Article

Urban Area Mapping Using Multitemporal SAR Images in Combination with Self-Organizing Map Clustering and Object-Based Image Analysis

1
Italian Aerospace Research Centre, Via Maiorise snc, 81043 Capua, Italy
2
Department of Electrical Engineering and Information Technology, University of Napoli Federico II, Via Claudio 21, 80125 Napoli, Italy
*
Author to whom correspondence should be addressed.
Remote Sens. 2023, 15(1), 122; https://doi.org/10.3390/rs15010122
Submission received: 15 November 2022 / Revised: 13 December 2022 / Accepted: 23 December 2022 / Published: 26 December 2022
(This article belongs to the Special Issue Urban Sensing Methods and Technologies)

Abstract

:
Mapping urban areas from space is a complex task involving the definition of what should be considered as part of an urban agglomerate beyond the built-up features, thus modelling the transition of a city into the surrounding landscape. In this paper, a new technique to map urban areas using multitemporal synthetic aperture radar data is presented. The proposed methodology exploits innovative RGB composites in combination with self-organizing map (SOM) clustering and object-based image analysis. In particular, the clustered product is used to extract a coarse urban area map, which is then refined using object-based processing. In this phase, Delaunay triangulation and the spatial relationship between the identified urban regions are used to model the urban–rural gradient between a city and the surrounding landscape. The technique has been tested in different scenarios representative of structurally different cities in Italy and Germany. The quality of the obtained products is assessed by comparison with the Urban Atlas of the European Environmental Agency, showing good agreement with the adopted reference data despite their different taxonomies.

Graphical Abstract

1. Introduction

According to the United Nations, the 21st century is the first “urban century” [1]. In 2014, the UNWater estimated that 3.9 billion people, corresponding to the 54% of the global population, live in cities [2]. In 2050, this percentage will grow to 75% [3]. This phenomenon mainly concerns developing countries with typically limited capabilities to deal with this rapid change.
The growth, often chaotic, of urban agglomerates has a significant impact on the environment [4]. The UN Conference on Human Settlement pointed out that cities are the main responsible for some of the main global problems such as waste production and air and water pollution [1]. Therefore, the need for technologies allowing for monitoring of and planning for this expansion and for predicting and mitigating its effect on natural resources, as well as the exposure of populations to man-induced and natural risks, is growing rapidly.
The remote sensing community is well aware of the importance of the topic. This is testified by the number of contributions produced in the last few years. Trianni et al. [5] proposed a framework for extracting urban areas’ extent from Landsat data at a regional/national scale. A survey on the accuracy of the eight global urban area maps available in 2009 is presented in [6]. Global urban area mapping is also presented by [7], in which a dataset depicting global urban land at a 500 m spatial resolution retrieved by one-year observations of a moderate resolution imaging spectroradiometer (MODIS) sensor [8] is discussed. Reference [9] deals with the extraction of land use/land cover maps inside and around an urban area exploiting multitemporal and multisource coarse-resolution data. The exploitation of multi-morphological profiles (MMP) for mapping the urban area from very high-resolution satellite imagery is proposed in [10]. Reference [11] proposes a study aimed at the assessment of the sustainable development of rural settlement in China by integrating satellite data with socio-economic indicators. Wang et al. exploited multiple high-resolution optical images to detail the development of the city of Zhengzhou (China) between 2016 and 2020 exploiting a deep learning model [12]. References [13,14] introduced different methodologies to enrich the classification of urban areas beyond the dichotomy urban/not urban.
Valuable contributions have also come from the radar community. In this case, rather than impervious surfaces, the feature which better identifies the urban area is the built-up feature, because of its high reflectivity and phase stability [15,16,17]. Esch et al. [18] used intensity information and a texture layer obtained by analyzing speckle characteristics to extract human settlements. Reference [19] proposes a method based on texture for enhancing the representation of the built-up feature in multitemporal synthetic aperture radar (SAR) RGB composites in order to improve the detection of the urban area. Salentinig and Gamba [20] introduced a framework for the extraction of urban areas from multiresolution SAR data. SAR segmentation techniques and ancillary optical data for the extraction of the urban area were used in [21]. Texture analysis is exploited in [22,23]. Multi-sensor data fusion for historical mapping of urban areas expansion is proposed in [24]. Reference [25] exploits archive data and the Google Earth engine to investigate the relationship between the growth of the urban area of Chennai (India) with the evolution of its urban heat island. Valuable suggestions on the usage of coarse-resolution SAR datasets for urban areas are summarized by [26]. More general approaches for land cover mapping are proposed in [27,28].
In this paper, we exploit multitemporal SAR composites as defined in [29,30] to introduce a novel method for mapping urban areas. It exploits multitemporal SAR red-green-blue (RGB) composites clustered using a self-organizing map algorithm to generate a coarse pre-classification map, which is refined through object-based reasoning in a loop.
This work introduces innovations in both methodology and approach. Working with objects is substantially new in the SAR community, with pixel-based segmentation of an information layer derived from the reflectivity being the most common practice in the literature. Here, feature-specific object-based reasoning has been developed to map the peculiar structure of a city, providing a tool to model the transition of the urban agglomerate into the surrounding landscape. This makes the approach innovative with respect to the literature, in which the detection of the built-up feature is privileged in spite of the heterogeneous texture property of urban environments.
The work is organized as follows. The general workflow of the proposed technique is presented in Section 2. The Experimental Results are provided in Section 3 and discussed in Section 4. Conclusions are drawn at the end of the work.

2. Methodology

The proposed workflow is shown in Figure 1. The input product is a multitemporal RGB SAR product of the Level-1α [29] or Level-1β [30] family. This image is clustered using self-organizing map (SOM) clustering [31] in order to obtain a (coarse) pre-classification map extracted using the low-level semantics carried by the clustered product [32].
The coarse map is then refined using object-based image analysis (OBIA) based on a Delaunay triangulation in a loop. It is stopped using a criterion on the number rm of regions merged after each iteration, which has to be lower than the threshold tr. Both these parameters are user-defined. They are set based on a trade-off between the number of iterations and the degree of homogeneity of the final map.
The description of each processing block, as well as of the exploited datasets, is provided in the following sections.

2.1. Coarse Urban Density Map Generation

As explained above, the proposed workflow accepts as input a pre-classification map obtained through SOM clustering of the original RGB product. As discussed in [32], this product keeps the chromatic content (i.e., the semantics) of the RGB product, which is exploited to identify the more significant classes of an urban environment. Dealing with SAR data, this is basically the built-up feature, which can be easily identified using Level-1α and Level-1β RGB composites thanks to its well-defined chromatic response [29,30].
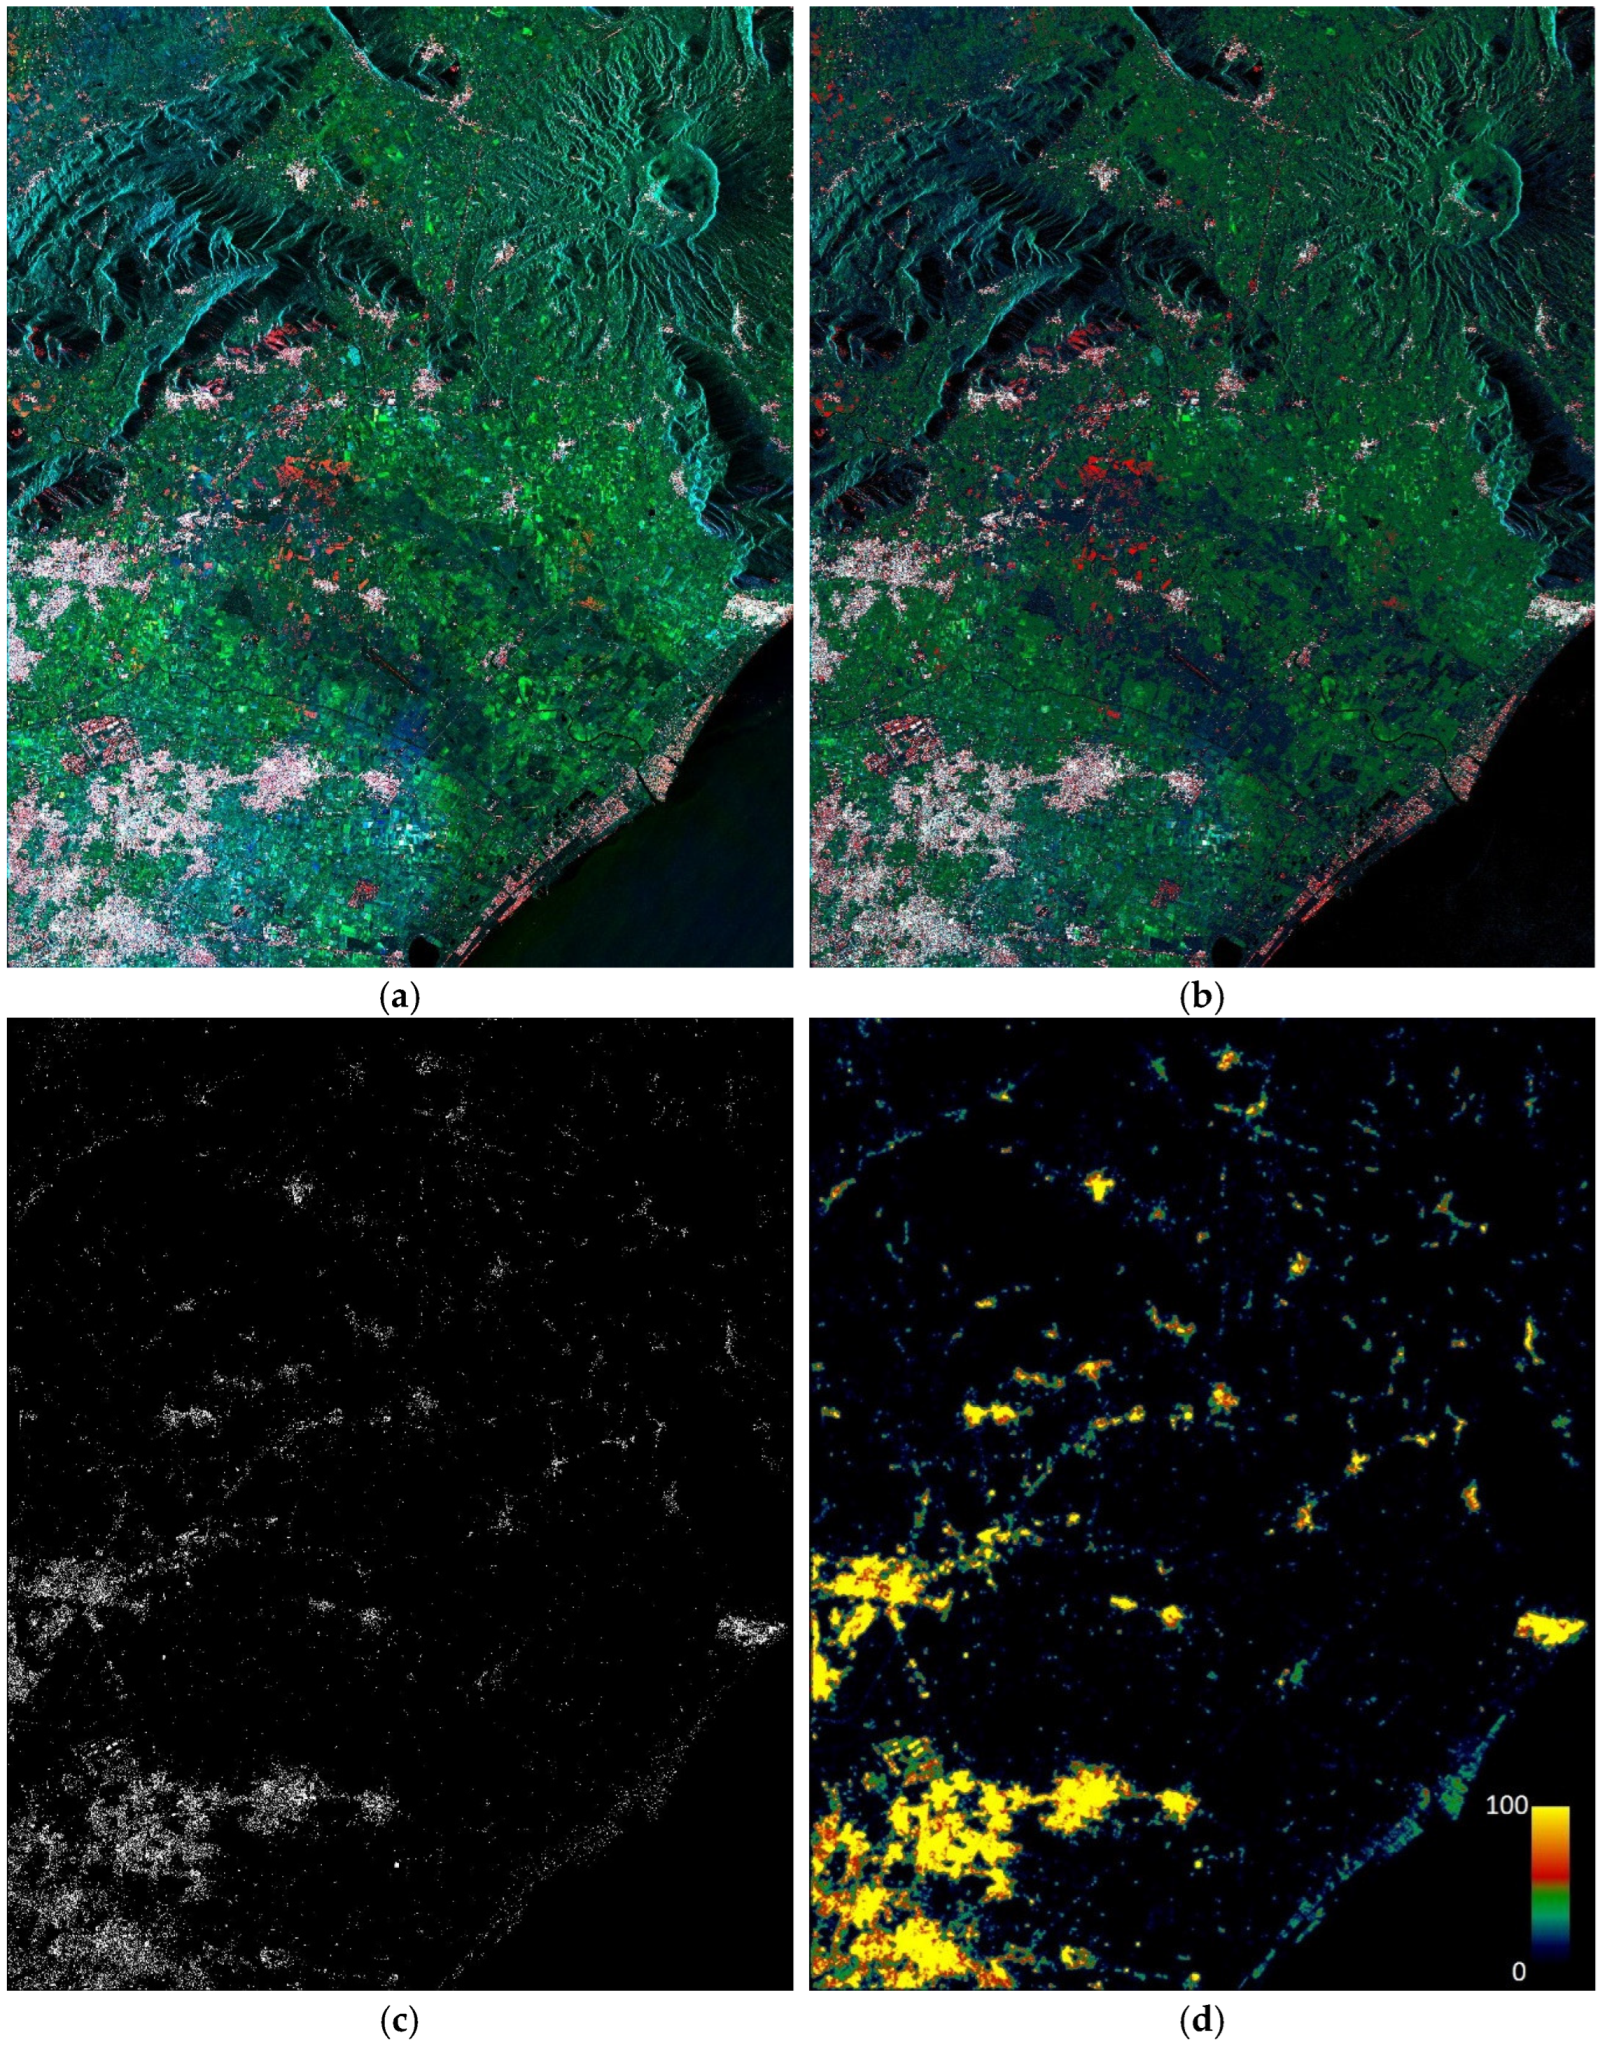
The rationale of these products is briefly recalled here for the ease of the reader. Level-1α images (see Figure 2a as an example) are bi-temporal oriented to change detection. They are built by using a reference image for changes evaluation and a test one, usually loaded on the blue and green channels, respectively. The red band is reserved to the interferometric coherence. This composition makes buildings appear in the color white due to their high response to all the channels involved in the composition [29].
Level-1β images are fully multitemporal products built by exploiting temporal variable. Images belonging to the time-series are stacked together and treated as a data-cube used for calculating the variance (loaded on the red band), the mean reflectivity (loaded on the green band), the saturation index, and the average interferometric coherence. The last quantities compose the blue band. In particular, the average interferometric coherence is displayed when it is higher than a user-defined threshold (usually 0.3). Otherwise, the pixel value is the one of the saturation indices. This band composition causes building to be rendered in a cyan color due to their high response to the average interferometric coherence and mean reflectivity [30].
The exploitation of such products simplifies the role of the operator, who can easily retrieve the built-up feature by visual inspection.
To prove this claim, consider the Level-1α product depicted in Figure 2a. It concerns an area at in the nearby of the city of Naples (Italy). This product has been generated using a time series of COSMO-SkyMed stripmap images and has been resampled up to 15 m resolution through spatial multilooking. In Figure 2b, a pre-classified map constituted by 16 categories obtained through SOM clustering is shown. The principal characteristic of this class of products is that the mapping into the feature space does not significantly alter the chromatic content of the image. This makes it simple to establish a correspondence between them and to recognize the classes relevant to the built-up feature, provided that the operator has the required knowledge to interpret the world as filtered by the sensor [33]. According to the Level-1α rationale, the built-up class is rendered in white and red colors [29]. The mask constituted by the pixels belonging to these classes (see Figure 2c) is the starting point for the urban area extraction.
Once the built-up feature map U is obtained, a moving window is implemented to compute the class density D within the scene calculated as the percentage of pixels classified as urban within the window according to relation
D = 1 N i = 1 N U i   ,
where N is the total number of pixels within the window. We suggest using two windows of different size in order to catch the texture of both dense and sparse urban areas. In particular, windows of about 150 and 450 m, i.e., with a side of 10 and 30 pixels, have been adopted for this operation. The two obtained density maps are averaged, providing the result depicted in Figure 2d. In this map, the color ramp goes from black (meaning no urban texture detected) to yellow through green and red colors. Therefore, yellow areas are the ones characterized by the higher density of built-up areas.
The degree of urbanization of the scene is determined based on the density of built-up pixels. To this end, the map depicted in Figure 2d is categorized through a crisp rule on the urban class density. In particular, four classes have been identified as having D ≥ 30 (“very high density”), 20 ≤ D < 30 (“high density”), 10 ≤ D < 20 (“medium density”), and D < 10 (“low density”). Each of them is associated with a decreasing numeric attribute, as detailed in Table 1. The class “very low density/not urban” is not considered at this stage. It will be created during the OBIA and reserved to those areas which do not exhibit relevant urban texture (i.e., they have D < 10) but are completely surrounded by areas classified as urban. This procedure is detailed in the following section.

2.2. Urban Map Refinement Using OBIA Based on Spatial Relationship

The classified urban density map is used to initialize OBIA. For a complete review on the remote sensing applications of OBIA, the reader can consult [34].
The urban density map is made binary by assigning the value 1 to all the pixels with a numeric attribute greater than zero (see Table 1). Connected components labeling [35] is then implemented to create a segmentation map. This map is the input for the block named as “object-based reasoning” in Figure 1. It is composed of three activities named as “fill holes”, “reject regions”, and, again, “fill holes”.
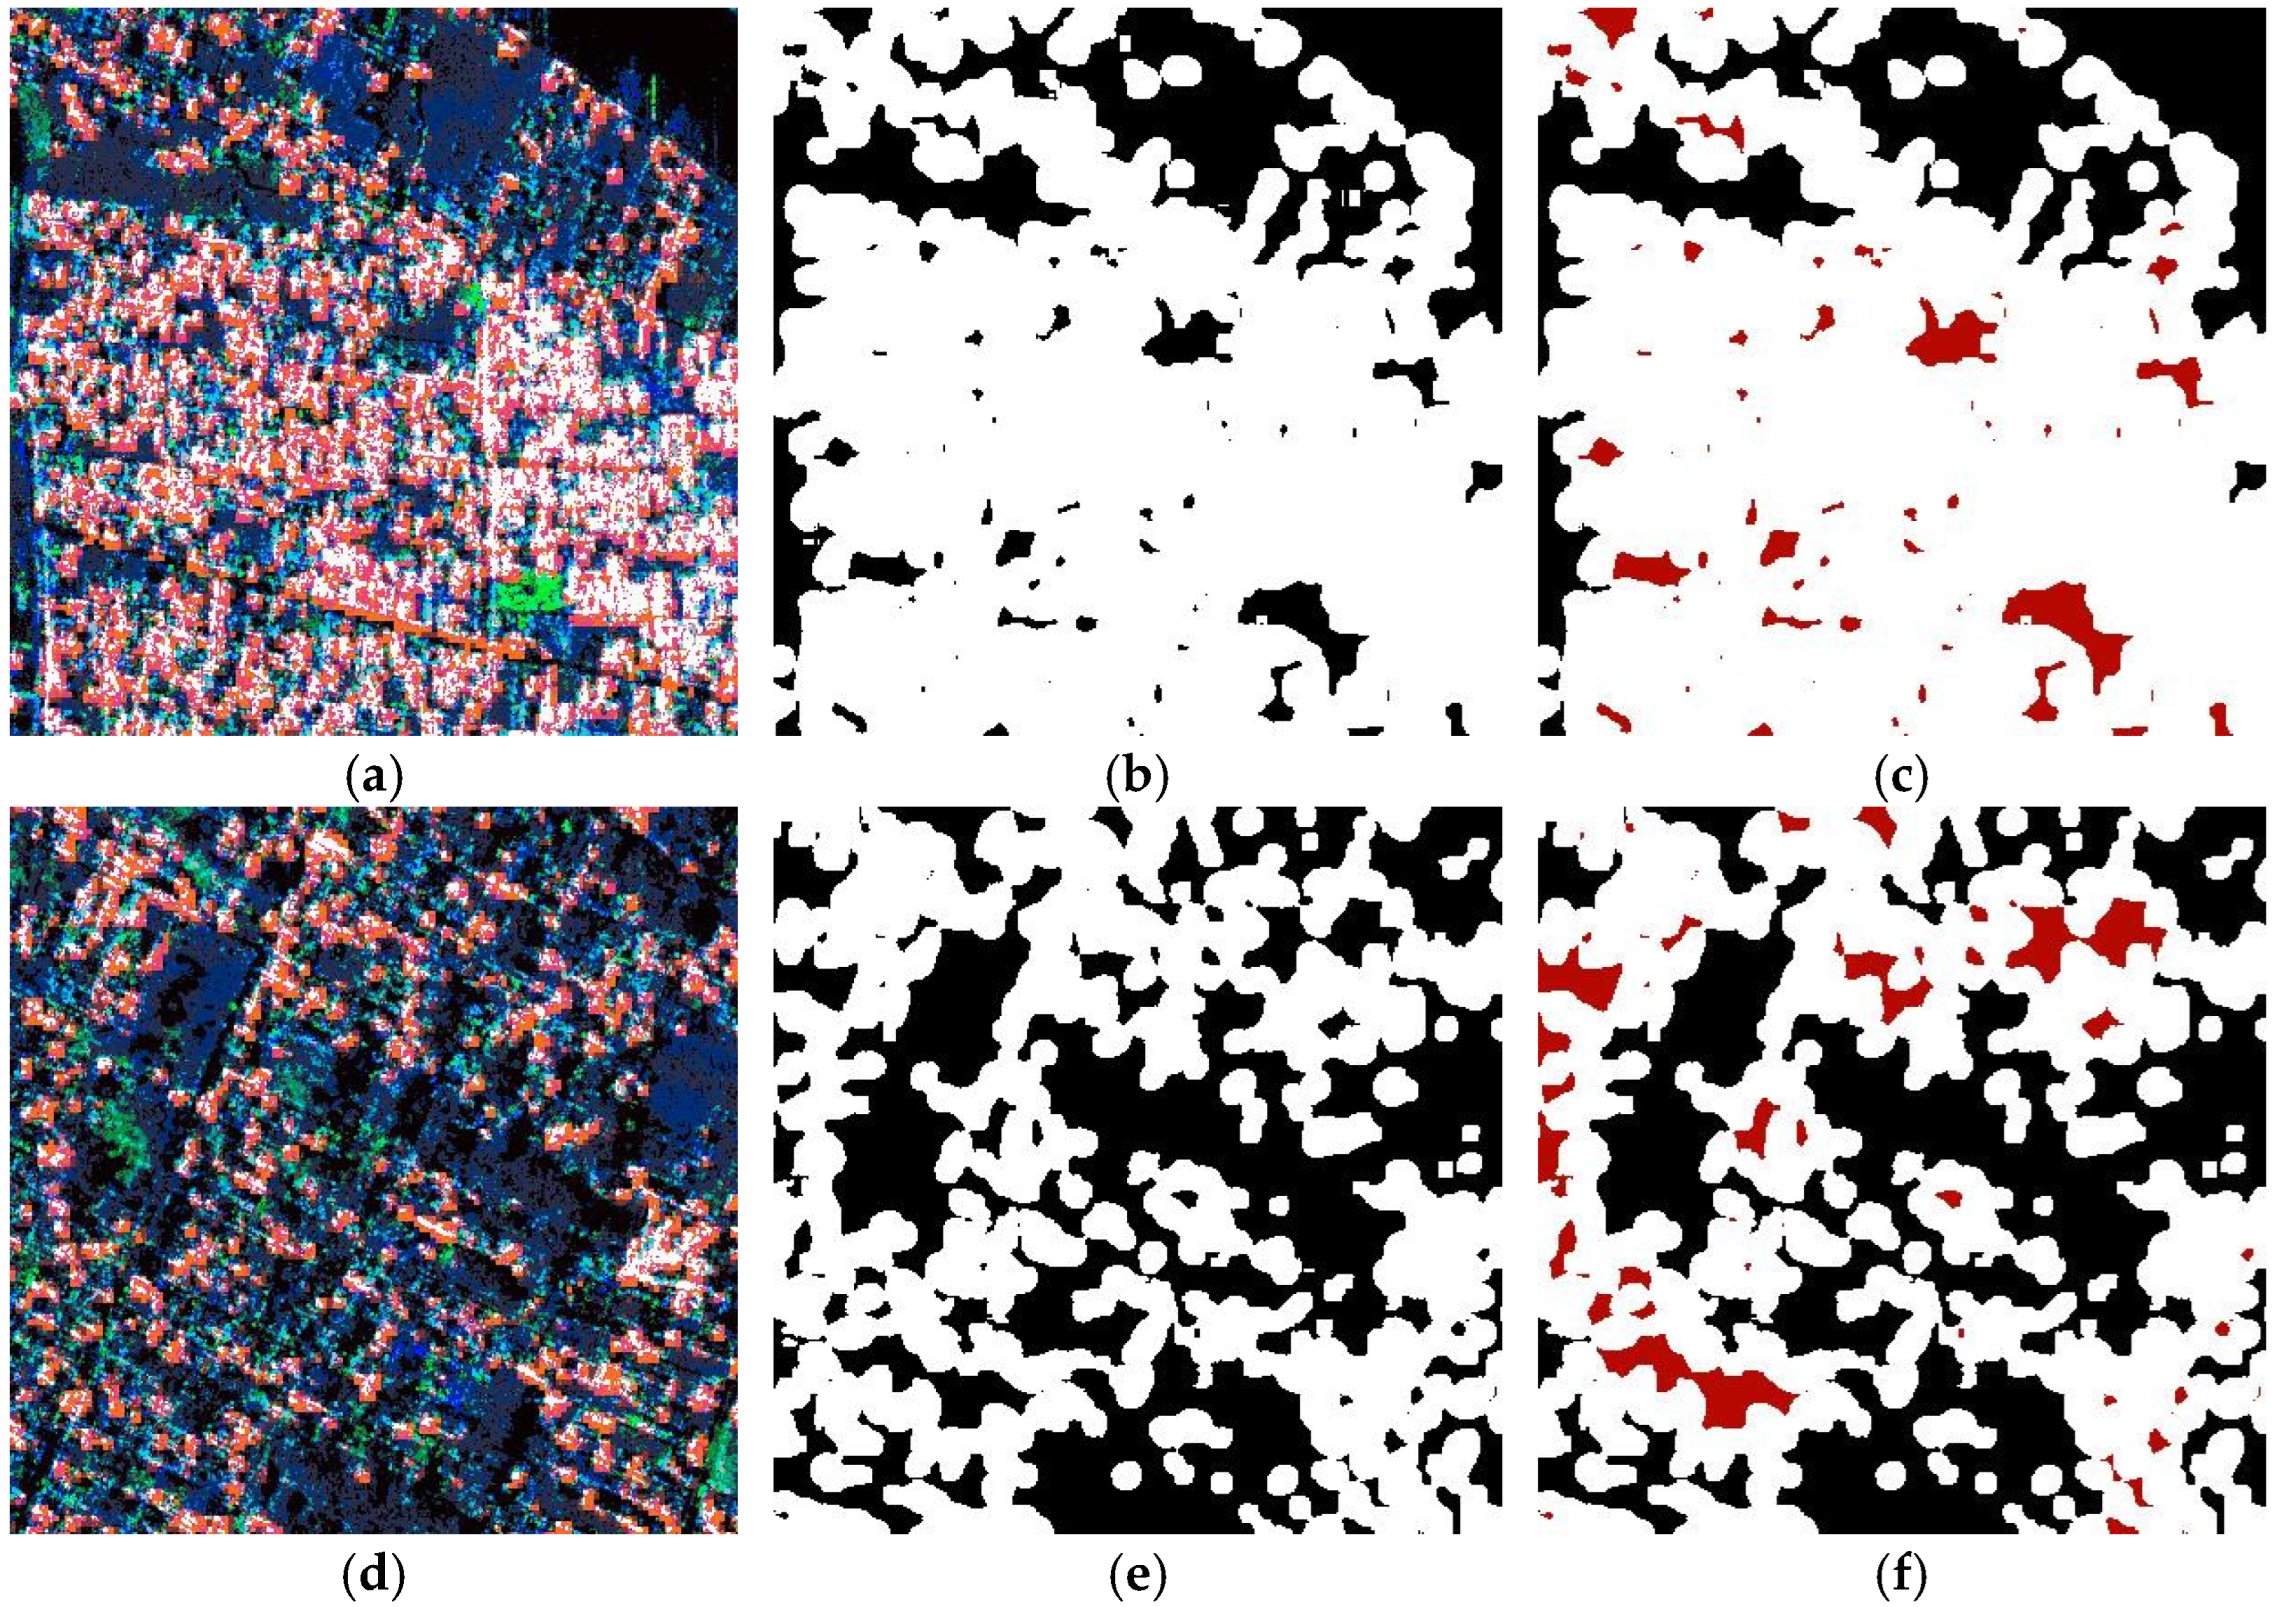
The first operation consists of filling the holes that are likely to be found within the regions classified as urban. To better understand this operation, let us consider Figure 3. In particular, in Figure 3a, a 3 m SOM clustering is depicted. In Figure 3b, the binary map obtained setting to “true” all of the pixels belonging to the classes “very high density”, “high density”, and “medium density” in the coarse urban density map discussed in Section 2.1 is shown. Some “holes” in the identified urban area are visible. They are likely to represent impervious surfaces with negligible reflectivity at SAR wavelengths, bare soils, or green urban areas. In any case, there are no reasons to assume that these “holes”, i.e., regions completely surrounded by areas classified as urban, do not belong to the urban area surrounding them. Therefore, by using the spatial relationship between neighboring objects, they can be identified and marked with the ID 1 (see Table 1), which will univocally identify regions “absorbed” in the surrounding urban landscape.
The result of this operation is shown in Figure 3c. In this picture, filled “holes” are displayed in red in order to help the readers’ understanding.
The second operation of the block named “object-based reasoning” in Figure 1 (“Reject regions”) consists of erasing small areas within the retrieved urban area map. The rationale is that regions whose extent is in the order of few thousand square meters are likely to be irrelevant in the computation of the final urban area map, but they can significantly increase the computational burden executing the loop described in the following section. This operation is ruled by a user-defined parameter. In this case, we discarded areas smaller than 2000 m2.
The third operation of the block “object-based reasoning” consists, again, of filling the “holes” possibly left by the elimination of one or more of the aforementioned small regions.
The abovedescribed operations are effective enough to make the urban map rather homogeneous in dense urban areas. Looking at Figure 3c, it is possible to appreciate that only a few “holes” are left. Conversely, if the urban area is sparser, the retrieved result is quite unsatisfying, since wide areas which should be considered as urban (even if low texture) are not recognized as such. This is the situation depicted in Figure 3d–f. The solution of this problem is addressed in the following section.

2.3. Urban Map Refinement Using OBIA Based on Delaunay Triangulation

The reasoning for the colors introduced in Section 2.1 for the extraction of the built-up feature is based on the mapping of SAR scattering mechanisms into the RGB composite. However, machine understanding of an image implies reasoning with incomplete information. Although a human photo-interpreter is able to reconstruct the scene interpreting colors (representative of a specific electromagnetic scattering phenomena) from a machine viewpoint, as suggested in [33], this information is insufficient, because it does not provide any knowledge about objects’ spatial organization or grouping in the structural elements of the scene.
An object-based reasoning, as discussed in Section 2.2, is then used for generating knowledge, not retrievable from electromagnetic models, about the scenes’ spatial organization. However, as highlighted at the end of Section 2.2, reasoning just on neighboring objects is not enough to reconstruct the urban whole, especially where it is scattered.
In order to reconstruct the urban area continuum, a Delaunay triangulation is used to bring into connection objects close to one another, but not adjacent. Following the diagram depicted in Figure 1, the discussion of the block named as “Delaunay” is now in order.
Let us consider the (binary) map obtained after the OBIA described in Section 2.2 (see as an example Figure 3c). On this map, we randomly select a number of points, equal to the 25% of the total number of points classified as “urban”, for generating a Delaunay triangulation. Given a set of point H, this triangulation subdivides the image domain K into triangles such that no point hiH which falls inside the circumcircle of any triangle. This technique has been thoroughly applied for solving different image processing problems, as detailed in [36].
The obtained mesh is then analyzed with the purpose of generating “bridges” between regions classified as urban, close to each other but not connected. In particular, the following algorithm is used. For each triangle (or finite element):
  • Obtain the vertexes coordinates ( v i x , v i y ) and compute the length lij of its sides according to the relation (specified here for i = 1, j = 2)
    l 12 = ( v 1 x v 2 x ) 2 + ( v 1 y v 2 y ) 2 ;
  • Compute the triangle area At with the formula of Hero of Alexandria:
    A t = p ( p l 1 ) ( p l 2 ) ( p l 3 ) ,
    where p is the triangle semi-perimeter.
  • If At is smaller than a user-defined threshold ta, then consider the pixels included in the triangle as part of the urban area and mark them with the numeric ID 1 (i.e., “low density” urban area). In our experiments, ta has been set to 2000 m2.
In Figure 4, a series of pictures graphically explaining the abovedescribed operations are shown. In particular, in Figure 4a,c, the bridges created by the Delaunay triangulation between close regions in a dense and in a sparse urban area, respectively, are depicted. These bridges create connected regions that are absorbed into the surrounding urban area, as shown in Figure 4b,d (see red areas). In both cases, the reader can appreciate as the Delaunay triangulation OBIA, coupled with the operation contained in the “object-based reasoning” processing block discussed before (see the loop in Figure 1), allows for the reconstruction of the urban area continuum.
The loop stopping criterion is given by a threshold tr on the number of regions merged after two successive iterations. If this number is below tr, then the algorithm exits the loop and stops the growth of the identified urban agglomerate into the surrounding natural landscape. This threshold represents a trade-off between the number of iterations and the homogeneity of the map. In our experiments, tr was set to 50. Usually, the loop is terminated after less than 10 iterations.
As indicated in Figure 1, the processing chain continues with the application of a morphological operator. In this work, a mode filter is adopted. Its functioning consists in two steps. As first, the histogram of the image within a sliding box of user-defined dimensions is calculated. Then, the central pixel of the box is assigned to the most probable value. In this work, a square box of 11 pixels has been adopted. This solution is useful to regularize the retrieved urban area contour. Interested readers can consult [37] for mathematical insights and calculous optimization strategies.
Finally, the user can set a threshold on the minimum mapped area. In this work, it has been set to 300,000 m2.

3. Experimental Results

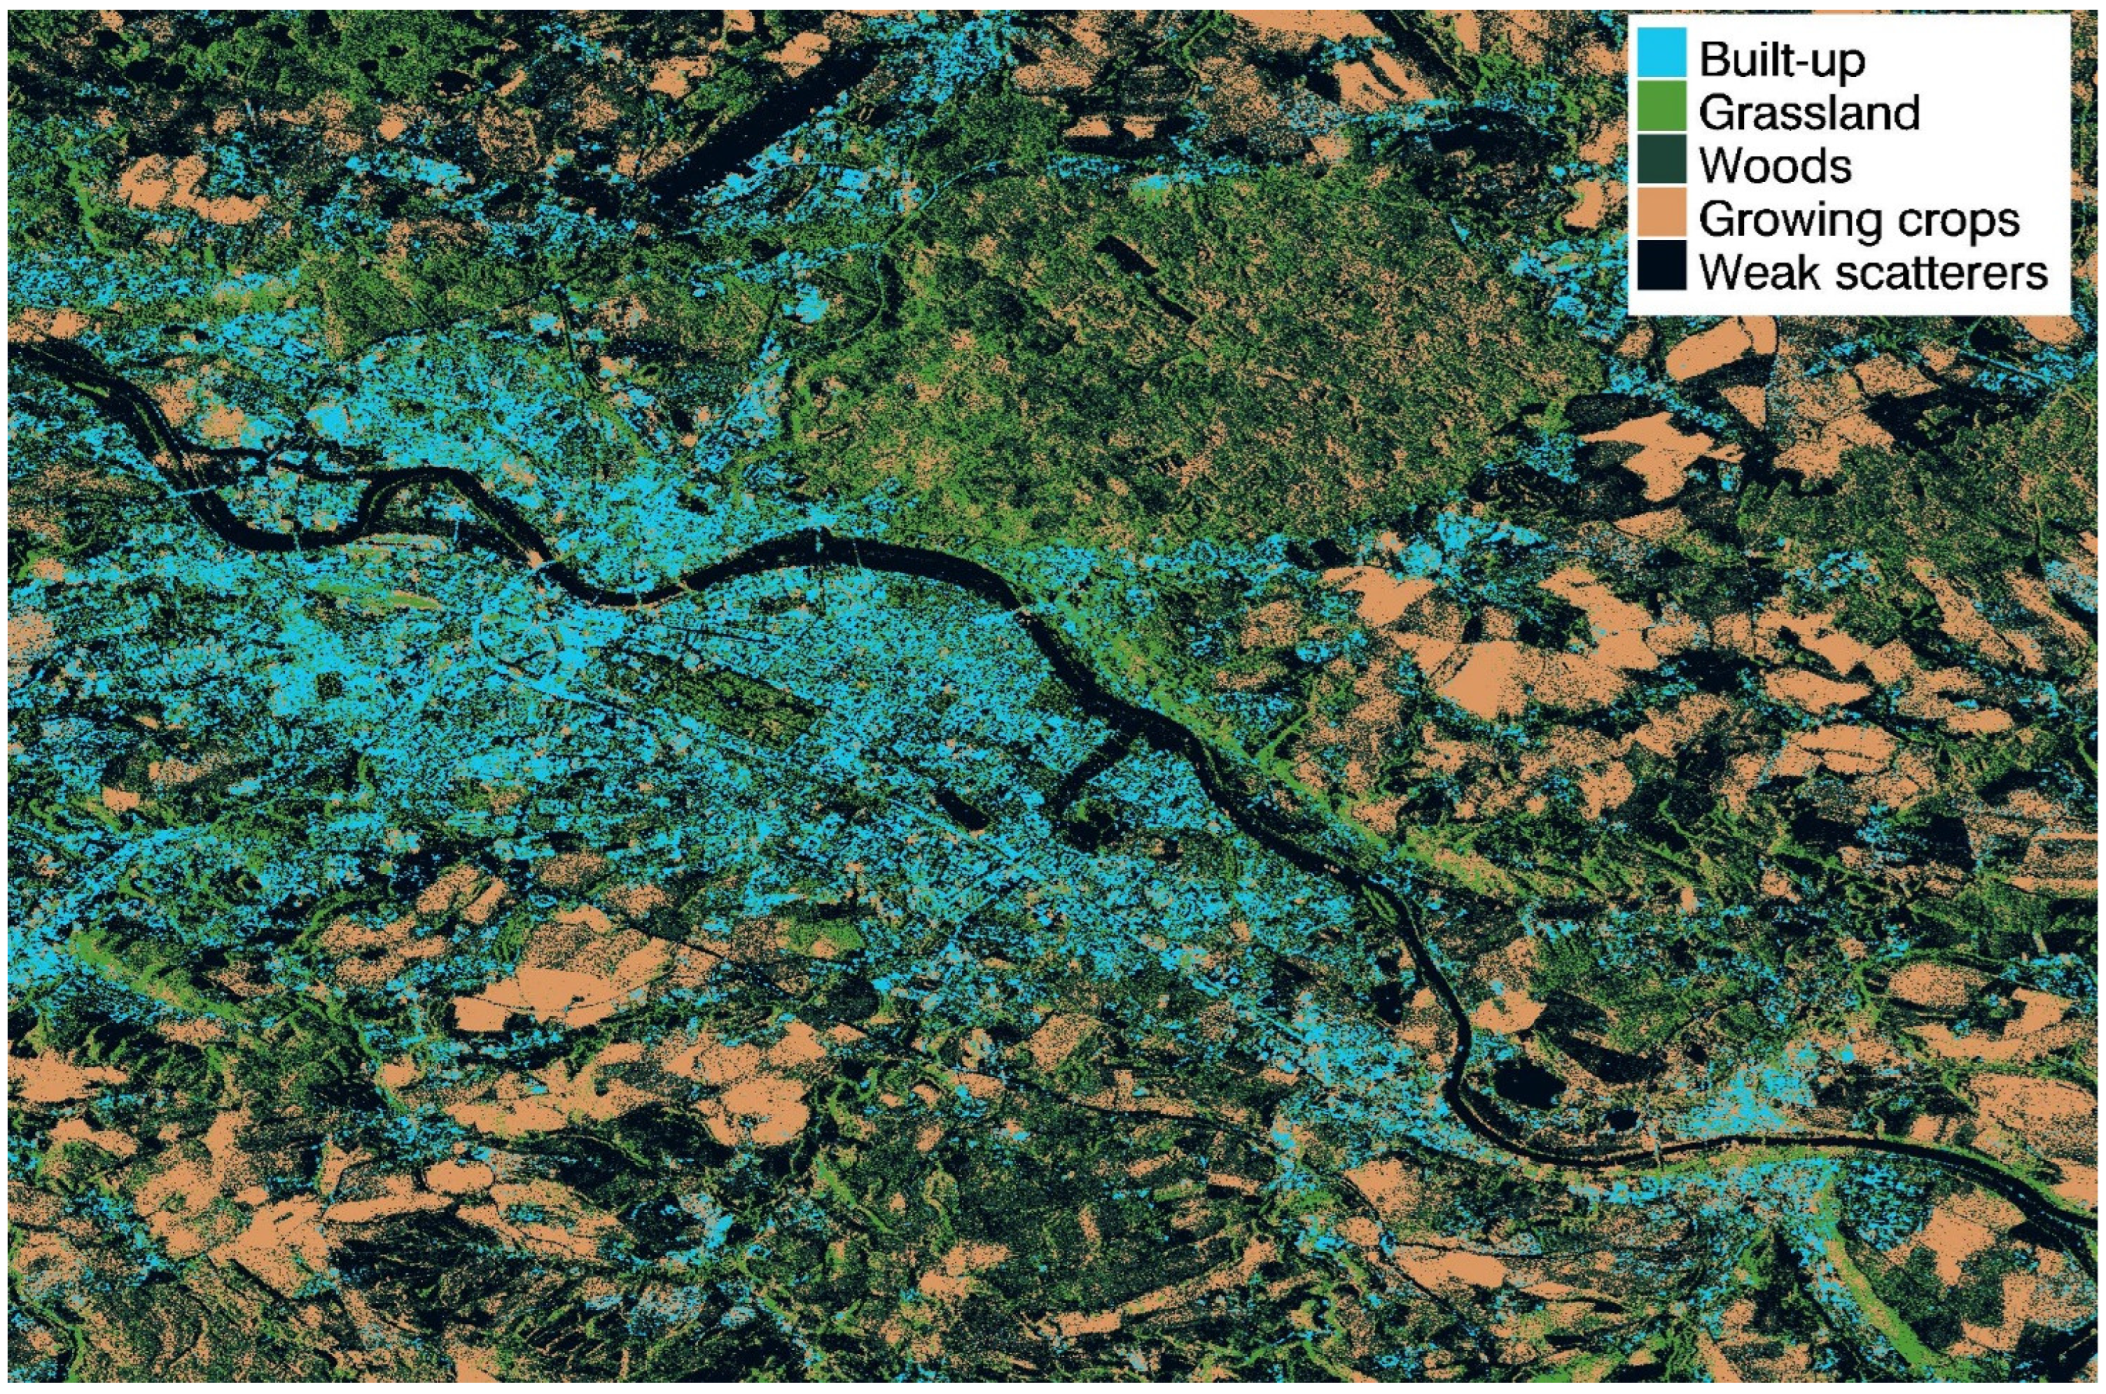
The workflow discussed above has been applied to two structurally different scenes, represented by two different input RGB products. The first scene concerns an area located in the north of the city of Napoli (Italy). In this case, the input product is the Level-1α product [29] depicted in Figure 2a. The second scene concerns the city of Dresden (Germany). In this case, the input product is a Level-1β product [30] derived from Sentinel-1 data. Its 5-class clustering is depicted in Figure 5. Both of the images have been resampled through spatial multilooking up to a 15 m resolution.
Operatively, if a Level-1α product is used, the requirement is to use images minimizing the sources of temporal/spatial decorrelation. This allows for maximization of the information content carried by the interferometric coherence, which in Level-1α images is usually reserved to the red band. Therefore, it is highly desirable to use images with a short temporal and spatial baseline. The Level-1α image used in this experiment was obtained using acquisitions made on 30 October 2014 and 15 November 2014, thus having a temporal baseline of 16 days. The orthogonal baseline was about 58 m.
In Figure 6, the urban area map for the Napoli scene (see Figure 2a) is shown. The Urban Atlas of the European Environmental Agency is used for comparison. It is a land cover map in which the density of the urban area is measured with respect to the soil sealing (SL), i.e., the percentage of soil covered by an impermeable material. In particular, five urban categories, reported here for the ease of the reader, have been considered: “continuous urban fabric” (SL > 80%)”, “discontinuous dense urban fabric” (SL 50–80%), “discontinuous medium density urban fabric” (SL 30–50%), “discontinuous low density urban fabric” (SL 10–30%), and “discontinuous very low density urban fabric” (SL < 10%).
It is worthwhile to remark that the meanings of the SAR categories reported in Table 1 are different. The urban density measured with SAR images is mainly related to the built-up feature, which is a subset of the impervious surfaces used in the Urban Atlas to estimate the SL. Therefore, the comparison between the SAR-derived density map and the Urban Atlas categories is not feasible. However, the Urban Atlas can be used to derive an urban/not urban ground truth by putting the aforementioned five categories in a unique class “urban” and reserving the attribute “not urban” to other land cover characterized by negligible urban texture, such as “agricultural land”, “water bodies”, “forests”, and so on. For a complete description of the Urban Atlas’ classes, the reader can refer to [38].
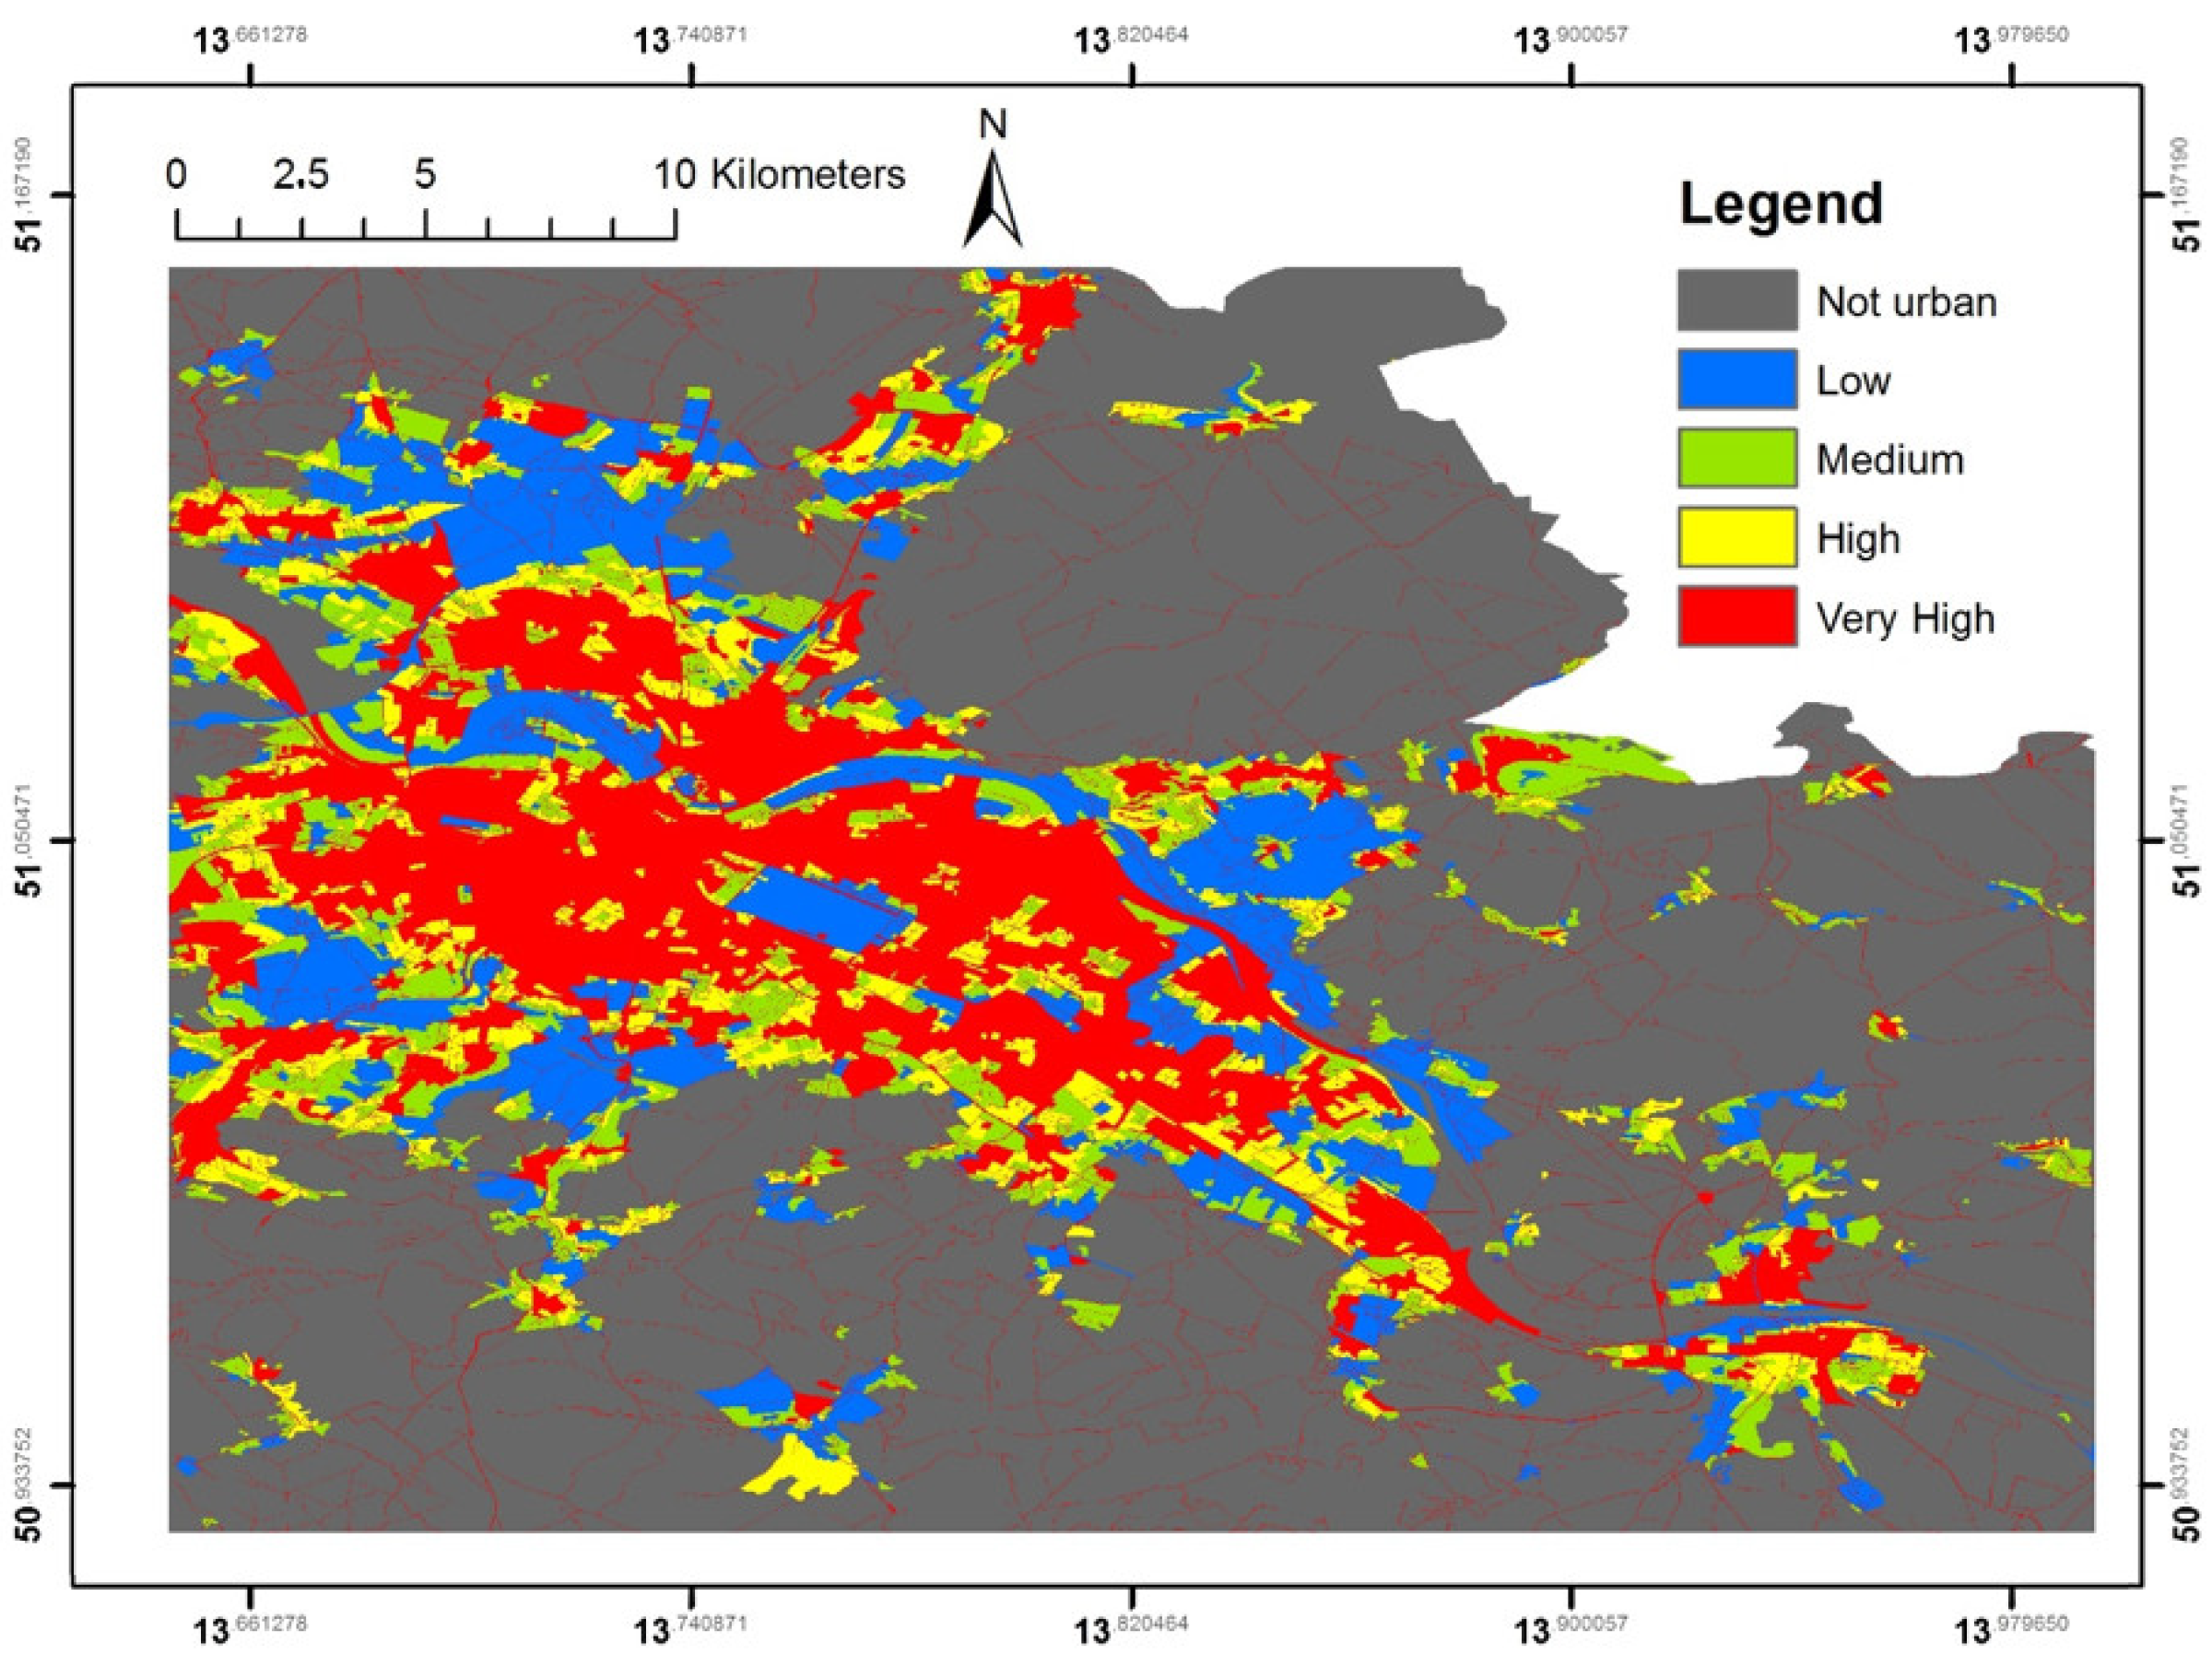
In order to compare the urban density map retrieved using SAR data and the Urban Atlas, we projected the first map into the grid of the second, as shown in Figure 7 for the city of Dresden. The unique class for each polygon has been determined by computing the more frequent SAR class inside each Urban Atlas object. The same operation has been performed for the Napoli scene depicted in Figure 6. Actually, this scene concerns two different Urban Atlas layers relevant to the cities of Napoli and Caserta. Therefore, two classifications have been implemented. The binary SAR-derived classification map has been obtained by fusing the SAR classes “very high”, “high”, “medium”, and “low” into the class “urban” (see Table 1). The class “not urban” is kept unchanged.
In Table 2, the confusion matrix for the Dresden scene has been reported. The overall accuracy is 83.61%. The kappa coefficient is 0.64. The results obtained from speckle divergence classification [18] are also reported. In this case, the values for overall accuracy and kappa coefficient were of 79.45% and 0.38, respectively.
In Table 3 and Table 4, the confusion matrices for the Napoli and Caserta area classifications are reported. In the first case, the overall accuracy is 81.93%, while the kappa coefficient is 0.63. In the second case, the overall accuracy is 92.91%, while the kappa coefficient is 0.61. The overall accuracy values obtained via application of the speckle divergence algorithm are 78.45% for the Napoli scene and 81.54% for the Caserta one. The obtained kappa coefficients are 0.54 and 0.59, respectively. The average classification accuracy obtained using the proposed methodology is 85.77%. The value for the speckle divergence technique is 79.8%.

4. Discussion

As suggested by Weeks [39], mapping an urban area requires, as first, the establishment of what should be considered as such. The answer to this question determines the method adopted to extract the urban area and the metric for assessing the accuracy of the implemented algorithm.
As stated by [6], currently, no generally accepted definition of “urban land” exists. As an example, it can be defined by its administrative borders, but they often do not reflect the development of the agglomerate. Sometimes the boundaries lie beyond the built-up city area, including the rural countryside. Sometimes they lie within the built-up area. Other approaches limit the urban area to the “built-up” area or define it in terms of the areas for which services and facilities are provided [40]. In any case, the definition of an urban area involves some arbitrary decisions in finding boundaries. As argued in [40] “towns tend to merge physically and functionally with neighboring towns and their hinterlands. Therefore, there is no hard border for urban areas and in any definition an urban area embraces land cover types not typically urban, such as forests, parks or agricultural land”.
According to [39], an urban area is a place “that incorporates elements of population density, social, and economic organization, and the transformation of the natural environment into a built environment”. Philosophically, this definition is correct, but, for the purposes of remote sensing, we can recognize only a keyword, i.e., the “built environment”, which, at the boundary of a city, constitutes a continuum with the rural area. In order to extract a border between the urban environment and the rural one, a dichotomy between these two features has to be created, appropriately modelling the existing urban–rural gradient [39].
The proposed methodology has been designed to appropriately model the transition between the urban landscape and the natural one through specific object-based processing which starts from the semantic identification of the built-up class. This makes it highly innovative against the past literature, in which the urban area is mainly assimilated with its buildings, which constitutes the feature with the more peculiar response to SAR wavelengths and is thus more easily identifiable through segmentation techniques. Although the background of the methodology has been presented in [32], the object-based reasoning necessary to reach the purpose is tailored and optimized for the specific heterogenous structure of the target.
The results obtained by applying the proposed methodology have been compared against the literature. In particular, the speckle divergence algorithm [18] has been used for benchmarking. The reference data were extracted from the Urban Atlas [38].
The benchmark revealed that the proposed methodology has performance comparable with the literature, with some crucial differences.
The speckle divergence algorithm is a pixel-based technique involving the thresholding of the feature map. These characteristics, i.e., the functioning at the pixel level and the thresholding, are shared with most of the literature. In this work, the thresholding has been determined with a trial-and-error approach, which represents a sub-optimal solution. However, the determination of the correct threshold is a highly complex task which significantly impacts the success of the classification [41]. Moreover, the pixel-based approach tends to privilege the identification of the built-up feature. It is not able to model the urban–rural transition and causes, on average, a higher misclassification rate due to false detection of high-texture and high-reflectivity natural structures, such as some types of vegetation. This behavior can be mitigated using object-based image analysis, which also introduces a higher independence from thresholds, that, where present, are moved from the feature space to more controllable parameters related to some physical quantity, such as the area of a region, the density of a class, or the number of objects processed in a certain processing block.
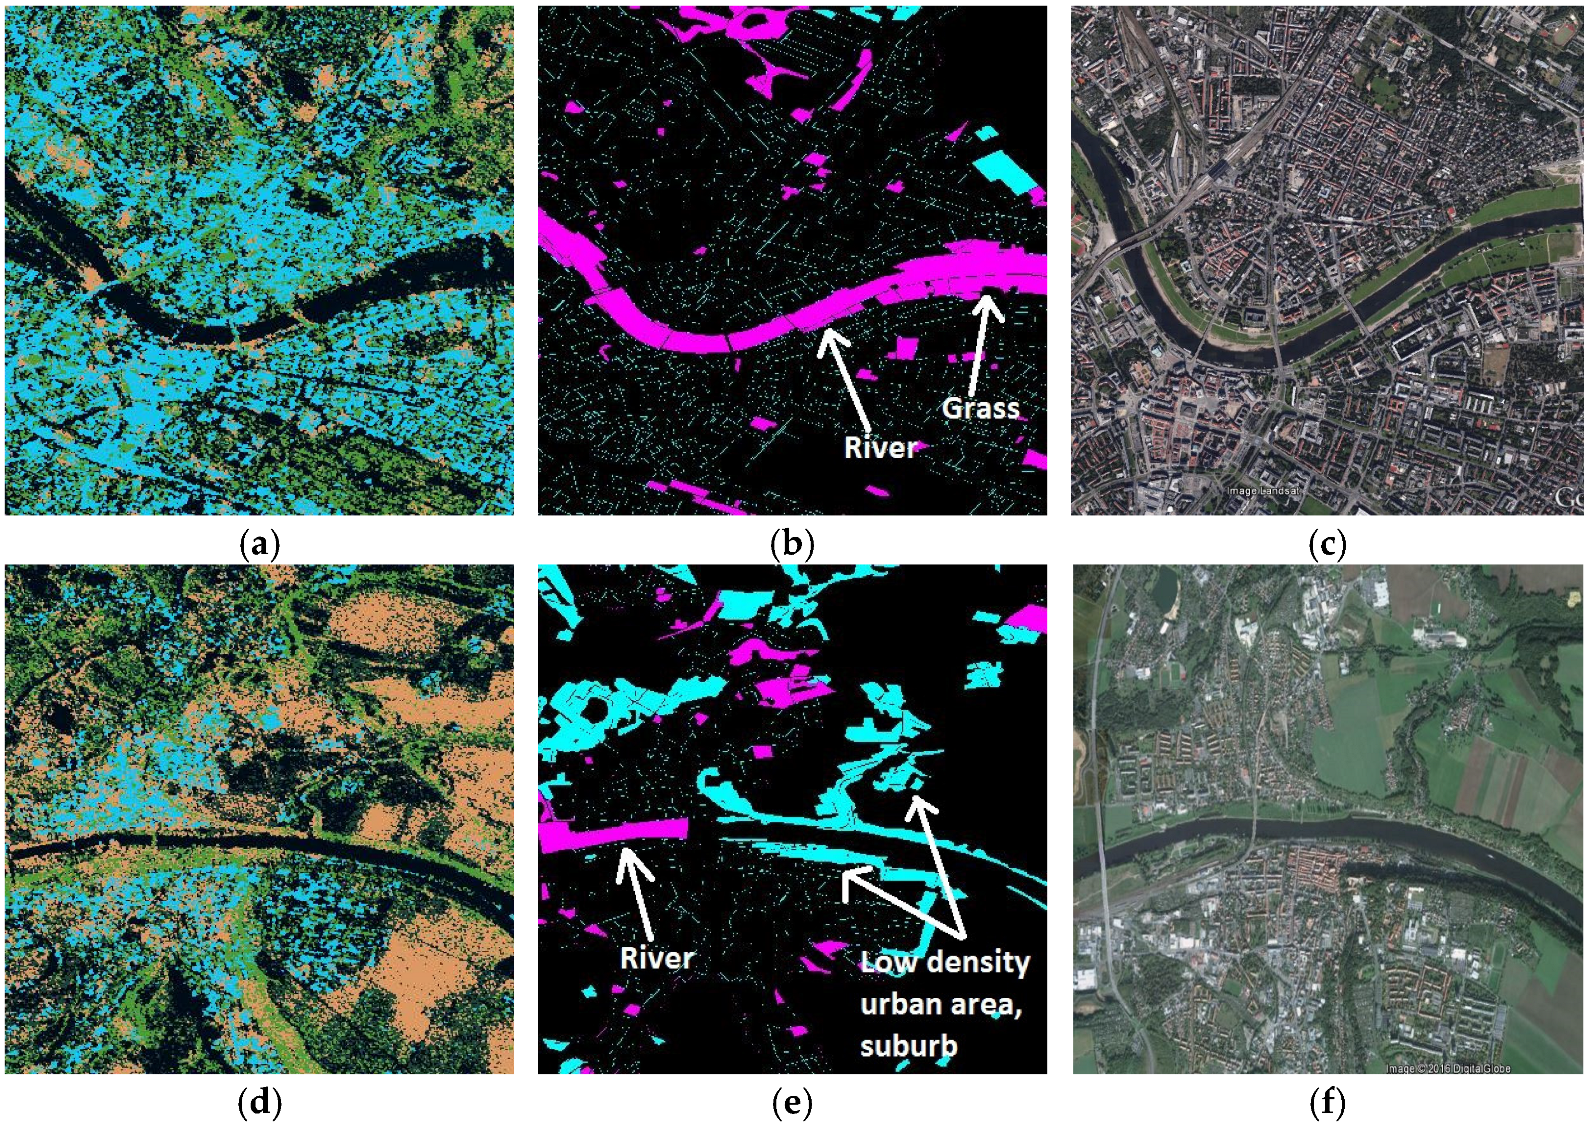
The comparison between the output of the proposed methodology and the reference data is now in order. The urban classes contained in the Urban Atlas are mainly extracted from the classification of impervious surfaces obtained from multispectral images. The main sources of disagreement between the two products can be explained by comparing the error map with the input Level-1β product and a Google Earth view, as shown in as shown in Figure 8. In particular, in Figure 8a, a portion of the Elbe River, as seen on a Level-1β product, is depicted. In Figure 8b, the classification error map for the same area is reported. In this map, magenta means “false urban”, while cyan means “missed urban”. Finally, in Figure 8c, the corresponding Google Earth view is shown.
The river is incorrectly classified as an urban area, as well as the adjacent grassland stripe. However, this classification is congruent with the given definition of urban area. With the river being completely surrounded by a dense urban agglomerate, it is reasonable to consider this feature as a part of it. This is a typical example of “false urban” classifications with respect to the Urban Atlas. In Figure 8d–f, the focus is on the “missed urban” areas. In particular, in Figure 8d, a portion of the Elbe River in the suburbs of Dresden is shown. The classification error map is reported in Figure 8e. Finally, the corresponding Google Earth view is depicted in Figure 8f.
It arises that missed detections are localized in correspondence with areas with very low urban texture. Indeed, the proposed algorithm estimates the density of the urban area by counting the number of “building pixels” in a moving window whose side is in the order of hundreds of meters. Therefore, when the urban agglomerate is small and the “not urban” class is dominant in the neighborhood, the projection of the SAR map into the Urban Atlas grid is likely to result in a “not urban” classification. Moreover, a small misalignment between the SAR map and the Urban Atlas could play a not negligible role in the city suburbs, where the urban density is typically lower.
The experiments made on the cities of Napoli and Caserta allow for better analysis of the characteristics and the limitations of the proposed algorithm, with the structure of the cities in southern Italy being very different with respect to Germany. In the Napoli area, towns are very close to one another. As a consequence, they tend to form a continuum, which causes misclassification with respect to the Urban Atlas.
In this regard, the example reported in Figure 9a–c is particularly significant. It concerns a high-density population area in the nearby of the city of Napoli. Here, as shown in Figure 9a on the RGB Level-1α product and in Figure 9c on the Google Earth view, towns form an urban continuum which absorbs the small agricultural fields scattered among them (see the annotations on Figure 9b). The proposed algorithm classifies these regions as urban areas (see, as an example, regions marked with 1, 2, and 3 on the pictures), while on the Urban Atlas they are considered as agricultural land. However, this classification is congruent with the adopted definition of an urban area. At the same time, the Urban Atlas classification is correct with its rationale, which is the one of a land cover map. This example is useful to stress the different taxonomy of the two maps and that the reported results have to be interpreted taking into account such difference.
In the confusion matrix relevant to the Caserta area classification, a lower detection accuracy of the urban area is registered compared with the two previous experiments. This is principally due to the structure of this area, as shown in Figure 9c–e. The province of Caserta is mainly agricultural with few large towns. In this area, the population density is about 348 inhabitants per km2. To give an idea of the differences with respect to the province of Napoli previously analyzed (which is characterized by a number of large settlements very close to one another), the data on the population density include about 2672 inhabitants per km2. Therefore, while in the case of the Napoli area the main problem was the “false” urban detection, for the Caserta area the disagreement between the Urban Atlas and the SAR map concerns “missed urban” detections. Here, there are a number of small settlements (see as an example the regions marked with 1, 2, and 3 on the pictures), which are not classified as urban areas by the proposed algorithm. This is due to three reasons: (i) the resolution of the input product, which is about 15 m, (ii) the dimension of the settlements (the reader should remember that the parameter on the minimum mapped area was set to 300,000 m2), and (iii) the strong dominance of agricultural land in the surrounding area. This explains the rather lower agreement between the two maps.
However, despite the different meanings carried by the SAR classes and the Urban Atlas ones, a link between the two representations of the urban area can be established. As stated above, in the Urban Atlas, the discriminant parameter is the soil sealing (SL). In the case of SAR, the parameter we measured is basically the building density. In Table 5, we show the percentage of urban/building pixels (computed through the moving window, as explained in Section 2.1) within the polygons defined by the Urban Atlas for each SAR class and for each of the analyzed cities. In the first column, the (roughly) correspondent Urban Atlas class has been reported. The retrieved SL value using SAR is different, since buildings represent just a subset of the SL measurable in the Urban Atlas. However, there is a clear correspondence between the SAR classes and the Urban Atlas ones. The only disagreement concerns the class “very low density urban” which, for the reasons explained above, by using the SAR is absorbed into the class “not urban”.
The information contained in Table 5 is useful for understanding how the SAR classes are mapped into the Urban Atlas. However, these two products cannot be considered alternative, since the completeness of the information brought by the Urban Atlas cannot be compared with the completeness measurable with a SAR. The Urban Atlas is the result of the fusion of data coming from several sources and is produced under the strong supervision of expert operators. Reasonably, it can be updated on a multi-year basis. The proposed approach requires minimum supervision and can be updated frequently, for the continuous monitoring of the urban landscape, even if with a lower taxonomy, as typically provided by SAR in land cover mapping applications.
The proposed methodology has wide potential applicability. As an example, where the Urban Atlas is available, changes in the SAR classes projected into the Urban Atlas polygons represent a warning concerning local changes. The information provided by SAR is at a high level but could be exploited to locally update the Urban Atlas land cover map. Otherwise, the proposed methodology can be used to generate standalone information or be interestingly combined with that provided by other sources (such as multispectral sensors) for frequent monitoring of the urban landscape. A third possibility is represented by the integration of the urban density attribute carried by the proposed products into globally available urban layers providing pixel-based information.
As a general comment, if Level-1α products are used, the suitability of the images exploited for their generation is crucial. In fact, the quality of the output map will be strongly dependent of the informative content carried by the interferometric coherence band. If images with the necessary requirements on the temporal and/or spatial baseline are not available, then a technique to enhance the information content of the red band using the texture can be considered, as explained in [19]. Otherwise, the usage of Level-1β products, carrying mean temporal information, can be considered to slacken the requirements on the temporal/spatial baseline of the single SAR interferometric couple.

5. Conclusions

Mapping an urban area requires as first a reliable definition of the object under consideration to be given. This is due to its intrinsic characteristics, which makes the mapping subject to some degree of arbitrariness, depending on the adopted sensor. The use of SAR data poses challenging questions concerning where to place the borders of a city (if any), which objects have to be included within it, how to manage the urban–rural gradient and the continuum between neighboring towns. Therefore, more than just a technique, a robust procedure has to be defined, stating clearly the more suitable data to be used, the technique to be exploited, and the parameters to be set in order to extract the best information made available by the sensor.
In this paper, we presented an innovative method for urban area mapping exploiting multitemporal SAR RGB products. The starting point is a pre-classified map obtained through self-organizing maps clustering of the input product, which can be either a Level-1α or Level-1β RGB composite.
The proposed methodology requires minimum supervision in the selection of the classes to be considered within the pre-classified product for the calculation of the preliminary urban density map. It is suggested for just classes to be considered identifying the built-up features, which are very well identifiable by visual inspection both in Level-1α and Level-1β products.
The preliminary urban density map is calculated through a moving window running on the binary mask constituted by the urban classes selected by the user. It is suggested for two windows of different sizes to be used in order to catch the characteristics of both high-density and low-density urban areas. The urban density map is then exploited in an object-based image analysis environment to obtain the final classification map.
The object-based reasoning is structured in two steps: in the first phase, spatial relations are exploited to make the preliminary urban map more compact by filling the “holes” left in the map by objects (such as city parks or bare soils) characterized by a low percentage of built-up areas but completely surrounded by an urban environment. In the second phase, a Delaunay mesh is used in order to connect the areas that are classified as urban but that are not adjacent. In this way, the urban continuum can be restored, especially in areas characterized by low building density.
The obtained results were compared against the literature and reference data extracted from the Urban Atlas land cover map for implementing an urban/not urban classification. Despite the different taxonomy of the data, the comparison assessed the reliability of the proposed methodology.

Author Contributions

Conceptualization, D.A. and G.D.M.; methodology, D.A., G.D.M. and G.R.; software, D.A.; validation, D.A.; formal analysis, D.A., G.D.M. and G.R.; investigation, D.A., G.D.M. and G.R.; data curation, D.A., G.D.M. and G.R.; writing—original draft preparation, D.A.; writing—review and editing, D.A., G.D.M., G.R., A.I. and D.R.; supervision, D.R. and A.I. All authors have read and agreed to the published version of the manuscript.

Funding

The COSMO-SkyMed data used in this work were provided under the aegis of the project MODISTA funded by the Italian Ministry of University and Research with grant PON03PE_00159_6.

Institutional Review Board Statement

Not applicable.

Informed Consent Statement

Not applicable.

Data Availability Statement

Not applicable.

Conflicts of Interest

The authors declare no conflict of interest.

References

  1. Weng, Q.; Quattrochi, D.A. (Eds.) Urban Remote Sensing; CRC Press: Boca Raton, FL, USA, 2006. [Google Scholar]
  2. UNWater. The United Nations World Water Development Report 2015: Water for a Sustainable World; UNWater: Paris, France, 2015. [Google Scholar]
  3. UNDESA. World Population Prospects: The 2014 Revision, Highlights; UNDESA: New York, NY, USA, 2014. [Google Scholar]
  4. Potere, D.; Schneider, A. A critical look at representations of urban areas in global maps. GeoJournal 2007, 69, 55–80. [Google Scholar] [CrossRef]
  5. Trianni, G.; Lisini, G.; Angiuli, E.; Moreno, E.A.; Dondi, P.; Gaggia, A.; Gamba, P. Scaling up to National/Regional Urban Extent Mapping Using Landsat Data. IEEE J. Sel. Top. Appl. Earth Obs. Remote Sens. 2015, 7, 3710–3719. [Google Scholar] [CrossRef]
  6. Potere, D.; Schneider, A.; Angel, S.; Civco, D. Mapping urban areas on a global scale: Which of the eight maps now available is more accurate? Int. J. Remote Sens. 2009, 30, 6531–6558. [Google Scholar] [CrossRef]
  7. Schneider, A.; Friedl, M.A.; Potere, D. Mapping global urban areas using MODIS 500-m data: New methods and datasets based on ‘urban ecoregions. Remote Sens. Environ. 2010, 114, 1733–1746. [Google Scholar] [CrossRef]
  8. García-Mora, T.J.; Mas, J.-F.; Hinkley, E.A. Land cover mapping applications with MODIS: A literature review. Int. J. Digit. Earth 2012, 5, 63–87. [Google Scholar] [CrossRef]
  9. Pacifici, F.; Del Frate, F.; Emery, W.J.; Gamba, P.; Chanussot, J. Urban Mapping Using Coarse SAR and Optical Data: Outcome of the 2007 GRSS Data Fusion Contest. IEEE Geosci. Remote Sens. Lett. 2008, 5, 331–335. [Google Scholar] [CrossRef] [Green Version]
  10. Tsoeleng, L.T.; Odindi, J.; Mhangara, P.; Malahlela, O. Assessing the performance of the multi-morphological profiles in urban land cover mapping using pixel based classifiers and very high resolution satellite imagery. Sci. Afr. 2020, 10, e00629. [Google Scholar] [CrossRef]
  11. Zhao, F.; Zhang, S.; Du, Q.; Ding, J.; Luan, G.; Xie, Z. Assessment of the sustainable development of rural minority settlements based on multidimensional data and geographical detector method: A case study in Dehong, China. Socioecon. Plann. Sci. 2021, 78, 101066. [Google Scholar] [CrossRef]
  12. Wang, H.; Gong, X.; Wang, B.; Deng, C.; Cao, Q. Urban development analysis using built-up area maps based on multiple high-resolution satellite data. Int. J. Appl. Earth Obs. Geoinf. 2021, 103, 102500. [Google Scholar] [CrossRef]
  13. Lynch, P.; Blesius, L.; Hines, E. Classification of urban area using multispectral indices for urban planning. Remote Sens. 2020, 12, 2503. [Google Scholar] [CrossRef]
  14. Chen, B.; Xu, B.; Gong, P. Mapping essential urban land use categories (EULUC) using geospatial big data: Progress, challenges, and opportunities. Big Earth Data 2021, 5, 410–441. [Google Scholar] [CrossRef]
  15. Franceschetti, G.; Iodice, A.; Riccio, D. A Canonical Problem in Electromagnetic Backscattering From Buildings. IEEE Trans. Geosci. Remote Sens. 2002, 40, 1787–1801. [Google Scholar] [CrossRef]
  16. Guida, R.; Iodice, A.; Riccio, D. Height Retrieval of Isolated Buildings From Single High-Resolution SAR Images. IEEE Trans. Geosci. Remote Sens. 2010, 48, 2967–2979. [Google Scholar] [CrossRef]
  17. Amitrano, D.; Di Martino, G.; Guida, R.; Iervolino, P.; Iodice, A.; Papa, M.N.; Riccio, D.; Ruello, G. Earth environmental monitoring using multi-temporal synthetic aperture radar: A critical review of selected applications. Remote Sens. 2021, 13, 604. [Google Scholar] [CrossRef]
  18. Esch, T.; Thiel, M.; Schenk, A.; Roth, A.; Muller, A. Delineation of Urban Footprints From TerraSAR-X Data by Analyzing Speckle Characteristics and Intensity Information. IEEE Trans. Geosci. Remote Sens. 2003, 48, 905–916. [Google Scholar] [CrossRef]
  19. Amitrano, D.; Belfiore, V.; Cecinati, F.; Di Martino, G.; Iodice, A.; Mathieu, P.P.; Medagli, S.; Poreh, D.; Riccio, D.; Ruello, G. Urban Areas Enhancement in Multitemporal SAR RGB Images Using Adaptive Coherence Window and Texture Information. IEEE J. Sel. Top. Appl. Earth Obs. Remote Sens. 2016, 9, 3740–3752. [Google Scholar] [CrossRef]
  20. Salentinig, A.; Gamba, P. A General Framework for Urban Area Extraction Exploiting Multiresolution SAR Data Fusion. IEEE J. Sel. Top. Appl. Earth Obs. Remote Sens. 2016, 9, 2009–2018. [Google Scholar] [CrossRef]
  21. Gamba, P.; Aldrighi, M. SAR data classification of urban areas by means of segmentation techniques and ancillary optical data. IEEE J. Sel. Top. Appl. Earth Obs. Remote Sens. 2012, 5, 1140–1148. [Google Scholar] [CrossRef]
  22. Dekker, R.J. Texture analysis and classification of ERS SAR images for map updating of urban areas in the Netherlands. IEEE Trans. Geosci. Remote Sens. 2003, 41 Pt I, 1950–1958. [Google Scholar] [CrossRef]
  23. Dell’Acqua, F.; Gamba, P. Texture-Based Characterization of Urban Environments on Satellite SAR Images. IEEE Trans. Geosci. Remote Sens. 2003, 41, 153–159. [Google Scholar] [CrossRef]
  24. Amitrano, D.; Di Martino, G.; Iodice, A.; Riccio, D.; Ruello, G. RGB SAR products: Methods and applications. Eur. J. Remote Sens. 2016, 49, 777–793. [Google Scholar] [CrossRef] [Green Version]
  25. Cecinati, F.; Amitrano, D.; Leoncio, L.B.; Walugendo, E.; Guida, R.; Iervolino, P.; Natarajan, S. Exploitation of ESA and NASA Heritage Remote Sensing Data for Monitoring the Heat Island Evolution in Chennai with the Google Earth Engine. In Proceedings of the IGARSS 2019-2019 IEEE International Geoscience and Remote Sensing Symposium, Yokohama, Japan, 28 July–2 August 2019; pp. 6328–6331. [Google Scholar]
  26. Henderson, F.M.; Xia, Z.-G. SAR applications in human settlement detection, population estimation and urban land use pattern analysis: A status report. IEEE Trans. Geosci. Remote Sens. 1997, 35, 79–85. [Google Scholar] [CrossRef]
  27. Koukiou, G.; Anastassopoulos, V. Fully Polarimetric Land Cover Classification Based on Markov Chains. Adv. Remote Sens. 2021, 10, 47–65. [Google Scholar] [CrossRef]
  28. Dumitru, C.O.; Cui, S.; Schwarz, G.; Datcu, M. Information Content of Very-High-Resolution SAR Images: Semantics, Geospatial Context, and Ontologies. IEEE J. Sel. Top. Appl. Earth Obs. Remote Sens. 2014, 8, 1635–1650. [Google Scholar] [CrossRef] [Green Version]
  29. Amitrano, D.; di Martino, G.; Iodice, A.; Riccio, D.; Ruello, G. A New Framework for SAR Multitemporal Data RGB Representation: Rationale and Products. IEEE Trans. Geosci. Remote Sens. 2015, 53, 117–133. [Google Scholar] [CrossRef]
  30. Amitrano, D.; Cecinati, F.; Di Martino, G.; Iodice, A.; Mathieu, P.P.; Riccio, D.; Ruello, G. Multitemporal Level-1β Products: Definitions, Interpretation, and Applications. IEEE Trans. Geosci. Remote Sens. 2016, 54, 6545–6562. [Google Scholar] [CrossRef]
  31. Kohonen, T. The Self-Organizing Map. Proc. IEEE 1990, 78, 1464–1480. [Google Scholar] [CrossRef]
  32. Amitrano, D.; Cecinati, F.; Di Martino, G.; Iodice, A.; Mathieu, P.P.; Riccio, D.; Ruello, G. Feature Extraction From Multitemporal SAR Images Using Selforganizing Map Clustering and Object-Based Image Analysis. IEEE J. Sel. Top. Appl. Earth Obs. Remote Sens. 2018, 11, 1556–1570. [Google Scholar] [CrossRef]
  33. Matsuyama, T.; Hwang, V.S.-S. SIGMA—A Knowledge-Based Aerial Image Understanding System; Plenum Press: New York, NY, USA, 1990. [Google Scholar]
  34. Blaschke, T. Object based image analysis for remote sensing. ISPRS J. Photogramm. Remote Sens. 2010, 65, 2–16. [Google Scholar] [CrossRef] [Green Version]
  35. Shapiro, L.; Stockman, G. Computer Vision; Prentice Hall: Upper Saddle River, NJ, USA, 2002. [Google Scholar]
  36. Favreau, J.-D.; Lafarge, F.; Bousseau, A.; Auvolat, A. Extracting Geometric Structures in Images with Delaunay Point Processes. IEEE Trans. Pattern Anal. Mach. Intell. 2019, 42, 837–850. [Google Scholar] [CrossRef]
  37. Amitrano, D.; di Martino, G.; Iodice, A.; Riccio, D.; Ruello, G. An end-user oriented framework for the classification of multitemporal SAR images. Int. J. Remote Sens. 2016, 37, 248–261. [Google Scholar] [CrossRef] [Green Version]
  38. European Environment Agency. Mapping Guide for a European Urban Atlas; European Environment Agency: Copenhagen, Denmark, 2011. [Google Scholar]
  39. Weeks, J.R. Defining Urban Areas. In Remote Sensing of Urban and Suburban Areas; Rashed, T., Jurgens, C., Eds.; Springer: Berlin, Germany, 2010. [Google Scholar]
  40. Boehm, C.; Schenkel, R. Analysis of Spatial Patterns of Urban Areas Using High Resolution Polarimetric SAR. In Proceedings of the 1st EARSel Workshop of the SIG Urban Remote Sensing, Berlin, Germany, 2–3 March 2006. [Google Scholar]
  41. Amitrano, D.; Guida, R.; Iervolino, P. Semantic Unsupervised Change Detection of Natural Land Cover With Multitemporal Object-Based Analysis on SAR Images. IEEE Trans. Geosci. Remote Sens. 2020, 59, 5494–5514. [Google Scholar] [CrossRef]
Figure 1. Block diagram of the proposed technique. Blocks with rounded corners indicate processing blocks. Rectangles stand for the products.
Remotesensing 15 00122 g001
Figure 2. Generation of the coarse urban area map. (a) RGB Level-1α product. (b) 16-category pre-classification map obtained through SOM clustering. (c) Built-up feature map obtained by isolation of the white and red classes in the clustered product. (d) Urban density map generated by averaging the density maps obtained by sliding two windows of different size on the binary mask depicted in (c).
Remotesensing 15 00122 g002
Figure 3. Object-based reasoning for filling the “holes” within the identified urban area. Dense urban area: (a) clustered Level-1α product, (b) coarse urban area map, and (c) holes (in red color) filled by analyzing the spatial relationship between neighboring objects. Sparse urban area: (d) clustered Level-1α product, (e) coarse urban area map, and (f) holes (in red color) filled by analyzing the spatial relationship between neighboring objects. Holes filled at this stage are marked with the numeric ID 1, indicating a “low density” urban area.
Remotesensing 15 00122 g003
Figure 4. Delaunay triangulation OBIA. Dense urban area: (a) bridges between close regions, and (b) connected regions absorbed in the urban area displayed in the color red. Sparse urban area: (c) bridges between close regions, and (d) connected regions absorbed in the urban area displayed in the color red.
Remotesensing 15 00122 g004
Figure 5. Dresden (Germany), 5-class land cover map with a 15 m spatial resolution obtained through semantic clustering of an input Level-1β product.
Remotesensing 15 00122 g005
Figure 6. Urban density map for the Napoli area extracted by applying the proposed methodology to the input Level-1α product depicted in Figure 2a. Minimum mapped area: 300,000 m2. Urban density windows ~150 m and ~450 m.
Remotesensing 15 00122 g006
Figure 7. Dresden area (Germany). SAR-Derived urban density map obtained by applying the proposed methodology to the input Level-1β product depicted in Figure 5. The result has been projected into the Urban Atlas polygons for comparison with the reference data.
Remotesensing 15 00122 g007
Figure 8. Dresden area, misclassification sources. (a) The Elbe River as seen on the Level-1β image. (b) Misclassification map. (c) Google Earth view. (d) A small urban area in the neighborhood of the Elbe River as seen on the clustered Level-1β product. (e) Misclassification map. (f) Google Earth view.
Remotesensing 15 00122 g008
Figure 9. Napoli and Caserta areas, misclassification sources. (a) An agricultural area as seen on the Level-1α image. (b) Misclassification map. (c) Google Earth view. (d) A small urban area surrounded by a rural landscape as seen on the Level-1α image. (e) Misclassification map. (f) Google Earth view.
Remotesensing 15 00122 g009
Table 1. Details of the preliminary urban density classification. The class “low density” is not assigned at this stage.
Class NameDensity (%)ID
Very high densityD ≥ 304
High density20 ≤ D < 303
Medium density10 ≤ D < 202
Low densityD < 10 1
Very low density/not urbanD < 100
Table 2. Dresden: confusion matrix for the urban/not urban classification using reference data derived from the Urban Atlas. Proposed methodology—overall accuracy: 83.61%, kappa coefficient: 0.64. Urban density windows ~150 m and ~450 m. Speckle divergence—overall accuracy: 79.45%, kappa coefficient: 0.38. Threshold set to 0.6.
ProposedSpeckle Divergence
Not Urban
(%)
Urban
(%)
Not Urban
(%)
Urban
(%)
Not urban84.6118.4082.45%35.99%
Urban15.3981.6017.55%64.01%
Producer accuracy84.6181.6082.45%64.01%
User accuracy90.3472.2792.19%41.43%
Table 3. Napoli area: confusion matrix for the urban/not urban classification using reference data derived from the Urban Atlas. Proposed methodology—overall accuracy: 81.93%, kappa coefficient: 0.63. Urban density windows ~150 m and ~450 m. Speckle divergence—overall accuracy: 78.45%, kappa coefficient 0.59. Threshold set to 0.8.
ProposedSpeckle Divergence
Not Urban
(%)
Urban
(%)
Not Urban
(%)
Urban
(%)
Not urban76.449.9973.769.63
Urban23.5690.0126.2490.37
Producer accuracy76.4490.0173.7690.37
User accuracy91.8472.8095.1157.56
Table 4. Caserta area: confusion matrix for the urban/not urban classification using reference data derived from the Urban Atlas. Proposed methodology—overall accuracy: 91.79%, kappa coefficient: 0.58. Urban density windows ~150 m and ~450 m. Speckle divergence: overall accuracy: 81.5%, kappa coefficient: 0.59. Threshold set to 0.8.
ProposedSpeckle Divergence
Not Urban
(%)
Urban
(%)
Not Urban
(%)
Urban
(%)
Not urban96.4441.6177.335.40
Urban3.5658.3922.67 94.60
Producer accuracy96.4458.3977.37 94.60
User accuracy94.3469.5697.79 57.43
Table 5. Comparison between the Urban Atlas categories and the SAR categories reported in Table 1 in terms of SL. The SAR-derived SL percentage has been retrieved by calculating the mean density of pixels identified as urban used within the urban Atlas polygons.
Urban Atlas CategorySL (%)SAR CategoryNapoli
SL (%)
Caserta
SL (%)
Dresden
(SL %)
Continuous urban fabric>80Very high33.834.6536.64
Dense urban fabric50–80High24.224.5424.47
Medium density urban30–50Medium14.9714.6714.52
Low density urban10–30Low7.438.079.05
Very low density urban<10Not urbannanana
Disclaimer/Publisher’s Note: The statements, opinions and data contained in all publications are solely those of the individual author(s) and contributor(s) and not of MDPI and/or the editor(s). MDPI and/or the editor(s) disclaim responsibility for any injury to people or property resulting from any ideas, methods, instructions or products referred to in the content.