Article

On the Discovery of a Roman Fortified Site in Gafsa, Southern Tunisia, Based on High-Resolution X-Band Satellite Radar Data

1
The Volcano & Earthquake Research Laboratory, Central South University, Changsha 410006, China
2
Institute of Heritage Science, National Research Council (ISPC CNR), 85050 Tito, Italy
3
National Institute of Heritage Tunisia, 04, Place du Château, Tunis 1008, Tunisia
4
Aerospace Information Research Institute, Chinese Academy of Sciences (CAS), Beijing 100094, China
5
Department of Computer Science, Hunan University, Changsha 410012, China
6
Institute of Methodologies for Environmental Analysis (IMAA), National Research Council (CNR), C. da Santa Loja, 85050 Tito Scalo, Italy
*
Author to whom correspondence should be addressed.
Remote Sens. 2022, 14(9), 2128; https://doi.org/10.3390/rs14092128
Submission received: 14 March 2022 / Revised: 8 April 2022 / Accepted: 25 April 2022 / Published: 28 April 2022
(This article belongs to the Special Issue Advances in Remote Sensing for Exploring Ancient History)

Abstract

:
The increasing availability of multiplatform, multiband, very-high-resolution (VHR) satellite synthetic aperture radar (SAR) data has attracted the attention of a growing number of scientists and archeologists. In particular, over the last two decades, archeological research has benefited from SAR development mainly due to its unique ability to acquire scenes both at night and during the day under all weather conditions, its penetration capability, and the provided polarimetric and interferometric information. This paper explored the potential of a novel method (nonlocal (NL)-SAR) using TerraSAR-X (TSX) and Constellation of Small Satellites for Mediterranean Basin Observation (COSMO)-SkyMed (CSK) data to detect buried archeological remains in steep, rugged terrain. In this investigation, two test sites were selected in southern Tunisia, home to some of the most valuable and well-preserved limes from the Roman Empire. To enhance the subtle signals linked to archeological features, the speckle noise introduced into SAR data by the environment and SAR system must be mitigated. Accordingly, the NL-SAR method was applied to SAR data pertaining to these two significant test sites. Overall, the investigation (i) revealed a fortified settlement from the Roman Empire and (ii) identified an unknown urban area abandoned during this period via a field survey, thus successfully confirming the capability of SAR data to reveal unknown, concealed archeological sites, even in areas with a complex topography.

1. Introduction

Over the last few decades, beginning with the use of aerial photos, optical satellite remote sensing has played an essential role in archeological research [1,2,3,4,5,6,7]. Shadows, crops, and soil marks are well-known markers commonly used in archeological photography [8,9,10,11,12] as proxy indicators for the presence of ancient buried remains. Furthermore, emergent, shallow, and buried remnants alter the albedo, physical, and chemical characteristics of the surface, yielding objects visible from space.
Accordingly, several scientists have evaluated and debated the use of optical satellite sensors to detect archeological traces [13,14,15,16,17,18,19]. The availability of imagery acquired by very-high-resolution (VHR) satellite sensors, such as those on board Ikonos, QuickBird and WorldView satellites, has sparked a surge in interest in space archeology, as is evident from the increasing number of publications on topics ranging from site discovery to better management and protection of archeological sites [11,14,20]. In fact, combined with aerial photos, optical satellite imaging has been used more extensively than radar data in archeology to date. Nevertheless, it should be mentioned that the National Aeronautics and Space Administration (NASA) released Shuttle Imaging Radar (SIR)-A/B/C, Airborne Synthetic Aperture Radar (AIRSAR), and Shuttle Radar Topography Mission (SRTM) SAR data in the 1980s, ushering in a new era of radar remote sensing in archeology at desert sites [21,22] and tropical regions [23,24]. These advances have led to considerable progress in archeological investigations employing SAR data. With the use of second-generation spaceborne SAR systems, which include multiband and high-resolution systems, e.g., Advanced Land Observing Satellite (ALOS), Phased Array type L-band Synthetic Aperture Radar (PALSAR), TanDEM-X, TerraSAR-X (TSX), Constellation of Small Satellites for Mediterranean Basin Observation (COSMO)-SkyMed (CSK), and Radarsat-2, researchers have focused on archeological detection and monitoring via techniques such as backscattering change detection [25,26], polarimetric enhancement [27,28,29], penetration [30], and deformation anomaly diagnosis [31,32,33].
However, although tests have been reported [34] utilizing simulated data, thereby correlating shadows/dark marks in SAR images with archeological features, all of the above mentioned studies leveraged the penetrative or polarimetric capacity of satellite L-, C-, and X-band SAR systems to identify archeological sites, crops, and soil marks [24]. In contrast, the use of aerial [35] and spaceborne SAR data [36] in the detection of evidence of archeological relevance represents a relatively new approach. In particular, NASA [35] explored the development of a systematic approach to survey vast areas using airborne SAR and satellite multispectral data [37] and proposed the use of multitemporal CSK data as a first step in the detection of known archeological traces. Schiavon et al. performed multitemporal analysis [35] to decrease speckle noise impairing SAR data. Nevertheless, despite the significant progress achieved in recent years, the use of SAR remote sensing to discover ancient sites remains immature, particularly in regard to X-band sensors such as the CSK sensor (for additional details, please refer to the COSMO-SkyMed System Description and User Guide) [38]. Chen et al. [36] effectively applied CSK intensity data in archeological prospecting by analyzing the roughness and microtopography (in addition to soil and vegetation markings) at a variety of sites, including Luoyang in China, Sabratha in Libya, and Metapontum in Italy. Gade and Kohlus [37] employed the TSX staring spotlight (ST) acquisition mode, which achieves a pixel size of 0.3 m, to discover archeological sites in Wadden Sea intertidal flats off the German North Sea coast.
When comparing current satellite L- and C-band SAR systems to X-band SAR systems, the latter is expected to offer information on a wider range of minor archeological features due to its higher geometric resolution. Thus, even though the use of satellite radar in archeology remains at the early stages, satellite radar systems exhibit an enormous potential for a variety of applications, including paleolandscape reconstruction [29], buried site detection [39], and cultural heritage (CH) documentation and monitoring, as demonstrated in a recent study using VHR data retrieved from satellites such as TSX and CSK satellites [40,41]. Consequently, there exists a pressing need in the field of SAR-based archeology to conduct additional research, particularly across multiple environments (desert, semiarid, Mediterranean, etc.) and varying land-use/cover types, to develop better interpretation and modeling methodologies that may be adapted or generated ad hoc for diverse environments.
Within this context, this study provides a first-of-its-kind assessment of the potential of satellite SAR data in the detection of traces of archeological relics. SAR processing chains often include a multilook filter to reduce speckle noise at the expense of notable resolution loss. The preservation of point-like and fine structures and textures requires locally adapted estimation. The nonlocal (NL) means algorithm can successfully modify the smoothing filter by deriving data-driven weights from the similarity between small image patches. Hence, the generalization of NL approaches offers a flexible framework for resolution-preserving speckle reduction. We describe a general method, i.e., NL-SAR, which builds extended NL neighborhoods to denoise amplitude, polarimetric, and/or interferometric SAR images. In particular, we present and examine the results of collaborative efforts of archeologists and remote sensing professionals to assess the utilization of high-resolution TSX and CSK data within various contexts and environmental situations. To achieve this goal, two key test sites in the Wadi El Maleh Valley (WMV, southern Tunisia) were chosen, as this region is characterized by diverse archeological features (ranging from roads to defense walls, ditches, and building structures) as a result of a long history of occupation before and by the Romans.

2. Materials and Methods

2.1. Purpose of the Study
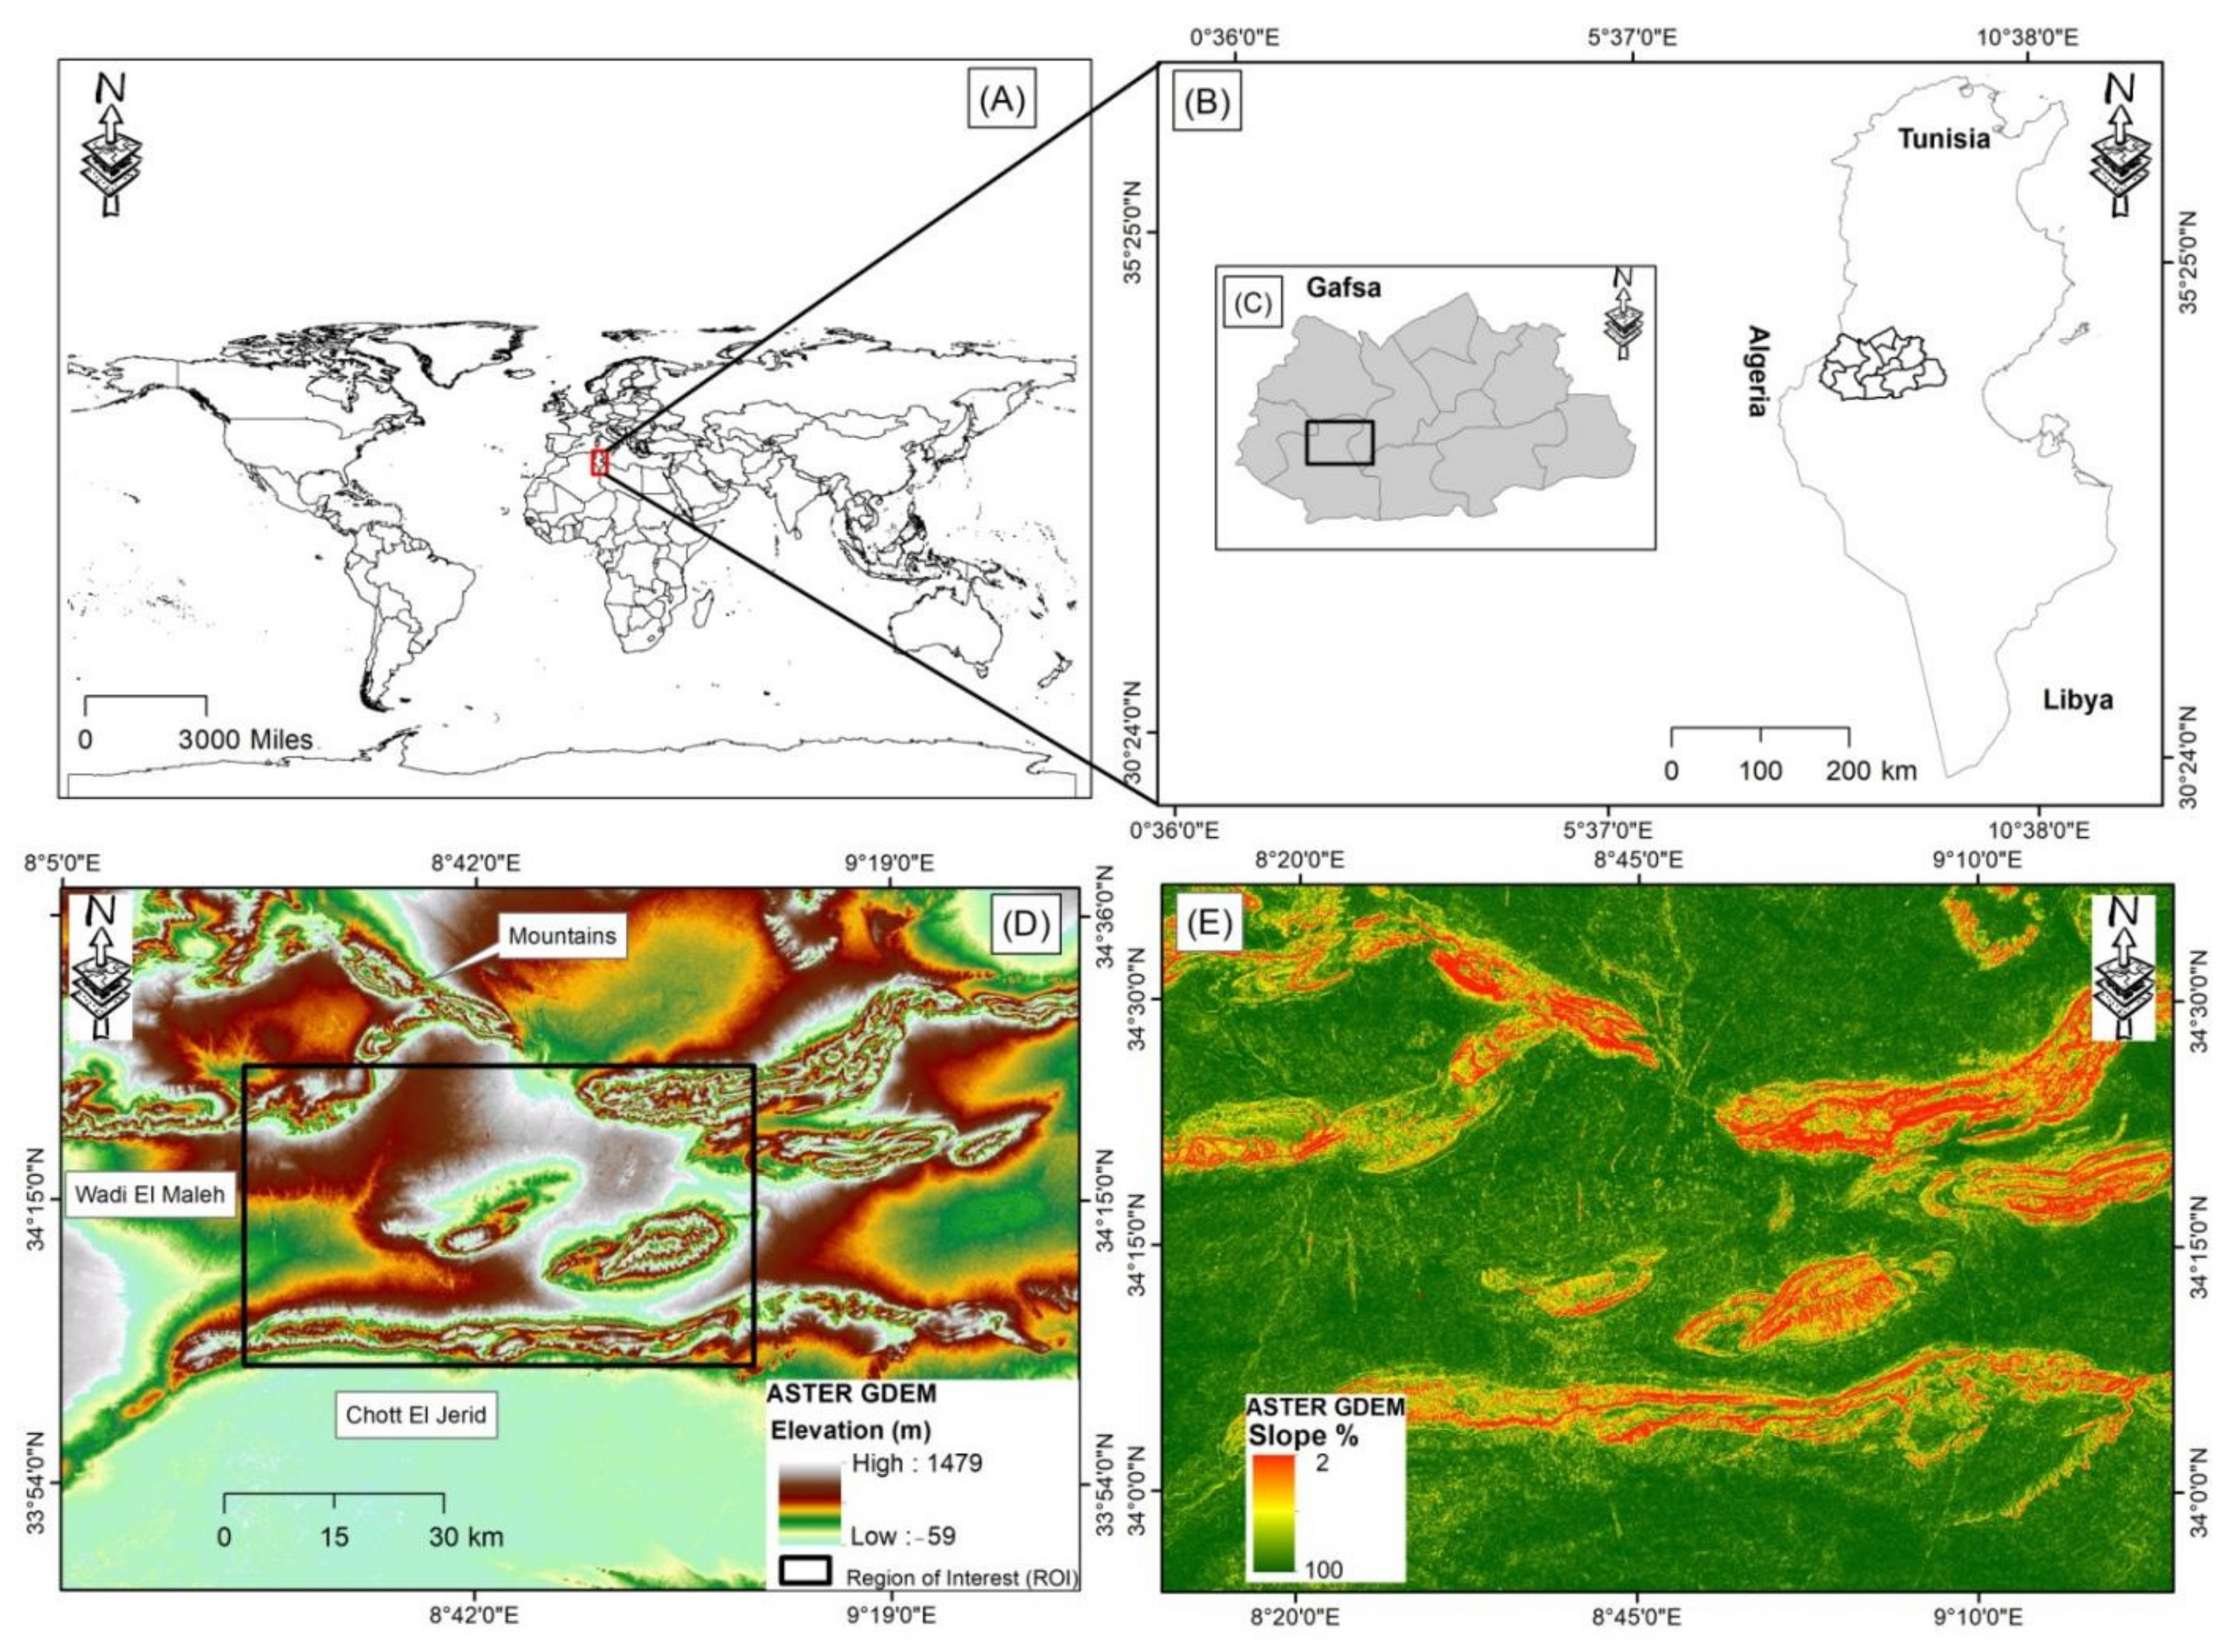
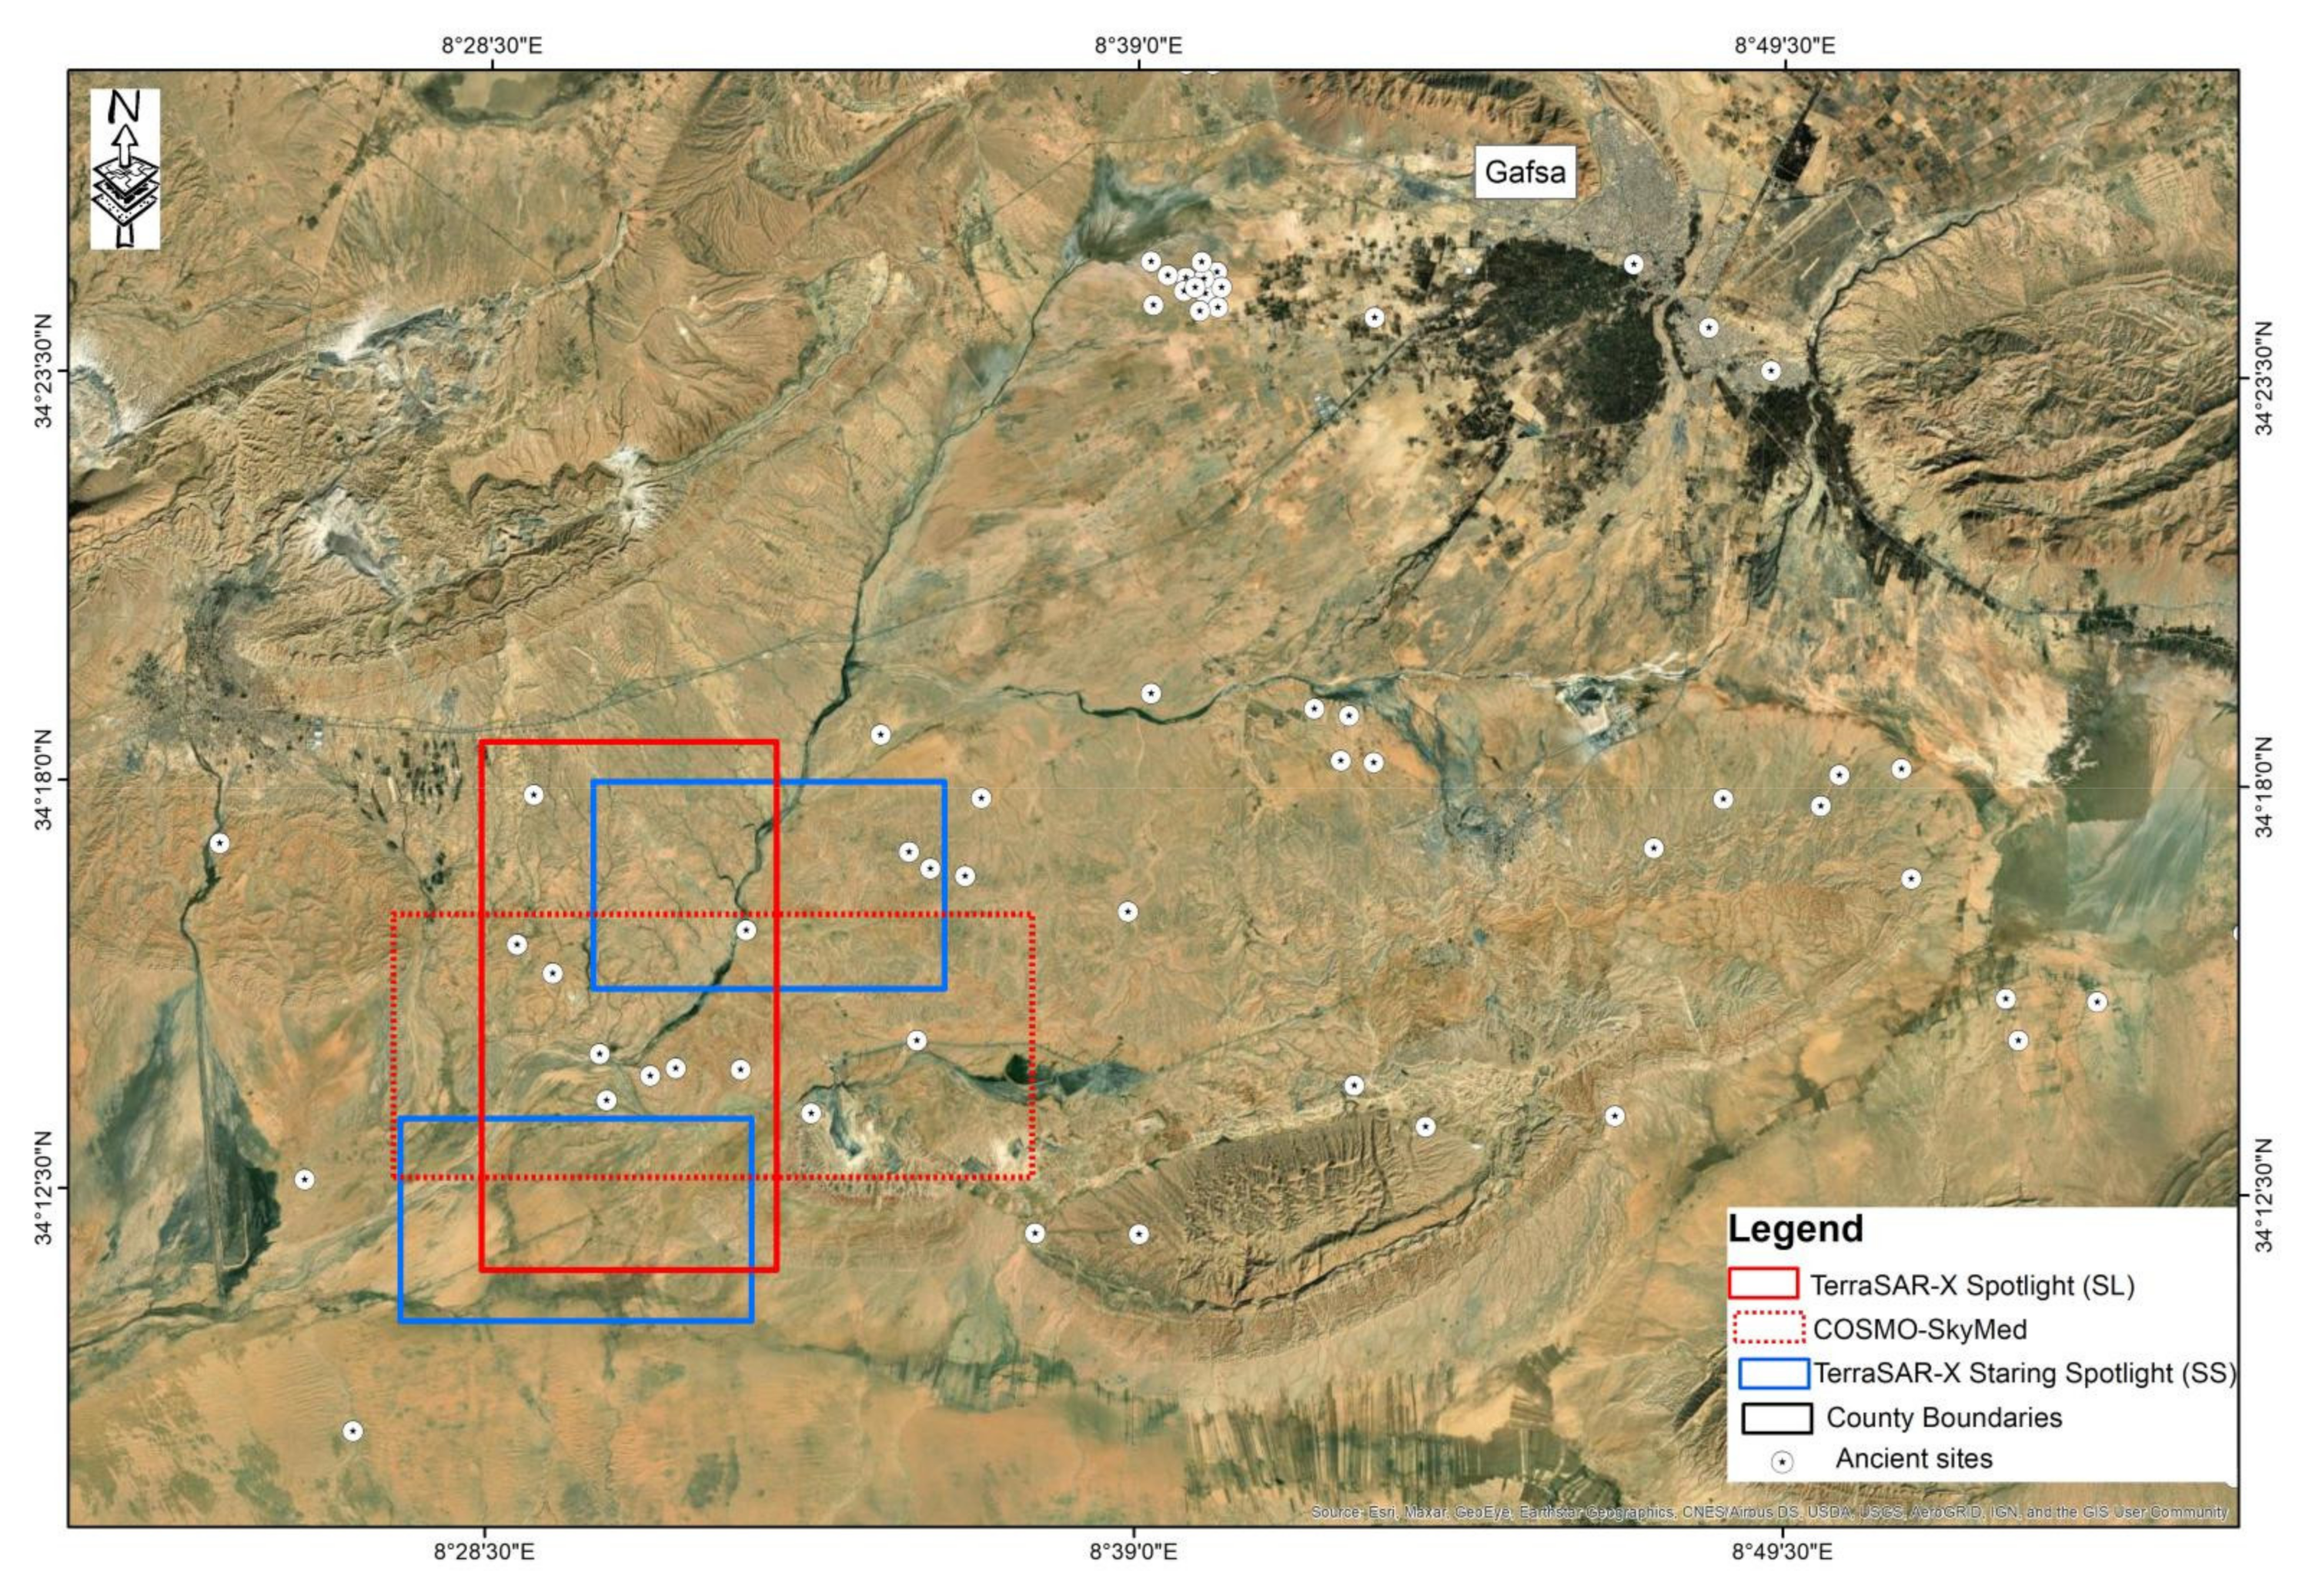
The purpose of this study was to exploit the highest-resolution SAR data available to survey archeological areas in the currently inaccessible Sahara Desert in Tunisia. The objective was to use SAR data to detect possible undiscovered buried structures at known archeological sites. SAR data analysis was conducted involving TSX data acquired in both spotlight (SL) and ST modes and CSK data acquired in the SL mode.

2.2. Study Area

The Roman archeological site investigated herein was recently discovered in 2017 on the eastern border of the city of Gafsa in Tunisia, approximately 50 km west of the town of Metloui along the southern frontier of the Roman Empire, the boundaries of which are referred to as the Roman limes. The limes remaining today comprise defense walls, ditches, fortresses, watchtowers, and civilian settlements. At Gafsa, most of these fortified structures are hidden beneath the desert, as the area is almost entirely covered with a layer of aeolian sand. The site is situated at the periphery of the WMV (both ancient and contemporary). The climate is warm and temperate, and the average annual temperature reaches 19.6 °C; the area receives less than 100 mm of precipitation annually [42]. As shown in Figure 1, the study area (between 34°11′56.58″N and 34°16′18.63″N and between 8°29′14.48″E and 8°32′49.66″E) and the city of Gafsa, southern Tunisia, are located within the WMV. The WMV, whose topography progressively decreases toward the south, geomorphologically comprises high plains delimited by mountains and reaches a maximum altitude of 1479 m. A considerable amount of work has been conducted to better understand the Roman frontiers, and systematic research projects have been conducted in most of the countries once occupied by the Roman Empire. A comprehensive series of works and monographs and an immense number of other contributions and papers have been published [43,44,45,46,47].

2.3. Data

The spaceborne SAR data, i.e., one frame of TSX SL archived time series data (solid red rectangle), one frame of CSK data (dotted red rectangle), and two frames of TSX ST archived time series data (solid blue rectangles), were acquired and are shown in Figure 2. TSX data were obtained from the German Aerospace Center (DLR) through the TSX and CSK new acquisitions research project (project ID 37046). In regard to the experiments described in this paper, we used six TSX images and three CSK images. The details of these images are listed in Table 1. TSX employs different acquisition modes. In our experiments, we used both TSX SL and ST data. In addition, we used CSK SL data. The CSK SL mode is the standard acquisition mode of SAR sensors at an approximate resolution of 1 m. In the above two TSX modes (i.e., SL and ST), during acquisition, the squint angle of the sensor shifts from a slightly forward-looking angle to a slightly backward-looking angle. This shift increases the acquisition time and is used to enhance the spatial resolution along the azimuthal direction of the sensor, allowing an increased resolution of approximately 1.3 m in the standard SL mode. In the ST mode, the acquisition time is further increased, leading to an approximate azimuthal resolution of 0.22 m. We, therefore, assumed that we could most effectively detect potential archeological targets in ST-mode images. Table 1 provides the characteristics of the considered TSX data. Three TSX ST images of the study area were acquired. These time series data were needed to reduce image speckle noise by implementing a speckle filter in the time domain while preserving the spatial resolution. The time series data further helped to identify and discard temporary features.
ZY-3 (Ziyuan-3 or Resources-3) is China’s first civil high-resolution mapping satellite. Launched in the spring of 2012, it provides 2.1 m resolution PAN and 5.8 m resolution multispectral (MS) image products for topographical mapping and observation of land resources (Table 2). The ZY-3 PAN imagery used in this study was acquired from the China Center for Resources Satellite Data and Application.

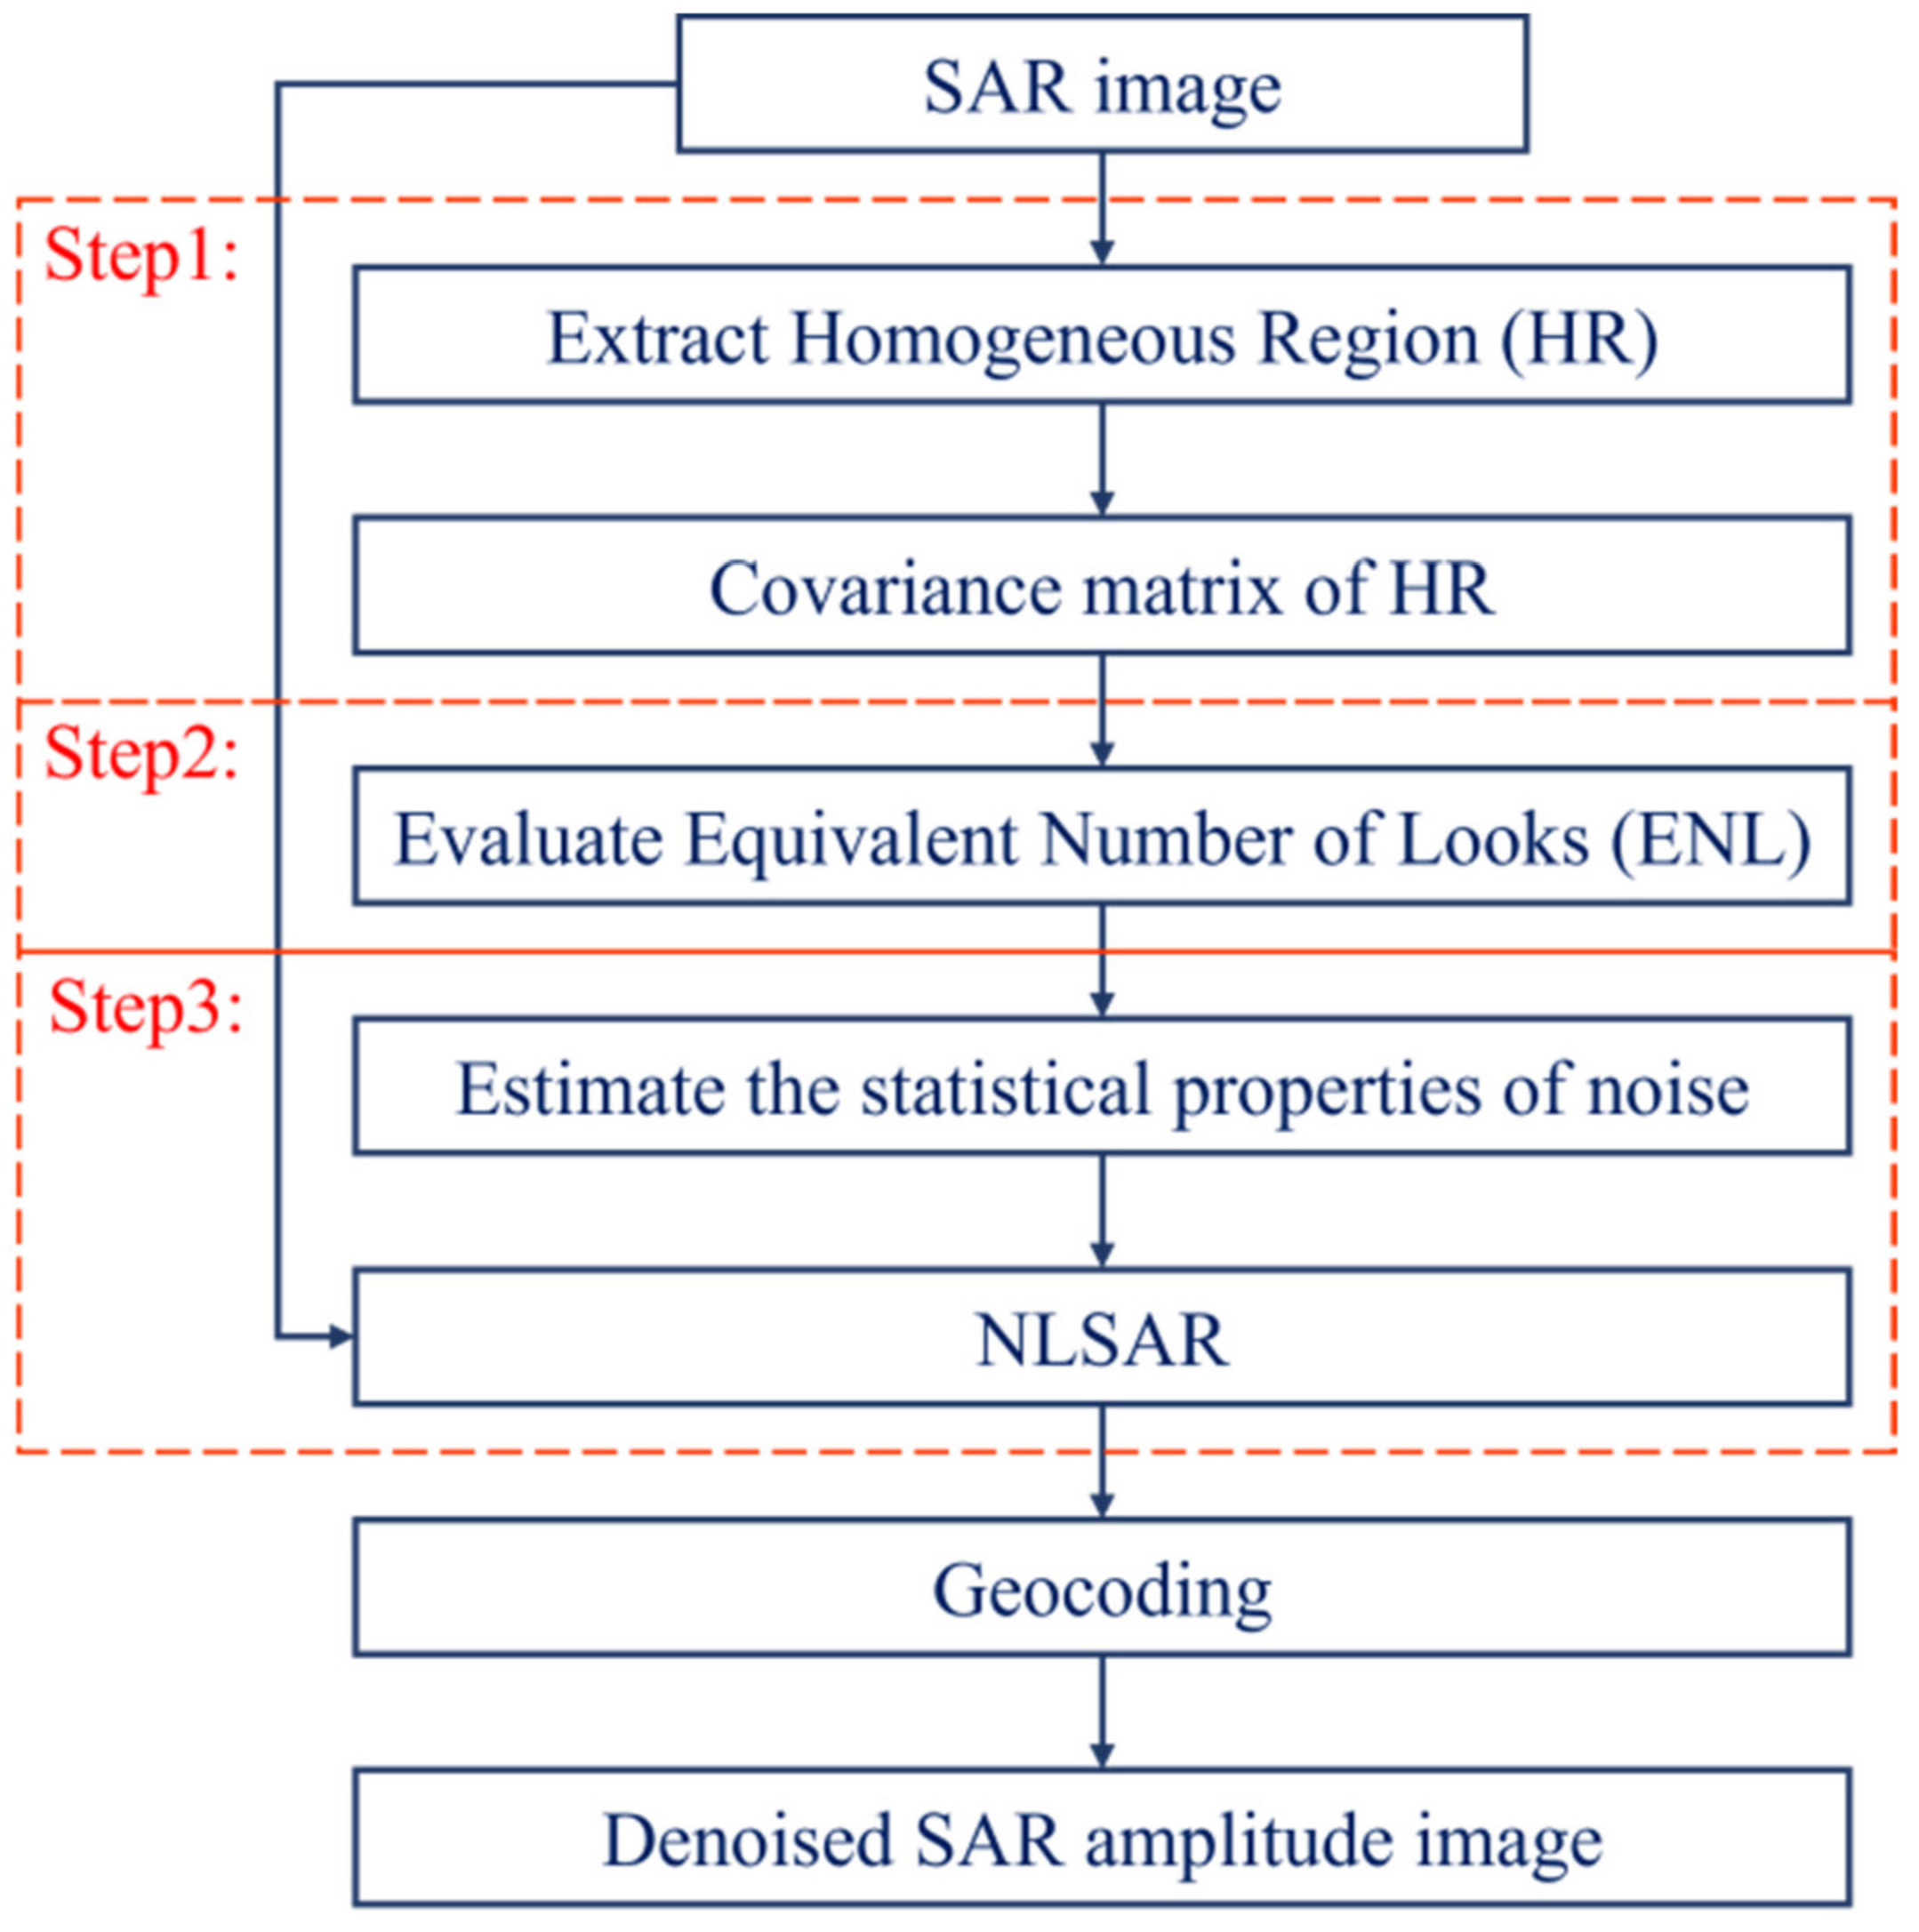
2.4. Processing Strategy: Rational Basis

As highlighted in Section 1, the use of satellite radar data in archeology still occurs at the experimental stage, but this approach undoubtedly offers a vast potential for manifold applications. However, compared to the use of optical data, the application of SAR data in archeology encounters critical issues: (i) the use (especially the interpretation process) of SAR data by archeologists is highly complicated, and (ii) the subtle signals of archeological interest in SAR images can be masked by noise. Recently, Sentinel-1 data have been used to monitor CH sites, and pioneering studies have demonstrated that multitemporal Sentinel-1 data can be employed to extract information on paleorivers and paleochannels, which are not evident in optical images of the present-day terrain [48,49]. Despite the promise and early successes of satellite SAR data, the application of Sentinel-1 data in archeology remains uncertain and is hindered by numerous challenges. Among these issues, despite their indisputable potential, multitemporal and/or time series SAR data are plagued by noise, the removal of which is not only a time-consuming endeavor but also not achievable for non-systematically acquired data, as is the case of VHR SAR data. To overcome this issue, in this paper, we propose a methodology for noise level reduction, which constitutes a crucial step whose success or failure can strongly influence the capability of SAR data to detect the faint signals of archeological features. A flowchart of the data processing scheme adopted herein is shown in Figure 3, and the data processing scheme comprises three main steps.
Step 1: A homogeneous region is selected in the SAR image to estimate noise statistical characteristics. The selected homogeneous region should not contain an obvious ground structure.
Step 2: The equivalent number of looks (ENL) of the SAR amplitude image is determined. The ENL is defined by Equation (1).
E N L I = 0.5227 β 2
where β is the ratio of the standard deviation to the mean of a large homogeneous region in the SAR image.
Step 3: On the basis of the NL-SAR method, the obtained noise statistical characteristics are used in image denoising, and the denoised image is then geocoded in the geographic coordinate system. Section 2.5 introduces the statistical characteristics of SAR and the NL-SAR denoising process in detail.

2.5. SAR Image Statistics

Speckle noise occurs in SAR images because the scattered signals between scatterers at the cell resolution interfere with each other. Speckle noise can seriously affect the analysis of SAR intensity signals. Therefore, it is necessary to model and minimize SAR speckle noise. Below, we describe the statistical behavior of SAR speckle noise.
When an SAR satellite observes the ground once, an SAR image can be obtained, which can be represented by the scattering vector u . The dimension D of u   is related to the SAR polarization observation mode. In regard to single-polarization data, D = 1 , and, in regard to full-polarization data, D = 3 . The scattering vector u   follows a D -dimensional complex circular Gaussian distribution.
Single-look complex (SLC) SAR images contain unwanted speckle noise resulting from interference among elementary scatterers within each resolved cell. In terms of SLC SAR images, in each pixel x ( D = 1 for a single-polarization image), a D -dimensional scattering vector k is produced from polarimetric SAR images, with a total of k entries matching the amplitudes of the different polarizations. The thusly formed scattering vector k follows a D -dimensional circular complex Gaussian distribution under two assumptions, namely, fully developed speckle and homogeneity of elementary scatterers within a resolved cell [50].
p u | Σ = 1 π D Σ e x p u * T Σ 1 u ,
where Σ = E u   u * T is the complex covariance matrix, u * T represents the complex conjugate transpose, and Σ represents the determinant of Σ . For the SAR image of a single observation, it can be represented by a complex number z , and its phase a n g l e z is uniformly distributed; thus, it cannot be used. Only its a b s z amplitude is useful, where the intensity a b s z 2 follows an exponential distribution, as shown by Equation (2). We assumed that single-polarization images are preprocessed (flat earth fringes are removed, and orbital imperfections are corrected) so that a flat and homogeneous region is approximated by a constant covariance matrix Σ .
C x = 1 L t = 1 L u t u t * ,
where L   represents the number of looks, and the vector u t represents the t -th single-look data sample. Let A = L C ; then, A conforms to the complex wishart distribution. When D = 1 , the distribution of one-dimensional multilook SAR intensity A is as follows [51]:
p A L A = L L A L 1 exp L * A C Γ L C L ,
where Γ represents the gamma function.
(A)
Generic nonlocal NL denoising of SAR imagery
The covariance matrix of each pixel in a given SAR image contains complete scattering and interference information, including intensity information used in this paper for site detection. The covariance matrix further contains considerable speckle noise; thus, a large number of homogeneous samples are needed to estimate the covariance matrix in an unbiased manner. The overall scheme of our method for NL estimation of covariance matrices is described in this section.
The essential steps of the approach are summarized in Figure 3. Beginning with an SLC SAR image or an MLC image, an empirical pre-estimation is obtained, which is then used to identify comparable pixels within the search window. A test is performed to detect identical covariance matrices. Then, a weighted maximum likelihood estimation approach is employed, wherein weights are determined on the basis of similarities and employed for sample balancing. NL estimation is followed by a bias reduction step similar to local linear minimum mean square estimation to obtain a suitable bias/variance trade off.
(B)
Nonlocal NL estimation with a weighted maximum likelihood
The NL means approach can reduce additive white Gaussian noise in images [52]. The NL means approach applies a weighted average after computing weights w x , x on the basis of squared differences across patches and an exponential kernel. Via the introduction of a weighted maximum likelihood, this method has been expanded to more general estimation problems [53,54].
. Σ ^ N L x = arg Σ   max x w x , x p C x | Σ
(C)
In the above equation, the weights can be determined as explained in the previous paragraph. The total weight is calculated from all pixels within the search window. To preserve the original resolution, Equation (5) uses only full-resolution input image covariance matrices C .
(D)
Bias reduction step
Although a patch with a bright target in pixel x and a patch containing only background are extremely different, these two patches remain quite similar. The weighted mean in Equation (6) causes the bright target to become somewhat blurry. Thus, we include a bias reduction phase after NL estimation to decrease the blurring phenomenon of bright structures. According to Lee [55], bias can be mitigated by combining the (potentially over smoothed) NL estimation with the noisy empirical covariance in a convex way.
Σ ^ N L R B x = Σ ^ N L x + α C x Σ ^ N L x
where the NL reduced bias (NLRB) estimate is denoted as Σ ^ N L R B . Highly similar weight values preserve the NL estimate, whereas contrasting weight values replace the NL estimate with the original (noisy) empirical covariances. After several NL estimation steps are conducted, the best estimate is locally chosen to generate a single restored image characterized by a well-preserved radar structure.

3. Results and Discussion

In this experiment, SAR image preprocessing and geocoding occurred in GAMMA software. The georeferencing capability of TSX is highly precise because its orbit is well known, whereas the azimuthal accuracy is determined mostly by the orbit precision and timing error and can reach an absolute precision as low as one decimeter. In contrast, the range accuracy of a signal is determined by the signal air travel delay and a variety of additional error factors [56,57]. In regard to TSX images acquired under a stereo arrangement, an absolute location precision lower than one decimeter in both range and azimuth can be attained after correcting for these defects [40]. With the use of only the path delay information contained in TSX header files as a guide, we used SLC data for georeferencing in the subsequent tests to apply appropriate data corrections. The main purpose of this experiment was to assess the capabilities of X-band TSX and CSK data in the detection of image archeological features and their characteristics. To this end, we obtained unaltered SAR images to thoroughly analyze the detection capability without introducing additional noise upon data resampling. Consequently, rather than resampling the obtained SAR images into a geographic or local coordinate system, we transformed the corresponding survey data into the SAR coordinate system. As previously stated, the ground survey-based coordinates are relatively accurate. Thus, after incorporating height information retrieved from GPS measurements, the coordinates in the radar coordinate system were transformed with the range–Doppler model.

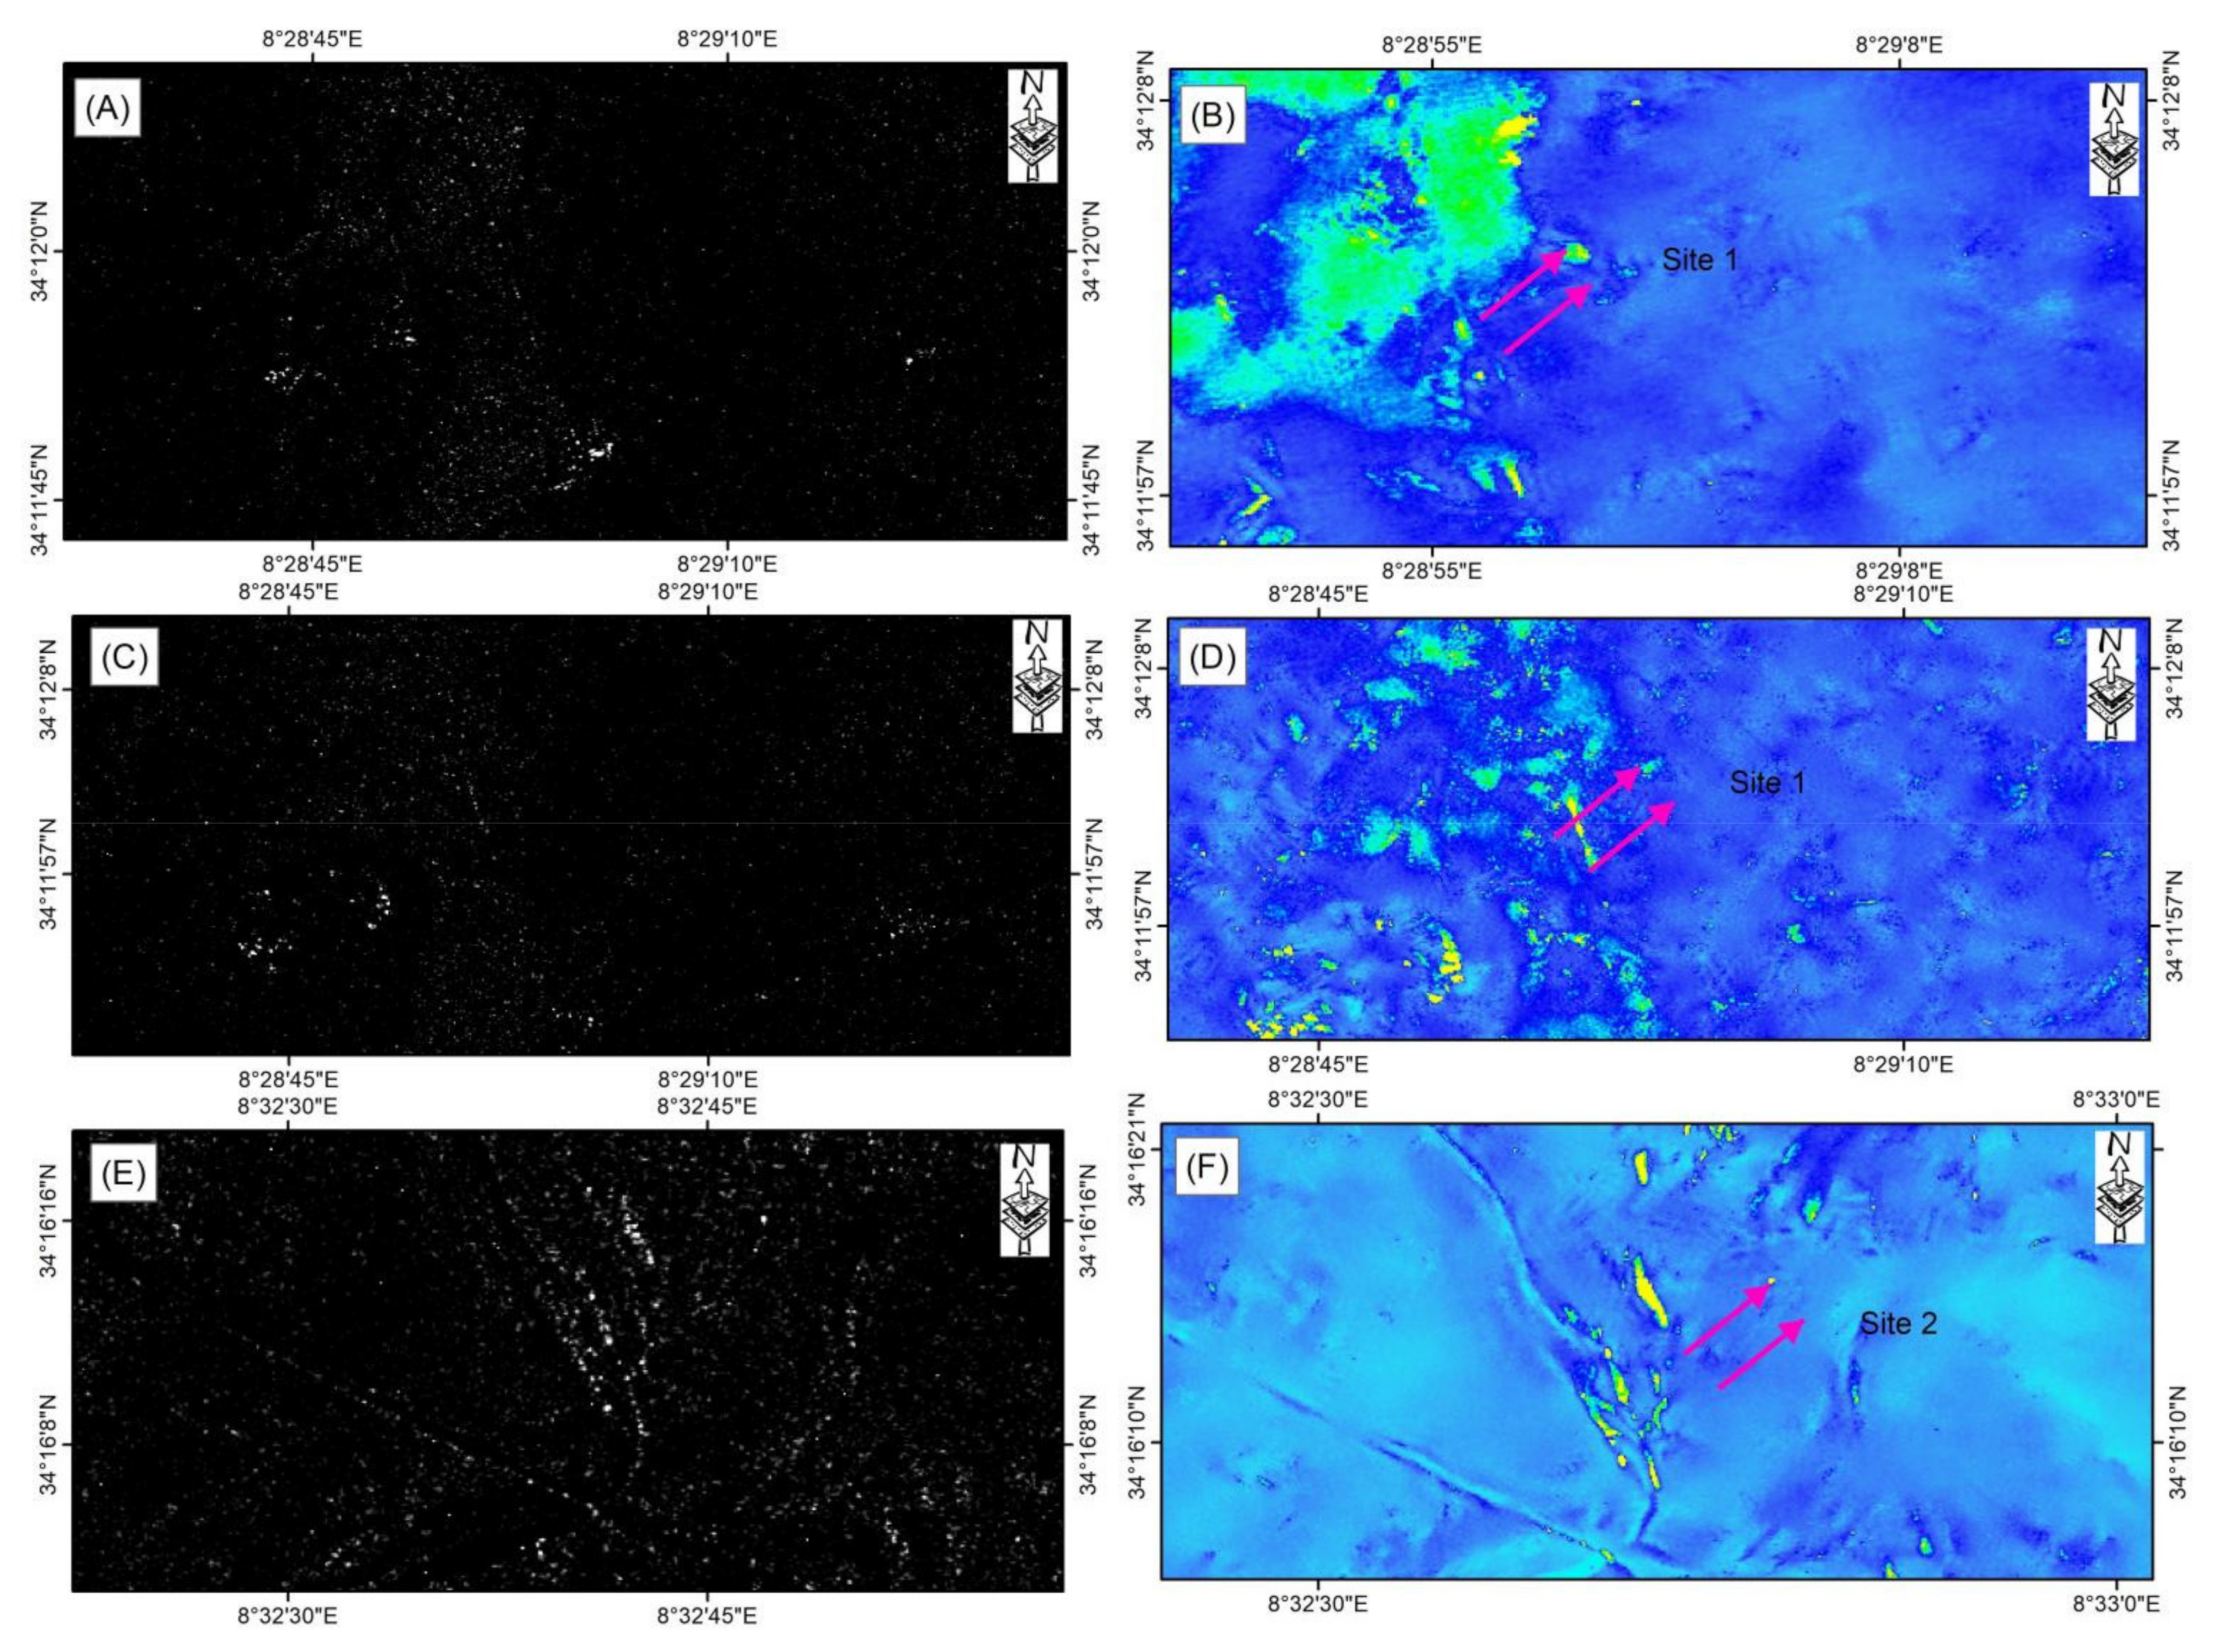
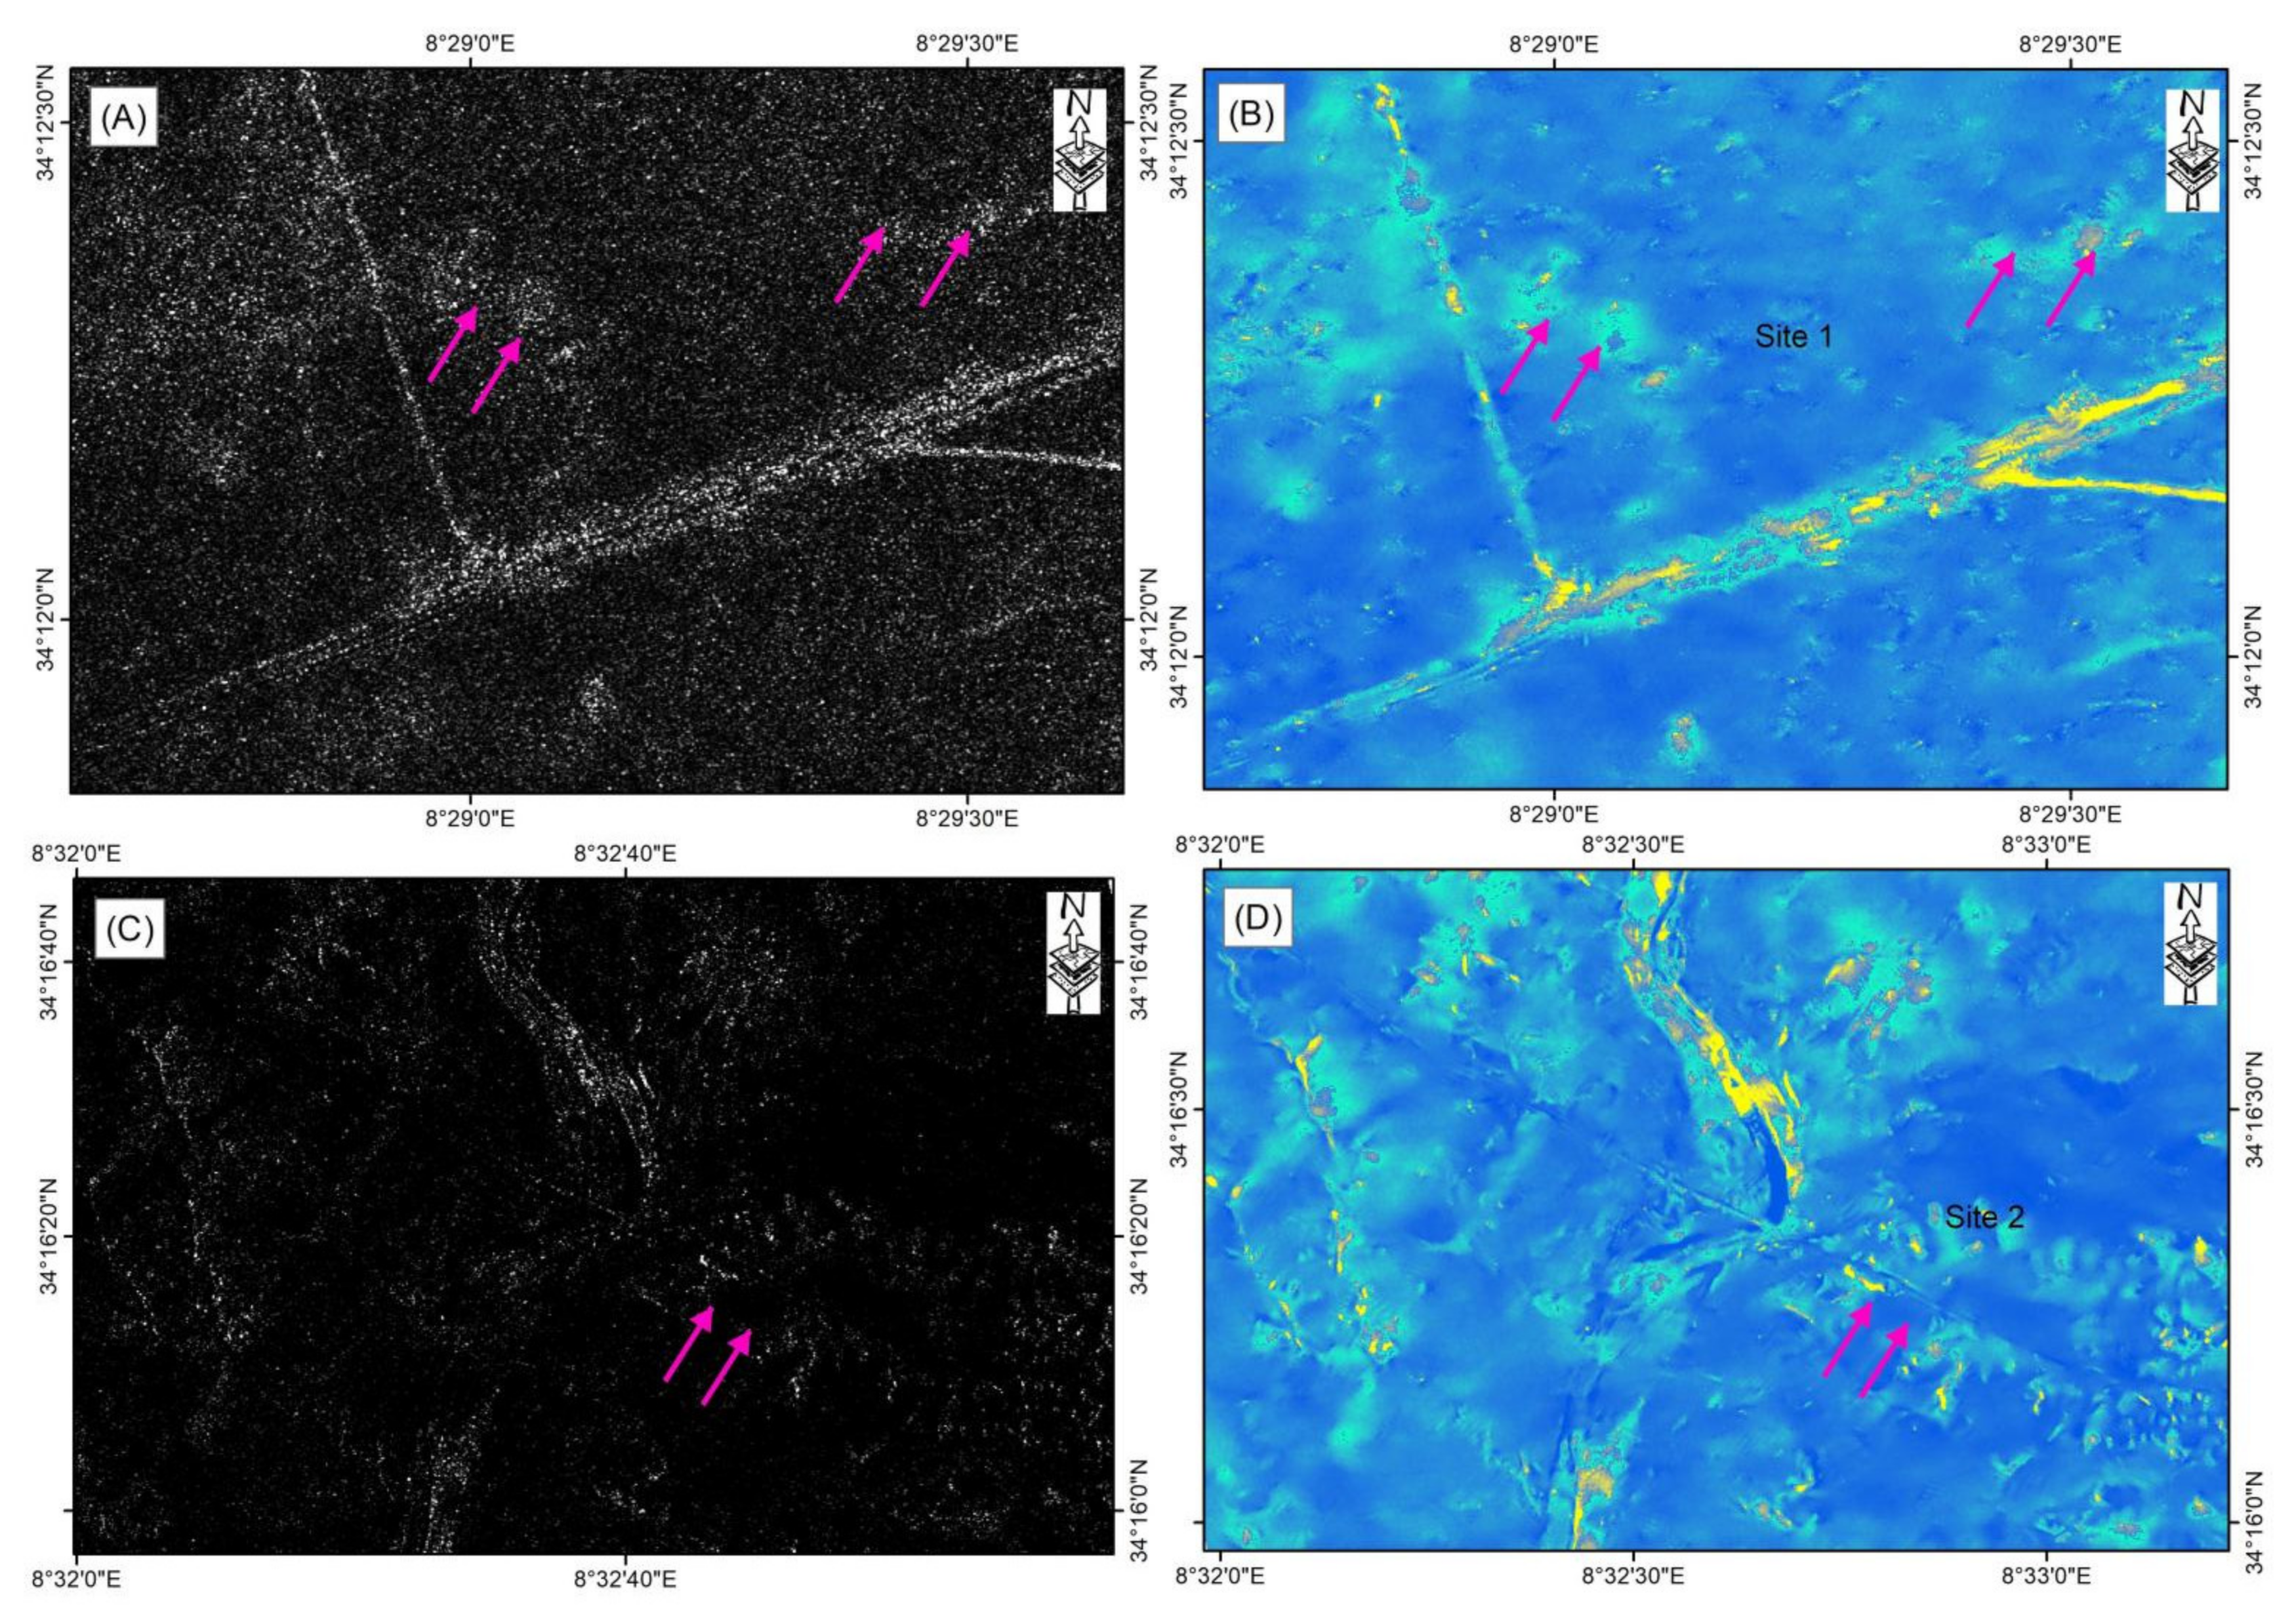
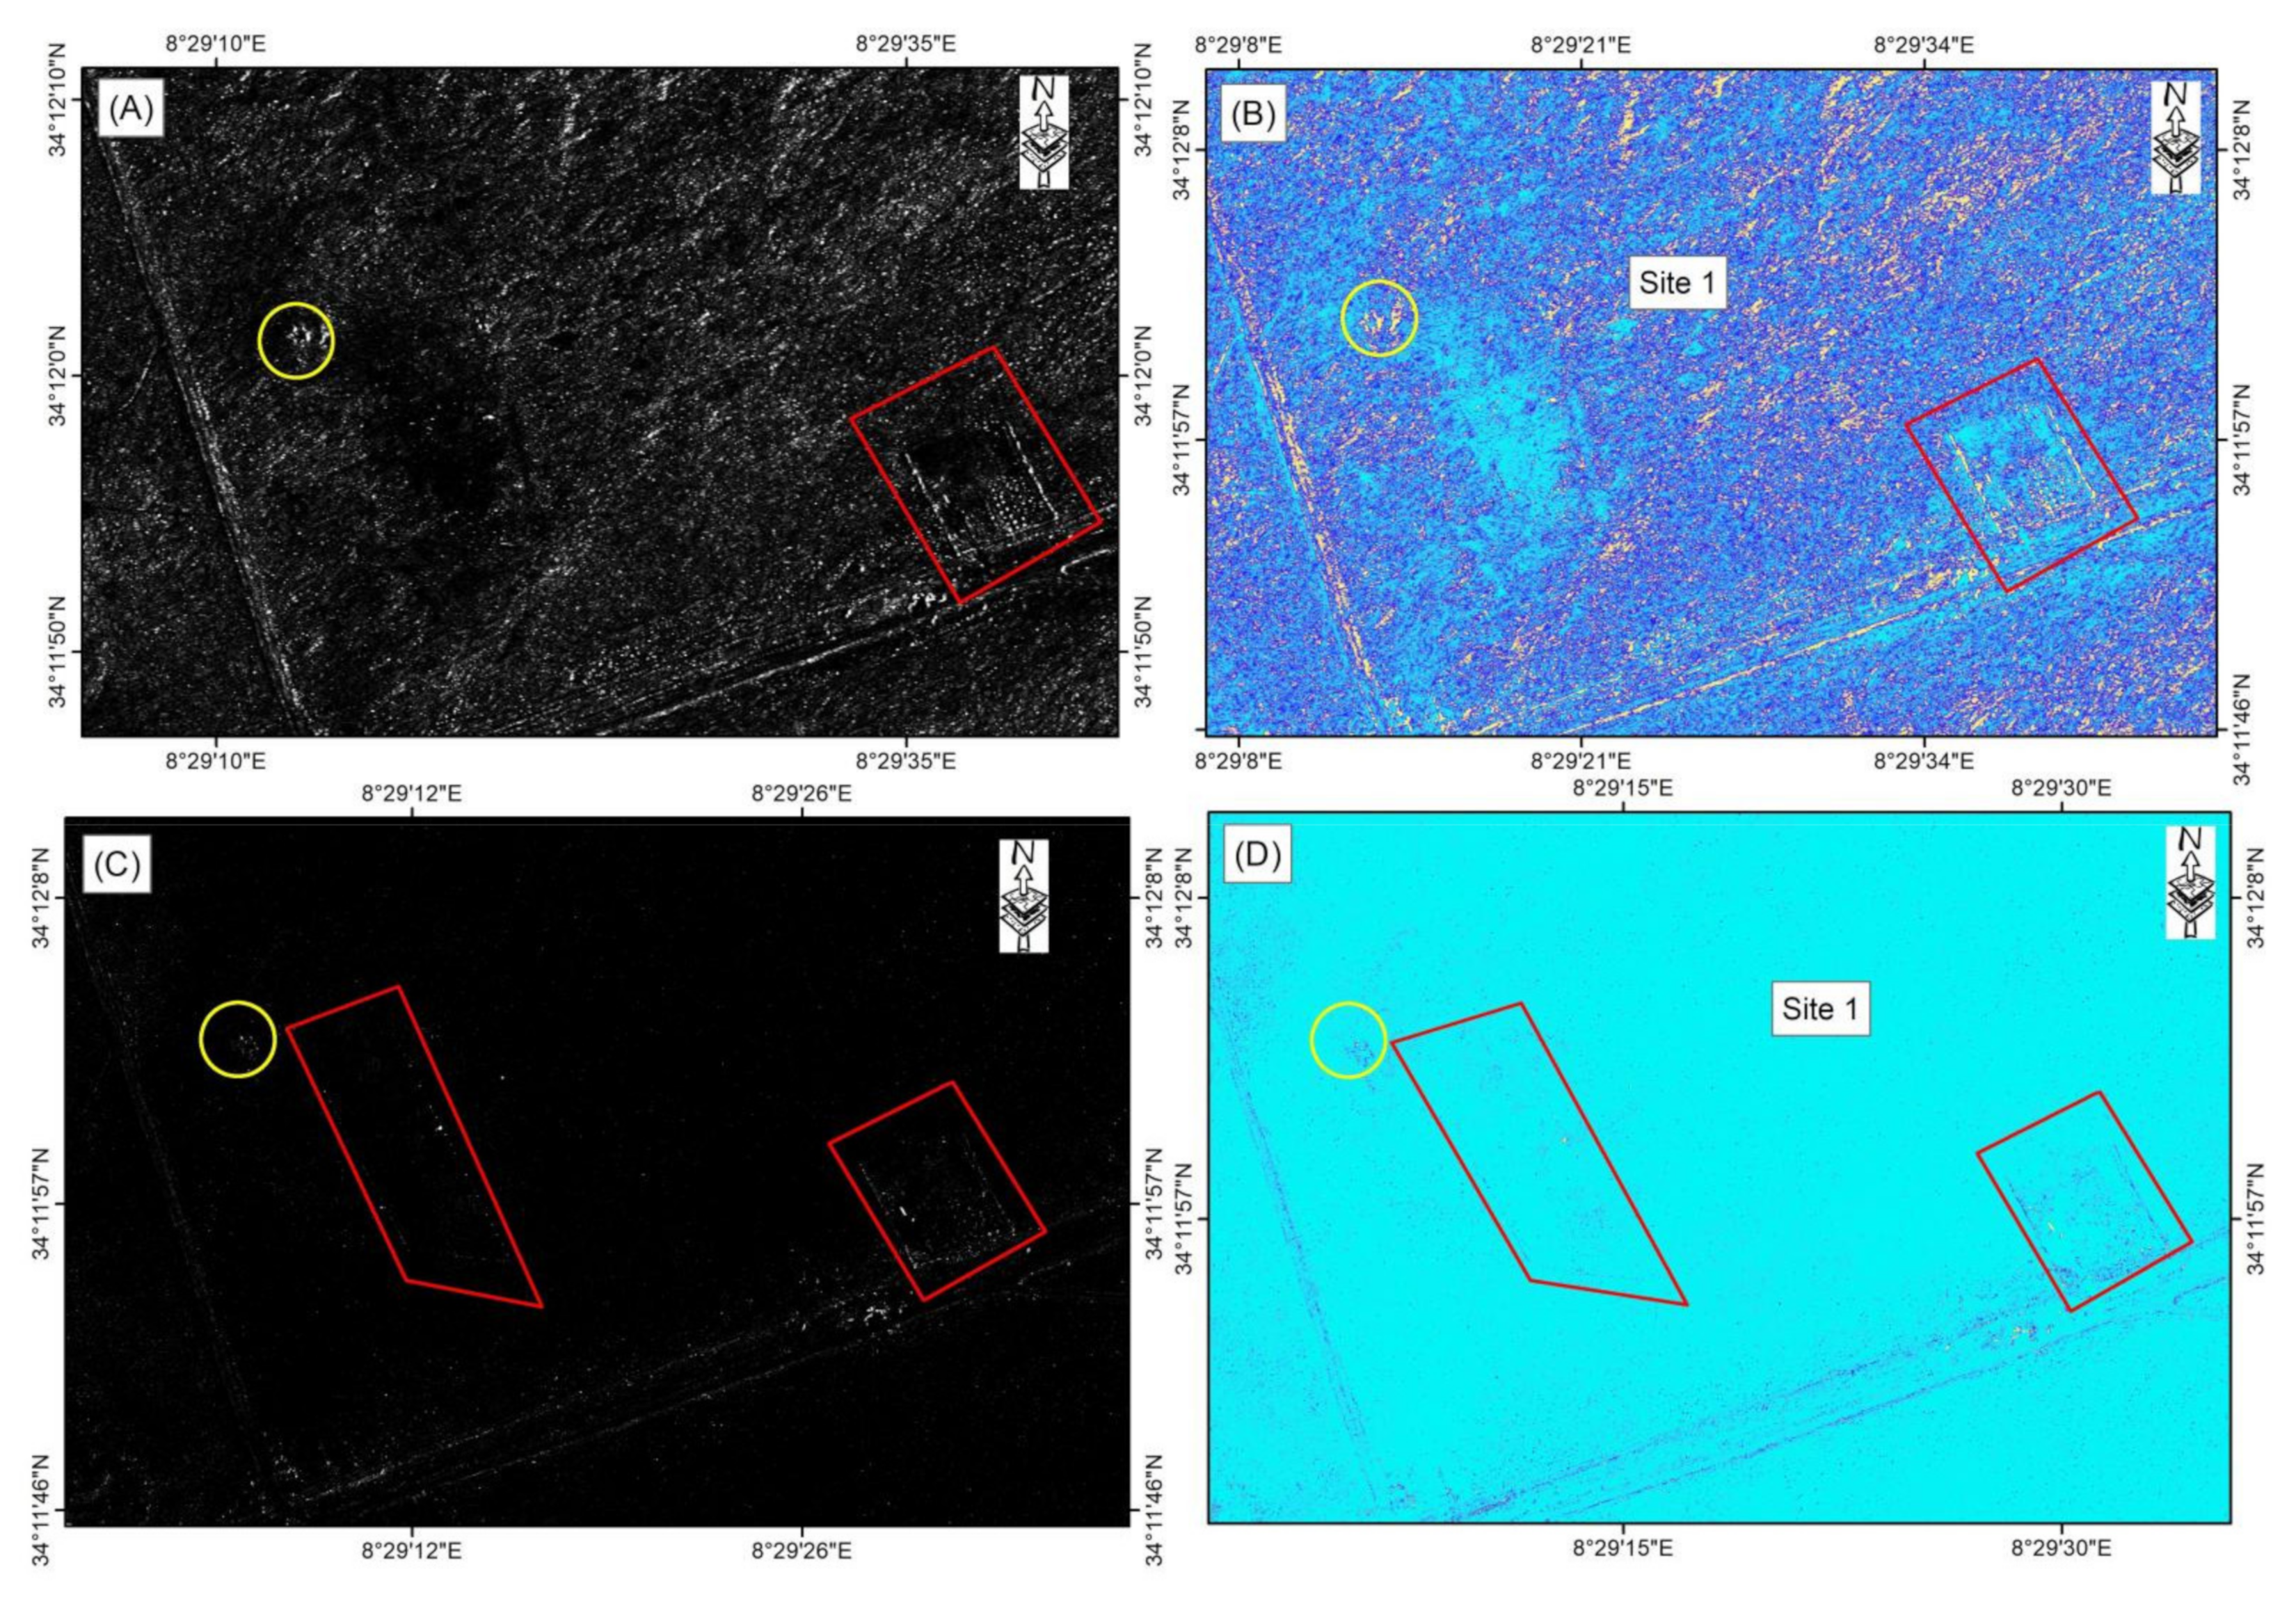
3.1. Assessment of the Detectability of Archeological Structures
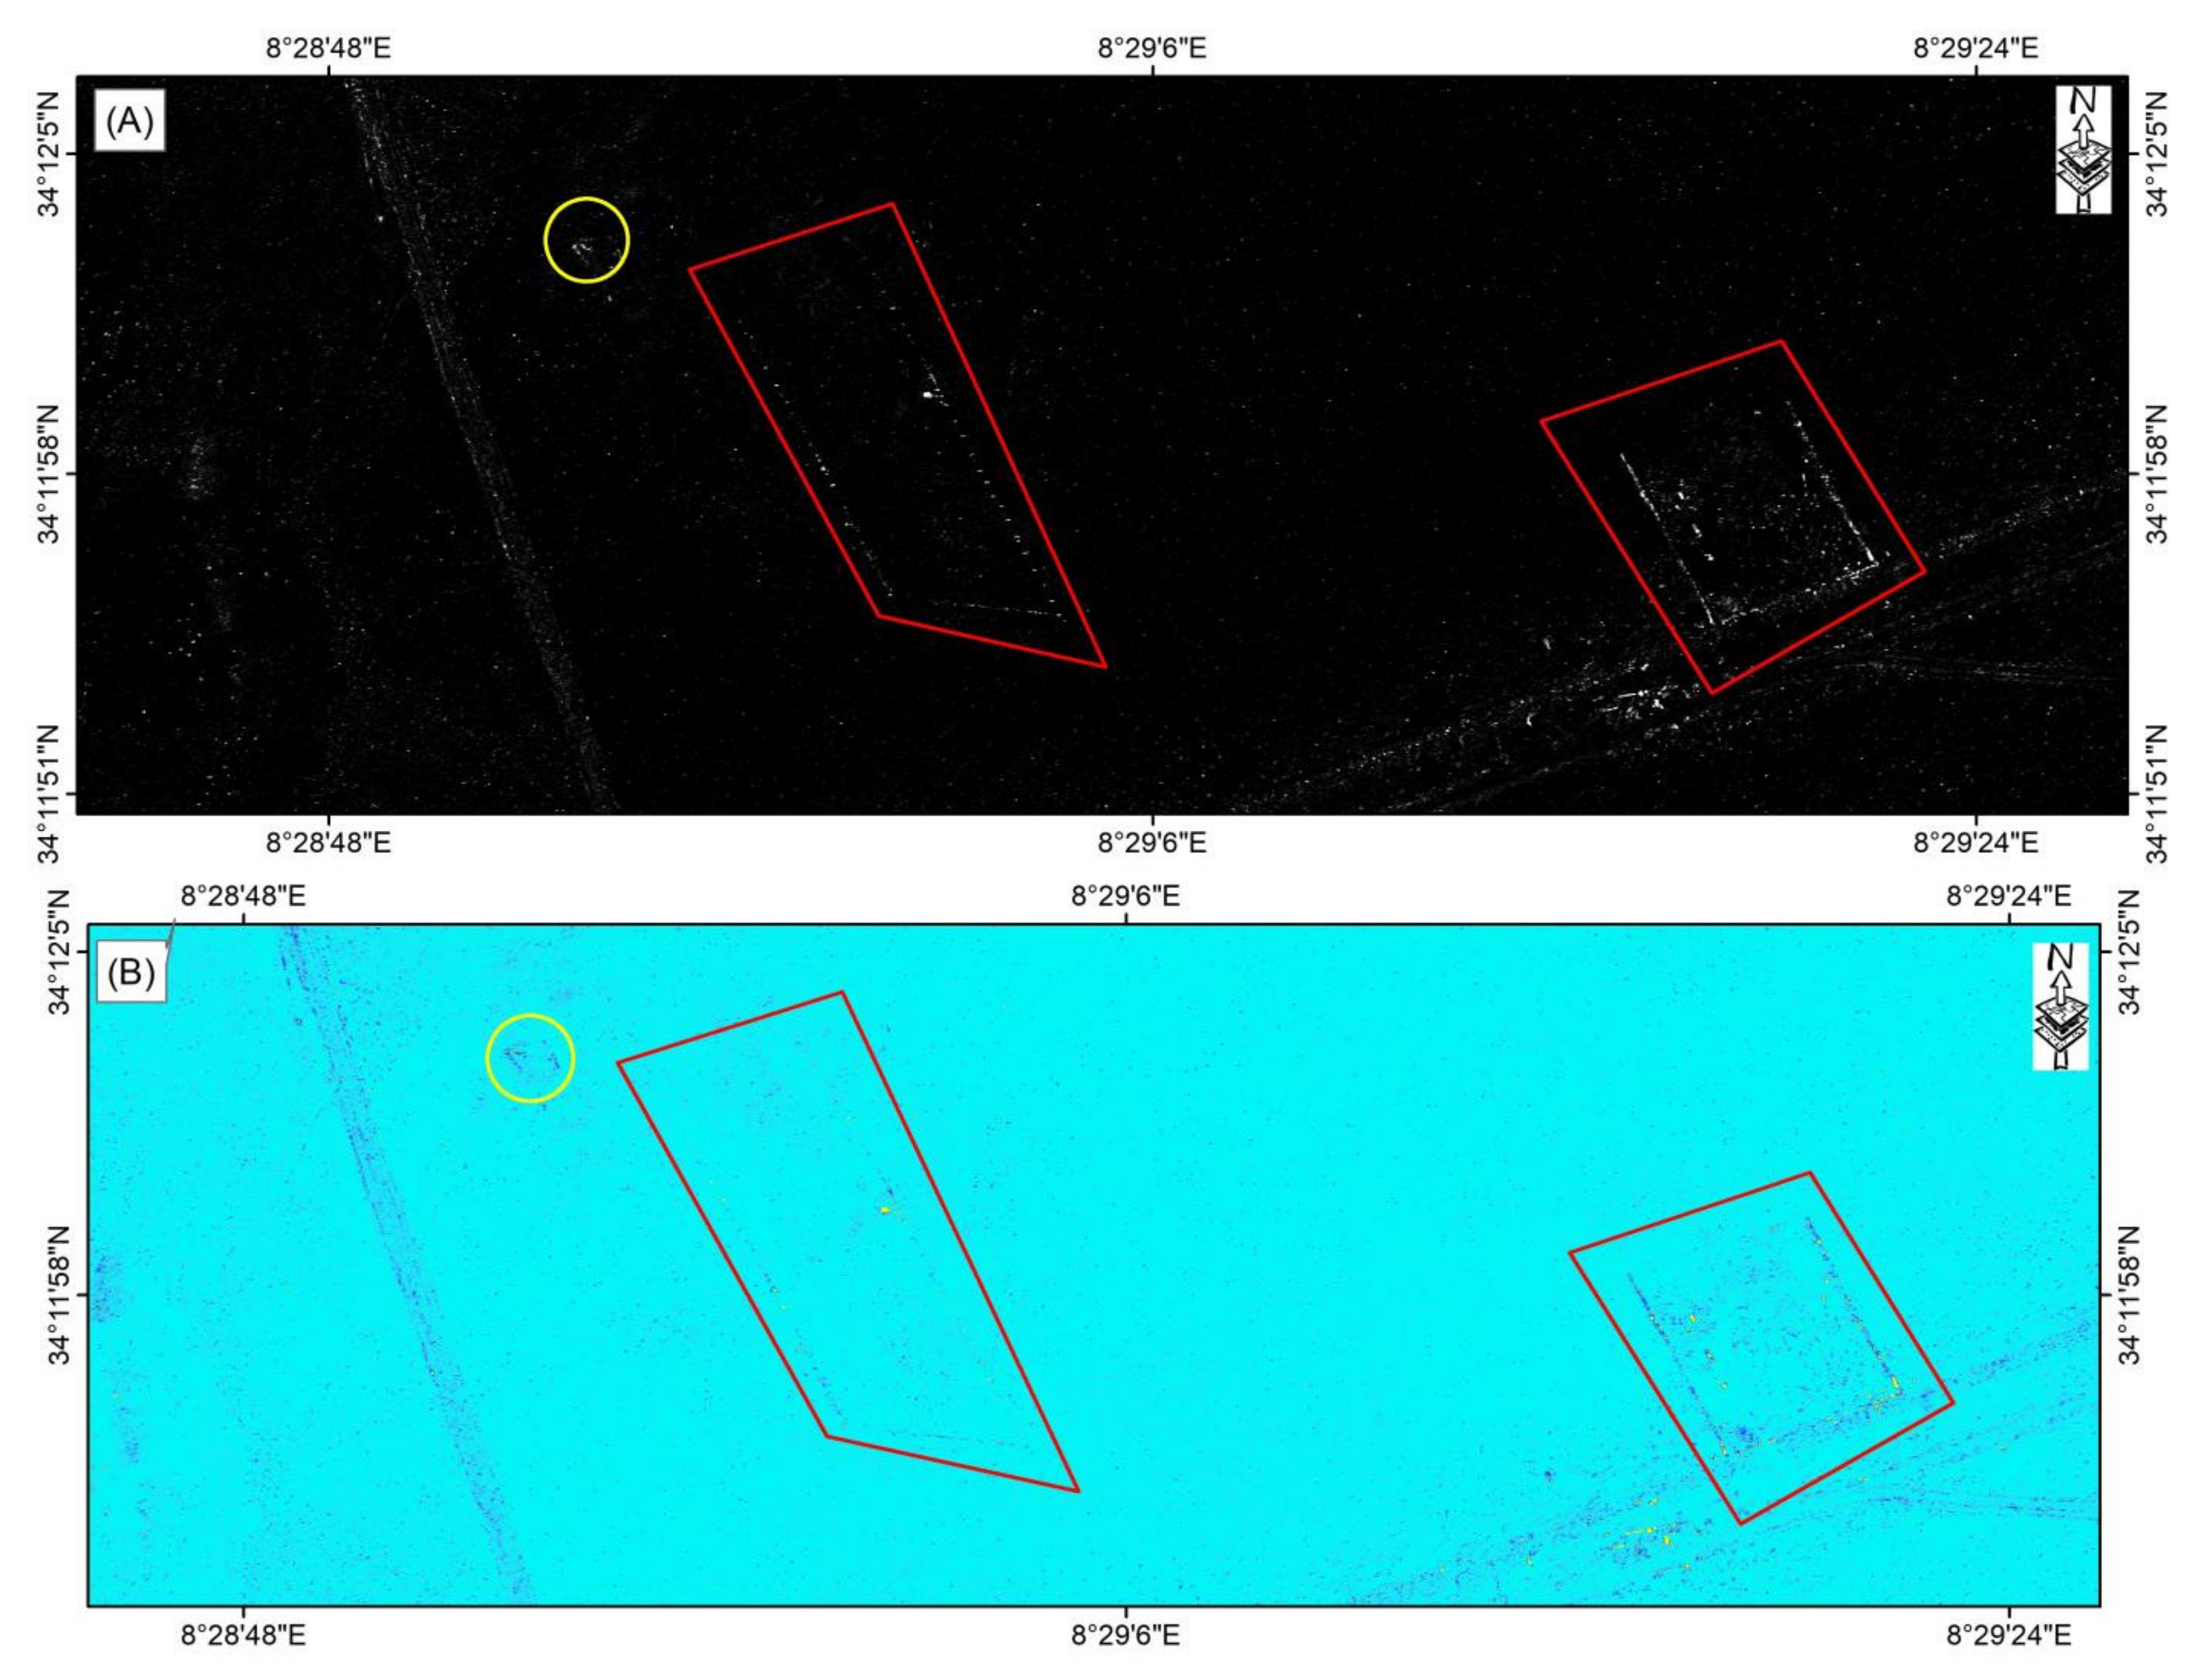
3.1.1. CSK Data

As shown in Figure 4, we could detect some already known fortress structures, but it was generally very difficult (if not impossible) to recognize archeological features without any previous knowledge. This example demonstrates that CSK data are unsuitable for the detection of these types of archeological structures.

3.1.2. TSX SL Images

In the TSX SL mode, images were acquired at an incidence angle of 38° and a ground resolution of 1.3 m. As shown in Figure 5, a fortress could be identified in the TSX SL images. Nevertheless, structures were generally too small to be clearly identifiable. The visibility was much better in Figure 4 (a descending-track CSK SL image acquired on 21 March 2018 at an incidence angle of 24° and a ground resolution of 0.9 m) than that in Figure 5 (a descending-track TSX SL image with an incidence angle of 38° and a ground resolution of 1.3 m). Even in the VHR images shown in Figure 5 and Figure 6, we could detect only some fortress structures. In contrast, it was generally highly difficult to recognize any archeological features in the TSX and CSK SL-mode images. Hence, we considered the fortress to be undetectable in all the SL images.

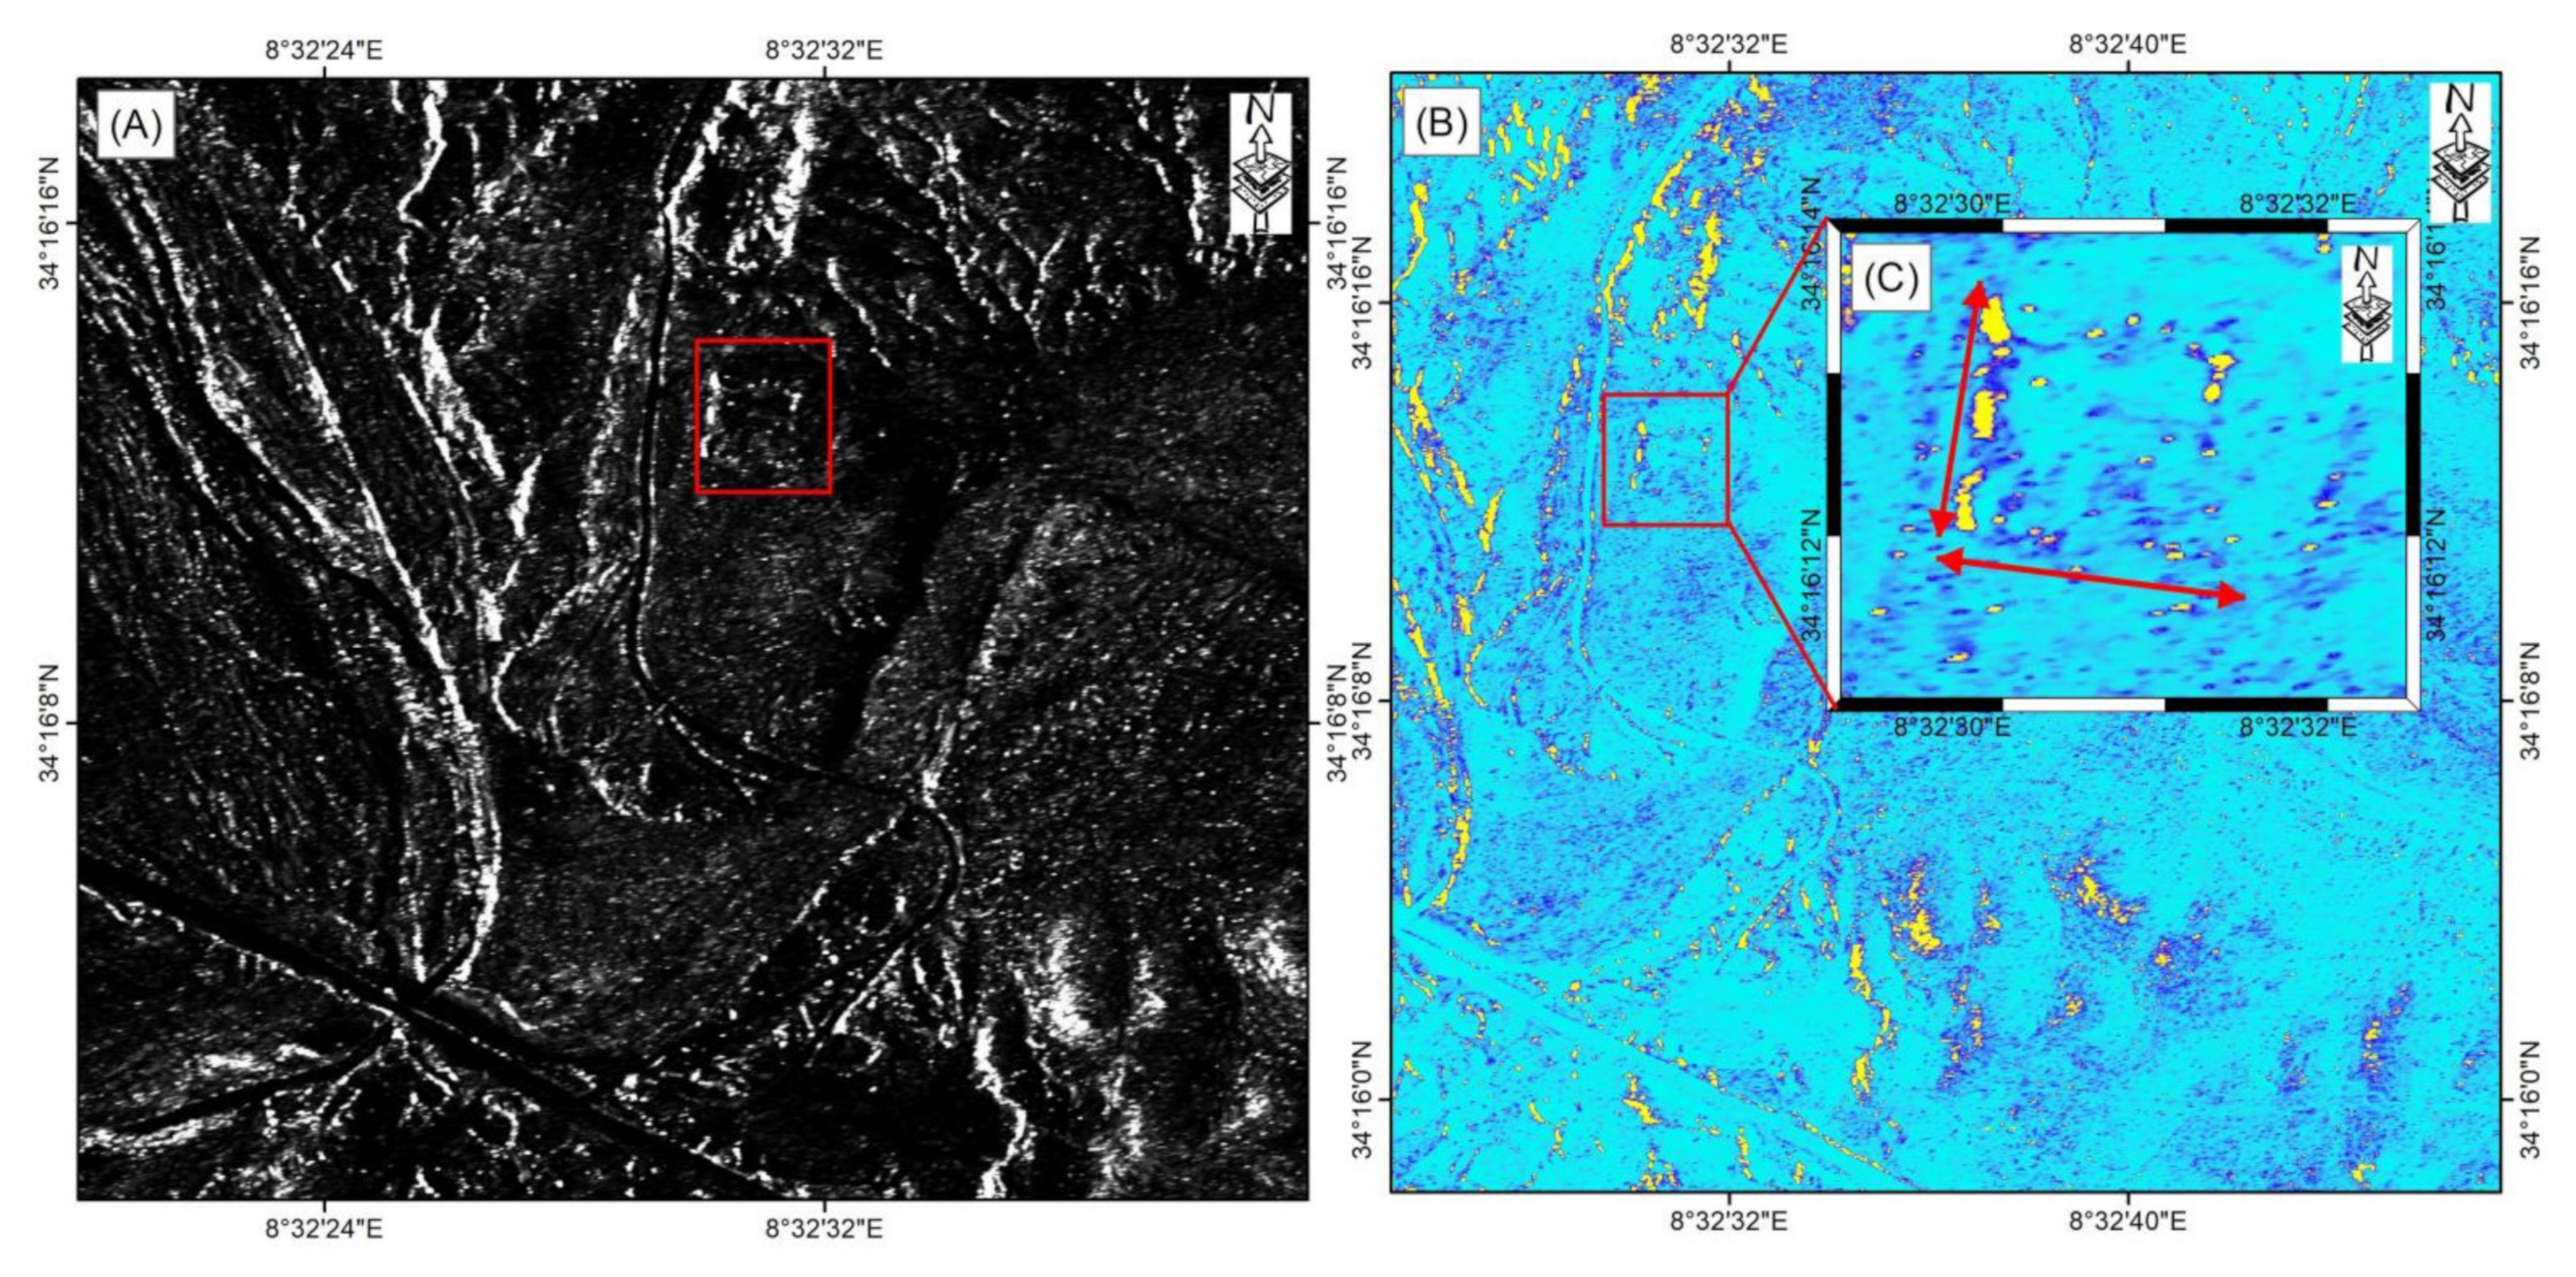
3.1.3. VHR TSX ST Images

With the use of the TSX ST mode, we acquired multilook images along the azimuthal direction four times to reduce the speckle effect before data analysis. As shown in Figure 6, archeological structures could clearly be identified in the obtained TSX ST images. However, because all structures were highly visible, there occurred an increased likelihood of confusing archeological structures, as shown in Figure 6. Likewise, the above fortress structures could be identified exceptionally well in the TSX ST images, as shown in Figure 7. These results demonstrate that large buried structures could be identified in the TSX ST-mode images. Nevertheless, the detectability of buried structures strongly depended on the image spatial resolution. The TSX ST images acquired under HH polarization (Figure 8) clearly showed the notable discoveries at sites 1 and 2. These archeological sites could be clarified at high spatial resolution. In other words, TSX ST data helped in the detection of buried features.

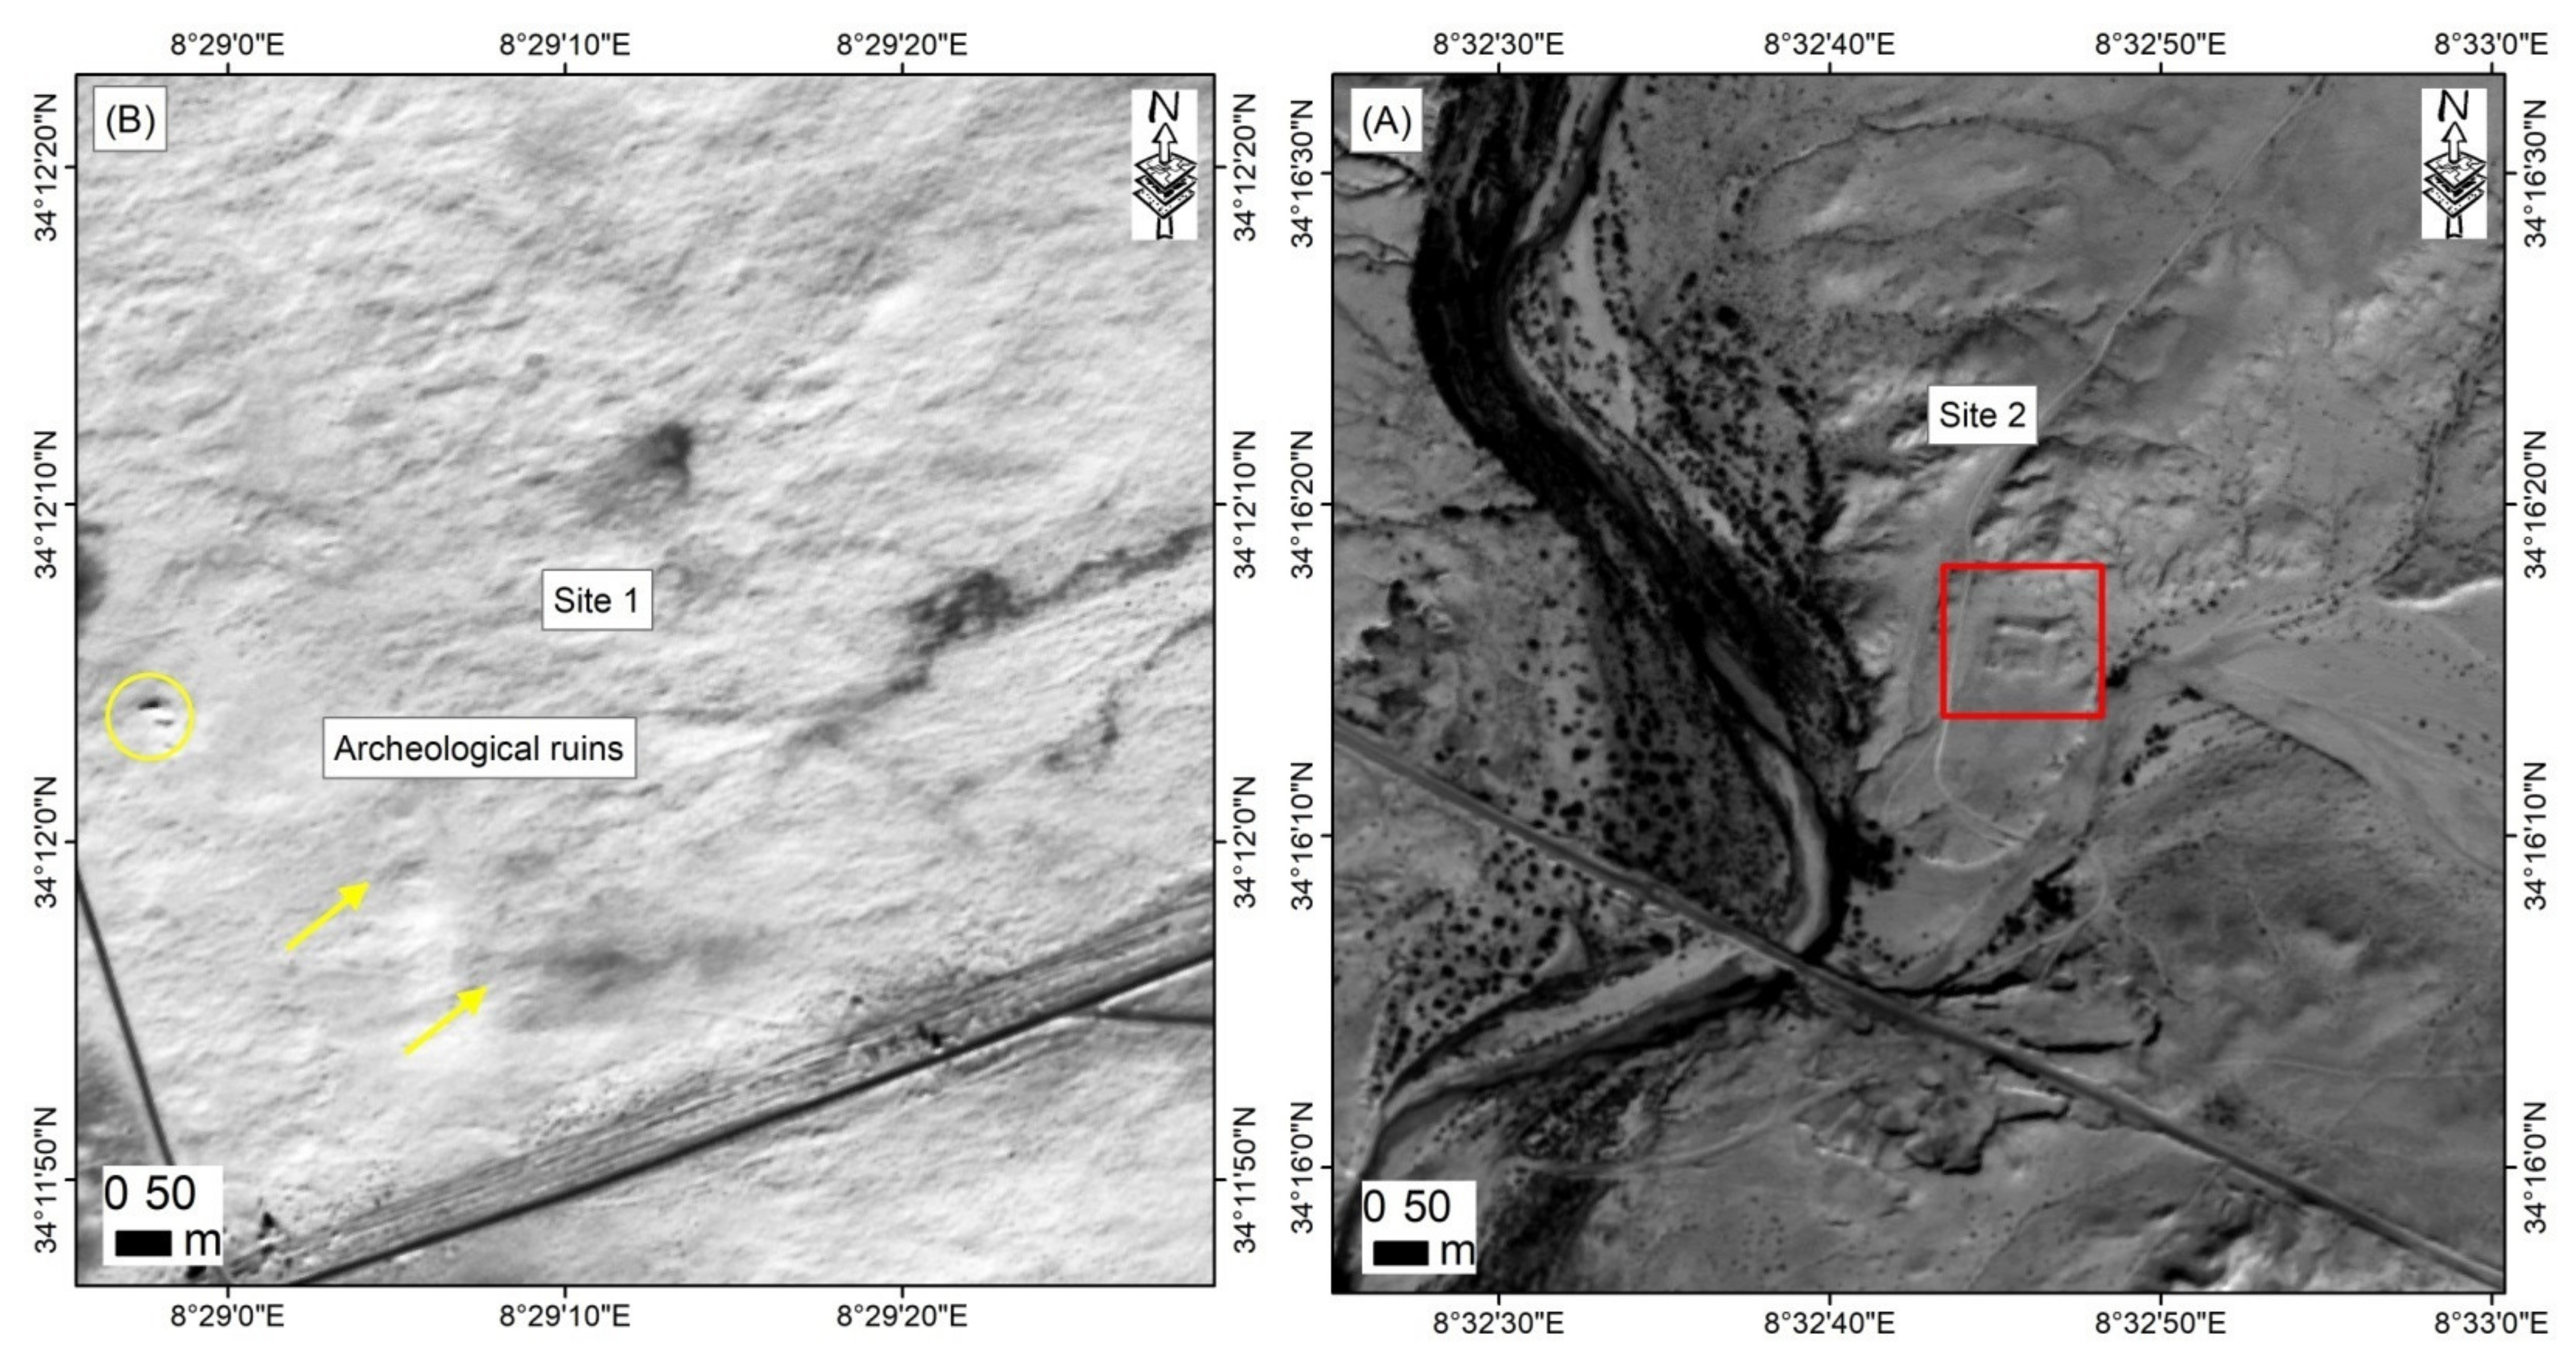
3.2. Optical Image Interpretation Results

Figure 9 shows the VHR panchromatic (PAN) images based on Ziyuan-3 (see Table 2) images of sites 1 and 2. Images in this band could reveal the highest contrast. On the right side of the image (site 1), archeological ruins are highlighted with a yellow circle. Below these ruins, in sand-covered areas, the same anomaly features revealed in the TSX data were also observed. Some of the features marked with yellow arrows closely correspond with unearthed structures (Figure 8). Only a few of the surveyed structures could be partially identified in the Ziyuan-3 images, although other structures could not be identified at all, as a result of subsequent burial by shifting sand, or the structures were too small to be distinguished in the optical images. There also occurred various archeological features in the TSX data that did not correspond with structures identified in the Ziyuan-3 images (highlighted in red polygons in Figure 7). In the left part (site 2), the red square is related to anomaly 2, which is highlighted in Figure 8C depicting the results obtained based on the TSX imagery.
Figure 9A,B verify how backscattering anomalies can be easily distinguished on ground surfaces with limited vegetation coverage. A backscattering anomaly was captured at the archeological site on 22 February 2021 in the TSK image acquired in the enhanced spotlight mode at an incidence angle of 38.5°. A polygonal pattern comprising pixels brighter than the surrounding soil pixels was observed, matching archeological sites 1 and 2 identified in the VHR Ziyuan-3 images, possibly indicating the presence of a buried structure at shallow depths.

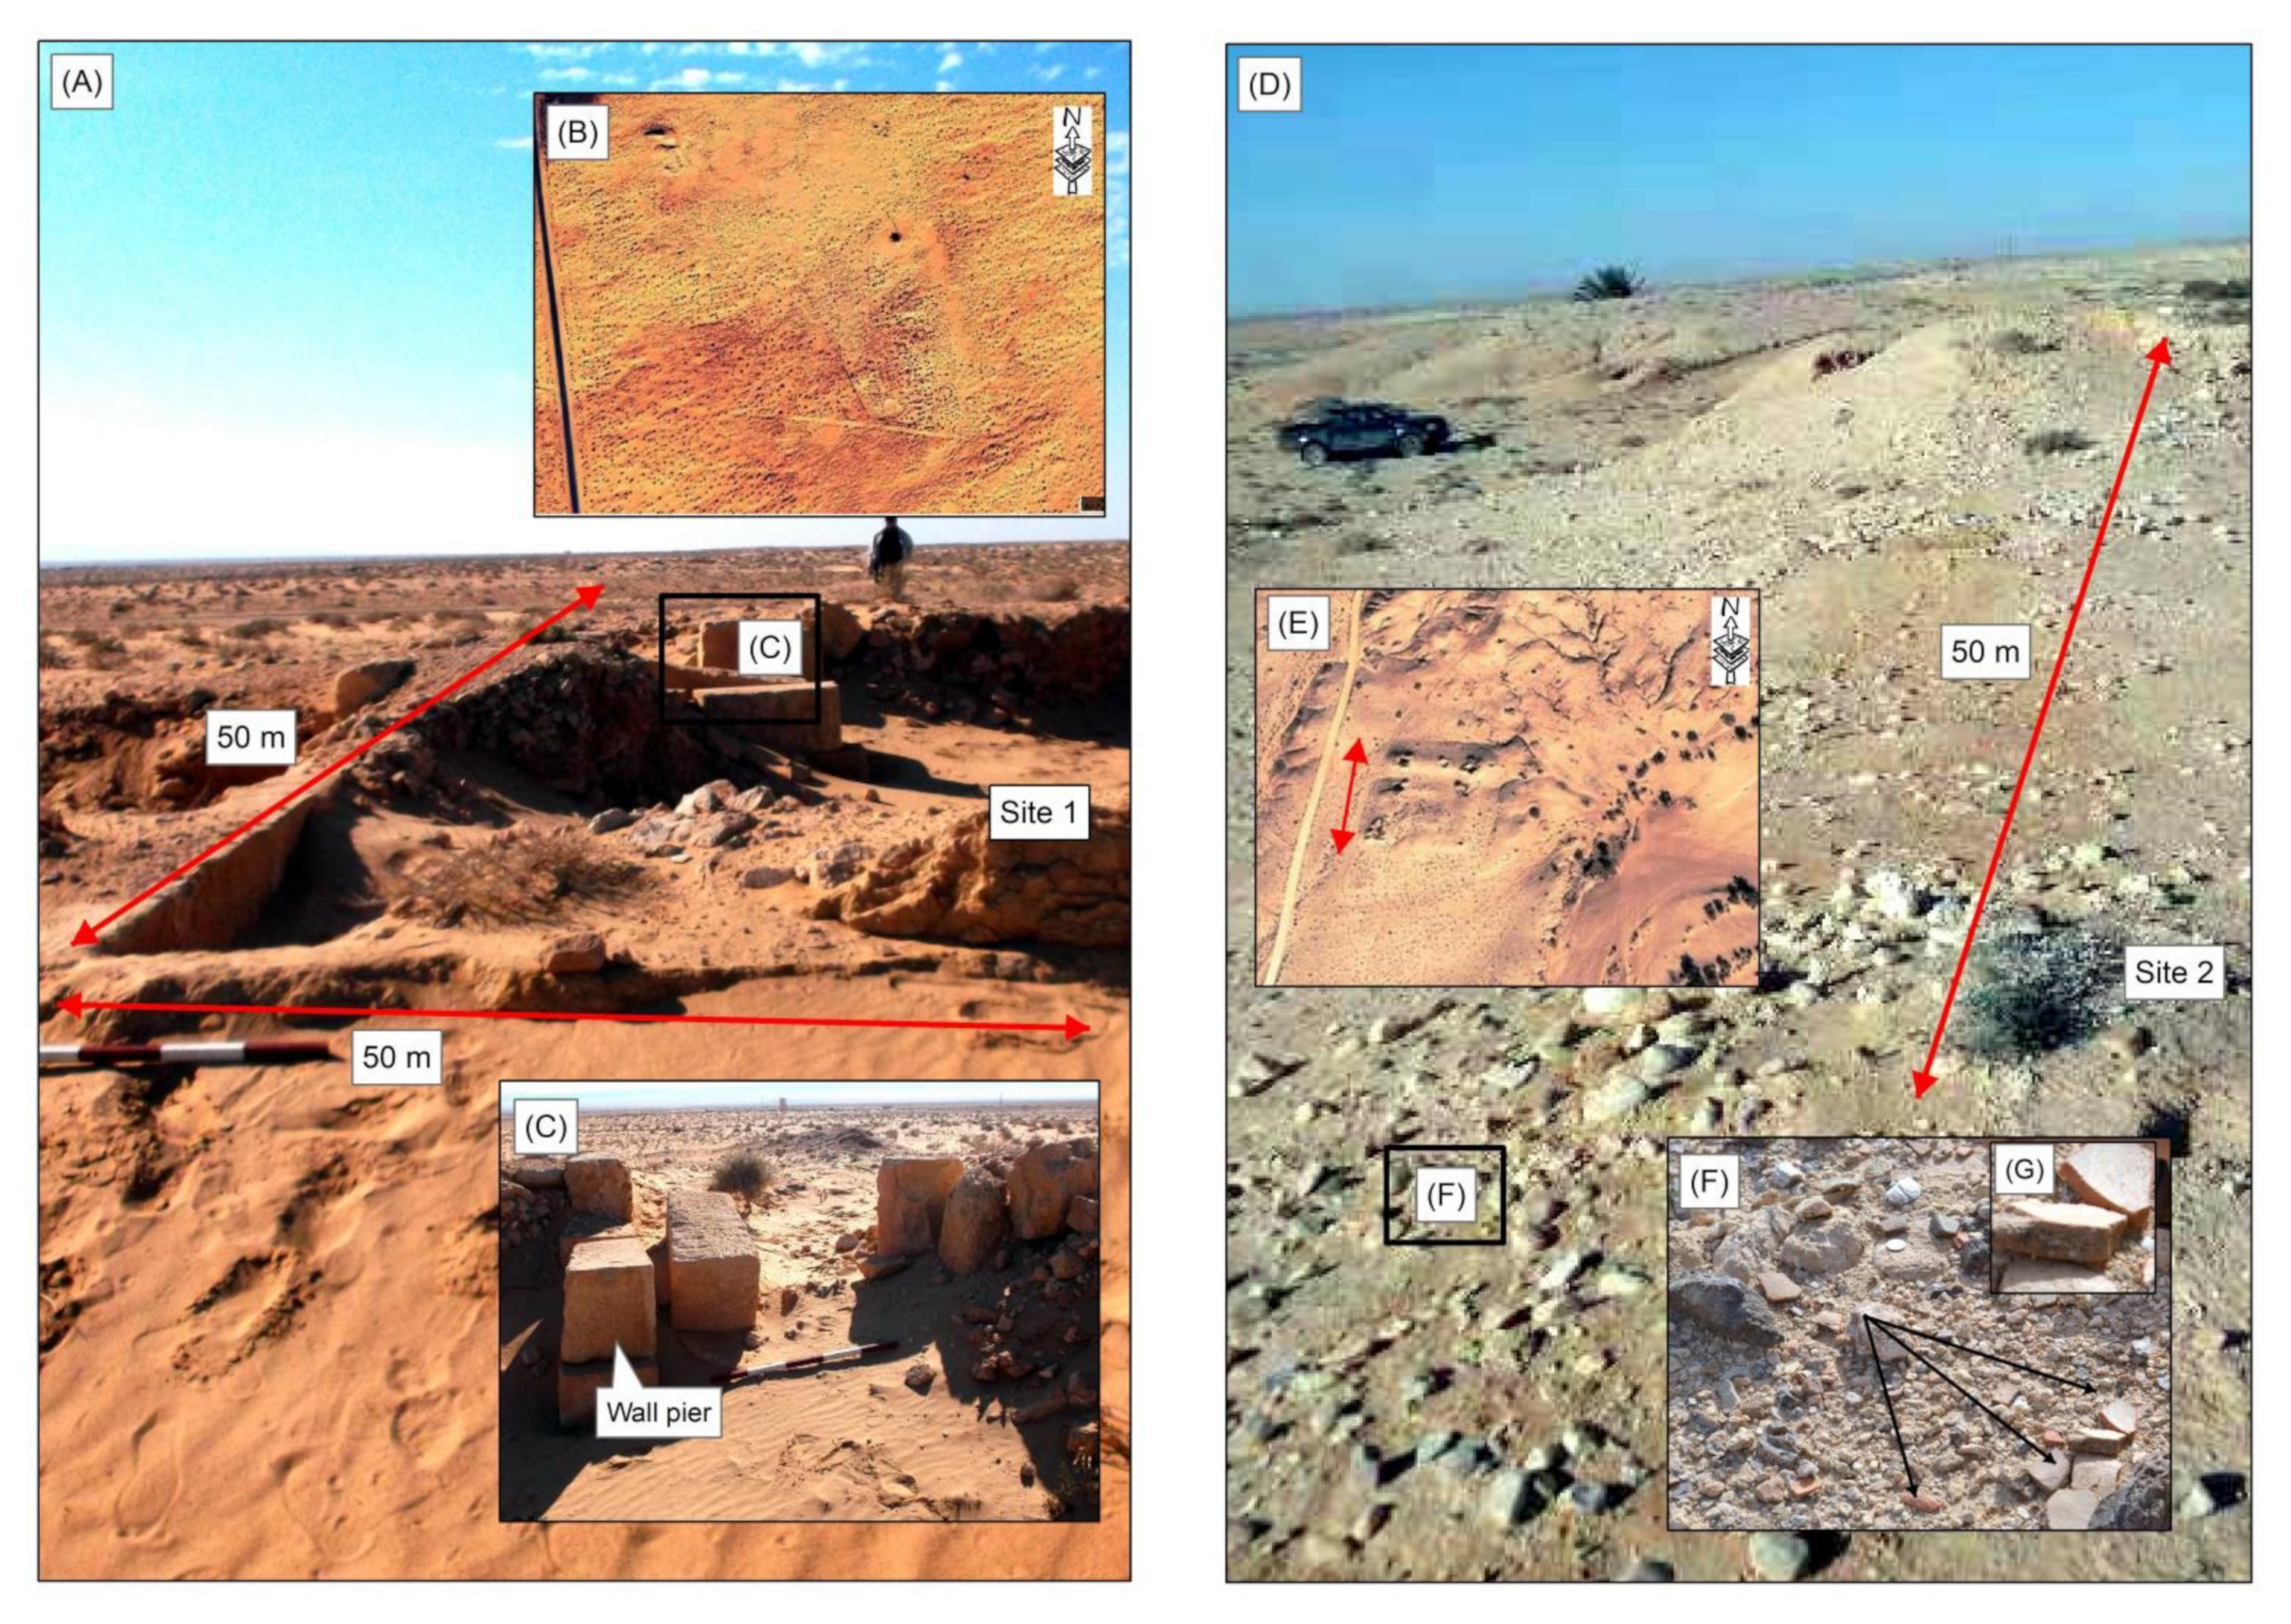
3.3. Ground Verification and Discussion

The above-discovered anomalies were verified in the field of Gafsa, southern Tunisia at Ziyuan-3 data. Apart from the enclosure wall and remains of the western part of the fortification system (Figure 10), no further archeological remains were observed on the surface. Instead, nearly all visible features in the analyzed TSX data were attributed to microtopographical marks of archeological interest. Moreover, a large number of other linear features could be distinguished in the TSX imagery. As a result of the limited resolution, however, not all detected walls and buildings could be identified. Nevertheless, the proposed NL-SAR method revealed a distinct layout of Roman archeological remains, and the results corresponded very well to structures observed in the field. In addition to these known Roman features, several structures corresponding to other buildings were found, and fortification walls in the south were observed to continue [13,14]. Wall extension was determined in the TSK ST images, as the grid enveloped the interior of the fortress and a small proportion of the surrounding area. Detailed SAR image analysis demonstrated that the reflections from walls could not be distinguished from those from mud bricks in the obtained TSK ST images and were mainly manifested as dark anomalies. The field survey performed in this area (Figure 10) revealed the presence of a farm dated between the early Roman Empire and early Byzantine periods on the basis of the discovery of tiles and pottery fragments originating from these eras. Buried walls and microrelief anomalies, indicating the occurrence of hidden sites, were also unearthed. From the VHR SAR data of the prospective subarea, circles and red polygons can be seen northwest of site 1 (Figure 7) and a square can be seen northwest of site 2. Each side of site 2 (Figure 8) was measured as being~50 m long. The anomalies 1 and 2 had no complete walls; however, the remains of four wall piers were investigated.
With the use of SAR data surveying, this study detailed the discovery of a buried Roman fortification in Gafsa strategically located along the southern boundary of the Roman or Byzantine Empire in southern Tunisia. The results of this study indicated that high-resolution SAR data comprise a crucial tool for the imaging of microtopographical features of archeological interest. SAR images have important potential for identifying the structure of sites, but high-resolution SAR images are also more severely affected by noise. The NL-SAR method is often used for denoising of low- and medium-resolution SAR images, and this paper introduces it into denoising for ultrahigh-resolution SAR images. The results indicate that NL-SAR can make the intensity signal of the site clearer. However, since the noise statistical characteristics of ultrahigh-resolution SAR images are different from those of low- and medium-resolution SAR images, the denoising performance is limited. The findings are highly fascinating from an archeological standpoint. Obviously, through the NL-SAR method, CSK SL and TSX SL data have a denoising effect, whereas these two data are not very convenient to identify sites; TSX St data are able to identify sites, but their denoising effect is not so accurate.
Our findings revealed that very high-frequency TSX X-band signals, which can penetrate the uppermost ground surface layer, could be used to support archeological studies. Moreover, the new high-resolution TSX ST acquisition mode facilitated the detection of various types of archeological structural remains. Correspondingly, we verified the discovery of a Roman fortress in the obtained TSX images under different acquisition modes. As such, the ST mode might pave the way toward the increased use of SAR data in archeological research.
The proposed NL-SAR method is ideally suited for ancient site surveying in arid southern Tunisia, where the political environment in similar regions frequently prevents ground-based research (e.g., via geophysical methods or excavation). Furthermore, our findings fundamentally highlighted the vast possibilities of satellite radar data in the field of archeological prospecting. With this tool, we could achieve tremendous progress, both technologically and archeologically. Despite challenging working conditions, the performed GPS-based field survey in southern Tunisia confirmed the sites identified in the VHR TSX images. Furthermore, ground-truth data pertaining to the research area were used to verify and complete the information suggested by the NL-SAR algorithm.
The findings are highly fascinating from an archeological standpoint. Overall, the proposed SAR-based archeological prospecting approach allowed us to (i) discover a previously unknown fortification, of which historical sources provide very little information, and to (ii) shed light on a fortress from the age of the Roman Empire, thereby providing fresh insights for future archeological research in Tunisia. In situ investigations confirmed our findings, demonstrating that key distinguishing features such as fortress walls could be detected and extracted with the proposed NL-SAR approach. Small characteristics attributed to subterranean structures could be identified in the area via visual evaluation of SAR data. This work is intriguing for a number of reasons, including the opportunity to investigate (i) the influences of climatic and environmental changes (and natural disasters) and (ii) the notable scientific and archeological challenge of imposing ad hoc procedures employing remote sensing technology on the basis of SAR data obtained at archeological sites.

Author Contributions

N.B., W.X., X.L., R.L., N.M., X.W., F.S. and M.B. conceptualized and designed the study, collected the data, finalized the analysis, interpreted the findings, and wrote the manuscript. N.B., W.X. and M.B. collected the data. N.B., W.X., R.L., N.M., F.S. and X.L. interpreted the findings and revised manuscript drafts. N.B., W.X., X.L., R.L. and N.M. interpreted the findings and commented on and revised the manuscript drafts. All authors have read and agreed to the published version of the manuscript.

Funding

We greatly appreciate the generous support of the German Aerospace Center (DLR) in providing the TSX data (TSX proposal MTH3742) supporting this work without which this research would not have been possible. This work was supported by the National Natural Science Foundation of China (No. 42174023).

Data Availability Statement

Not applicable.

Conflicts of Interest

The authors declare no conflict of interest.

References

  1. Agapiou, A.; Alexakis, D.D.; Hadjimitsis, D.G. Spectral sensitivity of ALOS, ASTER, IKONOS, LANDSAT and SPOT satellite imagery intended for the detection of archaeological crop marks. Int. J. Digit. Earth 2014, 7, 351–372. [Google Scholar] [CrossRef]
  2. Altaweel, M. The use of ASTER satellite imagery in archaeological contexts. Archaeol. Prospect. 2005, 12, 151–166. [Google Scholar] [CrossRef]
  3. Clark, C.; Garrod, S.; Pearson, M.P. Landscape archaeology and remote sensing in southern Madagascar. Int. J. Remote Sens. 1998, 19, 1461–1477. [Google Scholar] [CrossRef]
  4. Comer, D.C.; Harrower, M.J. Mapping Archaeological Landscapes from Space; Springer: Berlin/Heidelberg, Germany, 2013; Volume 5, pp. 159–171. [Google Scholar]
  5. Lasaponara, R.; Masini, N. Satellite remote sensing in archaeology: Past, present and future perspectives. J. Archaeol. Sci. 2011, 9, 1995–2002. [Google Scholar] [CrossRef]
  6. Masini, N.; Lasaponara, R. Sensing the past from space: Approaches to site detection. In Sensing the Past; Springer: Berlin/Heidelberg, Germany, 2017; pp. 23–60. [Google Scholar]
  7. Parcak, S.H. Satellite Remote Sensing for Archaeology; Routledge: New Delhi, India, 2009. [Google Scholar]
  8. Beck, A.R. Archaeological site detection: The importance of contrast. In Proceedings of the 2007 Annual Conference of the Remote Sensing and Photogrammetry Society, Newcastle, UK, 11–14 September 2007; Newcastle University: Newcastle, UK, 2007. [Google Scholar]
  9. Cavalli, R.M.; Pascucci, S.; Pignatti, S. Optimal spectral domain selection for maximizing archaeological signatures: Italy case studies. Sensors 2009, 9, 1754–1767. [Google Scholar] [CrossRef] [Green Version]
  10. Kalayci, T.; Lasaponara, R.; Wainwright, J.; Masini, N. Multispectral contrast of archaeological features: A quantitative evaluation. Remote Sens. 2019, 11, 913. [Google Scholar] [CrossRef] [Green Version]
  11. Lasaponara, R.; Masini, N. Detection of archaeological crop marks by using satellite QuickBird multispectral imagery. J. Archaeol. Sci. 2007, 34, 214–221. [Google Scholar] [CrossRef]
  12. Wilson, D.R. Air Photo Interpretation for Archaeologists; Batsford: Gloucestershire, UK, 1982. [Google Scholar]
  13. Bachagha, N.; Luo, L.; Wang, X.; Masini, N.; Moussa, T.; Khatteli, H.; Lasaponara, R. Mapping the Roman Water Supply System of the Wadi el Melah Valley in Gafsa, Tunisia, Using Remote Sensing. Sustainability 2020, 12, 567. [Google Scholar] [CrossRef] [Green Version]
  14. Bachagha, N.; Wang, X.; Luo, L.; Li, L.; Khatteli, H.; Lasaponara, R. Remote sensing and GIS techniques for reconstructing the military fort system on the Roman boundary (Tunisian section) and identifying archaeological sites. Remote Sens. Environ. 2020, 236, 111418. [Google Scholar] [CrossRef]
  15. De Laet, V.; Paulissen, E.; Waelkens, M. Methods for the extraction of archaeological features from very high-resolution Ikonos-2 remote sensing imagery, Hisar (southwest Turkey). J. Archaeol. Sci. 2007, 34, 830–841. [Google Scholar] [CrossRef]
  16. Luo, L.; Wang, X.; Guo, H.; Liu, C.; Liu, J.; Li, L.; Du, X.; Qian, G. Automated extraction of the archaeological tops of qanat shafts from VHR imagery in google earth. Remote Sens. 2014, 6, 11956–11976. [Google Scholar] [CrossRef] [Green Version]
  17. Luo, L.; Wang, X.; Liu, J.; Guo, H.; Lasaponara, R.; Ji, W.; Liu, C. Uncovering the ancient canal-based tuntian agricultural landscape at China’s northwestern frontiers. J. Cult. Herit. 2017, 23, 79–88. [Google Scholar] [CrossRef]
  18. Luo, L.; Wang, X.; Liu, J.; Guo, H.; Zong, X.; Ji, W.; Cao, H. VHR GeoEye-1 imagery reveals an ancient water landscape at the Longcheng site, northern Chaohu Lake Basin (China). Int. J. Digit. Earth 2017, 10, 139–154. [Google Scholar] [CrossRef]
  19. Parcak, S. Satellite remote sensing methods for monitoring archaeological tells in the Middle East. J. Field Archaeol. 2007, 32, 65–81. [Google Scholar] [CrossRef]
  20. Van Ess, M.; Becker, H.; Fassbinder, J.; Kiefl, R.; Lingenfelder, I.; Schreier, G.; Zevenbergen, A. Detection of Looting Activities at Archaeological Sites in Iraq Using Ikonos Imagery; Angewandte Geoinformatik, Beiträge zum 18; Wiechmann-Verlag: Heidelberg, Germany, 2006; pp. 668–678. [Google Scholar]
  21. El-Baz, F. Prehistoric artifacts near paleo-channels revealed by radar images in the western desert of Egypt. In Remote Sensing in Archaeology from Spacecraft, Aircraft, on Land, and in the Deep Sea; Boston University: Boston, MA, USA, 1998. [Google Scholar]
  22. McCauley, J.F.; Schaber, G.G.; Breed, C.S.; Grolier, M.J.; Haynes, C.V.; Issawi, B.; Elachi, C.; Blom, R. Subsurface valleys and geoarcheology of the eastern Sahara revealed by shuttle radar. Science 1982, 218, 1004–1020. [Google Scholar] [CrossRef] [PubMed]
  23. Evans, D.; Pottier, C.; Fletcher, R.; Hensley, S.; Tapley, I.; Milne, A.; Barbetti, M. A comprehensive archaeological map of the world’s largest preindustrial settlement complex at Angkor, Cambodia. Proc. Natl. Acad. Sci. USA 2007, 104, 14277–14282. [Google Scholar] [CrossRef] [PubMed] [Green Version]
  24. Garrison, T.G.; Chapman, B.; Houston, S.; Román, E.; López, J.L.G. Discovering ancient Maya settlements using airborne radar elevation data. J. Archaeol. Sci. 2011, 38, 1655–1662. [Google Scholar] [CrossRef]
  25. Cigna, F.; Tapete, D.; Lasaponara, R.; Masini, N. Amplitude change detection with ENVISAT ASAR to image the cultural landscape of the Nasca region, Peru. Archaeol. Prospect. 2013, 20, 117–131. [Google Scholar] [CrossRef]
  26. Linck, R.; Busche, T.; Buckreuss, S.; Fassbinder, J.W.E.; Seren, S. Possibilities of archaeological prospection by high-resolution X-band satellite radar–a case study from Syria. Archaeol. Prospect. 2013, 20, 97–108. [Google Scholar] [CrossRef]
  27. Dore, N.; Patruno, J.; Pottier, E.; Crespi, M. New research in polarimetric SAR technique for archaeological purposes using ALOS PALSAR data. Archaeol. Prospect. 2013, 20, 79–87. [Google Scholar] [CrossRef]
  28. Jiang, A.; Chen, F.; Masini, N.; Capozzoli, L.; Romano, G.; Sileo, M.; Yang, R.; Tang, P.; Chen, P.; Lasaponara, R.; et al. Archeological crop marks identified from Cosmo-SkyMed time series: The case of Han-Wei capital city, Luoyang, China. Int. J. Digit. Earth 2017, 10, 846–860. [Google Scholar] [CrossRef]
  29. Patruno, J.; Dore, N.; Crespi, M.; Pottier, E. Polarimetric Multifrequency and Multi-incidence SAR Sensors Analysis for Archaeological Purposes. Archaeol. Prospect. 2013, 20, 89–96. [Google Scholar] [CrossRef]
  30. Morrison, K. Mapping subsurface archaeology with SAR. Archaeol. Prospect. 2013, 20, 149–160. [Google Scholar] [CrossRef]
  31. Collins, A. Beneath the Pyramids: Egypt’s Greatest Secret Uncovered; A.R.E. Press (Association of Research & Enlig): Virginia Beach, VA, USA, 2009. [Google Scholar]
  32. Di Iorio, A.; Straccia, N.; Carlucci, R. Advancement in automatic monitoring and detection of archaeological sites using a hybrid process of remote sensing, GIS techniques and a shape detection algorithm. In Proceedings of the 30th EARSeL Symposium, Paris, France, 2–24 May 2010. [Google Scholar]
  33. Tapete, D.; Cigna, F. Rapid mapping and deformation analysis over cultural heritage and rural sites based on Persistent Scatterer Interferometry. Int. J. Geophys. 2012, 2012, 618609. [Google Scholar]
  34. Comer, D.C.; Blom, R.G. Detection and identification of archaeological sites and features using Synthetic Aperture Radar (SAR) data collected from airborne platforms. In Remote Sensing in Archaeology; Springer: Berlin/Heidelberg, Germany, 2006; pp. 103–136. [Google Scholar]
  35. Stewart, C.; di Iorio, A.; Schiavon, G. Analysis of the utility of Cosmo Skymed stripmap to detect buried archaeological features in the region of Rome. Experimental component of WHERE project. In Proceedings of the Towards Horizon 2020: Earth Observation and Social Perspectives, Matera, Italy, 3–6 June 2013; pp. 203–212. [Google Scholar]
  36. Chen, F.; Lasaponara, R.; Masini, N. An overview of satellite synthetic aperture radar remote sensing in archaeology: From site detection to monitoring. J. Cult. Herit. 2017, 23, 5–11. [Google Scholar] [CrossRef]
  37. Gade, M.; Kohlus, J. SAR imaging of archeological sites on dry-fallen intertidal flats in the German Wadden Sea. In Proceedings of the 2015 IEEE International Geoscience and Remote Sensing Symposium (IGARSS), Brussels, Belgium, 26–31 July 2015; IEEE: Piscataway, NJ, USA, 2015. [Google Scholar]
  38. Caltagirone, F.; Coletta, A.; de Luca, G. COSMO-SkyMed Mission and Products Description; Italian Space Agency Doc.: Rome, Italy, 2014. [Google Scholar]
  39. Chen, F.; Masini, N.; Yang, R.; Milillo, P.; Feng, D.; Lasaponara, R. A space view of radar archaeological marks: First applications of COSMO-SkyMed X-band data. Remote Sens. 2014, 71, 24–50. [Google Scholar] [CrossRef] [Green Version]
  40. Balss, U.; Gisinger, C.; Cong, X.Y.; Brcic, R.; Steigenberger, P.; Eineder, M.; Pail, R.; Hugentobler, U. High resolution geodetic earth observation with TerraSAR-X: Correction schemes and validation. In Proceedings of the 2013 IEEE International Geoscience and Remote Sensing Symposium-IGARSS, Melbourne, VIC, Australia, 21–26 July 2013; IEEE: Piscataway, NJ, USA, 2013. [Google Scholar]
  41. Balz, T.; Liao, M.; Caspari, G.; Fu, B.; Rosenbauer, R.; Erasmi, S. Analyzing TerraSAR-X staring spotlight mode data for archaeological prospections in the Altai Mountains. In Proceedings of the 2015 IEEE 5th Asia-Pacific Conference on Synthetic Aperture Radar (APSAR), Singapore, 1–4 September 2015; IEEE: Piscataway, NJ, USA, 2015. [Google Scholar]
  42. Khanoussi, M. Note sur la date de promotion de Capsa (Gafsa, en Tunisie) au rang de colonie romaine (Note d’information). In Comptes Rendus des Séances de l’Académie des Inscriptions et Belles-Lettres; Nabu Press: Charleston, SC, USA, 2010; Volume 154, pp. 1009–1020. [Google Scholar]
  43. Brahmi, M. Thiges et le castellum Thigensium. In Géographie Historique du Maghreb Antique et Médiéval: États des Lieux et Perspectives de Recherches, Actes du 1er Colloque International du Laboratoire de Recherche Occupation du sol, Peuplement et Modes de Vie Dans le Maghreb Antique et Médiéval; Université de Sousse, Faculté des Lettres et des Sciences Humaine: Sousse, Tunisia, 2015. [Google Scholar]
  44. Ch, T. Géographie Comparée de la Province Romaine d’Afrique, t. II; Exploration Scientifique de la Tunisie: Paris, France, 1888. [Google Scholar]
  45. Euzennat, M. Quatre années de recherches sur la frontière romaine en Tunisie méridionale. C. R. Séances Acad. Inscr. Belles-Lett. 1972, 116, 7–27. [Google Scholar]
  46. Toussaint, P. Résumé des Connaissances Archéologiques Exécutées par les Officiers des Brigades Topographiques d’Algérie et de Tunisie; Bulletin Archéologique du Comité: Paris, France, 1904; pp. 137–138. [Google Scholar]
  47. Toutain, J. Note sur quelques voies romaines de l’Afrique proconsulaire. In Mélanges d’Archéologie et d’Histoire; École Française de Rome: Rome, Italy, 1895; Volume XV. [Google Scholar]
  48. Chen, F.; Guo, H.; Tapete, D.; Masini, N.; Cigna, F.; Lasaponara, R.; Piro, S.; Lin, H.; Ma, P. Interdisciplinary approaches based on imaging radar enable cutting-edge cultural heritage applications. Natl. Sci. Rev. 2021, 8, nwab123. [Google Scholar] [CrossRef]
  49. Elfadaly, A.; Abate, N.; Masini, N.; Lasaponara, R. SAR sentinel 1 imaging and detection of palaeo-landscape features in the mediterranean area. Remote Sens. 2020, 12, 2611. [Google Scholar] [CrossRef]
  50. Goodman, N.R. Statistical analysis based on a certain multivariate complex Gaussian distribution (an introduction). Ann. Math. Stat. 1963, 34, 152–177. [Google Scholar] [CrossRef]
  51. Deledalle, C.A.; Denis, L.; Tupin, F.; Reigber, A.; Jäger, M. Additional Illustrations of NL-SAR Method for Resolution-Preserving (Pol) (In) SAR Denoising. 2014. Available online: https://hal.archives-ouvertes.fr/hal-00955194v4 (accessed on 24 April 2022).
  52. Buades, A.; Coll, B.; Morel, J.M. A non-local algorithm for image denoising. In Proceedings of the IEEE Computer Society Conference on Computer Vision and Pattern Recognition IEEE Computer Society, San Diego, CA, USA, 20–25 June 2005. [Google Scholar]
  53. Deledalle, C.-A.; Denis, L.; Tupin, F. Iterative weighted maximum likelihood denoising with probabilistic patch-based weights. IEEE Trans. Image Process. 2009, 18, 2661–2672. [Google Scholar] [CrossRef] [Green Version]
  54. Polzehl, J.; Spokoiny, V. Propagation-separation approach for local likelihood estimation. Probab. Theory Relat. Fields 2006, 135, 335–362. [Google Scholar] [CrossRef] [Green Version]
  55. Lee, J. Refined filtering of image noise using local statistics: Computer Graphics & Image Processing, 15, 380–389. cgi CGIPBG 0146-664X Computer Graphics Image Processing Crossref Google Scholar 1981b. Speckle analysis and smoothing of synthetic aperture radar images. Comput. Graph. Image Process. 1981, 17, 24–32. [Google Scholar]
  56. Eineder, M.; Minet, C.; Steigenberger, P.; Cong, X.; Fritz, T. Imaging geodesy—Toward centimeter-level ranging accuracy with TerraSAR-X. IEEE Trans. Geosci. Remote Sens. 2010, 49, 661–671. [Google Scholar] [CrossRef]
  57. Schubert, A.; Jehle, M.; Small, D.; Meier, E. Influence of atmospheric path delay on the absolute geolocation accuracy of TerraSAR-X high-resolution products. IEEE Trans. Geosci. Remote Sens. 2009, 48, 751–758. [Google Scholar] [CrossRef]
Figure 1. (A) Location of Tunisia relative to the world; (B,C) location of the study area in Tunisia; (D) 30 m resolution Advanced Spaceborne Thermal Emission and Reflection Radiometer (ASTER) global digital elevation model (GDEM) and hill shade of southern Tunisia showing the location of the archeological site; (E) slope map derived from the ASTER GDEM of the relief of Gafsa.
Remotesensing 14 02128 g001
Figure 2. Distribution of the obtained SAR images in the study area: one frame of TSX SL archived time series data (solid red rectangle), one frame of CSK data (dotted red rectangle), and two frames of TSX ST archived time series data (solid blue rectangles).
Remotesensing 14 02128 g002
Figure 3. Flowchart of the NL denoising method.
Remotesensing 14 02128 g003
Figure 4. Results obtained with the NL-SAR method involving CSK SL data. (AC,E) Original CSK intensity images: (A,C) CSK SL images acquired on 9 February 2018 (SAR image © DLR, 2018) in the independent mode under horizontal–horizontal (HH) polarization; (E) CSK SL image acquired on 21 March 2018 (SAR image © DLR, 2015) in the descending mode under HH polarization; (B,D,F) corresponding NL-SAR CSK SL images. The pink arrows denote some features of the ancient fortress in the eastern part of the study area.
Remotesensing 14 02128 g004
Figure 5. Results obtained with the NL-SAR method involving TSX SL data. (A,C) Original TSX intensity SL images acquired on 8 November 2011 (SAR image © DLR, 2011); (B,D) anomalies on bare ground observed in an enhanced TSX SL image at a ground resolution of 1.3 m and an incidence angle of 38°.The pink arrows denote some features of the ancient fortress in the eastern part of the study area.
Remotesensing 14 02128 g005
Figure 6. Identification of the archeological features of the ancient fortress (site 1) at Henchir BouGôra, Tunisia, from TSK ST data after application of the NL-SAR method. (A) High-resolution TSX ST-mode image of site 1 acquired on 20 February 2021 with a spatial resolution of 0.4 m under HH polarization at an incidence angle of 20.6° (© DLR, 2021); (C) high-resolution TSX ST-mode image of site 1 acquired on 26 February 2021 with a spatial resolution of 0.22 m under HH polarization at an incidence angle of 38.8° (© DLR, 2021); (BD) NL-SAR intensity result. The red polygons and yellow circle enclose features of the ancient fortress in the eastern part of the study area.
Remotesensing 14 02128 g006
Figure 7. Identification of the archeological features of the deserted fortress (site 1) at Henchir BouGôra, Tunisia, from TSK ST data after application of the NL-SAR method. (A) High-resolution TSX ST-mode image of site 1 acquired on 27 February 2021 with a spatial resolution of 0.22 m under HH polarization at an incidence angle of 38.6° (© DLR, 2021); (B) NL-SAR intensity result. The red polygons and yellow circle enclose features of the ancient fortress in the eastern part of the study area.
Remotesensing 14 02128 g007
Figure 8. Identification of the archeological features of the ancient fortress (site 2) at Borj Gourbata, Tunisia. (A) TSX 0.38m resolution ST-mode image acquired on 22 February 2021 under HH polarization at an incidence angle of 38.5° (© DLR 2021); (B) NL-SAR intensity result; (C) magnified view of the results obtained with the NL-SAR method. The red box highlights the ancient fortress in the eastern part of the study area.
Remotesensing 14 02128 g008
Figure 9. Results obtained from pansharpened Ziyuan-3-based PAN image data of sites 1 and 2, acquired on 9 July 2018, at a resolution of 2.1 m; the yellow polygons in the left part mark features of anomaly 1 (B), and the red box highlights anomaly 2 in the right part (A).
Remotesensing 14 02128 g009
Figure 10. (A,D) Magnified views of site 1 and 2 with field photos of the wall remains; (B,E) Google Earth image of sites 1 and 2 from 2009 with detected changes due to looting; (C) photo of the northwestern the entrance of the fortress; (F) pottery fragments (the black box in G).
Remotesensing 14 02128 g010
Table 1. Summary of the TSX and CSK data used to develop the case studies examined in this paper. SL—spotlight; ST—staring spotlight.
SiteSensorRadar BandInstrument ModeIncidence AngleRange Resolution (Res.) (M)Azimuth Res. (M)
Site 1TSXX-bandSL38.58951.3641 (slant range)1.8273
TSXX-bandST20.63810.4000 (ground range)0.4000
TSXX-bandST38.85750.2200 (ground range)0.2200
TSXX-bandST38.62530.2200 (ground range)0.2200
CSKX-bandSL24.00980.9749 (slant range)1.8005
CSKX-bandSL26.64480.9295 (slant range)2.2041
Site 2TSXX-bandSL38.58951.3641 (slant range)1.8273
TSXX-bandST21.09690.3800 (ground range)0.3800
CSKX-bandSL26.64480.9295 (slant range)2.2041
Table 2. Characteristics of the Ziyuan-3 (ZY-3) data.
SensorsZiyuan-3 (ZY-3)
Wavelength (µm)PAN0.50–0.80
MS0.45–0.52 Blue
0.52–0.59 Green
0.63–0.69 Red
0.77–0.89 NIR
Spatial resolution (m)PAN 2.1
MS 5.8
Publisher’s Note: MDPI stays neutral with regard to jurisdictional claims in published maps and institutional affiliations.

