Article

3D Visualization Techniques for Analysis and Archaeological Interpretation of GPR Data

by
Alexander Bornik
1,* and
Wolfgang Neubauer
1,2
1
Ludwig Boltzmann Institute for Archaeological Prospection and Virtual Archaeology, Hohe Warte 38, 1190 Vienna, Austria
2
Vienna Institute for Archaeological Science, University of Vienna, Franz-Klein-Gasse 1, 1190 Vienna, Austria
*
Author to whom correspondence should be addressed.
Remote Sens. 2022, 14(7), 1709; https://doi.org/10.3390/rs14071709
Submission received: 30 January 2022 / Revised: 14 March 2022 / Accepted: 29 March 2022 / Published: 1 April 2022
(This article belongs to the Special Issue Advances in Ground-Penetrating Radar for Archaeology)

Abstract

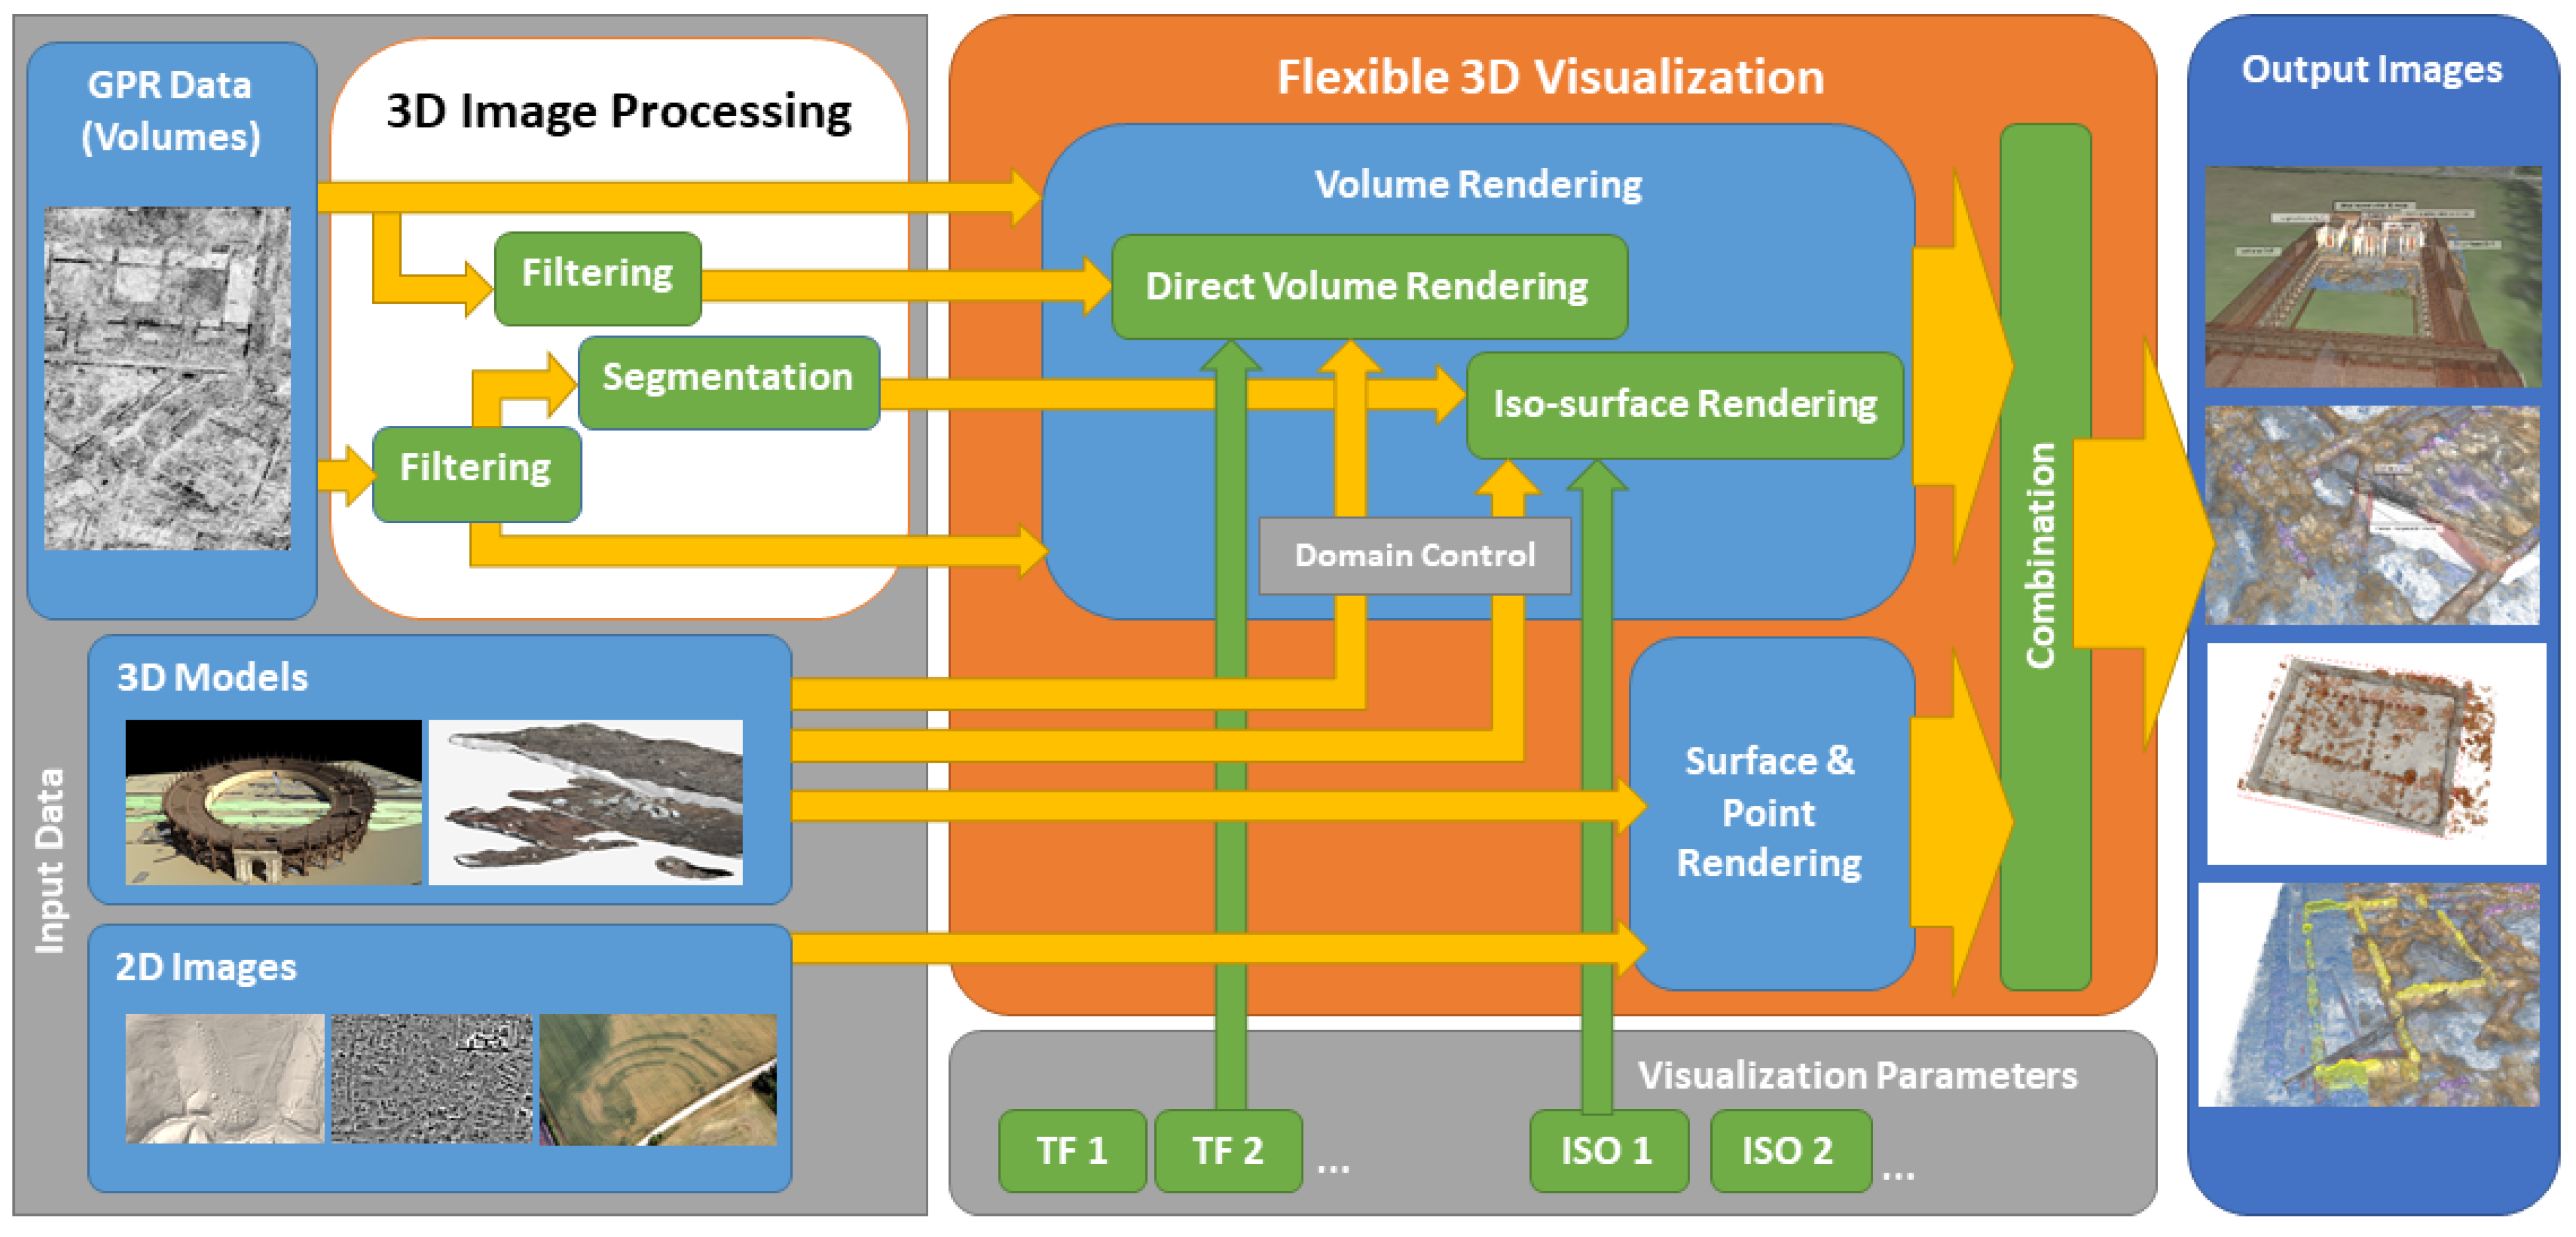
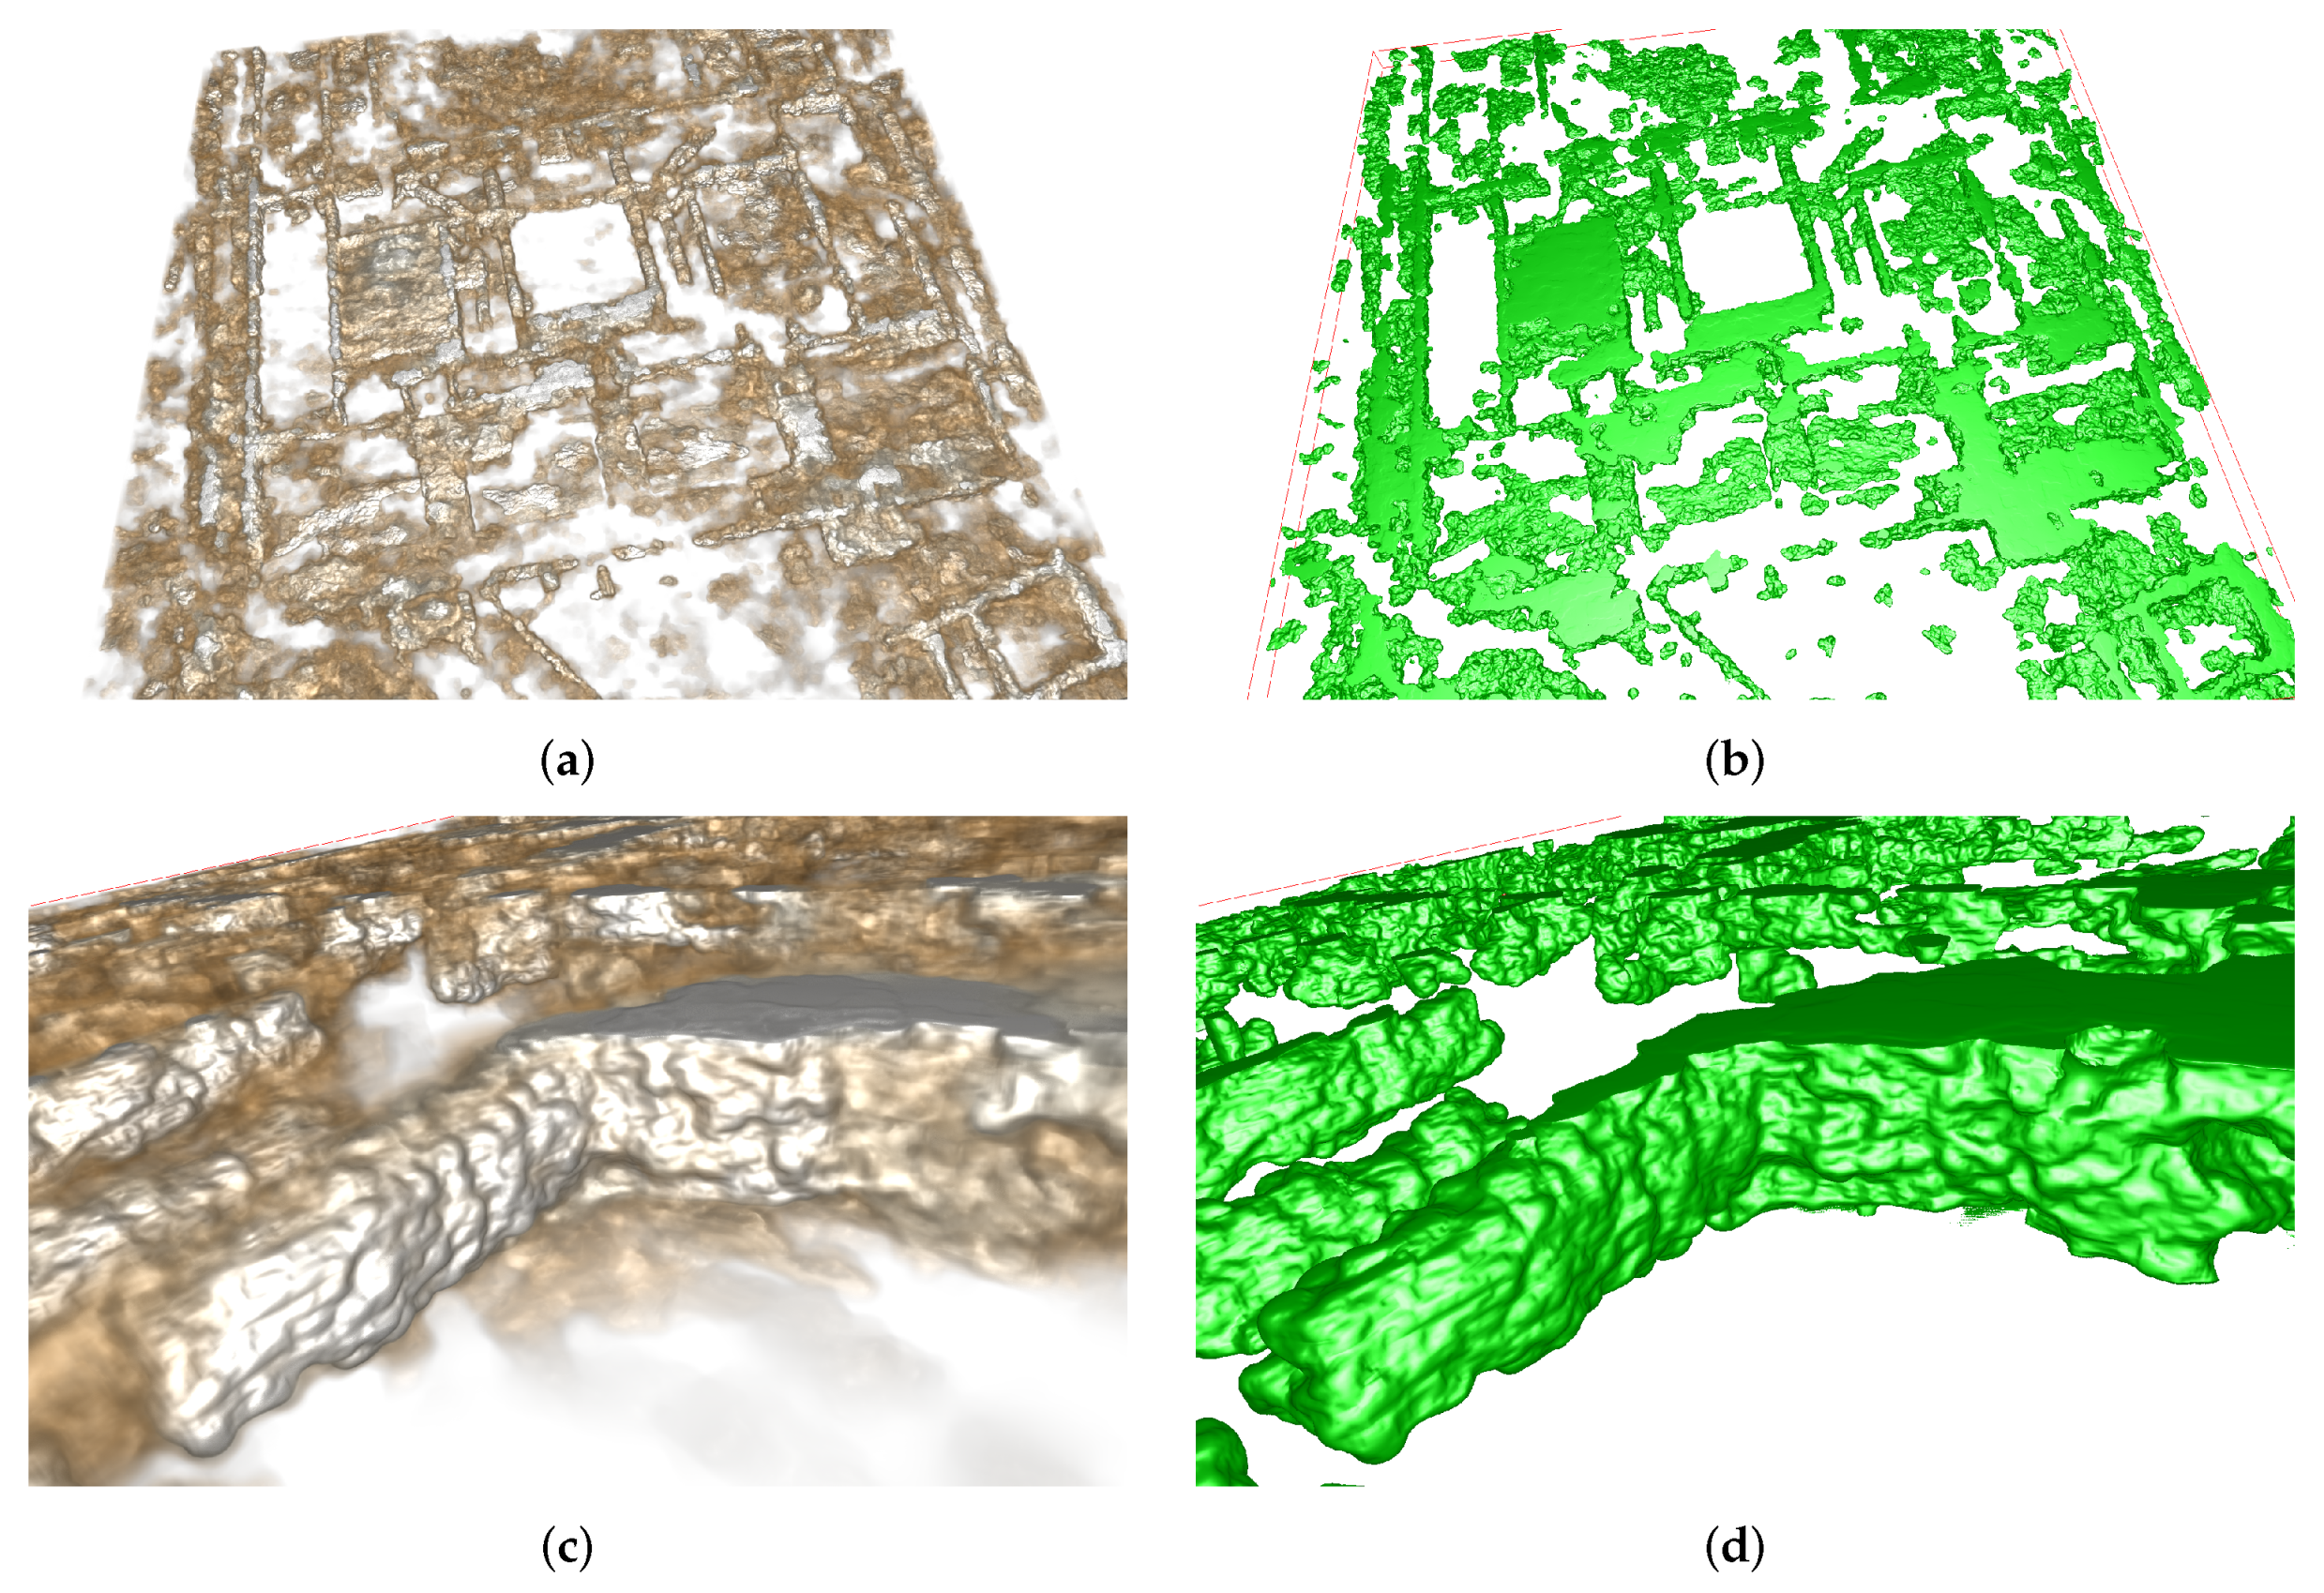
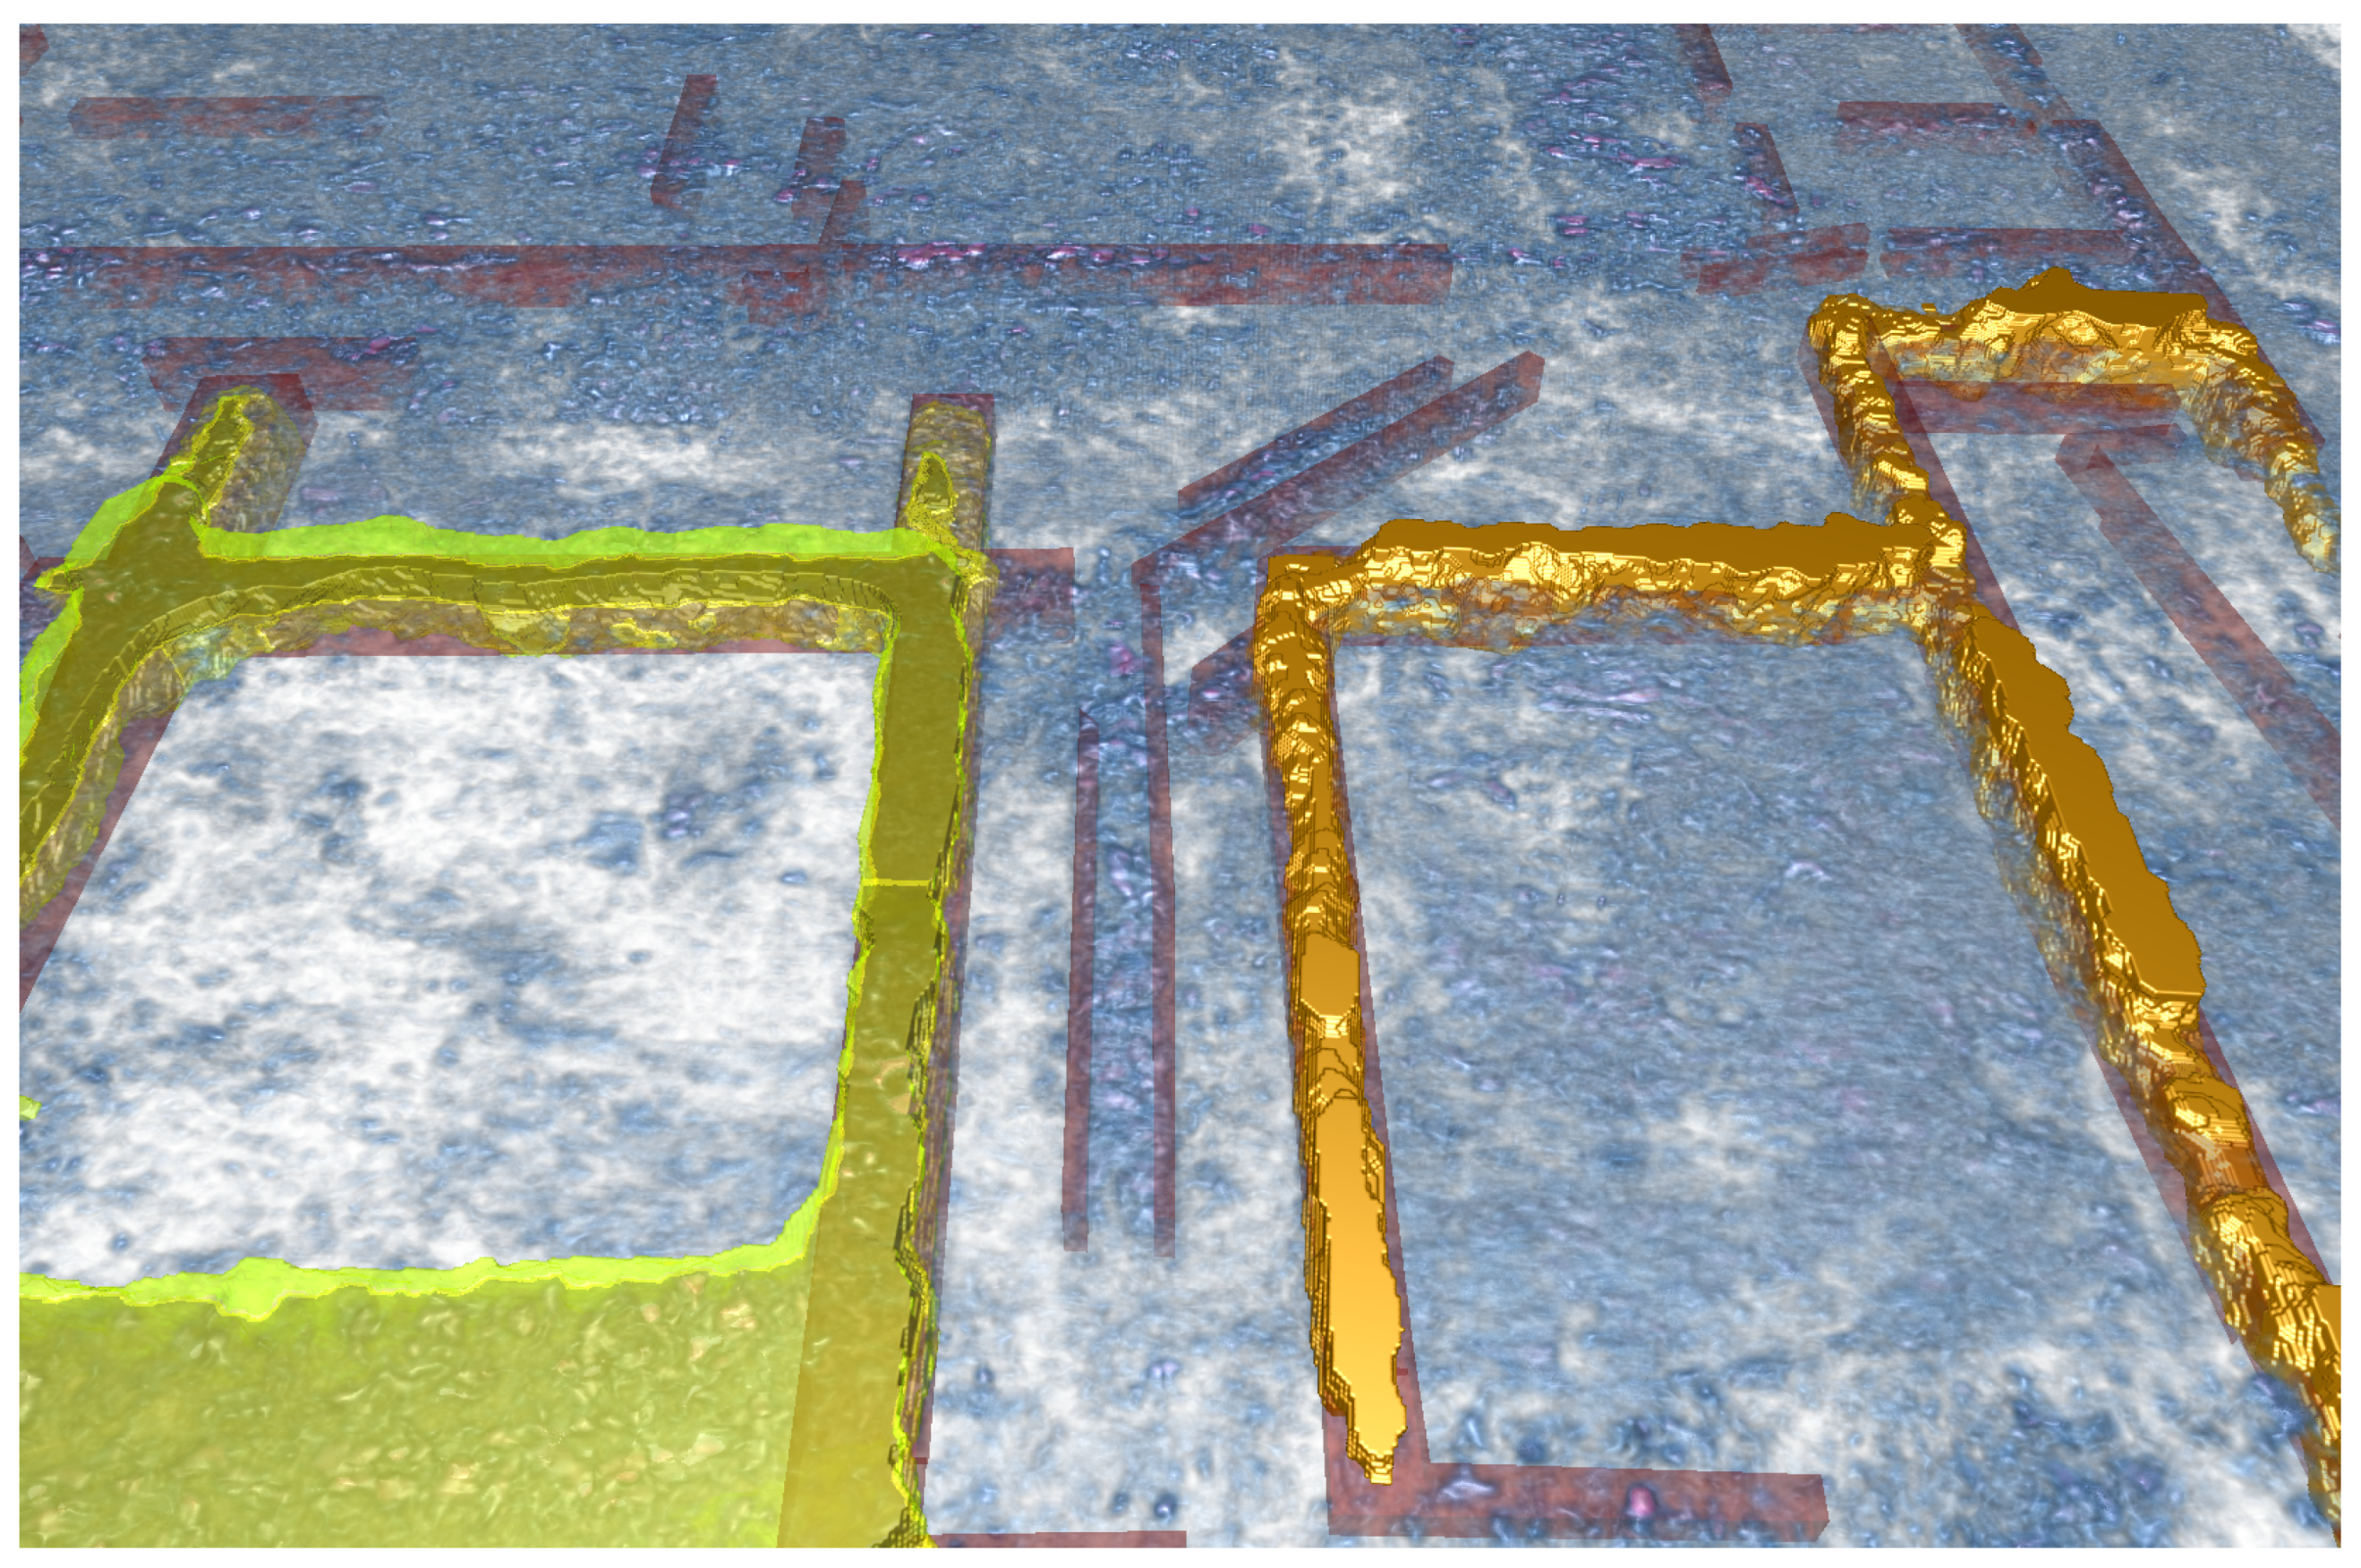
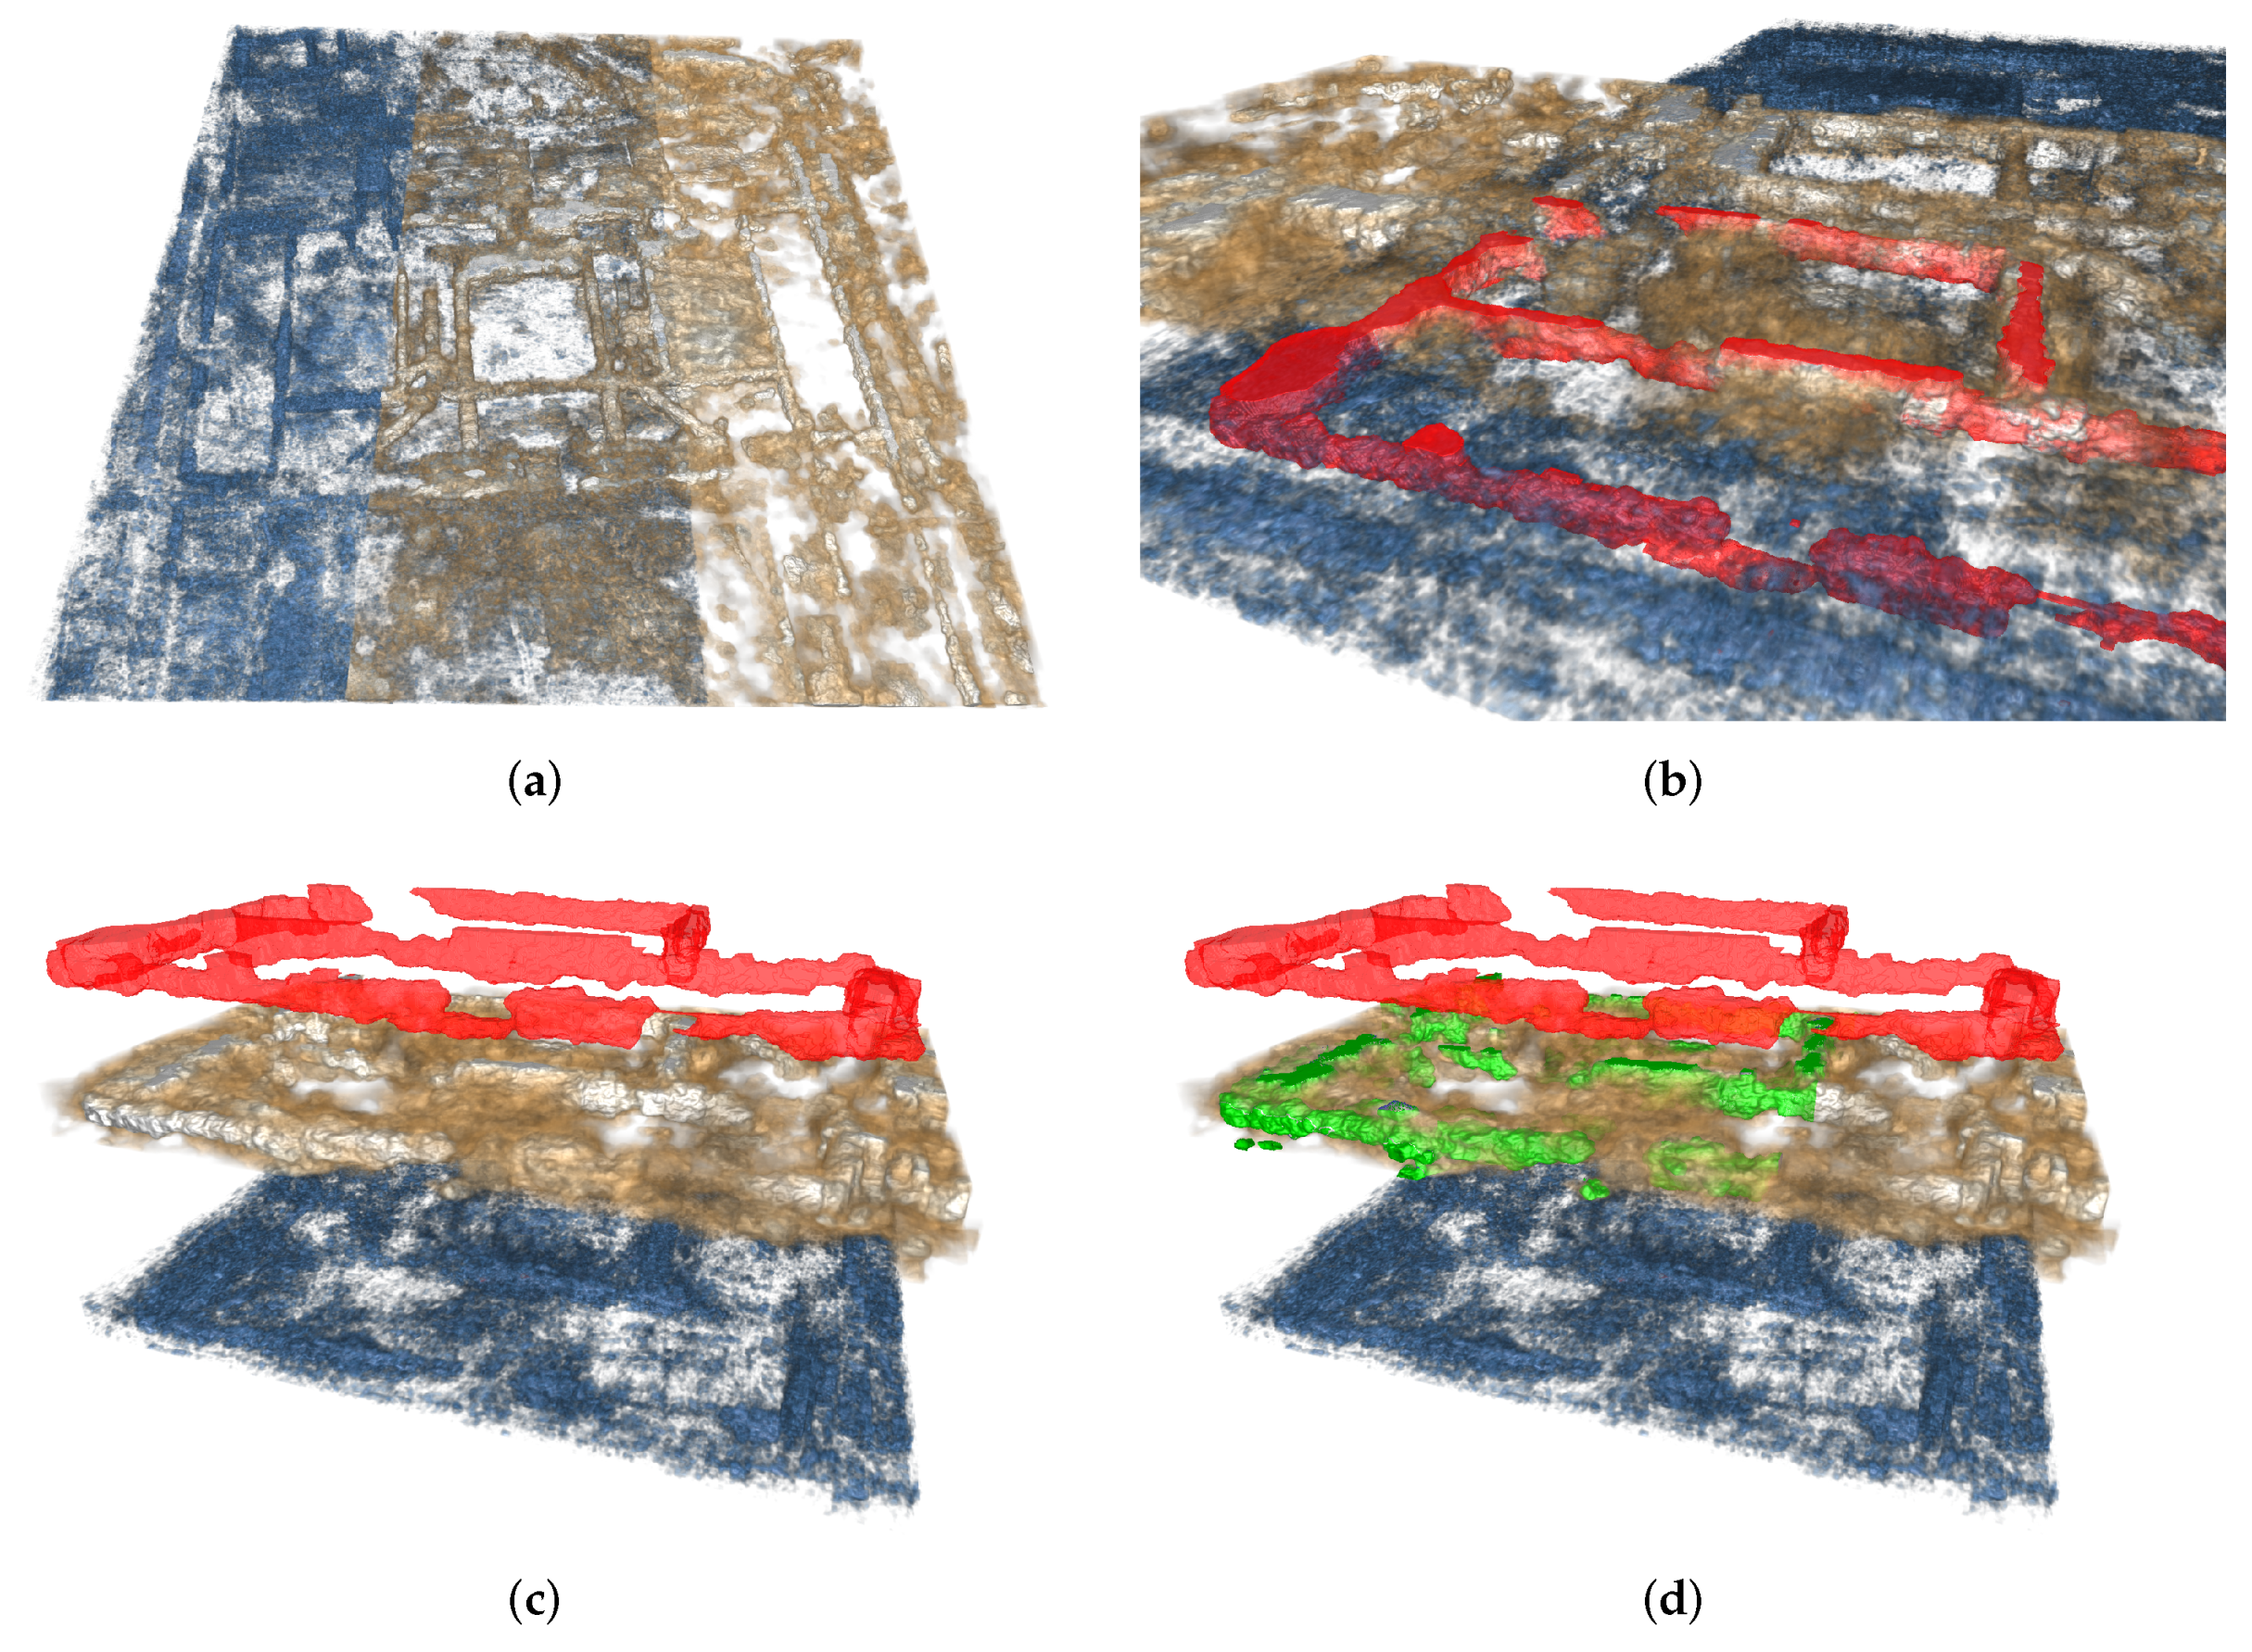
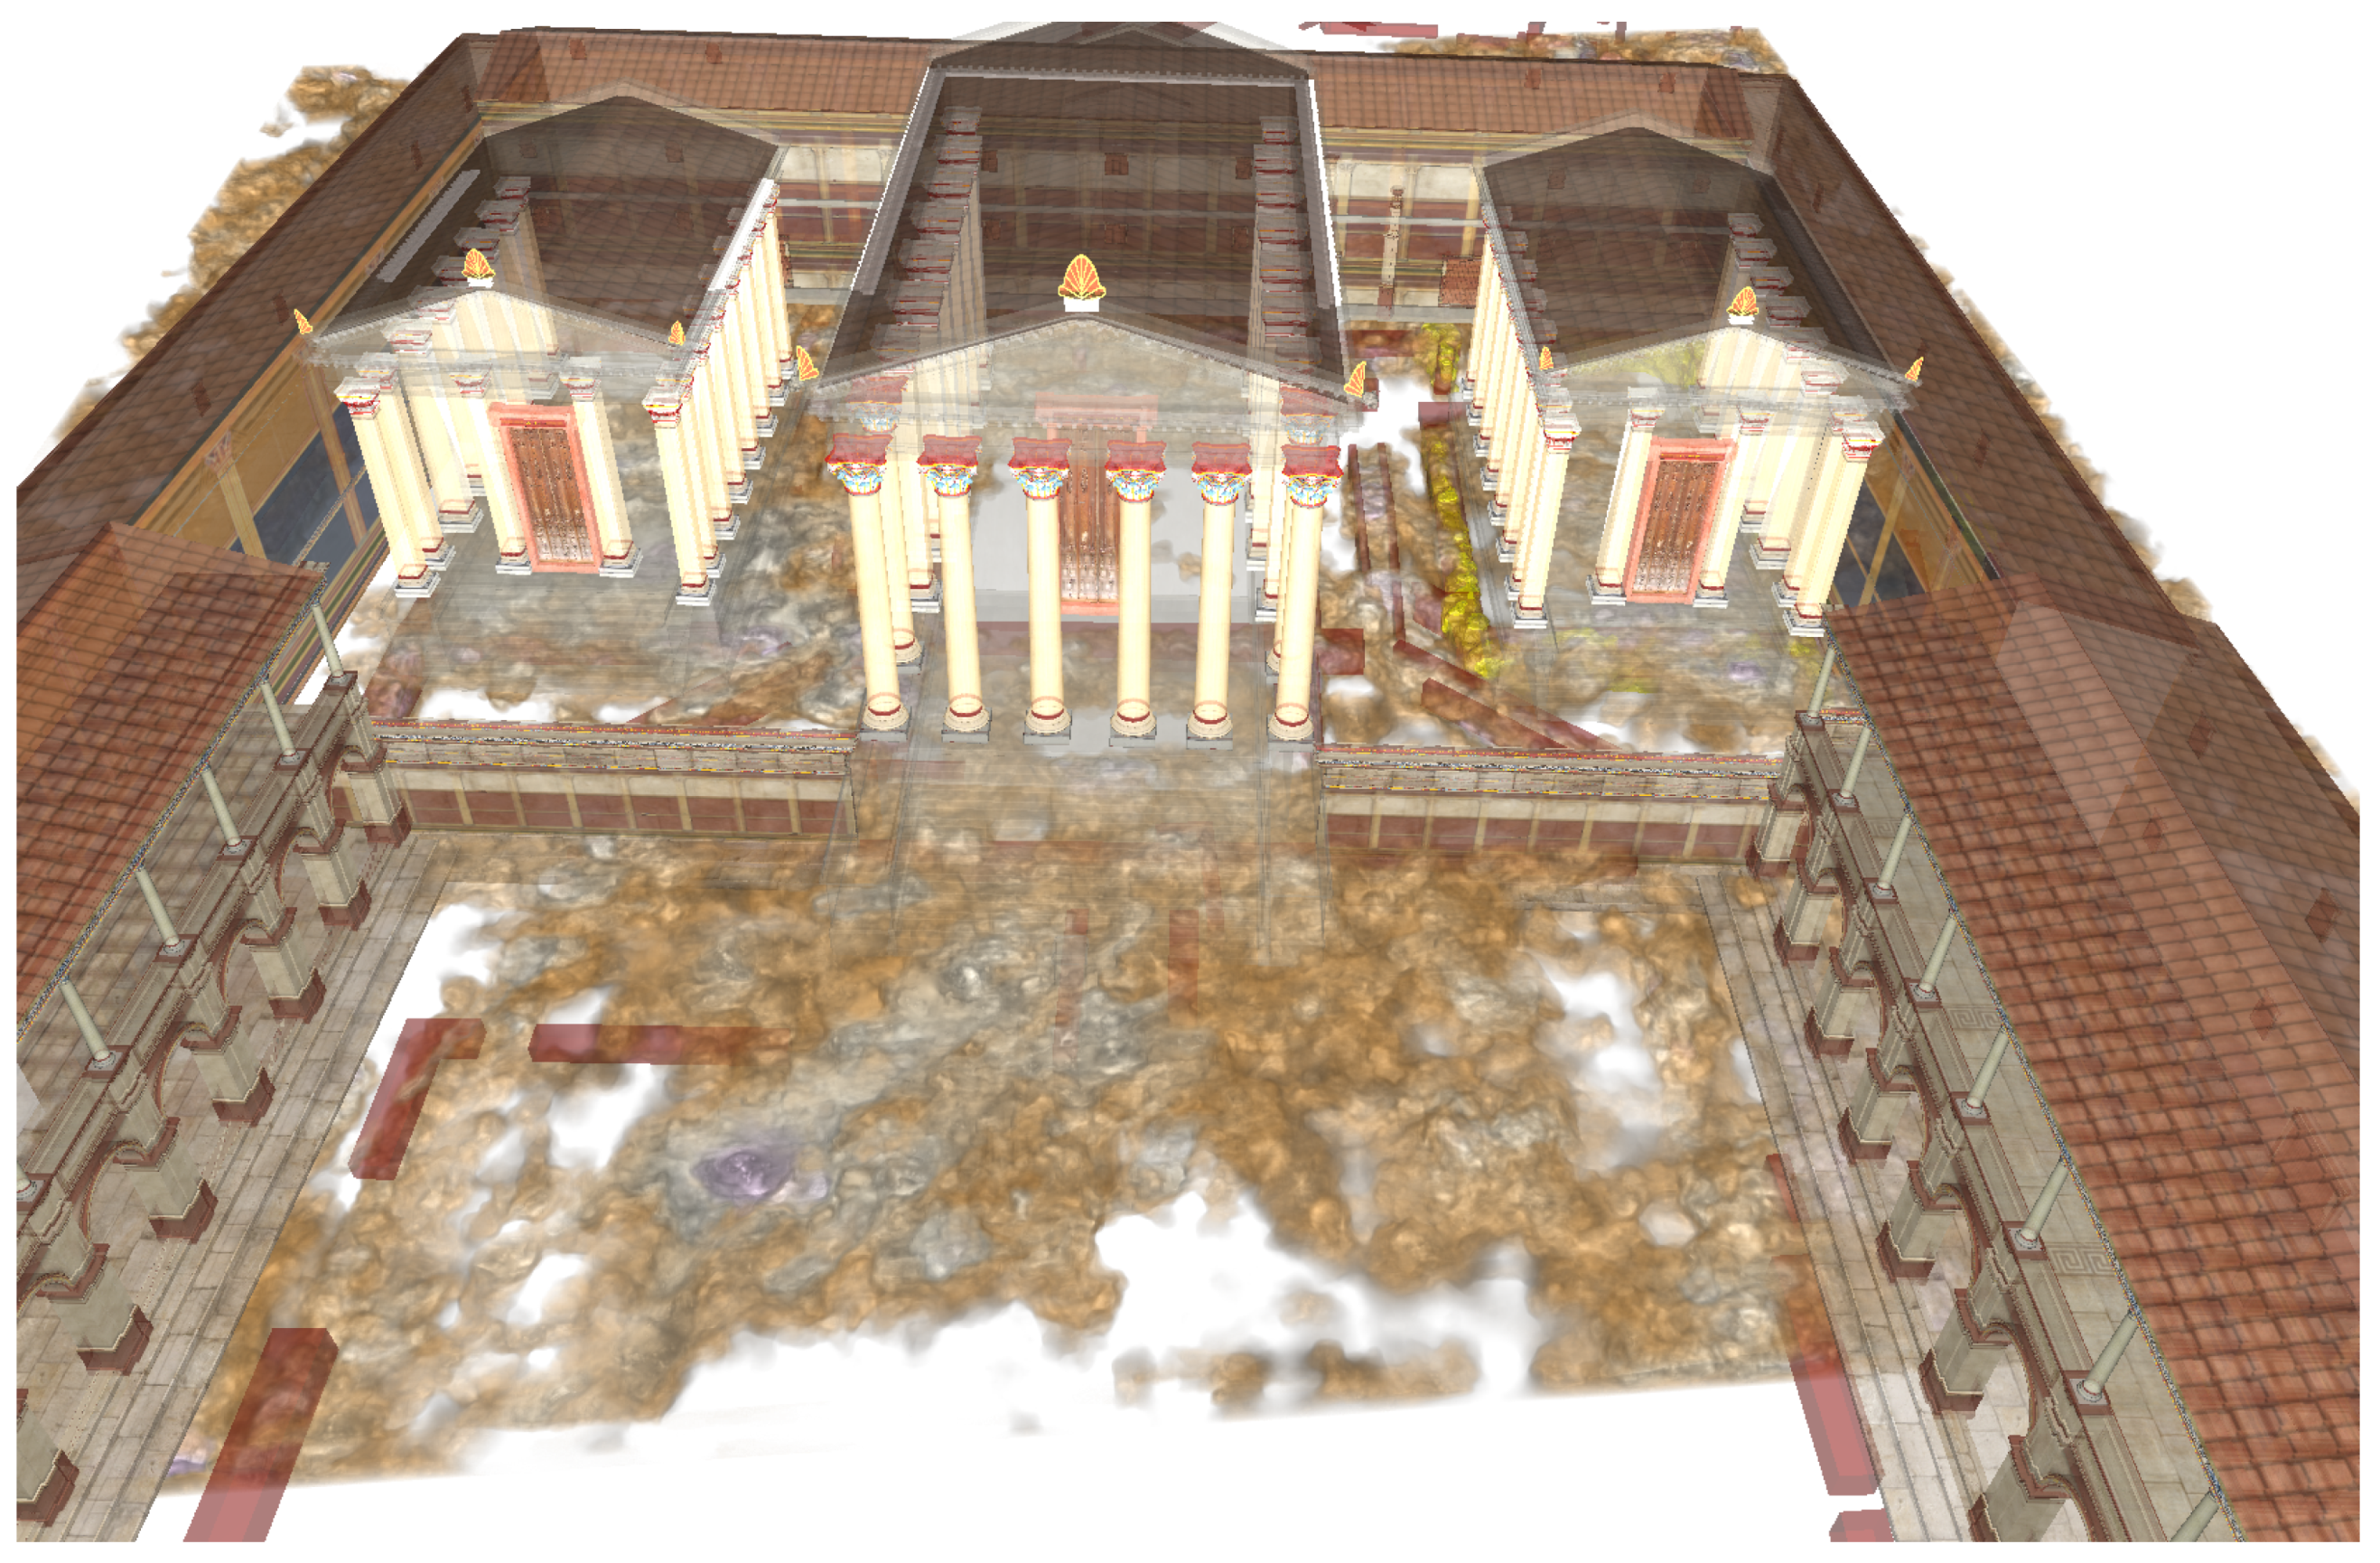
The non-invasive detection and digital documentation of buried archaeological heritage by means of geophysical prospection is increasingly gaining importance in modern field archaeology and archaeological heritage management. It frequently provides the detailed information required for heritage protection or targeted further archaeological research. High-resolution magnetometry and ground-penetrating radar (GPR) became invaluable tools for the efficient and comprehensive non-invasive exploration of complete archaeological sites and archaeological landscapes. The analysis and detailed archaeological interpretation of the resulting large 2D and 3D datasets, and related data from aerial archaeology or airborne remote sensing, etc., is a time-consuming and complex process, which requires the integration of all data at hand, respective three-dimensional imagination, and a broad understanding of the archaeological problem; therefore, informative 3D visualizations supporting the exploration of complex 3D datasets and supporting the interpretative process are in great demand. This paper presents a novel integrated 3D GPR interpretation approach, centered around the flexible 3D visualization of heterogeneous data, which supports conjoint visualization of scenes composed of GPR volumes, 2D prospection imagery, and 3D interpretative models. We found that the flexible visual combination of the original 3D GPR datasets and images derived from the data applying post-processing techniques inspired by medical image analysis and seismic data processing contribute to the perceptibility of archaeologically relevant features and their respective context within a stratified volume. Moreover, such visualizations support the interpreting archaeologists in their development of a deeper understanding of the complex datasets as a starting point for and throughout the implemented interactive interpretative process.
Keywords: archaeological prospection; 3D visualization; ground penetrating radar; image processing; archaeological interpretation archaeological prospection; 3D visualization; ground penetrating radar; image processing; archaeological interpretation