Article

The Dynamic Changes of Lake Issyk-Kul from 1958 to 2020 Based on Multi-Source Satellite Data

1
Shaanxi Key Laboratory of Earth Surface System and Environmental Carrying Capacity, College of Urban and Environmental Sciences, Northwest University, Xi’an 710127, China
2
Institute of Earth Surface System and Hazards, College of Urban and Environmental Sciences, Northwest University, Xi’an 710127, China
3
Institute of Tibetan Plateau Research, Chinese Academy of Sciences, Beijing 100101, China
*
Author to whom correspondence should be addressed.
Remote Sens. 2022, 14(7), 1575; https://doi.org/10.3390/rs14071575
Submission received: 25 January 2022 / Revised: 15 March 2022 / Accepted: 22 March 2022 / Published: 24 March 2022
(This article belongs to the Special Issue Remote Sensing of Land Water Bodies)

Abstract

:
Lake Issyk-Kul is the largest alpine lake in arid Central Asia. In recent years, the lake has become a subject of special concern due to the dramatic fluctuations in its water level. In this study, the long-term continuous changes in the water level of Lake Issyk-Kul were derived from hydro-meteorological stations, CryoSat-2, and ICESat-2 satellites. Changes in area were analyzed by the Joint Research Centre (JRC) Global Surface Water (GSW) dataset based on the Google Earth Engine and the variations in water volume were estimated by an empirical formula. The results indicate that the water level of Lake Issyk-Kul fluctuated between 1606.06 m and 1608.32 m during 1958–2020, showing a slight decrease of 0.02 m/year on average. The water level first experienced a significant decreasing trend of 0.05 m/year from 1958 to 1998, and then began to rise rapidly by 0.10 m/year during 1998–2006, followed by a fluctuating decline after 2006. The area of Lake Issyk-Kul exhibited a downward trend before 1998, then a rapid expansion during 1998–2006, and short-term fluctuations in decline thereafter. Meanwhile, changes in water volume of Lake Issyk-Kul followed a similar pattern of variations in water level and area. According to comprehensive analyses, the continuous downward trend of the water level before 1998 was primarily affected by substantial anthropogenic water consumption in the basin. However, since the 21st century, the increases in precipitation and glacier meltwater and the reduced water consumption have collectively facilitated the short-term recovery of Lake Issyk-Kul in water level, area, and water volume.

1. Introduction

As essential components of global hydrological and biogeochemical water cycles, lakes are extremely susceptible to climate and environmental changes. Endorheic lakes located in arid and semi-arid environments are highly sensitive to climate oscillation [1,2,3], so they serve as crucial indicators of regional climate change and also play indispensable roles in maintaining the regional ecological balance [4,5,6].
The acquisition of long-term gauge observations is restricted by the complex topography, the varying weather conditions, data confidentiality, and data incompleteness [7,8]. Satellite altimetry, an emerging water level determination approach to overcome the limitations of in situ observations, has been widely used by researchers to obtain continuous water levels due to its precise periodic operations and large spatial coverage [9]. Some of the most commonly used altimetric satellites in current research include ERS-1/2, Envisat, GFO, Jason-1/2, ICESat-1/2, CryoSat-2, etc. A number of studies have demonstrated the usefulness of satellite altimetry data for small lakes in ungauged regions and larger lakes such as typical lakes on the Tibetan Plateau [3,10,11,12,13,14,15,16]. The Geoscience Laser Altimeter System (GLAS) instrument onboard the Ice, Cloud, and Land Elevation Satellite (ICESat) was designed to monitor glaciers and sea ice, and it can also provide high-precision measurements of water levels [17,18]. ICESat-2, launched in 2018, is a spaceborne laser altimetry mission with great improvements in data coverage density and ranging accuracy compared with ICESat-1 [19]. CryoSat-2 is a radar altimetry mission, launched on 8 April 2010. The SAR Interferometric Radar Altimeter (SIRAL) on-board the CryoSat can effectively monitor changes in water level [20]. Compared with other radar altimetry missions, CryoSat-2, with a denser orbit and smaller footprint point distance, can visit various small lakes. In view of the above characteristics, ICESat-2 and CryoSat-2 can both contribute to the investigation of long-term water level series [21].
Lake Issyk-Kul is the largest high-altitude lake in arid Central Asia and is one of the largest saline lakes around the world [22]. Recently, Lake Issyk-Kul has aroused widespread concern because of the continuous drop in water level and the environmental pollution in the basin [23]. Therefore, it is of vital importance to monitor the long-term dynamic changes of Lake Issyk-Kul. Documentary records on the water level of Lake Issyk-Kul first began in 1930 from the Przhevalsk station, and several studies have adopted the records from then on [23,24,25,26]. At present, most researchers have performed further analyses based simply on the water level data obtained from telemetry gauging stations, thus the study period is short, and a comprehensive long-term series of water levels consisting of multi-source satellite altimetry and in situ data is still lacking [26,27,28].
Currently, the most commonly used data for extracting lake area are optical remote sensing satellites, especially the Landsat series satellites [29,30]. A number of studies explored the variations in the area of Lake Issyk-Kul over several years based on Landsat datasets [31,32] and various water indices which have been widely applied to identify water bodies [33,34,35]. Traditional methods of image acquisition and processing are complex and time-consuming owing to the consideration of cloud cover, data availability, and data quality, and the pre-processing procedures including radiometric calibration and atmospheric correction [36,37,38]. The Google Earth Engine (GEE), a cloud-based platform for large-scale geospatial analysis, is now regarded as an efficient tool to analyze multi-sensor data due to its abundant databases and massive computational abilities [39,40,41]. The Joint Research Centre (JRC) Global Surface Water (GSW) dataset derived from GEE involves more than 4,000,000 images of Landsat 5, 7, and 8, and it provides statistical data on the boundaries and changes of surface water from 1984 to 2020 [42]. Thus, the JRC dataset can comprehensively describe the area variations of lakes. Furthermore, the GEE contains atmospherically corrected surface reflectance datasets from the Landsat sensors (Landsat Surface Reflectance Tier), which can greatly shorten the processing flow of water body extractions using indices and algorithms. Upon that, lake areas can be extracted from Landsat datasets based on the GEE using the modified normalized difference water index (mNDWI) and the maximum between-cluster variance (OTSU) image segmentation algorithm as validations [43,44,45].
Based on the water level and lake area data, changes in water volume can be calculated by a mathematical model which regards the water volume of lakes as the volume of a pyramidal frustum [46].
Consequently, the objectives of this study were as follows: (1) to investigate the water level series of Lake Issyk-Kul composed of in situ data, CryoSat-2, and ICESat-2 during 1958–2020; (2) to extract the area of Lake Issyk-Kul with the JRC dataset, based on the Google Earth Engine, and calculate the water volume changes during 1990–2020; and (3) to explore the dominant factors affecting changes in Lake Issyk-Kul in terms of climate change, glacier meltwater, and human activities.

2. Materials and Methods
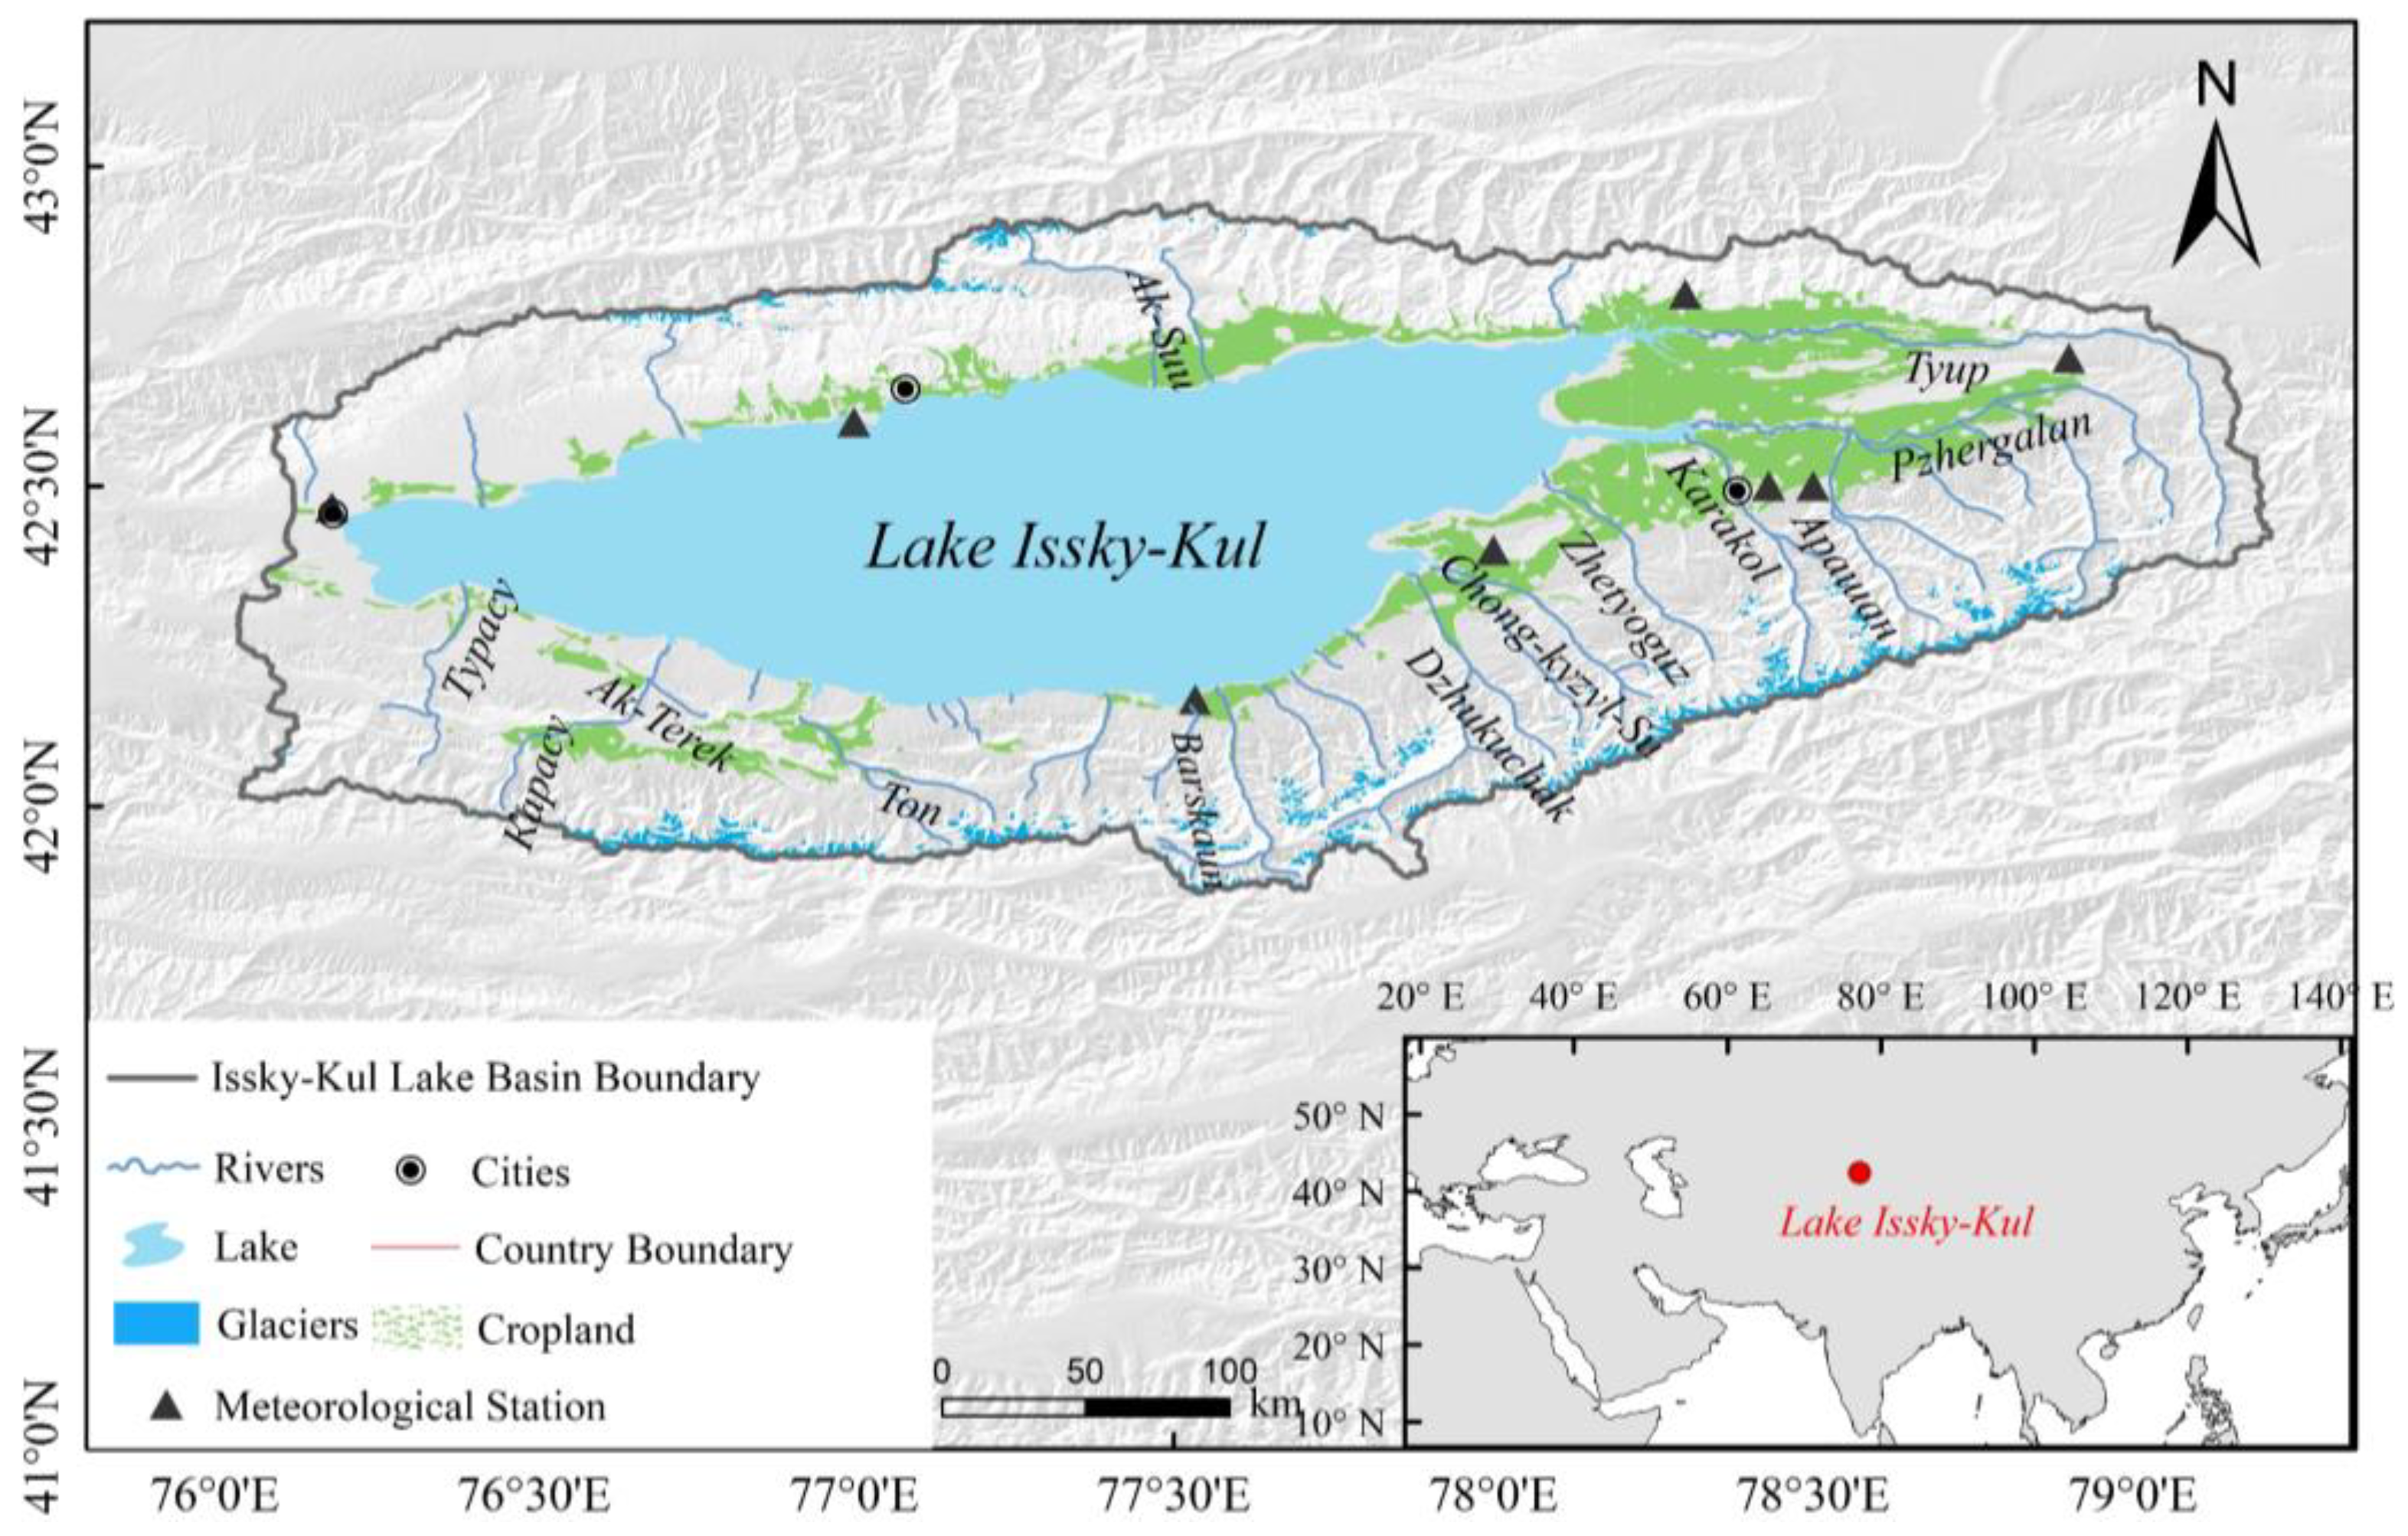
2.1. Study Area

Lake Issyk-Kul (77.33°E, 42.42°N), an inland lake located in northeastern Kyrgyzstan (Figure 1), is surrounded by the northern Terskey Alataw Mountains and the southern Kungey Alataw Mountains [47]. It is the largest alpine lake in Central Asia, covering an area of approximately 6236 km2 with an average altitude of 1607 m, a maximum depth of 665 m, a total volume of 1735 km3, and a shoreline perimeter stretching for around 69 km in 1973 [23,48]. The rivers that inflow to Lake Issyk-Kul originated from glaciers and snowfields in the Tien Shan Mountains [49]. In addition, the annual replenishment of surface water and groundwater to Lake Issyk-Kul is approximately 1.3 × 10⁹ m3 and 2.0 × 10⁹ m3, respectively [50].
The climatic conditions in the Issyk-Kul Lake Basin are mostly continental with a mild and dry climate throughout the year. Based on the meteorological observation data, the average temperature is 19–20 °C in July and 2–3 °C in January [51]. The annual total precipitation varies dramatically over different regions of the basin, increasing from west to east [52]. For example, the annual precipitation ranges 255–258 mm in the central area of the valley and 300–400 mm in the eastern valley [53]. In alpine regions, the annual precipitation increases from 300–400 mm in the east to 800–900 mm in the west [23].

2.2. Data

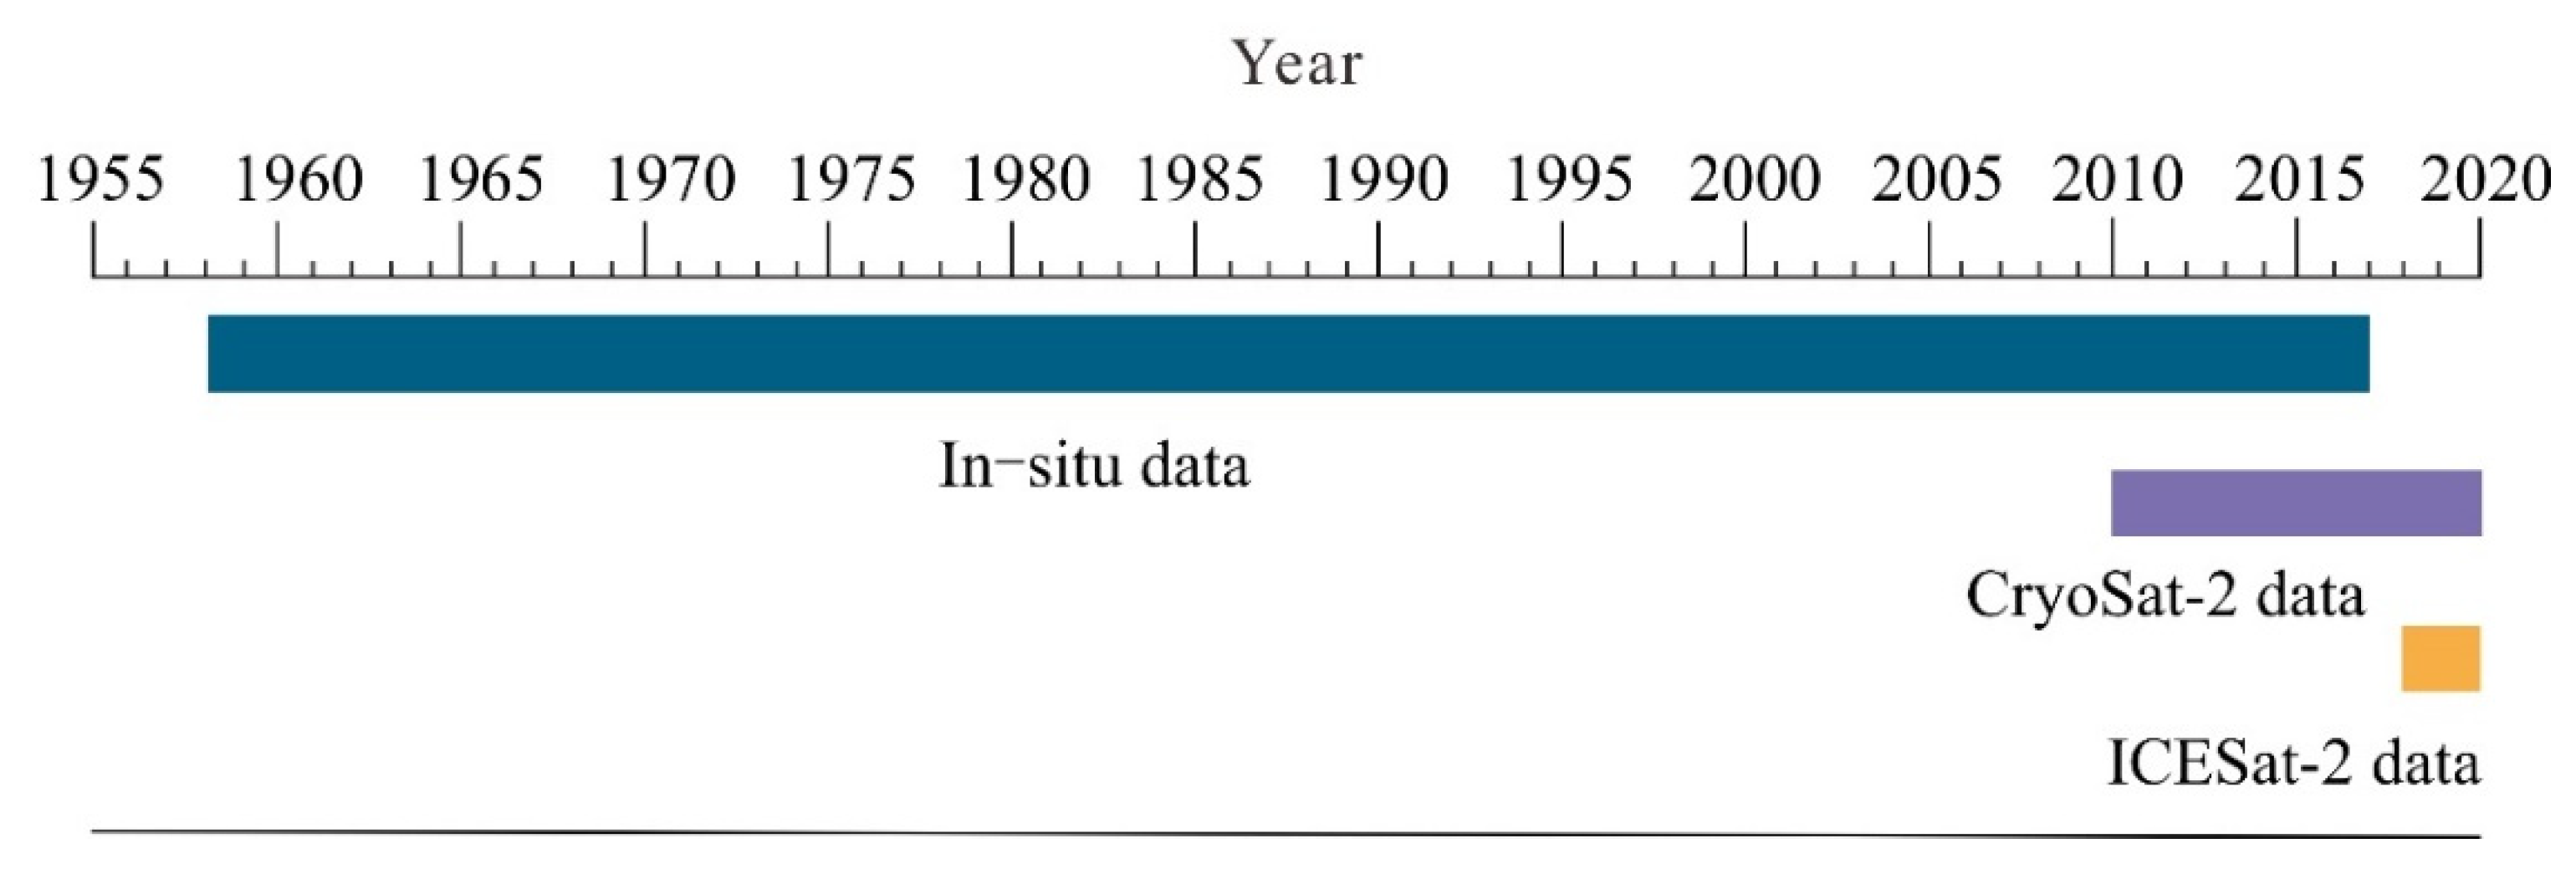
2.2.1. Lake Level Dataset

The lake level time series data (m above mean sea level) of Lake Issyk-Kul were obtained from in situ data, CryoSat-2, and ICESat-2. The main characteristics of the two satellite missions are shown in Table 1 [54,55,56]. CryoSat-2 is one of the missions of the Earth Exploration Program developed by the European Space Agency (ESA). SIRAL is the primary instrument on-board CryoSat-2, which operates in three modes, i.e., low-resolution mode (LRM), synthetic aperture mode (SAR), and SAR interferometric mode (SARIn). Cryosat-2/SIRAL contains four data products. The Level 2 GDR product includes measurement time, latitude, longitude, and height information that can be downloaded from EO-CAT, a Next Generation Earth Observation system (https://eocat.esa.int/sec/#data-services-area, accessed on 18 October 2021) [56]. In the latest updated GDR product, the LRM mode data applied 3 waveform retracking algorithms: Refined CFI, UCL, and Refined OCOG GDR with a footprint diameter of ~1.65 km on the water surface and an interval of ~300 m [55]. By comparing the number of altitude outliers derived by the three algorithms in Lake Issyk-Kul, the Refined OCOG, which is a tracking method developed by the Mullard Space Science Laboratory that uses an estimate of the pulse width to track the return waveform, was finally used to estimate lake level changes of Lake Issyk-Kul from 2010 to 2020 in this study [57].
ICESat-2, launched in September 2018, continues long-term elevation observations begun by the original ICESat-1 mission with the enhanced Advanced Topographic Laser Altimeter System (ATLAS). The diameter of laser footprints is ~17 m and interleaved by ~0.7 m along the track [54]. The two-beam instrument setting and smaller footprint help it achieve more accurate measurements. Among the data products of ICESat-2, ATL13 is a dataset specifically used for inland water surface height determination; data from 13 October 2018 to 1 January 2020 are available from the National Snow and Ice Data Center (NSIDC; https://nsidc.org/data/icesat-2/products/, accessed on 18 October 2021) [58]. This study applies height information from ATL13 to obtain the lake level data from 2018 to 2020, which can be used for the accuracy validation of overlapping time periods with data derived from Cryosat-2.
The in situ data used in this study was obtained from HYDROLARE (http://hydrolare.net/data_availability.php, accessed on 18 October 2021), which provides the water level data of Lake Issyk-Kul updated to 2017, with missing data for 1998 and 1999. The composition of water level data is shown in Figure 2.

2.2.2. Lake Area Dataset

The lake area time-series data of Lake Issyk-Kul were derived from JRC Monthly Water History, v1.3 dataset (https://developers.google.com/earth-engine/datasets/catalog/JRC_GSW1_3_GlobalSurfaceWater, accessed on 18 October 2021) and verified by the GEE-based Landsat datasets composed of the USGS Landsat 8 Surface Reflectance Tier 2 dataset (https://developers.google.com/earthengine/datasets/catalog/LANDSAT_LC08_C02_T1_L2, L8SRT2, accessed on 18 October 2021), the USGS Landsat 7 Surface Reflectance Tier 2 dataset (https://developers.google.com/earthengine/datasets/catalog/LANDSAT_LE07_C01_T2_SR, L7SRT2, accessed on 18 October 2021), and the USGS Landsat 5 Surface Reflectance Tier 2 dataset (https://developers.google.com/earthengine/datasets/catalog/LANDSAT_LT05_C01_T2_SR, L5SRT2, accessed on 18 October 2021) using the mNDWI and OTSU image segmentation algorithm. The specific descriptions of datasets are presented in Table 2. The JRC dataset shows the temporal and spatial changes of surface water over the years; every pixel is discriminated as water or non-water one by one through the expert system, and the final results are recorded as monthly historical data for the entire time period between 16 March 1984 and 31 December 2020. The Landsat datasets have been atmospherically corrected using the Land Surface Reflectance Code (LaSRC) and the Landsat ecosystem disturbance adaptive processing system (LEDAPS). Moreover, these data were also produced using the C Function of Mask (CFMASK) to improve the data quality [59].

2.2.3. Meteorological Data

The meteorological stations in the Issyk-Kul basin were established at different times and are located at different elevations and latitudes, with some stations changing location several times [24]. Each meteorological station provides observations for different periods of time, which makes it difficult to obtain comprehensive long-term continuous meteorological observations for the entire basin. Therefore, the annual temperature, annual total precipitation, and annual total evaporation during 1958–2020 were derived from ERA5-Land monthly averaged data (https://www.ecmwf.int/en/forecasts/datasets/reanalysis-datasets/era5, accessed on 18 October 2021). ERA5-Land is a reanalysis dataset providing a consistent view of the evolution of land variables over several decades at an enhanced resolution of 0.1° × 0.1° compared to ERA5 [61,62].

2.2.4. Glacier Data

The glacier data of the Issyk-Kul Lake Basin in 2002 were obtained from the Randolph Glacier Inventory (RGI) 6.0 published by Global Land Ice Measurements from Space (GLIMS, http://www.glims.org/RGI/, accessed on 18 October 2021) [63]. The glacier data in 2015 were derived in this study. There are numerous debris-covered glaciers distributed in the Issyk-Kul Lake Basin, which are difficult to identify through automatic classification. Therefore, the glaciers in 2015 were manually delineated based on the Landsat images, and the unrecognizable parts were identified by higher-resolution Google Earth images. Afterward, the glacier area was calculated on the WGS84 spheroid in an Albers equal-area map projection. The glacier volume was estimated by the volume-area (V-A) scaling method based on empirical parameters proposed by Radić and Hock (2010) [64].

2.2.5. Other Relevant Data
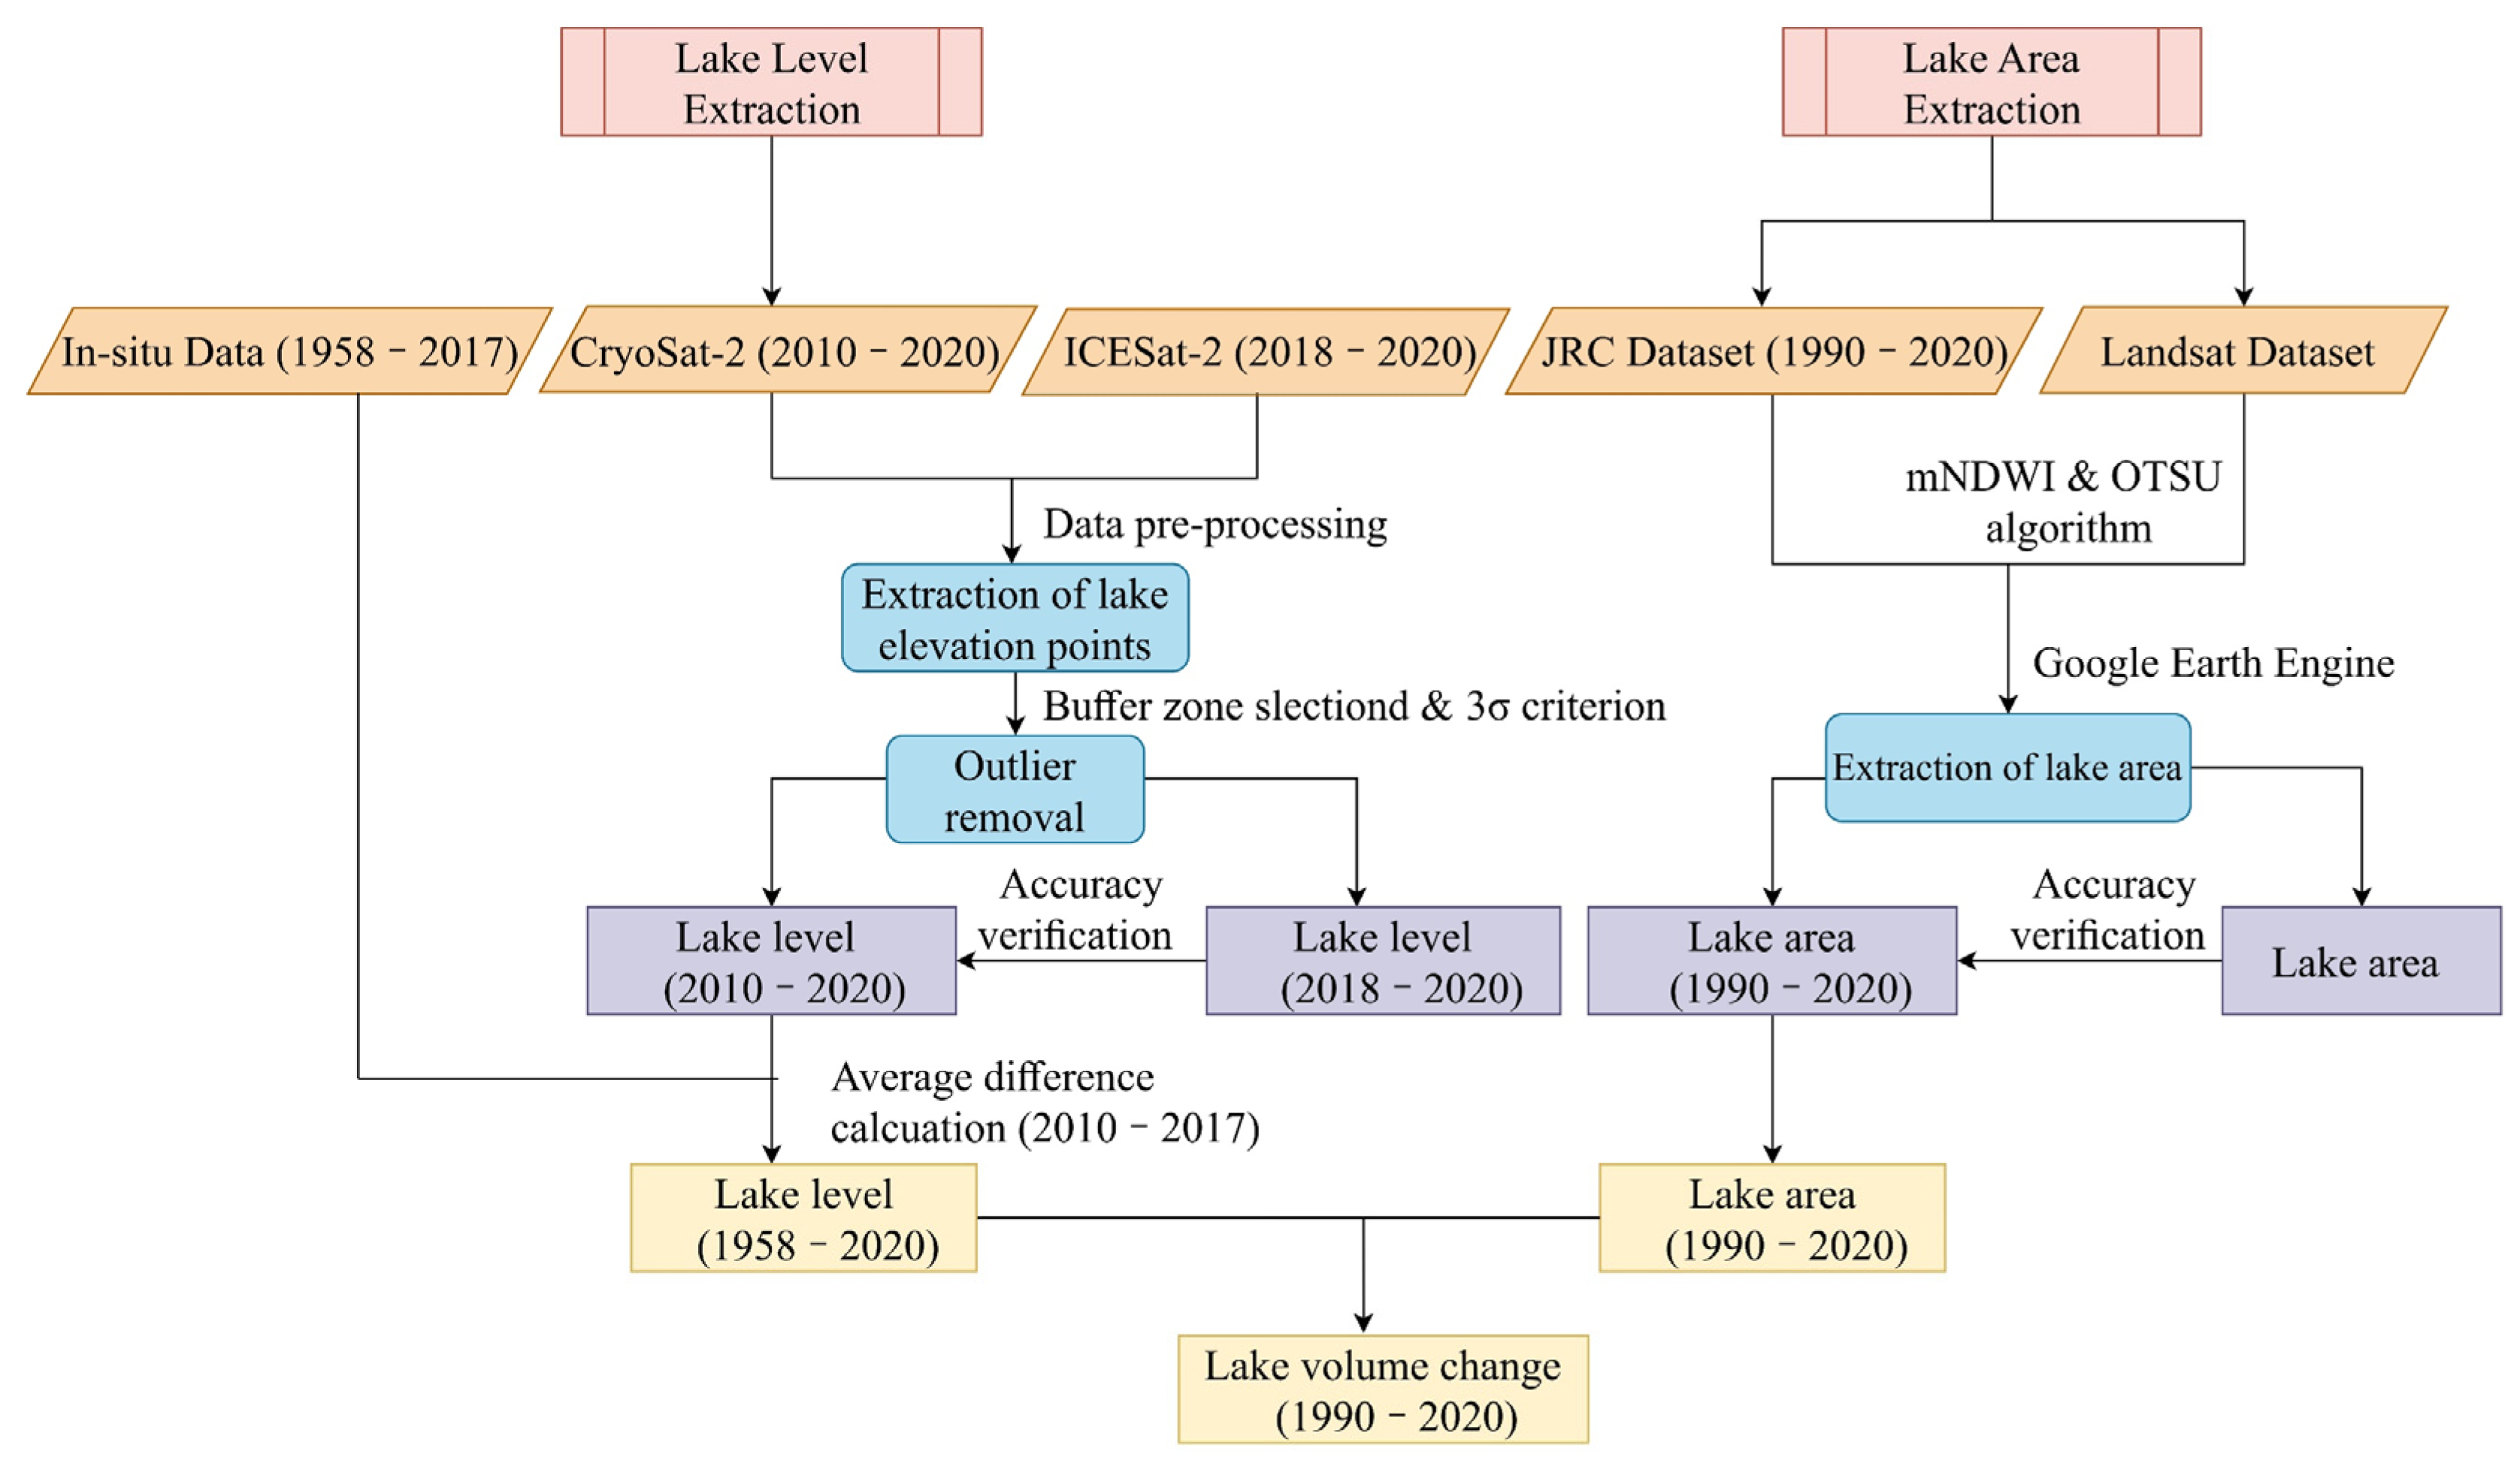
The extent of the water body used in this study was obtained from Global Lakes and Wetlands Database (GLWD). The cropland data of 2020 were from the Globalland30 dataset published by the Ministry of Natural Resources of the People’s Republic of China (http://www.globallandcover.com/, accessed on 18 October 2021).

2.3. Methods

The methods of both lake level and area extraction and the volume estimation in this study are shown in Figure 3.

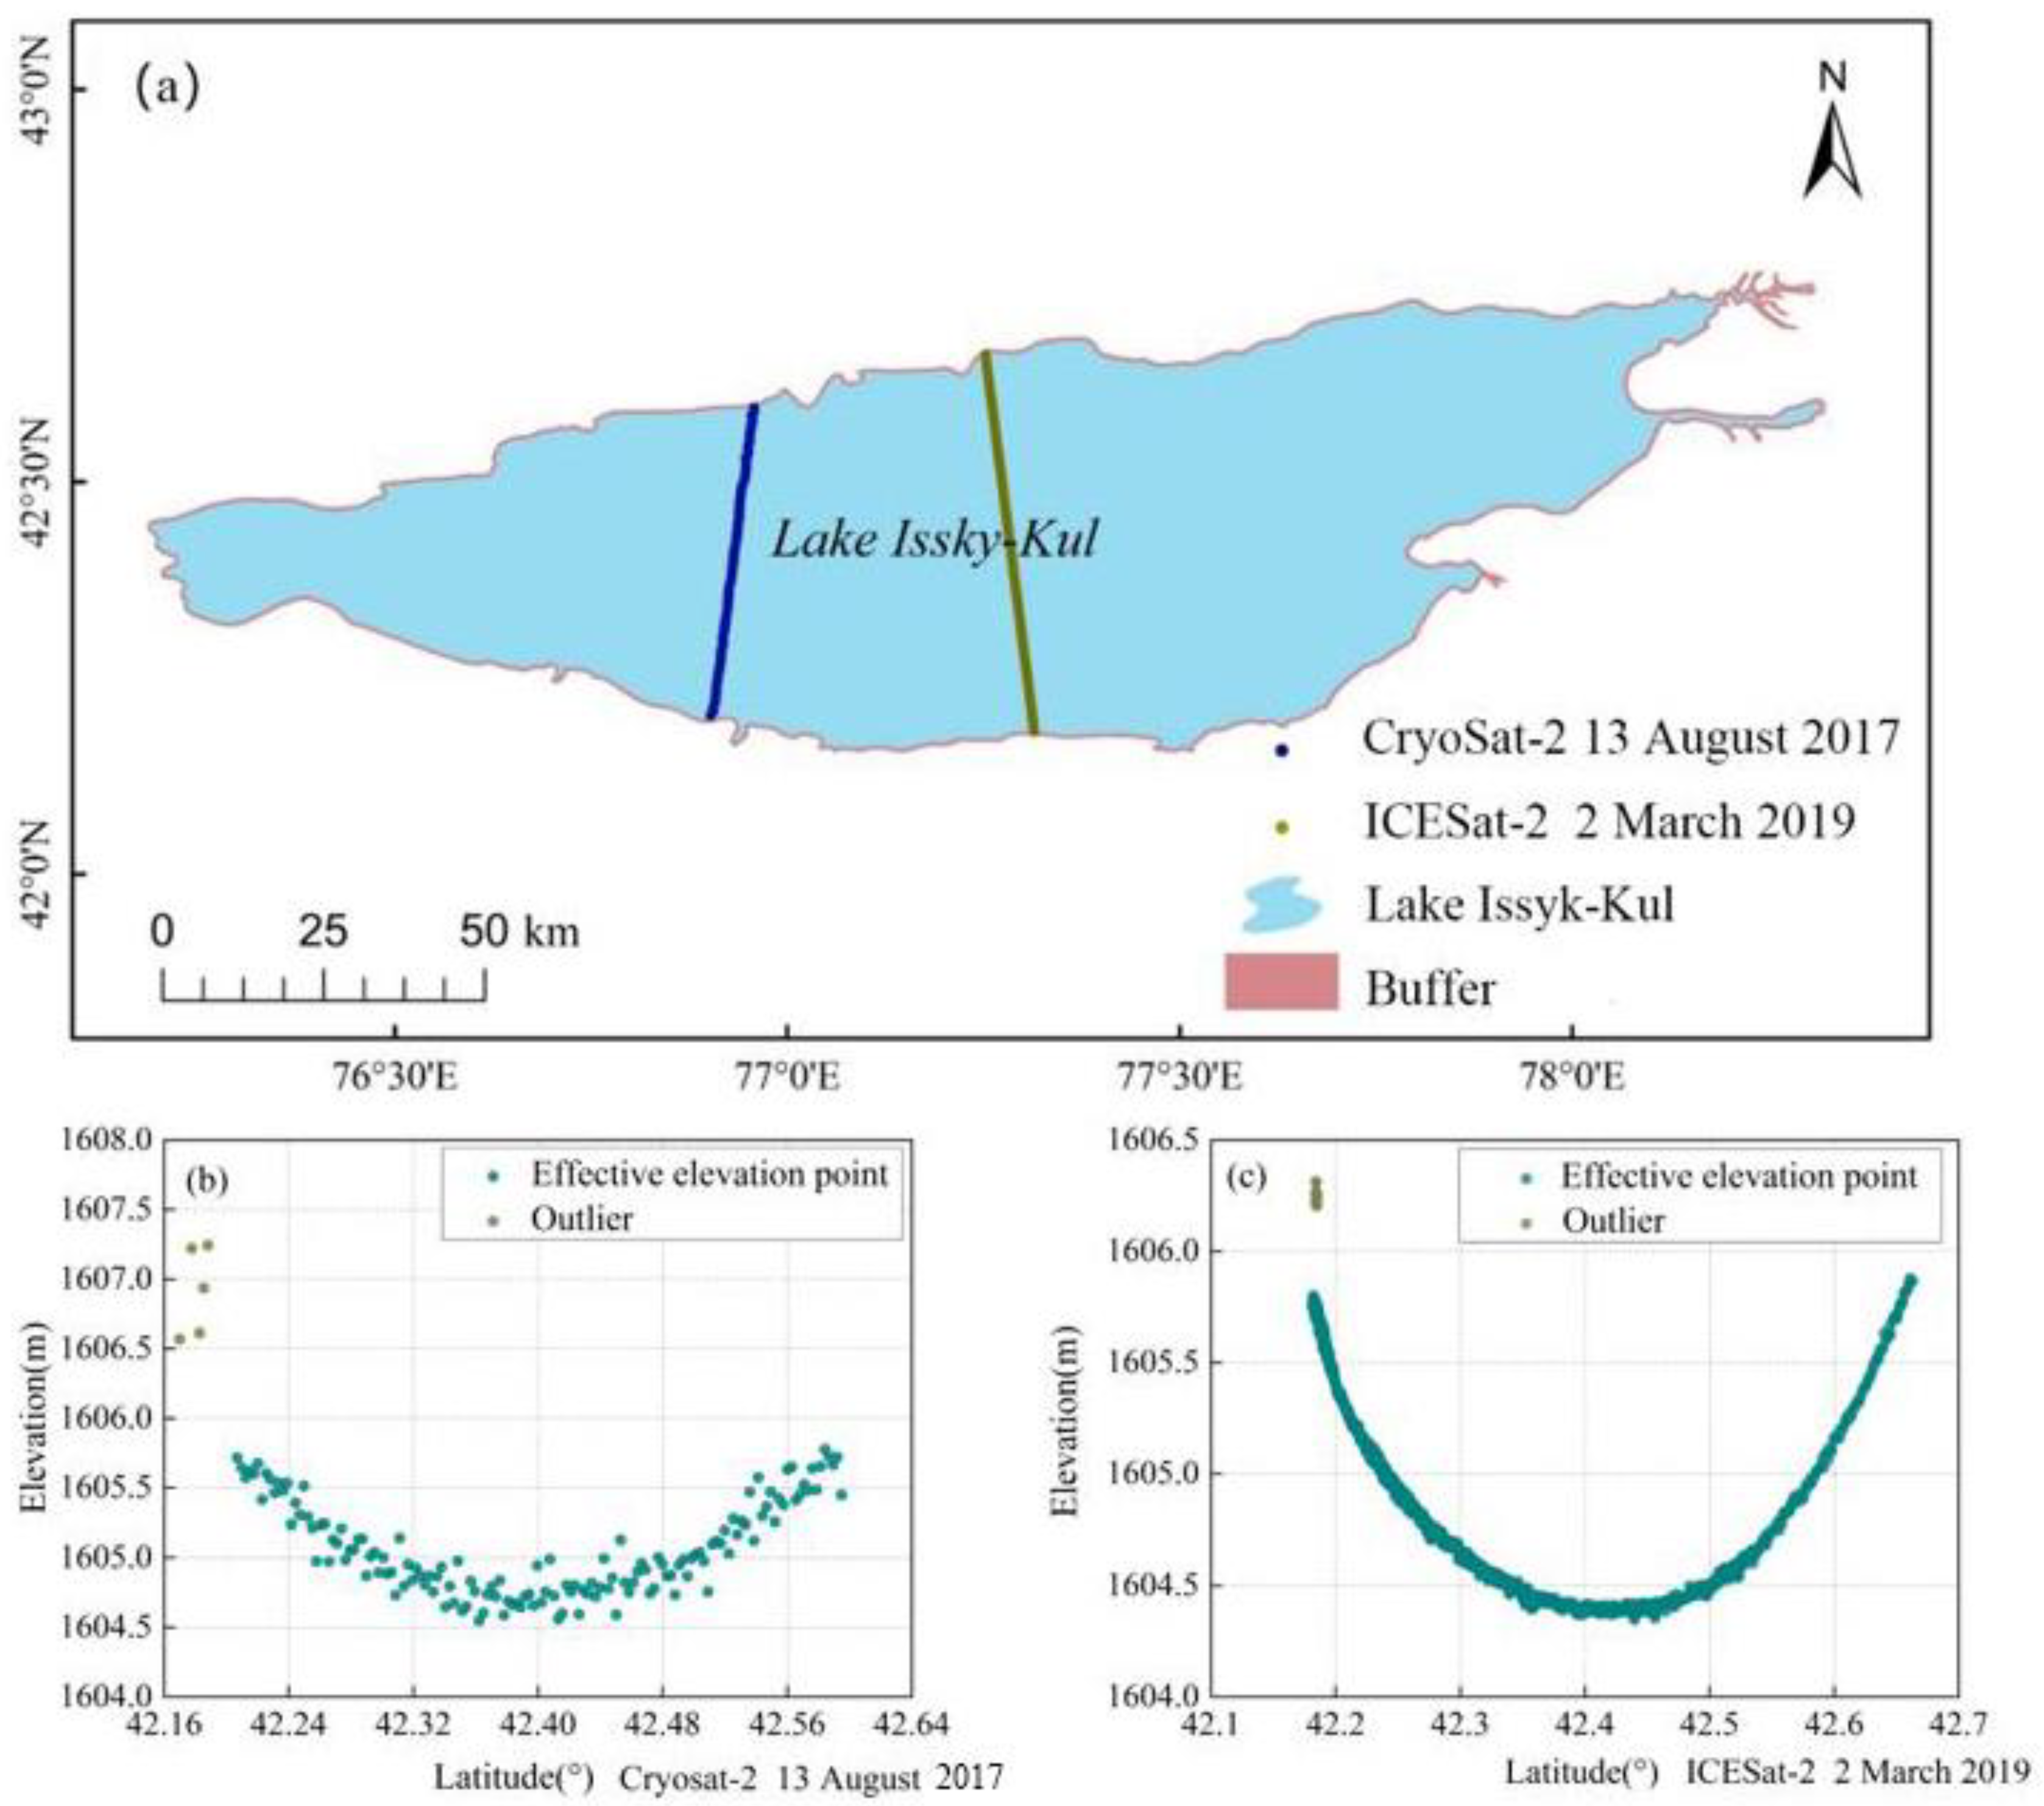
2.3.1. Lake Level Extraction

1.
Satellite altimetry data pre-processing
The scattering or refraction of the CryoSat-2 satellite radar pulse signal in the propagation process will affect its propagation speed and delay the round-trip time of the observation signal. Moreover, affected by natural factors, the distance estimated may be biased, therefore, various deviations need to be corrected. The calculation formula of the lake level is as follows:
H = H a l t R c N ,
where H is the orthometric height based on the EGM96 geoid, H a l t is the height from the satellite’s centroid to the WGS-84 reference ellipsoid, R is the distance from the satellite to the lake surface, c is the correction, and N is the difference between the local geoid and the EGM96 geoid, which can be calculated by the geoid height function in MATLAB.
Compared with ICESat-1, the reference ellipsoid of ICESat-2 has changed from T/P to WGS84, so its calculation formula is basically the same as CryoSat-2, and the elevation measurement results can be directly compared with CryoSat-2.
2.
Outlier removal
To ensure the validity of the data, it is necessary to filter out all the outliers of the water level to extract the time series. The specific removal steps are as follows:
First, a 200 m buffer zone from the lake boundary to the center of the lake was established, and satellite footprint points were filtered based on the buffer zone to make sure the points completely fall into the lake, thereby avoiding interference from elevation points that may touch the lake shore.
Second, all points were manually filtered to eliminate outliers that are tens or even hundreds of meters away from most water level values (Figure 4).
Third, the 3σ criterion was adopted to eliminate the outliers in the data within a day, and then the remaining effective values were averaged as the daily lake level. The results are shown in Figure 5, taking Cysosat-2 data on 13 August 2017 (Figure 5b) and ICESat-2 data on 2 March 2019 (Figure 5c) as examples. The usability of the 3σ criterion has been proven in the application of large lakes with enough footprints [65].
Finally, the overall screening of all daily water levels was operated by the 3σ criterion to further obtain the monthly average water level and the annual average water level.
3.
Multi-source water level data merging
As shown in Figure 3, the time series of water levels are synthesized by in situ data, CryoSat-2 products, and ICESat-2 missions. However, as the satellite altimetry data and the in situ hydrological data are referenced to WGS-84 and Baltic systems, respectively, the conversion of the elevation system must be completed first. According to the average difference between the water level obtained by CryoSat-2 and the in situ observations during the overlapping time periods, the altimetric data were converted into the same reference system as in situ data, thereby obtaining the lake level of Lake Issyk-Kul from 1958 to 2020.

2.3.2. Lake Area Extraction

Considering that the water level of Lake Issyk-Kul was at a relatively stable high value in August during the year, we selected remote sensing images of August from the JRC datasets based on the GEE to analyze long-term area variation patterns of Lake Issyk-Kul in the past three decades. For the years when the area in August cannot be obtained due to poor image quality, the images of the adjacent months were utilized as substitutes. The lake area extracted automatically is affected by some redundant elements such as rivers and beaches, so the lake boundaries derived from remote sensing images were further manually modified to improve accuracy.

2.3.3. Accuracy Verification

The assessment of water level data contains absolute verification and relative verification. The absolute verification refers to verifying CryoSat-2 data with in situ data, while relative verification means evaluating CryoSat-2 data through higher-precision ICESat-2 data. Before the accuracy evaluation, the CryoSat-2 data and ICESat-2 data have been converted by the method introduced in Section 2.3.1. The CryoSat-2 and the in situ observations of water level partially overlapped from July 2010 to December 2017 in Lake Issyk-Kul with 88 pairs of overlapping samples and there are also 27 paired samples during the overlap period of CryoSat-2 and ICESat-2 (from November 2018 to December 2020). Four statistical indices were selected for accuracy assessment, including the corresponding p-value (p), Pearson correlation coefficient (CC), Mean Absolute Error (MAE), and Root Mean Square Error (RMSE).
Moreover, we used a modified normalized difference water index (mNDWI) and a maximum between-cluster variance (OTSU) image segmentation algorithm to extract the lake area from the Landsat datasets based on the Google Earth Engine. The results were used as validation data to evaluate the accuracy of the area extracted by the JRC datasets. The mNDWI has been widely used to discriminate water bodies from other land surfaces [66]. It can be expressed as:
m N D W I = ρ G r e e n ρ M I R ρ G r e e n + ρ M I R
where ρ M I R and ρ G r e e n represent the middle-infrared and green bands, respectively.

2.3.4. Estimation of Water Volume Change

Changes in water volume are determined by both lake area and water level. In this study, we used an estimation equation to calculate the variations in water volume [67,68,69]. The estimation equation is as follows:
V = 1 3 × H × S 1 + S 2 + S 1 × S 2
where V represents the water volume change, H represents the lake level change during the two periods, and S 1 and S 2 represent the lake area for two periods.

3. Results

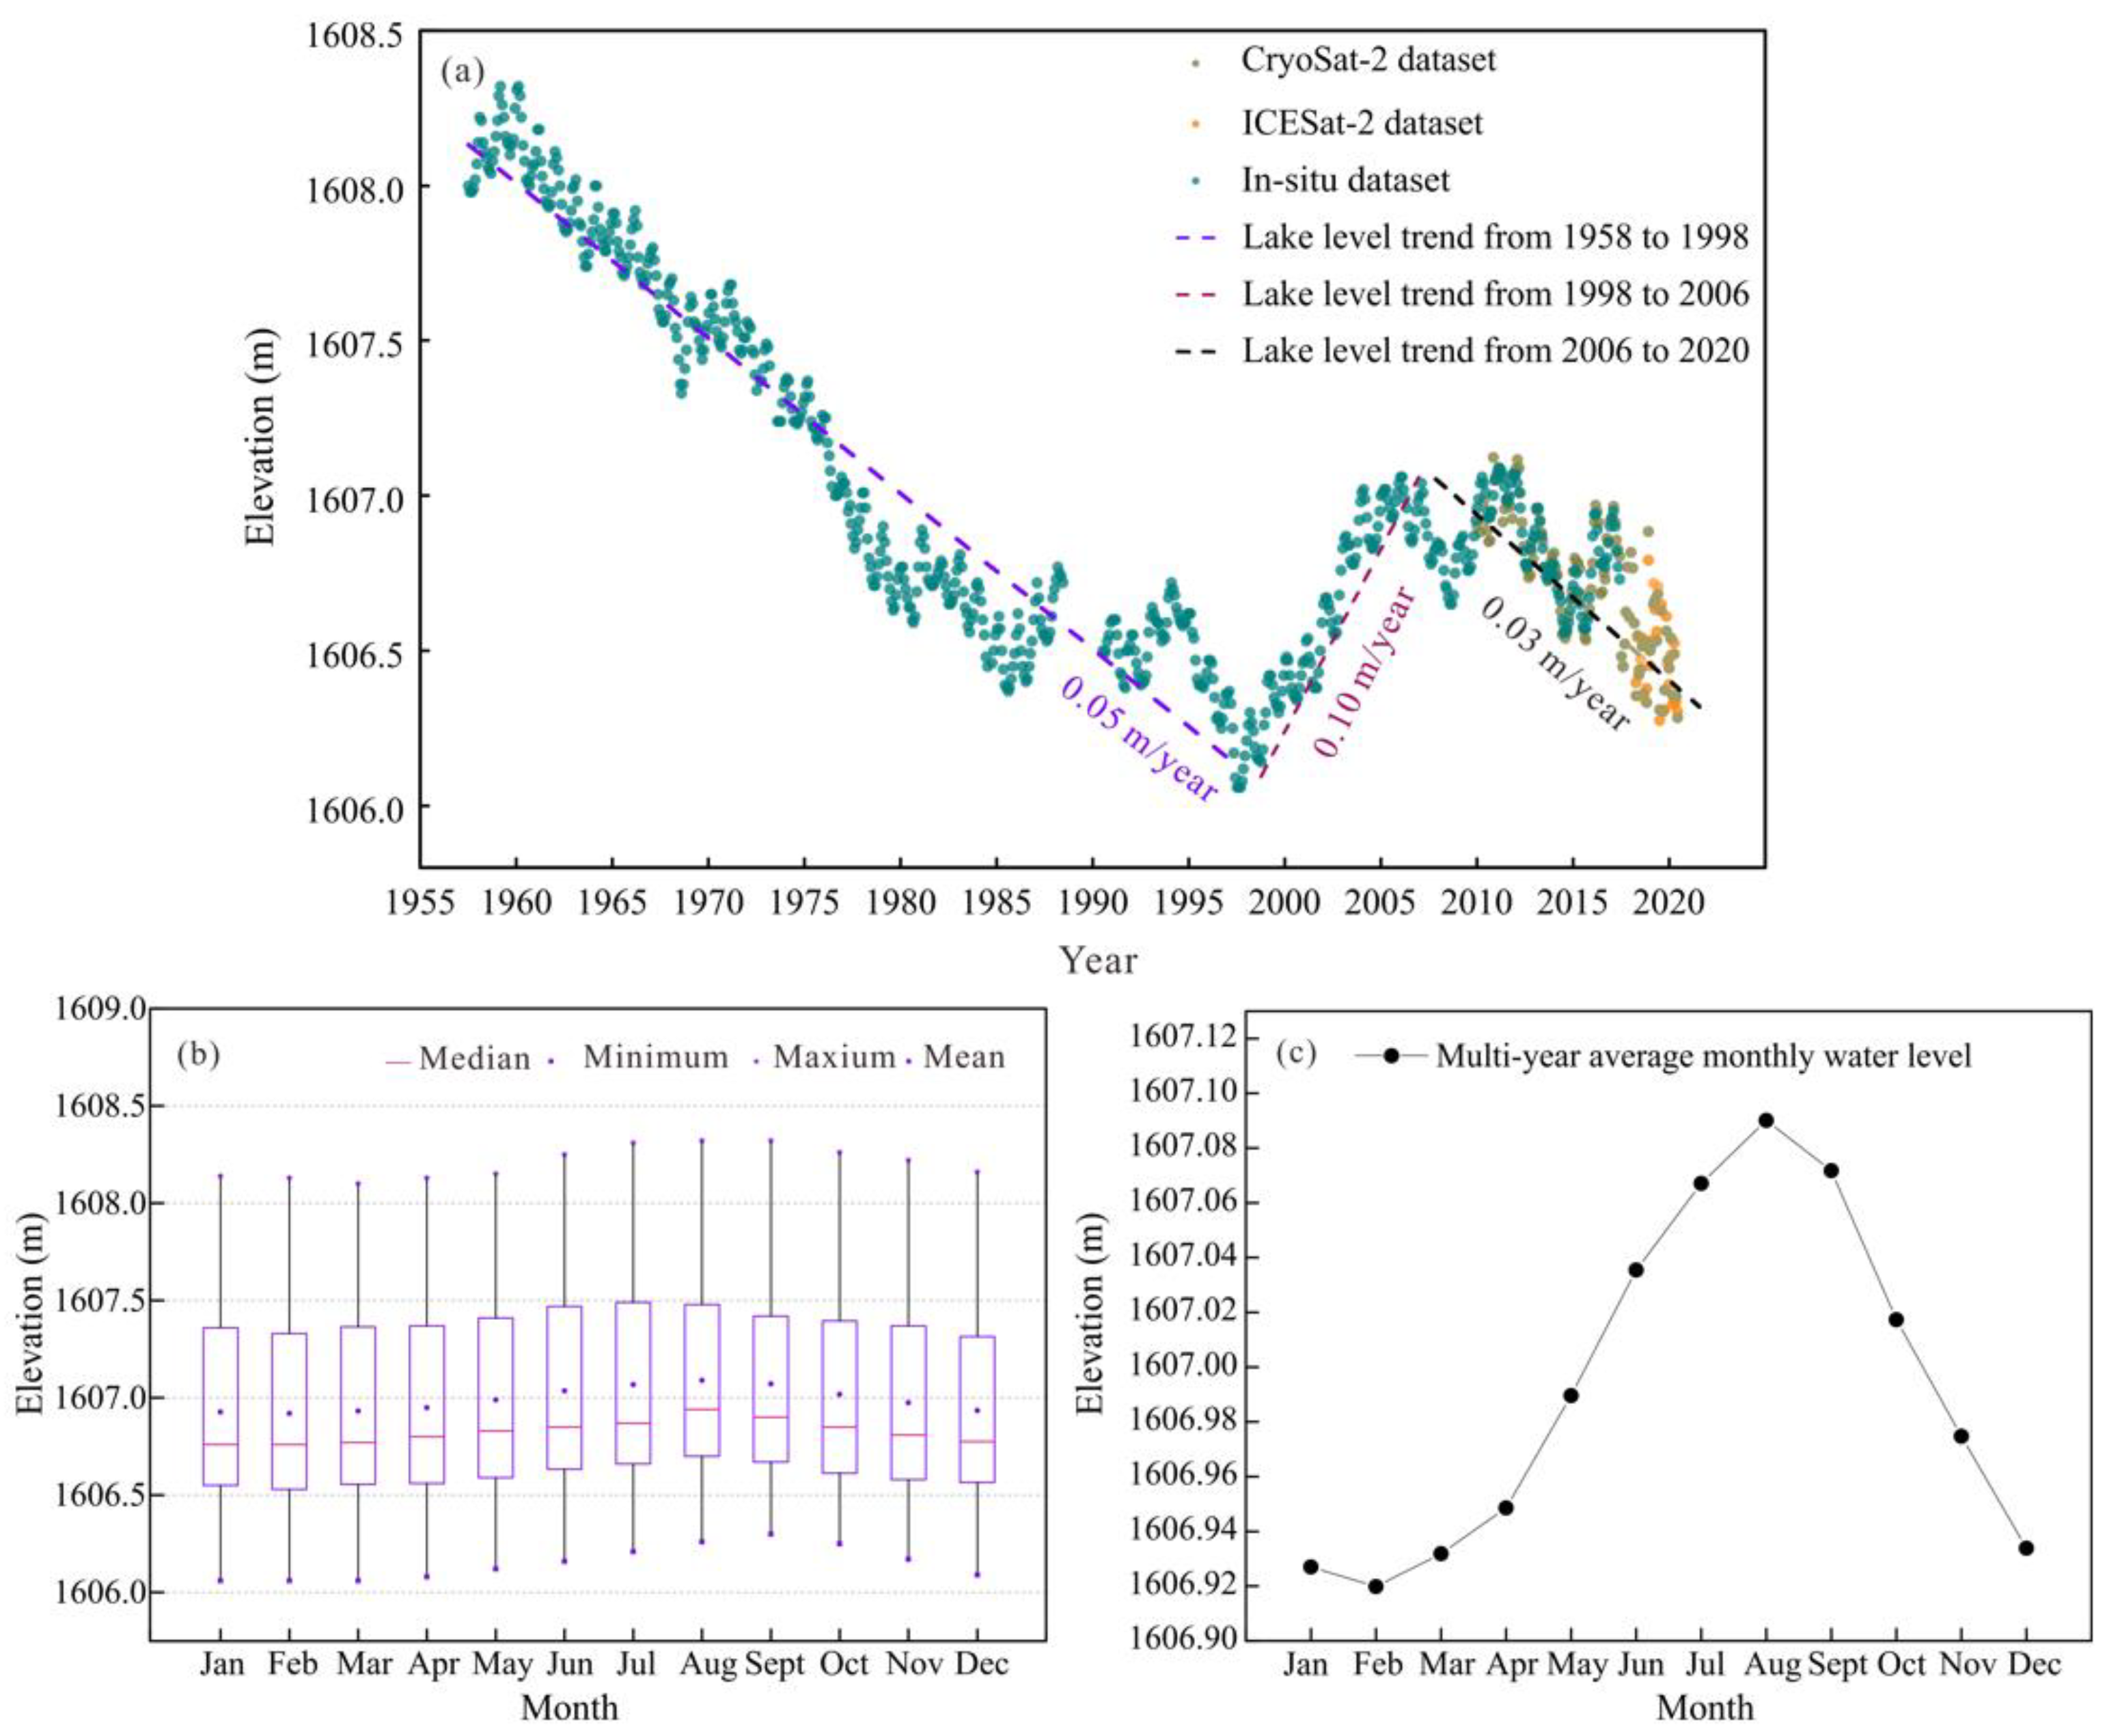
3.1. Variations in the Water Level of Lake Issyk-Kul

Based on the in situ observations, the CyroSat-2 dataset, and the ICESat-2 dataset, the temporal variations in the water level of Lake Issyk-Kul over the period of 1958 to 2020 are shown in Figure 6. The Mann–Kendall trend test was used to determine whether a time series has a monotonic upward or downward trend with a p-value lower than 0.01 (<0.01) being statistically significant. The water level of Lake Issyk-Kul dropped from 1608.08 to 1606.55 m, showing a slight decrease of 0.02 m/year on average. A maximum water level of 1608.32 m was observed in September 1959 and a minimum value of 1606.06 m was observed in March 1998. The water level time series presented obviously different tendencies during the three periods of 1958–1998, 1998–2006, and 2006–2020 (Figure 6a). A long-term continuous decline of the water level occurred during the period of 1958–1998, with a significant decrease of 1.91 m at a rate of 0.05 m/year (p < 0.01). From 1998 to 2006, the water level rose rapidly with a cumulative increment of 0.71 m at a rate of 0.10 m/year (p < 0.01). After 2006, the water level exhibited an overall downward trend of 0.03 m/year (p < 0.01) with several short-term oscillations.
The intra-annual variations in the water level of Lake Issyk-Kul indicated relatively regular seasonal variabilities (Figure 6b,c). The water level was relatively stable from January to March, and then gradually increased, reaching the maximum of 1607.09 m in August. Subsequently, the water level exhibited a downward trend until the monthly average value dropped to 1606.93 m in November. In general, the rising trend during the year mainly occurred from May to August, and the lake level fluctuated more drastically in the warm season (April to October) than in the cold season (November to March of the following year).

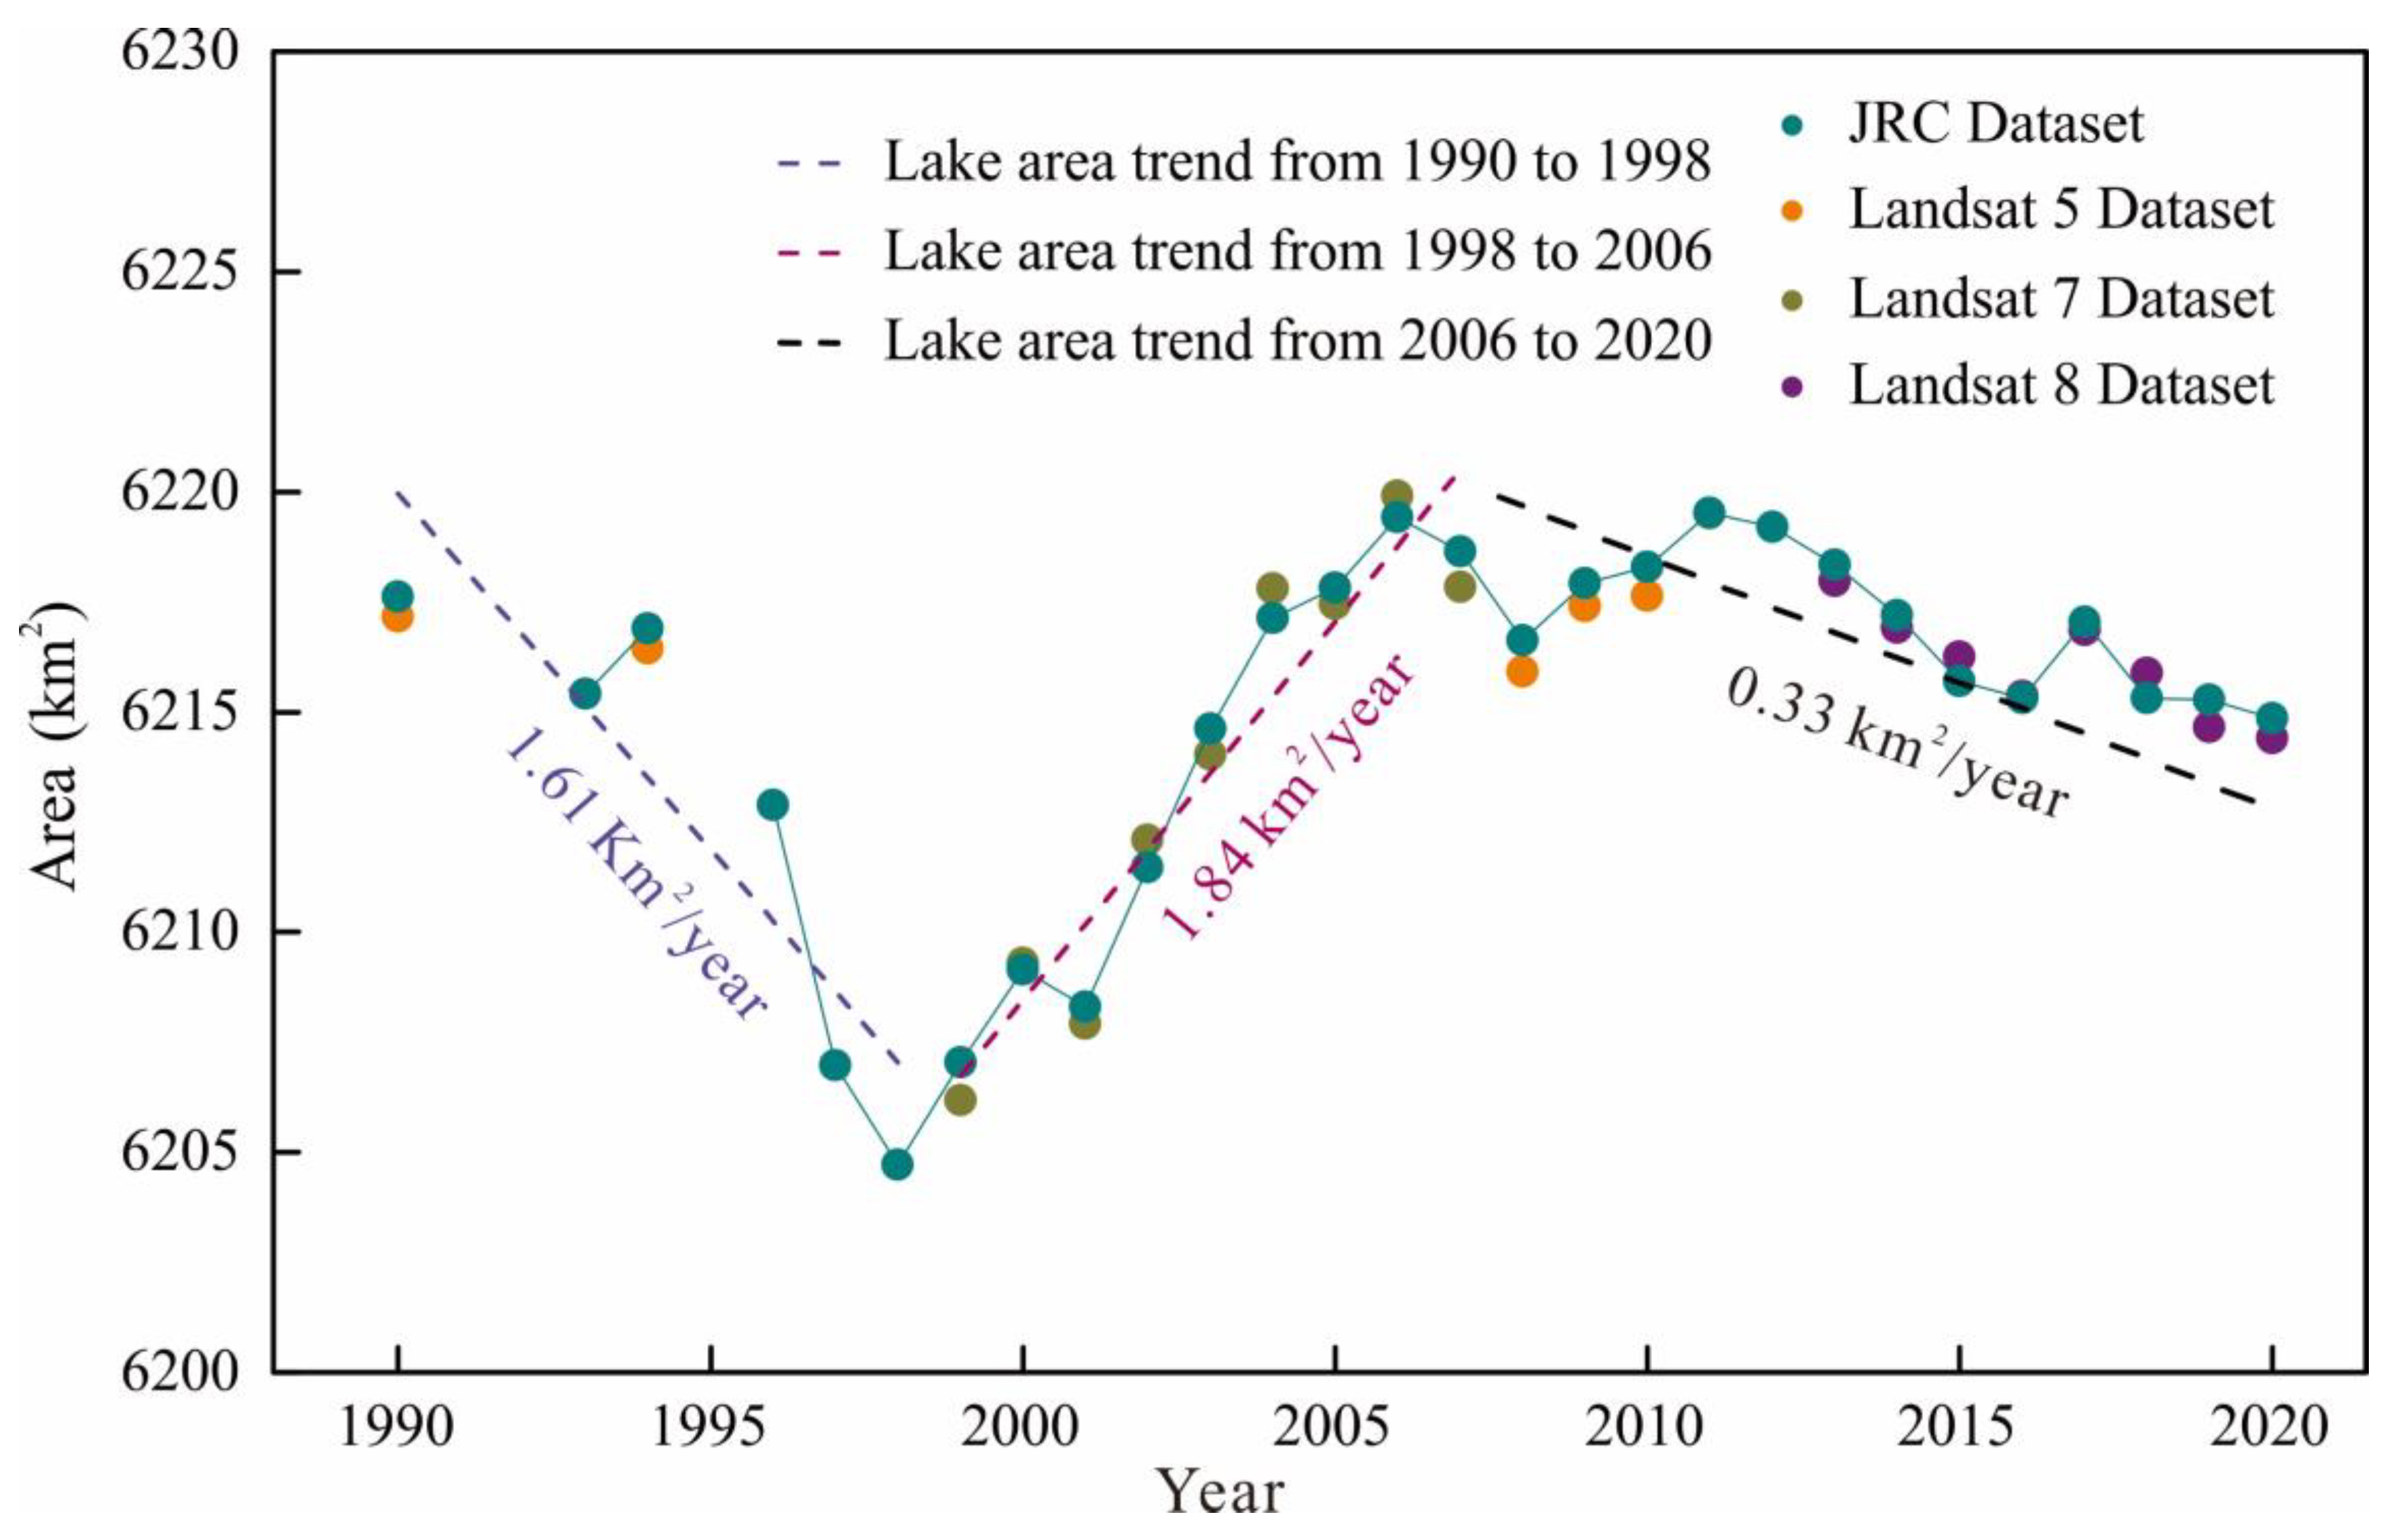
3.2. Variations in Area of Lake Issyk-Kul

According to the relationship between the SRTM DEM and the in situ water level, it can be inferred that the lake area decreased from 6242.85 km2 to 6217.62 km2 during 1958–1990. Owning to the poor quality of satellite images in the 1980s and the inability to fully cover the study area, only part of the effective area data after 1990 can be obtained through Landsat datasets, as shown in Figure 7. From 1990 to 2020, the lake area declined slightly from 6217.62 km2 to 6214.86 km2 at a rate of −0.09 km2/year. It stands out that the smallest lake area appeared in 1998 (6204.71 km2), becoming a turning point in the trend of lake area fluctuation, which was consistent with the findings of previous studies [31]. Between 1990 and 1998, the area of Lake Issyk-Kul reduced dramatically by 1.61 km2/year (p < 0.01) for a total of 12.91 km2, which means the lake shrank by about 0.21% during this period. From 1998 to 2006, the lake area expanded from 6204.71 km2 to 6219.51 km2 at a rate of 1.84 km2/year (p < 0.01). After 2006, the lake area entered a period of shrinkage at an average rate of 0.33 km2/year, accompanied by several short-term fluctuations.

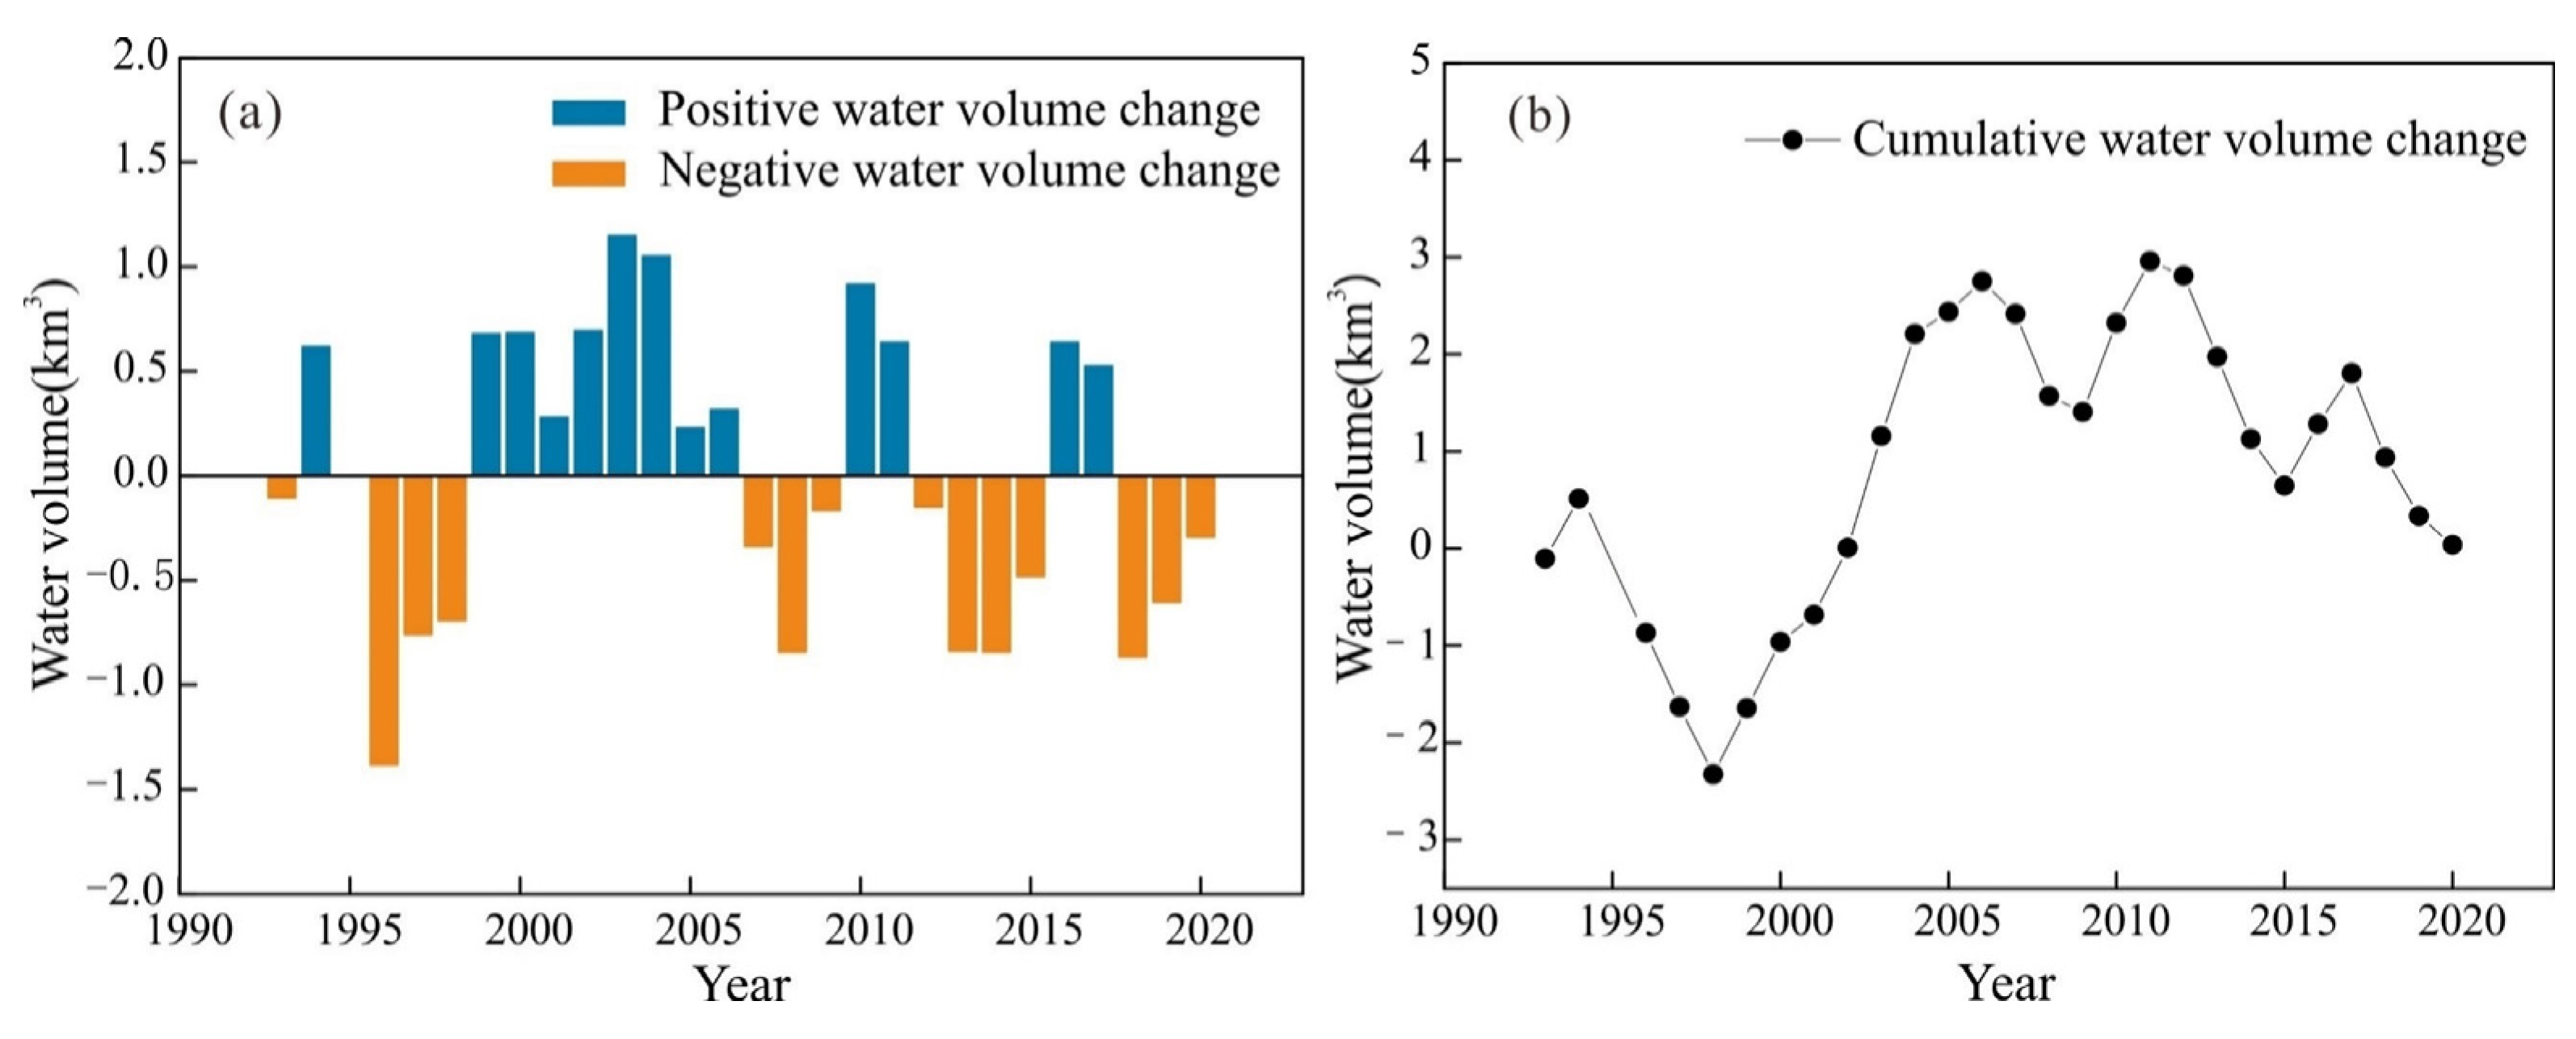
3.3. Variations in the Water Volume of Lake Issyk-Kul

Based on the past area changes and the Equation (3), it was estimated that the water volume of Lake Issyk-Kul dropped by about 9.57 km3 during 1958–1990, and the specific variations after 1990 were pre-sented in Figure 8. From 1990 to 1998, the water volume dropped by about 2.33 km3 at a rate of 0.29 km3/year. Then, the water volume entered a continuous recovery period at a rapid rate of 0.64 km3/year from 1998 to 2006, and the cumulative value of water volume reached 2.75 km3 in 2006. After a short-term decline (2006–2009) and increase (2010–2011) in water volume, the maximum cumulative water volume (2.96 km3) appeared in 2011. During 2011–2020, although temporary upward fluctuations occurred in 2015–2017, the overall water volume experienced a downward trend, the water volume declining by about 2.92 km3 at an average rate of 0.33 km3 /year.

4. Discussion

4.1. Accuracy Verification

In this section, we first evaluate the accuracy of the lake level data derived from CryoSat-2, and then the accuracy of the water area data extracted from the JRC dataset is explored systematically.

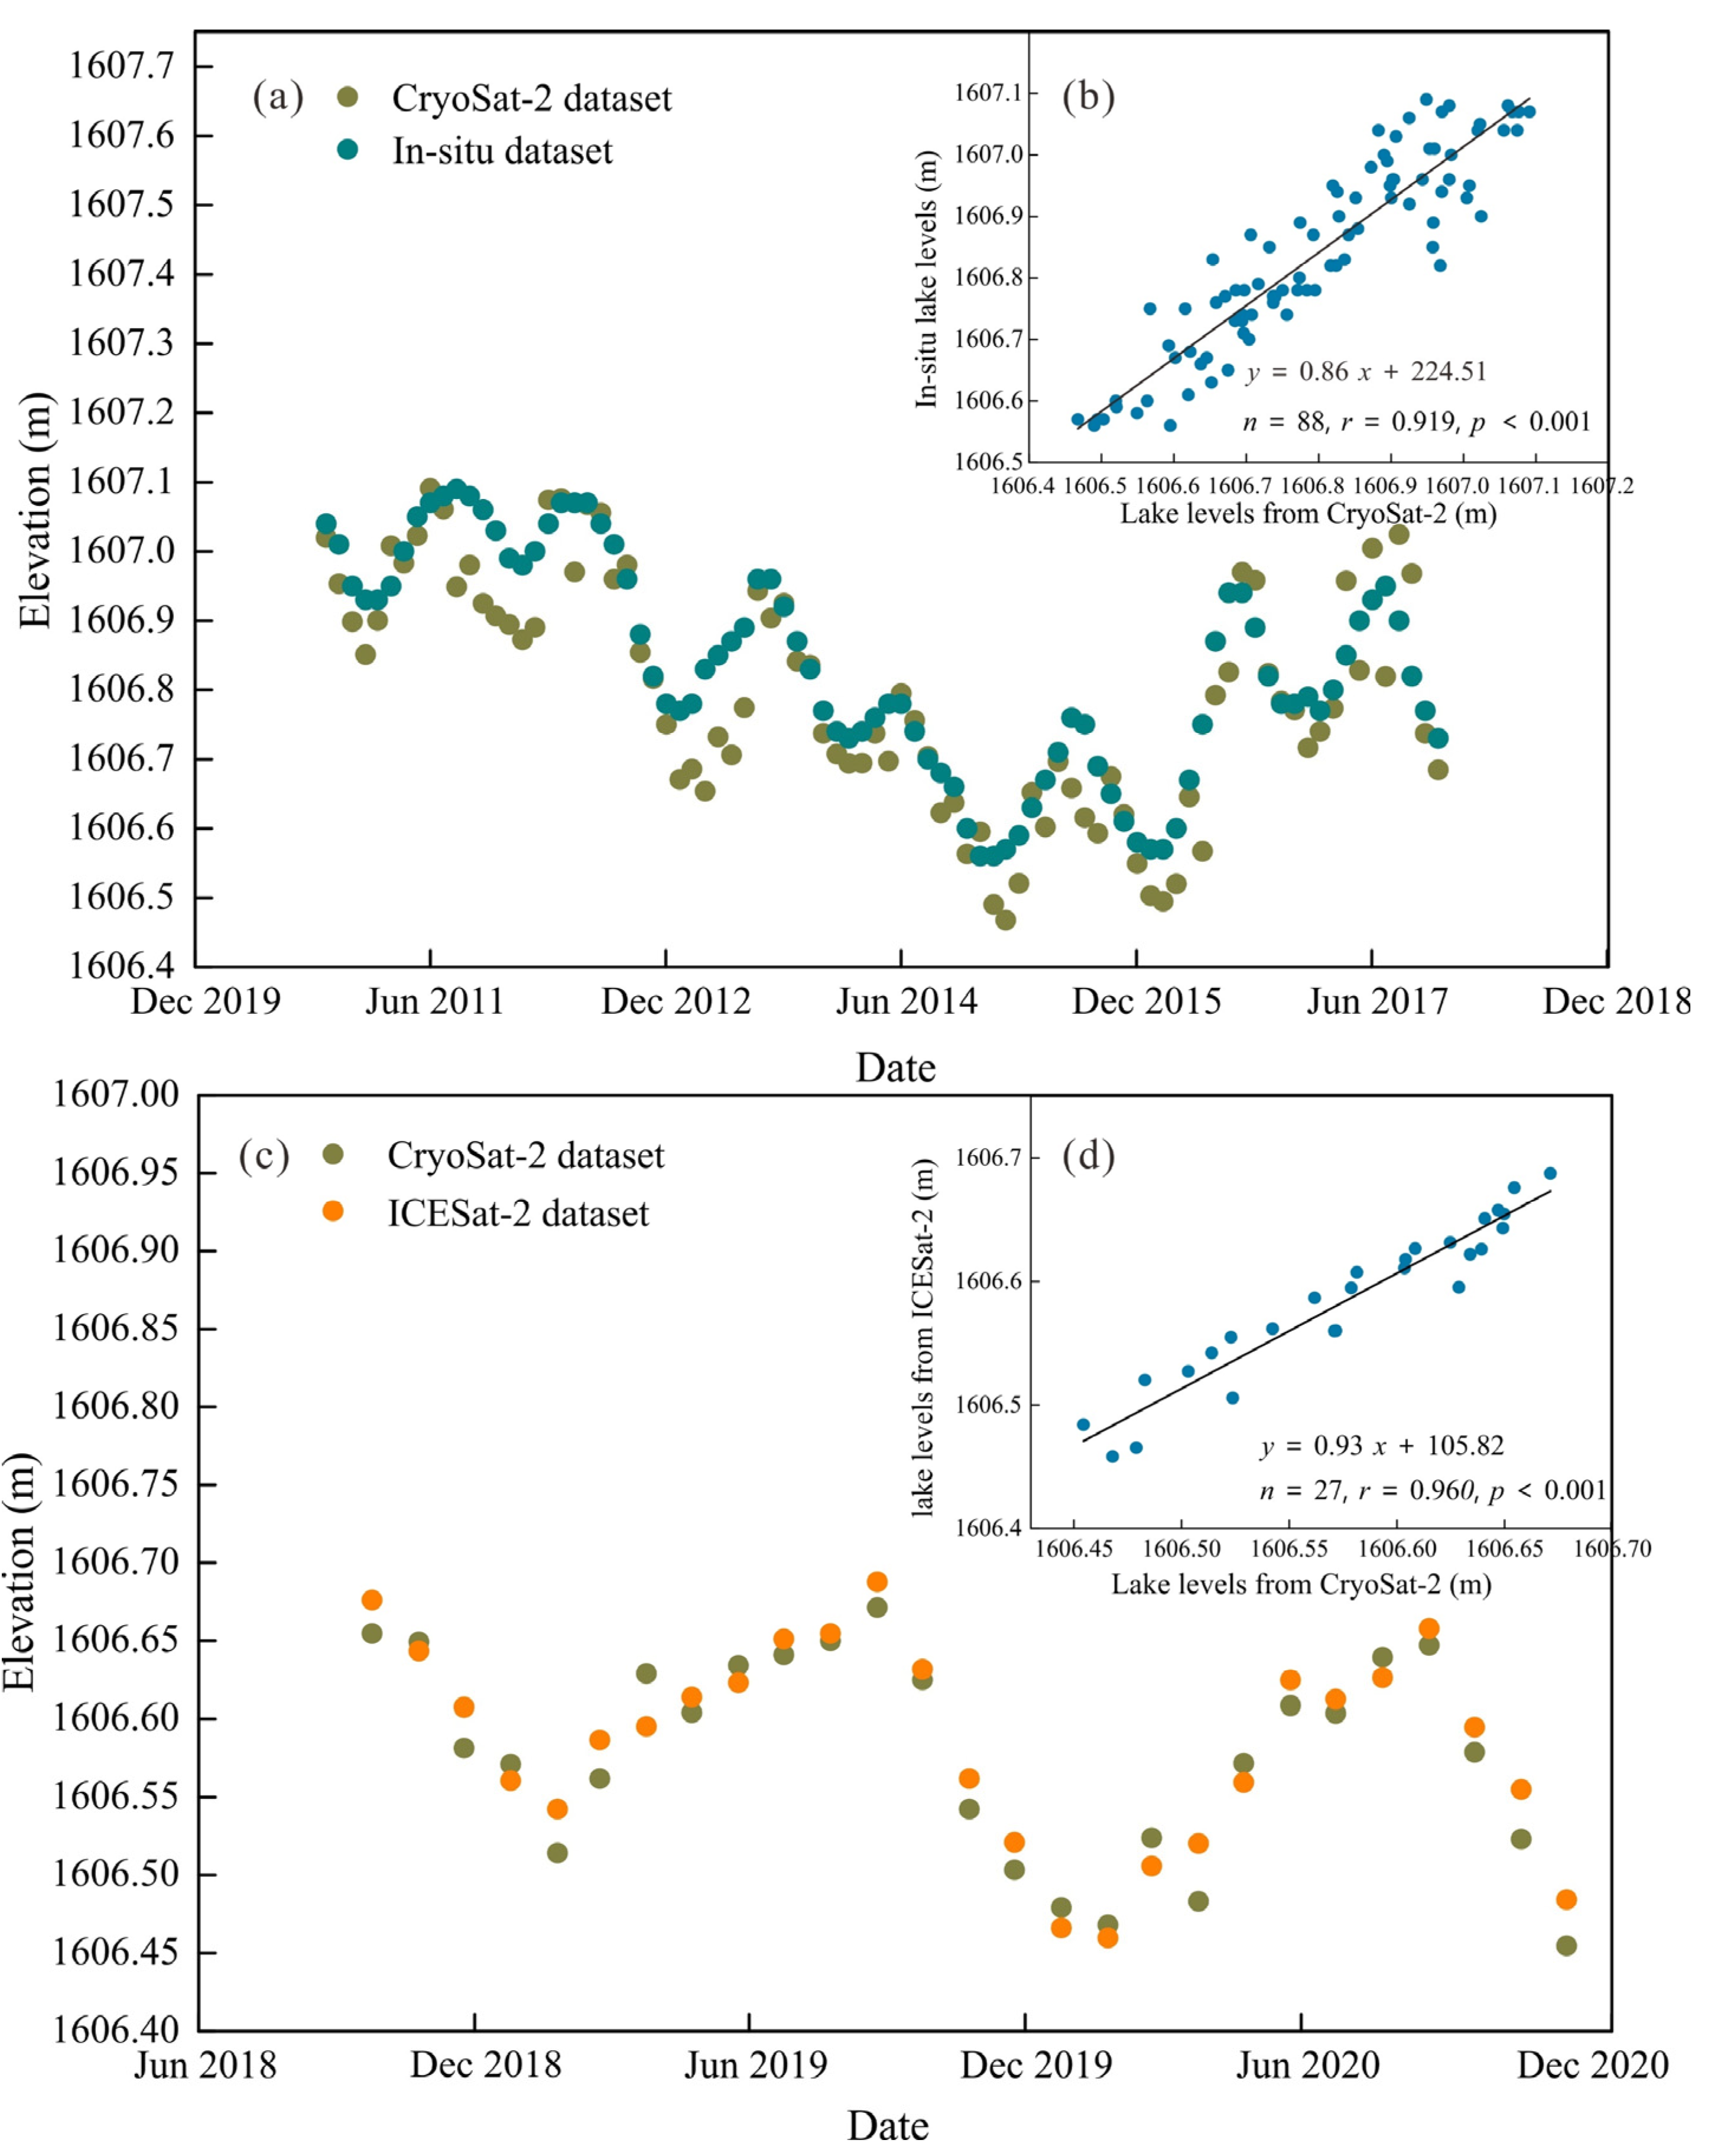
4.1.1. Accuracy Verification of Water Level

As shown in Figure 9a, the CryoSat-2 data are significantly correlated with in situ data. The Pearson correlation coefficient (CC) is 0.919 (Figure 9b), and the mean absolute error (MAE) and root-mean-square error (RMSE) are 0.060 m and 0.075 m, respectively. There is also a good match between CryoSat-2 data and ICESat-2 data (Figure 9c), with a CC of 0.960 (Figure 9d), an MAE of 0.018 m, and an RMSE of 0.020 m. In short, the combination of in situ observations, CryoSat-2 datasets, and ICESat-2 datasets can provide comprehensive and long-term information to monitor the water-level variations of Lake Issyk-Kul. The specific evaluation metrics are listed in Table 3. Several researchers have used ICESat-2 or CryoSat-2 to monitor water levels in various types of lakes, and the results showed that both satellites have great potential to accurately determine lake level changes [3,58,70,71,72]. Our study further demonstrates that combining the two satellites can provide a more accurate exploration of lake levels with higher consistency with in situ data.

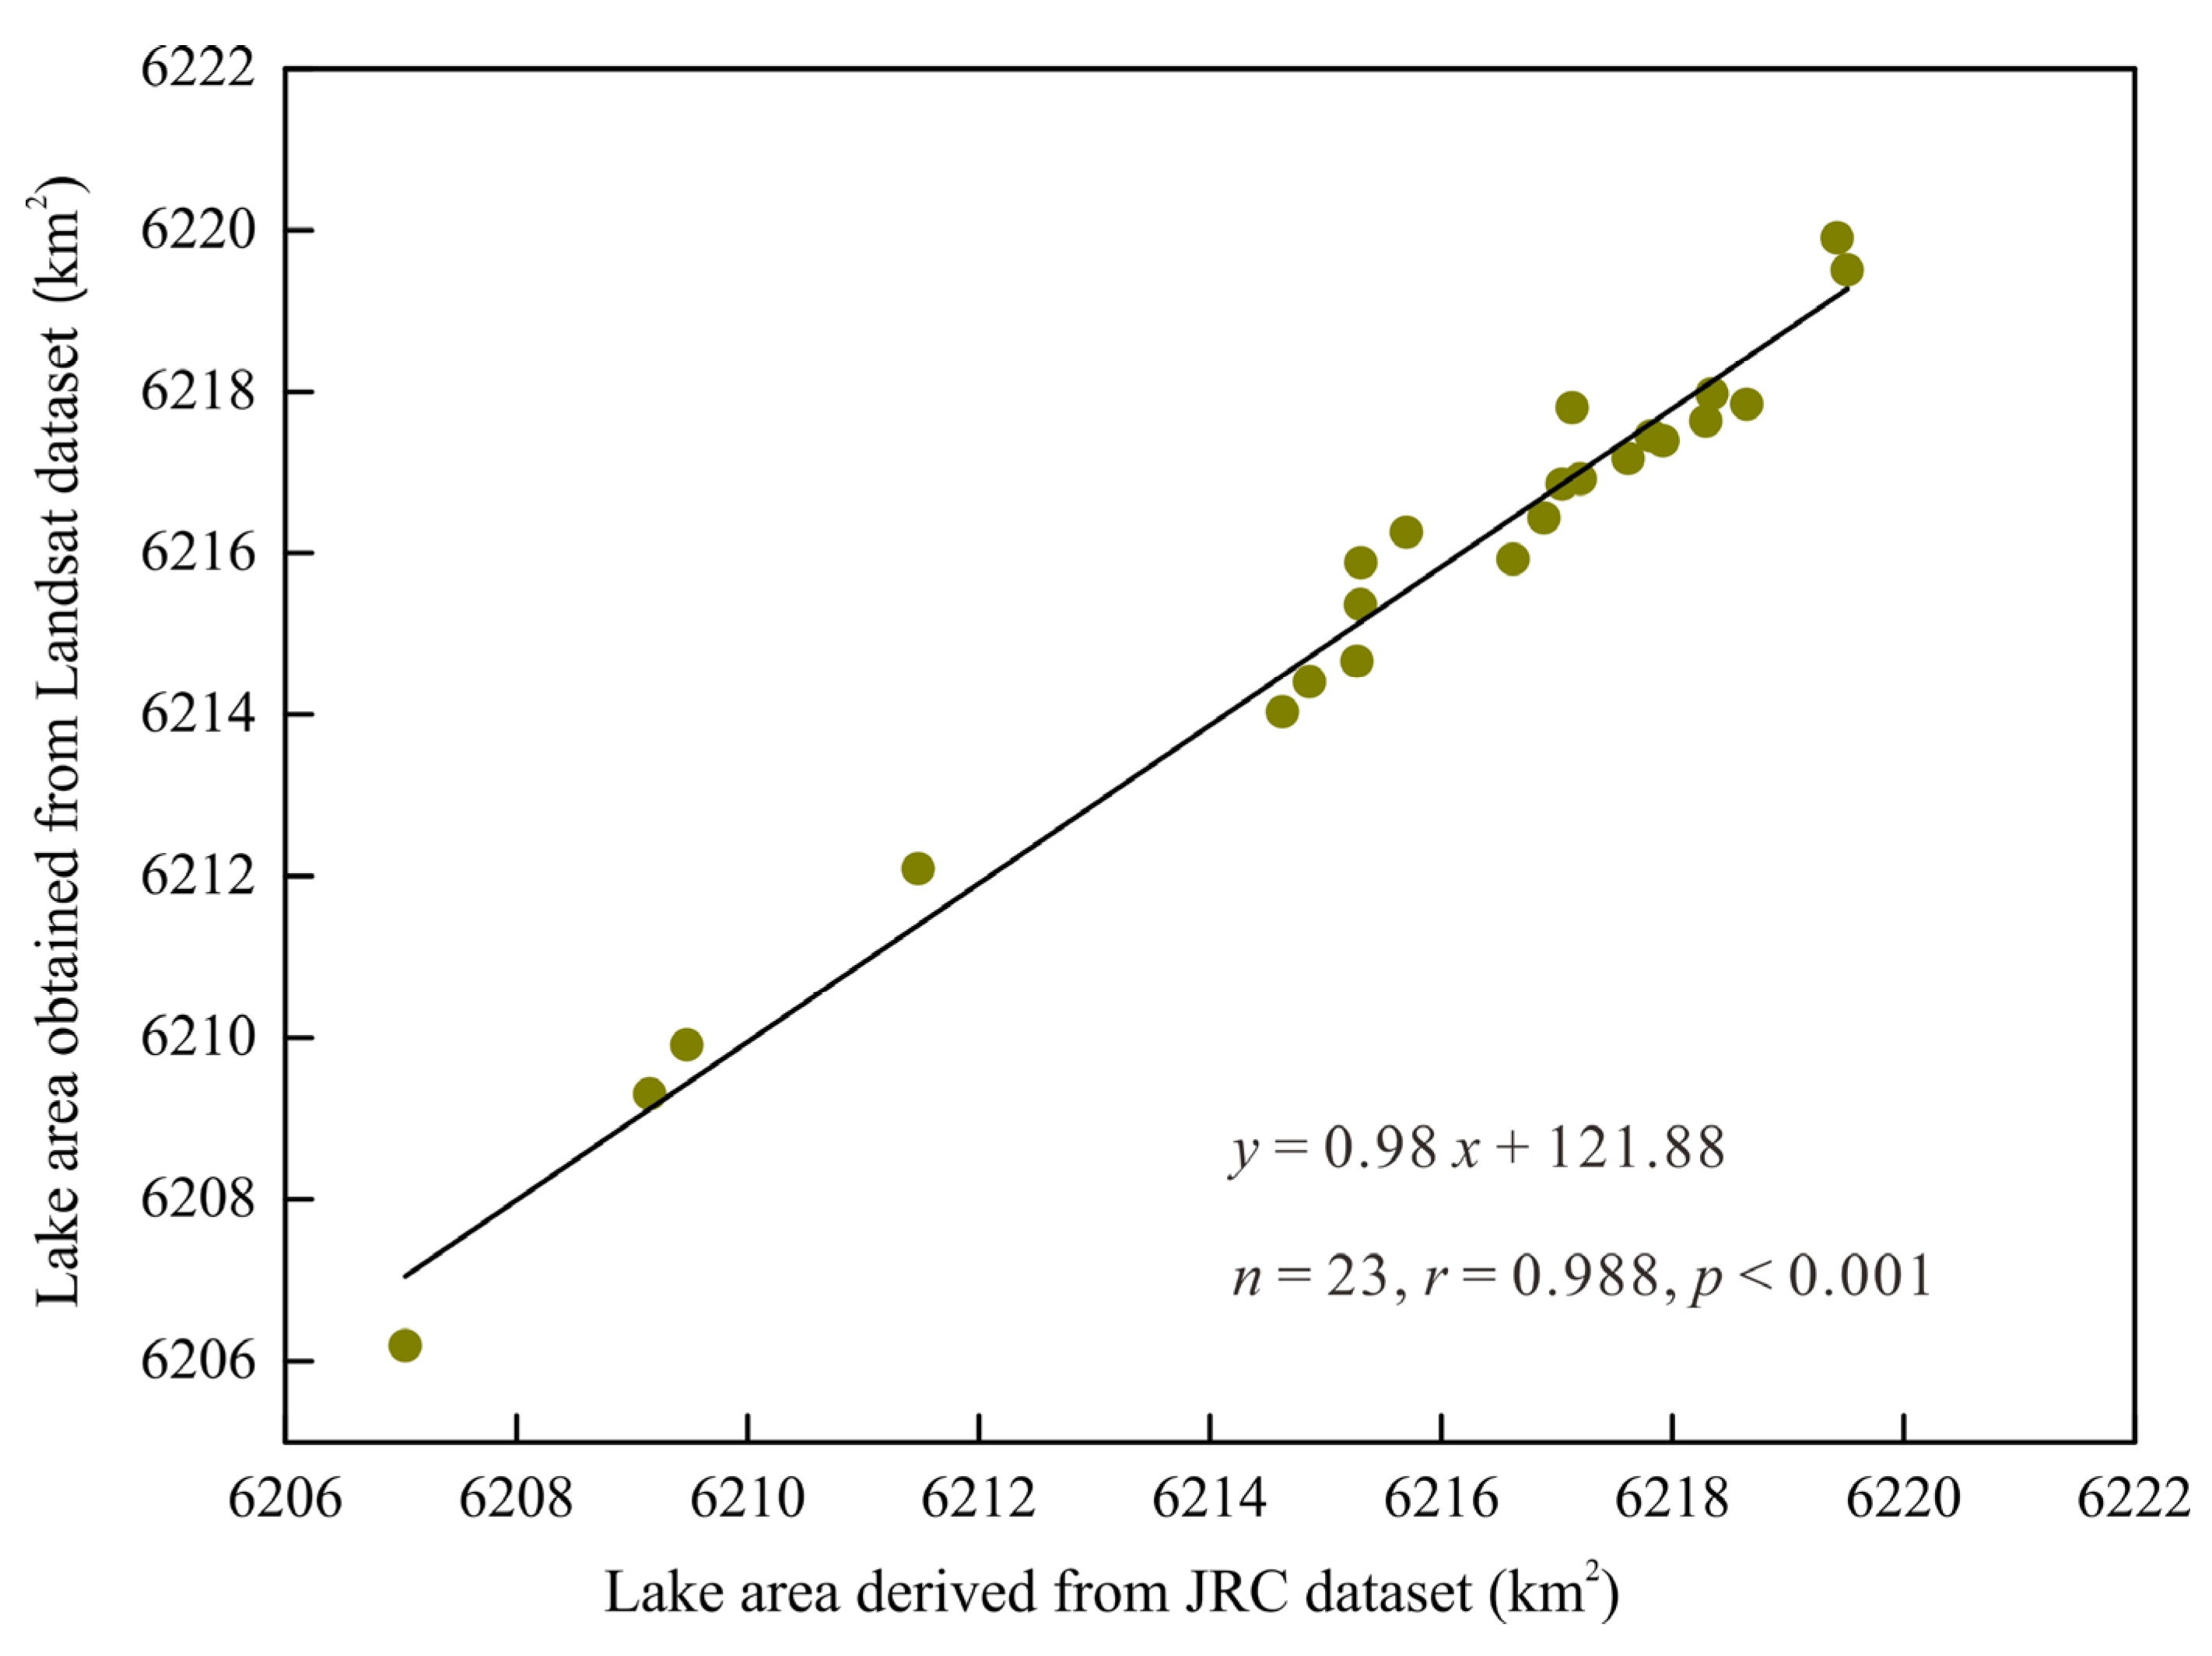
4.1.2. Accuracy Verification of Water Area

The comparison between the extraction results of the JRC dataset and the Landsat dataset using the mNDWI and OTSU algorithm is shown in Figure 10. The RMSE of the lake area derived from the JRC dataset was 0.518 km2 with a CC of 0.990 and an MAE of 0.470 km2, further demonstrating the feasibility of obtaining long-term area data of Lake Issyk-Kul from the JRC dataset.

4.2. The Driving Force of the Dynamic Changes of Lake Issyk-Kul

In order to explore the potential driving factors of the long-term dynamic changes of Lake Issyk-Kul, we further analyzed the lake’s response to climate change, glacier meltwater, and human activities in the basin.

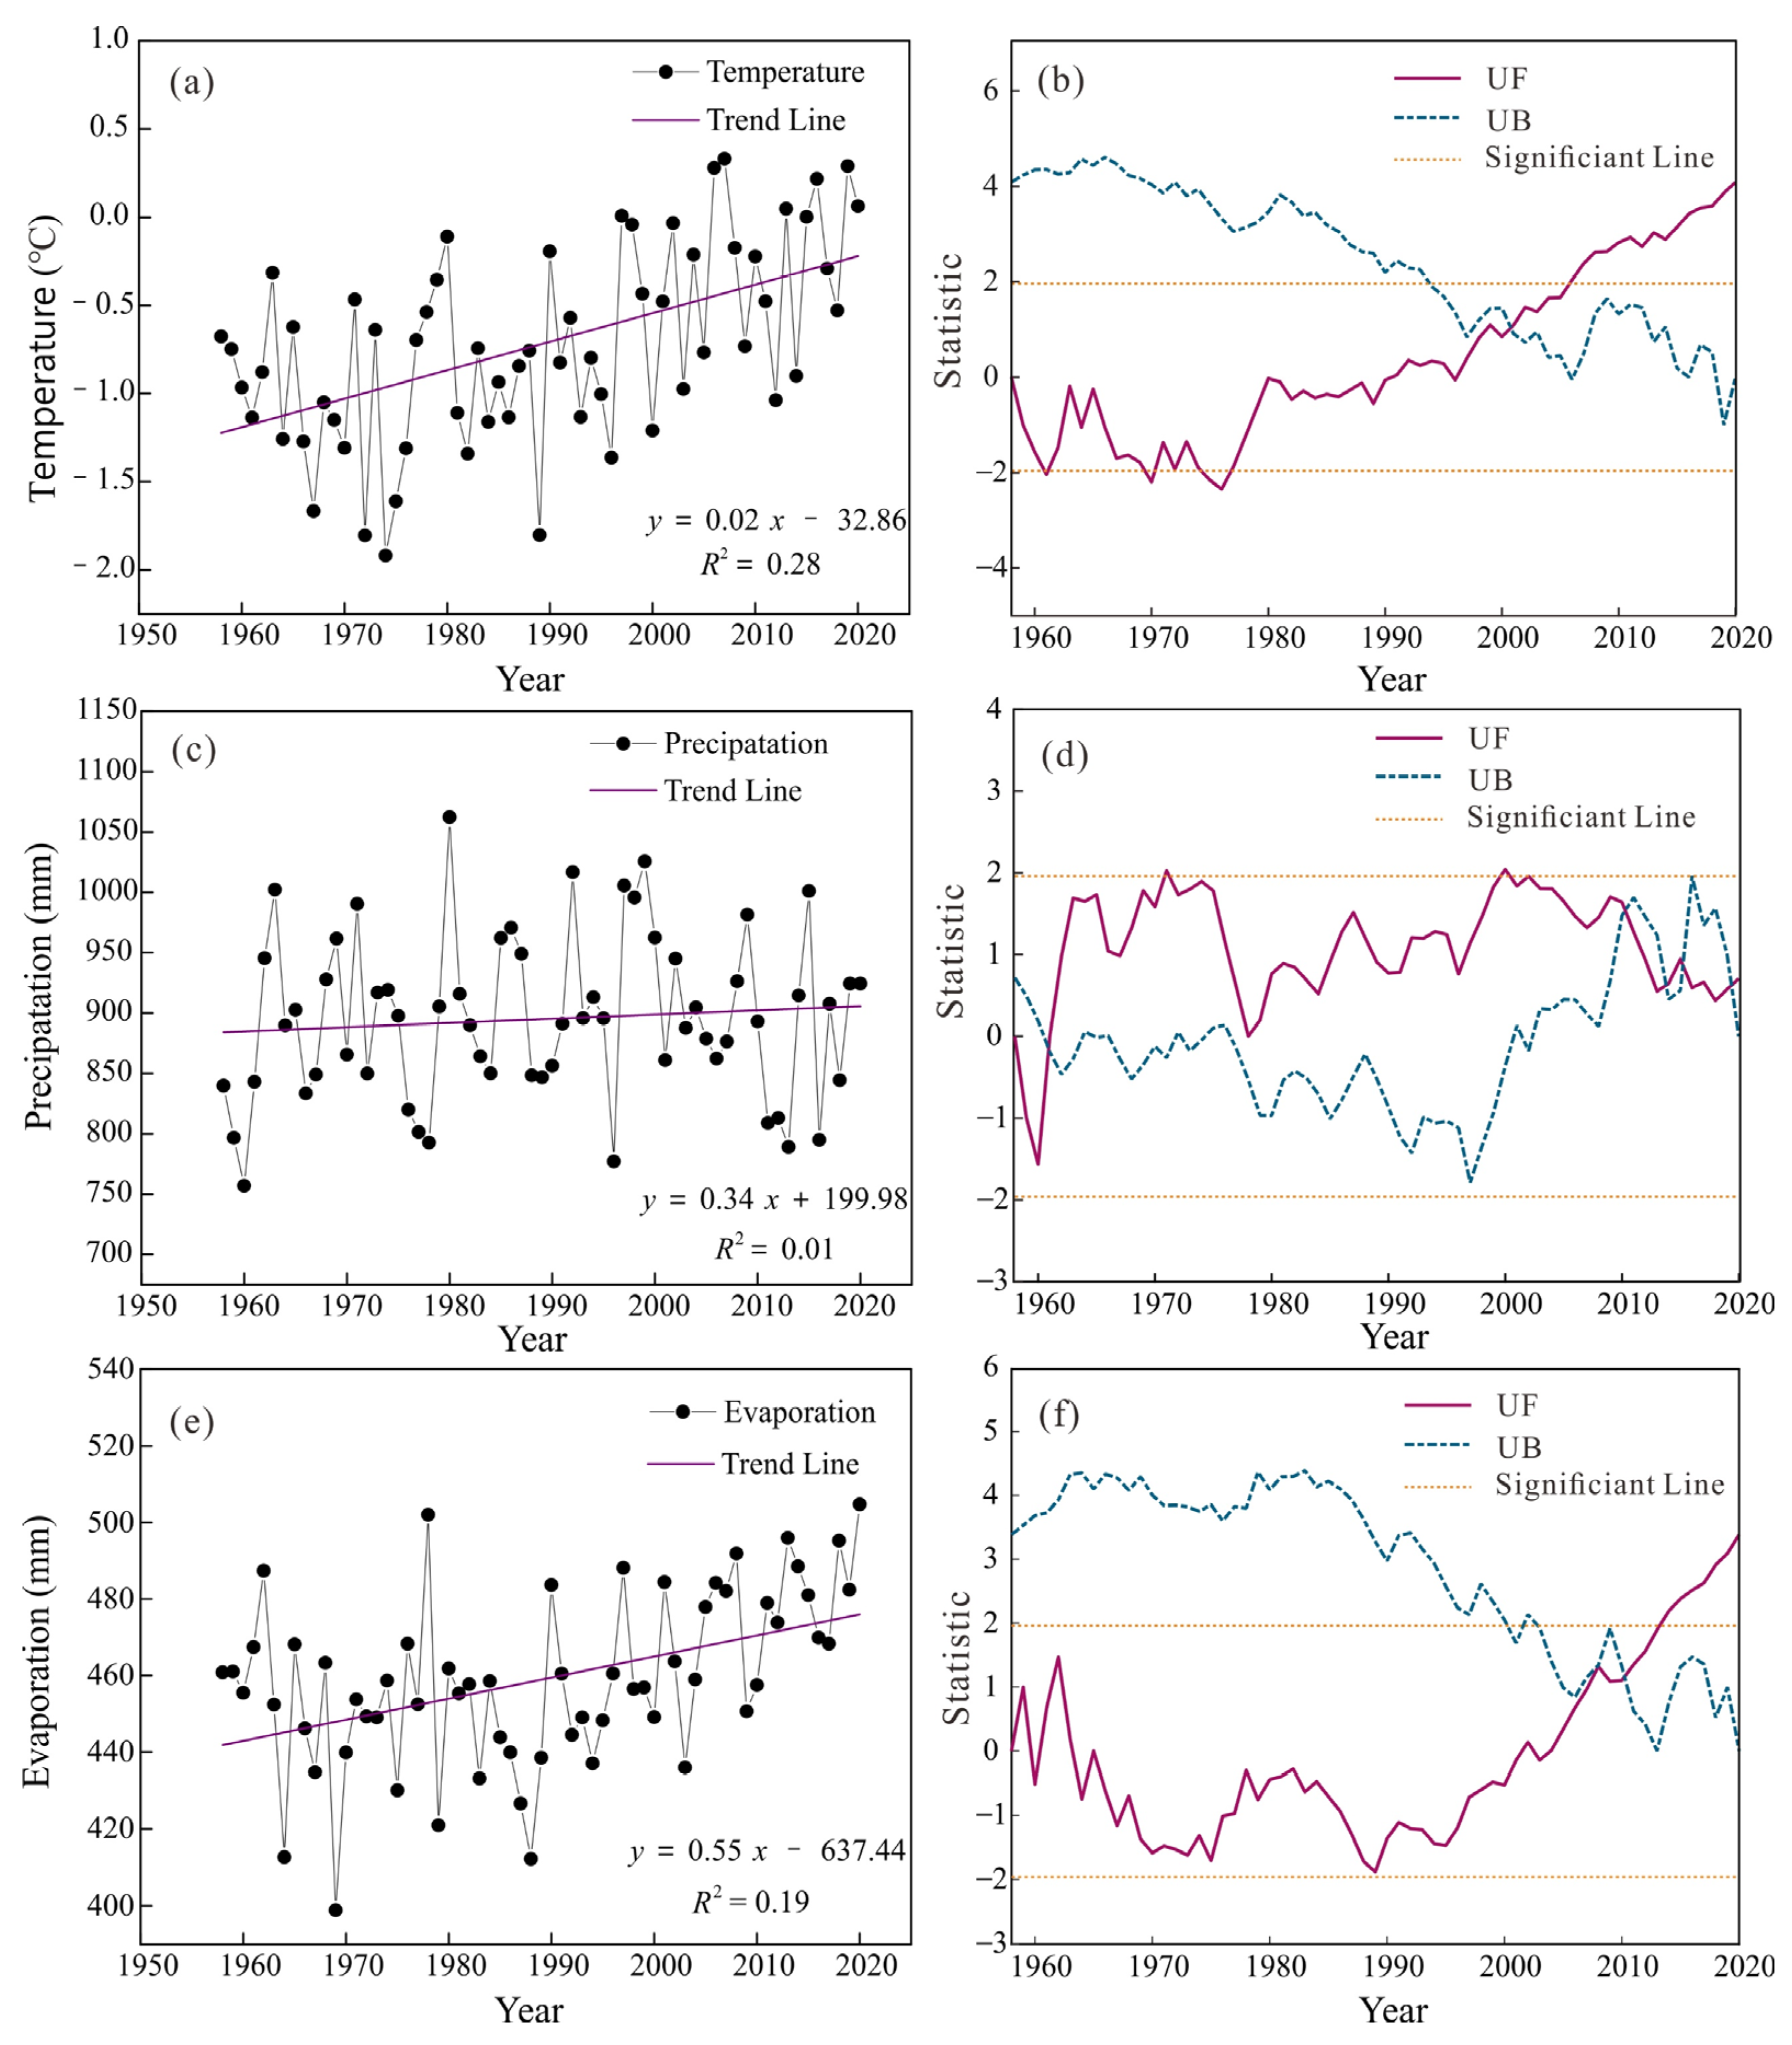
4.2.1. Climate Change

Temperature, precipitation, and evaporation as specific climatic characterizations are critical factors affecting the variations of the lake [24]. We used a sequential Mann–Kendall (M-K) mutation test that estimates progressive (UF) and backward (UB) series to detect abrupt variation years in the study series [73]. From 1958 to 2020, the mean temperature in the Issyk-Kul Lake Basin rose at a rate of 0.13 °C/10 year and the average annual air temperature was −0.72 °C (Figure 11a). The results of the M–K test (Figure 11b) showed that the upward trend of temperature became more evident since 2005, with a confidence level of more than 95%. Higher temperatures lead to an increase in glacial ablation, which may contribute to an increase in lake recharge and a rise in the lake level.
The precipitation fluctuated considerably during the study period (Figure 11c), and the M–K test showed multiple intersections of the UF and UB curves, none of which exceed the 0.05 significance level threshold (Figure 11d), which means that the overall upward trend in precipitation from 1958 to 2020 was not significant. The evaporation over the basin indicated an upward trend from 1958 to 2020, and the significant increase in evaporation occurred after 2013 (Figure 11e,f).
Since the water level of Lake Issyk-Kul increased significantly after 1998, the variations in precipitation and evaporation during different time periods, with 1998 as the turning point, were analyzed. From 1958 to 1998, the precipitation and evaporation exhibited slight increases and decreases, respectively, which should have contributed to the rise of water level. However, the water level dropped significantly during this period, indicating that climatic factors were not the major factors driving the dynamics of the lake before 1998. From 1998 to 2020, both the precipitation and evaporation presented increasing trends, and the lake level, area, and water volume have gradually recovered since 1998. The Pearson correlation coefficient value showed that the water volume was highly correlated with precipitation during this period (CC = 0.515, p < 0.01). These facts signified that the precipitation contributed more to the dynamics of Lake Issyk-Kul than evaporation in the early 21st century.

4.2.2. Glacier Meltwater

Glacier meltwater is the predominant source of replenishment for rivers in the arid regions of Central Asia, which can indirectly affect the water level, area, and volume of lakes [74]. Based on RGI 6.0 and the glacier data derived in this study, we found that the glacier area in the Issyk-Kul Lake Basin reduced from 520.09 km2 to 458.04 km2 at an average rate of 4.77 km2/year with a loss of around 62.05 km2, which means the glacier area shrank by about 11.93% during 2002–2015. The glacier volume decreased by approximately 2.63 km3 (11.63%) over the period of 2002–2015, equivalent to the loss of glacier mass of 2.23 ± 0.16 km3 w.e. (water equivalent), by assuming a volume to mass conversion factor of 850 ± 60 kg/m3. The water volume of Lake Issyk-Kul increased by about 0.64 km3 over the same period, which was lower than the loss of glacier mass. This fact suggests that the loss of glacier mass in the Issyk-Kul basin may contribute to the increase in the water volume of the lake during 2002–2015. Therefore, glacier meltwater is a critical factor influencing the variations of Lake Issyk-Kul, especially during 2002–2015.

4.2.3. Human Activities

In the 1950s, as the population in the lake basin grew, consequently, a large amount of wasteland was reclaimed. The irrigated area expanded rapidly from around 500 km2 in 1930 to 1540 km2 in 1984, which led to the increase in water demand. During 1935–1971, the average river water usage was about 9.4 × 10⁸ m3, which then increased to around 13.7 × 10⁸ m3 in the period of 1972–1984 [75]. Thus, it was the uptake of water for human activities such as irrigation, industry, and urban domestic life that seemed to be the major factor contributing to the dramatic decline in water levels during this period. Recent lake water consumers are shown in Table 4 [26]. Obviously, over the past few decades, agriculture has always been the highest water consumer compared to manufacturing and household water consumption. The water usage dedicated to human activities after 2000 had been reduced drastically compared with the 20th century, which is consistent with the water level and water area recovery period since 1998. The reduction in water consumption may be due to the decrease in water users in the Issyk-Kul Lake Basin after the collapse of the Soviet Union in 1989–1992, with some residents being deployed to different locations, which meant that they used other water sources [26,76]. Accordingly, human activities are the crucial factors responsible for the long-term dynamic changes of Lake Issyk-Kul.
In short, the continuous downward trend of the water level before 1998 is related to the excessive water consumption for human activities in the entire basin. Since the 21st century, the growing precipitation, increased glacier meltwater induced by significantly increasing temperature, as well as reduced water consumption collectively contributed to the restoration of the water level, area, and water volume of Lake Issyk-Kul.

5. Conclusions

The combination of multisource data proves to be a feasible way to detect variations in Lake Issyk-Kul. According to the monitoring results of in situ data, CryoSat-2, and ICESat-2, the water level of Lake Issyk-Kul declined rapidly from 1958 to 1998, with an average rate of 0.05 m/year. Since 1998, the water level climbed generally, accompanied by several fluctuations. The water level presented relatively regular seasonal changes, which is manifested in how the multi-year average water level reached the highest in spring and the lowest in autumn. The increase mainly occurred from May to August and the fluctuation in the warm season was more severe than that in the cold season. During the period of 1990–2020, the area of Lake Issyk-Kul shrank by around 2.76 km2 at a rate of 0.09 km2/year. Meanwhile, the water volume of Lake Issyk-Kul showed a decreasing trend before 1998, followed by a significant increase from 1998–2006, and then a small fluctuating decrease.
Over the years, the large amount of water withdrawal from lake tributaries for human activities in the basin has been cited as being responsible for the dynamic changes of Lake Issyk-Kul before 1998. However, the recovery of the water level, area, and water volume since 1998 was affected by increased precipitation, glacier meltwater resulting from rising temperature, and decreased water consumption in the early 21st century. Owing to the complexity and uncertainty of environmental changes, the quantitative discussion of the impact of various factors on lake dynamic changes requires further research.

Author Contributions

Conceptualization, Y.Z. and N.W.; methodology, Y.Z. and X.Y.; software, Y.Z. and Z.M.; validation, X.Y.; formal analysis, Y.Z.; investigation, X.Y. and Z.M.; resources, Y.Z.; data curation, Y.Z.; writing—original draft preparation, Y.Z.; writing—review and editing, X.Y., Y.Z., N.W. and Z.M.; visualization, Z.M.; supervision, X.Y.; project administration, N.W.; funding acquisition, N.W. All authors have read and agreed to the published version of the manuscript.

Funding

This research was funded by the Strategic Priority Research Program of the Chinese Academy of Sciences (XDA20060201, XDA19070302), the National Natural Science Foundation of China (42130516), and the Second Tibetan Plateau Scientific Expedition and Research Program (2019QZKK020102).

Institutional Review Board Statement

Not applicable.

Informed Consent Statement

Not applicable.

Data Availability Statement

Not applicable.

Acknowledgments

The authors are very grateful to HYDROLARE, for providing the in situ data (http://hydrolare.net/data_availability.php (accessed on 1 October 2021)), the European Space Agency (ESA), for providing Level 2 GDR product of CryoSat-2 (https://eocat.esa.int/sec/#data-services-area (accessed on 1 October 2021)), and the National Snow and Ice Data Center, for proving ATL13 product of ICESat-2 (NSIDC; https://nsidc.org/data/icesat-2/products/ (accessed on 1 October 2021)). We appreciate the editors and the three anonymous reviewers for their valuable suggestions and advice.

Conflicts of Interest

The authors declare no conflict of interest.

References

  1. Zhang, X.; Wu, Y. Zhari NamcoWater Level Change Detection Using Multi-satellite Altimetric Data during 1992–2012. J. Nat. Resour. 2015, 30, 1153–1162. [Google Scholar]
  2. Asfaw, W.; Haile, A.T.; Rientjes, T. Combining multisource satellite data to estimate storage variation of a lake in the Rift Valley Basin, Ethiopia. Int. J. Appl. Earth Obs. Geoinf. 2020, 89, 102095. [Google Scholar] [CrossRef]
  3. Li, P.; Li, H.; Chen, F.; Cai, X. Monitoring Long-Term Lake Level Variations in Middle and Lower Yangtze Basin over 2002–2017 through Integration of Multiple Satellite Altimetry Datasets. Remote Sens. 2020, 12, 1448. [Google Scholar] [CrossRef]
  4. Han, Q.; Zhang, S.; Huang, G.; Zhang, R. Analysis of Long-Term Water Level Variation in Dongting Lake, China. Water 2016, 8, 306. [Google Scholar]
  5. Long, A.; Deng, M.; Xie, L.; Wang, J.; Li, X. A Study of the Water Balance of Lake Balkhash. J. Glaciol. Geocryol. 2011, 33, 1341–1352. [Google Scholar]
  6. Gibson, J.J.; Prowse, T.D.; Peters, D.L. Partitioning impacts of climate and regulation on water level variability in Great Slave Lake. J. Hydrol. 2006, 329, 196–206. [Google Scholar] [CrossRef]
  7. Biancamaria, S.; Andreadis, K.M.; Durand, M.; Clark, E.A.; Rodriguez, E.; Mognard, N.M.; Alsdorf, D.E.; Lettenmaier, D.P.; Oudin, Y. Preliminary Characterization of SWOT Hydrology Error Budget and Global Capabilities. IEEE J. Sel. Top. Appl. Earth Obs. Remote Sens. 2010, 3, 6–19. [Google Scholar] [CrossRef] [Green Version]
  8. Song, C.Q.; Ye, Q.H.; Sheng, Y.W.; Gong, T.L. Combined ICESat and CryoSat-2 Altimetry for Accessing Water Level Dynamics of Tibetan Lakes over 2003–2014. Water 2015, 7, 4685–4700. [Google Scholar] [CrossRef] [Green Version]
  9. Jiang, L.G.; Nielsen, K.; Andersen, O.B.; Bauer-Gottwein, P. Monitoring recent lake level variations on the Tibetan Plateau using CryoSat-2 SARIn mode data. J. Hydrol. 2017, 544, 109–124. [Google Scholar] [CrossRef] [Green Version]
  10. Junli, L.I.; Xi, C.; Anming, B.A.O. Spatial-temporal Characteristics of Lake Level Changes in Central Asia during 2003–2009. Acta Geogr. Sin. 2011, 66, 1219–1229. [Google Scholar]
  11. Yang, X.; Li, G.; Wang, P.; Chang, X.; Yao, J. Monitoring of Qinghai Lake changes with spaceborne laser altimetry and remote sensing images. Sci. Surv. Mapp. 2020, 45, 79–87. [Google Scholar]
  12. Li, S.; Chen, J.P.; Xiang, J.; Pan, Y.; Huang, Z.Y.; Wu, Y.L. Water level changes of Hulun Lake in Inner Mongolia derived from Jason satellite data. J. Vis. Commun. Image Represent. 2019, 58, 565–575. [Google Scholar] [CrossRef]
  13. Liao, J.; Zhao, Y.; Chen, J. A dataset of lake level changes in High Mountain Asia using multialtimeter data. China Sci. Data 2020, 5, 1–12. [Google Scholar]
  14. Baup, F.; Frappart, F.; Maubant, J. Combining high-resolution satellite images and altimetry to estimate the volume of small lakes. Hydrol. Earth Syst. Sci. 2014, 18, 2007–2020. [Google Scholar] [CrossRef] [Green Version]
  15. Qiao, B.J.; Zhu, L.P.; Wang, J.B.; Ju, J.T.; Ma, Q.F.; Huang, L.; Chen, H.; Liu, C.; Xu, T. Estimation of lake water storage and changes based on bathymetric data and altimetry data and the association with climate change in the central Tibetan Plateau. J. Hydrol. 2019, 578. [Google Scholar] [CrossRef]
  16. Yao, F.F.; Wang, J.D.; Yang, K.H.; Wang, C.; Walter, B.A.; Crétaux, J.-F. Lake storage variation on the endorheic Tibetan Plateau and its attribution to climate change since the new millennium. Environ. Res. Lett. 2018, 13, 064011. [Google Scholar] [CrossRef]
  17. Phan, V.H.; Lindenbergh, R.; Menenti, M. ICESat derived elevation changes of Tibetan lakes between 2003 and 2009. Int. J. Appl. Earth Obs. Geoinf. 2012, 17, 12–22. [Google Scholar] [CrossRef]
  18. Wang, X.W.; Gong, P.; Zhao, Y.Y.; Xu, Y.; Cheng, X.; Niu, Z.G.; Luo, Z.C.; Huang, H.B.; Sun, F.D.; Li, X.W. Water-level changes in China’s large lakes determined from ICESat/GLAS data. Remote Sens. Environ. 2013, 132, 131–144. [Google Scholar]
  19. An, D.; Yang, J.; Wu, Y.; Ma, X.; Tao, D.; Shi, H. Current Research Progress and Applications of ICESat-2 Laser Altimetry Satellite. Hydrogr. Surv. Charting 2019, 39, 9–15. [Google Scholar]
  20. Villladsen, H.; Andersen, O.B.; Stenseng, L. Annual Cycle in Lakes and Rivers from Cryosat-2 Altimetry—The Brahmaputra River. In Proceedings of the IEEE Joint International Geoscience and Remote Sensing Symposium (IGARSS)/35th Canadian Symposium on Remote Sensing, Quebec City, QC, Canada, 13–18 July 2014; IEEE: New Piscataway, NJ, USA, 2014; pp. 894–897. [Google Scholar]
  21. Busker, T.; de Roo, A.; Gelati, E.; Schwatke, C.; Adamovic, M.; Bisselink, B.; Pekel, J.-F.; Cottam, A. A global lake and reservoir volume analysis using a surface water dataset and satellite altimetry. Hydrol. Earth Syst. Sci. 2019, 23, 669–690. [Google Scholar] [CrossRef] [Green Version]
  22. Ferronskii, V.I.; Polyakov, V.A.; Brezgunov, V.S.; Vlasova, L.S.; Karpychev, Y.A.; Bobkov, A.F.; Romaniovskii, V.V.; Johnson, T.; Ricketts, D.; Rasmussen, K. Variations in the Hydrological Regime of Kara-Bogaz-Gol Gulf, Lake Issyk-Kul, and the Aral Sea Assessed Based on Data of Bottom Sediment Studies. Water Resour. 2003, 30, 252–259. [Google Scholar]
  23. Wang, G.; Shen, Y.; Qin, D. Issyk-Kul Lake Level Fluctuation during 1860–2005 and Its Relation with Regional Climatic and Hydrological Changes. J. Glaciol. Geocryol. 2006, 28, 854–860. [Google Scholar]
  24. Uulu Salamat, A.; Abuduwaili, J.; Shaidyldaeva, N. Impact of climate change on water level fluctuation of Issyk-Kul Lake. Arab. J. Geosci. 2015, 8, 5361–5371. [Google Scholar] [CrossRef]
  25. Mihrigul, A.; Hamid, Y.; Mamattursun, E.; Shakure, T.; Yorov, H. Water Level Variations of Issyk-Kul Lake Based on Wavelet Analysis. Res. Soil Water Conserv. 2014, 21, 168–172. [Google Scholar]
  26. Alymkulova, B.; Abuduwaili, J.; Issanova, G.; Nahayo, L. Consideration of Water Uses for Its Sustainable Management, the Case of Issyk-Kul Lake, Kyrgyzstan. Water 2016, 8, 9. [Google Scholar]
  27. Reyes, R.; Nagai, M.; Blanco, A. Lake water level variability determination from SAR backscatter of discrete objects, GNSS levelling and satellite altimetry. Surv. Rev. 2021, 54, 153–162. [Google Scholar] [CrossRef]
  28. Alifujiang, Y.; Abuduwaili, J.; Ma, L.; Samat, A.; Groll, M. System Dynamics Modeling of Water Level Variations of Lake Issyk-Kul, Kyrgyzstan. Water 2017, 9, 20. [Google Scholar]
  29. Politi, E.; Rowan, J.S.; Cutler, M.E.J. Assessing the utility of geospatial technologies to investigate environmental change within lake systems. Sci. Total Environ. 2016, 543, 791–806. [Google Scholar] [CrossRef] [Green Version]
  30. Mueller, N.; Lewis, A.; Roberts, D.; Ring, S.; Melrose, R.; Sixsmith, J.; Lymburner, L.; McIntyre, A.; Tan, P.; Curnow, S.; et al. Water observations from space: Mapping surface water from 25 years of Landsat imagery across Australia. Remote Sens. Environ. 2016, 174, 341–352. [Google Scholar] [CrossRef] [Green Version]
  31. Yan, Z.; Guo, W. Remote sensing monitoring of the lake area of Issyk-Kul Lake in Central Asia from 1991 to 2014. Geomat. Spat. Inf. Technol. 2018, 41, 142–146. [Google Scholar]
  32. Bai, J.; Chen, X.; Li, J.; Yang, L. Changes of inland lake area in arid Central Asia during 1975–2007: A remote-sensing analysis. Hupo Kexue 2011, 23, 80–88. [Google Scholar]
  33. Schwatke, C.; Scherer, D.; Dettmering, D. Automated Extraction of Consistent Time-Variable Water Surfaces of Lakes and Reservoirs Based on Landsat and Sentinel-2. Remote Sens. 2019, 11, 1010. [Google Scholar] [CrossRef] [Green Version]
  34. Sun, W.W.; Du, B.; Xiong, S. Quantifying Sub-Pixel Surface Water Coverage in Urban Environments Using Low-Albedo Fraction from Landsat Imagery. Remote Sens. 2017, 9, 428. [Google Scholar] [CrossRef] [Green Version]
  35. Ogilvie, A.; Belaud, G.; Massuel, S.; Mulligan, M.; Le Goulven, P.; Calvez, R. Surface water monitoring in small water bodies: Potential and limits of multi-sensor Landsat time series. Hydrol. Earth Syst. Sci. 2018, 22, 4349–4380. [Google Scholar] [CrossRef] [Green Version]
  36. Feyisa, G.L.; Meilby, H.; Fensholt, R.; Proud, S.R. Automated Water Extraction Index: A new technique for surface water mapping using Landsat imagery. Remote Sens. Environ. 2014, 140, 23–35. [Google Scholar] [CrossRef]
  37. Young, N.E.; Anderson, R.S.; Chignell, S.M.; Vorster, A.G.; Lawrence, R.; Evangelista, P.H. A survival guide to Landsat preprocessing. Ecology 2017, 98, 920–932. [Google Scholar] [CrossRef] [Green Version]
  38. Ji, L.; Gong, P.; Geng, X.; Zhao, Y. Improving the Accuracy of the Water Surface Cover Type in the 30 m FROM-GLC Product. Remote Sens. 2015, 7, 13507–13527. [Google Scholar] [CrossRef] [Green Version]
  39. Gorelick, N.; Hancher, M.; Dixon, M.; Ilyushchenko, S.; Thau, D.; Moore, R. Google Earth Engine: Planetary-scale geospatial analysis for everyone. Remote Sens. Environ. 2017, 202, 18–27. [Google Scholar] [CrossRef]
  40. Nguyen, U.N.T.; Pham, L.T.H.; Dang, T.D. An automatic water detection approach using Landsat 8 OLI and Google earth engine cloud computing to map lakes and reservoirs in New Zealand. Environ. Monit. Assess. 2019, 191, 235, Erratum in Environ. Monit. Assess. 2020, 192, 616. [Google Scholar]
  41. Fattore, C.; Abate, N.; Faridani, F.; Masini, N.; Lasaponara, R. Google Earth Engine as Multi-Sensor Open-Source Tool for Supporting the Preservation of Archaeological Areas: The Case Study of Flood and Fire Mapping in Metaponto, Italy. Sensors 2021, 21, 1791. [Google Scholar] [CrossRef]
  42. Pekel, J.-F.; Cottam, A.; Gorelick, N.; Belward, A.S. High-resolution mapping of global surface water and its long-term changes. Nature 2016, 540, 418–422. [Google Scholar] [CrossRef] [PubMed]
  43. Yang, Y.J.; Zhang, Y.Y.; Su, X.W.; Hou, H.P.; Zhang, S.L. The spatial distribution and expansion of subsided wetlands induced by underground coal mining in eastern China. Environ. Earth Sci. 2021, 80, 1–14. [Google Scholar] [CrossRef]
  44. Rad, A.M.; Kreitler, J.; Sadegh, M. Augmented Normalized Difference Water Index for improved surface water monitoring. Environ. Model. Softw. 2021, 140, 105030. [Google Scholar] [CrossRef]
  45. Guo, Q.D.; Pu, R.L.; Li, J.L.; Cheng, J. A weighted normalized difference water index for water extraction using Landsat imagery. Int. J. Remote Sens. 2017, 38, 5430–5445. [Google Scholar] [CrossRef]
  46. Schwatke, C.; Dettmering, D.; Seitz, F. Volume Variations of Small Inland Water Bodies from a Combination of Satellite Altimetry and Optical Imagery. Remote Sens. 2020, 12, 1606. [Google Scholar] [CrossRef]
  47. Korzhenkov, A.M.; Deev, E.V.; Turova, I.V.; Abdieva, S.V.; Ivanov, S.S.; Liu, J.; Mazeika, I.V.; Rogozhin, E.A.; Strelnikov, A.A.; Fortuna, A.B.; et al. Active Tectonics and Paleoseismicity of the Eastern Issyk-Kul Basin (Kyrgyzstan, Tien Shan). Russ. Geol. Geophys. 2021, 62, 263–277. [Google Scholar]
  48. Romanovsky, V.V.; Tashbaeva, S.; Crétaux, J.-F.; Calmant, S.; Drolon, V. The closed Lake Issyk-Kul as an indicator of global warming in Tien-Shan. Nat. Sci. 2013, 5, 608–623. [Google Scholar] [CrossRef] [Green Version]
  49. Taft, J.B.; Phillippe, L.R.; Dietrich, C.; Robertson, K.R. Grassland composition, structure, and diversity patterns along major environmental gradients in the Central Tien Shan. Plant Ecol. 2011, 212, 1349–1361. [Google Scholar] [CrossRef]
  50. Wang, G.; Shen, Y.; Wang, N.; Wu, Q. The Effects of Climate Change and Human Activities on the Lake Level of the Issyk-Kul during the Past 100 Years. J. Glaciol. Geocryol. 2010, 32, 1097–1105. [Google Scholar]
  51. Alifujiang, Y.; Abuduwaili, J.; Maihemuti, B.; Emin, B.; Groll, M. Innovative Trend Analysis of Precipitation in the Lake Issyk-Kul Basin, Kyrgyzstan. Atmosphere 2020, 11, 16. [Google Scholar]
  52. Narama, C.; Kaab, A.; Duishonakunov, M.; Abdrakhmatov, K. Spatial variability of recent glacier area changes in the Tien Shan Mountains, Central Asia, using Corona (similar to 1970), Landsat (similar to 2000), and ALOS (similar to 2007) satellite data. Glob. Planet. Change 2010, 71, 42–54. [Google Scholar]
  53. Yilinuer, A.; Jilili, A.; Ding, Z.; Sun, J. Analysis of the Difference of Runoff Variation and Its Influencing Factors in the Typical Small Watershed of Issyk-Kul Basin. J. Soil Water Conserv. 2020, 34, 198–210. [Google Scholar]
  54. Markus, T.; Neumann, T.; Martino, A.; Abdalati, W.; Brunt, K.; Csatho, B.; Farrell, S.; Fricker, H.; Gardner, A.; Harding, D.; et al. The Ice, Cloud, and land Elevation Satellite-2 (ICESat-2): Science requirements, concept, and implementation. Remote Sens. Environ. 2017, 190, 260–273. [Google Scholar] [CrossRef]
  55. ESRIN-ESA and Mullard Space Science Laboratory. CryoSat Product Handbook; European Space Agency: Paris, France, 2021; Volume DLFE-3605. [Google Scholar]
  56. Parrinello, T.; Shepherd, A.; Bouffard, J.; Badessi, S.; Casal, T.; Davidson, M.; Fornari, M.; Maestroni, E.; Scagliola, M. CryoSat: ESA’s ice mission—Eight years in space. Adv. Space Res. 2018, 62, 1178–1190. [Google Scholar]
  57. Ferraro, E.J.; Swift, C.T. Comparison of retracking algorithms using airborne radar and laser altimeter measurements of the Greenland ice sheet. IEEE Trans. Geosci. Remote Sens. 1995, 33, 700–707. [Google Scholar] [CrossRef] [Green Version]
  58. Yuan, C.; Gong, P.; Bai, Y.Q. Performance Assessment of ICESat-2 Laser Altimeter Data for Water-Level Measurement over Lakes and Reservoirs in China. Remote Sens. 2020, 12, 770. [Google Scholar] [CrossRef] [Green Version]
  59. Foga, S.; Scaramuzza, P.L.; Guo, S.; Zhu, Z.; Dilley, R.D.; Beckmann, T.; Schmidt, G.L.; Dwyer, J.L.; Hughes, M.J.; Laue, B. Cloud detection algorithm comparison and validation for operational Landsat data products. Remote Sens. Environ. 2017, 194, 379–390. [Google Scholar] [CrossRef] [Green Version]
  60. Tucker, C.J.; Grant, D.M.; Dykstra, J.D. NASAs global orthorectified landsat data set. Photogramm. Eng. Remote Sens. 2004, 70, 313–322. [Google Scholar]
  61. Hoffmann, L.; Gunther, G.; Li, D.; Stein, O.; Wu, X.; Griessbach, S.; Heng, Y.; Konopka, P.; Muller, R.; Vogel, B.; et al. From ERA-Interim to ERA5: The considerable impact of ECMWF’s next-generation reanalysis on Lagrangian transport simulations. Atmos. Chem. Phys. 2019, 19, 3097–3124. [Google Scholar]
  62. Hersbach, H.; Bell, B.; Berrisford, P.; Hirahara, S.; Horanyi, A.; Munoz-Sabater, J.; Nicolas, J.; Peubey, C.; Radu, R.; Schepers, D.; et al. The ERA5 global reanalysis. Q. J. R. Meteorol Soc. 2020, 146, 1999–2049. [Google Scholar]
  63. Pfeffer, W.T.; Arendt, A.A.; Bliss, A.; Bolch, T.; Cogley, J.G.; Gardner, A.S.; Hagen, J.O.; Hock, R.; Kaser, G.; Kienholz, C.; et al. The Randolph Glacier Inventory: A globally complete inventory of glaciers. J. Glaciol. 2014, 60, 537–552. [Google Scholar]
  64. Radić, V.; Hock, R. Regional and global volumes of glaciers derived from statistical upscaling of glacier inventory data. J. Geophys. Res. Earth Surf. 2010, 115, F01010. [Google Scholar] [CrossRef]
  65. Wen, J.; Zhao, H.; Jiang, Y.; Chen, D.; Ji, G. Research on the quality screening method for satellite altimetry data take Jason-3 data and Hongze Lake as an example. SN Water Transf. Water Sci. Technol. 2018, 16, 194. [Google Scholar]
  66. Xu, H. Modification of normalised difference water index (NDWI) to enhance open water features in remotely sensed imagery. Int. J. Remote Sens. 2006, 27, 3025–3033. [Google Scholar] [CrossRef]
  67. Qiao, B.J.; Zhu, L.P.; Wang, J.B.; Ju, J.T.; Ma, Q.F.; Liu, C. Estimation of lakes water storage and their changes on the northwestern Tibetan Plateau based on bathymetric and Landsat data and driving force analyses. Quat. Int. 2017, 454, 56–67. [Google Scholar] [CrossRef]
  68. Qiao, B.J.; Zhu, L.P.; Yang, R.M. Temporal-spatial differences in lake water storage changes and their links to climate change throughout the Tibetan Plateau. Remote Sens. Environ. 2019, 222, 232–243. [Google Scholar] [CrossRef]
  69. Qiao, B.; Zhu, L.; Qiao, B.J.; Zhu, L.P. Differences and cause analysis of changes in lakes of different supply types in the north-western Tibetan Plateau. Hydrol. Process. 2017, 31, 2752–2763. [Google Scholar] [CrossRef]
  70. Xu, N.; Ma, Y.; Zhang, W.H.; Wang, X.H.; Yang, F.L.; Su, D.P. Monitoring Annual Changes of Lake Water Levels and Volumes over 1984–2018 Using Landsat Imagery and ICESat-2 Data. Remote Sens. 2020, 12, 4004. [Google Scholar] [CrossRef]
  71. Jiang, L.G.; Nielsen, K.; Andersen, O.B.; Bauer-Gottwein, P. A Bigger Picture of how the Tibetan Lakes Have Changed Over the Past Decade Revealed by CryoSat-2 Altimetry. J. Geophys. Res. Atmos. 2020, 125, e2020JD033161. [Google Scholar] [CrossRef]
  72. Xu, X.F.; Yuan, L.G.; Jiang, Z.S.; Chen, C.F.; Cheng, S. Lake level changes determined by Cryosat-2 altimetry data and water-induced loading deformation around Lake Qinghai. Adv. Space Res. 2020, 66, 2568–2582. [Google Scholar] [CrossRef]
  73. Ma, Z.G.; Guo, Q.Y.; Yang, F.Y.; Chen, H.L.; Li, W.Q.; Lin, L.L.; Zheng, C.Y. Recent Changes in Temperature and Precipitation of the Summer and Autumn Seasons over Fujian Province, China. Water 2021, 13, 1900. [Google Scholar] [CrossRef]
  74. Sorg, A.; Bolch, T.; Stoffel, M.; Solomina, O.; Beniston, M. Climate change impacts on glaciers and runoff in Tien Shan (Central Asia). Nat. Clim. Chang. 2012, 2, 725–731. [Google Scholar] [CrossRef]
  75. Savvaitova, K.; Petr, T. Lake Issyk-kul, Kirgizia. Int. J. Salt Lake Res. 1992, 1, 21–46. [Google Scholar]
  76. Vollmer, M.K.; Weiss, R.F.; Williams, R.T.; Falkner, K.K.; Qiu, X.; Ralph, E.A.; Romanovsky, V.V. Physical and chemical properties of the waters of saline lakes and their importance for deep-water renewal: Lake Issyk-Kul, Kyrgyzstan. Geochim. Cosmochim. Acta 2002, 66, 4235–4246. [Google Scholar] [CrossRef]
Figure 1. Location map of Lake Issyk-Kul. Glaciers’ shapes were derived from the Randolph Glacier Inventory (RGI) 6.0. The cropland data were derived from the Globalland30 dataset.
Remotesensing 14 01575 g001
Figure 2. The lake level data over the different periods used in this study.
Remotesensing 14 01575 g002
Figure 3. Flowchart of synthesizing multi-source data in this study.
Remotesensing 14 01575 g003
Figure 4. (a) All elevation points of Cryosat-2 and (b) ICESat-2 passing through Lake Issyk-Kul.
Remotesensing 14 01575 g004
Figure 5. An example of outlier removal. (a) The location of ground tracks of two satellite altimeters, and outlier removal for (b) CryoSat-2 and (c) ICESat-2 altimetry data.
Remotesensing 14 01575 g005
Figure 6. (a) Changes in the water level of Lake Issyk-Kul from 1958 to 2020. (b) Intra-annual variations in the water level of Lake Issyk-Kul. (c) Multi-year average monthly water level of Lake Issyk-Kul.
Remotesensing 14 01575 g006
Figure 7. Inter-annual variations in the area of Lake Issyk-Kul from 1990 to 2020.
Remotesensing 14 01575 g007
Figure 8. (a) Annual variations in water volume and (b) cumulative change in the water volume of Lake Issyk-Kul from 1990 to 2020.
Remotesensing 14 01575 g008
Figure 9. The comparison of the CryoSat-2 dataset with (a) the in situ dataset and ICESat-2 dataset (c) and the correlation analysis of the CryoSat-2 dataset with (b) in situ data and (d) the ICESat-2 dataset.
Remotesensing 14 01575 g009
Figure 10. The comparison between the extraction results of the JRC dataset and the Landsat dataset using the mNDWI and OTSU algorithm.
Remotesensing 14 01575 g010
Figure 11. Inter-annual variations in (a) the annual mean temperature, (c) the annual total precipitation, and (e) the annual total evaporation of the Issyk-Kul Lake Basin, and (b) the M–K tests of (b) temperature, (d) precipitation, and (f) evaporation.
Remotesensing 14 01575 g011
Table 1. The main characteristics of CryoSat-2 and ICESat-2 missions.
MissionCryoSat-2ICESat-2
AgencyEuropean Space Agency (ESA)National Aeronautics and
Space Administraion
(NASA)
Primary instrumentSAR Interferometric Radar Altimeter (SIRAL)Advanced Topographic
Laser Altimeter System
(ATLAS)
Operation timeApril 2010~presentSeptember 2018~present
Orbit altitude (km)730500
Inclination angle (°)9292
Repeat cycle (day)369 days with 30-day subcycle91
Beam numberTwo beamsSix beams
Footprint diameter (m)1650 m for LRM mode~17
Sampling interval (m)300~0.7
Precision (cm)1~36.1
Table 2. Description of L8SRT2, L7SRT2, L5SRT2, and JRC datasets.
DatasetsLandsat 8 Surface Reflectance Tier 2Landsat 7 Surface Reflectance Tier 2Landsat 5 Surface Reflectance Tier 2JRC Monthly Water History, v1.3
Dataset Availability11 April 2013–28 September 20211 January 1999–15 October 20211 January 1984–5 May 201216 March 1984–1 January 2021
Dataset ProviderUSGSUSGSUSGSEC JRC/Google
Earth Engine SnippetLANDSAT/LC08/C01/T2_SRLANDSAT/LE07/C01/T2_SRLANDSAT/LT05/C01/T2_SRJRC/GSW1_3/MonthlyHi-story
Spatial resolution (m)30303030
Number of bands11771
Positional accuracy (m) [60]<12<50<50<50
Table 3. Evaluation metrics.
ReferencePeriodCCpMAERMSE
In situ dataJuly 2010–December 20170.919p < 0.0010.0600.075
ICESat-2 dataOctober 2018–December 20200.960p < 0.0010.0180.020
Table 4. The water consumption for agriculture, manufacturing, and household uses in the Issyk-Kul Lake Basin from 1980 to 2014 [26].
PeriodAgriculture (106 m3)Manufacture (106 m3)Household (106 m3)
1980–19892029.4217.7427.02
1990–19999819.4618.06
2000–2014461.768.7416.55
Publisher’s Note: MDPI stays neutral with regard to jurisdictional claims in published maps and institutional affiliations.

