Abstract
The surface energy balance algorithm for land (SEBAL) is a commonly used method for estimating evapotranspiration (ET) at a regional scale; however, the cloudy and rainy characteristics of subtropical monsoon regions pose a greater challenge for estimating paddy field ET based on remote sensing technology. To this end, a typical subtropical climate region in southern China (Ganfu Plain irrigation system) was selected as the study area. Subsequently, we evaluated the applicability of the SEBAL model for estimating the ET of paddy fields at the daily scale; derived the interannual variation (2000–2017) characteristics of early, middle, and late rice ET; and finally analyzed the spatial distribution patterns of rice in different hydrological years. The results demonstrated that: (1) the SEBAL model estimated ET accurately on a daily scale, with R2, NSE, and RMSE values of 0.85, 0.81, and 0.84 mm/day, respectively; (2) the ET of paddy fields in the irrigated area was higher in July and August and the interannual trend of ET of early rice was not obvious, with a declining trend observed in middle rice and late rice from 2000 to 2009, which was followed by an increasing trend from 2009 to 2017; and (3) variations in the spatial distribution of ET were significant for early and late rice at different precipitation levels and less obvious for middle rice in wet years but significant in dry years. Overall, this study verified the applicability of the SEBAL model for estimating ET in paddy fields in subtropical regions and provided a basis and reference for the rational allocation of water resources at a regional scale.
1. Introduction
Paddy rice is a dominant staple food that feeds over 50% of the population worldwide. However, paddy rice needs a large amount of water to maintain high production. Statistics have shown that paddy field irrigation accounts for 80% of agricultural water consumption in southern China [1]. Evapotranspiration (ET) represents the sum of vegetation transpiration and soil evaporation, which is the major component of farmland water consumption, and it includes the amount of evaporation on the ground surface and plant surface and the amount of transpiration that occurs at the plant surface and inside the plant. ET not only plays a huge role in hydrological cycles and energy balance systems, but also represents a crucial link between ecological and hydrological processes; furthermore, it is a significant parameter for calculating the regional water balance and a convenient means to retrieve water amounts applied for irrigation over anthropized regions [2,3,4]. Water consumption dominated by ET is the final form of water resource consumption, which often approximates the regional water resource consumption [5]. With economic and social development and population growth, the problem of water resource shortages is becoming increasingly prominent. The unbalanced spatial and temporal distribution of water resources is one of the challenges of water resource management. Therefore, understanding the spatial and temporal variability in ET is of great significance for rationally allocating regional water resources and scheduling irrigation [6].
With the continuous development of remote sensing (RS) technology in recent decades [7,8,9], satellite sensors with multiple spatial, temporal, and spectral resolutions (e.g., Land Remote Sensing Satellite (Landsat), Moderate Resolution Imaging Spectroradiometer (MODIS), Advanced Very-High-Resolution Radiometer (AVHRR), and Sentinel) have become ideal tools for estimating ET at a regional scale [10,11,12,13]. Various models have been reported for estimating ET with RS datasets [14,15,16]. According to different theoretical bases, RS-based ET models can be roughly classified as: (i) empirical statistical methods, which have the advantages of requiring less data and being easy to use; however, they have significant regional limitations because their statistical parameters need to be recalibrated when used in different regions [17,18]; (ii) feature space methods, which refers to the method of obtaining feature points and interpolating the ET of the feature points to derive the ET of each image element based on each surface parameter obtained from remote sensing images—such as surface albedo, vegetation index, surface temperature, etc.—presenting a certain shape on the scatter plot, and using that shape to obtain the ET of the feature points [18,19]; (iii) residual surface energy balance methods, which calculate the net radiation, soil heat flux, and sensible heat flux of the surface energy balance equation and finally calculate the latent heat flux as the residual term, which can be divided into single-source models and dual-source models according to whether soil evaporation and vegetation transpiration are distinguished. Studies have shown that vegetation cover can affect the water cycle and accurate estimation of ET [20,21]. Since the dual-source model considers the parameters of vegetation and soil separately, it can describe the surface fluxes of nonuniform subsurfaces in greater detail; however, it is difficult to obtain the corresponding parameters for the model [22]. The uncertainty and errors of the dual-source model will increase, and the estimation results may not be more accurate than those of the single-source model [23]. In contrast, the single-source model simplifies the treatment of the subsurface, which makes the model parameters easier to obtain and more flexible to apply.
As a typical single-source model, the surface energy balance algorithm for land (SEBAL) based on the surface energy balance has been applied to estimate ET in different regions with multiple data sources [24,25,26,27,28,29,30], since it does not excessively rely on ground-assisted data. The accuracy of ET estimated by the SEBAL model can reach 85% for the daily ET, 95% for the whole-season ET at a field scale, and 96% for the annual ET in large watersheds [31]. The SEBAL-based ET model has been gradually applied to water use and water management in irrigation districts in recent years. The SEBAL model has been used to estimate ET across various land uses in Nansi Lake Wetland of China using Landsat-7 ETM+ images, and the results showed that the SEBAL model can calculate the spatial distribution of ET despite little ground-based weather data over large areas [32]. Gao et al. (2020) [33] estimated the actual ET of the Loess Plateau in China from 1990 to 2015 using the MODIS and AVHRR datasets based on the SEBAL model, and the R2 values were above 0.87 in 161 subbasins, which indicated the simulation results are reliable and effective; meanwhile, they obtained an interesting finding that the SEBAL model overestimates regional ET, the main reason mainly being due to the overestimation of regional latent heat or underestimation of sensible heat. Ding (2020) [34] compared the performance of the SEBAL model and Surface Energy Balance System model (SEBS, a dual-source model) in estimating regional ET, and results showed that the SEBAL model is suitable for estimating ET in plain areas, while the SEBS model is suitable in composite terrain. The above studies show that the SEBAL model has been used for estimating ET at field scale to regional scale with encouraging results, but the application of the SEBAL model to rice-dominated irrigation areas has not been sufficiently investigated.
The rice-planting areas are mainly distributed in the monsoon regions of East Asia, Southeast Asia, and South Asia, as well as the tropical rainforests of Southeast Asia. The SEBAL model has been applied to several regions in China: the northeast Sanjiang River Basin [35,36], the North China Plain [37], the Loess Plateau [33,38], the agro-pastoral ecotone of Northwestern China [39], the Taklimakan Desert [40], and the Yellow River Delta [21]. Additionally, the SEBAL model has been widely applied over a multitude of different climatic conditions, including subtropical areas [41,42,43], but the cloudy and rainy weather in the subtropical climate zone—which is represented by the southern region of China, where mixed double-season early and late rice and single-season middle rice are cultivated—presents a greater challenge for accurate estimations of ET using the SEBAL model.
Therefore, the Ganfu Plain irrigation system (GFPIS) located in southern China, which is a subtropical monsoon climate region, was selected as the study area. The objectives of this study are to: (1) assess the applicability of the SEBAL model for estimating ET in rice-dominated irrigation areas; (2) analyze the daily variation in paddy rice ET over the growing season; and (3) analyze the interannual variation (2000–2017) characteristics of early, middle, and late rice ET and the spatial distribution pattern in different hydrological years. Hence, this study estimated ET of the rice-dominated irrigation areas in southern China using Landsat and the SEBAL model, and derived the spatial-temporal variation patterns of ET in the region, which will provide a reference for regional farmland water consumption and a decision-making basis for the rational and efficient allocation of regional water resources.
2. Material and Methods
2.1. Study Area
The GFPIS (8°10′–28°48′ N, 115°48′–116°17′ E) is the largest diversion irrigated area south of the Yangtze River in China (Figure 1) and one of the main grain-producing areas in Jiangxi Province, with an effective irrigated area of approximately 67,000 Hm2. The main crop planted in this region is rice, which can be divided into double-season early and late rice and single-season middle rice. The growing season is shown in Figure 2 [44]. Among the rice crops, double-season early-late rice may only be planted with early-late rice, which is rotated with cash crops, such as vegetables, melons, and fruits.
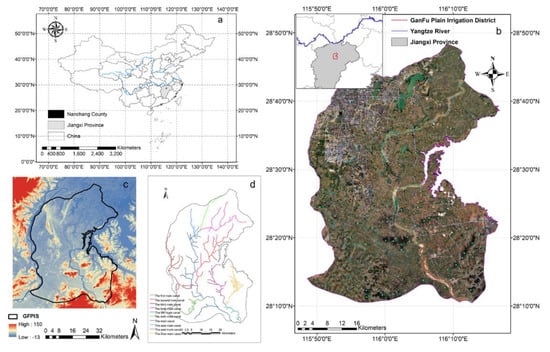
Figure 1.
Overview of study area. (a) Geographical location of Jiangxi Province; (b) Location of the study area; (c) DEM of the study area; and (d) Distribution of the water conservancy project in the GFPIS.
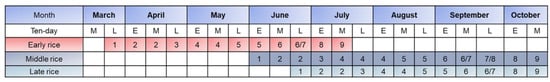
Figure 2.
Common growth stages of early, late, and middle rice in the GFPIS: 1–sowing; 2–seeding; 3–transplanting; 4–tillering; 5–booting; 6–heading; 7–milk; 8–mature; and 9–harvest.
The distribution of water conservancy projects in the GFPIS is shown in Figure 1d, with a total of 10 major trunk canals. With the expansion and economic development of Nanchang city in recent years, the water consumption of urban residents and industry in irrigated areas has been growing and the demand for water resources from various water-using units has been increasing; therefore, the contradiction between water supply and consumption in irrigated areas will be more prominent.
The GFPIS is located in a humid subtropical climate zone, with an average annual temperature of 17–18 °C, an average annual wind speed of 3.4 m/s, an average annual sunshine of 1603.4 h, a frost-free period of 260–280 days, an average annual precipitation of approximately 1662.5 mm, and an average annual land evaporation of approximately 800 mm. The irrigated area has four distinct seasons, with low temperatures and rain in spring, greater precipitation and flooding in late spring and early summer, high temperatures and little rain in summer, mild temperatures but little rain in autumn, and cold temperatures in winter.
2.2. Data Used
The input data (Table 1) in the SEBAL model include satellite imagery, meteorological data, and digital elevation data (DEM).

Table 1.
Information of datasets used.
The Landsat images have the same spatial resolution and continuous temporal coverage. All of the Landsat images are level 1 T data, with terrain corrections referencing the World Reference System-2 and intercalibrated across the various Landsat sensors; thus, these images are suitable for time series processing analysis. According to the rice growing season in the GFPIS, satellite imagery acquisition occurred between 20 April and 31 October from 2000 to 2017. All cloud-free Landsat 5 TM, 7 ETM+, and 8 OLI images (Path 121 and Row 40) from the U.S. Geological Survey (USGS) Earth Explorer data portal (http://earthexplorer.usgs.gov/, accessed on 10 January 2022) were downloaded. A total of 63 images were used, and Figure 3 shows the temporal distribution of the available Landsat images.
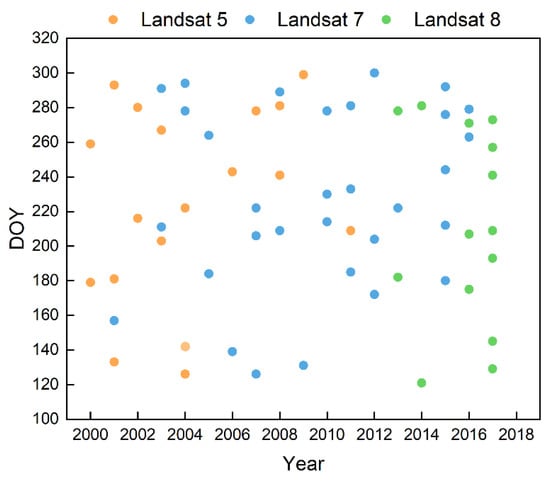
Figure 3.
Temporal distribution of the available Landsat images for the rice growing season from 2000 to 2017.
The meteorological data in this study are from the China Meteorological Data Sharing Service Network (http://data.cma.cn, accessed on 10 January 2022), and the Daily Climatic Dataset (V3.0) of the China International Ground Exchange station was selected as the basic meteorological data. Meteorological data were collected from Nanchang Station from 2000 to 2017, and they included the maximum temperature, minimum temperature, average temperature, average wind speed, relative humidity, and sunshine duration.
DEM data are derived from SRTM data, which are jointly measured by NASA and the National Geospatial-Intelligence Agency (https://earthexplorer.usgs.gov/, accessed on 10 January 2022). The spatial resolutions of SRTM data are 30 and 90 m. SRTM data from radar images have the highest resolution and represent the most widely used terrain data thus far; furthermore, global SRTM data have a unified coordinate system. In this study, DEM data with 30 m resolution were mosaicked together with two sheets and then cropped to a rectangle containing the range size using the GFPIS vector file, as shown in Figure 1c.
2.3. Selection of Typical Hydrological Years
Precipitation and irrigation are the main sources of water in paddy fields, and ET is the main consumer of water in paddy fields; thus, it is also the basis of irrigation management. Therefore, it is of great guiding significance for water resource management to investigate the distribution characteristics of ET under different precipitation conditions in irrigated areas.
First, the total precipitation during the growing seasons of early, middle, and late rice from 2000 to 2017 was statistically analyzed, and the results are shown in Figure 4. Overall, the total precipitation during the growing season of early rice was the highest and ranged from 351.8 mm to 1025.9 mm, with the minimum value occurring in 2009 and the maximum value in 2010. The second highest was the total precipitation during the growing season of middle rice, with a minimum value of 216.2 mm (2016) and a maximum value of 563.8 mm (2014). The total precipitation of late rice was the lowest and ranged from 58.9 mm to 401.2 mm. These results indicate that precipitation is abundant in the early rice growing season and less abundant in the late rice growing season, and the total precipitation in the middle rice growing season is between that of early rice and late rice.
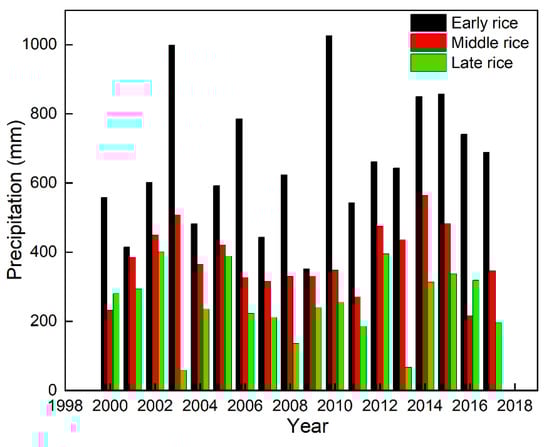
Figure 4.
Interannual variation in precipitation during the early, middle, and late rice growing seasons from 2000 to 2017.
In this study, the precipitation data for the GFPIS from 1952 to 2017 were sorted by frequency, the Pearson type III curve was used to fit the line, and the precipitation values corresponding to each frequency case were obtained by fitting the line. Generally, the precipitation values corresponding to P = 25%, 50%, and 75% can be taken as the design values for wet, normal, and dry years, respectively, and then the real years equal to or close to the design values can be selected as the corresponding wet, normal, and dry representative years in the existing actual measurement series. The wet years selected in this paper were 2002 and 2014; the normal years were 2004, 2008, and 2010; and the dry years were 2007, 2008, and 2016.
Consistent with the previous conclusion, the total precipitation during the growing season of rice in different hydrological years was ranked as early rice, middle rice, and late rice. The precipitation during the growing season of early rice was higher than 400 mm in different hydrological years; the precipitation during the growing season of middle rice was as high as 564 mm in wet years, 365 mm in normal years, and only 216 mm in dry years; and the precipitation during the growing season of late rice was 401 mm in wet years, 255 mm in normal years, and as low as 136 mm in dry years.
2.4. SEBAL Algorithm Description
Since the SEBAL model was proposed by Bastiaanssen, it has been successfully applied to a variety of ecosystems through continuous improvement and development [45]. The SEBAL model calculates the latent heat flux by estimating the net radiation, soil heat flux, and sensible heat flux to obtain the instantaneous ET. The theoretical basis of the SEBAL model is the surface energy balance formula, and the calculation formula is
where is the latent heat flux (W/m2), is the net radiation flux (W/m2), is the soil heat flux (W/m2), and is the sensible heat flux (W/m2).
is the main energy source in the transport and exchange of energy, momentum, and water on Earth’s surface, and it is calculated as follows:
where is the incoming shortwave radiation (W/m2), is the incoming longwave radiation, is the outgoing longwave radiation (W/m2), is the incident longwave radiation emitted through the surface (W/m2), is the surface albedo (dimensionless), is the atmospheric radiance, is the thermal surface emissivity (dimensionless), is the temperature of the air near the surface, and is the surface temperature (K).
where and are the constant values (K), is the corrected thermal radiance of the surface, and is the narrow band surface emissivity.
where and are DN values of the near-infrared band and red band, respectively.
It should be pointed out that the radiance changes at different times in the year and between years as a result of different solar incidences over the surface, especially in rough terrain. The ratio properties of NDVI enable the great mass of noise due to changing sun angles, clouds, topography, or shadow to be cancelled, making NDVI less susceptible to illumination conditions [46].
where and are the surface reflectance and the weight coefficient of band , respectively.
is the soil heat flux, and its equation is
where represents the surface temperature (C); represents albedo; and is the normalized difference vegetation index (dimensionless).
where is the air density (kg/m3), is the air specific heat (J/kg*K), is the aerodynamic resistance against heat transfer (s/m), and is the temperature difference (T1 − T2) at heights of Z1 and Z2 (°C).
where is the von Karman constant (0.41) and is the fraction velocity at heights of 2 m and 0.1 m.
where is the surface momentum roughness height (m). The equation for is
where and are empirical coefficients.
where and are linear parameters, and is the temperature difference (T1 − T2) at heights of Z1 and Z2 (°C), with Z1 = 0.1 m, Z2 = 2 m usually used in the SEBAL model. The purpose of defining the zero-plane displacement is to reduce the obstruction of wind by ground vegetation.
In Equation (1), ET represents instantaneous evapotranspiration. The evaporative fraction () was taken to extrapolate the instantaneous ET to the daily ET in the SEBAL model, and the equations are
where is the latent heat of vaporization (MJ kg−1); ET, Rn, and G are the instantaneous latent heat flux, net radiation and ground heat flux in each pixel, respectively; is the daily net radiation (W m−2); and G24 is the daily soil heat flux (W m−2).
2.5. Calculation of ET in Paddy Fields
The paddy rice fields of the GFPIS were extracted in our previous study [44], and we took the average ET value calculated based on the extracted rice image elements as the daily average paddy rice ET value calculated in Section 3.2.
For the days without accessible RS images, the daily ET can be estimated by linearly interpolating over periods between two consecutive images [47,48]. The specific steps are as follows: (1) Calculate the daily crop reference ET (ET0) using the Penman–Monteith method recommended by the FAO [49]; (2) Calculate the ratio of ET24 to ET0 in two available RS images; and (3) Linearly interpolate the two-spoke image to determine the ratio on the missing dates. The ET24 of the missing date can be obtained by multiplying the ratio by the ET0 on the missing date [50]. The Penman model was modified by the FAO in 1998, and the modified Penman model has a solid theoretical basis and high universality; thus, it is currently the most accurate method of calculating ET0. The calculation formula of the Penman model is as follows:
2.6. Evaluation of Model Accuracy
In this study, the daily average ET observed based on the eddy covariance of the Jiangxi Province Irrigation Experiment Station (116°00′03″ E, 28°26′27″ N) in the GFPIS from 2016–2017 was compared with the results calculated by the SEBAL model. To evaluate the prediction accuracy of the model for ET, the coefficient of determination (R2), root-mean-square error (RMSE), and Nash–Sutcliffe efficiency coefficient (NSE) were chosen to analyze the ET derived by the model, and the calculation process is shown in Equations (20)–(22). A reliable model usually has high R2 and NSE values and low RMSE values [51,52].
where is the ET observed by vorticity on day , is the ET estimated by remote sensing on day , is the mean ET value observed by vorticity, and is the total number of observed samples.
In this study, ArcGIS (ESRI, West Redlands, CA, USA) and ENVI (Environment for Visualizing Images, Exelis Visual Information Solutions, Boulder, CO, USA) were used to process the RS images and PyCharm (JetBrains, Prague, Czech Republic) was used to construct the SEBAL model using the Python programming language.
3. Results and Discussion
3.1. Estimation Accuracy of the SEBAL Model for Daily ET in the GFPIS
In this paper, Landsat images on typical days with cloudless skies or less cloud cover were selected to analyze the estimated surface ET results in the growing season of 2017, which were 25 May, 12 July, 14 September, and 30 September 2017. Due to cloud cover and other influences, the processing results of some pixels were still null, as shown in Figure 5.
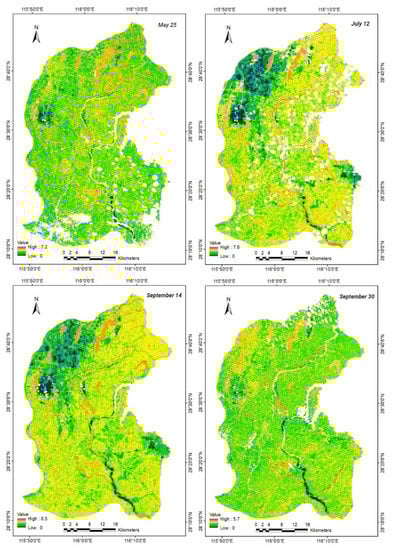
Figure 5.
Daily ET estimated in the GFPIS in 2017 by the SEBAL model.
In terms of time series, the maximum ET value in the GFPIS was 7.6 mm/day on July 12, followed by those on 25 May and 14 September, and the minimum daily ET was 5.6 mm/day on 30 September. The ET of the farmland area on 12 July and 14 September was higher, and the ET of the farmland area on 30 September was lower than that on 14 September. In terms of the four seasons, the maximum and minimum ET values were observed in summer and winter, respectively; moderate values were observed in spring and autumn; and higher values were observed in spring than in autumn.
The ET was estimated by the SEBAL model in 2016 and 2017 and the ETs observed based on the eddy covariance at the experimental station are shown in Figure 6. The RMSE of the comparison between the model estimation results and the observation results was 0.84 mm/d, the R2 was 0.85, and the NSE was 0.81. Figure 6 shows that the estimated ET results in 2016 and 2017 were consistent with the observed eddy covariance values. In general, the ET estimated by the SEBAL model was of high accuracy, and the adaptability and stability of the SEBAL model in the irrigated area of GFPIS were satisfactory.
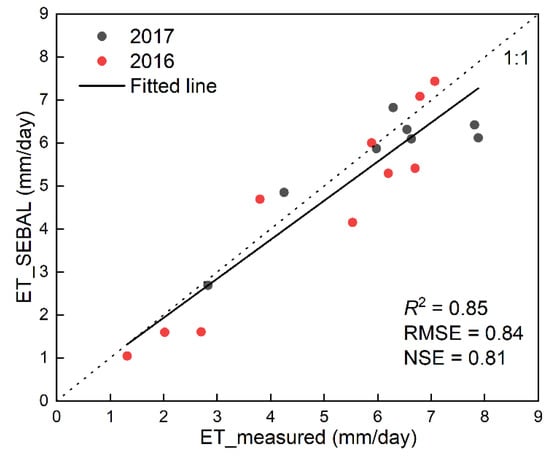
Figure 6.
Validation of the estimated ET.
The results of this study indicate that the SEBAL model has reasonable accuracy when predicting the ET of subtropical regions. In Tan et al.’s previous study in 2021 [42], the SEBAL model was applied to estimate the ET characteristics in a subtropical region (Huaihe River Basin, China) and the SEBAL model performance was evaluated by fitting the regression with the daily reference ET calculated by multiple theoretical methods. The results showed that the bias between the ET estimated by the SEBAL model and daily reference ET was less than 1.5%. The results of this study have a slightly higher error than that in the previous study. The bias of the SEBAL model’s estimation of ET is mainly due to the following factors: (1) The SEBAL model relies on instantaneous surface temperature, and the selection of hot and cold pixels in the imagery is subjective, which has a great impact on the accuracy of ET estimation; (2) The SEBAL model has been proven to be applicable for estimating ET in flat surfaces with relative accuracy, while it tends to have a high bias when applied to mountainous areas [53], which may lead to some increase in bias due to the presence of some hilly areas in our study area; and (3) Studies have shown that even a thin layer of clouds can lead to large errors when calculating sensible heat fluxes [54].
Landsat images with a resolution of 30 m can reflect spatial differences in the ET distribution. Moreover, ET is greatly affected by different ground object types. The greatest evapotranspiration occurred from water bodies—mainly lakes and rivers—whose ET was approximately 5 mm/day. The daily ET of the urban construction area and beach sand was the lowest at only 0–3 mm/day. The ET of forestland and farmland varied with different growth stages. Thus, the estimated spatial distribution of evapotranspiration in the irrigated area is consistent with the actual evapotranspiration.
3.2. Variation in the Daily Rice ET during the Growing Season
The daily variation characteristics of ET from paddy fields in the GFPIS were analyzed based on the ET of double-season rice in 2016 and 2017, and the results are shown in Table 2.
Table 2.
SEBAL-estimated daily average evapotranspiration from early and late rice in 2016 and 2017.
In June 2016, as the rice grew and changed from the booting stage to the heading stage. The average ET value increased from 4.69 mm/day on June 7 to 7.43 mm/day on 23 June. On 9 July, as the double-season early rice was in the mature stage, the ET was weak and had a value of 6 mm/day. On 25 July, as the double-season late rice was about to enter the tiller stage, the ET increased to 7.08 mm/day. In September, the ET of double-season late rice was approximately 5.3 mm/day; and in October, it decreased to 4.15 mm/d as double-season late rice entered the mature stage.
In May 2017, as rice growth and transpiration increased, the daily ET value of rice also increased gradually from 5.87 mm/day on 9 May to 6.31 mm/day on 25 May. In July and August, the peak of the double-season early and late rice growing season occurred, the temperature in the GFPIS was high, and the daily ET of rice fields also maintained a high value, which was higher than 6 mm/day. On 14 September, when the late rice was in the heading stage, transpiration remained at 6.09 mm/day. However, the transpiration intensity gradually decreased on 30 September when the rice was in the milking stage and water was lacking in the paddy field due to evaporation by the sun; therefore, the transpiration value decreased significantly to 4.85 mm/day. In November, the transpiration value reached a minimum of 2.69 mm/day when there was no vegetation in the paddy field.
The results showed that the seasonal ET exhibited significant changes and was closely related to the climate. Overall, excluding November and December after rice harvest, the regional daily average double-season early and late rice ET values in 2016 and 2017 showed a pattern higher than 6 mm/day in July and August and lower than 5 mm/day in late September and October, while the daily average paddy ET values varied in the range of 5 to 6 mm/day for the rest of the year.
3.3. Interannual Variation in ET and Precipitation in the Rice Growing Season
Due to cloudy and rainy weather during the growing season of early rice, limited remote sensing image data are available, and no data are available to calculate the ET of the growing season of early rice in 2003, 2008, 2010, and 2015. Due to the lack of data, we cannot obtain the distribution map of early, middle, and late rice in each year. According to our extraction results for paddy rice in the GFPIS in a previous study [37], the rice planting structure changed, with 2010 as the boundary; according to the available quantity and image quality of satellite data sources during the rice growing period, the middle and double-season rice maps of 2003 were used to calculate the ET of paddy fields from 2000 to 2009 and the middle and double-season rice maps of 2017 were used to calculate the ET of paddy rice from 2010 to 2017. The division of the rice growing season was determined by the observation data from the Jiangxi Irrigation Experiment Station, where the early rice growing season was from 22 April to 10 July, the middle rice growing season was from 26 June to 7 October, and the late rice growing season was from 19 July to 24 October.
Figure 7 shows the interannual variation in ET and precipitation in the rice growing season by the SEBAL model combined with the paddy rice distribution map. The interannual variation in evapotranspiration in the GFPIS from 2000 to 2017 shows that the ET of middle rice is generally the largest, with a multiyear average value of 434 mm; followed by the ET of the late rice growing season, with a multiyear average value of 380 mm; and the ET of early rice is the smallest, with a multiyear average value of 287 mm. The ET in the early rice growing season ranged from 263 mm to 349 mm, with maximum and minimum values occurring in 2013 and 2014, respectively. The average ET value during the growing season of middle rice ranged from 378 mm to 520 mm, with maximum and minimum values occurring in 2016 and 2009, respectively. The mean ET value during the growing season of late rice ranged from 324 mm to 457 mm, with maximum and minimum values occurring in 2016 and 2012, respectively.
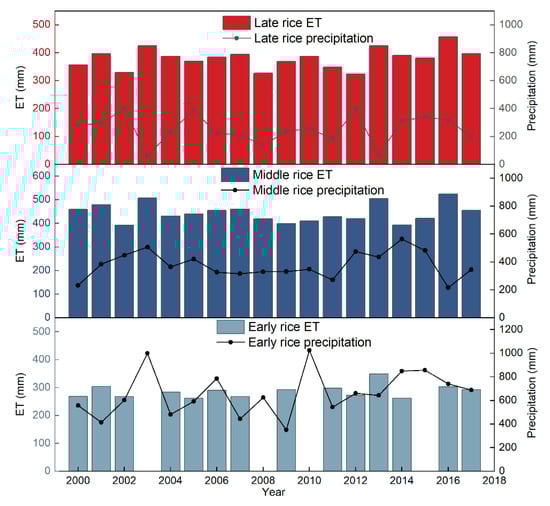
Figure 7.
Interannual variation in ET and precipitation in the rice growing season in the GFPIS.
The interannual variation trend of ET during the rice growing season of early rice was not obvious, but the variation trend of ET of middle rice and late rice was consistent. The interannual change in ET of middle rice and late rice was not significant before 2003, and ET of middle rice and late rice showed a downward trend from 2003 to 2009, while ET of middle rice and late rice showed an upward trend from 2009 to 2017.
As can be seen from Figure 7, the interannual variation trend of precipitation is opposite to the interannual variation trend of ET overall in rice growing season, showing a negative correlation which is especially obvious in the early rice growth season. This may be that the study area is located in the subtropical monsoon region, and the east Asian summer circulation is enhanced during the early rice growth period, resulting in increased precipitation. ET can be regarded as one of the most important factors for indicating climate change at the catchment scale [55], and our research supports this view. Meanwhile, the interannual variation of ET is closely related with many ecological factors. This study’s focus on the analysis of the time characteristics of ET and cannot directly explain the relationship between the interannual variation in ET and precipitation. If ET values are combined with meteorological factors, topographical factors, and vegetation changes, we may arrive at a more accurate and comprehensive understanding of the relationship between the interannual variation in ET and precipitation in the study area.
3.4. Spatial Distribution of ET during Rice Growth in Different Hydrological Years
Table 3 shows the precipitation and ET values during the rice growing season in different hydrological years, and the selection of a typical hydrological year is explained in Section 2.3. Almost no difference was observed between the ET of early rice in wet years and dry years, which might be due to the abundant precipitation of different hydrological years in the growing season of early rice. The ET of middle rice in different hydrological years showed significant differences, with a value of 393 mm in wet years, 423 mm in normal years, and 520 mm in dry years. The ET of late rice in wet years and normal years showed little difference, and the values in dry years were 330 mm and 367 mm. Overall, ET showed limited differences in the early and late rice in different hydrological years, but great differences in middle rice.
Table 3.
ET of early, middle, and late rice during typical years in the GFPIS.
Figure 8 and Figure 9 show the ET frequency distribution and spatial distribution of rice in different hydrological years. In the wet year (2014), the early rice ET in the GFPIS was mainly within the range of 200–300 mm, with an average of 263 mm. The ET of the first, third, and fourth main canals of the irrigated area was between 263 mm and 283 mm. The early rice ET in the second main canal and the middle of the main trunk canal was lower than the average early rice ET in the whole irrigated area, and the early rice ET in the east trunk canal and the main canal was generally approximately 243–263 mm. In the dry year (2007), the ET of early rice was mainly in the range of 225–300 mm, with an average of 267 mm. Among them, the early rice ET in the first, second, and third main canal irrigated areas was higher than the average early rice ET value in the whole irrigated area, and the early rice ET in the fourth main canal and the end of the third main canal irrigated area was lower than the average value. These results indicate that the mean values of early rice ET do not differ significantly in different hydrological years, although significant differences occur in the spatial distribution of early rice ET.
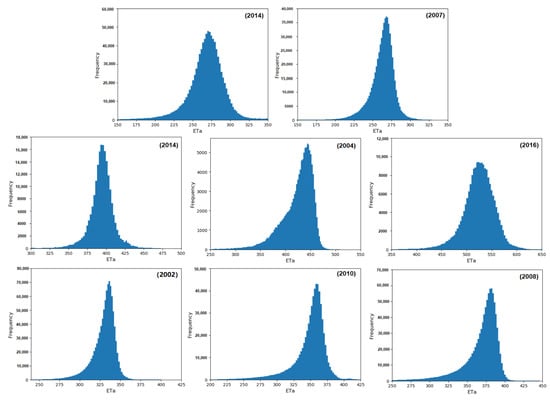
Figure 8.
Frequency distribution of rice ET in different hydrological years.
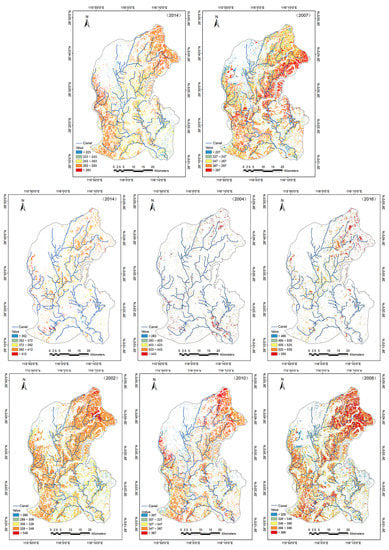
Figure 9.
Spatial distribution of rice ET in different hydrological years.
The middle rice ET values in the wet year (2014) mainly ranged between 375 mm and 425 mm and the mean middle rice ET value in the whole irrigated area was 392 mm, with little spatial difference. In the normal year (2004), the middle rice ET mainly ranged from 360 mm to 450 mm and the average middle rice ET value in the whole irrigated area was 423 mm. In terms of spatial distribution, the middle rice ET in the east main trunk and the end of the fourth main canal was higher than 450 mm. In the dry year (2016), the middle rice ET value mainly ranged from 487–570 mm and the mean ET value was 525 mm in the whole irrigated area. There were differences in the spatial distribution of ET, with generally higher values at the end of the fourth main canal and the second main canal compared with the mean ET value in the whole irrigated area while the ET values in the middle section of the west main canal and the second main canal were lower than 525 mm.
The late rice ET values in the wet year (2002) in the GFPIS mainly ranged from 300 mm to 350 mm, with an average value of 328 mm. In the western GFPIS, the late rice ET was generally higher than that of early rice and the ET was evenly distributed. The eastern GFPIS is a hilly area, and the late rice ET was generally lower than the mean value. In the normal year (2010), the late rice ET values in the GFPIS areas mainly ranged from 300 mm to 380 mm, with an average value of 347 mm. The late rice ET at the end of the second main canal and the fourth main canal was higher than that in the whole irrigated area (347 mm). The late rice ET in the third main canal and the first main canal irrigated area was higher than that in the whole irrigated area. In the dry year (2008), the late rice ET in the whole irrigated area mainly ranged from 325 mm to 400 mm, with an average value of 366 mm. The spatial distribution of the late rice ET was similar to that of the wet year, and the late rice ET in the western irrigated area was higher than the average value, while the ET in the eastern irrigated area was lower than the average value overall. Compared with the wet year, the ET in the whole irrigated area increased in dry years and mainly ranged from 40 mm to 60 mm.
In general, the late rice ET in the western irrigated areas was higher than the mean late rice value in irrigated areas in different hydrological years. The late rice ET in the irrigated areas of the first and second main canals and the third canal was slightly higher than the mean late rice ET in the whole irrigated area in the three hydrological years. In the normal and dry years, the late rice ET at the end of the fourth main canal and the second main canal was much higher than the mean late rice ET value in the whole irrigated area. This finding is related to water resource dispatching measures in the GFPIS. In the case of drought, the first, second, and third main canals on the east main canal and west main canal should be adopted to temporarily control water inflow so that the water output can guarantee water for production and living in the middle and lower reaches of the irrigated area. The late rice ET of the eastern irrigated area and the hilly area near the west main water inlet in the three hydrological years was generally lower than the mean late rice ET value of the GFPIS [56]. Agricultural water consumption accounts for approximately 8% of the actual water consumption in the eastern irrigated area; therefore, the irrigation conditions in the irrigated area are not as good as those in the western irrigated area.
4. Conclusions
In this paper, the SEBAL model was applied to the subtropical climate region of southern China (GFPIS) to assess its rationality and applicability for daily scale estimates of paddy ET and to analyze the spatial and temporal distribution characteristics of early, middle, and late rice evapotranspiration in the GFPIS in different hydrologic years. The main conclusions are as follows:
- (1)
- On the daily scale, the ET estimated by the SEBAL model is consistent with the eddy covariance, with R2, NSE, and RMSE values of 0.85, 0.81, and 0.84 mm/day, respectively.
- (2)
- Based on the analysis of the temporal characteristics of paddy ET, the daily average evapotranspiration value in irrigated areas was higher in July and August but lower in other months. The interannual variation trend of ET during the growing season of early rice was not obvious from 2000 to 2017, while that during the growing season of middle rice and late rice generally showed a downward trend from 2000 to 2009 and an upward trend after 2009.
- (3)
- In terms of spatial distribution, significant differences were observed between early rice and late rice in different hydrological years. The spatial difference of middle rice was not significant in the wet year but was significant in the dry year.
Due to the large amount of water evaporation in paddy fields, the single-source SEBAL model needs further research to estimate ET in rice flooding periods, which will improve the accuracy of the SEBAL model in estimating ET in rice growing areas.
Author Contributions
Conceptualization, Y.L., J.C. and G.W.; Methodology, Y.L., J.C. and G.W.; Software, J.C. and G.W.; Validation, H.X (Hua Xie). and Y.Y.; Formal analysis, J.C. and G.W.; Investigation, J.C. and H.X. (Hengwang Xie); Resources, C.W. and Y.C.; Data curation, Y.Y. and C.W.; Writing—original draft preparation, J.C. and G.W.; Writing—review and editing, Y.L., G.W. and Y.C.; Visualization, G.W.; Supervision, Y.L.; Project administration, Y.L.; Funding acquisition, Y.L. All authors have read and agreed to the published version of the manuscript.
Funding
This work was financially supported by the NSFC-MWR-CTGC Joint Yangtze River Water Science Research Project (No. U2040213) and the National Natural Science Foundation of China (nos. 51979201 and 51779187).
Institutional Review Board Statement
Not applicable.
Informed Consent Statement
Not applicable.
Data Availability Statement
Not applicable.
Conflicts of Interest
The authors declare no conflict of interest.
References
- Mao, Z. Water Saving Irrigation for Rice and Its Effect on Environment. Strateg. Study Chin. Acad. Eng. 2002, 4, 8–16. [Google Scholar]
- Shao, G.; Han, W.; Zhang, H.; Liu, S.; Wang, Y.; Zhang, L.; Cui, X. Mapping maize crop coefficient Kc using random forest algorithm based on leaf area index and UAV-based multispectral vegetation indices. Agric. Water Manag. 2021, 252, 106906. [Google Scholar] [CrossRef]
- Dari, J.; Brocca, L.; Quintana-Seguí, P.; Escorihuela, M.J.; Stefan, V.; Morbidelli, R. Exploiting High-Resolution Remote Sensing Soil Moisture to Estimate Irrigation Water Amounts over a Mediterranean Region. Remote Sens. 2020, 12, 2593. [Google Scholar] [CrossRef]
- Zappa, L.; Schlaffer, S.; Bauer-Marschallinger, B.; Nendel, C.; Zimmerman, B.; Dorigo, W. Detection and Quantification of Irrigation Water Amounts at 500 m Using Sentinel-1 Surface Soil Moisture. Remote Sens. 2021, 13, 1727. [Google Scholar] [CrossRef]
- Yi, Z. Research and Application of Collaborating Acquisition of Evapotranspiration and Surface Soil Moisture over Irrigated Area. Ph.D. Thesis, China Institute of Water Resources and Hydropower Research, Beijing, China, 2019. [Google Scholar]
- Cao, M.; Wang, W.; Xing, W.; Wei, J.; Chen, X.; Li, J.; Shao, Q. Multiple sources of uncertainties in satellite retrieval of terrestrial actual evapotranspiration. J. Hydrol. 2021, 601, 126642. [Google Scholar] [CrossRef]
- Wang, J.; Ding, J.; Yu, D.; Ma, X.; Zhang, Z.; Ge, X.; Teng, D.; Li, X.; Liang, J.; Lizaga, I.; et al. Capability of Sentinel-2 MSI data for monitoring and mapping of soil salinity in dry and wet seasons in the Ebinur Lake region, Xinjiang, China. Geoderma 2019, 353, 172–187. [Google Scholar] [CrossRef]
- Chen, Z.; Wang, W.; Woods, R.A.; Shao, Q. Hydrological effects of change in vegetation components across global catchments. J. Hydrol. 2021, 595, 125775. [Google Scholar] [CrossRef]
- Wang, J.; Ding, J.; Yu, D.; Teng, D.; He, B.; Chen, X.; Ge, X.; Zhang, Z.; Wang, Y.; Yang, X.; et al. Machine learning-based detection of soil salinity in an arid desert region, Northwest China: A comparison between Landsat-8 OLI and Sentinel-2 MSI. Sci. Total Environ. 2020, 707, 136092. [Google Scholar] [CrossRef] [PubMed]
- Wang, X.-G.; Wang, W.; Huang, D.; Yong, B.; Chen, X. Modifying SEBAL Model Based on the Trapezoidal Relationship between Land Surface Temperature and Vegetation Index for Actual Evapotranspiration Estimation. Remote Sens. 2014, 6, 5909–5937. [Google Scholar] [CrossRef] [Green Version]
- Urso, G.D.; Bolognesi, S.F.; Kustas, W.P.; Knipper, K.R.; Anderson, M.C.; Alsina, M.M.; Hain, C.R.; Alfieri, J.G.; Prueger, J.H.; Gao, F.; et al. Determining Evapotranspiration by Using Combination Equation Models with Sentinel-2 Data and Comparison with Thermal-Based Energy Balance in a California Irrigated Vineyard. Remote Sens. 2021, 13, 3720. [Google Scholar]
- Sobrino, J.A.; Souza Da Rocha, N.; Skoković, D.; Suélen Käfer, P.; López-Urrea, R.; Jiménez-Muñoz, J.C.; Alves Rolim, S.B. Evapotranspiration Estimation with the S-SEBI Method from Landsat 8 Data against Lysimeter Measurements at the Barrax Site, Spain. Remote Sens. 2021, 13, 3686. [Google Scholar] [CrossRef]
- Xue, J.; Anderson, M.C.; Gao, F.; Hain, C.; Yang, Y.; Knipper, K.R.; Kustas, W.P.; Yang, Y. Mapping Daily Evapotranspiration at Field Scale Using the Harmonized Landsat and Sentinel-2 Dataset, with Sharpened VIIRS as a Sentinel-2 Thermal Proxy. Remote Sens. 2021, 13, 3420. [Google Scholar] [CrossRef]
- Han, X.; Wei, Z.; Zhang, B.; Han, C.; Song, J. Effects of Crop Planting Structure Adjustment on Water Use Efficiency in the Irrigation Area of Hei River Basin. Water 2018, 10, 1305. [Google Scholar] [CrossRef] [Green Version]
- Tang, J.; Han, W.; Zhang, L. UAV Multispectral Imagery Combined with the FAO-56 Dual Approach for Maize Evapotranspiration Mapping in the North China Plain. Remote Sens. 2019, 11, 2519. [Google Scholar] [CrossRef] [Green Version]
- Srivastava, A.; Sahoo, B.; Raghuwanshi, N.; Singh, R. Evaluation of Variable-Infiltration Capacity Model and MODIS-Terra Satellite-Derived Grid-Scale Evapotranspiration Estimates in a River Basin with Tropical Monsoon-Type Climatology. J. Irrig. Drain. Eng. 2017, 143, 04017028. [Google Scholar] [CrossRef] [Green Version]
- Jackson, R.D.; Reginato, R.J.; Idso, S.B. Wheat canopy temperature: A practical tool for evaluating water requirements. Water Resour. Res. 1977, 13, 651–656. [Google Scholar] [CrossRef]
- Jiang, L.; Islam, S. A methodology for estimation of surface evapotranspiration over large areas using remote sensing observations. Geophys. Res. Lett. 1999, 26, 2773–2776. [Google Scholar] [CrossRef] [Green Version]
- Moran, M.S.; Rahman, A.F.; Washburne, J.C.; Goodrich, D.C.; Weltz, M.A.; Kustas, W.P. Combining the Penman-Monteith equation with measurements of surface temperature and reflectance to estimate evaporation rates of semiarid grassland. Agric. Forest Meteorol. 1996, 80, 87–109. [Google Scholar] [CrossRef]
- Srivastava, A.; Kumari, N.; Maza, M. Hydrological Response to Agricultural Land Use Heterogeneity Using Variable Infiltration Capacity Model. Water Resour. Manag. 2020, 34, 3779–3794. [Google Scholar] [CrossRef]
- Ning, J.; Gao, Z.; Xu, F. Effects of land cover change on evapotranspiration in the Yellow River Delta analyzed with the SEBAL model. J. Appl. Remote Sens. 2017, 11, 16009. [Google Scholar] [CrossRef] [Green Version]
- Bai, L.; Cai, J.; Liu, Y.; Chen, H.; Zhang, B.; Huang, L. Responses of field evapotranspiration to the changes of cropping pattern and groundwater depth in large irrigation district of Yellow River basin. Agric. Water Manag. 2017, 188, 1–11. [Google Scholar] [CrossRef]
- Bai, L. Inversion and Application of Agriculture Evapotranspiration and Soil Moisture in Irrigation District Based on Multi-source Remote Sensing Data. Ph.D. Thesis, China Institute of Water Resources and Hydropower Research, Beijing, China, 2017. [Google Scholar]
- Lima, C.E.S.D.; Costa, V.S.D.O.; Galvíncio, J.D.; Silva, R.M.D.; Santos, C.A.G. Assessment of automated evapotranspiration estimates obtained using the GP-SEBAL algorithm for dry forest vegetation (Caatinga) and agricultural areas in the Brazilian semiarid region. Agric. Water Manag. 2021, 250, 106863. [Google Scholar] [CrossRef]
- Senkondo, W.; Munishi, S.E.; Tumbo, M.; Nobert, J.; Lyon, S.W. Comparing Remotely-Sensed Surface Energy Balance Evapotranspiration Estimates in Heterogeneous and Data-Limited Regions: A Case Study of Tanzania’s Kilombero Valley. Remote Sens. 2019, 11, 1289. [Google Scholar] [CrossRef] [Green Version]
- Kamali, M.I.; Nazari, R. Determination of maize water requirement using remote sensing data and SEBAL algorithm. Agric. Water Manag. 2018, 209, 197–205. [Google Scholar] [CrossRef]
- Rahimzadegan, M.; Janani, A. Estimating evapotranspiration of pistachio crop based on SEBAL algorithm using Landsat 8 satellite imagery. Agric. Water Manag. 2019, 217, 383–390. [Google Scholar] [CrossRef]
- García-Gutiérrez, V.; Stöckle, C.; Gil, P.M.; Meza, F.J. Evaluation of Penman-Monteith Model Based on Sentinel-2 Data for the Estimation of Actual Evapotranspiration in Vineyards. Remote Sens. 2021, 13, 478. [Google Scholar] [CrossRef]
- Gobbo, S.; Presti, S.L.; Martello, M.; Panunzi, L.; Berti, A.; Morari, F. Integrating SEBAL with in-Field Crop Water Status Measurement for Precision Irrigation Applications—A Case Study. Remote Sens. 2019, 11, 2069. [Google Scholar] [CrossRef] [Green Version]
- Grosso, C.; Manoli, G.; Martello, M.; Chemin, Y.; Pons, D.; Teatini, P.; Piccoli, I.; Morari, F. Mapping Maize Evapotranspiration at Field Scale Using SEBAL: A Comparison with the FAO Method and Soil-Plant Model Simulations. Remote Sens. 2018, 10, 1452. [Google Scholar] [CrossRef] [Green Version]
- Bastiaanssen, W.G.M.; Noordman, E.J.M.; Pelgrum, H.; Davids, G.; Thoreson, B.P.; Allen, R.G. SEBAL Model with Remotely Sensed Data to Improve Water-Resources Management under Actual Field Conditions. J. Irrig. Drain. Eng. 2005, 131, 85–93. [Google Scholar] [CrossRef]
- Sun, Z.; Wei, B.; Su, W.; Shen, W.; Wang, C.; You, D.; Liu, Z. Evapotranspiration estimation based on the SEBAL model in the Nansi Lake Wetland of China. Math. Comput. Model. 2011, 54, 1086–1092. [Google Scholar] [CrossRef]
- Gao, X.; Sun, M.; Luan, Q.; Zhao, X.; Wang, J.; He, G.; Zhao, Y. The spatial and temporal evolution of the actual evapotranspiration based on the remote sensing method in the Loess Plateau. Sci. Total Environ. 2020, 708, 135111. [Google Scholar] [CrossRef] [PubMed]
- Ding, C. Research and Implementation of Remote Sensing Ground Evapotranspiration Estimation Algorithm Based on SEBAL Model. Master’s Thesis, Xidian University, Xi’An, China, 2020. [Google Scholar]
- Du, J.; Zhang, B.; Song, K.; Wang, Z.; Zeng, L. Study on Daily evapotranspiration estimation of Sanjiang Plain based on MODIS product and SEBAL Model. Chin. J. Agrometeorol. 2010, 31, 104–110. [Google Scholar]
- Du, J.; Song, K.; Wang, Z.; Zhang, B.; Liu, D. Evapotranspiration estimation based on MODIS products and surface energy balance algorithms for land (SEBAL) model in Sanjiang Plain, Northeast China. Chin. Geogr. Sci. 2013, 23, 73–91. [Google Scholar] [CrossRef]
- Li, H.; Zheng, L.; Lei, Y.; Li, C.; Liu, Z.; Zhang, S. Estimation of water consumption and crop water productivity of winter wheat in North China Plain using remote sensing technology. Agric. Water Manag. 2008, 95, 1271–1278. [Google Scholar] [CrossRef]
- Kimura, R.; Bai, L.; Fan, J.; Takayama, N.; Hinokidani, O. Evapo-transpiration estimation over the river basin of the Loess Plateau of China based on remote sensing. J. Arid Environ. 2007, 68, 53–65. [Google Scholar] [CrossRef]
- Li, X.; Xu, X.; Wang, X.; Xu, S.; Tian, W.; Tian, J.; He, C. Assessing the Effects of Spatial Scales on Regional Evapotranspiration Estimation by the SEBAL Model and Multiple Satellite Datasets: A Case Study in the Agro-Pastoral Ecotone, Northwestern China. Remote Sens. 2021, 13, 1524. [Google Scholar] [CrossRef]
- Wu, Z.; Wang, M.; Zhao, X. Retrieval of land surface heat fluxes based on SEBAL model in hyper-arid region. Sci. Surv. Mapp. 2015, 40, 26–29. [Google Scholar]
- Kayser, R.H.; Ruhoff, A.; Laipelt, L.; Kich, E.D.M.; Roberti, D.R.; Souza, V.D.A.; Rubert, G.C.D.; Collischonn, W.; Neale, C.M.U. Assessing geeSEBAL automated calibration and meteorological reanalysis uncertainties to estimate evapotranspiration in subtropical humid climates. Agric. Forest Meteorol. 2022, 314, 108775. [Google Scholar] [CrossRef]
- Tan, L.; Zheng, K.; Zhao, Q.; Wu, Y. Evapotranspiration Estimation Using Remote Sensing Technology Based on a SEBAL Model in the Upper Reaches of the Huaihe River Basin. Atmosphere 2021, 12, 1599. [Google Scholar] [CrossRef]
- Laipelt, L.; Bloedow Kayser, R.H.; Santos Fleischmann, A.; Ruhoff, A.; Bastiaanssen, W.; Erickson, T.A.; Melton, F. Long-term monitoring of evapotranspiration using the SEBAL algorithm and Google Earth Engine cloud computing. ISPRS J. Photogramm. 2021, 178, 81–96. [Google Scholar] [CrossRef]
- Cao, J.; Cai, X.; Tan, J.; Cui, Y.; Xie, H.; Liu, F.; Yang, L.; Luo, Y. Mapping paddy rice using Landsat time series data in the Ganfu Plain irrigation system, Southern China, from 1988–2017. Int. J. Remote Sens. 2021, 42, 1556–1576. [Google Scholar] [CrossRef]
- Bastiaanssen, W.G.M.; Menenti, M.; Feddes, R.A.; Holtslag, A.A.M.; Hutjes, R.W.A.; Kabat, P.; Bass, B.; Field, C.; Running, S.W.; Shuttleworth, W.J. A remote sensing Surface Energy Balance Algorithm for Land (SEBAL); 1, Formulation. J. Hydrol. 1998, 212–213, 198–212. [Google Scholar] [CrossRef]
- Martín-Ortega, P.; García-Montero, L.G.; Sibelet, N. Temporal Patterns in Illumination Conditions and Its Effect on Vegetation Indices Using Landsat on Google Earth Engine. Remote Sens. 2020, 12, 211. [Google Scholar] [CrossRef] [Green Version]
- Teixeira, A.H.D.C.; Bastiaanssen, W.G.M.; Ahmad, M.D.; Bos, M.G. Reviewing SEBAL input parameters for assessing evapotranspiration and water productivity for the Low-Middle São Francisco River basin, Brazil. Agric. Forest Meteorol. 2009, 149, 462–476. [Google Scholar] [CrossRef] [Green Version]
- Bastiaanssen, W.G.M.; Ahmad, M.; Chemin, Y. Satellite surveillance of evaporative depletion across the Indus Basin. Water Resour. Res. 2002, 38, 1–9. [Google Scholar] [CrossRef]
- Allen, R.G.; Pereira, L.S.; Raes, D.; Smith, M. Crop Evapotranspiration: Guidelines for Computing Crop Requirements; FAO Irrigation and Drainage Paper 56; Food and Agricultural Organization of the U.N.: Rome, Italy, 1998. [Google Scholar]
- Yang, Y.; Shang, S.; Jiang, L. Remote sensing temporal and spatial patterns of evapotranspiration and the responses to water management in a large irrigation district of North China. Agric. Forest Meteorol. 2012, 164, 112–122. [Google Scholar] [CrossRef]
- Ge, X.; Ding, J.; Jin, X.; Wang, J.; Chen, X.; Li, X.; Liu, J.; Xie, B. Estimating Agricultural Soil Moisture Content through UAV-Based Hyperspectral Images in the Arid Region. Remote Sens. 2021, 13, 1562. [Google Scholar] [CrossRef]
- Wang, J.; Shi, T.; Yu, D.; Teng, D.; Ge, X.; Zhang, Z.; Yang, X.; Wang, H.; Wu, G. Ensemble machine-learning-based framework for estimating total nitrogen concentration in water using drone-borne hyperspectral imagery of emergent plants: A case study in an arid oasis, NW China. Environ. Pollut. 2020, 266, 115412. [Google Scholar] [CrossRef] [PubMed]
- Zhong, Y.; Zhong, M.; Mao, Y.; Ji, B. Evaluation of Evapotranspiration for Exorheic Catchments of China during the GRACE Era: From a Water Balance Perspective. Remote Sens. 2020, 12, 511. [Google Scholar] [CrossRef] [Green Version]
- Liu, C.; Zhang, D.; Liu, X.; Zhao, C. Spatial and temporal change in the potential evapotranspiration sensitivity to meteorological factors in China (1960–2007). J. Geogr. Sci. 2012, 22, 3–14. [Google Scholar] [CrossRef]
- Zhang, H.; Wang, L. Analysis of the variation in potential evapotranspiration and surface wet conditions in the Hancang River Basin, China. Sci. Rep. 2021, 11, 1–10. [Google Scholar] [CrossRef]
- He, Z. The Study on Water Allocation and Related Engineering Measure Research of Ganfu Plain Irrigation Area. Master’s Thesis, NanChang Univeresity, Nanchang, China, 2012. [Google Scholar]
Publisher’s Note: MDPI stays neutral with regard to jurisdictional claims in published maps and institutional affiliations. |
© 2022 by the authors. Licensee MDPI, Basel, Switzerland. This article is an open access article distributed under the terms and conditions of the Creative Commons Attribution (CC BY) license (https://creativecommons.org/licenses/by/4.0/).