Abstract
Social media texts spontaneously produced and uploaded by the public contain a wealth of disaster information. As a supplementary data source for remote sensing, they have played an important role in disaster reduction and emergency response in recent years. However, social media also has certain flaws, such as insufficient location information, etc. This affects the efficiency of combining these data with remote sensing data. For flood disasters in particular, extensively flooded areas limit the distribution of social media data, which makes it difficult for these data to function as they should. In this paper, we propose a disaster reduction framework to solve these problems. We first used an approach that was based on search engine and lexical rules to automatically extract disaster-related location information from social media texts. Then, we combined the extracted information with the upload location of social media itself to construct location-pointing relationships. These relationships were used to build a new social network, which can be used in combination with remote sensing images for disaster analysis. The analysis integrated the advantages of social media and remote sensing. It can not only provide macro disaster information in the study area but can also assist in evaluating the disaster situation in different flooded areas from the perspective of public observation. In addition, the timeliness of social media data also improved the continuity and situational awareness of flood monitoring. A case study of the flood disaster in the Yangtze River Basin in China in 2020 was used to verify the effectiveness of the method described in this paper.
1. Introduction
With the intensification of global climate change, meteorological disasters such as heavy rains and floods frequently occur [1,2]. This has caused a large number of casualties and property losses, which seriously affect the sustainable development of society [3]. Due to the development of science and technology, Earth observation methods represented by remote sensing have played an important role in disaster reduction [4,5]. They provide detailed snapshots of conditions that cover a wide range of disaster areas, which are convenient for disaster assessment and auxiliary rescue [6]. However, remote sensing also has some limitations. The revisit period of satellites is long, which makes it difficult to continuously monitor disaster-stricken areas [7]. Conversely, remote sensing is used more to describe the macro situation in the disaster-stricken area, such as the scope of the flooded area. It is difficult to learn the specific situation in these areas, and it is also difficult to assess which areas are most affected by a disaster. With the popularity of the internet and smart mobile devices [8], social media, as a kind of crowd-sourced data, has brought new opportunities for disaster reduction. Compared with traditional remote sensing, social media data from the public have the advantages of high timeliness and rich disaster information and can be used as an effective supplementary data source for remote sensing.
Social media has rich attribute features (e.g., space, time, content, and network), which have been well applied to disaster reduction [9]. Combining these attribute features with remote sensing data can effectively improve the effect of disaster reduction [10]. Many scholars have carried out research on this. For example, Denis et al. [11] developed a comprehensive system integrating remote sensing and social media data for decision making and rapid information dissemination. The system can help guide and evacuate people at risk in disasters in a timely manner. Qunying Huang et al. [12] proposed a framework that integrates multi-source data (e.g., social media, remote sensing, etc.) to help in the disaster analysis of historical and future events. Jun Li et al. [13] systematically discussed the key technologies used for integrating content and spatial information contained in social media with remote sensing data and showed the application effects of multi-source data integration in different fields with different examples. For the flood disaster mentioned in this paper, the fusion of multi-source data also showed great application potential. By introducing the spatiotemporal information contained on social media, the efficiency of flood inundation mapping can be improved [14,15,16,17]. The combination of location-marked pictures and remote sensing data can better judge the traffic conditions of urban roads under floods [18]. In [19], real-time data collected from social media were fused with remote sensing data for transportation damage assessment. Related studies have mostly relied on the tags of upload location on social media, which was also the basis for combining social media with remote sensing images. However, due to user habits (most users do not want to upload their location information to social media platforms), most social media data does not contain location tags [20]. Moreover, some disasters, especially floods, limit the spatial distribution of social media data (it is hard for people to upload social media in heavily flooded areas), which makes it difficult for us to keep abreast of detailed disaster information in hard-hit areas. This information is particularly important for disaster reduction. In this paper, we propose a framework that aims to improve the efficiency of combining social media data with remote sensing data in order to mine more disaster information from disaster-affected areas. We wanted to compensate for the insufficient location information of these data by extracting location information involving flooded areas from social media texts. On this basis, we constructed a new social network based on the relationship between different location information (uploading location information from social media and location information contained in text) in social media data to explore how to use multi-source data to assess and monitor disasters in severely affected areas.
1.1. Rapid Extraction of Disaster-Related Location Information Contained in Social Media Data
There are some studies [21,22] that have found that social media text contained a large number of locational words, which can effectively make up for the insufficient location information of the data. When an area was flooded, it usually attracted the attention of many people in the surrounding areas (these areas might not have been affected or might have been less affected by the flood), and these people would upload social media texts containing the location of the flooded area. We can then understand the disaster situation in the flooded area through this data. In addition, if an area was mentioned by more people, it might also mean that the area was more severely affected by disaster. There are three kinds of methods for extracting words with spatial attributes from Chinese texts, including dictionary-based [23,24], rule-based [25,26] and machine learning methods [27,28] (as well as deep learning [29]). These methods have their own advantages but all require certain labor costs. For example, the dictionary-based method is the most convenient, but the maintenance and update costs of dictionaries are high; the rule-based method has high accuracy, but it is difficult to apply to different scenarios, and the formulation of rules requires the participation of expert knowledge; machine learning methods have good flexibility, but the model requires a large amount of annotated corpus. Fortunately, there are some natural language processing tools available that integrate some existing methods to help identify locational words in text, such as “Stanford NLP (https://nlp.stanford.edu/ accessed on 15 January 2022)”, “NLPIR (http://ictclas.nlpir.org/ accessed on 15 January 2022)” and “Hanlp (https://www.hanlp.com/, accessed on 15 January 2022)”, etc. This saves a lot of labor for our work. However, through experiments, we found that some words were not well recognized, and they were often fragmented due to incorrect word segmentation. For example, the locational word “同马大堤 (Tongma Dyke)” was wrongly divided into “同 (Tong)”, “马 (Ma)”, “大堤 (Dyke)”. Therefore, we used a method that combined the Internet search engines and Chinese lexical rules to effectively recall those locational words, which were not correctly recognized by natural language processing tools. It improved the recognition efficiency of locational words in social media texts and satisfied the requirements of subsequent experiments.
1.2. Flood Disaster Assessment and Monitoring Combined with Multi-Source Data
We dealt with remote sensing and social media data separately. For remote sensing data, we obtained SAR images related to the study area before and after the disaster, and mapped the flooded areas based on these data. For social media, based on the different location information of social media (uploaded location information of social media and location information contained in the text), we constructed a new social network that can describe pointing relationships between spatial locations. These relationships can reflect the distribution of victims and their attention. Then, the social network and processed remote sensing images were comprehensively considered to mine disaster information. These multi-source data can not only provide the macro disaster situation in a study area but can also assess the disaster in different areas through public concern. Conversely, we used the continuous theme change information of social media data to dynamically monitor the severely flooded area, which effectively provided situational awareness to emergency responders, as well as assistance to disaster reduction. The flood disaster in the Yangtze River Basin in China in 2020 was used as a case study to verify the effectiveness of the method in this paper.
2. Study Area and Data
2.1. Study Area
Every year from mid-June, the Yangtze River Basin in China enters the “Meiyu” period, and there is continuous rainfall in this area. In 2020, the accumulated rainfall and duration days in the area exceeded the level in the same period over the years. In the southern Anhui Province in particular, due to the continuous torrential rain, many estuaries reached the upper limit of water volume on July 21, resulting in serious floods. In this paper, we took the central and southern regions of the Anhui Province as the study area, and the relevant scope is shown in Figure 1.
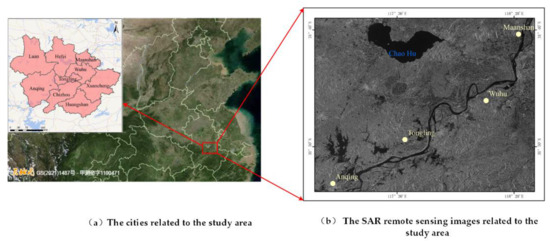
Figure 1.
The study area shown in this paper. Among them, (a) depicts the cities involved in the study area; (b) shows the SAR remote sensing image covering the study area.
2.2. Data Collection
We collected multi-source data related to the disaster, including remote sensing data and social media data.
2.2.1. Remote Sensing Data
Unlike optical systems, SAR is an active sensor that utilizes microwaves, which can penetrate clouds and generate ground information regardless of atmospheric conditions [30]. Therefore, the “Sentinel-1” SAR was selected in this paper. We obtained the post-flood (on 27 July) images from the website “USGS” (https://earthexplorer.usgs.gov/ accessed on 15 January 2022). The study area is shown in Figure 1b. We also obtained pre-flood images (on 10 April) for the same area from this website.
2.2.2. Social Media Data
The social media data used in this paper came from Sina microblog, which is the largest social media platform in China. We developed a crawler tool based on the advanced search platform of Sina microblog, which can obtain data related to this disaster in a specified area and a specified time period by setting search conditions. Through web page parsing, these data are stored in the database in a structured form, including fields such as time, location tags and content, etc. After de-duplication, the corresponding data totaled 10,839. The relevant data involved nine cities, including Hefei, Liuan, Ma’anshan, Wuhu, Tongling, Anqing, Chizhou, Xuancheng and Huangshan, as shown in Figure 1a. The time span of the data is from 21 to 30 July.
3. Methods
In this paper, we proposed a framework that integrated algorithms, including natural language processing, network analysis, etc., to extract locational words from social media texts and construct a new social network based on different kinds of locational information on social media. Then, we combined the network with processed remote sensing data to serve as disaster reduction. The structure of the proposed framework is shown in Figure 2.
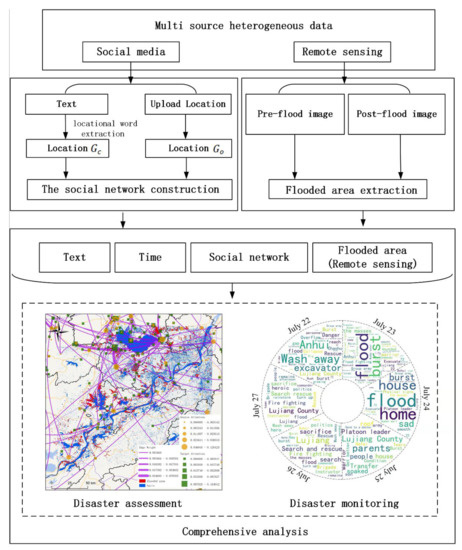
Figure 2.
The structure of the proposed framework in this paper.
3.1. Location Information Extraction Based on Social Media Text
Existing natural language processing tools have a certain ability to identify locational words contained in text. However, due to the limitation of Chinese word segmentation accuracy, some locational words are often destroyed such that they cannot be recognized by tools. In this paper, we introduce a method based on Chinese lexical rules and search engine knowledge discovery to recall the locational word form fragmented words. The method flow is shown in Figure 3.
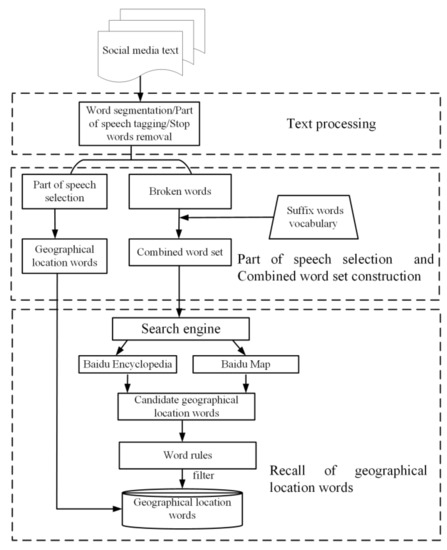
Figure 3.
The process of extracting locational words in social media text.
3.1.1. Text Processing
We used the commonly used Chinese natural language processing tool “HanLP” to process social media text. The main processing flow included word segmentation, which is part of speech tagging and stop word removal. Among them, stopping word removal means discarding those words that have no practical meaning in the text, such as “的 (of)”, “是 (is)” and so on. They contributed little to the semantics and affected the efficiency of the subsequent processing of the text.
3.1.2. Part of Speech Selection and Word Set Construction
After word segmentation and part of speech tagging, we obtained those words with location tags. These tags were provided by the “HanLP” tool, such as “ns (place name label)”, “nt (institution name label)”, “ntcf (factory name label)”, etc. Some common locational words were identified by filtering these tags. However, there were some potential words with spatial attributes that had not been correctly identified due to incorrect word segmentation. For example, after text processing, the sentence “暴雨使的附近同马大堤有崩溃的风险! (the torrential rainstorm may break the nearby “Tongma dike”!)” can be converted into “(暴雨/n, 附近/f, 同/p, 马/n, 大堤/n, 有/vyou, 崩溃/vg, 风险/n)”. In the original text, “同马大堤 (Tongma dike)” was a locational word, which showed the area where the disaster occurred. However, it was broken into three words, including “同(Tong)/p”, “马(Ma)/n” and “大堤 (Dyke)/n”. We needed to restore these fragmented words correctly. In this paper, a suffix word vocabulary related to locational words was summarized based on the named entity library provided by “HanLP”, such as “堤 (dyke)”, “路 (road)”, etc. These suffix words can help us locate potential locational words in the fragmented words. When a word was matched successfully, we traced back from the position of the matched word. Each time an index position was traversed forward, the related words would be combined in order. For example, based on the processed sentence “(暴雨/n, 附近/f, 同/p, 马/n, 大堤/n, 有/vyou, 崩溃/vg, 风险/n)”, we can match the word “大堤 (dyke)” and obtain the combined word set (大堤 (dyke), 马大堤 (ma dyke), 同马大堤 (tong ma dyke), 附近同马大堤 (near Tong ma dyke), and 暴雨附近同马大堤 (rainstorm near Tong ma dyke)) according to the rule. These combined words were regarded as potential locational words.
3.1.3. Recalling the Locational Words
When using Internet search engines to retrieve words, we can obtain a lot of information related to them. This information will help us understand the attributes of these words, including judging whether the words have spatial attributes. This benefits from the explosive growth of information and even knowledge, and they are interconnected through the network. Due to using Chinese text, the Baidu search engine was selected in this paper. The related method was as follows.
- (1)
- The construction of candidate locational word set
When the searched words have entity features, content such as Baidu Encyclopedia and Baidu Map may be fed back by the search engine. Baidu Encyclopedia and Baidu Map are two important applications that are closely related to the Baidu search engine. They have the ability to discover the attribute of the searched words, especially the spatial attribute. Then, we added those words with spatial attributes to the candidate locational word set.
- Spatial attribute judgment based on Baidu Encyclopedia
Similarly to Wikipedia, Baidu Encyclopedia is a Chinese information collection platform covering different fields of knowledge. As of October 2020, this platform contained more than 21 million entries [31]. When a word was included in Baidu Encyclopedia, and there were some attribute fields related to location information in the basic attribute list of the word, we considered that the word was a locational word. For example, by retrieving, we can obtain encyclopedic information (https://baike.baidu.com/item/%E4%B8%AD%E5%BA%99/24544? accessed on 15 January 2022) about the combined word “中庙寺 (Zhongmiao Temple)”. The basic attribute list about it contained the “地理位置 (location)” field, which proved that the word had spatial attributes. In addition, Baidu Encyclopedia provides a list of categories for different entities, and each category contains specific entity attribute fields (https://baike.baidu.com/editor/load/createload?lemmaTitle=baimasi, accessed on 15 January 2022). We obtained all of these entity categories and their attribute fields, and filtered out the attribute fields with spatial features, such as “地理位置 (location)”, “发源地 (birthplace)”, etc., to construct a spatial attribute list. When the attribute field in the basic attribute list of the searched word can match the attribute in the spatial attribute list, the word can be regarded as a candidate locational word.
- Spatial attribute judgment based on Baidu Map
Baidu Encyclopedia can confirm the spatial attribute of many commonly used words. However, the recognition effect of it on some ordinary POI (points of interest), such as a designated building or square, etc., and even some abbreviations of locational words were not positive. Therefore, Baidu Map, which is an electronic map that provides queries and positioning functions for geographical entities, was used to help identify the words with spatial attributes. When a word had spatial attributes, the retrieved results of the search engine would include the Baidu Map tag. For example, the word “石大圩 (Shi da wei)” was not included in Baidu Encyclopedia, but it was marked with a tag “百度地图 (Baidu Map)” when we retrieved it by search engine (https://www.baidu.com/s?wd=%E7%9F%B3%E5%A4%A7%E5%9C%A9, accessed on 15 January 2022).
- (2)
- Recall of locational words
By using the search engine to link Baidu Encyclopedia and Baidu Map, we judged whether the combined word had spatial attributes. We proposed that there can only be, at most, one word in each combined word set as a recalled locational word. Some compound word sets also have multiple recognized locational words. For example, each word in the combined word sets “(石大圩 (shi da wei), 大圩 (da wei))” and “(大堤 (dyke), 同马大堤 (Tongma dyke))” had spatial attributes. We stated that the word with the longest byte was the final locational word, such as “石大圩”, “同马大堤”, etc., because the word with a shorter byte may be a sub word of the word with a longer byte.
3.2. The Social Network Construction Based on Location Information
In this paper, we combined the locational words extracted from social media text and the tags of upload location of social media to construct the location-pointing relationship. The relationships can help us find the areas that were most concerned by people. These areas might be severely affected by disasters.
We removed the social media data that did not carry location tags and did not contain locational words in their texts. Then, we divided the other data into three categories, including:
- : social media data themselves contained a location tag, but its text did not contain locational words.
- : social media data themselves did not contain a location tag, but its text contained locational words.
- : social media data themselves contained a location tag, and its text also contained locational words.
We used to represent the locational words extracted from the text and to represent the location tag of social media. The spatial scales of this location information were not the same. In this paper, the locations with large spatial scale, such as provinces and cities, were not considered.
We regarded the location information as nodes. Among them, corresponded to the node , and corresponded to the node . These nodes involved at least one piece of microblog, and the relationship between nodes was shown through these microblogs. We defined the location-pointing relationship between nodes pointed from to . Based on the nodes and the relationship between nodes defined in this paper, we constructed a new social network. For example, there were three pieces of social media data, as shown in Table 1. The structure of the network can be described as shown in Figure 4. Among them, the circle represented and the square represented . For the microblog , was “石头镇 (Shitou Town)” and was “中庙寺 (Zhongmiao Temple)”. It showed that the disaster in “中庙寺 (Zhongmiao Temple)” attracted the attention of the residents from “石头镇 (Shitou Town)”. The same was true of microblog . For microblog , it did not have , only . This meant that there was an implicit location-pointing relationship, pointing to from an unknown node . This still indicated that the disaster in “十字镇 (Shizi Town)” might be serious.

Table 1.
Relationship between location information related to social media.
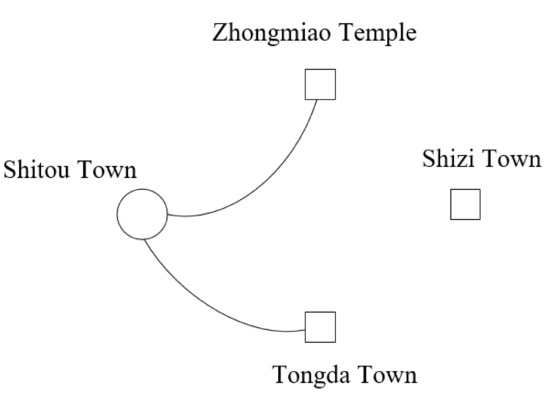
Figure 4.
The structure of the reconstructed social network.
Furthermore, we set two indicators to quantify the network constructed in this paper, including node degree and edge weight . The calculation formulas of related indicators are shown below:
Among them, was the node degree of . It was related to the number of social media texts uploaded from node , and we used to represent the number of these social media texts. In addition, there were some data in these social media texts, which contained location information . We used to represent the number of such social media. The edge weight between nodes and was related to . In order to better express indicators and , we normalized them, and was the number of all social media. was the node degree of . It was the sum of the edge weights of all edges () pointing to node .
The larger the , the more social media texts were uploaded in the area where was located. The larger the , the more people paid attention to the area where node was located. Edge weight reflected the strength of the connection between two nodes. It showed the spatial distribution of people who paid attention to the disaster in the area where node was located.
3.3. Flooded Area Extraction Based on Multi-Temporal Remote Sensing Images
There are two main commonly used strategies for extracting flooded areas based on remote sensing images [32], including directly classifying multi-temporal remote sensing images [15] and post-classification comparison (PCC) [33]. The former regards multi-temporal remote sensing images as a whole, and directly uses methods including machine learning, deep learning, etc., to extract a flooded area. The latter first identifies water bodies from multi-temporal remote sensing images, and then obtains the flooded area by comparing the differences between these processed images. In comparison, PCC is more intuitive and convenient. Therefore, PCC was selected to extract the flooded area. The flow is shown in Figure 5.
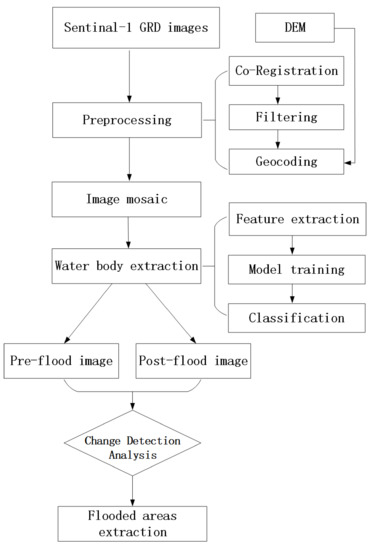
Figure 5.
Process of flooded area extraction in this work using remotely sensed data.
The Sentinel-1 GRD images involving the study area were used in this paper, including pre-flood images and post-flood images. These multi-temporal images were first preprocessed, and the process included co-registration, filtering and geocoding. In this paper, we used the pre-flood image as the main image for co-registration. “De Grandi spatio-temporal filtering” was selected to filter the noise of the images. The DEM data related to the study area from the Geospatial data cloud (http://www.gscloud.cn/#page1/2 accessed on 15 January 2022) was used to geocode the images, which facilitated spatial integration of remote sensing imagery with social media data. After the preprocessing operation, we performed an image mosaic on the images such that the images completely covered the study area.
There are many methods for extracting a water body from a remote sensing image, including classification [34,35], setting thresholds [18,36] and object-based image analysis [37,38], etc. In this paper, we selected the maximum likelihood method [39], which is a type of supervised classification and is one of the most commonly used methods. According to the Bayesian information criterion, this method assumes that the spectral characteristics of each object in the remote sensing image obey the orthonormal distribution. Then, the method evaluates the similarity between other pixels and the pixels in the training area by calculating the mean and variance of the pixels in the training area. The optimal parameters are obtained by learning and calculating the pixel features of the water body in the image by the classifier. Finally, the trained model can be directly used to calculate the category of specified pixels, so as to extract the water body in the image.
Furthermore, we performed change detection on processed (water body extraction) pre- and post-disaster images. Among them, the pre-disaster image was used as the main image. We first kept only the water body part in the two images and then determined the area of change by taking the difference between the two images. Finally, based on the OSTU threshold segmentation method [40], we can extract the flooded area in the area of change.
3.4. Comprehensive Analysis
In order to combine social media data with remote sensing data, we need to convert the tags of upload location of social media and the extracted locational words into latitude and longitude coordinates. The API interface from AMAP (https://lbs.amap.com/api/javascript-api/guide/services/geocoder, accessed on 10 December 2021) was used in this paper to accomplish this purpose. Then, we performed a comprehensive analysis of the two types of data, which included disaster assessment and continuous disaster monitoring.
3.4.1. Disaster Assessment Combined with Multi-Source Data
We regarded the processed remote sensing images and the constructed social network as different spatial layers. These layers were then superimposed under one space to help assess disasters in different areas. Among them, the remote sensing image described the disaster situation in the study area from the macro perspective, including the extent and spatial distribution of the flooded area. Based on the relevant indicators of social networks, we can understand which flooded areas in the remote sensing image received more public attention. Generally speaking, the larger the flooded area and the more public attention it receives, the more severely affected the area is. Furthermore, the corresponding location-pointing relationship reflected the spatial distribution of people who paid attention to those flooded areas, and we can also learn about the situation in the flooded area through social media texts uploaded by those people. This is an effective illustration for disaster assessment.
3.4.2. Continuous Monitoring of Disaster in Flooded Areas Combined with Social Media Data
The long revisit cycle of satellites makes it difficult to provide continuous disaster monitoring. Moreover, it is difficult to perceive the specific disaster information in the flooded area simply by using remote sensing images. Therefore, we supplemented this information with social media data. We first selected the flooded area to be monitored and collected social media data related to this area based on the constructed social network. Then, we extracted keywords from these social media texts. These keywords reflected the disaster themes in the area that people were concerned about. By analyzing the change characteristics of these themes over time, the disaster reduction department can monitor and understand the disaster situation in the flooded area in detail. At the same time, it also improved the situational awareness of the disaster. The method of extracting keywords from social media texts used in this paper is “TF-IDF” [41], and its formulas are as follows:
Among them, is word frequency, which is a measure of the local importance of the word w; is the number of times the word w appears in the document (social media text) ; is the sum of occurrences of all words in document ; IDF is the inverse document frequency, which represents the distribution of words in the entire corpus; is the total number of documents in the corpus; is the number of documents containing the word w.
4. Results
4.1. Locational Words Extraction
In this paper, we used three indicators, including P (precision), R (recall) and F-1 (comprehensive indicator), to evaluate the effect of the proposed method on extracting locational words from the social media text. The relevant calculation formulas are as follows:
Among them, represented the number of locational words that were correctly recognized, represented the number of locational words that were not recognized correctly, and represented the number of locational words contained in the text.
We randomly selected 500 texts to evaluate the accuracy of the method in this paper (approximately 1000 locational words were contained in these texts). The experimental results showed that the indicators P, R and F-1 reached 89.32%, 83.64% and 86.39%, respectively. The relevant results met the requirements of subsequent disaster analysis in this paper.
4.2. Disaster Analysis Combined with Multi-Source Information
Based on the remote sensing data, we used the algorithm described above to extract the flooded area, as shown in Figure 6a. Among them, the blue area was the water body, and the red area was the flooded area. We superimposed the social media data with the remote sensing image, as shown in Figure 6b. We can see that there was little social media data in the flooded area. When the areas were being severely affected by floods, it was difficult for people in these areas to upload social media data. Conversely, the regional population distribution and the degree of economic development were also factors that caused the uneven distribution of social media data. Therefore, it was difficult to effectively assist remote sensing data to further mine disaster information by only using social media data with uploaded location information.
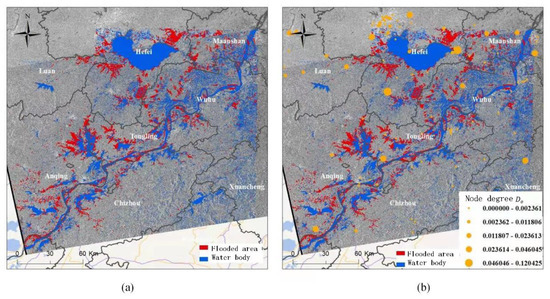
Figure 6.
The spatial distribution relationship between social media data and flooded areas. Among them, (a) shows the flooded area based on remote sensing images; (b) overlays social media data, which have location tags, on a remote sensing image.
4.2.1. Disaster Assessment Combined with Multi-Source Data
Based on social networks constructed in this paper and remote sensing data, we superimposed them to carry out disaster assessments for different disaster-affected areas. The analysis results are shown in Figure 7. In this figure, the yellow circular node represents the upload location of the social media data, and the green square node represents the location of the disaster mentioned in the social media text. We can see that most of the green square nodes are located in the flooded area, such as area 1, area 2 and area 3, etc. The larger the green square node, the more attention the area it was in received, which meant that the disaster in these areas was serious. Based on the remote sensing image, it can be seen that there are some areas which were less affected by floods. However, these areas still received more attention, such as area 4. This area is “Zhongmiao Temple”, which is a famous scenic spot. Combined with social media data related to this area, we found that this area was greatly affected by the disaster, and the base under the temple had been flooded. The relevant disaster situation had attracted the attention of people in many other areas. We checked the official news reports and confirmed the information mined by social media (https://www.thepaper.cn/newsDetail_forward_8404872, accessed on 15 January 2022). Perhaps due to factors such as resolution or ground occlusion, the remote sensing images failed to reflect this disaster information.
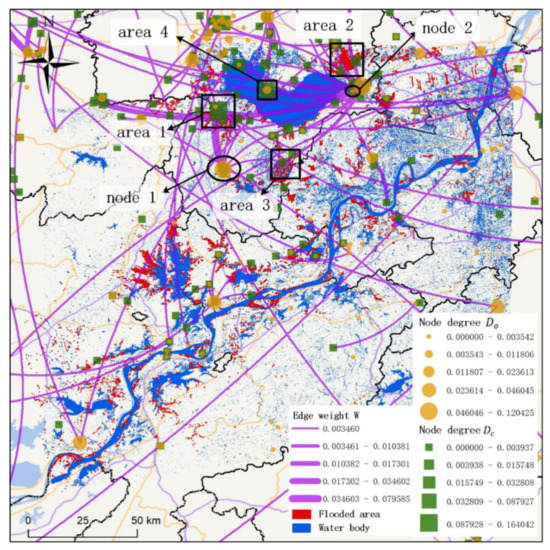
Figure 7.
Superposition analysis of multi-source disaster information.
In addition, the edges between nodes described the spatial distribution characteristics of people who were concerned about those affected areas. Combined with the corresponding social media data, we can understand why people paid attention to these affected areas and even what requirements people wanted. Using area 1 in Figure 7 as an example, this area is “Tongda Town”, which had been seriously affected by a flood. We marked two yellow circular nodes (node 1 and node 2) that were linked to area 1. Among them, node 1 was closer to area 1. The two nodes were less affected by the disaster according to remote sensing images. We checked some social media data at node 1 and found that some people were worried about the disaster in area 1 and even felt nervous and anxious. Because their property (such as houses, farmland, etc.) and relatives were located in area 1, they were curious to know how the disaster was progressing in this area. Although these people were not directly affected by the flood, their bad emotions (nerves and anxiety) might have triggered some other disaster losses [42,43]. For example, anxious people are more sensitive to negative information about disaster, and are more likely to be induced and deceived by bad information such as rumors [44]. Therefore, the disaster reduction department can take some measures, such as pushing more disaster information in the flooded area to the people in a timely manner, etc. In contrast, people at node 2 were only concerned about the disaster situation in area 1. It indicated that more disaster reduction measures may not be required for this area. Therefore, understanding the themes that people in different areas pay attention to in flooded areas is conducive to reasonably allocating disaster relief resources.
Compared with some existing studies, including flood disaster assessments based solely on social media [45,46] or remote sensing [47,48], and flood disaster analysis combined with multi-source data such as that shown in the literature [14,15,16,17], the method in this paper fully considered disaster-related location information contained in social media texts, constructing the relationship between them and uploading location tags of social media. This not only improves the fusion efficiency of the two kinds of data but also effectively integrates the respective advantages of multi-source data. Remote sensing images show the macroscopic disaster situation in the study area; conversely, social media (especially the constructed social network) further assess the disaster situation in different flooded areas. In addition, through the method in this paper, more disaster information, such as the spatial distribution of people who pay attention to the disaster area and the detailed disaster situation of the flooded areas, are also effectively excavated.
4.2.2. Continuous Monitoring of Disaster in Flooded Areas Combined with Social Media Data
Figure 7 not only showed the spatial distribution and extent of flooded areas but also reflected the degree to which these areas were affected by disasters from the public perspective. Among them, areas 1, 2 and 3 were severely affected by the disaster, especially area 1. Therefore, we took area 1 as an example and combined social media texts to continuously monitor this area. The analysis results are shown in Figure 8.
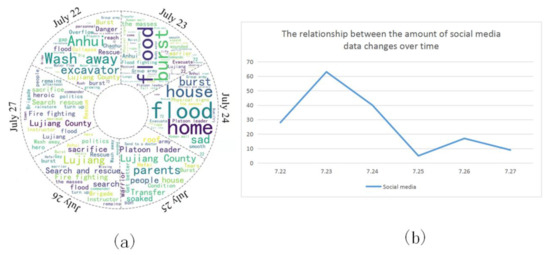
Figure 8.
Monitoring the disaster in “Tongda Town” based on social media data. Among them, (a) depicts how the themes of social media data related to “Tongda Town” changed over time; (b) depicts how the amount of social media data related to “Tongda Town” changed over time.
In Figure 8, it can be seen that “Tongda Town” received more attention from 22 to 24 July. Among them, the keyword “22” indicated the specific date when the disaster occurred. Keywords such as “burst”, “overflow”, “collapse” and “danger” described the main causes of the flood disaster. It was reported that due to heavy rains over the past few days, a section of the dam in the area broke, causing several villages to be submerged. Almost at the same time as the disaster occurred, the disaster reduction departments had already started rescue operations, and the keywords “flood fighting”, “rescue”, etc., could explain it. With the progress of disasters and rescue, more and more people began to pay attention to this area, especially on 23 and 24 July. During this period, related disaster themes were abundant, and we could learn about the specific progress of the disaster, including property damage (through the keywords “home”, “houses”, “sad”, etc.), rescue casualties (through the keywords “wounded”, “coma”, “sign”, etc.) and effectiveness of disaster reduction (through the keywords “rescued”, “evacuate”, “transfer”, etc.), etc. Since 25 July, although the disaster in “Tongda Town” still existed, the attention of people to this area had dropped significantly. This might show that the disaster in the area was no longer serious. Keywords such as “transfer” and “get better” accounted for a relatively large proportion, indicating that the public had received better assistance during this period. On 26 and 27 July, people once again focused their attention on “Tongda Town”. By combining keywords such as “search”, “sacrifice”, etc., we could learn that some rescuers were sacrificed in this disaster, and their remains were not found until 26 July. This information attracted widespread attention. Keywords such as “heroic” and “hero”, etc., showed how grateful people were to rescuers. The same method can be used for disaster monitoring in other areas.
Social media data enhance temporal continuity of flood monitoring, which is an important complement to remote sensing data. Moreover, based on the social network constructed in this paper, we can obtain more social media data about the flooded area (only a small amount of these data were from the local flooded area, and more were from other areas). The information mined from social media effectively reflected the entire disaster process and improved the situational awareness of disasters.
5. Conclusions
Social media and remote sensing data serve disaster reduction from different perspectives. They complement each other and enrich the expression of disaster-related information. However, the limitations of social media data, such as insufficient geotags and uneven spatial distribution, make it difficult to efficiently combine them with remote sensing data. Thus, in this paper, we tried to solve this problem by extracting disaster-related location information in social media texts and constructing a social network based on the pointing relationship between different types of location information (uploaded location information of social media and location information contained in the text). We combined the processed social media data with remote sensing image data to verify the advantages of our method in disaster analysis. We found that: (1) It is difficult to dig out more disaster information in the flooded area by simply using the social media data with only uploaded location tags because some hard-hit areas may exist little or no social media. (2) The social network constructed in this paper can be effectively combined with remote sensing image data and can help us to mine more disaster information, such as assessing the disaster situation in different areas and analyzing the spatial distribution of people who pay attention to flooded areas. (3) The effective combination of multi-source data can make better use of the advantages of different data sources, helping to fully describe the progress of the disaster.
The method in this paper still has some aspects that need to be improved in the future: (1) We will consider optimizing the location information extraction method proposed in this paper. Although this method had low labor costs and high automation, it depended on the suffix words of the locational word. It is difficult for us to list all the suffix words exhaustively. Therefore, we can consider introducing the semantic similarity calculation of words to try to automatically identify these suffix words in the future. (2) More data sources will be introduced, including population distribution data, land use data, and road network data. These data can feed back disaster information from different aspects. In a word, this paper has made an effective attempt to improve the efficiency of multi-source data combinations to enhance disaster information mining and proved the great potential of multi-source data combination in disaster reduction.
Author Contributions
T.Y., J.X. and G.L. conceived and designed the paper; T.Y. and J.X. wrote the paper; T.Y., L.Z. and N.M. designed and implemented the algorithmic framework; T.Y., H.W. and X.Z. realized the visualization; X.W. collected the data and processed them. All authors have read and agreed to the published version of the manuscript.
Funding
This research was funded by the National Key R&D Program of China, grant number 2019YFE0127400.
Institutional Review Board Statement
Not applicable.
Informed Consent Statement
Not applicable.
Data Availability Statement
Not applicable.
Conflicts of Interest
The authors declare no conflict of interest.
References
- Ntontis, E.; Drury, J.; Amlôt, R.; Rubin, G.J.; Williams, R. Endurance or decline of emergent groups following a flood disaster: Implications for community resilience. Int. J. Disaster Risk Reduct. 2020, 45, 101493. [Google Scholar] [CrossRef]
- Swain, D.L.; Wing, O.E.; Bates, P.D.; Done, J.M.; Johnson, K.A.; Cameron, D.R. Increased flood exposure due to climate change and population growth in the United States. Earth’s Future 2020, 8, e2020EF001778. [Google Scholar] [CrossRef]
- Špitalar, M.; Brilly, M.; Kos, D.; Žiberna, A. Analysis of flood fatalities–Slovenian illustration. Water 2020, 12, 64. [Google Scholar] [CrossRef]
- Schumann, G.J.; Brakenridge, G.R.; Kettner, A.J.; Kashif, R.; Niebuhr, E. Assisting flood disaster response with earth observation data and products: A critical assessment. Remote Sens. 2018, 10, 1230. [Google Scholar] [CrossRef]
- Wang, X.; Xie, S.; Zhang, X.; Chen, C.; Guo, H.; Du, J.; Duan, Z. A robust Multi-Band Water Index (MBWI) for automated extrac-tion of surface water from Landsat 8 OLI imagery. Int. J. Appl. Earth Obs. Geoinf. 2018, 68, 73–91. [Google Scholar] [CrossRef]
- Zhang, T.; Ren, H.; Qin, Q.; Zhang, C.; Sun, Y. Surface water extraction from Landsat 8 OLI imagery using the LBV transfor-mation. IEEE J. Sel. Top. Appl. Earth Obs. Remote Sens. 2017, 10, 4417–4429. [Google Scholar] [CrossRef]
- Rosser, J.F.; Leibovici, D.; Jackson, M. Rapid flood inundation mapping using social media, remote sensing and topographic data. Nat. Hazards 2017, 87, 103–120. [Google Scholar] [CrossRef]
- Kawamura, Y.; Dewan, A.M.; Veenendaal, B.; Hayashi, M.; Shibuya, T.; Kitahara, I.; Nobuhara, H.; Ishii, K. Using GIS to develop a mobile communications network for disaster-damaged areas. Int. J. Digit. Earth 2014, 7, 279–293. [Google Scholar] [CrossRef]
- Wang, Z.; Ye, X. Social media analytics for natural disaster management. Int. J. Geogr. Inf. Sci. 2018, 32, 49–72. [Google Scholar] [CrossRef]
- Li, J.; He, Z.; Plaza, J.; Li, S.; Chen, J.; Wu, H.; Wang, Y.; Liu, Y. Social media: New perspectives to improve remote sensing for emergency response. Proc. IEEE 2017, 105, 1900–1912. [Google Scholar] [CrossRef]
- Denis, L.A.S.; Palen, L.; Anderson, K.M. Mastering social media: An analysis of Jefferson County’s communications during the 2013 Colorado floods. In Proceedings of the 11th International ISCRAM Conference, University Park, PA, USA, 1 May 2014. [Google Scholar]
- Huang, Q.; Cervone, G.; Zhang, G. A cloud-enabled automatic disaster analysis system of multi-sourced data streams: An example synthesizing social media, remote sensing and Wikipedia data. Comput. Environ. Urban Syst. 2017, 66, 23–37. [Google Scholar] [CrossRef]
- Li, J.; Benediktsson, J.A.; Zhang, B.; Yang, T.; Plaza, A. Spatial technology and social media in remote sensing: A survey. Proc. IEEE 2017, 105, 1855–1864. [Google Scholar] [CrossRef]
- Scotti, V.; Giannini, M.; Cioffi, F. Enhanced flood mapping using synthetic aperture radar (SAR) images, hydraulic model-ling, and social media: A case study of Hurricane Harvey (Houston, TX). J. Flood Risk Manag. 2020, 13, 12647. [Google Scholar] [CrossRef]
- Fohringer, J.; Dransch, D.; Kreibich, H.; Schröter, K. Social media as an information source for rapid flood inundation mapping. Nat. Hazards Earth Syst. Sci. 2015, 15, 2725–2738. [Google Scholar] [CrossRef]
- Li, Z.; Wang, C.; Emrich, C.T.; Guo, D. A novel approach to leveraging social media for rapid flood mapping: A case study of the 2015 South Carolina floods. Cartogr. Geogr. Inf. Sci. 2018, 45, 97–110. [Google Scholar] [CrossRef]
- Huang, X.; Wang, C.; Li, Z. A near real-time flood-mapping approach by integrating social media and post-event satellite imagery. Ann. GIS 2018, 24, 113–123. [Google Scholar] [CrossRef]
- Ahmad, K.; Pogorelov, K.; Riegler, M.; Ostroukhova, O. Automatic detection of passable roads after floods in remote sensed and social media data. Signal Process. Image Commun. 2019, 74, 110–118. [Google Scholar] [CrossRef]
- Cervone, G.; Schnebele, E.; Waters, N.; Moccaldi, M. Using social media and satellite data for damage assessment in urban areas during emergencies. In Seeing Cities through Big Data; Springer: Berlin/Heidelberg, Germany, 2017; pp. 443–457. [Google Scholar]
- Chong, W.-H.; Lim, E.-P. Exploiting contextual information for fine-grained tweet geolocation. In Proceedings of the International AAAI Conference on Web and Social Media, Montreal, QC, Canada, 15–18 May 2017. [Google Scholar]
- Mahmud, J.; Nichols, J.; Drews, C. Where is this tweet from? inferring home locations of twitter users. In Proceedings of the Sixth International AAAI Conference on Weblogs and Social Media, Dublin, Ireland, 4–7 June 2012. [Google Scholar]
- Cheng, Z.; Caverlee, J.; Lee, K. You are where you tweet: A content-based approach to geo-locating twitter users. In Proceedings of the 19th ACM International Conference on Information and Knowledge Management, Toronto, ON, Canada, 26–30 October 2010. [Google Scholar]
- Middleton, S.E.; Middleton, L.; Modafferi, S. Real-time crisis mapping of natural disasters using social media. IEEE Intell. Syst. 2013, 29, 9–17. [Google Scholar] [CrossRef]
- Maynard-Ford, M.C.; Phillips, E.C.; Chirico, P.G. Mapping Vulnerability to Disasters in Latin America and the Caribbean, 1900–2007; Open-File Report 2008-1294; US Geological Survey: Reston, VA, USA, 2008; p. 30.
- Milanova, I.; Silc, J.; Serucnik, M.; Eftimov, T.; Gjoreski, H. LOCALE: A Rule-based Location Named-entity Recognition Method for Latin Text. In Proceedings of the HistoInformatics@ TPDL Conference, Oslo, Norway, 12 September 2019; pp. 13–20. [Google Scholar]
- Sugiartaa, N.P.A.S.A.; Sanjaya ER, N.A. Location Named-Entity Recognition using Rule-Based Approach for Balinese Texts. J. Elektron. Ilmu Komput. Udayana 2021, 9, 15. [Google Scholar]
- Shue, L.; Dey, S.; Anderson, B. On state-estimation of a two-state hidden Markov model with quantization. IEEE Trans. Signal Process. 2001, 49, 202–208. [Google Scholar] [CrossRef][Green Version]
- Lafferty, J.; McCallum, A.; Pereira, F.C. Conditional random fields: Probabilistic models for segmenting and labeling sequence data. In Proceedings of the 18th International Conference on Machine Learning 2001, Online. 28 June 2001. [Google Scholar]
- Shao, X.; Kim, C.S. Multi-step short-term power consumption forecasting using multi-channel LSTM with time location con-sidering customer behavior. IEEE Access 2020, 8, 125263–125273. [Google Scholar] [CrossRef]
- Hong, S.; Jang, H.; Kim, N.; Sohn, H.G. Water area extraction using RADARSAT SAR imagery combined with landsat imagery and terrain information. Sensors 2015, 15, 6652–6667. [Google Scholar] [CrossRef] [PubMed]
- Baike. Available online: https://baike.baidu.com/ (accessed on 15 January 2022).
- Zhang, L.; Wang, S.; Liu, H.; Lin, Y.; Wang, J.; Zhu, M.; Gao, L.; Tong, Q. From Spectrum to Spectrotemporal: Research on Time Series Change Detection of Remote Sensing. Geomat. Inf. Sci. Wuhan Univ. 2021, 46, 451–468. [Google Scholar] [CrossRef]
- Howarth, P.J.; Wickware, G.M. Procedures for change detection using Landsat digital data. Int. J. Remote Sens. 1981, 2, 277–291. [Google Scholar] [CrossRef]
- Chapman, B.; McDonald, K.; Shimada, M.; Rosenqvist, A. Mapping regional inundation with spaceborne L-band SAR. Remote Sens. 2015, 7, 5440–5470. [Google Scholar] [CrossRef]
- Martinis, S.; Twele, A.; Voigt, S. Unsupervised extraction of flood-induced backscatter changes in SAR data using Markov image modeling on irregular graphs. IEEE Trans. Geosci. Remote Sens. 2010, 49, 251–263. [Google Scholar] [CrossRef]
- Bartsch, A.; Trofaier, A.; Hayman, G.; Sabel, D. Detection of open water dynamics with ENVISAT ASAR in support of land surface modelling at high latitudes. Biogeosciences 2012, 9, 703–714. [Google Scholar] [CrossRef]
- Evans, T.L.; Costa, M.; Telmer, K. Using ALOS/PALSAR and RADARSAT-2 to map land cover and seasonal inundation in the Brazilian Pantanal. IEEE J. Sel. Top. Appl. Earth Obs. Remote Sens. 2010, 3, 560–575. [Google Scholar] [CrossRef]
- Simon, R.; Tormos, T.; Danis, P. Geographic object based image analysis using very high spatial and temporal resolution radar and optical imagery in tracking water level fluctuations in a freshwater reservoir. South-East. Eur. J. Earth Obs. Geomat. 2014, 3, 287–291. [Google Scholar]
- Dewan, A.M.; Kankam-Yeboah, K. Using synthetic aperture radar (SAR) data for mapping river water flooding in an urban landscape: A case study of Greater Dhaka, Bangladesh. J. Jpn. Soc. Hydrol. Water Resour. 2006, 19, 44–54. [Google Scholar] [CrossRef]
- Otsu, N. A threshold selection method from gray-level histograms. IEEE Trans. Syst. Man Cybern. 1979, 9, 62–66. [Google Scholar] [CrossRef]
- Rajaraman, A.; Ullman, J.D. Mining of Massive Datasets; Cambridge University Press: Cambridge, UK, 2011. [Google Scholar]
- Tausczik, Y.R.; Pennebaker, J.W. The psychological meaning of words: LIWC and computerized text analysis methods. J. Lang. Soc. Psychol. 2010, 29, 24–54. [Google Scholar] [CrossRef]
- Yang, T.; Xie, J.; Li, G.; Mou, N.; Li, Z. Social media big data mining and spatio-temporal analysis on public emotions for dis-aster mitigation. ISPRS Int. J. Geo-Inf. 2019, 8, 29. [Google Scholar] [CrossRef]
- Oh, O.; Kwon, K.H.; Rao, H.R. An Exploration of Social Media in Extreme Events: Rumor Theory and Twitter during the Haiti Earthquake 2010. In Proceedings of the International Conference on Information Systems, ICIS 2010, Saint Louis, MI, USA, 12–15 December 2010; Volume 231, pp. 7332–7336. [Google Scholar]
- Fang, J.; Hu, J.; Shi, X.; Zhao, L. Assessing disaster impacts and response using social media data in China: A case study of 2016 Wuhan rainstorm. Int. J. Disaster Risk Reduct. 2019, 34, 275–282. [Google Scholar] [CrossRef]
- Yang, T.; Xie, J.; Li, G.; Mou, N.; Chen, C.; Zhao, J.; Liu, Z.; Lin, Z. Traffic Impact Area Detection and Spatiotemporal Influence Assessment for Disaster Reduction Based on Social Media: A Case Study of the 2018 Beijing Rainstorm. ISPRS Int. J. Geo-Inf. 2020, 9, 136. [Google Scholar] [CrossRef]
- Klemas, V. Remote sensing of floods and flood-prone areas: An overview. J. Coast. Res. 2015, 31, 1005–1013. [Google Scholar] [CrossRef]
- Lin, L.; Di, L.; Yu, E.G.; Kang, L.; Shrestha, R.; Rahman, M.S.; Tang, J.; Deng, M.; Sun, Z.; Zhang, C.; et al. A review of remote sensing in flood assessment. In Proceedings of the 2016 Fifth International Conference on Agro-Geoinformatics, Tianjin, China, 18–20 July 2016; IEEE: New York, NY, USA, 2016. [Google Scholar]


Publisher’s Note: MDPI stays neutral with regard to jurisdictional claims in published maps and institutional affiliations. |
© 2022 by the authors. Licensee MDPI, Basel, Switzerland. This article is an open access article distributed under the terms and conditions of the Creative Commons Attribution (CC BY) license (https://creativecommons.org/licenses/by/4.0/).