1. Introduction
Urban land-use classification plays a key role in applications such as urban construction, land-use planning, infrastructure construction management, natural disasters and crisis management [
1]. The faster the growth of the country, the more rapid the change in land-use. Land-use surveys are time-consuming, labor-intensive and costly [
2]. A national land-use survey is implemented every ten years in China. The development of processing technologies for high-resolution remote sensing could help planners to collect exhaustive land-cover information in a timely and cost-effective manner [
3]. For example, deep convolutional neural networks (DCNNs) could automatically extract serval-specific features in remote sensing images to fully realize the classification of urban land-use.
For land-use classification, one typical class may contain more than one kind of object, according to current standards. Each could also include different kinds of objects under different standards. For example, the contents are different for The Land-Use Standard of the 2nd and the 3rd National Land-Use Resource Survey. The complex spatial and textural patterns in one class pose great challenges to convolutional neural networks (CNN) attempting to classify high-resolution remote sensing images [
4]. Early FCN-based models could identify features to a certain extent, but suffered from loss of high-frequency details, blurred boundaries, and a limited ability to reconstruct spatial information while obtaining rich contextual information. To deal with this problem, a skip connection was added to the networks. U-Net Architecture, designed by Ronneberger et al., aggregated the multi-layer feature maps from the encoder using the decoder structure for step-by-step upsampling and generated high-resolution feature maps [
5]. The fusion of high-and-low level semantic information improves the classification effects of object boundaries. Later, Yu and Koltun introduced atrous convolution into fully convolutional networks (FCN), which were able to keep the resolution of a featured image and expand the receptive field to capture multi-scale context information and improve the accuracy of semantic segmentation using spatial information in the images [
6]. To better capture global context information, Spatial Pyramid Pooling (SPP) [
7] has been widely adopted. Zhao et al., used a pyramid pooling module to aggregate the context of different regions to exploit the capability of global context information [
8]. Chen et al. realized pyramid-shaped atrous pooling in spatial dimensions [
9] and heaped up atrous convolution [
10] with different atrous in cascade or in parallel to obtain multi-scale information [
11]. However, Atrous Spatial Pyramid Pooling (ASPP) [
9] still had some limitations, as the resolution in the scale axis dimension was not sufficient to accurately extract target features in remote sensing images (RSIs). Therefore, Yang et al. proposed densely-connected Atrous Spatial Pyramid Pooling (DenseASPP) [
12], which was able cover a wider scale of the feature map and obtain more intensive receptive field information in order to better classify complex scenes under the premise of not increasing the size of the model.
To improve the accuracy of the urban land-use classification, it needs to deal with the inherent challenges in current classification methods, and to build a labor-intensive fundament, including well-tagged remote sensing image labels for the latest urban land-cover types under different classification standards. It is also an effective method to combine algorithms generating the higher-level sematic class images for replacing the origin images in labor-intensive jobs.
According to the characteristics of urban land-use types, which contain multiple elements in one type, we proposed a double-layer deep convolutional neural network called DUA-Net, which mainly combined two networks with different advantages, U-Net and DenseASPP, into a parallel structure. The method used in this paper can generate the land use classification of urban area into the bigger and continuous block. When using the image of this classification result as the input of man-made fine classification, it can significantly reduce the operation times and manual interactions, which can improve the efficiency. In addition, with the help of vector data, we can also make full use of the same standard to classify the images at different times to analyze the changes of land types at different times.
This was an effort to effectively obtain the characteristics of land-use types in high-resolution RSIs. First, we produced the tagged land-use labels under the Land-Use Standard of the 2nd and the 3rd National Land-Use Resource Survey by combining the urban road networks and generated an image dataset for test and automatic applications. Second, we used Very Deep Convolutional Networks (VGG16) [
13] as the backbone algorithm to extract the urban land-cover features from RSIs. Then, feature maps were processed in parallel using the U-Net module and the DenseASPP module to fully extract land-use type feature information and boundary ambiguity and class imbalance problems in semantic segmentation. Finally, the newly added feature fusion module fused the spatial information, boundary information, multi-scale contextual information, and global contextual information obtained by parallel processing. The experiments were conducted using the dataset constructed in this paper, the publicly available ISPRS Vaihingen dataset and Potsdam dataset. The proposed DUA-Net was compared with other typical methods, such as FCN, U-Net, SegNet, DenseASPP and Deeplab v3. The overall accuracies of the proposed DUA-Net in the land-use classification of self-built image datasets and in land-cover classification of Vaihingen datasets and Potsdam datasets were 75.90%, 89.71% and 89.91%, respectively, and the average F1 scores were 74.68%, 86.64% and 86.93%, respectively.
The rest of this article was organized as follows:
Section 2 will introduce the related work.
Section 3 will propose the overall structure of the model and the details of each module.
Section 4 will present the experimental details and results.
Section 5 will discuss the major findings and limitations of the study. Finally, a brief conclusion will be provided in
Section 6.
The main contributions of this paper can be summarized as follows:
We proposed a double-layer deep convolutional neural network (DUA-Net) combining U-Net and DenseASPP to improve the accuracy of urban land-use classification by avoiding the incorrect classification of fragmented single elements and enhancing the holistic classification of multiple elements.
We employed SENet to build a lightweight Channel Attention Fusion module to optimize the weight assignment of different land-use types and alleviate the problem of incorrect segmentation caused by similar features of similar types.
We constructed an RSI dataset for classification experiments under the standard of the 3rd Land Resource Survey classification (3rd LRSC) from different temporal satellite images and aerial photographs with the help of urban road network vector data acquired from a public map service.
2. Related Work
In this section, we briefly reviewed the development of land-use classification and semantic segmentation, and then discussed the limitations of the current methods.
2.1. Land-Use Classification
An increasing number of remote sensing image datasets are being created. The land cover and land use categories used in these datasets vary, and in order to improve the surface coverage, Castillo-Navarro et al. [
14] have created datasets covering multiple scenes. Besides, there are differences in the labels attached to the datasets [
15]. For example, SEN12MS [
16] provides pixel-level labels and BigEarthNet [
17] provides image-level labels, and these datasets with different scene categories can only be used for specific semantic segmentation applications. LULC, for example, has many semantic classes, even hundreds of fine-grained classes, which can be subdivided into buildings, roads, vehicles, countryside, urban areas, etc. In particular, the relationships within and between semantic classes are simply ignored in many datasets, and the contexts that can reveal the relationship between the content of interest and its surroundings are rarely considered [
18].
High-resolution RSIs have rich and detailed spatial information, geometric structures and texture information [
19]. The obtained features from these images can be interpreted with high accuracy for land-use classification. Land-use classification of RSIs has experienced the development process from pixel-based image analysis, to object-based image analysis, to pixel-level semantic segmentation [
20].
Traditional classification methods have mainly used spectral information from remote sensing images to classify low-resolution remote sensing images. For complex land-use types, such as residential land and wasteland, the classification results are often not ideal, because the spectral features of pixels, lacking textural features and structural features, cannot comprehensively represent the characteristics of land-use types [
21]. Residential land and industrial land may contain similar pixels in different land-use types. Aimed at enlarging the scale and promoting the efficiency of training datasets, some techniques have been developed [
22], such as Transfer Learning [
23], Active Learning [
24], and others. Ammour et al., used a pretraining network for feature extraction, combined two asymmetric networks for data domain adaptation and classification, mapped the two networks to the same feature space, and carried out post-training for the two networks’ weight coefficient adjustment method [
25]. Zhou et al. carried out migration experiments on data from the same sensor at different times [
26]. They also designed a tremendously challenging migration experiment which was carried out on hyperspectral remote sensing data from different perspectives—and which verified the effectiveness of feature extraction and migration structure.
To compensate for the shortcomings of traditional pixel-based classification methods, the object-oriented classification method [
27] considers the correlation information between pixels and the internal texture features of ground objects while utilizing the spectral information of RSIs [
28]. Nonetheless, feature descriptions are not comprehensive and the obtained information is often not enough to support the classification and recognition of ground objects. By mastering shape and texture features of different objects, deep learning breaks the limitation of artificial features, guides object classification, and realizes pixel-level land-use classification of RSIs.
Numerous efforts have been devoted to use deep learning in RSIs for land-use classification. Deep filter banks were proposed to combine multicolumn stacked denoising sparse autoencoders (SDSAE) and Fisher vectors (FV) to automatically learn the representative and discriminative features in a hierarchical manner for land-use scene classification [
29]. Xu et al., proposed a land-use classification framework for photos (LUCFP) and successfully applied it to the automatic verification of land surveys in China [
30].Considering the high-level details in an ultrahigh-spatial-resolution (UHSR) unmanned aerial vehicle (UAV) dataset, adaptive hierarchical image segmentation optimization, multilevel feature selection, and multiscale supervised machine learning (ML) models were integrated to accurately generate detailed maps for heterogeneous urban areas from the fusion of the UHSR ortho mosaic and digital surface model (DSM). This framework exhibited excellent potential for the detailed mapping of heterogeneous urban landscapes [
31]. Multitemporal relearning with convolutional long short-term memory (LSTM) Models is another novel hybrid framework. It integrates spatial–temporal semantic segmentation with post classification relearning, and is efficient in terms of classifying complex LULC maps with multitemporal VHR images [
32].
More and more data are applied for classification. Points of interest (POIs), the most common type of crowdsourced data, promise the potential to characterize geographic spaces and provide an alternative to current methodologies for land-use and land-cover (LULC) classification [
33]. Linked open geospatial data, such as POI data, can be taken as inputs in a land-use classification model at a moderate spatial resolution [
34]. This could pave the way for innovative solutions to urban land-use extracting problems [
28]. Among deep learning models, there are many combined models. Considering the lack of a large number of well-annotated samples, Semi-MCNN was proposed to select samples and generate a dataset from large amounts of unlabeled data automatically, integrated with a multi-CNN framework, which could improve generalization ability and classification accuracy [
35]. For heterogeneous urban land-cover, considering the different contributions of various types of ground objects in land-use classification, such as landscape patterns and building functions, Zhang et al. proposed the impervious surface area-weighted building-based indices from the building outline data [
36].
2.2. Semantic Segmentaion of RSIs
Semantic segmentation of RSIs is used to classify and add color to different ground objects in the image. DCNNs extending convolutional neural network (CNN) structure, such as FCN, SegNet, U-Net and DeepLab, are often used in urban semantic segmentation of RSIs. However, these architectures are usually changed to address different challenges in urban semantic segmentation of RSIs, such as boundary pixel classification problems, ignorance of spatial/contextual information by CNNs, class imbalance problems [
22], etc. To address boundary pixel classification problems, Sherrah applied a full convolutional network [
37] to add semantic labels to high-resolution remote sensing data by fine-tuning the pretrained VGG16 network and smoothing the edge portion with conditional random fields. The U-Net framework could alleviate the boundary pixel classification problem in semantic segmentation with its skip connections. Yi et al., proposed DeepResUnet [
38] to efficiently perform pixel-level urban building segmentation from very high resolution (VHR) images. Since pixel-based segmentation methods tend to ignore spatial/contextual information, atrous convolution is widely used. Diakogiannis et al. proposed ResUNet-A [
39], which used the U-Net encoder/decoder framework to infer object boundaries and segment mask boundaries, distance transformation and input of reconstruction by combining residual connections, atrous convolutions, pyramid scene parsing pooling and multi-tasking inference. Xu et al., proposed HRCNet [
40], a feature enhancement feature pyramid (FEFP) module to integrate multi-scale context information by merging DenseNet and ASPP [
41].
The classification of land-cover in RSIs is often highly unbalanced, which leads to the severe problem of class imbalance in the semantic segmentation of RSIs. Inspired by dense connections, Dong et al., proposed DenseU-Net [
42], which connected convolutional neural network features through cascading operations, and used its symmetrical structure to fuse shallow detail features in shallow layers and the abstract semantic features in deep layers to alleviate the problem of class imbalance. After that, others used multiple FCNs to form new networks [
37], such as the building segmentation architecture [
43] which combined the SegNet [
44] and U-Net [
5], which was a combination of multiple FCNs [
45]. These combined networks exploit the advantages of different models for multi-objective semantic segmentation.
In order to efficiently fuse feature maps outputted by combined networks, the correlation between feature channels needs to be considered. Attention mechanisms are widely used as a contextual aggregation design, which makes CNNs context-aware in the process of semantic information acquisition and effectively improves the accuracy of the classification of large targets [
46]. Hu et al., focused on channel relations and proposed the Squeeze-and-Excitation (SE) block [
47], which increased the sensitivity of the network to information features. Fang et al. extended DenseNet using a spectral attention mechanism to enhance the distinguishability of spectral features and improve the accuracy of HIS image classification [
48].
Urban land-use classification is one of the most important subfields in remote sensing research. In general, the contents in remotely sensed images tend to vary with spatial and temporal attributes, and the increasing complexity of urban systems in particular makes accurate classification of urban land use extremely challenging [
49]. Therefore, the orientation of this paper is to create remote sensing image labels based on land use classification criteria and train DUA-Net in order to serve actual urban land use planning. Inspired by skip connection and dense connection, we designed a parallel architecture combining the U-Net module and the DenseASPP module to maximize the extraction of spatial information, boundary information, multi-scale contextual information, and global contextual information. Then, we efficiently fused multi-information features through channel attention to improve the accuracy of urban land-use classification. Our method aimed to produce an automatic tool which would greatly reduce manual labor in National Land Resource Survey works.
3. The Proposed Method
Our proposed model used parallel modules to acquire spatial information, boundary information, multi-scale contextual information and global contextual information. Thus, it was able to solve the incorrect, fragmented single element classification in urban land-use semantic segmentation, improve boundary ambiguity and class imbalance, and enhance the accuracy of urban land-use classification.
In this section, the proposed architecture of DUA-Net for urban land-use classification was presented. Then, the main steps of the proposed architecture were described in detail, including the U-Net module, DenseASPP module, and Channel Attention Fusion module.
3.1. Overview of the Proposed Architecture
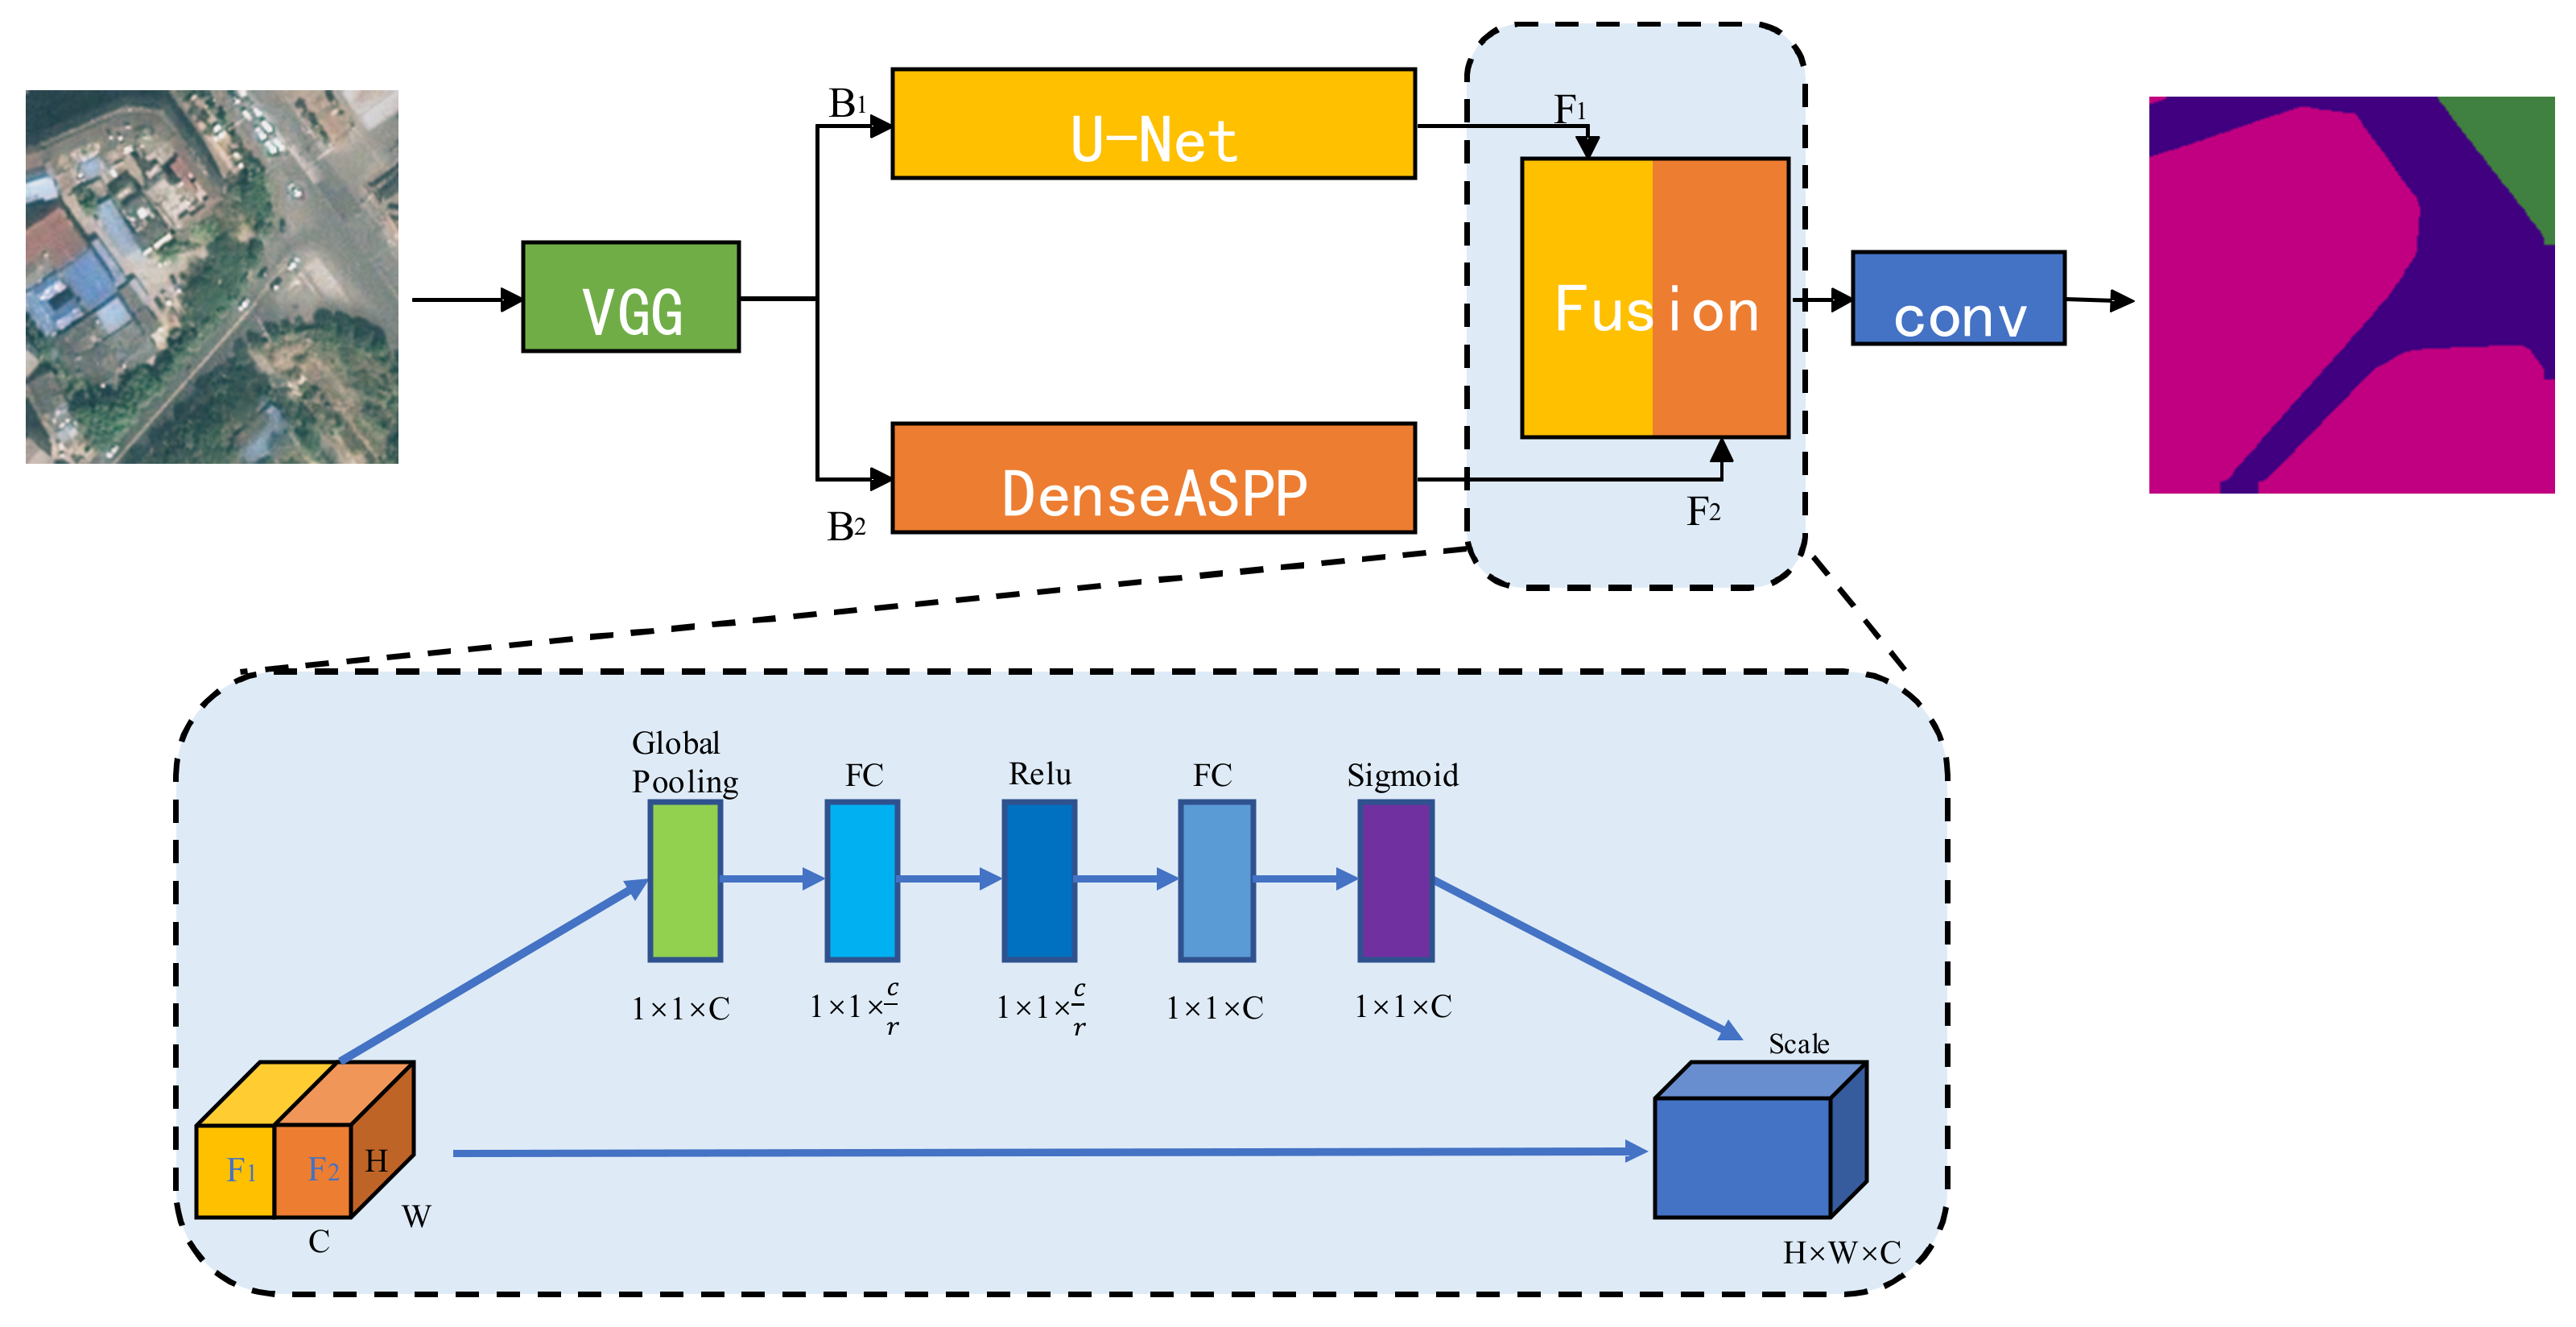
In this study, two different DCNNs, U-Net and DenseASPP, were applied to construct the parallel architecture of DUA-Net, which made full use of the different advantages of these two kinds of networks in the semantic segmentation of RSIs. As shown in
Figure 1, the proposed framework consisted of three parts: a backbone network, a parallel feature extraction module and a feature fusion module. First, the VGG16 network [
13] is introduced as the backbone of U-Net and DenseASPP for feature extraction. Second, considering the complexity of land-use type, structure and spatial distribution of irregularity, we adopt the U-Net module and DenseASPP module to capture multiple semantic information in parallel. For detail, the U-Net module fuses high-level and low-level semantic information to enhance the extraction of spatial and boundary information, and the DenseASPP module aggregates semantic information at different scales to capture multi-scale contextual information and global contextual information. Then, in the Channel Attention Fusion module, the feature maps outputted by the U-Net module and DenseASPP module were fused in the channel dimension through the attention mechanism to alleviate the problem of incorrect segmentation due to similar features of similar categories. Finally, the feature vectors were mapped to the required number of classes through convolution with a convolution kernel size of 1 × 1 to generate the segmentation results.
Specifically, the RSI B is inputted to the U-Net module and the DenseASPP module for parallel processing, respectively, so as to generate two different feature maps,
F1 and
F2:
Next, the Channel Attention Fusion module learned the correlation between feature map channels, and
F1 and
F2 were fused in the channel dimension to promote specific semantic features of interconnected feature maps to generate new features,
Ffuse:
Lastly, Ffuse went through a 1 × 1 convolution to map the feature vectors to the desired number of classes and produce the segmentation results.
3.2. U-Net Module
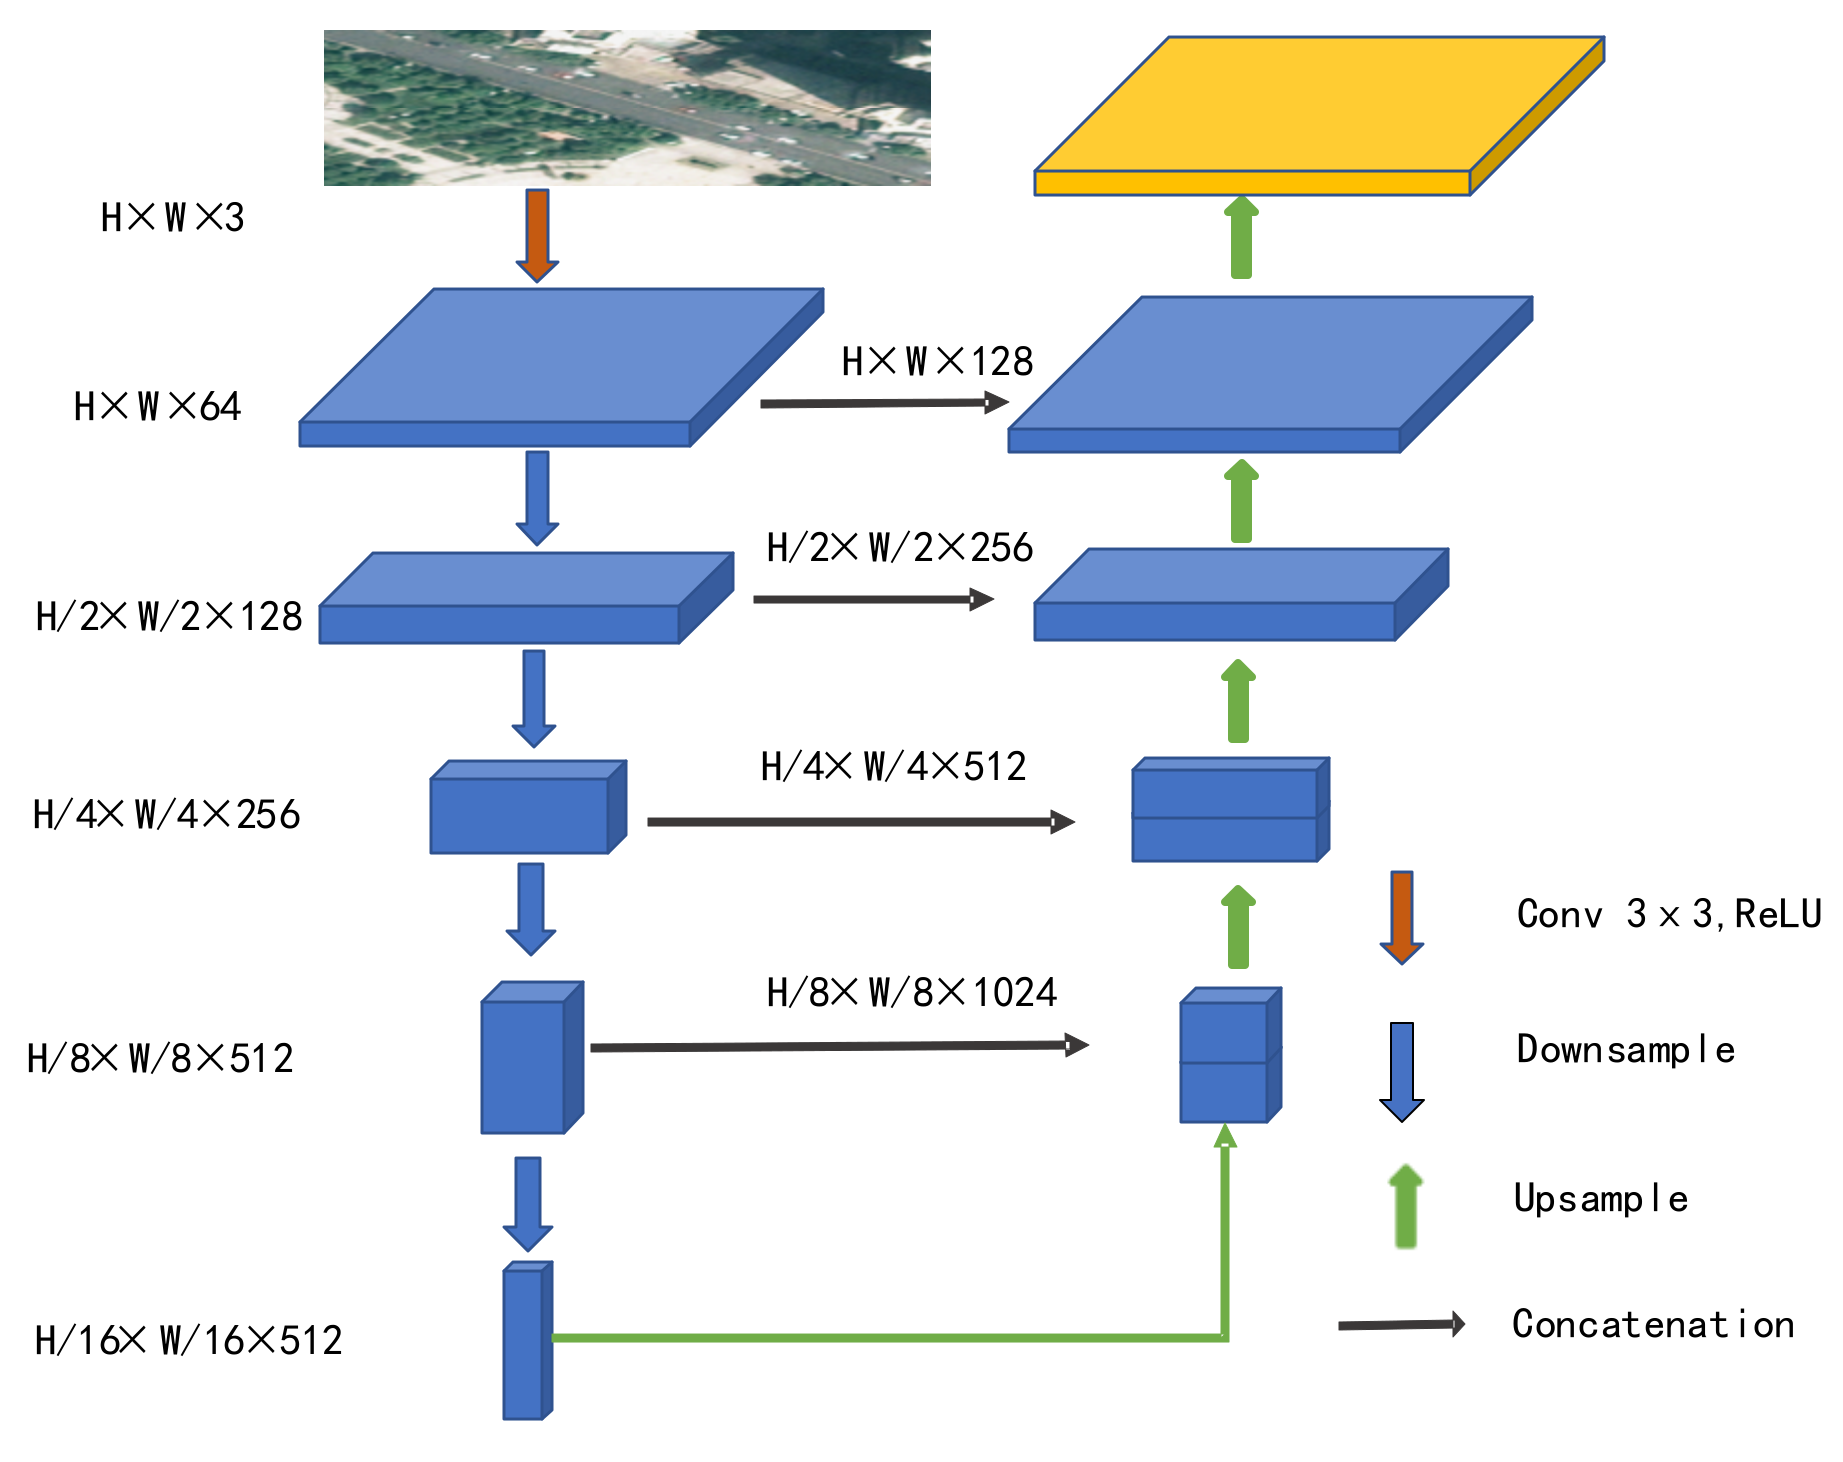
The architecture of U-Net was mainly composed of a contraction path to capture context and a symmetric expansion path to enable precise localization [
5]. In the downsampling step, U-Net performed feature extraction for RSI, in which each convolution block was followed by a ReLU and a 2 × 2 maximum pooling operation. At the same time, the number of feature channels doubled in each downsampling step. Then, U-Net passed the contextual information captured by downsampling through the expansion path to the upsampling process in the same layer. In each upsampling step, the feature map went through a 2 × 2 up-convolution, and the number of output channels after the up-convolution became half of the original image. Meanwhile, the corresponding cropped downsampled feature map was concatenated with it and went through two 3 × 3 convolutions as well as a ReLU action.
Figure 2 illustrates this structure.
3.3. DenseASPP Module
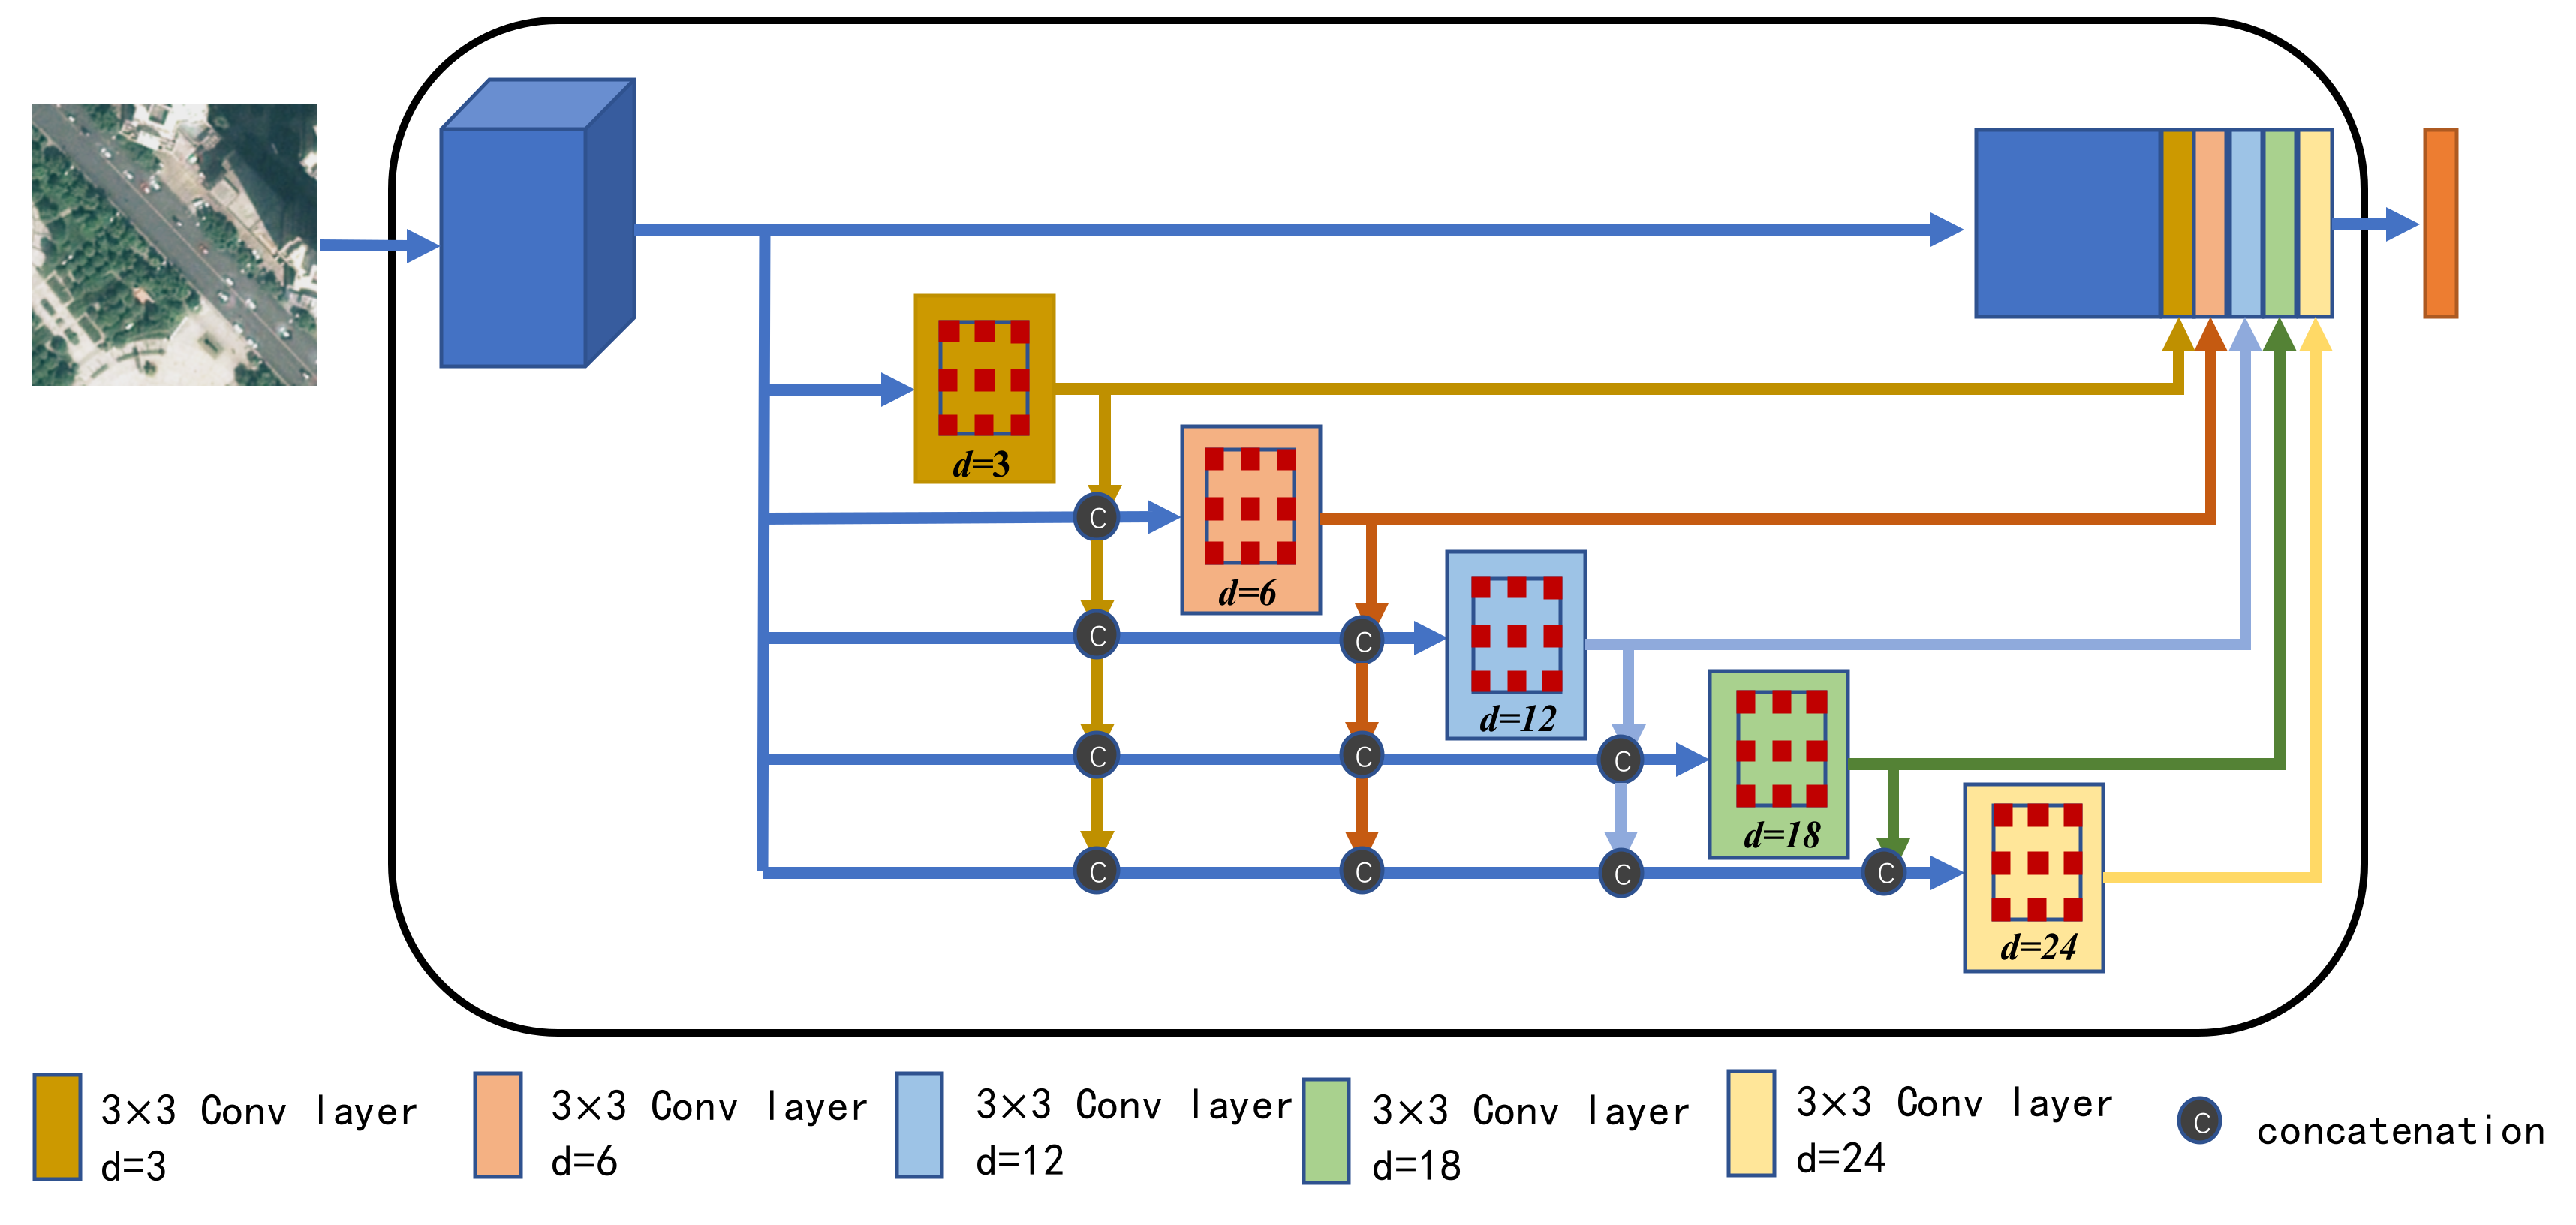
In order to capture multi-scale contextual information and global contextual information in RSIs, the DenseASPP module was introduced as the feature extractor. As shown in
Figure 3, DenseASPP adopts the idea of dense connection and organizes atrous convolution layers in a cascading way to realize the integration at different levels with different dilation rates [
12]. This organization mode not only covers a larger scale, but also intensively covers the scale without significantly increasing the model size. Specifically, in this work, it used dense connections to feed the output of each atrous convolution layer to all previous unvisited atrous convolution layers so as to obtain semantic information from different scales. Moreover, the dilation rate of atrous convolution at each layer increased layer by layer, expanding the receptive field while keeping the resolution of the feature map unchanged. Among these, the layer with the smallest dilation rate was placed in the lower layer, while the layer with the largest dilation rate was placed in the upper layer. Finally, the feature map generated by multi-scale convolution was outputted. According to Equation (4), the output expression of each layer in DenseASPP is:
where
dl represents the dilation of layer
l, […] represents the concatenation operation.
represents the feature map formed by concatenating the outputs from all previous layers. It not only retains the pyramidal feature of increasing the atrous convolution rate layer by layer, but also densely concatenates the output of all atrous convolutions together so that more pixels are involved in the computation.
3.4. Channel Attention Fusion Module
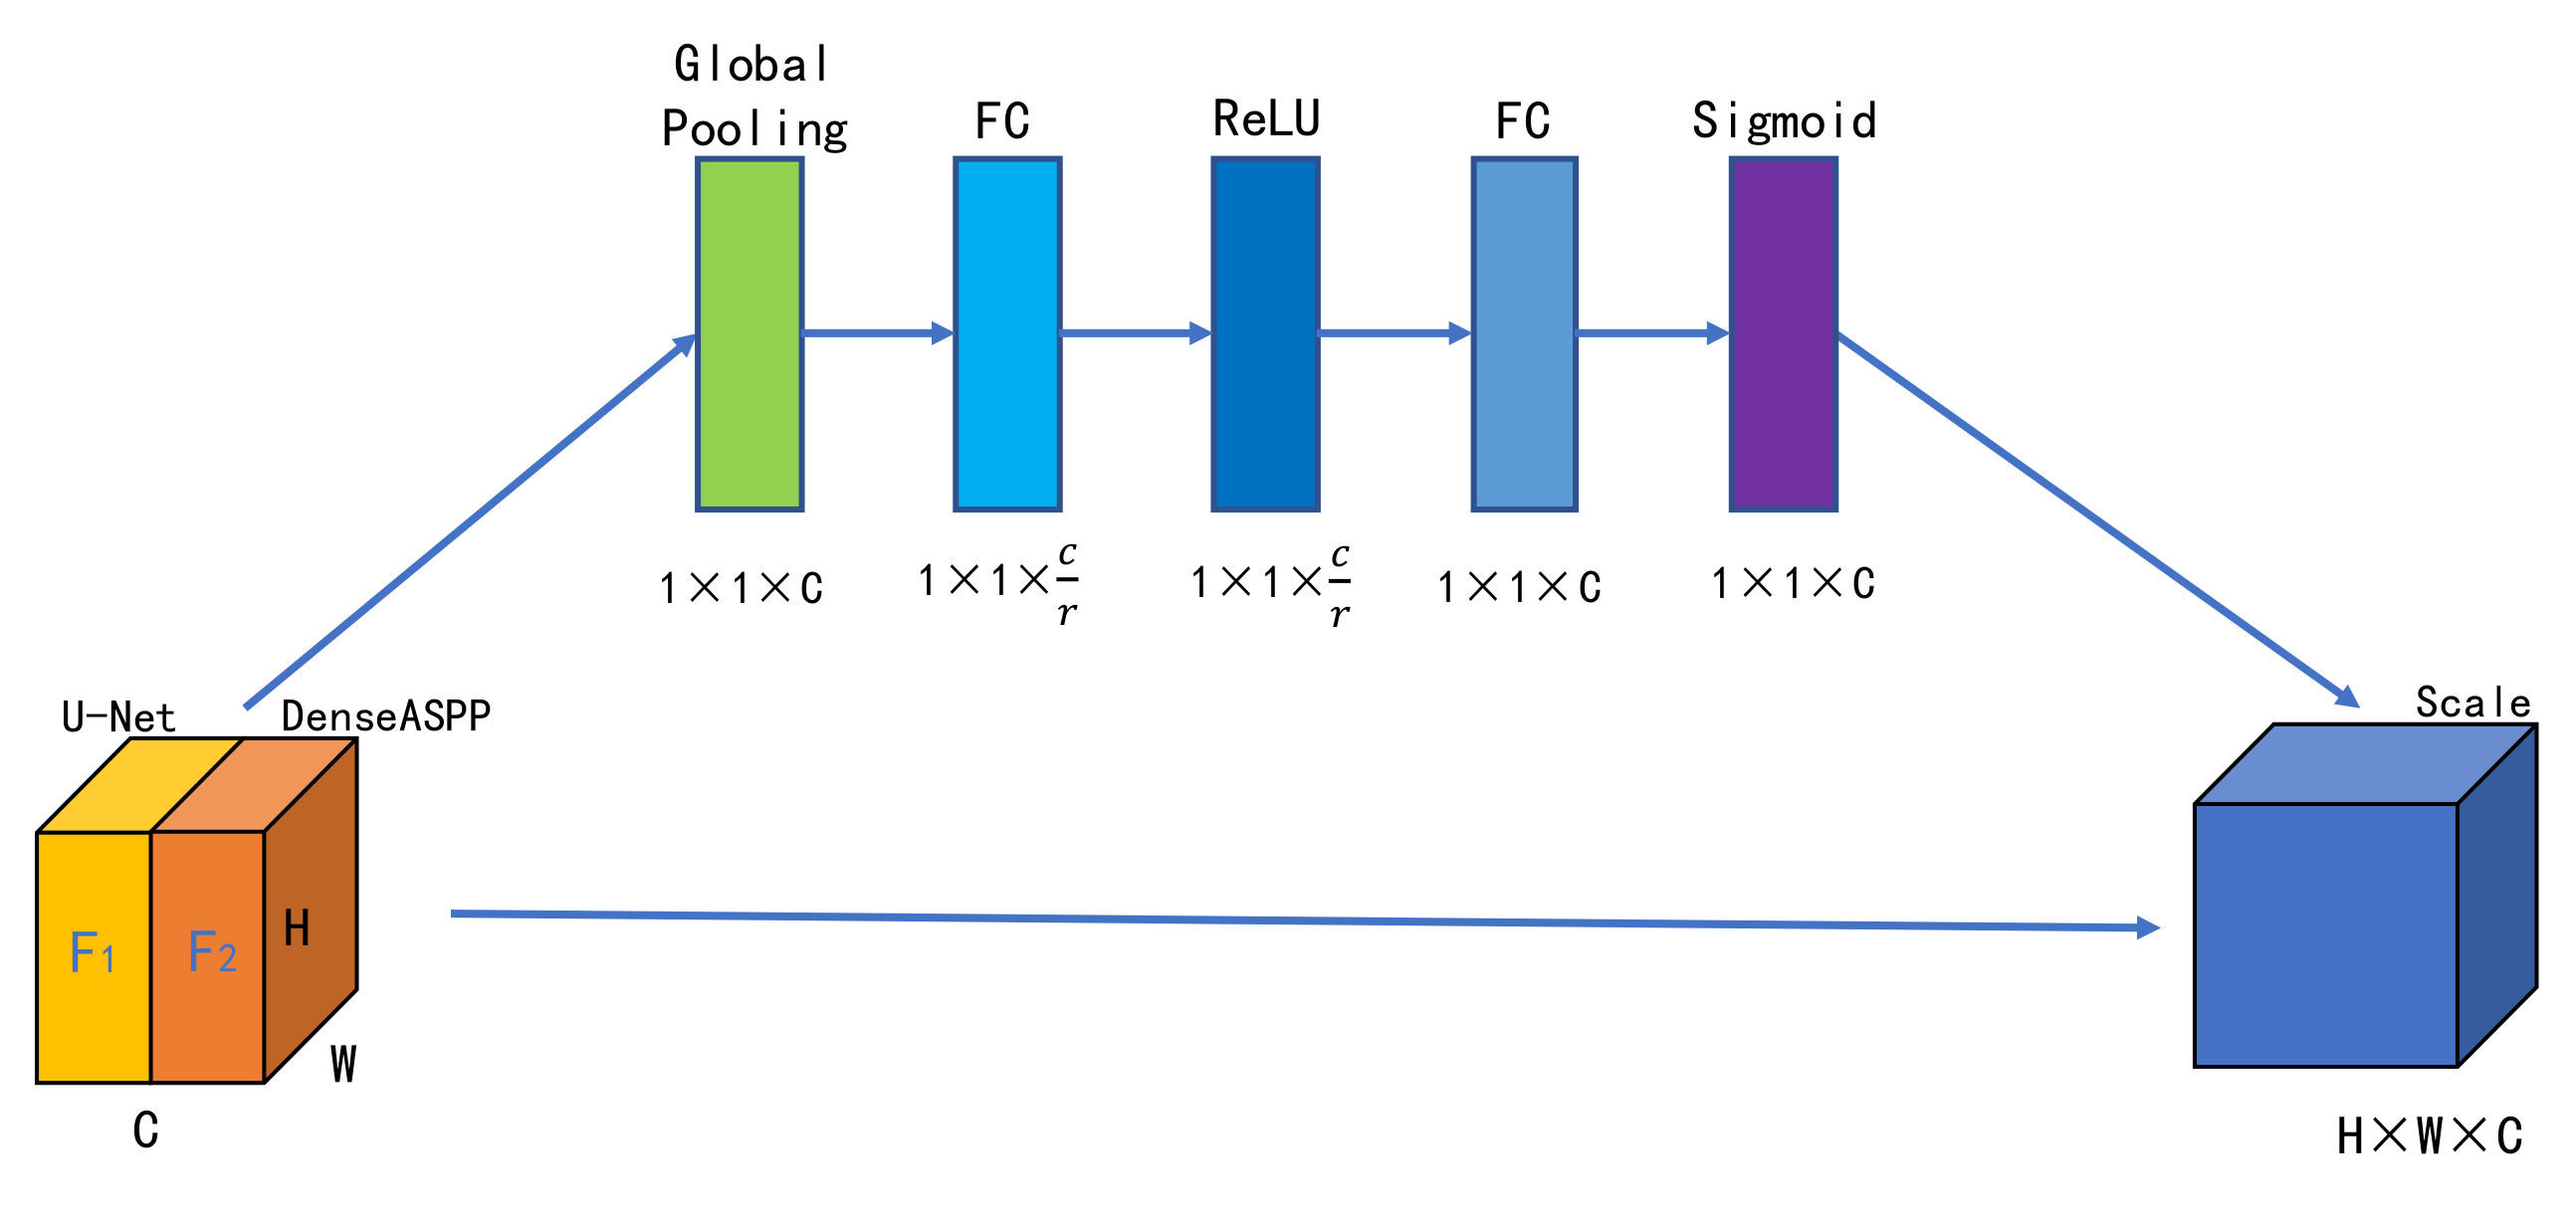
The traditional approaches usually ignore the correlation between feature channels and express low sensitivity to important information features during the fusion process. In order to effectively fuse the feature maps of the U-Net module and the DenseASPP module, we adopted the channel attention method. Using SENet [
47] to learn the correlation between different feature channels (and to enhance the extraction of important features) this fusion module achieved the automatic selection and weight assignment of attention regions, then improved output feature quality. Specifically, its core operations mainly included Concatenation, Squeeze and Excitation. The structure of the fusion module shows as
Figure 4.
First, the feature maps
F1 and
F2, outputted by the U-Net module and the DenseASPP module, respectively, were concatenated from the channel dimension to obtain the feature maps
F,
F , where
F = [f
1, f
2, …, f
c]:
Secondly, the global spatial information was squeezed to generate channel statistics and obtain channel descriptions
Z. The statistic
Z was generated by shrinking
F through its spatial dimensions
H ×
W, such that the c-th element of
Z was calculated by:
Next, the Excitation operation used the aggregated information from the Squeeze stage to capture the importance of each feature channel after the sigmoid function. In order to limit the model complexity and enhance the generalization ability, it was necessary to downscale the first FC layer to 1/r, and r was the downscaling hyperparameter. After a ReLU layer, it was then raised back to its original dimension through the second FC layer, so
and
. The calculation formula is as follows:
where
denotes the sigmoid function, and
denotes the ReLU function. Further, the final output of the module was obtained by rescaling
F with the activation
s:
where
X = [
x1,
x2, …,
xc],
refers to channel-wise multiplication between the scalar s
c and the feature map
.
4. Description Datasets and Experiment Settings
In this section, we introduce the experimented datasets, the experiment setting and the evaluation metrics.
4.1. Experiment Datasets
4.1.1. Self-Built Image Dataset
In this paper, we built a semantic segmentation dataset of land-use types. In order to make sure the samples in the training set and validation set were sufficient and to ensure reasonable experiment results, the original image data of the satellite adopted open multi-source remote sensing data. We selected satellite image data from the main urban areas of one city’s urban district: Hunan Province in central China. The resolution of the image was 0.5 m, and the image was composed of three channels: red, green and blue. The GSD (Ground Sample Distance) range of each image was 35–60 cm and each image was 14,969 × 22,929 pixels. For the acquisition of land-use type labeled images, we divided the area of the original image according to the third Land Resources Survey classification (3rd LRSC) standard and combined it with the actual land-use in the main urban area. The 3rd LRSC was made in 2019 based on the actual land use in China, in order to rationalize land use and ensure development efficiently (GB/T 21010-2017). Then, the Labelme image annotation tool [
50] was used to segment and mark different land-use types in the original RSIs. It produced label images with different color categories in the dataset. According to the importance of urban land-use types, the main research types of this paper were residential land, industrial land, traffic land, woodland and unused land.
Table 1 shows the 5 classes used in this paper. We built all classes for 3rd LRSC, while these five classes changed a lot over the years of urbanization.
Table 2 shows the statistics of areas and proportions of different land-use types in the remote sensing image data.
In tasks with only a small number of training samples, data augmentation [
51] was critical for the invariance and robustness of the training network. In this experiment, the original image data and label image data were preprocessed, including data cutting and data augmentation, as follows: (1) The original remote sensing images were cut into blocks of 256 × 256 pixels; (2) sample label images were created; (3) the images were processed by data augmentation, such as rotation, displacement, random clipping and random scaling. Finally, we obtained 4584 sample RSIs at a size of 256 × 256 pixels and assigned 60% of the sample data to the training set, 20% to the validation set, and 20% to the test set.
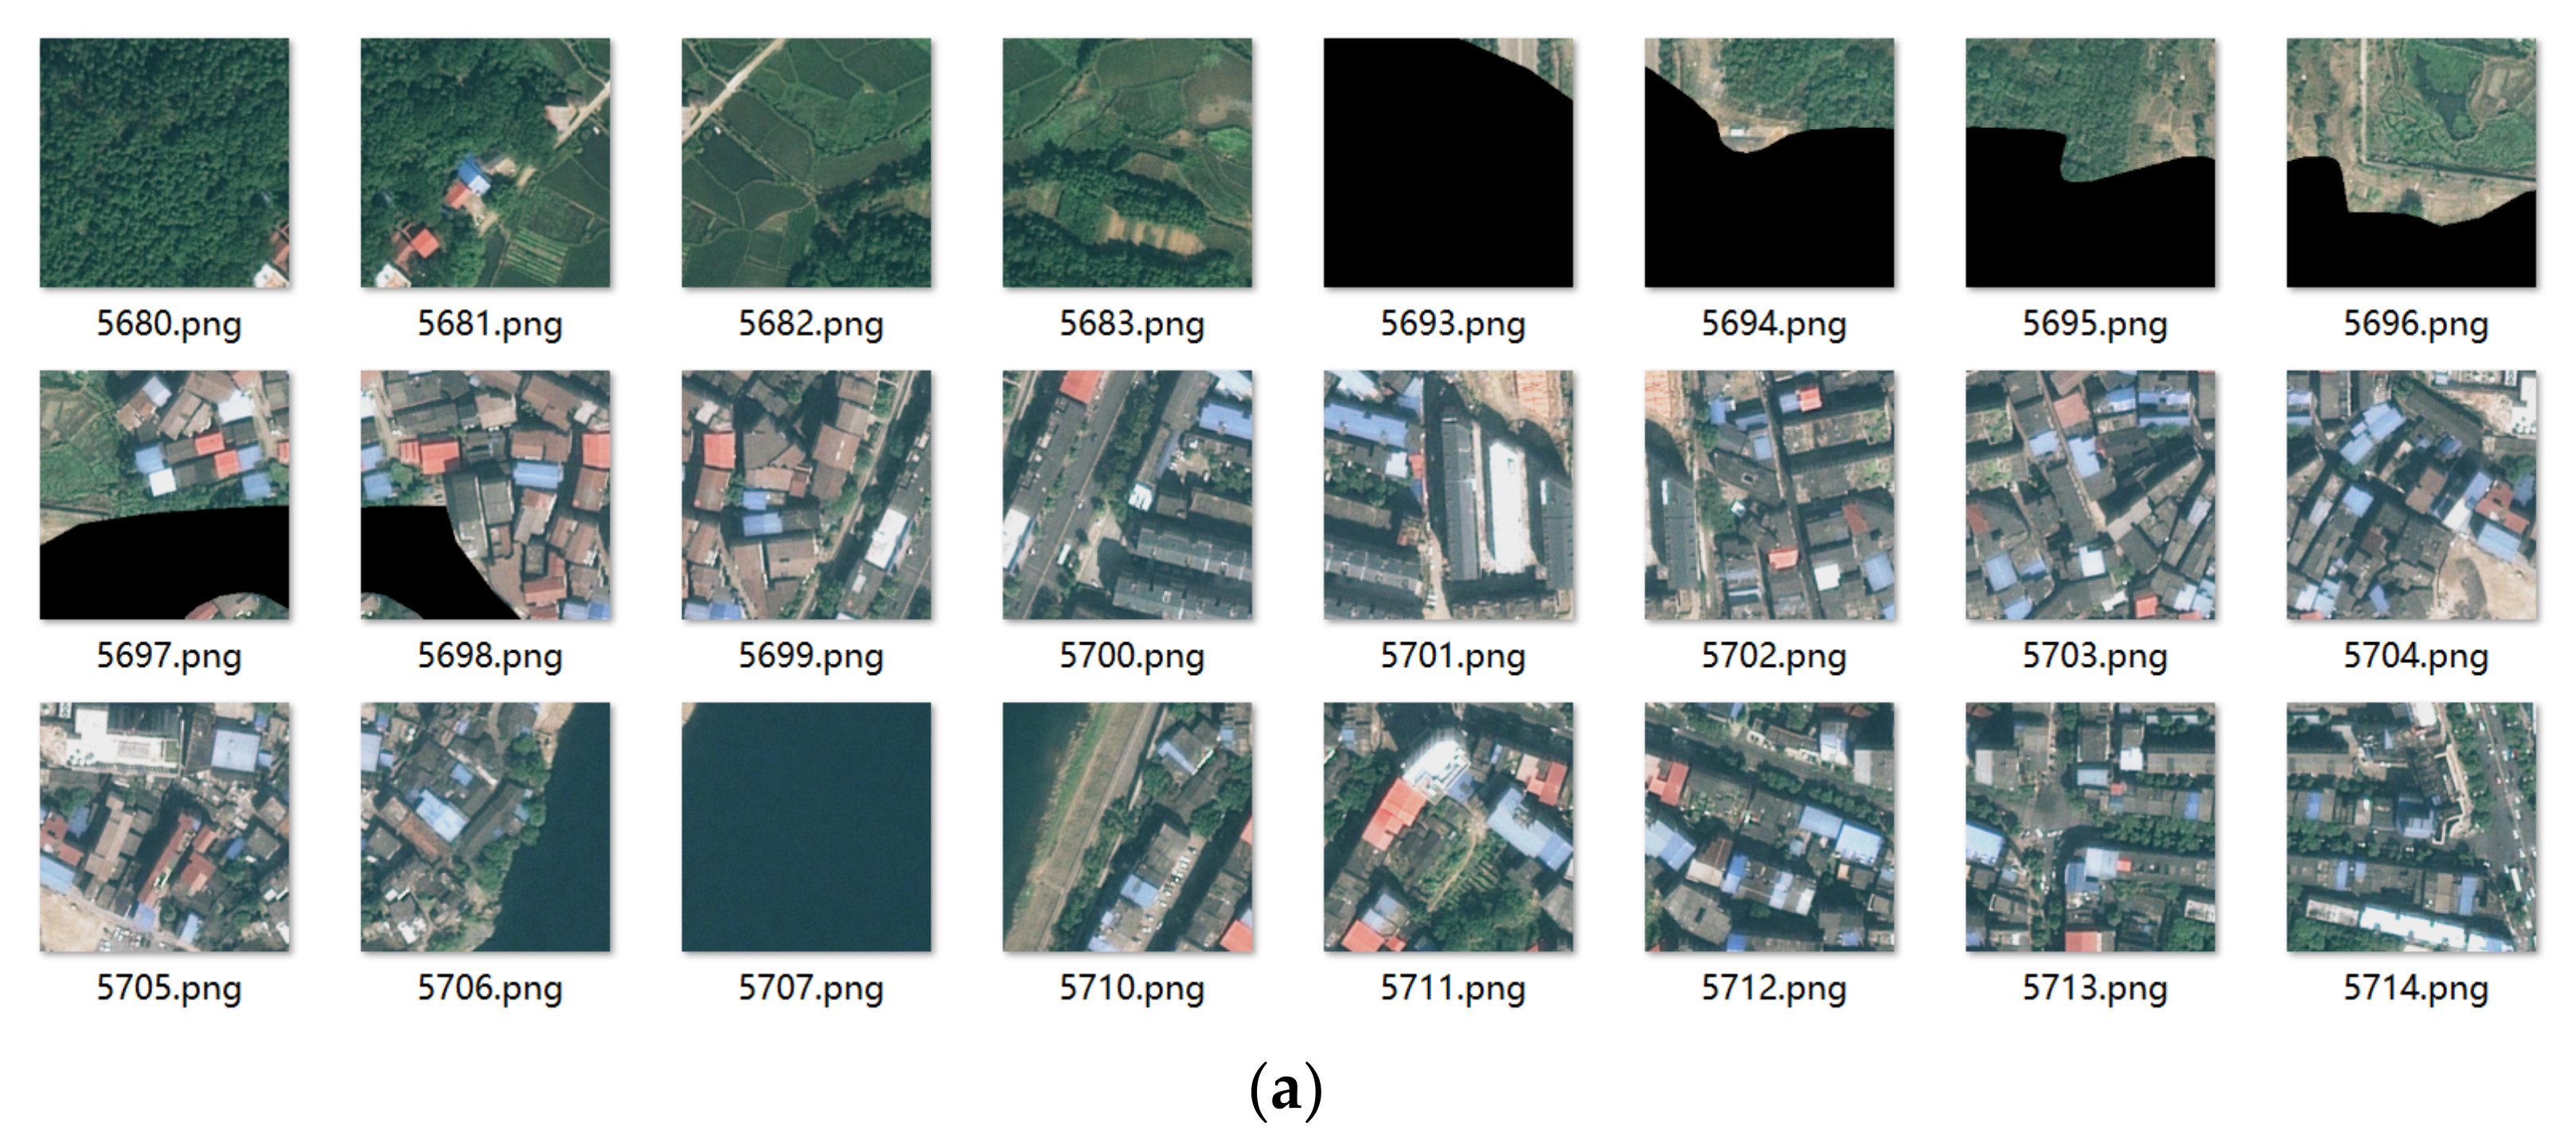
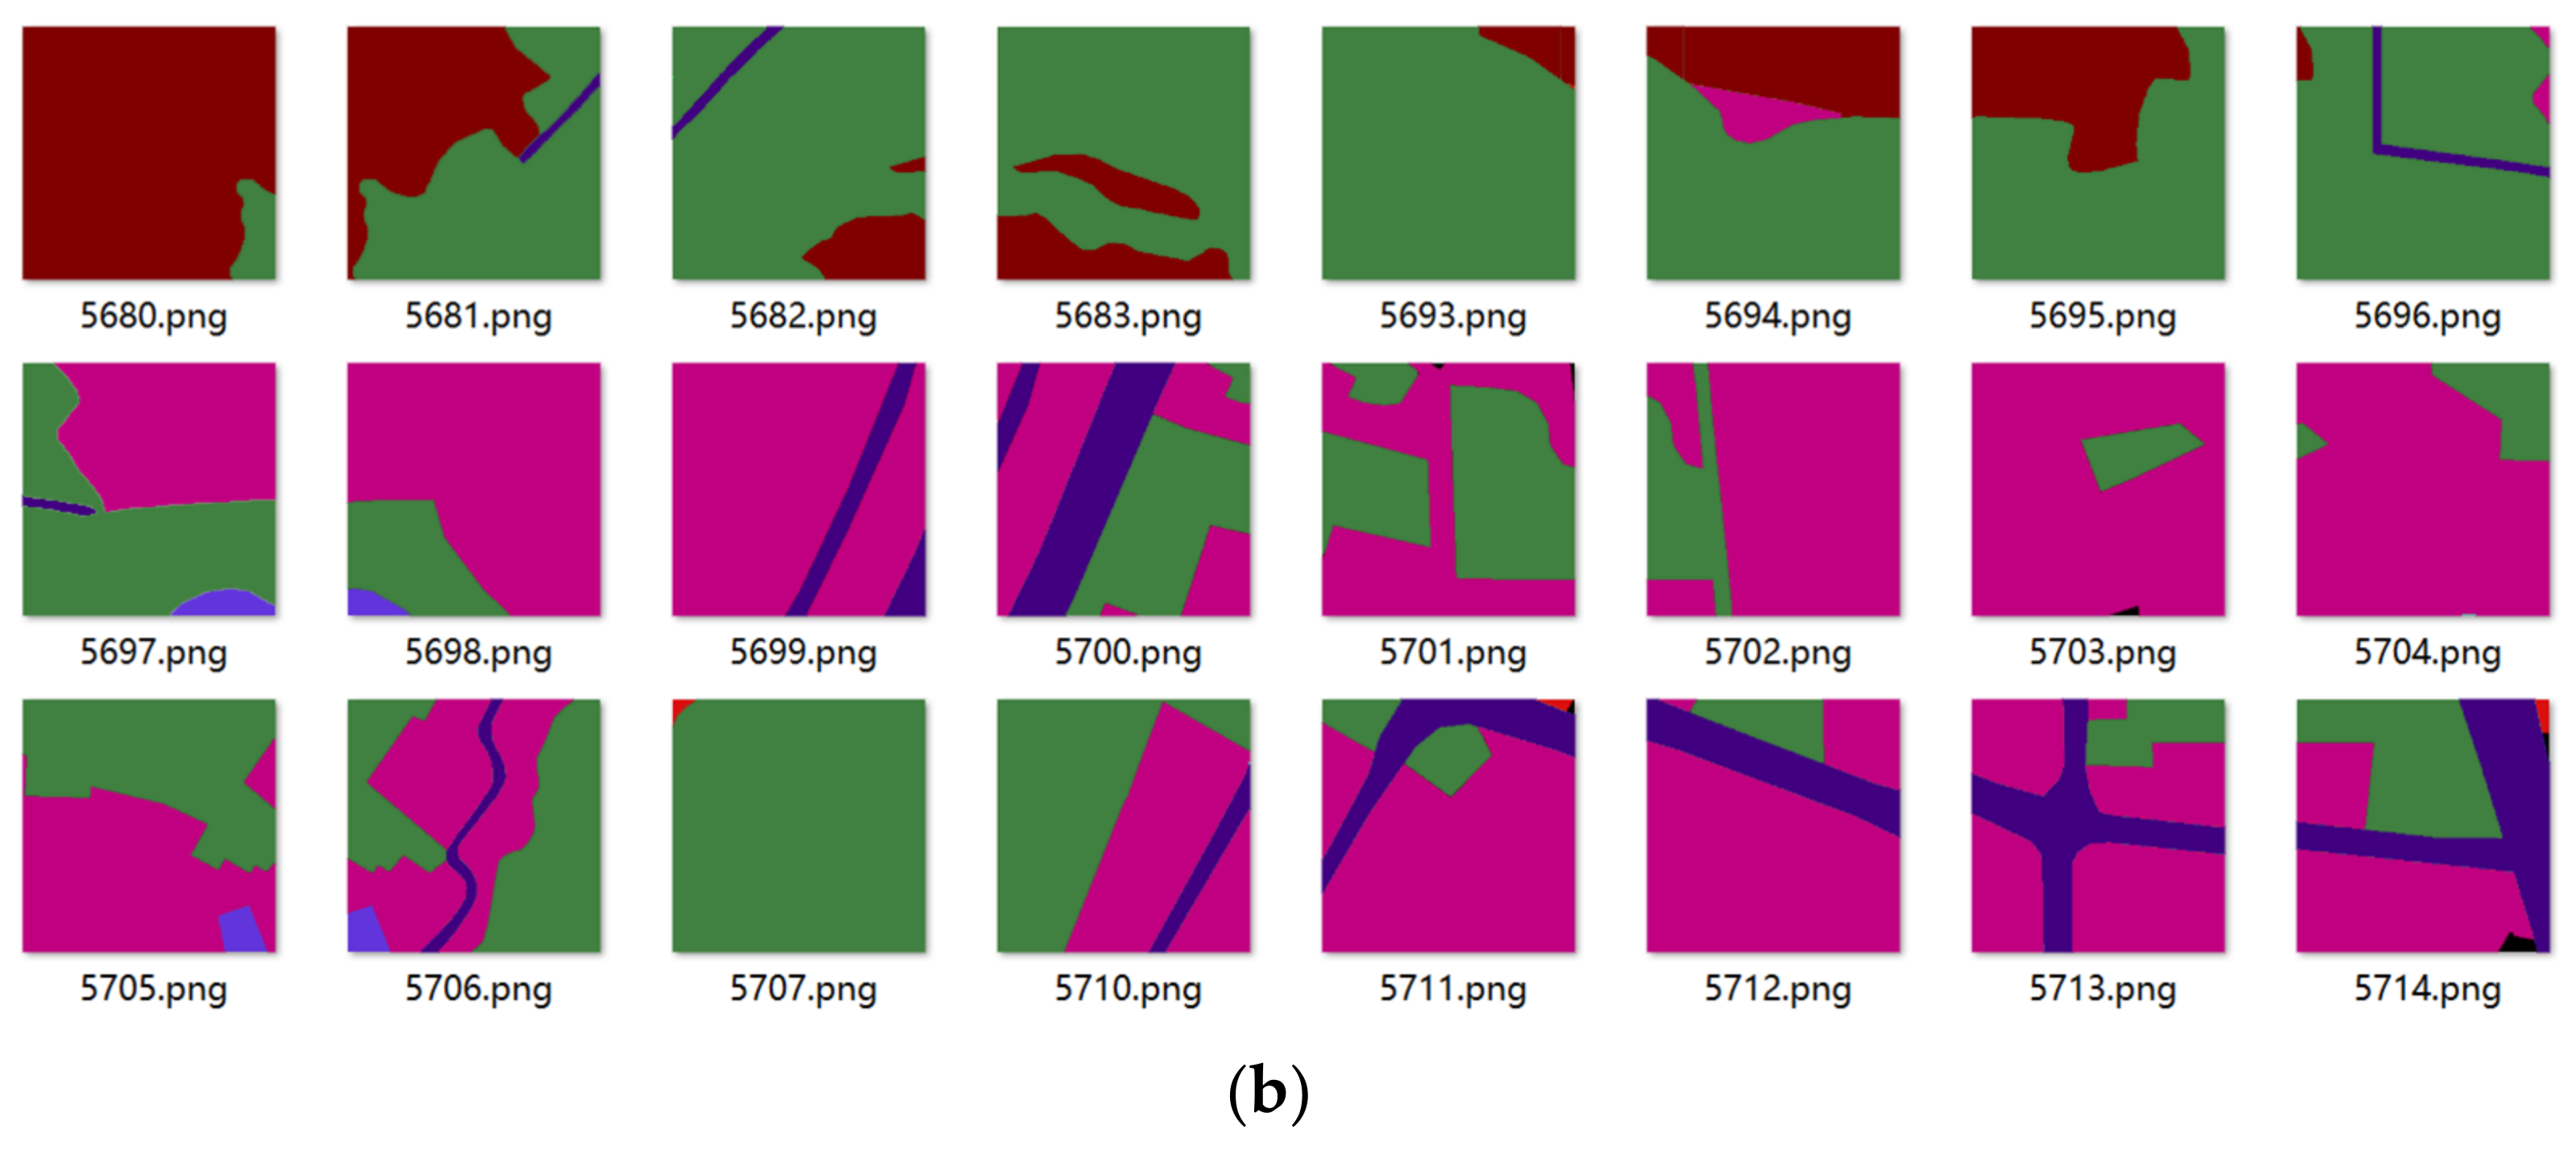
In
Figure 5, which displays part of the image map in the data set,
Figure 5a is the original image map, and
Figure 5b is the label image of different land use types obtained.
4.1.2. ISPRS Vaihingen Dataset and Potsdam Dataset
We tested the proposed approach on two commonly used and high-quality RSI benchmark datasets: the Vaihingen and the Potsdam datasets.
The Vaihingen Dataset [
52]: The dataset contains 33 tiles extracted from true orthophotos and the corresponding registered normalized digital surface models (DSMs). Sixteen image patches are used for the training phase, and the remaining 17 for the testing phase. The spatial size of images varies from 1996 × 1995 to 3816 × 2550 pixels, and the ground sampling distance (GSD) of this dataset is 0.09 m. The images in this dataset had six common classes, including impervious surface, building, low vegetation, tree, car, and background. According to the statistics, there were significant differences in the proportions of pixels of objects. For example, the number of pixels of miscellaneous categories such as water area was only 1/38 of the number of pixels on the ground. At the same time, the size of objects varied from place to place. Vehicles were similar to point features, while vegetation, buildings and ground were close to surface features.
The Potsdam Dataset [
53]: The dataset contains 38 tiles extracted from true orthophotos and the corresponding registered normalized digital surface models (DSMs). Twenty-four image patches are used for the training phase, and the remaining 14 for the testing phase. Each image has the same spatial size of 6000 × 6000 pixels. The ground sampling distance (GSD) of this dataset is 5 cm. The defined object classes are the same as those in the Vaihingen dataset.
On the two publicly available datasets, we first performed data preprocessing, including data cutting and data enhancement. (1) The images in the data set were evenly cut into image blocks of 256 × 256 pixels. (2) Data augmentation processing was performed on the images used in the training model.
4.2. Experiment Setting and Evaluation Metrics
The proposed network and other comparison ones were trained on an NVIDIA GeForce GTX 1080Ti GPU, and all the experiments were implemented using the Keras framework with a Tensorflow backend. The stochastic gradient descent (SGD) optimizer was used to optimize the experimental process. Due to the limited memory of GPU, the batch size (BS) of 8 was chosen in the experiment. The learning rate (LR) was obtained through experiments. The loss function adopted the Cross-Entropy Loss Function. The learning rate strategy was the Polynomial Decay strategy, using the formula:
where
is the learning rate,
is the initial learning rate and was set to 0.001, and
refers to the current iteration number,
refers to the maximum number of iterations and obtains from the epoch multiplying the number of the training set image, and
is the learning rate strategy index, which is set to 0.9 in the experiment.
For research on land-use classification, in order to make an effective evaluation of the experimental results, this paper used the overall accuracy (OA), F1-score (F1) and mean intersection over union (mIOU) of the semantic segmentation field as evaluation indices.
The formulas follow:
where
P,
N,
TP,
TN,
FP, and
FN represent the positive, negative, true positive, true negative, false positive, and false negative pixels in the prediction map, respectively. The manning of
is the total number of all pixel classes.
5. Experimental Results
To evaluate the performance of DUA-Net, we used five of the most advanced and mature deep learning methods (FCN, SegNet, U-Net, DenseASPP, Deeplab v3) to conduct experiments and compare results in the same environment and settings. Each method is trained from scratch, no pre-trained models are used, and all networks converge during training. The inference process of the five existing deep learning methods is the same as that of DUA-Net.
For a fairer comparison between the single network approaches and the proposed dual network setup, we replace the SENet part of DUA-Net by an identity function. We named this method as DUA-Net (replaced by IF). To be specific, we concatenate the channel dimensions of the feature maps outputted by the U-Net module and the DenseASPP module, and due to the different number of channels in the two stages, 1 × 1 convolution R1 and R2 is used to reduce the channel dimension in order to generate the new feature
instead of
:
The results of the examples show the overall results of the different networks for randomly selected test regions.
5.1. Results of the Self-Built Image Dataset
In the self-built remote sensing image dataset, we selected five important land-use types and conducted seven different experimental methods.
Table 3 shows the semantic segmentation results of the selected land-use types and the overall evaluation indices of six different methods.
As shown in
Table 3, the DUA-Net of this experiment achieved a higher degree of accuracy than other typical methods. The overall accuracy improved by 5.24% compared with FCN, since FCN does not consider the high frequency details of images. Compared with SegNet and U-Net, DUA-Net also significantly improved. Although the SegNet algorithm and U-Net algorithm also work by encoding and decoding structures, they only use input images of one scale, and the encoding structure does not carry out feature fusion for feature images of different scales. DenseASPP used dilated convolution to expand the receptive field of features and to integrate more features of pixels in RSI, but it failed to fully consider the correlation between pixels. Compared to the Deeplab v3, the DUA-Net model is better at extracting pixel association features from image data during the classification of different land use types. The Deeplab v3 model uses only a 1 × 1 convolution kernel and a single bilinear interpolation method in the final upsampling process to reduce the image scale and obtain the final classification result. This approach loses image accuracy and the parameters of the bilinear interpolation method are not learnable and therefore do not take into account the phenomenon of pixel point association in the semantic segmentation problem of land use classification. The method proposed in this paper exhibited greater advantages in feature correlation analysis, which can be derived from the results of the comparison between DUA-NET (replaced by IF) and DUA-Net. DUA-Net (replaced by IF) is slightly inferior in acquiring features of complex land-use types for the reason that DUA-Net with the Channel Attention Fusion module enhances the ability to learn feature channel weights, so the segmentation accuracy of different land-use types is improved to some extent. All in all, the overall accuracy, average F1 score and mIOU of DUA-Net are better than DUA-Net (replaced by IF). For example, in the self-built image dataset, industrial land was different from other land-use types and had complex features, so the overall recognition effect fell behind other categories. The proposed method considered the relationship between pixels and used the adjacent pixels for classification to improve recognition accuracy of industrial land. DUA-Net ranked in first place among the methods compared.
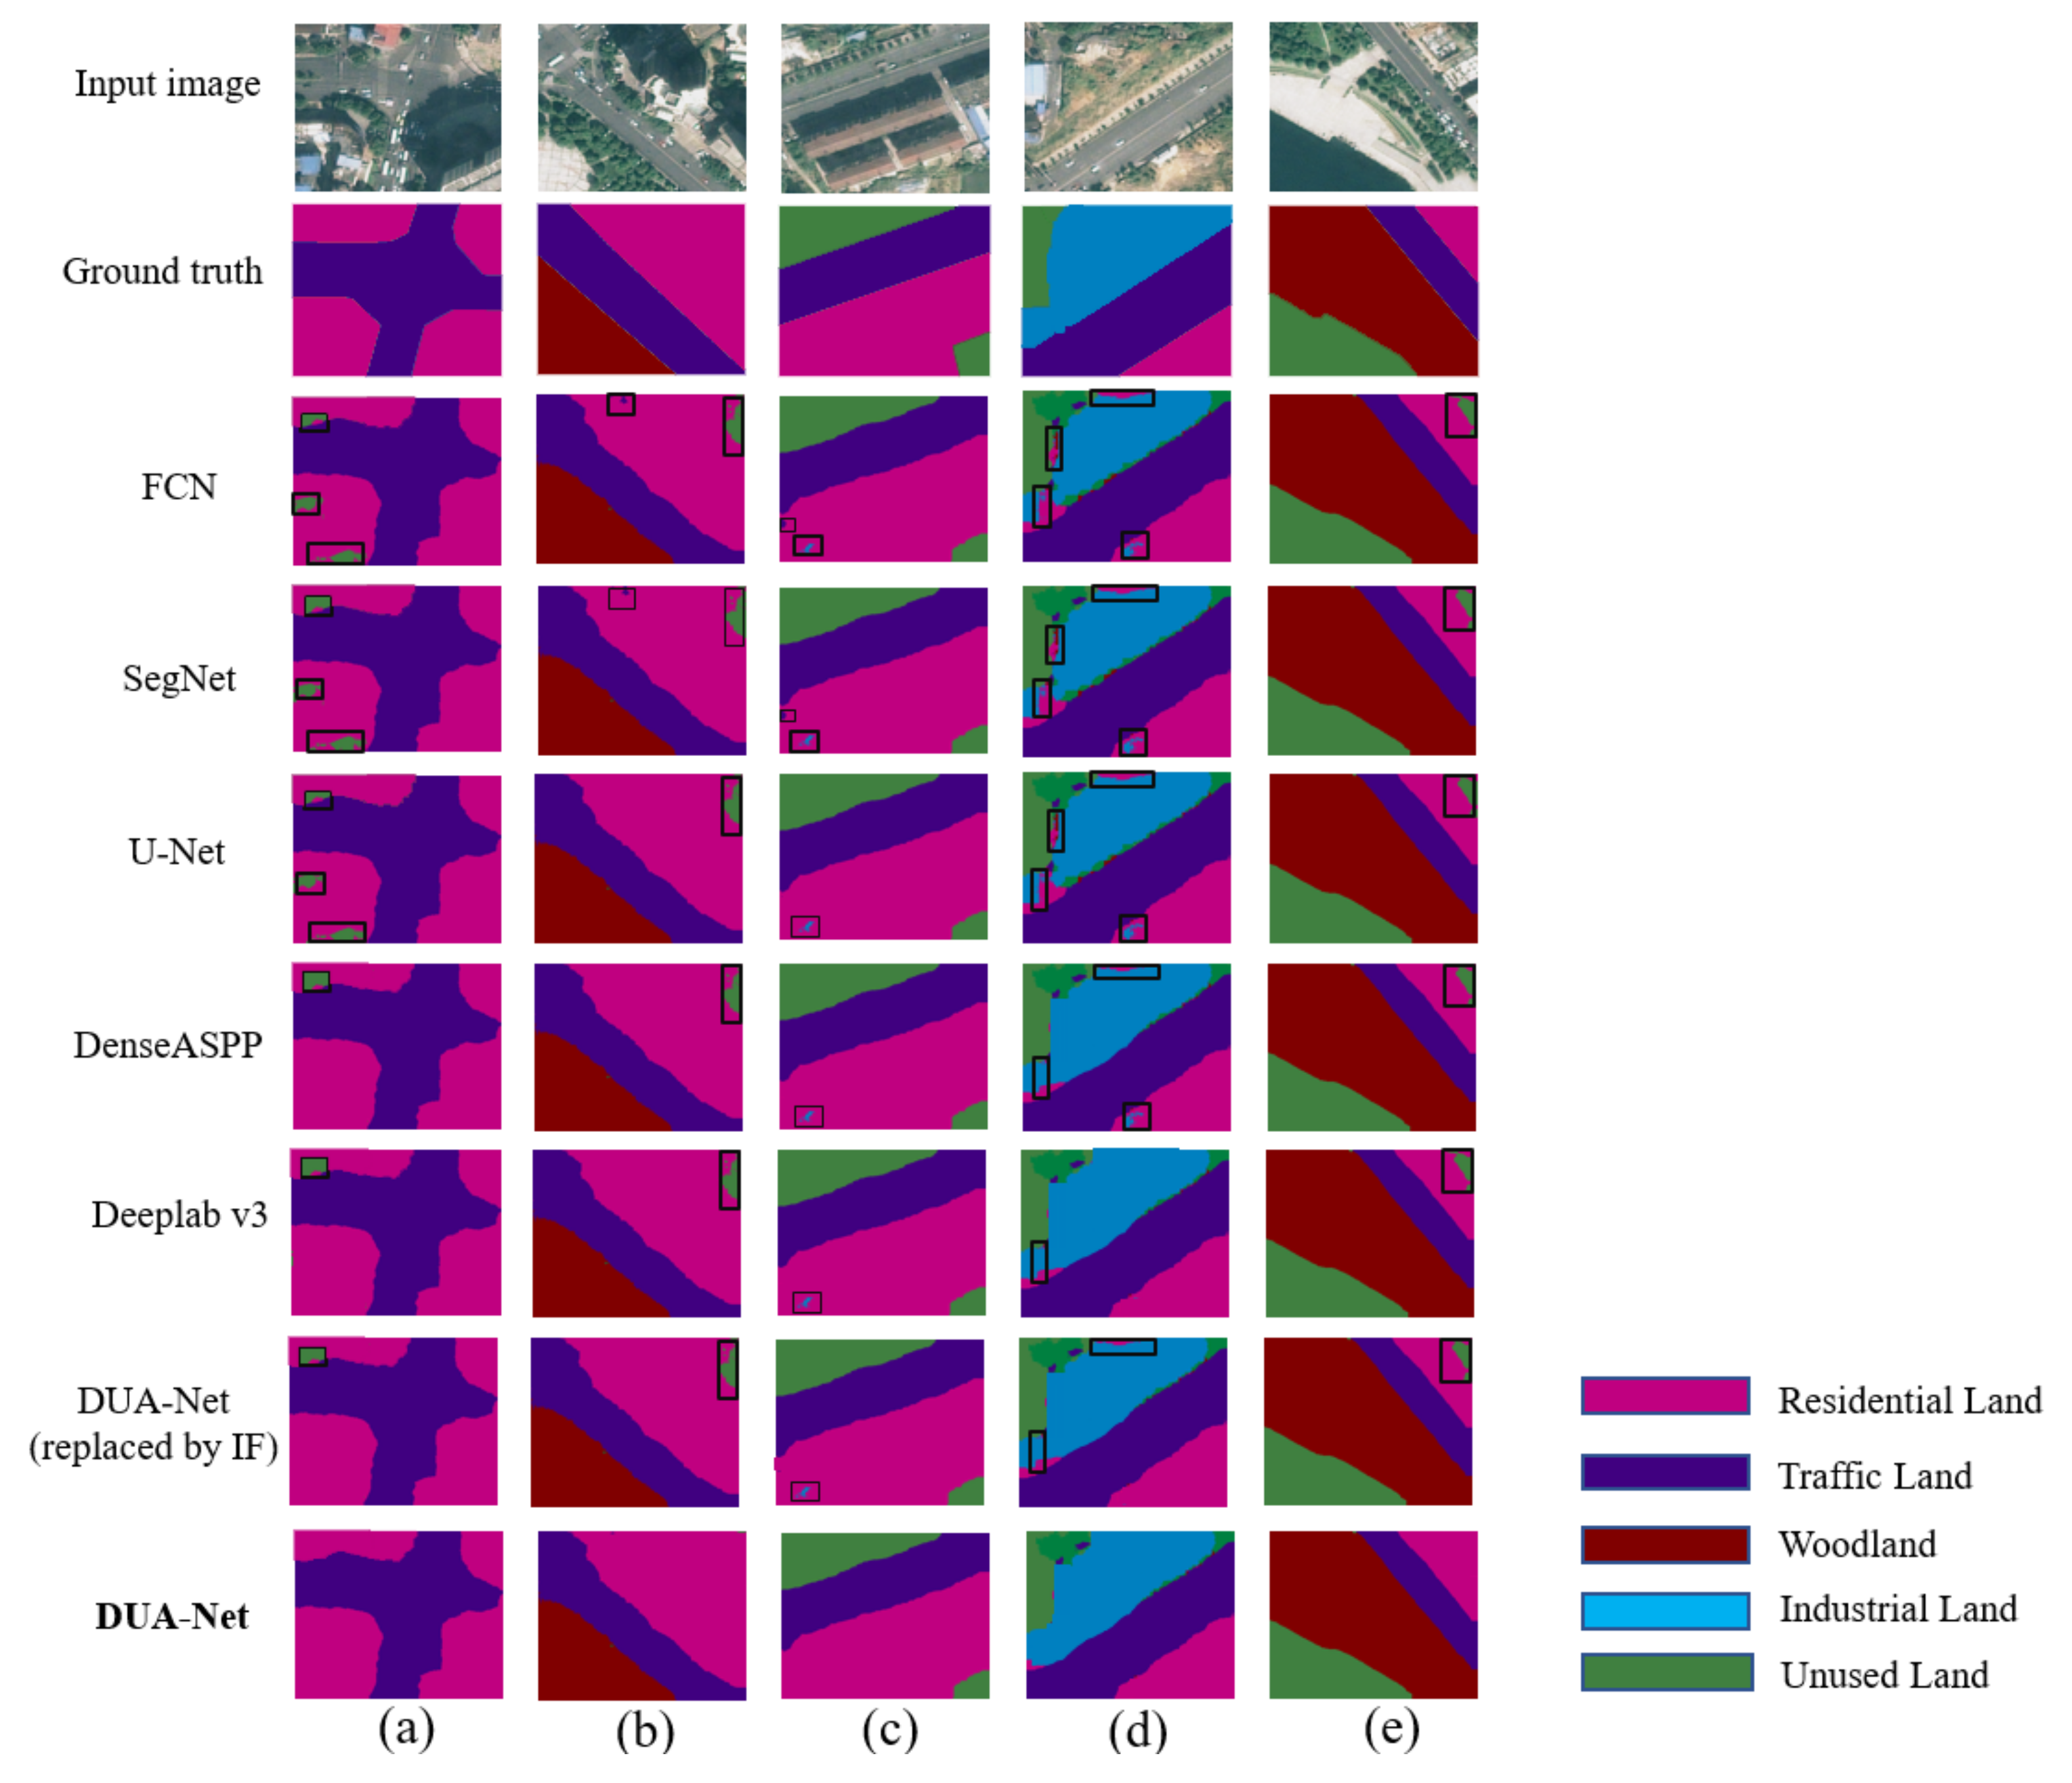
Figure 6 shows the segmentation prediction results of the proposed method and the other five classification methods. Compared with other existing methods, DUA-Net effectively improved the problem of pixel classification and pixel correlation, and the segmentation prediction results were more accurate. The black boxes in the sub-figures show the errors caused by the failure of other models. These errors are mainly manifested in the fragmented single element classification, which ignores the holistic nature of land use types. As shown in
Figure 6a–e, the obvious classification errors of land-use types involved identification errors in residential land. This is because residential land contains many other fragmented pixel features, such as trees and grass. Other typical methods typically do not consider the correlation between pixels to classify these fragmented features one by one. Similarly, there were more errors in the identification of industrial land, as shown in
Figure 6d, because industrial land contains more complex pixel feature types, such as bare land, trees, grassland, water, etc. The proposed DUA-Net extracted the fusion features between pixels in the recognition process and learned the association between different land-use types. As such, it had greater advantages in the recognition process of land-use types containing multiple pixels, and the recognition accuracy was better than in other typical methods.
5.2. Results of ISPRS Vaihingen Dataset and Potsdam Dataset
In the two publicly available datasets, we selected five land-cover types for our experiments, namely impervious surface (Imp.Surf), building, low vegetation (LowVeg), tree and car.
Table 4 shows the semantic segmentation results of the selected land-cover types and the overall evaluation indices of seven different methods. As shown, the DUA-Net network achieved the highest overall accuracy, average F1 score and mIOU in this dataset for all compared categories.
Table 5 shows the experimental results of the method in this paper on the Potsdam dataset. In particular, the high accuracy of identifying the building class in the Potsdam datasets is due to the fact that people live in similar residential areas with similar architectural features, proving that the method in this paper takes into account the correlation between neighboring pixels of buildings.
The recent proposed Dual Attention Feature fusion method [
54] and Class-Wise FCN [
55] also use these two datasets, and we compared the performances with the DAU-Net.
Table 6 shows the results. Our method achieved the higher accuracy of the serval classes for considering one class as the whole block.
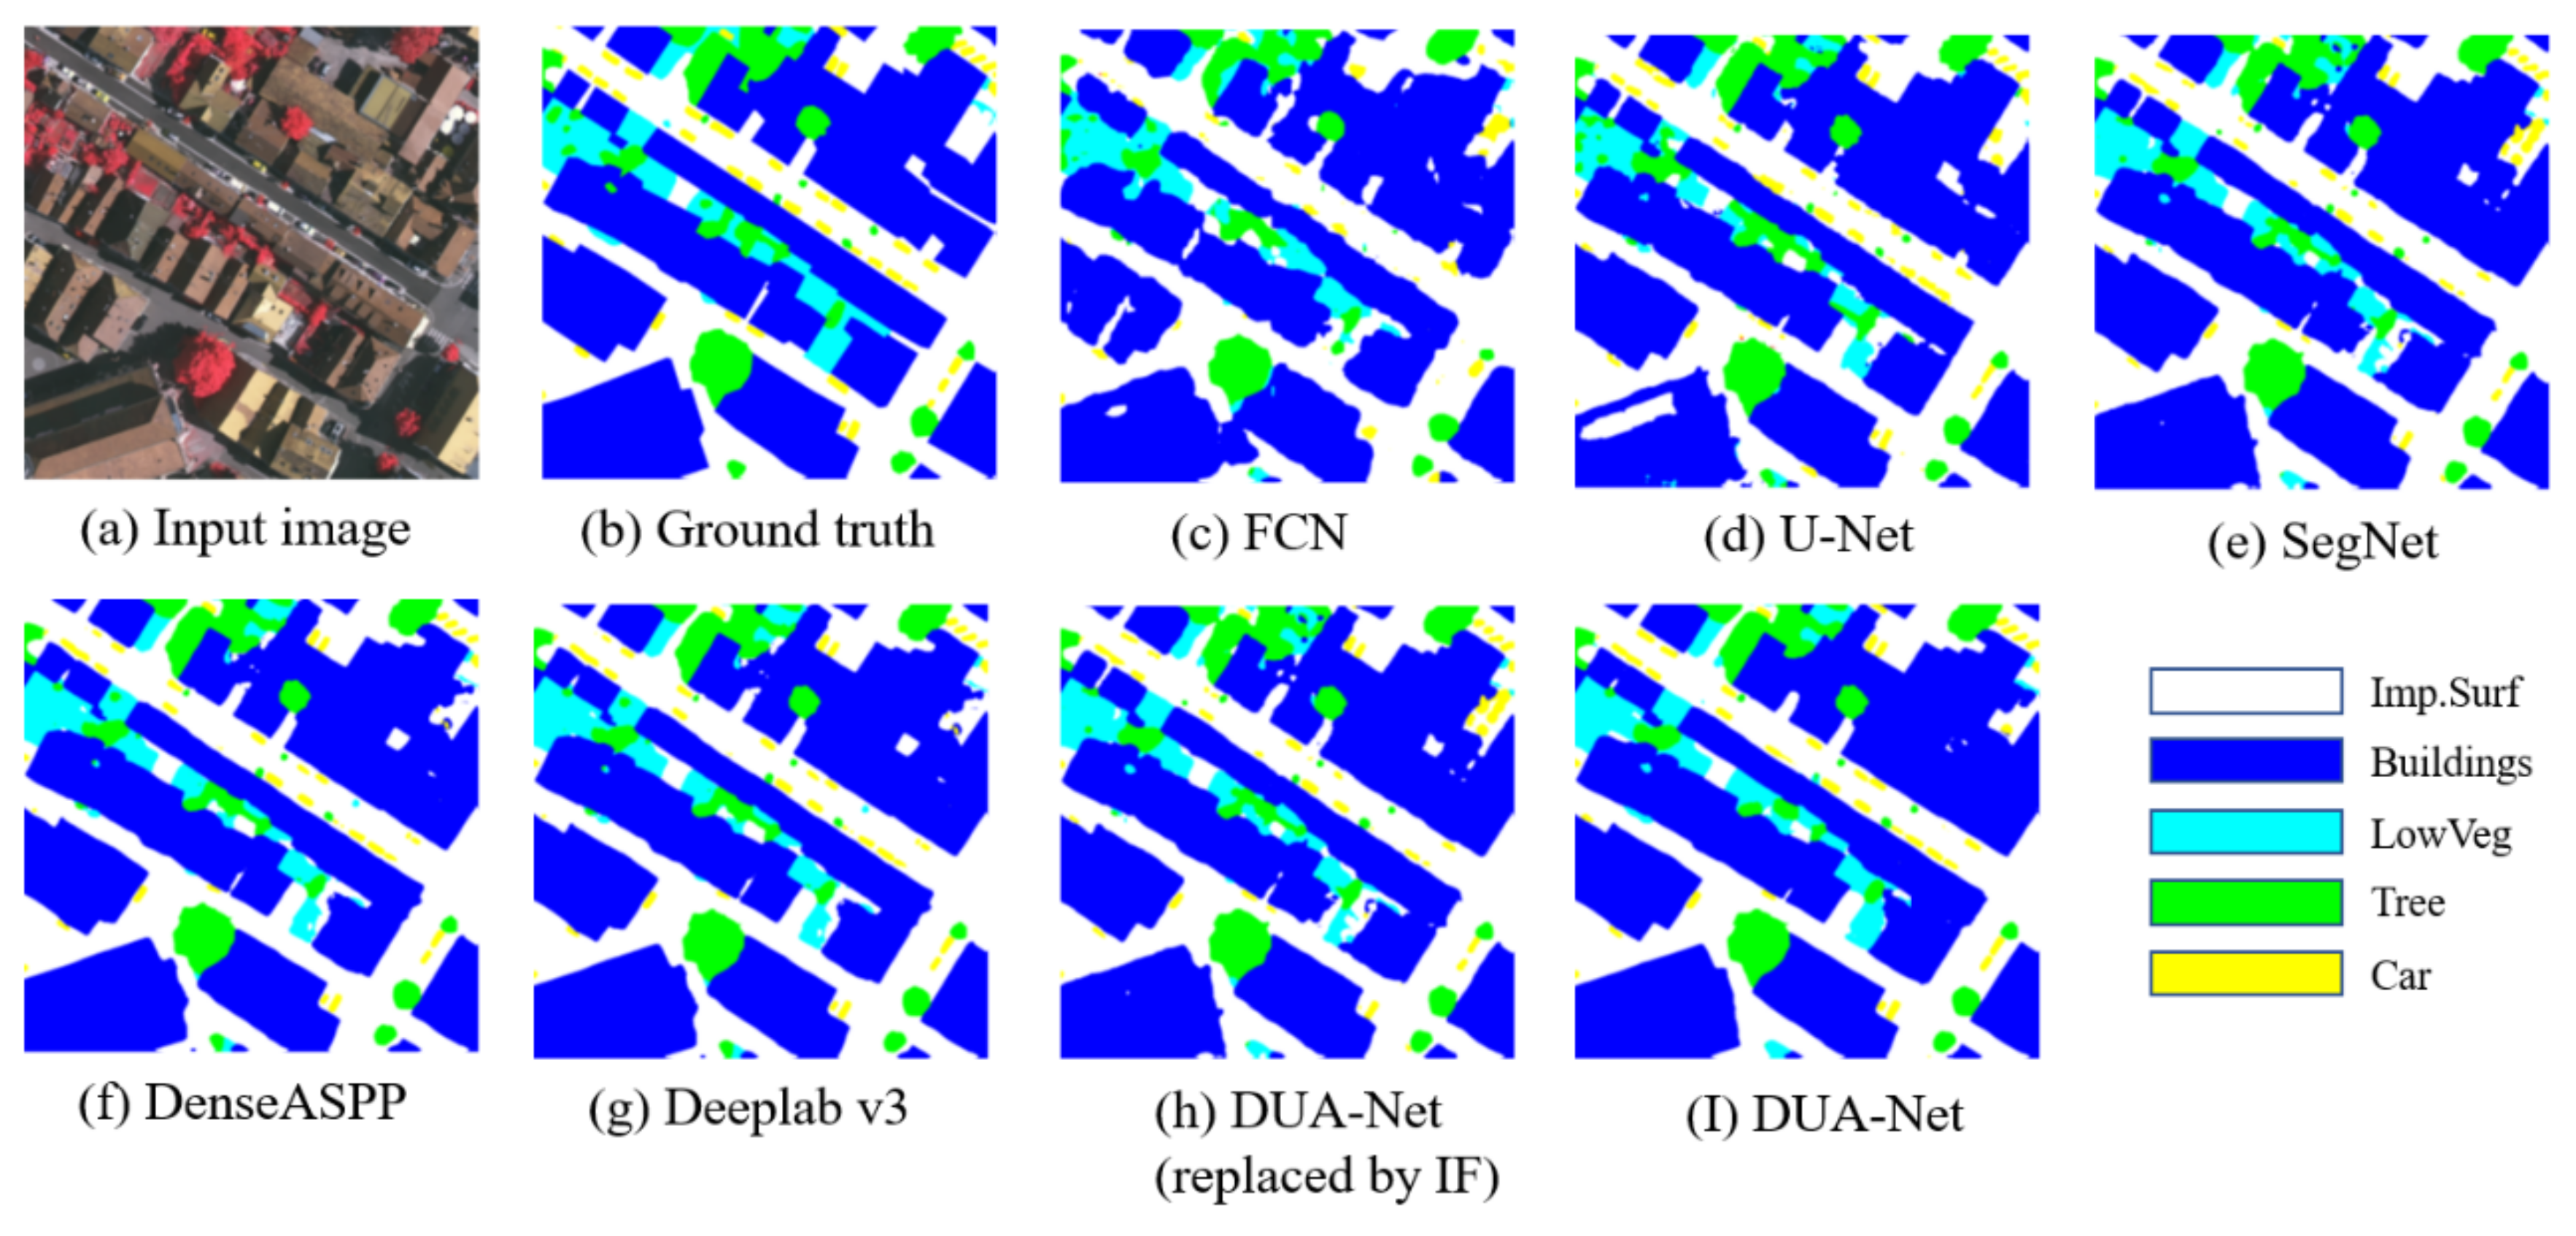
Figure 7 shows the predicted results of different networks in the publicly available Vaihingen dataset. As shown, the DUA-Net network had a better semantic segmentation effect on complex classes and classes with strong pixel correlation.
5.3. Comparison of Experimental Results between Self-Built Image Dataset and ISPRS Vaihingen Dataset
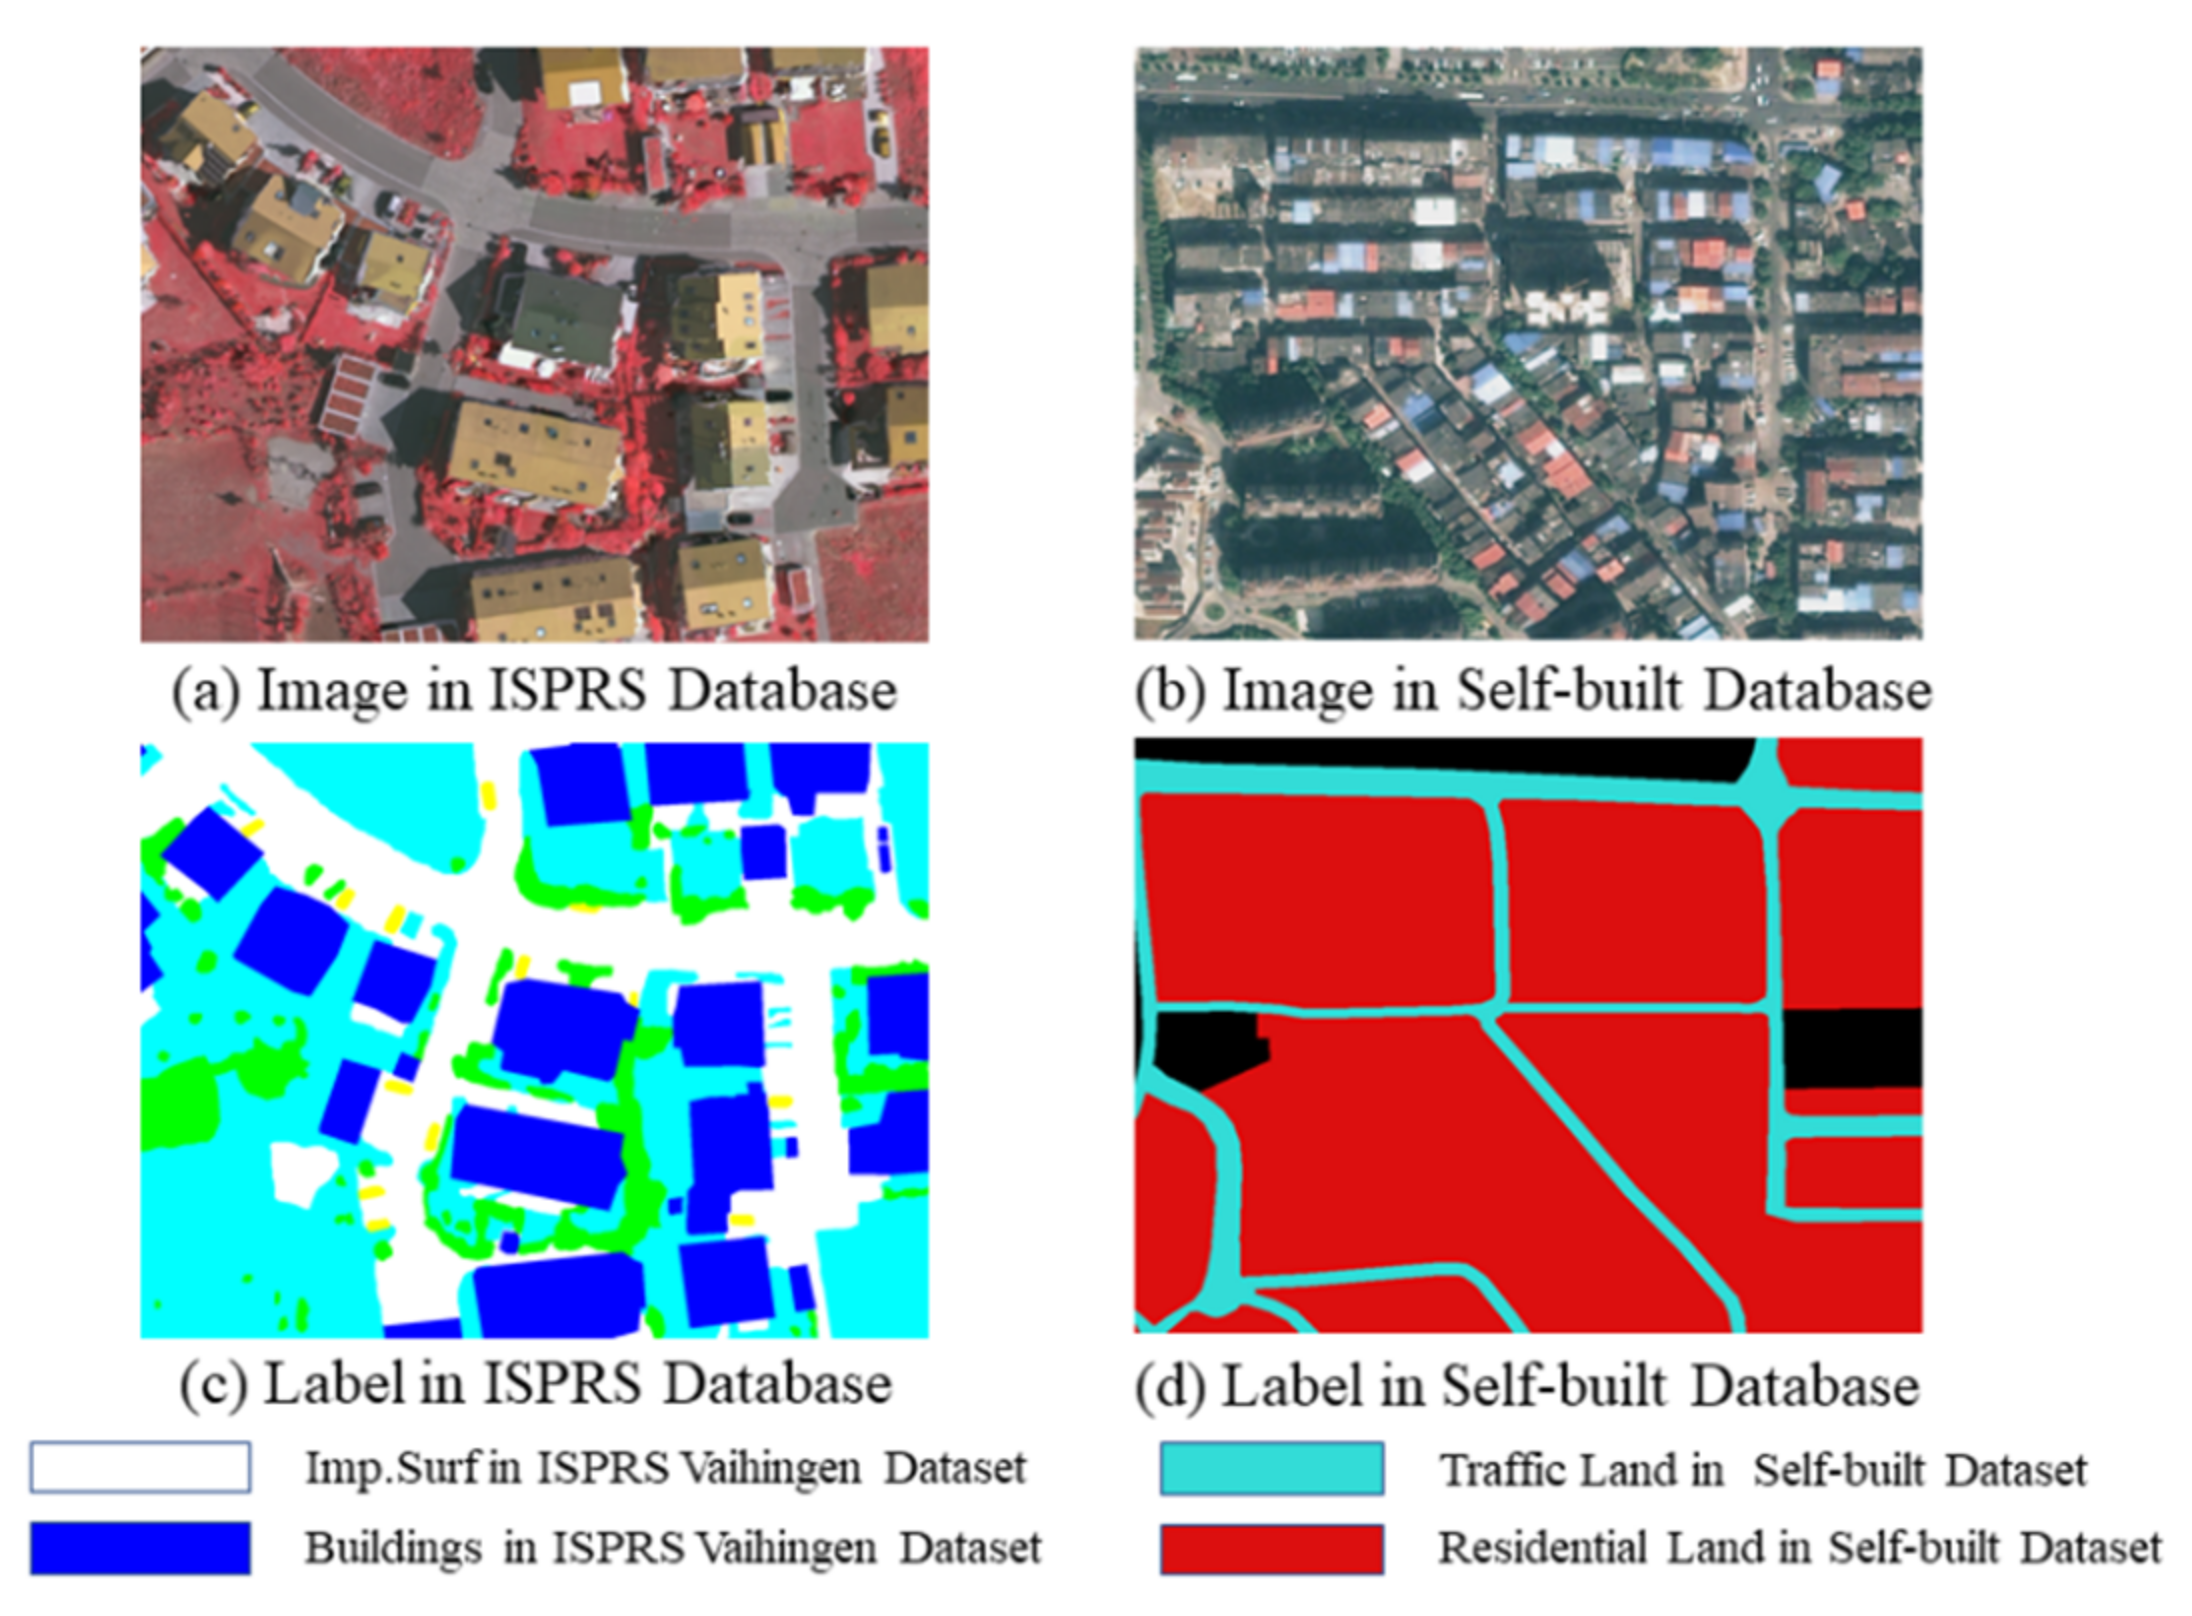
The differences in the experimental results on the ISPRS dataset and the self-built image dataset of the 3rd LRSC are mainly due to differences in the pixel features of land-use types and land-cover types. The ISPRS dataset involves pixel marking for land-cover types, while the self-built image dataset involves pixel marking according to land-use types in actual urban planning.
Figure 8a,c are the original and label images of ISPRS Vaihingen Dataset and
Figure 8b,d are original images and true label images for the self-built image dataset. The blue part in
Figure 8c represents the building label, which consisted of a single land-cover type. The red part in
Figure 8d represents the residential land in the self-built image dataset, which was divided according to the 3rd LRSC and actual living conditions of the resident. It was composed of a variety of land-cover types and had complex features, making semantic segmentation more difficult.
In
Section 5.1 and
Section 5.2, for the self-built image dataset with land-use types classification, the accuracy of the proposed method was the highest, at 75.90%. For the Vaihingen dataset with land-cover classification, the accuracy of the proposed method was also the highest, at 89.71%. The difference in the accuracy of image semantic segmentation was mainly due to the difference in the feature labels. The aforementioned experimental results further demonstrate that the DUA-Net network effectively fuses feature relationships between adjacent pixels, is more suitable for interrelated complex semantic images, and improves the overall accuracy of semantic segmentation.
6. Discussion
Since land-use types contain multiple elements and have characteristics similar to adjacent land-use types compared with single element land-cover classification, there is no specific edge division of land-use types. For example, residential land is often closely related to industrial land, and they generally have similarities in their appearance. This phenomenon leads to difficulty in distinguishing different urban functional areas. In order to solve these problems, urban road networks have been used to optimize the boundary blur problem in land-use types. Additionally, the uneven distribution of urban land-use types leads to the phenomenon of category imbalance in semantic segmentation, primarily caused by the high density of residential land and woodland in urban spatial distribution and the relatively low density of industrial land distribution. Therefore, in this paper, we combined the U-Net module and DenseASPP module to focus on optimizing boundary blurring with skip connections and urban road network labeling, and on optimizing class imbalance with densely connected atrous spatial pyramid pooling. Most importantly, we used SENet in the Channel Attention Fusion module to obtain the relationships of different classes, strengthen the important features and optimize the feature fusion process to improve the aforementioned series of problems. The simple averaging method to calculate the spatial information into a value is to obtain the spatial response distribution of the characteristic channel and improve the important features. We focused attention to get the coarse and high-level boundary for the complex land-use. The accuracy of land cover classification is not higher as with other fusion algorithms. While these results are suitable for the further processing of man-made production works, this fusion method is just a case for one particular work; generally speaking, more algorithms should be tested and developed further.
We chose the VGG 16 as the backbone to integrate into U-Net, and DenseASPP was based on the functions of VGG. Our double layer network structure needs parallel processing to capture multiple semantic information. VGG16 is a simple and quick backbone compared to others.
In
Section 4, we validated the proposed method on two urban remote sensing image datasets: the self-built image dataset of the 3rd LRSC and the Vaihingen dataset, respectively. The proposed method significantly outperformed the reference method in terms of the average of F1 score and OA. In particular, DUA-Net enabled pixels with similar visual appearances to be correctly labeled more successfully than the original U-Net model (see
Figure 5). For example, compared with DUA-Net, other typical deep learning methods suffer from confusing classifications and blurred boundaries in land-use types like industrial land and residential land. In addition, with the help of urban road network labels, the boundary details and the overall segmentation performance were significantly improved.
Table 3 shows that, in the Vaihingen dataset, the accuracy of DUA-Net classification of low vegetation was significantly higher than that of the original networks, demonstrating that this structure effectively alleviated the problems of boundary blur and class imbalance. This suggested that our method could better accomplish the holistic segmentation of land-use types with mixed characteristics and similarity features due to the proposed parallel structure and improve semantic segmentation performance of land-use types for urban high-resolution RSIs.
Compared with the existing results of the aforementioned Dual Attention Feature fusion [
54] and Class-Wise FCN [
55], our method improved the results in classes of building and others, but was lower in car class. With the target of generating the land use classification of an urban area into the bigger and continuous block, our method will do better for bigger classes on images. Other situations should be considered in future.
Although the deep learning model achieved impressive results in semantic segmentation performance, its recognition efficiency remained poor when confronted with mixed land-use types in cities. The experimental results showed that, with higher purity of land-use type, higher classification accuracy was achieved, indicating that trying to improve the accuracy of land-use type classification faces the inherent difficulties of semantic segmentation, as well as special problems derived from land-use type features in RSIs. For example, in the Vaihingen dataset, the pixel share of different land-cover types varied widely. In the self-built image dataset, the pixel occupancy ratio of different land-use types varied widely. Not only that, since the land-use types were composed of different land-cover types, their semantic information was more difficult to obtain. This could be why the segmentation accuracy of DUA-Net on the self-built image dataset was lower than that of the Vaihingen dataset. In addition, there were inevitable errors in the manually labeled urban land-use types, and such errors also affected the accuracy of the deep learning model in semantic segmentation of urban land-use types. Today, the studied city is growing rapidly and land-use types are always changing. It would be meaningful to obtain urban remote sensing data and corresponding land-use type labels from previous years and more recent years to construct training datasets, which would help DCNNs to better obtain the characteristics of land-use types. In so doing, we could improve the accuracy of urban land-use classifications.
7. Conclusions
In this paper, a double-layer deep convolutional neural network DUA-Net was proposed to train urban remote sensing image datasets with urban land-use classification criteria labels to achieve land-use classification of high-resolution urban RSIs. According to the characteristics of urban land-use types, a parallel architecture, consisting of the U-Net module and the DenseASPP module, was constructed to extract multiple features and to enhance feature fusion with the Channel Attention Fusion module. This facilitated the effective capture of the correlation between multiple elements of the same type and the difference between different types. It also helped to alleviate the false segmentation caused by similar features in similar types. In addition, urban road network data were used to support semantic segmentation of different land-use types to ensure the integrity of urban functional areas and to avoid fragmentation results. Specifically, the U-Net module, designed to extract multi-scale features, and the DenseASPP module, designed to extract abstract features of spatial distribution, were used. Finally, the channel attention of image context was implemented for the extracted features to fuse multiple information sources, enhancing the characterization capability of the network and improving the classification performance.
We evaluated the proposed DUA-Net on the self-built image dataset and on the Vaihingen dataset. Firstly, using the self-built image dataset, we successfully extracted five land-use types; DUA-Net achieved 75.90% OA and a 74.68% average F1-score. Compared with U-Net, DUA-Net improved the OA and average F1-score by 4.12% and 7.44%, respectively. Secondly, on the Vaihingen dataset, the OA of DUA-Net was 89.71%, and the average F1-score was 86.64%, which illustrated the effectiveness and feasibility of DUA-Net in improving land-use classification performance.
Nevertheless, the performance of DUA-Net was still constrained by the complex structure of land-use types and their uneven distribution. As a continuation of this work, some widely used methods, such as semantic information edge detection and the dual attention mechanism, will be considered in the future as methods to improve the performance of DUA-Net for urban land-use classification.
Author Contributions
Conceptualization, J.Y. and D.Z.; Data curation, P.Z. and Y.Y.; Formal analysis, J.Y.; Funding acquisition, J.Y., L.H. and D.Z.; Investigation, P.Z. and L.H.; Methodology, Y.Y., H.Y. and D.Z.; Resources, H.Y. and L.H.; Software, H.Y.; Validation, P.Z.; Writing—original draft, J.Y.; Writing—review & editing, D.Z. All authors have read and agreed to the published version of the manuscript.
Funding
This research was supported by the National Natural Science Foundation of China (62177017,41671377), the Ministry of Education China-Mobile research fund (MCM 20200406) and the Basic Research Fee Project “Smart Airport Framework and Key Technology Research” of China Academy Civil Aviation Science and Technology.
Institutional Review Board Statement
Not applicable.
Informed Consent Statement
Not applicable.
Data Availability Statement
Data will be available upon request to the corresponding author.
Acknowledgments
The authors would like to thank all the anonymous reviewers for their helpful comments and suggestions to improve the manuscript. The Vaihingen and the Potsdam datasets were provided by the German Society for Photogrammetry, Remote Sensing and Geoinformation (DGPF).
Conflicts of Interest
The authors declare that they have no conflicts of interest.
References
- Yuan, X.; Shi, J.; Gu, L. A Review of Deep Learning Methods for Semantic Segmentation of Remote Sensing Imagery. Expert Syst. Appl. 2021, 169, 114417. [Google Scholar] [CrossRef]
- Beykaei, S.A.; Zhong, M.; Shiravi, S.; Zhang, Y. A Hierarchical Rule-Based Land Use Extraction System Using Geographic and Remotely Sensed Data: A Case Study for Residential Uses. Transp. Res. Part C Emerg. Technol. 2014, 47, 155–167. [Google Scholar] [CrossRef]
- Zhang, J.; Li, P.; Wang, J. Urban Built-Up Area Extraction from Landsat TM/ETM+ Images Using Spectral Information and Multivariate Texture. Remote Sens. 2014, 6, 7339–7359. [Google Scholar] [CrossRef] [Green Version]
- Shang, R.; Zhang, J.; Jiao, L.; Li, Y.; Marturi, N.; Stolkin, R. Multi-Scale Adaptive Feature Fusion Network for Semantic Segmentation in Remote Sensing Images. Remote Sens. 2020, 12, 872. [Google Scholar] [CrossRef] [Green Version]
- Ronneberger, O.; Fischer, P.; Brox, T. U-Net: Convolutional Networks for Biomedical Image Segmentation. In Proceedings of the Medical Image Computing and Computer-Assisted Intervention—MICCAI 2015, Munich, Germany, 5–9 October 2015; Navab, N., Hornegger, J., Wells, W.M., Frangi, A.F., Eds.; Springer International Publishing: Cham, Switzerland, 2015; pp. 234–241. [Google Scholar]
- Yu, F.; Koltun, V. Multi-Scale Context Aggregation by Dilated Convolutions. In Proceedings of the 4th International Conference on Learning Representations, ICLR 2016—Conference Track Proceedings, San Juan, Puerto Rico, 2–4 May 2016. [Google Scholar]
- He, K.; Zhang, X.; Ren, S.; Sun, J. Spatial Pyramid Pooling in Deep Convolutional Networks for Visual Recognition. IEEE Trans. Pattern Anal. Mach. Intell. 2015, 37, 1904–1916. [Google Scholar] [CrossRef] [Green Version]
- Zhao, H.; Shi, J.; Qi, X.; Wang, X.; Jia, J. Pyramid Scene Parsing Network. In Proceedings of the 30th IEEE Conference on Computer Vision and Pattern Recognition, CVPR 2017, Honolulu, HI, USA, 22–25 July 2017; pp. 6230–6239. [Google Scholar]
- Chen, L.C.; Papandreou, G.; Kokkinos, I.; Murphy, K.; Yuille, A.L. DeepLab: Semantic Image Segmentation with Deep Convolutional Nets, Atrous Convolution, and Fully Connected CRFs. IEEE Trans. Pattern Anal. Mach. Intell. 2018, 40, 834–848. [Google Scholar] [CrossRef] [Green Version]
- Chen, L.-C.; Papandreou, G.; Schroff, F.; Adam, H. Rethinking Atrous Convolution for Semantic Image Segmentation. arXiv 2017, arXiv:1706.05587. [Google Scholar]
- Chen, L.C.; Zhu, Y.; Papandreou, G.; Schroff, F.; Adam, H. Encoder-Decoder with Atrous Separable Convolution for Semantic Image Segmentation. In Proceedings of the European Conference on Computer Vision, Munich, Germany, 8–14 September 2018. [Google Scholar] [CrossRef] [Green Version]
- Yang, M.; Yu, K.; Zhang, C.; Li, Z.; Yang, K. DenseASPP for Semantic Segmentation in Street Scenes. In Proceedings of the IEEE Conference on Computer Vision and Pattern Recognition, Salt Lake City, UT, USA, 18–23 June 2018; pp. 3684–3692. [Google Scholar] [CrossRef]
- Simonyan, K.; Zisserman, A. Very Deep Convolutional Networks for Large-Scale Image Recognition. arXiv 2014, arXiv:1409.1556. [Google Scholar]
- Castillo-Navarro, J.; le Saux, B.; Boulch, A.; Audebert, N.; Lefèvre, S. Semi-Supervised Semantic Segmentation in Earth Observation: The MiniFrance Suite, Dataset Analysis and Multi-Task Network Study. Mach. Learn. 2021. [Google Scholar] [CrossRef]
- Wilhelm, T.; Koßmann, D. Land Cover Classification from a Mapping Perspective: Pixelwise Supervision in the Deep Learning Era. In Proceedings of the 2021 IEEE International Geoscience and Remote Sensing Symposium IGARSS, Brussels, Belgium, 11–16 July 2021; pp. 2496–2499. [Google Scholar]
- Schmitt, M.; Hughes, L.H.; Qiu, C.; Zhu, X.X. SEN12MS—A Curated Dataset of Georeferenced Multi-Spectral Sentinel-1/2 Imagery for Deep Learning and Data Fusion. arXiv 2019, arXiv:1906.07789. [Google Scholar] [CrossRef] [Green Version]
- Sumbul, G.; Charfuelan, M.; Demir, B.; Markl, V. Bigearthnet: A Large-Scale Benchmark Archive for Remote Sensing Image Understanding. In Proceedings of the IGARSS 2019—2019 IEEE International Geoscience and Remote Sensing Symposium, Yokohama, Japan, 28 July–2 August 2019; pp. 5901–5904. [Google Scholar]
- Long, Y.; Xia, G.S.; Li, S.; Yang, W.; Yang, M.Y.; Zhu, X.X.; Zhang, L.; Li, D. On Creating Benchmark Dataset for Aerial Image Interpretation: Reviews, Guidances, and Million-AID. IEEE J. Sel. Top. Appl. Earth Obs. Remote Sens. 2021, 14, 4205–4230. [Google Scholar] [CrossRef]
- Richards, J.A.; Jia, X. Remote Sensing Digital Image Analysis: An Introduction, 4th ed.; Springer: Berlin, Germany, 2005; ISBN 978-3-662-02464-5. [Google Scholar]
- Neupane, B.; Horanont, T.; Aryal, J. Deep Learning-Based Semantic Segmentation of Urban Features in Satellite Images: A Review and Meta-Analysis. Remote Sens. 2021, 13, 808. [Google Scholar] [CrossRef]
- Pan, X.; Zhao, J. High-Resolution Remote Sensing Image Classification Method Based on Convolutional Neural Network and Restricted Conditional Random Field. Remote Sens. 2018, 10, 920. [Google Scholar] [CrossRef] [Green Version]
- Ma, L.; Liu, Y.; Zhang, X.; Ye, Y.; Yin, G.; Johnson, B.A. Deep Learning in Remote Sensing Applications: A Meta-Analysis and Review. ISPRS J. Photogramm. Remote Sens. 2019, 152, 166–177. [Google Scholar] [CrossRef]
- Lyu, H.; Lu, H.; Mou, L.; Li, W.; Wright, J.; Li, X.; Li, X.; Zhu, X.; Wang, J.; Yu, L.; et al. Long-Term Annual Mapping of Four Cities on Different Continents by Applying a Deep Information Learning Method to Landsat Data. Remote Sens. 2018, 10, 471. [Google Scholar] [CrossRef] [Green Version]
- Liu, P.; Zhang, H.; Eom, K.B. Active Deep Learning for Classification of Hyperspectral Images. IEEE J. Sel. Top. Appl. Earth Obs. Remote Sens. 2017, 10, 712–724. [Google Scholar] [CrossRef] [Green Version]
- Ammour, N.; Bashmal, L.; Bazi, Y.; Al Rahhal, M.M.; Zuair, M. Asymmetric Adaptation of Deep Features for Cross-Domain Classification in Remote Sensing Imagery. IEEE Geosci. Remote Sens. Lett. 2018, 15, 597–601. [Google Scholar] [CrossRef]
- Zhou, X.; Prasad, S. Deep Feature Alignment Neural Networks for Domain Adaptation of Hyperspectral Data. IEEE Trans. Geosci. Remote Sens. 2018, 56, 5863–5872. [Google Scholar] [CrossRef]
- Walter, V. Object-Based Classification of Remote Sensing Data for Change Detection. ISPRS J. Photogramm. Remote Sens. 2004, 58, 225–238. [Google Scholar] [CrossRef]
- Chen, W.; Li, X.; He, H.; Wang, L. A Review of Fine-Scale Land Use and Land Cover Classification in Open-Pit Mining Areas by Remote Sensing Techniques. Remote Sens. 2018, 10, 15. [Google Scholar] [CrossRef] [Green Version]
- Wu, H.; Liu, B.; Su, W.; Zhang, W.; Sun, J. Deep Filter Banks for Land-Use Scene Classification. IEEE Geosci. Remote Sens. Lett. 2016, 13, 1895–1899. [Google Scholar] [CrossRef]
- Xu, S.; Zhang, S.; Zeng, J.; Li, T.; Guo, Q.; Jin, S. A Framework for Land Use Scenes Classification Based on Landscape Photos. IEEE J. Sel. Top. Appl. Earth Obs. Remote Sens. 2020, 13, 6124–6141. [Google Scholar] [CrossRef]
- Gibril, M.B.A.; Kalantar, B.; Al-Ruzouq, R.; Ueda, N.; Saeidi, V.; Shanableh, A.; Mansor, S.; Shafri, H.Z.M. Mapping Heterogeneous Urban Landscapes from the Fusion of Digital Surface Model and Unmanned Aerial Vehicle-Based Images Using Adaptive Multiscale Image Segmentation and Classification. Remote Sens. 2020, 12, 1081. [Google Scholar] [CrossRef] [Green Version]
- Zhu, Y.; Geis, C.; So, E.; Jin, Y. Multitemporal Relearning with Convolutional LSTM Models for Land Use Classification. IEEE J. Sel. Top. Appl. Earth Obs. Remote Sens. 2021, 14, 3251–3265. [Google Scholar] [CrossRef]
- Andrade, R.; Alves, A.; Bento, C. POI Mining for Land Use Classification: A Case Study. ISPRS Int. J. Geo-Inf. 2020, 9(9), 493. [Google Scholar] [CrossRef]
- Re Calegari, G.; Carlino, E.; Peroni, D.; Celino, I. Extracting Urban Land Use from Linked Open Geospatial Data. ISPRS Int. J. Geo-Inf. 2015, 4, 2109–2130. [Google Scholar] [CrossRef]
- Fan, R.; Feng, R.; Wang, L.; Yan, J.; Zhang, X. Semi-MCNN: A Semisupervised Multi-CNN Ensemble Learning Method for Urban Land Cover Classification Using Submeter HRRS Images. IEEE J. Sel. Top. Appl. Earth Obs. Remote Sens. 2020, 13, 4973–4987. [Google Scholar] [CrossRef]
- Zhang, Y.; Qin, K.; Bi, Q.; Cui, W.; Li, G. Landscape Patterns and Building Functions for Urban Land-Use Classification from Remote Sensing Images at the Block Level: A Case Study of Wuchang District, Wuhan, China. Remote Sens. 2020, 12, 1831. [Google Scholar] [CrossRef]
- Sherrah, J. Fully Convolutional Networks for Dense Semantic Labelling of High-Resolution Aerial Imagery. arXiv 2016, arXiv:1606.02585. [Google Scholar]
- Yi, Y.; Zhang, Z.; Zhang, W.; Zhang, C.; Li, W.; Zhao, T. Semantic Segmentation of Urban Buildings from VHR Remote Sensing Imagery Using a Deep Convolutional Neural Network. Remote Sens. 2019, 11, 1774. [Google Scholar] [CrossRef] [Green Version]
- Diakogiannis, F.I.; Waldner, F.; Caccetta, P.; Wu, C. ResUNet-a: A Deep Learning Framework for Semantic Segmentation of Remotely Sensed Data. ISPRS J. Photogramm. Remote Sens. 2020, 162, 94–114. [Google Scholar] [CrossRef] [Green Version]
- Xu, Z.; Zhang, W.; Zhang, T.; Li, J. HRCNet: High-Resolution Context Extraction Network for Semantic Segmentation of Remote Sensing Images. Remote Sens. 2021, 13, 71. [Google Scholar] [CrossRef]
- Huang, G.; Liu, Z.; Van Der Maaten, L.; Weinberger, K.Q. Densely Connected Convolutional Networks. In Proceedings of the Proceedings—30th IEEE Conference on Computer Vision and Pattern Recognition, CVPR 2017, Honolulu, HI, USA, 22–25 July 2017; pp. 2261–2269. [Google Scholar]
- Dong, R.; Pan, X.; Li, F. DenseU-Net-Based Semantic Segmentation of Small Objects in Urban Remote Sensing Images. IEEE Access 2019, 7, 65347–65356. [Google Scholar] [CrossRef]
- Abdollahi, A.; Pradhan, B.; Alamri, A.M. An Ensemble Architecture of Deep Convolutional Segnet and Unet Networks for Building Semantic Segmentation from High-Resolution Aerial Images. Geocarto Int. 2020. [Google Scholar] [CrossRef]
- Badrinarayanan, V.; Kendall, A.; Cipolla, R.; Member, S. SegNet: A Deep Convolutional Encoder-Decoder Architecture for Image Segmentation. IEEE Trans. Pattern Anal. Mach. Intell. 2017, 39, 2481–2495. [Google Scholar] [CrossRef]
- Sariturk, B.; Bayram, B.; Duran, Z.; Seker, D.Z. Feature Extraction from Satellite Images Using Segnet and Fully Convolutional Networks (Fcn). Int. J. Eng. Geosci. 2020, 5, 138–143. [Google Scholar] [CrossRef]
- Takikawa, T.; Acuna, D.; Jampani, V.; Fidler, S. Gated-SCNN: Gated Shape CNNs for Semantic Segmentation. Proc. IEEE Int. Conf. Comput. Vis. 2019, 2019, 5228–5237. [Google Scholar] [CrossRef] [Green Version]
- Hu, J.; Shen, L.; Albanie, S.; Sun, G.; Wu, E. Squeeze-and-Excitation Networks. IEEE Trans. Pattern Anal. Mach. Intell. 2020, 42, 2011–2023. [Google Scholar] [CrossRef] [Green Version]
- Fang, B.; Li, Y.; Zhang, H.; Chan, J.C.W. Hyperspectral Images Classification Based on Dense Convolutional Networks with Spectral-Wise Attention Mechanism. Remote Sens. 2019, 11, 159. [Google Scholar] [CrossRef] [Green Version]
- Ge, P.; He, J.; Zhang, S.; Zhang, L.; She, J. An Integrated Framework Combining Multiple Human Activity Features for Land Use Classification. ISPRS Int. J. Geo-Inf. 2019, 8, 90. [Google Scholar] [CrossRef] [Green Version]
- Russell, B.C.; Torralba, A.; Murphy, K.P.; Freeman, W.T. LabelMe: A Database and Web-Based Tool for Image Annotation. Int. J. Comput. Vis. 2008, 77, 157–173. [Google Scholar] [CrossRef]
- Van Dyk, D.A.; Meng, X.-L. The Art of Data Augmentation. J. Comput. Graph. Stat. 2001, 10, 1–50. [Google Scholar] [CrossRef]
- ISPRS Vaihingen 2D Semantic Labeling Dataset. Available online: https://www2.isprs.org/commissions/comm2/wg4/benchmark/2d-sem-label-vaihingen/ (accessed on 22 December 2021).
- ISPRS Potsdam 2D Semantic Labeling Dataset. Available online: https://www2.isprs.org/commissions/comm2/wg4/benchmark/2d-sem-label-potsdam/ (accessed on 22 December 2021).
- Shi, H.; Fan, J.; Wang, Y.; Chen, L. Dual Attention Feature Fusion and Adaptive Context for Accurate Segmentation of Very High-Resolution Remote Sensing Images. Remote Sens. 2021, 13, 3715. [Google Scholar] [CrossRef]
- Tian, T.; Chu, Z.; Hu, Q.; Ma, L. Class-Wise Fully Convolutional Network for Semantic Segmentation of Remote Sensing Images. Remote Sens. 2021, 13, 3211. [Google Scholar] [CrossRef]
Figure 1.
The overall framework of the proposed method.
Figure 1.
The overall framework of the proposed method.
Figure 2.
The adapted U-Net Module in the proposed method.
Figure 2.
The adapted U-Net Module in the proposed method.
Figure 3.
The adapted DenseASPP Module of the proposed method.
Figure 3.
The adapted DenseASPP Module of the proposed method.
Figure 4.
Channel Attention Fusion Module.
Figure 4.
Channel Attention Fusion Module.
Figure 5.
The data set generated by GIS data: (a) the origin images, (b) the corresponding classifications.
Figure 5.
The data set generated by GIS data: (a) the origin images, (b) the corresponding classifications.
Figure 6.
Comparison of experimental results on semantic segmentation of land-use types. (a) are the results of residential land and traffic land, (b) are the results of residential land, traffic land and woodland, (c) are the results of residential land, traffic land and unused land, (d) are the results of residential land, industrial land and unused land, (e) are the results of residential land, wood land, unused land and traffic land.
Figure 7.
Comparison of experimental results on semantic segmentation of land-cover types. (a) is the input image, (b) is the ground truth image of the input image, (c) is the result by FCN method, (d) is the result by U-Net method, (e) is the result by SegNet method, (f) is the result by DenseASPP network method, (g) is the results by Deeplab v3, (h) is the result by DUA-Net where the fusion module replaced by Identify function, (I) is the result by DUA-Net.
Figure 8.
Comparison of the ISPRS Vaihingen Dataset with the Self-built Image Dataset. (a,b) are the input images, (a) is from ISPRS Vaihingen Dataset, (b) is from the self-built dataset, (c) is labeled as for ISPRS dataset, and (d) is labeled for 3rd National Land use Survey.
Figure 8.
Comparison of the ISPRS Vaihingen Dataset with the Self-built Image Dataset. (a,b) are the input images, (a) is from ISPRS Vaihingen Dataset, (b) is from the self-built dataset, (c) is labeled as for ISPRS dataset, and (d) is labeled for 3rd National Land use Survey.
Table 1.
Sample urban land-use classes.
Table 2.
Statistics of areas and proportions of different land-use types.
Table 2.
Statistics of areas and proportions of different land-use types.
| Land-Use Type | Area/m2 | Proportion/% |
|---|
| residential land | 11,146,206 | 12.99 |
| industrial land | 3,234,888 | 3.77 |
| traffic land | 3,303,533 | 3.85 |
| woodland | 10,528,402 | 12.27 |
| unused land | 57,593,021 | 67.12 |
| total | 85,806,050 | 100.00 |
Table 3.
Experimental results of the selected land-use types and overall evaluation indices.
Table 3.
Experimental results of the selected land-use types and overall evaluation indices.
| Method | Land-Use Types | Overall
Accuracy | Average
F1-Score | mIOU |
|---|
| Residential Land | Industrial Land | Traffic Land | Woodland | Unused Land |
|---|
| FCN | 82.05 | 60.36 | 79.71 | 85.16 | 72.31 | 70.66 | 70.13 | 76.32 |
| SegNet | 75.86 | 63.58 | 80.65 | 83.63 | 75.64 | 72.03 | 72.58 | 77.65 |
| U-Net | 80.87 | 60.74 | 83.36 | 80.63 | 69.58 | 69.83 | 67.24 | 78.85 |
| DenseASPP | 81.43 | 70.59 | 76.81 | 85.13 | 76.65 | 74.78 | 71.64 | 81.81 |
| Deeplab v3 | 85.01 | 71.12 | 84.31 | 85.16 | 79.96 | 74.30 | 72.23 | 81.97 |
DUA-Net
(replaced by IF) | 81.34 | 70.11 | 76.64 | 83.79 | 75.86 | 74.62 | 71.17 | 77.83 |
| DUA-Net | 85.64 | 71.20 | 85.14 | 85.28 | 80.52 | 75.90 | 74.68 | 82.23 |
Table 4.
Experimental results of the selected land-cover types and overall evaluation indices on the Vaihingen dataset [
52].
Table 4.
Experimental results of the selected land-cover types and overall evaluation indices on the Vaihingen dataset [
52].
| Method | Land-Cover Types | Overall
Accuracy | Average
F1-Score | mIOU |
|---|
| Imp.Surf | Building | LowVeg | Tree | Car |
|---|
| FCN | 83.87 | 89.01 | 75.36 | 82.20 | 62.63 | 82.37 | 72.67 | 77.93 |
| U-Net | 83.82 | 87.80 | 74.92 | 84.73 | 61.16 | 82.32 | 72.53 | 78.85 |
| SegNet | 87.30 | 90.12 | 76.53 | 85.95 | 66.21 | 87.43 | 81.22 | 81.02 |
| DenseASPP | 88.53 | 90.07 | 79.87 | 86.35 | 67.16 | 87.68 | 82.34 | 81.81 |
| Deeplab v3 | 89.01 | 91.10 | 82.68 | 86.65 | 67.77 | 88.96 | 85.68 | 81.97 |
DUA-Net
(replaced by IF) | 83.25 | 88.13 | 75.11 | 84.52 | 62.01 | 83.25 | 75.33 | 79.17 |
| DUA-Net | 89.35 | 91.43 | 83.31 | 87.82 | 68.25 | 89.71 | 86.64 | 82.31 |
Table 5.
Experimental results of the selected land-cover types and overall evaluation indices on the Potsdam datasets [
53].
Table 5.
Experimental results of the selected land-cover types and overall evaluation indices on the Potsdam datasets [
53].
| Method | Land-Cover Types | Overall
Accuracy | Average
F1-Score | mIOU |
|---|
| Imp.Surf | Building | LowVeg | Tree | Car |
|---|
| FCN | 85.62 | 90.86 | 77.31 | 84.22 | 64.88 | 83.62 | 73.92 | 79.18 |
| U-Net | 85.07 | 89.05 | 76.17 | 85.98 | 62.41 | 83.57 | 73.78 | 80.10 |
| SegNet | 88.50 | 91.37 | 77.78 | 87.20 | 67.46 | 88.68 | 82.47 | 82.27 |
| DenseASPP | 89.78 | 91.32 | 81.12 | 87.60 | 68.41 | 88.93 | 83.59 | 83.06 |
| Deeplab v3 | 89.66 | 91.55 | 83.68 | 87.91 | 69.02 | 89.76 | 86.53 | 82.57 |
DUA-Net
(replaced by IF) | 85.18 | 90.25 | 77.26 | 85.71 | 63.49 | 83.22 | 74.47 | 80.26 |
| DUA-Net | 89.88 | 91.76 | 83.86 | 89.01 | 69.19 | 89.91 | 86.93 | 82.71 |
Table 6.
Comparing the Performances of the DAU-Net design measured by mean F1-score (%) and mean IoU (%) of all test samples.
Table 6.
Comparing the Performances of the DAU-Net design measured by mean F1-score (%) and mean IoU (%) of all test samples.
| Category | Metric | | Vaihingen | Potsdam |
|---|
| Dual [54] | Class-W [55] | DUA-Net | Class-W [55] | DUA-Net |
|---|
| Imp.surf | IoU | 80.11 | 78.02 | 89.35 | 78.78 | 89.88 |
| F1 | / | 87.55 | 91.16 | 88.01 | 91.03 |
| Building | IoU | 86.57 | 84.22 | 91.43 | 85.84 | 91.76 |
| F1 | / | 91.36 | 92.68 | 92.35 | 93.46 |
| Low veg. | IoU | 65.56 | 63.52 | 83.31 | 68.63 | 83.86 |
| F1 | / | 77.32 | 85.63 | 81.20 | 85.63 |
| Tree | IoU | 76.24 | 73.42 | 87.82 | 71.37 | 89.01 |
| F1 | / | 84.52 | 89.12 | 83.24 | 90.11 |
| Car | IoU | 66.64 | 62.59 | 68.25 | 79.79 | 69.19 |
| F1 | / | 76.83 | 71.25 | 88.73 | 76.26 |
| Avg. | IoU | 70.51 | 72.35 | 82.31 | 76.88 | 82.71 |
| F1 | / | 83.52 | 86.64 | 86.71 | 86.93 |
| Publisher’s Note: MDPI stays neutral with regard to jurisdictional claims in published maps and institutional affiliations. |
© 2022 by the authors. Licensee MDPI, Basel, Switzerland. This article is an open access article distributed under the terms and conditions of the Creative Commons Attribution (CC BY) license (https://creativecommons.org/licenses/by/4.0/).


