
Mapping of Urban Vegetation with High-Resolution Remote Sensing: A Review


Cartography and GIS Research Group, Department of Geography, Vrije Universiteit Brussel, 1050 Brussels, Belgium
*
Author to whom correspondence should be addressed.
Remote Sens. 2022, 14(4), 1031; https://doi.org/10.3390/rs14041031
Submission received: 23 December 2021
/
Revised: 4 February 2022
/
Accepted: 16 February 2022
/
Published: 21 February 2022
(This article belongs to the Topic High-Resolution Earth Observation Systems, Technologies, and Applications)
Abstract
:Green space is increasingly recognized as an important component of the urban environment. Adequate management and planning of urban green space is crucial to maximize its benefits for urban inhabitants and for the urban ecosystem in general. Inventorying urban vegetation is a costly and time-consuming process. The development of new remote sensing techniques to map and monitor vegetation has therefore become an important topic of interest to many scholars. Based on a comprehensive survey of the literature, this review article provides an overview of the main approaches proposed to map urban vegetation from high-resolution remotely sensed data. Studies are reviewed from three perspectives: (a) the vegetation typology, (b) the remote sensing data used and (c) the mapping approach applied. With regard to vegetation typology, a distinction is made between studies focusing on the mapping of functional vegetation types and studies performing mapping of lower-level taxonomic ranks, with the latter mainly focusing on urban trees. A wide variety of high-resolution imagery has been used by researchers for both types of mapping. The fusion of various types of remote sensing data, as well as the inclusion of phenological information through the use of multi-temporal imagery, prove to be the most promising avenues to improve mapping accuracy. With regard to mapping approaches, the use of deep learning is becoming more established, mostly for the mapping of tree species. Through this survey, several research gaps could be identified. Interest in the mapping of non-tree species in urban environments is still limited. The same holds for the mapping of understory species. Most studies focus on the mapping of public green spaces, while interest in the mapping of private green space is less common. The use of imagery with a high spatial and temporal resolution, enabling the retrieval of phenological information for mapping and monitoring vegetation at the species level, still proves to be limited in urban contexts. Hence, mapping approaches specifically tailored towards time-series analysis and the use of new data sources seem to hold great promise for advancing the field. Finally, unsupervised learning techniques and active learning, so far rarely applied in urban vegetation mapping, are also areas where significant progress can be expected.
1. Introduction
The presence of vegetation in an urban ecosystem has a multitude of beneficial effects. The proximity of green space has been linked to improved physical and psychological wellbeing of city dwellers [1]. Urban green also provides a whole range of environmental benefits [2,3,4]. The specific services that provide these benefits include, among others, (a) sequestration of carbon through photosynthesis [4], (b) noise reduction [5], (c) provision of shade and the attenuation of the urban heat island effect [6]. The latter is becoming increasingly important due to the ongoing climatic warming [7,8].
Services rendered by urban green depend on (a) the vegetation type, (b) structure and (c) local context [9,10,11]. Assessing services rendered by urban green requires a suitable scale of analysis, depending on the service of interest. As an input for studying the urban heat island effect, information on the spatial distribution and density of vegetated areas may be sufficient [12]. However, the services and disservices of urban green can also be studied at a more detailed level, for different species, as is often done for urban trees. As an example, the absorption of airborne pollutants is much larger for some plant species than for others [13]. Several species can be linked to ecosystem disservices such as the spread of allergens during the pollination season and the release of volatile organic compounds [14,15], which is an important factor to take into account when designing urban green spaces. To facilitate sustainable urban planning, it is important to establish a detailed inventory of urban green to adequately manage and to understand the ecological services rendered by vegetation [13,16]. The level of detail of such an inventory, and hence the mapping approach required for its creation, can vary depending on its purpose.
Most larger cities already monitor vegetation through extensive field surveys; however, this only provides information concerning the public green space. Private properties remain largely unmonitored, despite their significant contribution to ecosystem services [17]. Monitoring urban vegetation is also costly and time-consuming [18]—hence the increasing interest in automated mapping techniques. The use of remote sensing imagery to distinguish different land cover and land use types in an urban environment is a mature sub-discipline of remote sensing research. However, traditionally, land cover mapping in an urban context often concerned only two vegetation classes: high vegetation and low vegetation [19,20]. Nevertheless, the use of remote sensing imagery for the detailed mapping of urban vegetation is gaining interest from different public and private actors. The development of this branch of remote sensing research has been made possible by an improvement in remote sensing technology. More specifically, it is now possible to capture spatial data with a higher temporal, spectral and spatial resolution than before. Additionally, the increase in available computational power has enabled researchers to process the available data faster and in ways that were previously not feasible.
A whole body of research already exists concerning the mapping of tree species and crop types in a rural environment. Nonetheless, research on the mapping of urban green has its own challenges that are related to the spatial and spectral heterogeneity of the urban landscape and the complex three-dimensional structure of urban areas, resulting in large shadowed areas, multiple scattering and issues of geometric mismatch in combining different data sources [21,22,23]. The objective of this review is to give an overview of the different approaches used by scholars to map and classify vegetation in an urban environment at a high level of detail. The paper is structured according to the main decisions that need to be made throughout the mapping process: (a) the choice of a suitable vegetation typology, (b) the remote sensing data to be used and (c) the mapping approach to be applied. As such, the first part of the review discusses the different vegetation typologies that are used by researchers, making a distinction between mapping of functional vegetation types and mapping of urban vegetation at higher- and lower-level taxonomic ranks. Next, the use of different sources of remote sensing data is discussed. Special attention is given to trade-offs in spectral and spatial resolution in relation to the type of vegetation classes to be distinguished. In the same section, the potential of LiDAR imaging and terrestrial sensors is discussed, as well as the use of multi-temporal datasets. The third and final part of the review gives an overview of the different approaches used for urban vegetation mapping from high-resolution remote sensing data. This part is split into three subsections, focusing on feature definition, image segmentation and classification methods. The paper ends with a discussion highlighting the main observations, gaps in the literature and potential opportunities for future research.
2. Materials and Methods
Many review studies have been written on the identification or classification of vegetation by means of remote sensing data, yet only a few have focused on urban areas. Shahtahmassebi et al. [24] looked at the use of remote sensing for urban green space analysis with a focus on various types of (potential) applications. Their analysis revealed that the number of studies on the mapping of the distribution of green spaces, as well as on the mapping of tree species, has increased rapidly in recent years. The authors recommend a wider variety of research, both in terms of the type of green spaces considered (e.g., lack of interest in private green) as well as thematic applications (e.g., limited attention to use of remote sensing for carbon mapping). Wang et al. [25] focused on the identification of tree species in an urban setting. In their review study, they assessed the added value of fusing spectral imagery with Light Detection And Ranging (LiDAR) data for tree species mapping. They conclude that the fusion of both image sources substantially improves the mapping results. Fassnacht et al. [26] reviewed studies on the classification of tree species without specifically focusing on an urban setting. They conclude that most studies highlight the use of data-driven approaches, yet without a clear target in terms of anticipated applications or accuracy, despite the latter having more value. The focus throughout this literature review lies on the spatially and thematically detailed mapping of urban vegetation, as well as on the various mapping methodologies applied. As such, the objective is to provide the reader with a comprehensible overview of state-of-the-art methods and approaches used for mapping different types of urban green from high-resolution remote sensing data.
In order to produce an inventory of the papers fulfilling the criteria of this review study, it was decided to use a limited number of search queries and make use of the “snowballing” approach to complete the database. The original set of papers was extracted from Web of Science and Google Scholar using search terms composed of the following keywords: “remote sensing”, “urban green”, “classification”, “streetview” and “terrestrial and laser scanning”. Subsequently, the citations in the collected papers were analyzed for other relevant papers. This process was repeated until no new (relevant) papers were found satisfying our criteria. As for Web of Science, all papers were analyzed, while, for Google Scholar, only the 300 first returns were taken into consideration. All papers were assessed for their relevance based on four criteria:
- Is the study published after 2000?
- Does the study focus on the mapping of vegetation in an urban environment?
- Does the study go beyond the functional distinction between major plant habits/life forms (e.g., woody vegetation versus herbaceous vegetation or trees, shrubs and herbs)?
- Does the study use high-resolution imagery?
After the initial search, snowballing and selection, a total of 78 papers were included in this review study.
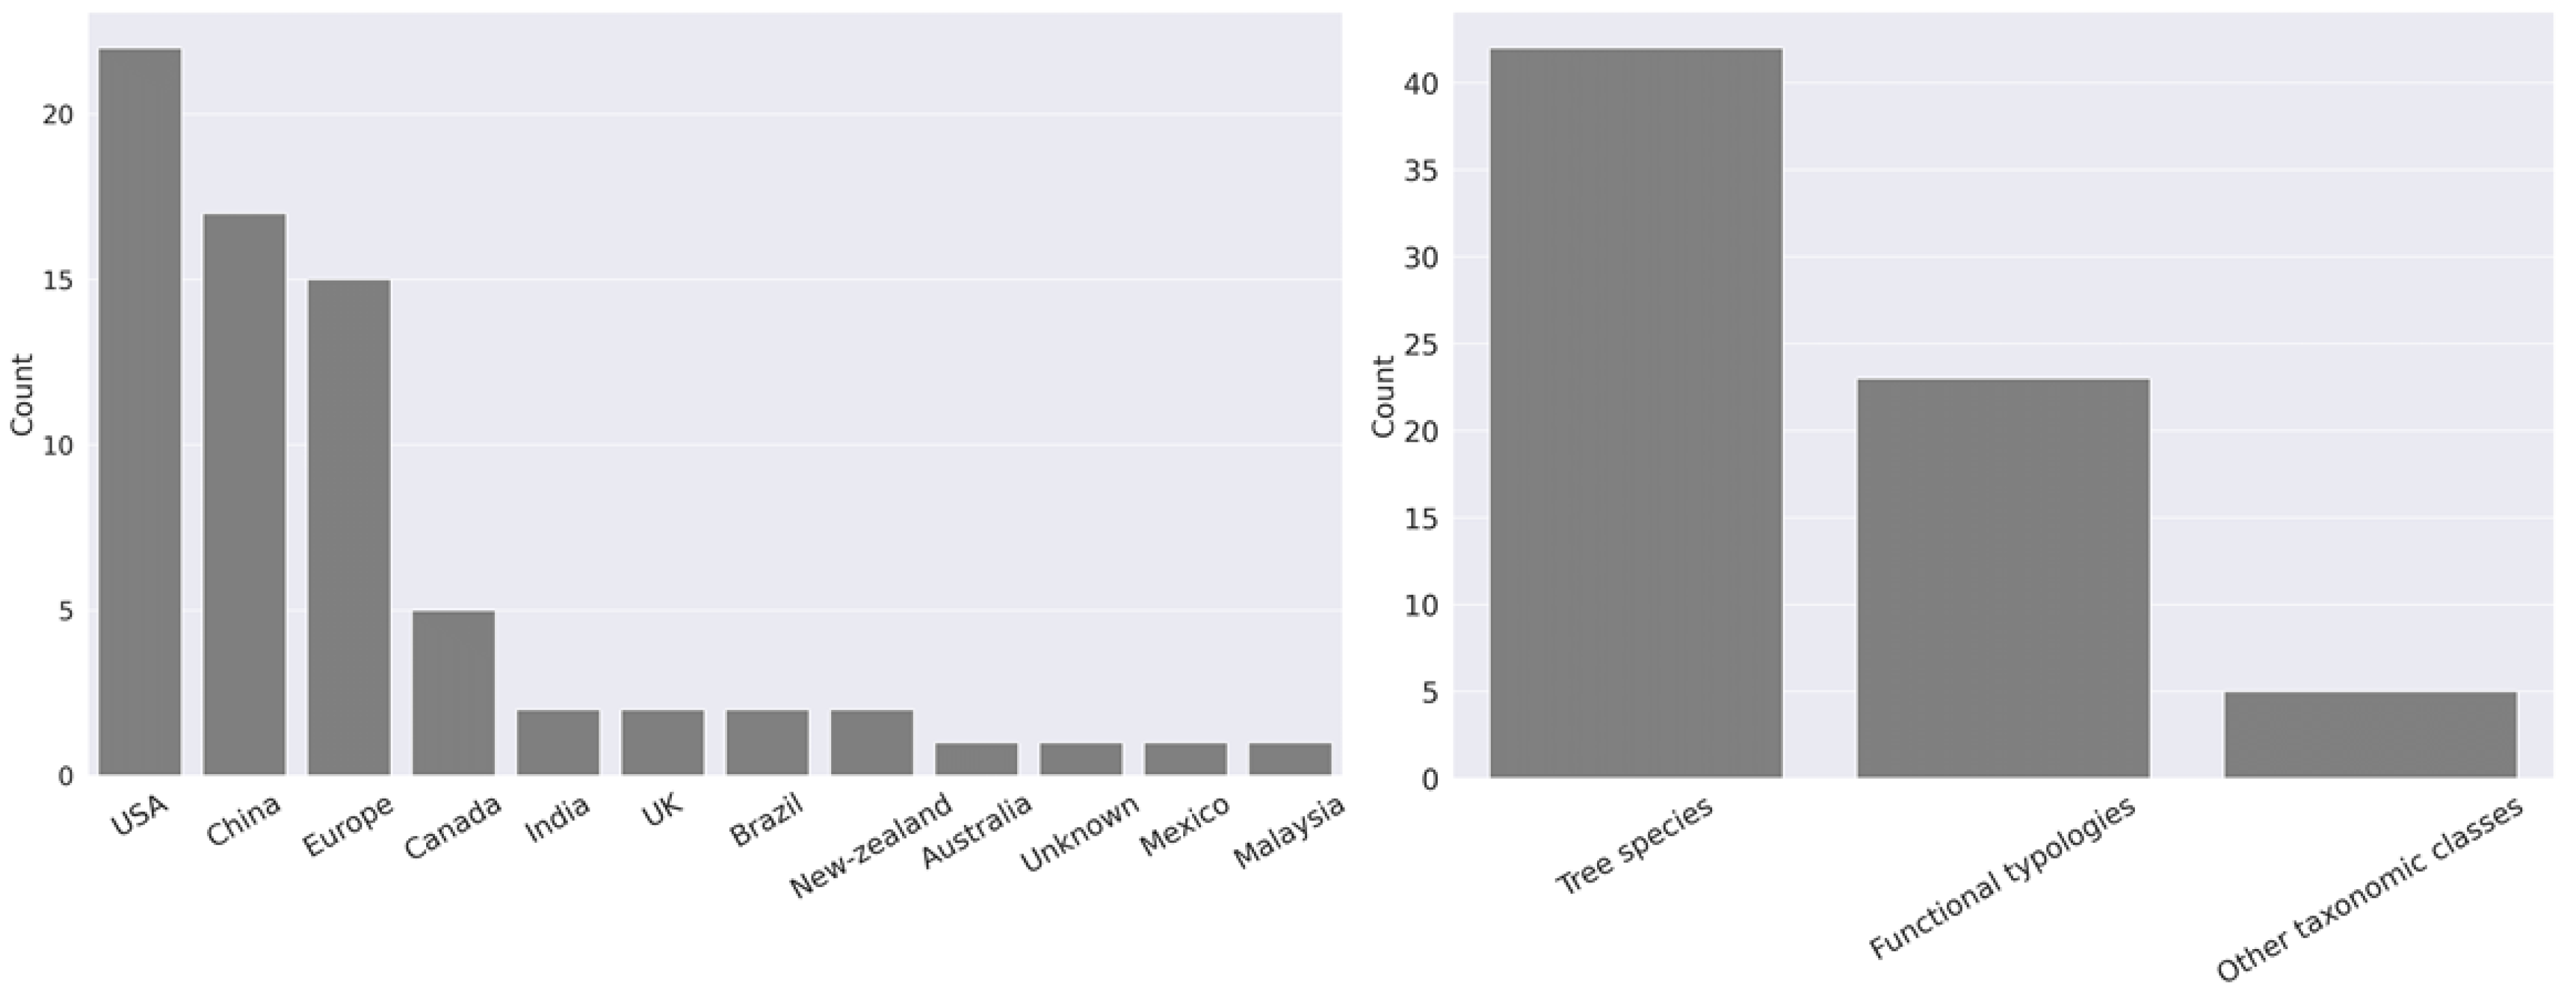
The number of papers fulfilling the criteria of our review study has been steadily increasing between 2000 and 2021 (Figure 1). Most urban mapping studies included in this review have been performed in the USA, China and Europe (Figure 2). An important number of these studies focus on the mapping of tree species, while fewer studies focus on other taxonomic classes or functional vegetation types (Figure 2). The mapping itself is done using various types of data sources (spectral data, LiDAR) mounted on different platforms (airborne, spaceborne, terrestrial) and using various mapping approaches. Each of these dimensions will be explored in this review to give a coherent overview of the evolution and current practices in the field.
3. Results
As mentioned above, the analysis of the literature was structured based on vegetation typology, utilized remote sensing data and mapping approach. To avoid confusion with regard to the terminology used throughout this paper, Table 1 gives an overview of the different terms used in studies on urban vegetation mapping with remotely sensed data.
3.1. Vegetation Typologies
Broadly, a distinction can be made between two approaches taken by scholars when mapping vegetation in an urban environment: vegetation types are either defined based on functionality or on taxonomic classes.
3.1.1. Functional Vegetation Types
Many studies focus on the mapping of urban land use/land cover, yet, in the majority of these works, the focus does not lie on the mapping of urban vegetation, but on characterizing built-up areas with different functionalities (residential, commercial, etc.) or morphology [33,34,35]. In these studies, vegetation is usually represented by only one or two classes (e.g., high versus low vegetation, woody versus herbaceous). A number of the studies reviewed, though, define vegetation classes from a functional perspective, whereby the nature of the vegetation classes and the level of thematic detail depends on the envisioned use of the map. In these studies, we see an increasing focus on the role of different types of vegetation as providers of ecosystem services [36]. Generally, four types of services are recognized: (a) provisioning, (b) regulating, (c) supporting and (d) cultural services [37]. Various frameworks have been proposed for defining urban vegetation classes based on the kinds of ecosystem services they provide.
Mathieu et al. [36] focus on supporting/habitat services, providing a living space for organisms. The classes in their study on mapping vegetation communities in Dunedin City, New Zealand, were based on a habitat classification scheme specifically designed for the urban environment, where mixed exotic–indigenous vegetation occurs more than in a rural environment [38]. The first level in their classification defines four structural habitat categories (trees, scrub, shrubs and grassland), which, at the second level of the hierarchy, are further subdivided into a total of 15 classes based on (a) spatial arrangement (tree stands, scattered trees, isolated groups of trees), (b) the presence of native or non-native species, or a mix of both (for trees, scrub, shrubs), and (c) the type of management (for grassland). Using object-based classification of Ikonos imagery, they obtained a relatively low classification accuracy of 64% for these classes, mainly caused by confusion between scrub habitats, shrubland and vineland, as well as between parks and woodland.
Bartesaghi-Koc et al. [12] focus on the regulating services of green infrastructure in the greater metropolitan area of Sydney. In their study, they propose a general green infrastructure typology to support climate studies. Inspiration for this typology was drawn from existing standard land cover classification schemes, such as LULC [39], LCZ [40], HERCULES [41] and UVST [42]. Such a typology is valuable given the effectiveness of green infrastructure in mitigating the intensity of heatwaves and in decreasing urban temperatures overall [43]. In their scheme, the differentiating factor is not only the vegetation life form but also the structural characteristics of the vegetated area (e.g., vegetation density). The distinction between different classes in their scheme is based on three dimensions: (a) height of the vegetation (or life form), (b) structural characteristics and (c) composition of the ground surface. Using thermal infrared, hyperspectral, LiDAR and cadastral data, they reached an overall accuracy of 76% in mapping the classes of their proposed scheme.
Kopecká et al. [44] and Degerickx et al. [30] took all four ecosystem services into consideration in defining the vegetation types in their studies and both ended up with a total of 15 classes. Both tried to use expert knowledge to define a fixed set of categories. Kopecká et al. [44] do not take the physiological or structural characteristics of the vegetation explicitly into consideration but rather make a distinction between urban vegetation types based on the land use in which the vegetation is embedded. Degerickx et al. [30] focus on the characteristics of urban green elements by initially distinguishing three main classes based on the height of the vegetation: trees, shrubs and herbaceous plants. Each of these classes is then further divided into subclasses based on spatial arrangement (e.g., tree/scrub patches, rows of trees, hedges, etc.), vegetation composition (grass, flowers, crops, etc.) and type of management (e.g., plantations, lawns, meadows, vegetable gardens, extensive green roofs, etc.).
The automated part of the classification procedure by Kopecká et al. [44] only entailed two vegetation classes (tree cover and non-woody vegetation). Because the authors assumed the spectral separability of the detailed classes in their scheme to be too low, further distinction between classes was made based on visual interpretation of the vegetated areas. Degerickx et al. [30] performed the mapping in a semi-automated way. Making use of high-resolution airborne hyperspectral imagery (APEX sensor) and LiDAR data and applying an object-oriented classification approach followed by a rule-based post classification process aimed at improving the quality of the classification, they achieved an overall accuracy of 81% on the 15 classes defined.
Various studies focusing on differentiating between functionally relevant vegetation types are specifically aimed at defining the degree of thematic detail that can be achieved by analyzing the spatial/spectral separability of the classes during the image segmentation and/or image classification phase (e.g., [45,46,47,48,49,50]), whereby it is common to use a hierarchical classification approach (e.g., [51]).
3.1.2. Taxonomic Classes
In rural areas, classification at the species level has been thoroughly researched in the context of automated crop classification and forestry research. However, the urban environment poses specific challenges. As mentioned before, (a) the spectral/spatial heterogeneity caused by a large variety in background material, (b) the disturbing effects of shadow casting and (c) the different spatial arrangements in which vegetation can occur make the mapping of urban vegetation quite challenging [52,53,54]. Furthermore, the availability of reference data for training image classifiers for mapping at species level is often limited due to a lack of effort by local public authorities in maintaining urban green inventories. On top of this, a large part of the vegetation in urban areas is found on private property, for which relatively little information on vegetation cover is known.
In urban environments, mapping up to the species level has almost exclusively been done for tree species. One of the (obvious) reasons is that tree crowns are large enough to be recognized on high and very high spatial resolution imagery that is available nowadays (for an overview of sensors used in the studies included in this review, see Table 2). Additionally, the difference in spectral signature and 3D structure between tree species is sufficient to expect acceptable accuracies for the mapping of urban trees [55,56].
Various authors have attempted to classify urban trees at species level, although it is difficult to compare these studies due to the high variety in the tree species that are mapped (e.g., [53,54,57]). This can be attributed to the fact that studies on this topic are often of a local nature and linked to applied research (e.g., related to tree species inventorying or ecosystem service assessment in a specific study area). Researchers will generally not consider applying their proposed methodology on a benchmark dataset.
A distinction must be made between the identification of trees that are part of a denser canopy (e.g., [58,59]) or the identification of single standing trees (e.g., street trees). Often, both will be included in the same study when the area entails both urban parks and built-up areas. However, different approaches may be required to obtain optimal mapping results in each case. In an urban forest setting, trees will be located close to each other, so textural measures derived from the spectral imagery can significantly improve classification, whereas the utility of this information decreases when dealing with freestanding trees (e.g., [53]). On the other hand, the development of a freestanding tree is often unobstructed and it can therefore develop properly, making it often more representative for the species and easier to identify [60].
The presence of background material in the pixel is often an important source of confusion when mapping freestanding trees. Unlike in a natural environment, the background material in an urban setting is often much more diverse, making it difficult to filter out its influence [53,54]. The spatial resolution of the imagery is of course important in mitigating these effects: the lower the spatial resolution, the larger the impact of mixing with background material will be.
The broadest distinction one can make in mapping trees based on tree taxonomy is between either deciduous and evergreen species or between angiosperms and gymnosperms. Both types of distinction can generally be made with high accuracy [61], especially when including LiDAR data, due to the characteristic difference in tree crown shape [18,62,63]. Within each category, the accuracy with which species can be identified may differ. Xiao et al. [61] found that, on a physiognomic level, broadleaf deciduous species were easier to identify than broadleaf evergreen species and conifer species when using imagery captured by the AVIRIS sensor (3.5 m spatial resolution), although it should be noted that sample sizes in this study were small, the dataset was highly unbalanced and the differences in mean mapping accuracy between the different categories were limited. Higher accuracies were achieved for evergreen species by Liu et al. [64] when using airborne hyperspectral imagery (CASI sensor) with a higher spatial resolution (1 m) in combination with LiDAR data. This indicates that very high-resolution imagery in combination with structural information seems required for mapping needleleaf trees at species level. This can be attributed to the similarity in spectral signature between these species and therefore the higher reliance on information about tree crown structure [54,60]. Despite a better spectral distinction between different broadleaf species, crown structure also appears to be the the most important discriminating factor for identifying broadleaf trees when fusing various data sources. Alonzo et al. [65], using AVIRIS imagery, concluded that the highest classification accuracies are obtained for species with large, densely foliated crowns. It is beneficial if the crown is densely foliated since this avoids contamination of background material in the spectral signature of the tree [61,65]. Smaller tree crowns increase the risk that the pixel size of the spectral imagery is too small to avoid mixture with the background material [52]. In the latter, the inclusion of structural information from LiDAR data can be very valuable [18]. Another reason for the importance of a large crown size is the higher risk of a co-registration error between the reference data and the imagery or between the various data sources (usually LiDAR and spectral imagery) for smaller crowns. Of course, the between-class spectral and/or structural heterogeneity of the trees within a dataset will also influence the accuracy of the classification. More specifically, it is easier to discriminate between species of a different genus than between species of the same genus [66].
Besides the identification of tree species, it can be of great interest to identify non-tree vegetation species present in urban areas. However, such attempts are rare and only a few studies passed the criteria used for selecting papers for this review, as mentioned in the Section 2. Shouse et al. [67] used both medium-resolution Landsat imagery and very-high-resolution aerial imagery to map the occurrence of Bush honeysuckle, a pervasive invasive exotic plant (IEP) in eastern North America. Unsurprisingly, the use of imagery with a higher resolution resulted in higher accuracies (90–95%). However, the accuracy scores obtained with Landsat imagery proved to be still reasonably high (75–80%). Important to note is that most trees in the study area were in leaf-off conditions when the imagery was captured. Chance et al. [68] mapped the presence of two invasive shrub species in Surrey, Canada. An accuracy of 82% was achieved for the mapping of Himalayan blackberry and 82% for English ivy using airborne hyperspectral imagery (1 m spatial resolution) in combination with LiDAR-derived variables. The classification of smaller plant species comes with additional challenges; for example, the object of interest will often be located under a tree canopy, especially in densely vegetated areas. Chance et al. [68] therefore made a distinction between open areas and areas located under a tree canopy, whereby the latter were mapped solely using LIDAR-derived variables.
3.2. Remote Sensing Data
3.2.1. Optical Sensors
A wide variety of multi- and hyperspectral sensors have been used for the classification of urban green. The utility of the imagery is determined mainly by its spectral, spatial and temporal resolution. A high spatial resolution is, in most cases, desirable to ensure that the vegetation object of interest is larger than the size of a pixel [61]. Unfortunately, high spatial resolution often comes at the cost of lower spectral resolution, especially when dealing with satellite imagery. This is an important trade-off since, generally, the inclusion of more detailed spectral information leads to improved mapping results [30,69].
Certain regions in the electromagnetic spectrum are more important than others for distinguishing various types of vegetation. A detailed representation of reflectance characteristics in specific parts of the visual, NIR and SWIR regions is crucial in this regard [54,55]. Li et al. [70] found that the newly added red edge and NIR2 bands of Worldview 2 and 3 contribute significantly more to the discrimination of various tree species than the traditional four bands of Worldview 1 (red, green, blue, NIR). In contrast, Alonzo et al. [18], who studied urban tree species mapping using 3.7 m AVIRIS data, found limited discriminatory value in the NIR range due to the very high within-class spectral variability in this region. The green edge, green peak and yellow edge, on the other hand, showed a larger contrast between various tree species [18,23,54,64,65].
In contrast to research performed in forested areas, textural information on the surroundings of the tree crown does not improve the classification results for urban trees [53]. This can be attributed to the fact that urban trees are often freestanding. As such, the classifier will not benefit from neighborhood information [70]. On the other hand, if the spatial resolution is sufficiently high, it is beneficial to include textural information concerning the crown structure of the tree [60] (see Section 3.3.1).
It should be noted that the disturbing effect of shadow plays a larger role in urban environments than in natural environments due to the 3D structure of urban areas. It is important to take the influence of shadow on the reflectance of vegetation objects into consideration, especially when mapping tree species. In a forest environment, a large tree will rarely cast a shadow over the complete crown of a smaller tree, whereas this is often the case when shadow is cast by a large building. Different authors deal with shadow in different ways, either (a) by omitting elements that are affected by shadow from the training set (e.g., [71]), (b) by performing a shadow correction [23,46] or (c) by including shadowed areas as a separate class (e.g., [53,58,72]).
To facilitate the overview of different types of optical sensors used for mapping urban vegetation, we will group them into two categories based on their spatial resolution (see Table 2). Each category will be discussed separately.

Table 2.
Overview of the various sensors used to classify different types of vegetation in the studies included in this review. Airborne sensors are indicated in italics. Sensors that produce an additional panchromatic band are indicated in bold.
Table 2.
Overview of the various sensors used to classify different types of vegetation in the studies included in this review. Airborne sensors are indicated in italics. Sensors that produce an additional panchromatic band are indicated in bold.
| Sensor | Spatial Resolution [m] | Spectral Resolution [# Bands] | Classification Scheme | Used by |
|---|---|---|---|---|
| High spatial resolution [1–5 m] | ||||
| Gao-Fen 2 | 4 | 4 | green space | [73] |
| IKONOS | 4 (MS) | 4 | vegetation communities, tree species | [36,45,53,58,74] |
| Quickbird | 2.62 (MS) | 4 | green space | [75] |
| Pleiades | 2 (MS) | 4 | tree species | [76,77] |
| Rapid-Eye | 5 (MS) | 5 | green space, plots of homogeneous trees | [57,78] |
| Worldview-2 | 2 (MS) | 8 | green infrastructure, tree species | [30,55,56,79] |
| Worldview-3 | 1.24 (MS) 3.7 (SWIR) | 16 | tree species | [55,66] |
| CASI | 2 | 32 (429–954 nm) | vegetation types, tree species | [52] |
| AISA | 2 | (400–850 nm) | tree species | [71] |
| HyMap | 3 | 125 | tree species | [80] |
| Hypex VNIR 1600 | 2 | 160 | green infrastructure | [12] |
| AISA | 2 | 186 (400–850 nm) | tree species | [71] |
| APEX | 2 | 218 (412–2431 nm) | functional vegetation types | [30] |
| AVIRIS | 3–17 | 224 | tree species | [18,59,61,65] |
| AISA+ | 2.2 | 248 (400–970 nm) | tree species | [54] |
| AISA Dual hyperspectral sensor | 1.6 | 492 | tree species | [81] |
| Very high spatial resolution [≤1 m] | ||||
| Nearmap Aerial photos | 0.6 | 3 | tree species | [56] |
| Aerial photos (various) | 0.075–0.4 (RGB) | 3 | vegetation types, tree species | [17,48,67,82,83,84,85,86] |
| NAIP | 1 | 4 | functional vegetation types | [51,55] |
| Aerial photos (various) | 0.20–0.5 (VNIR) | 4 | tree species | [20,72,87,88] |
| Air sensing inc. | 0.06 (VNIR) | 4 | tree species | [60] |
| Rikola | 0.65 | 16 (500–900 nm) | tree species | [89] |
| Eagle | 1 | 63 (400–970 nm) | tree species | [71] |
| CASI 1500 | 1 | 72 (363–1051 nm) | shrub species | [64,68] |
Imagery with a High Spatial Resolution (1–5 m)
This category consists of both airborne and spaceborne sensors. The number of spectral bands and spectral regions that are captured by these sensors may vary substantially.
High-resolution imagery is used for mapping functional vegetation types as well as for species-level classification. RapidEye imagery with a 5 m resolution was used by Tigges et al. [57], due to its relatively short revisit time, to map homogeneous tree plots using a multi-temporal dataset, indicating that a classification at the species level is possible but only for areas with multiple trees of the same genus. However, in an urban environment, one often needs to be able to map single standing trees as they make up a large portion of the urban vegetated landscape. IKONOS imagery with a resolution of 4 m was used and compared to higher-resolution imagery by Sugumaran et al. [58] (1 m airborne photographs) and Pu and Landry [53] (WorldView-2 imagery) for the classification of individual trees. Both authors concluded that better results can be achieved when using imagery with a higher spatial resolution, since this enables the capture of pure pixels within each tree crown. Naturally, this also depends on the tree species in question and the maturity of the trees [61]. Lower spatial resolution can also be a limiting factor in mapping heterogeneous urban forests, due to the higher likelihood of overlap of crowns of different types of trees [61]. Both for the detection of street trees and of trees in an urban forest setting, the use of structural information through LiDAR can vastly improve the identification of smaller trees when working with imagery at resolutions of 3.5 m or less [18], depending on the size of the small tree crowns.
From a resolution of 3 m or higher, the mapping of individual trees becomes more feasible. Both spaceborne and airborne sensors can produce imagery at this resolution. While airborne sensors often deliver imagery with a higher spectral and spatial resolution, the capacity of satellite sensors to make recurrent measurements of the same location makes them particularly suited for multi-temporal data acquisition and mapping based on vegetation phenology, especially if fused with other types of data, such as LiDAR or aerial photography [55,56]. The higher spatial resolution that is often associated with airborne sensors makes airborne remote sensing an interesting source for mapping individual vegetation elements, which, on this type of imagery, extend over multiple pixels (e.g., freestanding trees). However, the increased spectral information delivered by these sensors can also be interesting for mapping other, often larger vegetation elements. Degerickx et al. [30] and Bartesaghi-Koc et al. [12] made use of hyperspectral imagery from the APEX and Hypex VNIR 1600 sensors, respectively, to map functional green types. Degerickx et al. [30] demonstrated the added value of hyperspectral data (APEX, 218 bands) compared to WorldView-2 (eight bands), especially for the mapping of thematically more detailed functional classes (see also Section 3.1.1). Although it is possible to use all bands (e.g., [81]), the abundance of information captured by hyperspectral sensors is often condensed before it is used in a machine learning context. This can be done either through the use of appropriate spectral indices [54,64] or through the use of dimension reduction techniques [30,89] (see Section 3.3.1).
Imagery with a Very High Spatial Resolution (≤1 m)
When considering imagery with a spatial resolution smaller than or equal to 1 m, we may be dealing with aerial photography or with multi- or hyperspectral airborne sensors. However, various satellite sensors also include a panchromatic band with a resolution below 1 m. The process of pan sharpening has become increasingly common to obtain multispectral spaceborne information at an increased spatial resolution and can also be of interest for the accurate delineation of vegetation objects in an urban context [51,53]. The continuous development of new pan sharpening techniques using deep learning (e.g., [90]) has made this an interesting option; however, one needs to be aware of the potential loss of spatial or spectral information in the pan-sharpened image.
Currently, aerial photography is still the most used source for the spatially detailed mapping of urban vegetation. Despite the high spatial resolution of true-color aerial photography, there are indications that the spectral information in RGB aerial photos is too limited for vegetation mapping, even for the identification of relatively broad vegetation classes, and needs to be combined with structural information to be useful [17]. While the use of multi-temporal RGB imagery, as provided by some commercial vendors, may aid in the identification of tree species [56] or other vegetation types by capturing the differences in phenology between different species, aerial photography including an NIR band is used more often for vegetation mapping. Li and Shao [51] used 4-band NAIP data for mapping broad vegetation types (forest, individual trees, shrub, lawns and crops) and obtained a good degree of accuracy (>90%) when using an object-based classification approach. For the classification of tree species, the use of very high-resolution imagery has been shown to offer unique benefits. The small size of individual pixels allows one to capture the variation within a tree crown at a more detailed level, therefore increasing the potential of defining meaningful textural features [20,60,72,88]. Puttonen et al. [72] made an explicit distinction between the illuminated and shaded part of a tree crown, using the mean value of each part and the ratio between the two parts to train their classifier. The approach led to improved results compared to a method not making this distinction developed by Persson et al. [91]. Iovan et al. [20] found both first- and second-order textural features when calculated at the tree crown level to contain important information for the discrimination between two species. When the resolution of the imagery is high enough, the analysis of tree crown texture can become increasingly detailed. Zhang and Hu [60] used imagery with a resolution of 0.06 m to derive several descriptors from the longitudinal reflectance profile of each tree crown. They showed that the longitudinal profiles contain valuable information when the spatial resolution of the imagery is sufficiently high. Additionally, this type of information appeared to have a positive influence on the robustness of the classification with regard to differences in illumination and the influence of shadow.
There are indications that combining a very high spatial resolution with a high spectral resolution can improve the mapping of tree species even further [89]. However, so far, few studies with this type of data have been performed in an urban setting.
3.2.2. LiDAR
Light Detection And Ranging (LiDAR) technology can be used to infer the distance between the sensor and an object. It has been widely applied to generate detailed digital terrain and digital surface models. Various vegetation types or species have different three-dimensional structural characteristics that can be captured with LiDAR. Hence, the inclusion of LiDAR has been shown to significantly increase mapping accuracy both in an urban and a non-urban environment [30,56,64,71]. Several authors have used LiDAR as the sole source to distinguish between vegetation types or species [62,63]. While information about the shape of the tree is important, in functional vegetation mapping, LiDAR is mainly used to discriminate between various types of vegetation based on height (e.g., [50,87]). Besides LiDAR technology, height information can also be derived from stereoscopic imagery [20,50]. However, the use of this technology is less common for the purpose of vegetation mapping.
Various point cloud densities have been employed to map urban vegetation (see Table 3). A higher point cloud density will generally lead to better results [92]. LiDAR point clouds with a lower point cloud density (<10 points/m²) can provide sufficient information for the mapping of larger vegetation objects (e.g., large trees, homogeneously vegetated areas), especially when combined with spectral imagery [12,48,57,59]. Nevertheless, high-density LiDAR point clouds allow for the extraction of more complex information regarding the vegetation object. This can be especially important when dealing with small objects or, in the case of trees, high-porosity crowns [18,64,68]. Moreover, for the classification of trees, the optimal point density might depend on the phenological stage of the tree, with a full canopy requiring lower density than a bare tree since the point cloud will only represent the outer shape of the tree [62].
It is common practice (also in a non-urban setting) to derive a range of features from the raw LIDAR data (e.g., related to the vertical profile of the vegetation), especially when working at a spatially more detailed level. However, next to geometric features, one can also extract useful information from the intensity of the return signal. Kim et al. [62] found the mean intensity of the LiDAR return signal to be more important than structural variables in discriminating between different tree genera during the leaf-off phase using LiDAR data.
Fusion of LiDAR Data and Spectral Imagery
Combining spectral imagery with LiDAR has become a common strategy for high-resolution vegetation mapping in urban areas. Feature importance analysis by Liu et al. [64] (mapping of tree species) and Degerickx et al. [30] (mapping of functional vegetation types) pointed out that the structural variables derived from the LiDAR data had higher importance than the hyperspectral variables used in their analyses, especially in shadowed areas, where spectral information becomes less conclusive [68]. Voss and Sugumaran [71] achieved a substantial increase of 19% in overall accuracy when including LiDAR-derived elevation and intensity features in combination with airborne hyperspectral imagery for classifying seven dominant tree species. This improvement in accuracy was ascribed by the authors to the insensitivity of LiDAR data to the influence of shadow and to the inclusion of height information. In a study by Katz et al. [56], where a higher number of different species (16 in total) was mapped using multi-temporal aerial photography in combination with WorldView-2 imagery, the added value of LiDAR was limited. Similarly, Alonzo et al. [18] concluded that the spectral information was still the main driver of mapping accuracy in discriminating between 29 different tree species using a combination of hyperspectral AVIRIS imagery and LiDAR. The different conclusions regarding the added value of LiDAR data in these studies can be attributed to several factors, such as the characteristics of the species considered, the number of species to be discriminated and the type of spectral sensor used.
3.2.3. Terrestrial Sensors
Mobile terrestrial sensors gather information through a sensor mounted on a moving vehicle, usually an automotive system. As such, the observation of objects is not done from a top-down view but from a side perspective, providing additional information that cannot be gathered from airborne or spaceborne sensors. This can be very useful for analyzing vegetation that is located close to a building or vegetation in front yards [93]. Data captured by terrestrial spectral sensors are gaining popularity for the mapping of roadside vegetation. A large benefit is the widespread availability of this type of data as they can be acquired through several online platforms, the most popular one being Google Street View. This type of data has been used to carry out virtual surveys for the quantification of street green [94,95] or the mapping of street trees [96,97]. The abundance of imagery also holds potential for the use of deep learning techniques [98], which requires sufficient reference data to obtain accurate results (see Section 3.3.3). The time and date of acquisition is important when working with these types of sensors as a low Sun zenith angle causes shadows in the image, which makes the classification of objects more difficult [99]. Additionally, although the trees are photographed from various angles, a top-down view may still contribute substantially to the correct identification of tree species. The challenge in combining street-level and top-down imagery lies in the correct matching of vegetation objects throughout various images and image types [98].
Terrestrial laser scanning is another type of data acquisition used for vegetation mapping. Puttonen et al. [99] and Chen et al. [100] found this type of data useful for the mapping of tree species; however, higher accuracy may be obtained when this type of data is merged with higher-resolution spectral data [99]. The segmentation of various objects from terrestrial point clouds remains a significant challenge on par with the actual classification of the clouds due to the large volume of data and the irregularities in the point cloud, caused by the complexity of the urban environment [100]. A direct comparison between terrestrial and airborne laser scanning has been done by Wu et al. [101] for the classification of four tree species in an urban corridor. In the specific setting of this study, use of the airborne platform achieved slightly better results, although, interestingly, the terrestrial data had a much higher point cloud density. Combining both data sources yielded an even better output, although the improvement was limited to an increase in accuracy of only 6% points, resulting in a total overall accuracy rate of 78%. This limited gain obtained with terrestrial data might be due to the inconsistency in intensity features caused by strongly varying incident angles and ranging distances [101].
The combined use of laser scanning with close-range photogrammetry, which is increasingly applied in forestry applications [102], may also offer improved results in an urban context since both methods complement each other. The difference in light source between both methods means that the depth of penetration in the canopy is different and the point cloud will show different parts of the canopy. This can mitigate the negative consequences of gaps in the laser point cloud or issues related to low radiometric quality [103,104,105]. Despite good results in other fields, the combination of both approaches for the mapping of urban vegetation was not encountered in the studies included in this review.
3.2.4. Importance of Phenology in Vegetation Mapping
A promising way to improve vegetation mapping is by making use of multi-temporal information such that the phenological characteristics of a plant species can be taken into consideration [57,66,70,73,79,106]. This has become possible with the launch of satellites with a short revisit time in combination with an adequate spatial and spectral resolution, such as RapidEye or PlanetScope. Especially for the recognition of different deciduous tree genera, where different species have different leafing out and blossoming patterns [64], the acquisition of imagery during the crucial stages in the phenological cycle has the potential to improve the mapping results [57].
Sugumaran et al. [58] assessed the influence of seasonality on the overall classification accuracy for distinguishing oak trees from other tree species. Fall images produced the best results. This could be attributed to a shift in the blue band caused by changes in the amount of chlorophyll pigmentation for the oak species. This is in accordance with the results of Voss and Sugumaran [71] and Fang et al. [66]. Voss and Sugumaran [71] assessed the influence of seasonality on the overall classification accuracy while mapping seven different tree species using hyperspectral airborne imagery with a resolution of 1 m, concluding that, despite no significant difference in the overall accuracy when acquiring the imagery in summer (July) or fall (October), the fall results showed higher average class-wise accuracy over different tree species. Fang et al. [66] performed a more detailed analysis, using twelve WorldView-3 images spread over the year to classify trees both at the species and the genus level. A feature importance analysis revealed that although the fall imagery provided the best separability overall, spring imagery also aided classification at the species level. Additionally, they concluded that, within the fall period, the optimal acquisition time varied depending on the tree species in the dataset. Pu et al. [77] identified spring season (April) imagery to provide better results than all other seasons for the classification of seven tree species using high-resolution Pleiades imagery. The tree genera with a distinct phenological pattern (e.g., early leafing out of the populus genus) generally reached higher producer and user accuracy; this is also why it may be easier to discriminate between species of a different genus [66]. Capturing imagery at the appropriate dates and thorough knowledge of the phenological stages of the vegetation to be modeled are therefore crucial [66,70]. Acquiring such knowledge can be challenging, especially in an urban environment, where the anthropogenic effects on ground surface temperature may be substantial and may lead to the intensification of the temporal and spatial variations in leaf development [107]. Acquisition time also matters when using LiDAR data. Kim et al. [62] observed an increase in accuracy when using leaf-on as compared to leaf-off data in distinguishing between deciduous and evergreen tree species.
Besides using multi-temporal data to assess the influence of the time of data acquisition on the mapping results, multi-temporal data can be used directly in the classification. Tigges et al. [57] used five RapidEye images captured over one year (Δ1.5 months on average) to discriminate eight commonly occurring tree genera in Berlin, Germany. They observed that the overall error decreased with an increasing number of features from the multi-temporal imagery. Compared to single date imagery (from the summertime), the kappa value increased from 0.52 to 0.83. The downside of using RapidEye data is the relatively low spatial resolution (5 m), which led the authors to focus on larger, uniform urban forests. Li et al. [70] achieved an average improvement of 11% in overall accuracy by combining a WorldView-2 and WorldView-3 image taken in late summer and high autumn, respectively, for the identification of five dominant urban tree species in Beijing as compared to only using single date imagery. A similar improvement was achieved by Le Louarn et al. [76] using bi-temporal Pleiades imagery taken in high summer and early spring (March). Even RGB imagery may contain valuable information on the phenological evolution of plant species throughout the year. Katz et al. [56] attained an increase in overall accuracy of 10% points (63% to 74%) by including commercially available multi-temporal RGB Nearmap imagery (eight images) in addition to a WorldView-2 multispectral image and LiDAR data for the mapping of 16 common tree species in Detroit. Another way to acquire information regarding the phenological profile of different tree species is by using terrestrial imagery taken at specific intervals throughout the year. Abbas et al. [108] achieved accuracies of up to 96% for the mapping of 19 tree species with bi-monthly hyperspectral, terrestrial imagery.
3.3. Mapping Approaches
3.3.1. Feature Definition
Oftentimes, rather than directly providing the classifier with the original spectral data, researchers choose to derive a set of features with the intention of extracting the most useful information contained in the available data. This leads to a reduction in noise and allows one to avoid the problems that come with the high dimensionality of the feature space. Pixel-based or object-based features can be extracted in various ways and from both spectral data and LiDAR. A distinction can be made between the use of predefined features and the use of dimension reduction techniques. However, only the former will be discussed here since the choice of dimension reduction technique will generally not be influenced by the type of land cover or the type of object that is being mapped. In this section, the following types of features will be discussed: (a) spectral features, (b) textural features, (c) geometric features (d) contextual features and (e) LIDAR-derived features.
Spectral Features
Some of the most used spectral features in vegetation mapping are so-called vegetation indices, which are calculated based on two or more spectral band values. These are often used at a higher level in a hierarchical classification approach to discriminate between vegetated and non-vegetated areas (e.g., [52,53,64,78,80]) or between basic vegetation types [12].
Spectral indices related to the red edge slope are considered to be most valuable for the mapping of tree species or other vegetation types, both when using multispectral [23,45] and hyperspectral imagery [54,64,66]. The most used index is the normalized difference vegetation index (NDVI). However, when working with NDVI in an urban environment, one must be aware of the possible false labeling of red clay roofs as vegetation, as such roofs can have similar NDVI scores [46]. Using narrow band ratios, Liu et al. [64] found two leaf pigment indices, the anthocyanin content index and photochemical reflectance index, to be more valuable than indices defined on the red edge region for the classification of tree species. This was attributed by the authors to the fact that data were gathered during leaf-off conditions (early spring), causing more disturbance from understory vegetation in this part of the spectrum. Although the use of narrow band ratios from hyperspectral imagery allows for the definition of very specific features for the classification of trees, the inclusion of wide band ratios has also been shown to have a positive effect on the accuracy for tree species mapping [54].
Textural Features
Textural features provide information with regard to the spectral variation present within the surroundings of a pixel or within a predefined object. In several studies, texture is used to distinguish between high vegetation and low vegetation (e.g., [45,53,109]). Texture measures can also aid in identifying various vegetation types or species (e.g., [23,76,110]). However, their relative importance decreases at more detailed levels of vegetation differentiation [23,53,56,70]. For tree species mapping, textural information regarding tree crown structure becomes useful only if the spatial resolution of the imagery is sufficiently high (depending on the size of the tree crown) [20,60].
Two types of textural features can be identified: (a) first-order and (b) second-order features. The former provide information about the variation in reflectance around the pixel or within the image object. Second-order texture features provide information on the spatial structure of the variation and are often based on the calculation of the grey level co-occurrence matrix [111]. Both types of textural features were used by Iovan et al. [20] for the binary classification of two tree species (lime trees and plane trees) in the city of Marseilles based on aerial imagery with a very high spatial resolution (20 cm), capturing information in the visible and near-infrared wavelengths. It was observed that both types of features are strong predictors of tree species, given that the image resolution is high enough to calculate the measures for each tree crown.
Textural features can be calculated in two different ways, either within a window of fixed size surrounding the central pixel of the vegetation object or by only considering pixels that are a part of the vegetation object (OBIA) [20,109]. The former approach can only be used in a setting with homogeneously vegetated plots, making it less suitable for urban environments. As such, the object-based method is generally preferred, although the parametrization of a segmentation algorithm or, alternatively, the manual delineation of vegetation objects can be a burden and does not always lead to a large increase in accuracy [109].
Geometric Features
Geometric features describing the size, shape and edge complexity of objects can also be included in an object-based analysis of vegetation (e.g., [30,74,112]). This can be especially interesting for identifying broader functional vegetation types due to their widely different spatial properties (e.g., a patch of trees compared to a hedge).
Contextual Features
Contextual features incorporate neighborhood information that is not related to an object itself, but to the characteristics of other objects nearby. In its simplest form, the nearest neighbors of an object could be taken into consideration during classification on the assumption that similar trees or vegetation types often occur together. Distance to the nearest objects can also be used to weigh class probabilities and derive measures of density. Zhou et al. [88] included density-related features to capture the spatial structure of neighboring tree species and found it to be beneficial for defuzzifying an initial fuzzy classification based on high-resolution aerial imagery. Contextual features can also be used for the semantic mapping of functional vegetation types, where the plant configuration or the specific embedding of a vegetated area in the urban context plays an important role [30,87,110]. For example, Wen et al. [110] were able to distinguish between park, roadside and residential–institutional trees by taking the relation between trees within an area of predefined size into consideration.
LiDAR-Derived Features
Different types of features can be derived from LiDAR point clouds (e.g., [18,62]). The nature of this type of data allows for the extraction of more detailed information about the structure of the vegetation in three-dimensional space. Liu et al. [64] make a distinction between three types of LiDAR-derived information that can be used for the mapping of trees: (a) features related to the tree crown provide information concerning the height, width and shape of a crown; (b) features related to the distribution of laser points within the crown contain information about the structure of the branches and the leaves; (c) features related to the return intensity. Alonzo et al. [18] concluded, in a study on the mapping of 29 tree species and their leaf type, that, from the calculation of tree crown structure variables based on LiDAR, height-based variables appear to be the most important, followed by return intensity metrics and crown widths at different heights. However, these findings differ from Liu et al. [64], where all three types of features were identified as being equally important for the mapping of 15 tree species. The relative importance of various attributes will in part depend on the different types of trees in the dataset, as well as on the types of variables used, which both differed in these two studies.
Using ratios instead of absolute values for LiDAR-derived features is generally assumed to be useful for tree species discrimination [62] since ratio-based features are more invariant to life stage. However, there are indications that ratios are not as valuable in an urban environment [18], possibly due to the lower degree of within-class variance as a result of proactive urban forest management.
3.3.2. Image Segmentation
In the context of urban vegetation mapping, an object-oriented approach is preferred by many researchers because of the high spectral/spatial variability that is present in an urban environment and between pixels that may belong to the same vegetation object [51,74,89,112,113]. Object-based analysis allows one to extract additional features related to the texture, shape and context (see Section 3.3.1) of vegetation objects. Moreover, the effect of spatial misalignment when fusing multiple data sources can be mitigated by working at the object level.
Although many studies still rely on the manual delineation of vegetation objects (e.g., [23,53,54,55,57,64,69,70,71,89]), it remains a time-consuming and unpractical approach. For this reason, image segmentation is increasingly used in urban vegetation mapping. Region growing segmentation has become a common approach for the delineation of tree crowns in multispectral imagery (e.g., [30,46,53,56]). The downside of this method is the parametrization, which is often difficult and highly case-sensitive. The method iteratively merges groups of spectrally similar pixels into larger regions until a measure describing the spatial–spectral heterogeneity within the regions is exceeded (the so-called scale factor). However, the optimal choice of the scale factor can differ for various vegetation types. In many object-oriented classification studies, features are extracted from multiple segmentation levels or a hierarchical approach is applied, refining the definition of vegetation types while moving down the hierarchy of classes during the classification process (e.g., [17,18,36,51,80,114]). The proprietary algorithm of the eCognition Developer software is used by various researchers for this type of image segmentation and/or classification (e.g., [17,36,51,53,70,80,114]).
Another way to approach the segmentation of vegetation and trees is to make use of LiDAR data, either by using the raw point cloud data or by using the canopy height model (CHM) derived from them. Katz et al. [56], Zhang et al. [80] used a local maxima filter to detect treetops on a CHM, after masking out non-vegetated areas using an NDVI filter or ancillary data. The local maxima filter consists of passing a window over the image, where the highest point in the window is identified as a seed point. For trees, one can adapt the window size based on the tree height, working under the assumption that higher trees have wider canopies, which is not always the case [56]. Tree crowns are then identified using a region growing algorithm based on height increments. This approach has several weaknesses: (a) over- or under-segmentation occurs frequently and (b) subdominant trees may be omitted. These problems will occur more often in densely vegetated areas and less when dealing with freestanding trees. They could be mitigated by using additional segmentation criteria that can be derived from the raw LiDAR data, such as the intensity of the return signal (e.g., [30]). A marker-controlled watershed segmentation algorithm is a similar method to delineate various tree crowns on a CHM [18,64]. Generally, the marker locations are identified using a local maximum filter at the potential location of the treetops; afterwards, the crowns are grown until a minimum is reached. To avoid over-segmentation, two watershed algorithms were combined by Alonzo et al. [18] in a cascaded manner, where the second one was applied on segments created by the first one. The first algorithm was applied on the inverse distance transformed binary canopy image and the second algorithm on an inverted canopy maxima model (CMM). On the former, markers were placed on the locations that were furthest away from the canopy edges, while on the latter, they were placed at locations with the maximum tree height.
Specific methods have also been designed for the segmentation of tree objects from the LiDAR point cloud itself (e.g., voxel-based methods); these are mainly used when working with terrestrial laser scanning data (e.g., [100,101]). Reviewing these methods in detail falls outside the scope of this article.
3.3.3. Classification Approaches
Various classification approaches have been used to map vegetation in an urban environment. The simplest means of discriminating between various vegetation classes is through the construction of user-defined decision trees based on the thresholding of certain feature values derived from the remote sensing data. This approach is used more often when working with broad vegetation types and a low number of classes (e.g., [12,17,115]), which is not unsurprising as broader vegetation types are often spectrally or structurally quite easy to distinguish. Hence, choosing a specific feature, such as the NDVI and/or object height, is often enough to discriminate between the various classes. User-defined decision rules generally produce worse results as compared to machine learning methods [48]. However, in combination with a machine learning approach, they can prove useful, e.g., for the identification/segmentation of objects of interest before applying a machine learning algorithm (e.g., [61]) or the refinement of an automated classification result (e.g., [30,36]).
Supervised Learning Approaches
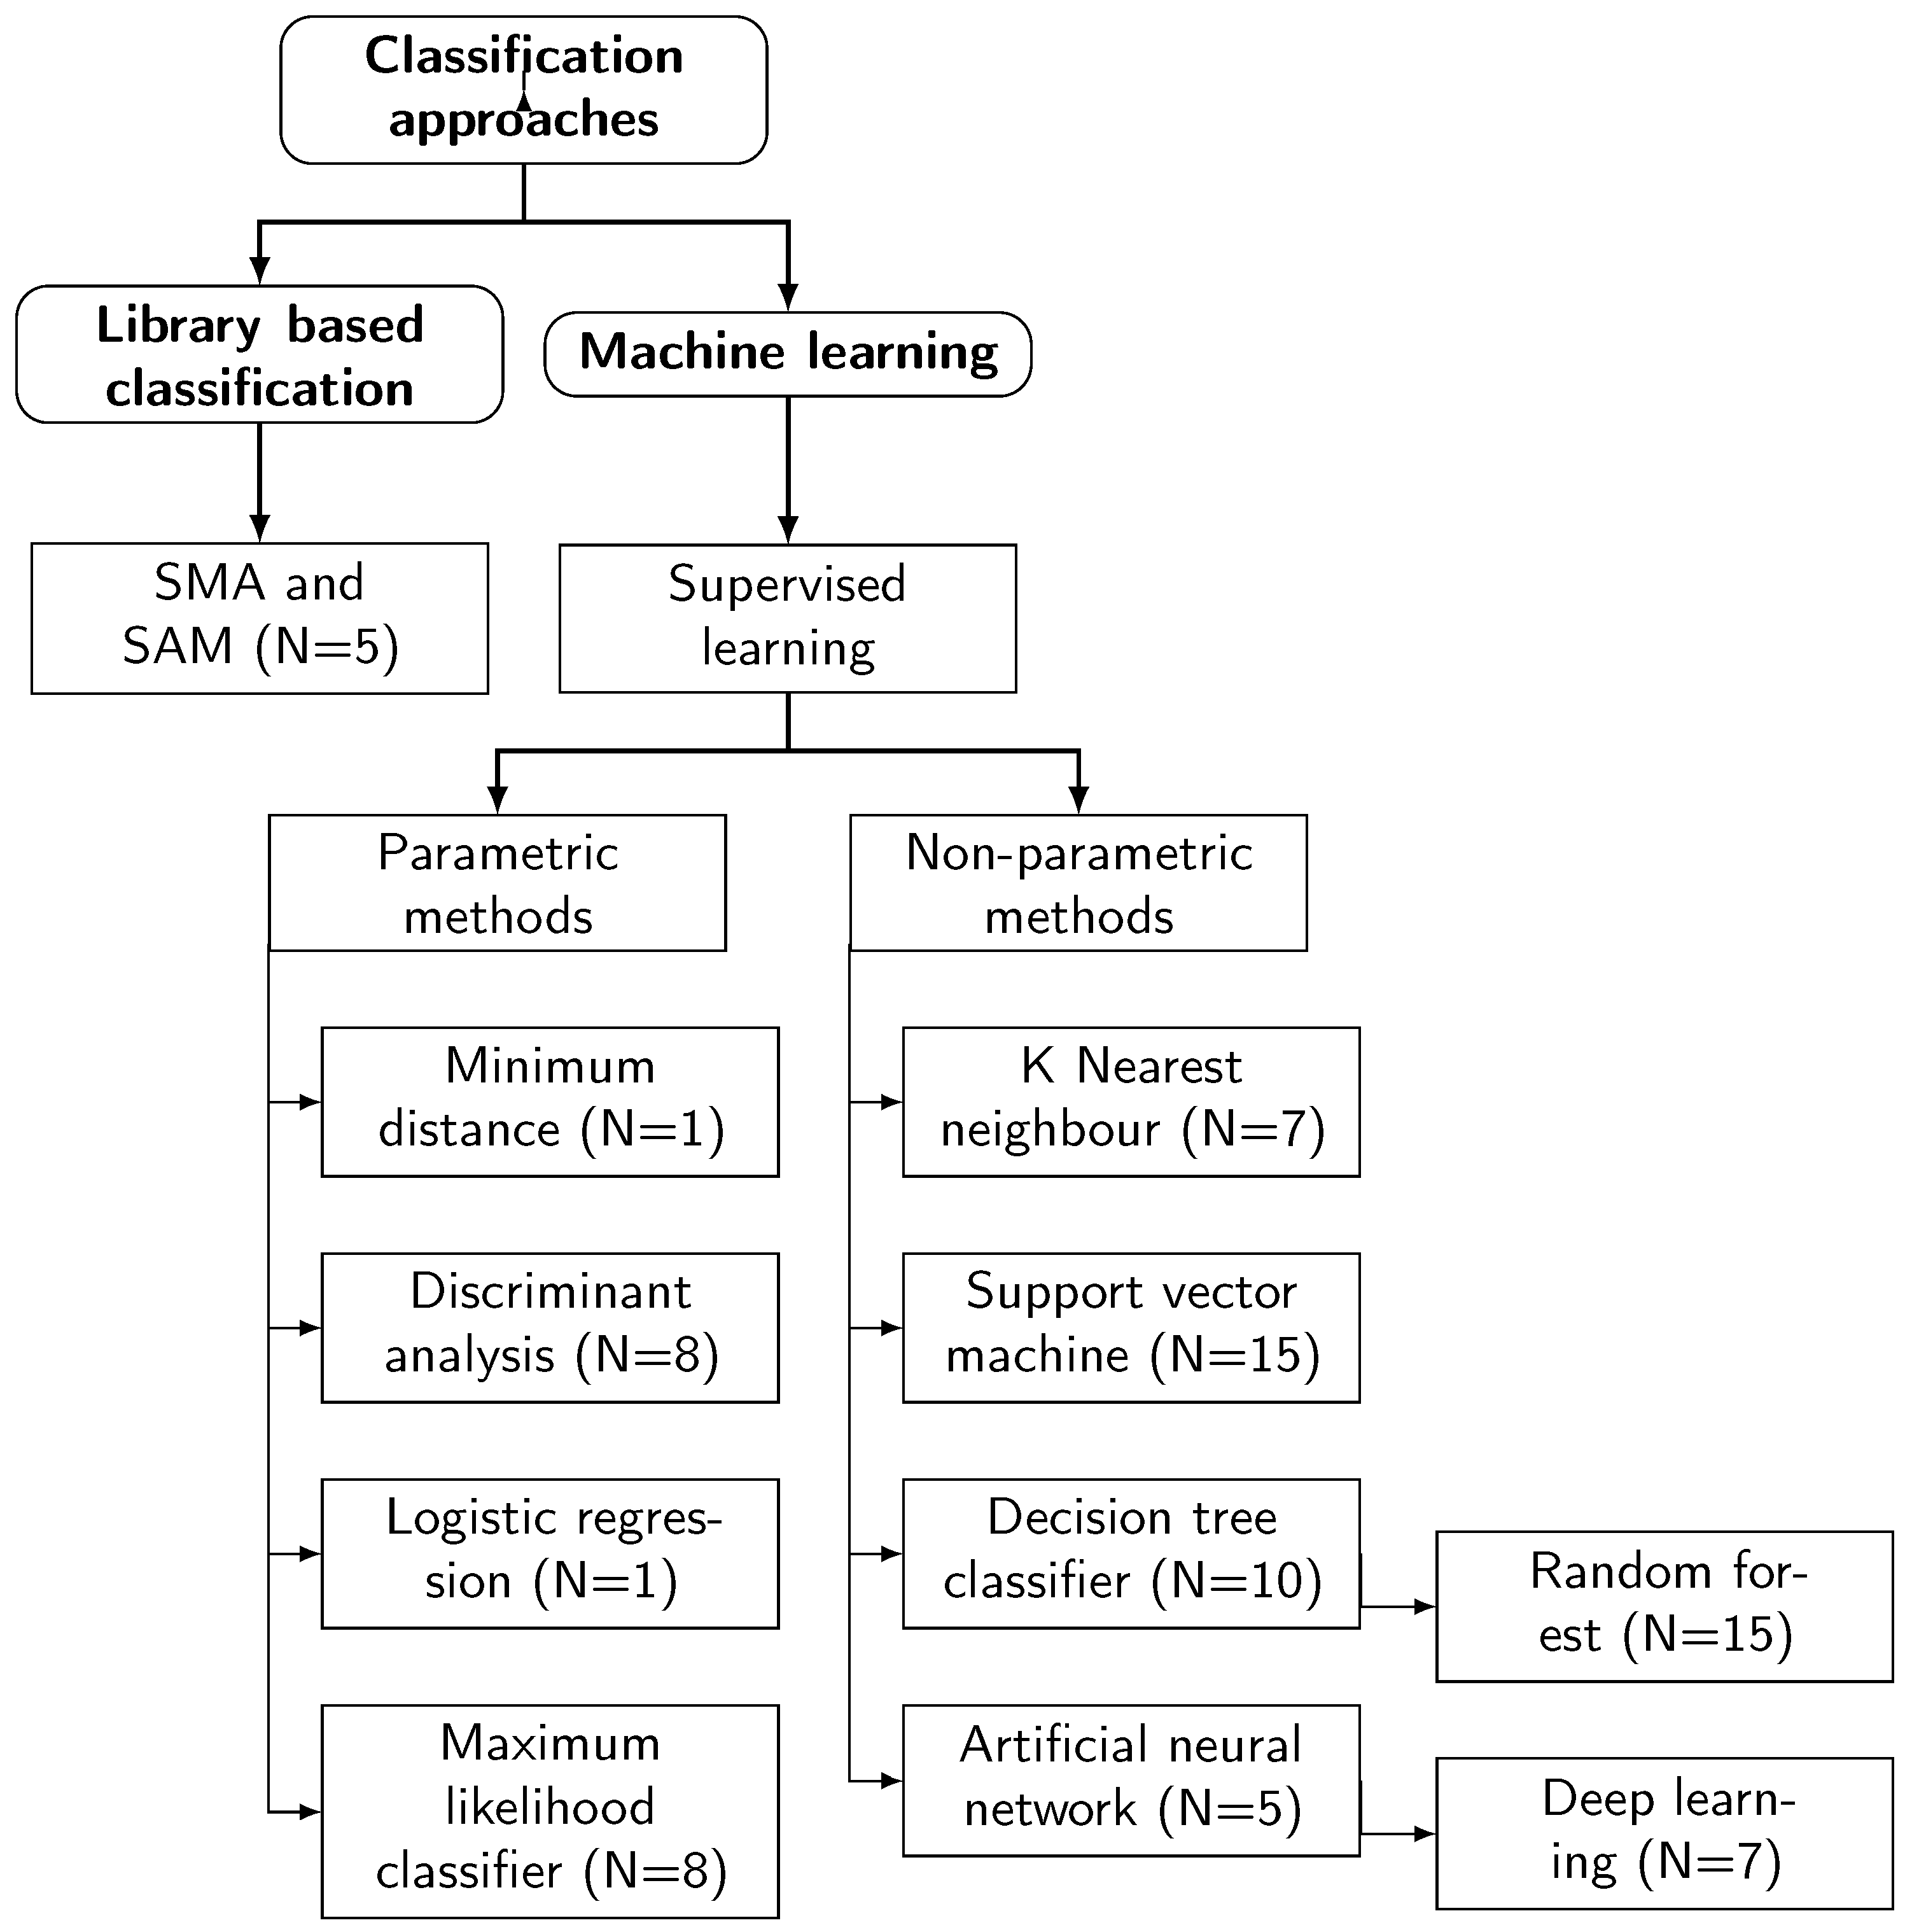
Supervised learning is the most popular classification approach for the mapping of vegetation in an urban environment. Supervised learning approaches can be subdivided into two broad categories: (a) parametric and (b) non-parametric methods (see Figure 3). Both are trained on a labeled dataset and make assumptions about the underlying distribution of the data (parametric) or not (non-parametric). Parametric classifiers are often of interest because they are easy to interpret, fast and overall require less training data than non-parametric approaches. Nevertheless, the assumptions regarding the distribution of the data might not be valid and therefore cause lower performance. Figure 3 shows that the maximum likelihood (ML) classifier and discriminant analysis are the most used parametric classification methods in the studies reviewed for this paper. Besides the standard linear discriminant analysis (LDA), there are variants to this method that may be adopted, such as canonical discriminant analysis (CDA) or stepwise discriminant analysis (SDA). Alonzo et al. [65] found SDA to perform significantly worse than LDA and CDA for the classification of 15 tree species using AVIRIS imagery.
Overall, non-parametric methods are more common than parametric methods, especially if sufficient reference data are available. Support vector machine (SVM) and decision tree classifiers are most often used, while the use of deep learning algorithms has been gaining popularity in recent years. However, there appears to be no clear relation between the spectral or spatial resolution of the imagery used in the study, the vegetation typology and the algorithm of choice. The same holds true for the use of LiDAR data. Overall, the use of deep learning techniques appears to be more popular with Street View imagery [98,116] and for species-level mapping [55,108,117].
Sugumaran et al. [58] compared an ML classifier and a rule-based decision tree algorithm for the discrimination of oak trees from other species using IKONOS imagery. The hypothesis was that CART would perform better as the large within-class spectral heterogeneity of oak samples could not be represented by a unimodal distribution in feature space, as is assumed when using an ML classifier. Nonetheless, this could not be observed in the results, as the two algorithms did not produce significantly different outcomes. Zhang et al. [46] also compared a decision tree classifier with ML for the classification of more general vegetation types (broadleaf forest, needleleaf forest, artificial grassland and weed land) from IKONOS imagery using an object-based classification approach. Here, the non-parametric classifier clearly performed better, with an increase in overall accuracy of 12% (75% to 88%). A comparison between the use of a decision tree classifier and linear discriminant analysis (LDA) was made by Pu and Landry [53] for the classification of seven tree species using WorldView-2 imagery. Here, the LDA provided better results, although accuracy scores were generally low (<65%). Shojanoori et al. [112] found an SVM classifier to produce better results than an ML classifier for the pixel-based classification of three tree species using WorldView-2 imagery. Puttonen et al. [99] also found an SVM to provide significantly better results than an LDA classifier for the mapping of three tree species using terrestrial laser scanning and terrestrial hyperspectral imagery.
For the classification of urban trees with multi-temporal WorldView (2 and 3) data, Li et al. [70] obtained better results with the use of an SVM classifier than with a CART. The authors reason that the SVM was able to deal better with the high-dimensional and unbalanced data in the training set.
Ensemble learning techniques combine the output of multiple simple non-parametric algorithms to obtain improved results. Their use has become increasingly popular for remote sensing applications. The most popular ensemble method is arguably the random forest, also for the mapping of urban vegetation. Le Louarn et al. [76] achieved slightly better results using a random forest classifier than an SVM when mapping four tree species and two tree types using bi-temporal Pleiades imagery. A combination of several classifiers (other than a decision tree) with a loss function combining their output is also possible and has been shown to give good results, especially when modeling noisy data with a limited number of training samples [80,118].
The most extensive comparison of various supervised classification algorithms has been performed by Mozgeris et al. [69] for the classification of six common tree species in Kaunas city (Lithuania) using a hyperspectral airborne sensor. In this study, the tree crowns were manually delineated to identify trees at the object level. Five classifiers were compared against each other: (a) ML, (b) k-nearest neighbor, (c) decision tree classifier, (d) multi-layer perceptron (MLP) and (e) random forest. The best results were achieved with the MLP and the random forest classifier, with the latter gaining higher overall accuracy and kappa scores. This was partly shown to be due to the high number of training samples (>100 for every tree species), which is required to properly train a neural network [49].
Library-Based Classification
Besides the use of classification techniques, several authors have used endmember signatures to map the presence of vegetation types [47,52,75,119] or species [52,61,68,120] at the sub-pixel or pixel level, using spectral mixture analysis (SMA) or the spectral angle mapper (SAM) algorithm. At the sub-pixel level, the fraction of each endmember within the pixel is determined. At the pixel level, a label is assigned corresponding to the majority endmember or the endmember that shows the highest similarity with the pixel to be classified. A benefit of using library-based classification is that one does not necessarily need a (large) training set of labeled samples to build a spectral library of endmembers. However, if the inter- and intra-species variability becomes too high, it may become difficult to define representative endmembers for spectral unmixing.
Deep Learning
Deep learning is an umbrella term for various neural network architectures with a large number of hidden layers. The approach can be used for supervised, unsupervised or semi-supervised learning. The strength of deep learning techniques is based on the capability of a network to attain a feature representation that maximizes the separability between the different classes. Thus far, only a limited number of studies have applied deep learning techniques for the classification of urban green [55,73,98,108,121]. Overall, various groups of deep learning algorithms can be distinguished, of which three have been used in the papers identified in this literature review for mapping urban vegetation: (a) a Boltzman machine, (b) an MLP with more than one hidden layer and (c) a convolutional neural network architecture (CNN). Guan et al. [121] used a deep Boltzmann machine to extract high-level features from the waveform representation of ten tree species derived from terrestrial laser scanning. Their study shows that deep learning techniques provide more accurate feature descriptions than more traditional dimension reduction techniques such as PCA or the use of manually defined features.
Abbas et al. [108] used an MLP with three hidden layers to classify 17 tree species using imagery acquired with a hyperspectral, terrestrial sensor at different moments throughout the year. The model was able to predict species with high accuracy, ranging from 84% to 96% depending on the season. Abdollahi and Pradhan [82] used an MLP with four hidden layers to discriminate between high and low vegetation using high-resolution RGB images and reached an overall accuracy of 94%; however, no comparison was made with other machine learning algorithms. The model was used with an additional algorithm to make it explainable and as such address one of the main drawbacks of deep learning, namely that it does not provide insight into the decision process.
Xu et al. [73] used a CNN architecture (HRNet) to discriminate between basic vegetation classes (decidious trees, evergreen trees, grassland) in an urban environment using multi-temporal GaoFen-2 imagery, reaching an overall accuracy of 93%, which was 6% points higher than the performance of an SVM on the same dataset. Hartling et al. [55] adopted a DenseNet architecture [117] to model eight tree species in a city park environment using WorldView-2/3 data. Despite the spatial resolution of the imagery being rather coarse in relation to the size of a tree crown, the model of Hartling et al. [55] performed better than an SVM or RF classifier, even when provided with only a limited amount of training samples. More specifically, the DenseNet achieved an overall accuracy of 83%, compared to 52% (SVM) and 52% (RF) for the other two classifiers. Martins et al. [83] used various CNN architectures (SegNet, U-Net, FC-DenseNet and two DeepLabv3+ variants) for the classification of five tree species in a tropical urban setting using aerial photographs, reaching an accuracy of 86%.
Branson et al. [98] used a convolutional neural network (CNN) architecture for both the recognition of trees and the classification of the detected trees from Street View imagery. Interestingly, in their study, Street View imagery was combined with aerial imagery to improve the classification accuracy, whereby the challenge (in part) lay in fusing both data sources.
4. Discussion
The objective of this review paper was to give an overview of the state of the art on the mapping of urban vegetation from high-resolution remote sensing data, with an emphasis on the methodological aspects of the mapping. Conceptually, urban vegetation mapping involves three decisions: (a) the choice of a suitable vegetation typology, (b) the selection of (a combination of) remote sensing data for the task at hand and (c) the mapping method to be used. Clearly, the three aspects are interrelated in the sense that restrictions imposed by remote sensing data characteristics and data availability, as well as limitations of current mapping approaches, will determine to what extent differentiation between various urban vegetation types or species can be achieved.
Two broad approaches in urban vegetation mapping could be identified. Studies either focus on the structural and/or functional characteristics of the vegetation (e.g., woody versus herbaceous, deciduous versus evergreen, broadleaf versus needleleaf, hedges versus compact vegetation patches, etc.) or on taxonomy. In the former, the definition of classes and the level of detail may strongly vary depending on the application, where the focus on particular ecosystem services of vegetation is often the determining factor for the proposed typology [12,30,44]. In the case of taxonomy-based mapping, the majority of studies focus on the mapping of tree species or genera (e.g., [66,108]). Very often, these studies are limited to only a few of the most prevailing tree species that occur within an urban area. Small trees or uncommon species are often omitted, which might give a biased view on the accuracies attained in the mapping of urban forests. Thus far, only a few studies have focused on the prevalence of non-tree plants in the urban environment, despite their important contribution to the urban ecosystem [122,123]. As such, additional research on the detailed mapping of non-tree and understory vegetation in the urban environment is necessary to gain a more complete understanding of the rendered services. We also notice that, for both trees and understory plants, the number of studies focusing on the presence of vegetation in the private domain is still fairly limited. Acquiring knowledge on private green is important as many cities contain a larger amount of private than public green [124], making it an important part of the urban ecosystem and crucial in making cities more resilient against future environmental challenges [125].
The choice of vegetation classes required for a specific application will influence the input data of choice. Broadly, two types of sensors are commonly used for urban vegetation mapping: optical sensors and LiDAR. For optical imagery, both spectral and spatial resolution are important. The mapping of functional green types or green infrastructure does not always require a very high spatial resolution since single plants are grouped together, creating larger spatial units that can be mapped from imagery with a resolution that is coarser than 3 m [36,73,74]. However, for the mapping of individual plants, the use of higher-resolution imagery is required to limit the complex background contamination that occurs in an urban environment [53]. Additionally, it should also be noted that the datasets used in the reported studies on the mapping of urban trees often only contain mature trees, limiting the variation in shape and size compared to what is observed in the field [18,54,71]. Demands with respect to the required spatial resolution may thus be higher if atypical and/or small tree exemplars are included. In terms of spectral resolution, both multi- and hyperspectral imagery has been utilized for urban vegetation mapping. More detailed spectral information generally provides better results, especially for the mapping of thematically more detailed information [30,53,69]. However, improvements with hyperspectral imagery may be limited if the multispectral imagery captures information in the appropriate parts of the spectrum [17].
Information obtained from airborne LiDAR data can be used on its own to differentiate different types of vegetation. However, the fusion of spectral and LiDAR data, combining the potential of both data sources, has become an increasingly common and quite successful approach for the detailed mapping of urban vegetation. The use of LiDAR data not only improves the segmentation of vegetation objects. It complements spectral data with structural and intensity-related information that is often found crucial in discriminating different vegetation types in an urban setting. Moreover, the intensity of the return signal may provide valuable information [62].
Optical sensors and LiDAR sensors can be mounted on airborne as well as terrestrial platforms, both offering a different perspective. The fusion of top-down imagery with information captured by terrestrial sensors, integrating various viewpoints, has been shown to be a promising way of obtaining more detailed information on vegetation objects [98]. Large quantities of publicly available street-level imagery, as provided by Google Street View, have huge potential for research on the use of this type of imagery for inventorying and managing urban street green across different types of urban environments. The combined use of close-range photogrammetry and LiDAR has shown promising results in related fields [104,105] but is not yet established for the detailed mapping of urban vegetation.
Capturing the phenological differences between vegetation types or species through the use of multi-temporal imagery is a well-known mapping approach in global vegetation studies and in monitoring vegetation in rural environments. However, it also proves to be a promising method for improving vegetation differentiation and for monitoring vegetation species in urban settings [66,73,79]. The challenge here lies in selecting a data source (or combining different sources) offering an adequate temporal resolution to capture imagery at multiple times throughout the year while, at the same time, having a spatial and spectral resolution that is sufficiently high. Improvements in cycle revisit time offered by new-generation sensors (e.g., PlanetScope) and the potential of combining this type of data with complementary data sources, adding detailed spectral and structural information, is a promising avenue for future research.
In terms of methods, various classification approaches have been used by researchers for mapping urban vegetation. Traditional supervised learning algorithms remain very popular in the field. Object-based as opposed to pixel-based mapping approaches are often preferred by researchers due to the ability to extract features at the level of urban vegetation objects or vegetation patches. Making use of predefined features ensures the more general applicability and interpretability of the methodology and can improve the classification results by removing noise from the feature space. However, inductive feature extraction is increasingly preferred as an alternative to the use of predefined features, especially in rich data environments. Unsupervised feature extraction techniques (e.g., principal component analysis, minimum noise transformation, etc.) have been used widely, especially with hyperspectral imagery, due to their ability to extract the most useful features in relation to the variance present in the dataset at hand [18,69]. Recently, deep learning has emerged as a promising strategy to perform automated feature extraction in a supervised manner. In recent years, CNN architectures have gained increasing attention in the remote sensing field, and they hold potential for urban vegetation mapping as they allow the learning model to simultaneously extract both spatial and spectral information. The increased complexity of the hidden representation that can be achieved by these models is especially interesting for its generalization capacity, possibly allowing one to handle a larger number of vegetation classes across multiple sites. However, a lot of labeled data are required to obtain good results with deep learning approaches, which can be challenging. While private green makes up a large part of the urban space, there is clearly a lack of sufficient, high-quality reference data for these green areas. Citizen science approaches can be a useful tool to bridge the data gap, although bias might be present in the gathered data. A lack of knowledge on the side of the participants might introduce errors into the data that are difficult to quantify [17].
Several machine learning techniques that are popular in other fields of study have been scarcely used in the field of urban vegetation mapping. Active learning approaches have hardly been explored, despite their acknowledged benefits in the classification of remote sensing data [126]. For vegetation in the public sphere (e.g., mapping of street trees), the ease of acquiring additional labels is often larger than in a natural or rural setting, making it suitable for applying an active learning approach. Data-driven approaches through unsupervised learning (e.g., [127]) or semi-supervised learning (e.g., [128]) can be very useful when there is a lack of labeled data. A multi-level unsupervised learning approach can reveal meaningful levels of separability in the data without adhering to strict taxonomic levels [62] or being limited by a lack of labeled samples for one subgroup. Moreover, the use of deep learning approaches for advanced feature extraction remains limited. The recent development of various new network architectures can be leveraged and adapted to improve mapping results using the urban datasets that are currently available. One example is the use of self-attention for multi-temporal image analysis and the modeling of vegetation phenology [129].
5. Conclusions
Over the last two decades, mapping of urban vegetation from high-resolution image data has gained increasing interest among scholars. This literature review provides an overview of studies in this field in the period 2000–2021. The literature was analyzed along three dimensions: (a) the vegetation typology chosen, (b) the remote sensing data used and (c) the mapping method applied. Typologies used for mapping urban vegetation vary widely among scholars, depending on the intended use of the map product. Nevertheless, a distinction can be made between studies focusing on the mapping of functional vegetation types, linked to their role in the urban ecosystem, and taxonomy-based vegetation mapping, the latter being mainly concerned with the mapping of tree species or genera. The overview of studies highlights the potential and the limitations of different types of spaceborne, airborne and terrestrial sensors for urban vegetation mapping, both in terms of image acquisition technology and in terms of sensor characteristics (spectral, spatial and temporal resolution). It also demonstrates the merits of combining different types of sources, with each data source providing complementary information on the biophysical and structural characteristics of the vegetation.
Traditional supervised learning remains the most popular approach for the mapping of vegetation in an urban environment. If sufficient reference data are available, non-parametric classifiers tend to perform better than parametric classifiers, with SVM and decision tree classifiers being the most commonly used mapping approaches. Nevertheless, as in other fields of research, deep learning methods have gained popularity in recent years. Recent studies show that these techniques provide added value for thematically detailed vegetation mapping using high-resolution imagery and for mapping approaches combining different types of source data. With the growing awareness of the role of urban vegetation as a provider of multiple ecosystem services, and the increasing number of complimentary data sources available for urban mapping, applications in the field of urban vegetation mapping are likely to grow rapidly in the coming years. Currently, most taxonomy-based mapping efforts lack sufficient accuracy and completeness to warrant their use in detailed ecosystem service analysis studies. Nevertheless, new developments in imaging technology and data science offer great promise for the production of virtual urban green inventories, supporting the management of green spaces at the city-wide scale.
Author Contributions
Conceptualization, R.N. and F.C.; Methodology, R.N.; Formal Analysis, R.N.; Investigation, R.N.; Writing—Original Draft Preparation, R.N.; Writing—Review and Editing, F.C.; Visualization, R.N.; Supervision, F.C.; Project Administration, F.C. All authors have read and agreed to the published version of the manuscript.
Funding
This research received no external funding.
Conflicts of Interest
The authors declare no conflict of interest.
References
- Nutsford, D.; Pearson, A.; Kingham, S. An ecological study investigating the association between access to urban green space and mental health. Public Health 2013, 127, 1005–1011. [Google Scholar] [CrossRef]
- Bastian, O.; Haase, D.; Grunewald, K. Ecosystem properties, potentials and services–The EPPS conceptual framework and an urban application example. Ecol. Indic. 2012, 21, 7–16. [Google Scholar] [CrossRef]
- Dimoudi, A.; Nikolopoulou, M. Vegetation in the urban environment: Microclimatic analysis and benefits. Energy Build. 2003, 35, 69–76. [Google Scholar] [CrossRef] [Green Version]
- Nowak, D.J.; Crane, D.E. Carbon storage and sequestration by urban trees in the USA. Environ. Pollut. 2002, 116, 381–389. [Google Scholar] [CrossRef]
- De Carvalho, R.M.; Szlafsztein, C.F. Urban vegetation loss and ecosystem services: The influence on climate regulation and noise and air pollution. Environ. Pollut. 2019, 245, 844–852. [Google Scholar] [CrossRef] [PubMed]
- Susca, T.; Gaffin, S.R.; Dell’Osso, G. Positive effects of vegetation: Urban heat island and green roofs. Environ. Pollut. 2011, 159, 2119–2126. [Google Scholar] [CrossRef]
- Cadenasso, M.L.; Pickett, S.T.; Grove, M.J. Integrative approaches to investigating human-natural systems: The Baltimore ecosystem study. Nat. Sci. Soc. 2006, 14, 4–14. [Google Scholar] [CrossRef]
- Pickett, S.T.; Cadenasso, M.L.; Grove, J.M.; Boone, C.G.; Groffman, P.M.; Irwin, E.; Kaushal, S.S.; Marshall, V.; McGrath, B.P.; Nilon, C.H.; et al. Urban ecological systems: Scientific foundations and a decade of progress. J. Environ. Manag. 2011, 92, 331–362. [Google Scholar] [CrossRef]
- Escobedo, F.J.; Kroeger, T.; Wagner, J.E. Urban forests and pollution mitigation: Analyzing ecosystem services and disservices. Environ. Pollut. 2011, 159, 2078–2087. [Google Scholar] [CrossRef]
- Gillner, S.; Vogt, J.; Tharang, A.; Dettmann, S.; Roloff, A. Role of street trees in mitigating effects of heat and drought at highly sealed urban sites. Landsc. Urban Plan. 2015, 143, 33–42. [Google Scholar] [CrossRef]
- Drillet, Z.; Fung, T.K.; Leong, R.A.T.; Sachidhanandam, U.; Edwards, P.; Richards, D. Urban vegetation types are not perceived equally in providing ecosystem services and disservices. Sustainability 2020, 12, 2076. [Google Scholar] [CrossRef] [Green Version]
- Bartesaghi-Koc, C.; Osmond, P.; Peters, A. Mapping and classifying green infrastructure typologies for climate-related studies based on remote sensing data. Urban For. Urban Green. 2019, 37, 154–167. [Google Scholar] [CrossRef]
- Sæbø, A.; Popek, R.; Nawrot, B.; Hanslin, H.M.; Gawronska, H.; Gawronski, S. Plant species differences in particulate matter accumulation on leaf surfaces. Sci. Total Environ. 2012, 427, 347–354. [Google Scholar] [CrossRef]
- Roy, S.; Byrne, J.; Pickering, C. A systematic quantitative review of urban tree benefits, costs, and assessment methods across cities in different climatic zones. Urban For. Urban Green. 2012, 11, 351–363. [Google Scholar] [CrossRef] [Green Version]
- Eisenman, T.S.; Churkina, G.; Jariwala, S.P.; Kumar, P.; Lovasi, G.S.; Pataki, D.E.; Weinberger, K.R.; Whitlow, T.H. Urban trees, air quality, and asthma: An interdisciplinary review. Landsc. Urban Plan. 2019, 187, 47–59. [Google Scholar] [CrossRef]
- Raupp, M.J.; Cumming, A.B.; Raupp, E.C. Street Tree Diversity in Eastern North America and Its Potential for Tree Loss to Exotic Borers. Arboric. Urban For. 2006, 32, 297–304. [Google Scholar] [CrossRef]
- Baker, F.; Smith, C.L.; Cavan, G. A combined approach to classifying land surface cover of urban domestic gardens using citizen science data and high resolution image analysis. Remote Sens. 2018, 10, 537. [Google Scholar] [CrossRef] [Green Version]
- Alonzo, M.; Bookhagen, B.; Roberts, D.A. Urban tree species mapping using hyperspectral and lidar data fusion. Remote Sens. Environ. 2014, 148, 70–83. [Google Scholar] [CrossRef]
- Walter, V. Object-based classification of remote sensing data for change detection. ISPRS J. Photogramm. Remote Sens. 2004, 58, 225–238. [Google Scholar] [CrossRef]
- Iovan, C.; Boldo, D.; Cord, M. Detection, characterization, and modeling vegetation in urban areas from high-resolution aerial imagery. IEEE J. Sel. Top. Appl. Earth Obs. Remote Sens. 2008, 1, 206–213. [Google Scholar] [CrossRef]
- Adeline, K.R.; Chen, M.; Briottet, X.; Pang, S.; Paparoditis, N. Shadow detection in very high spatial resolution aerial images: A comparative study. ISPRS J. Photogramm. Remote Sens. 2013, 80, 21–38. [Google Scholar] [CrossRef]
- Van der Linden, S.; Hostert, P. The influence of urban structures on impervious surface maps from airborne hyperspectral data. Remote Sens. Environ. 2009, 113, 2298–2305. [Google Scholar] [CrossRef]
- Li, D.; Ke, Y.; Gong, H.; Chen, B.; Zhu, L. Tree species classification based on WorldView-2 imagery in complex urban environment. In Proceedings of the 2014 Third International Workshop on Earth Observation and Remote Sensing Applications (EORSA), Changsha, China, 11–14 June 2014; pp. 326–330. [Google Scholar]
- Shahtahmassebi, A.; Li, C.; Fan, Y.; Wu, Y.; Gan, M.; Wang, K.; Malik, A.; Blackburn, A. Remote sensing of urban green spaces: A review. Urban For. Urban Green. 2020, 57, 126946. [Google Scholar] [CrossRef]
- Wang, K.; Wang, T.; Liu, X. A review: Individual tree species classification using integrated airborne LiDAR and optical imagery with a focus on the urban environment. Forests 2019, 10, 1. [Google Scholar] [CrossRef] [Green Version]
- Fassnacht, F.E.; Latifi, H.; Stereńczak, K.; Modzelewska, A.; Lefsky, M.; Waser, L.T.; Straub, C.; Ghosh, A. Review of studies on tree species classification from remotely sensed data. Remote Sens. Environ. 2016, 186, 64–87. [Google Scholar] [CrossRef]
- Smith, T.; Shugart, H.; Woodward, F.; Burton, P. Plant functional types. In Vegetation Dynamics & Global Change; Springer: Berlin/Heidelberg, Germany, 1993; pp. 272–292. [Google Scholar]
- Ecosystem Services and Green Infrastructure. Available online: https://ec.europa.eu/environment/nature/ecosystems/index_en.htm (accessed on 14 April 2021).
- Taylor, L.; Hochuli, D.F. Defining greenspace: Multiple uses across multiple disciplines. Landsc. Urban Plan. 2017, 158, 25–38. [Google Scholar] [CrossRef] [Green Version]
- Degerickx, J.; Hermy, M.; Somers, B. Mapping Functional Urban Green Types Using High Resolution Remote Sensing Data. Sustainability 2020, 12, 2144. [Google Scholar] [CrossRef] [Green Version]
- Adamson, R. The classification of life-forms of plants. Bot. Rev. 1939, 5, 546–561. [Google Scholar] [CrossRef]
- Yapp, G.; Walker, J.; Thackway, R. Linking vegetation type and condition to ecosystem goods and services. Ecol. Complex. 2010, 7, 292–301. [Google Scholar] [CrossRef]
- Weber, C.; Petropoulou, C.; Hirsch, J. Urban development in the Athens metropolitan area using remote sensing data with supervised analysis and GIS. Int. J. Remote Sens. 2005, 26, 785–796. [Google Scholar] [CrossRef]
- Hermosilla, T.; Palomar-Vázquez, J.; Balaguer-Beser, Á.; Balsa-Barreiro, J.; Ruiz, L.A. Using street based metrics to characterize urban typologies. Comput. Environ. Urban Syst. 2014, 44, 68–79. [Google Scholar] [CrossRef] [Green Version]
- Walde, I.; Hese, S.; Berger, C.; Schmullius, C. From land cover-graphs to urban structure types. Int. J. Geogr. Inf. Sci. 2014, 28, 584–609. [Google Scholar] [CrossRef]
- Mathieu, R.; Aryal, J.; Chong, A.K. Object-based classification of Ikonos imagery for mapping large-scale vegetation communities in urban areas. Sensors 2007, 7, 2860–2880. [Google Scholar] [CrossRef] [Green Version]
- Millennium ecosystem assessment, M. Ecosystems and Human Well-Being; Island Press: Washington, DC, USA, 2005; Volume 5. [Google Scholar]
- Freeman, C.; Buck, O. Development of an ecological mapping methodology for urban areas in New Zealand. Landsc. Urban Plan. 2003, 63, 161–173. [Google Scholar] [CrossRef]
- Anderson, J.R. A Land Use and Land Cover Classification System for Use with Remote Sensor Data; US Government Printing Office: Washington, DC, USA, 1976; Volume 964.
- Stewart, I.D.; Oke, T.R. Local climate zones for urban temperature studies. Bull. Am. Meteorol. Soc. 2012, 93, 1879–1900. [Google Scholar] [CrossRef]
- Cadenasso, M.; Pickett, S.; McGrath, B.; Marshall, V. Ecological heterogeneity in urban ecosystems: Reconceptualized land cover models as a bridge to urban design. In Resilience in Ecology and Urban Design; Springer: Berlin/Heidelberg, Germany, 2013; pp. 107–129. [Google Scholar]
- Lehmann, I.; Mathey, J.; Rößler, S.; Bräuer, A.; Goldberg, V. Urban vegetation structure types as a methodological approach for identifying ecosystem services–Application to the analysis of micro-climatic effects. Ecol. Indic. 2014, 42, 58–72. [Google Scholar] [CrossRef]
- Gill, S.E.; Handley, J.F.; Ennos, A.R.; Pauleit, S. Adapting cities for climate change: The role of the green infrastructure. Built Environ. 2007, 33, 115–133. [Google Scholar] [CrossRef] [Green Version]
- Kopecká, M.; Szatmári, D.; Rosina, K. Analysis of urban green spaces based on Sentinel-2A: Case studies from Slovakia. Land 2017, 6, 25. [Google Scholar] [CrossRef] [Green Version]
- Van Delm, A.; Gulinck, H. Classification and quantification of green in the expanding urban and semi-urban complex: Application of detailed field data and IKONOS-imagery. Ecol. Indic. 2011, 11, 52–60. [Google Scholar] [CrossRef]
- Zhang, X.; Feng, X.; Jiang, H. Object-oriented method for urban vegetation mapping using IKONOS imagery. Int. J. Remote Sens. 2010, 31, 177–196. [Google Scholar] [CrossRef]
- Liu, T.; Yang, X. Mapping vegetation in an urban area with stratified classification and multiple endmember spectral mixture analysis. Remote Sens. Environ. 2013, 133, 251–264. [Google Scholar] [CrossRef]
- Tong, X.; Li, X.; Xu, X.; Xie, H.; Feng, T.; Sun, T.; Jin, Y.; Liu, X. A two-phase classification of urban vegetation using airborne LiDAR data and aerial photography. IEEE J. Sel. Top. Appl. Earth Obs. Remote Sens. 2014, 7, 4153–4166. [Google Scholar] [CrossRef]
- Kranjčić, N.; Medak, D.; Župan, R.; Rezo, M. Machine learning methods for classification of the green infrastructure in city areas. ISPRS Int. J. Geo-Inf. 2019, 8, 463. [Google Scholar] [CrossRef] [Green Version]
- Kothencz, G.; Kulessa, K.; Anyyeva, A.; Lang, S. Urban vegetation extraction from VHR (tri-) stereo imagery—A comparative study in two central European cities. Eur. J. Remote Sens. 2018, 51, 285–300. [Google Scholar] [CrossRef] [Green Version]
- Li, X.; Shao, G. Object-based urban vegetation mapping with high-resolution aerial photography as a single data source. Int. J. Remote Sens. 2013, 34, 771–789. [Google Scholar] [CrossRef]
- Wania, A.; Weber, C. Hyperspectral imagery and urban green observation. In Proceedings of the 2007 Urban Remote Sensing Joint Event, Paris, France, 11–13 April 2007; pp. 1–8. [Google Scholar]
- Pu, R.; Landry, S. A comparative analysis of high spatial resolution IKONOS and WorldView-2 imagery for mapping urban tree species. Remote Sens. Environ. 2012, 124, 516–533. [Google Scholar] [CrossRef]
- Jensen, R.R.; Hardin, P.J.; Hardin, A.J. Classification of urban tree species using hyperspectral imagery. Geocarto Int. 2012, 27, 443–458. [Google Scholar] [CrossRef]
- Hartling, S.; Sagan, V.; Sidike, P.; Maimaitijiang, M.; Carron, J. Urban tree species classification using a WorldView-2/3 and LiDAR data fusion approach and deep learning. Sensors 2019, 19, 1284. [Google Scholar] [CrossRef] [Green Version]
- Katz, D.S.; Batterman, S.A.; Brines, S.J. Improved Classification of Urban Trees Using a Widespread Multi-Temporal Aerial Image Dataset. Remote Sens. 2020, 12, 2475. [Google Scholar] [CrossRef]
- Tigges, J.; Lakes, T.; Hostert, P. Urban vegetation classification: Benefits of multitemporal RapidEye satellite data. Remote Sens. Environ. 2013, 136, 66–75. [Google Scholar] [CrossRef]
- Sugumaran, R.; Pavuluri, M.K.; Zerr, D. The use of high-resolution imagery for identification of urban climax forest species using traditional and rule-based classification approach. IEEE Trans. Geosci. Remote Sens. 2003, 41, 1933–1939. [Google Scholar] [CrossRef]
- Gu, H.; Singh, A.; Townsend, P.A. Detection of gradients of forest composition in an urban area using imaging spectroscopy. Remote Sens. Environ. 2015, 167, 168–180. [Google Scholar] [CrossRef]
- Zhang, K.; Hu, B. Individual urban tree species classification using very high spatial resolution airborne multi-spectral imagery using longitudinal profiles. Remote Sens. 2012, 4, 1741–1757. [Google Scholar] [CrossRef] [Green Version]
- Xiao, Q.; Ustin, S.; McPherson, E. Using AVIRIS data and multiple-masking techniques to map urban forest tree species. Int. J. Remote Sens. 2004, 25, 5637–5654. [Google Scholar] [CrossRef] [Green Version]
- Kim, S.; Hinckley, T.; Briggs, D. Classifying individual tree genera using stepwise cluster analysis based on height and intensity metrics derived from airborne laser scanner data. Remote Sens. Environ. 2011, 115, 3329–3342. [Google Scholar] [CrossRef]
- Matasci, G.; Coops, N.C.; Williams, D.A.; Page, N. Mapping tree canopies in urban environments using airborne laser scanning (ALS): A Vancouver case study. For. Ecosyst. 2018, 5, 31. [Google Scholar] [CrossRef] [Green Version]
- Liu, L.; Coops, N.C.; Aven, N.W.; Pang, Y. Mapping urban tree species using integrated airborne hyperspectral and LiDAR remote sensing data. Remote Sens. Environ. 2017, 200, 170–182. [Google Scholar] [CrossRef]
- Alonzo, M.; Roth, K.; Roberts, D. Identifying Santa Barbara’s urban tree species from AVIRIS imagery using canonical discriminant analysis. Remote Sens. Lett. 2013, 4, 513–521. [Google Scholar] [CrossRef]
- Fang, F.; McNeil, B.E.; Warner, T.A.; Maxwell, A.E.; Dahle, G.A.; Eutsler, E.; Li, J. Discriminating tree species at different taxonomic levels using multi-temporal WorldView-3 imagery in Washington DC, USA. Remote Sens. Environ. 2020, 246, 111811. [Google Scholar] [CrossRef]
- Shouse, M.; Liang, L.; Fei, S. Identification of understory invasive exotic plants with remote sensing in urban forests. Int. J. Appl. Earth Obs. Geoinf. 2013, 21, 525–534. [Google Scholar] [CrossRef]
- Chance, C.M.; Coops, N.C.; Plowright, A.A.; Tooke, T.R.; Christen, A.; Aven, N. Invasive shrub mapping in an urban environment from hyperspectral and LiDAR-derived attributes. Front. Plant Sci. 2016, 7, 1528. [Google Scholar] [CrossRef] [Green Version]
- Mozgeris, G.; Juodkienė, V.; Jonikavičius, D.; Straigytė, L.; Gadal, S.; Ouerghemmi, W. Ultra-light aircraft-based hyperspectral and colour-infrared imaging to identify deciduous tree species in an urban environment. Remote Sens. 2018, 10, 1668. [Google Scholar] [CrossRef] [Green Version]
- Li, D.; Ke, Y.; Gong, H.; Li, X. Object-based urban tree species classification using bi-temporal WorldView-2 and WorldView-3 images. Remote Sens. 2015, 7, 16917–16937. [Google Scholar] [CrossRef] [Green Version]
- Voss, M.; Sugumaran, R. Seasonal effect on tree species classification in an urban environment using hyperspectral data, LiDAR, and an object-oriented approach. Sensors 2008, 8, 3020–3036. [Google Scholar] [CrossRef] [Green Version]
- Puttonen, E.; Litkey, P.; Hyyppä, J. Individual tree species classification by illuminated—Shaded area separation. Remote Sens. 2010, 2, 19–35. [Google Scholar] [CrossRef] [Green Version]
- Xu, Z.; Zhou, Y.; Wang, S.; Wang, L.; Li, F.; Wang, S.; Wang, Z. A novel intelligent classification method for urban green space based on high-resolution remote sensing images. Remote Sens. 2020, 12, 3845. [Google Scholar] [CrossRef]
- Pu, R.; Landry, S.; Yu, Q. Object-based urban detailed land cover classification with high spatial resolution IKONOS imagery. Int. J. Remote Sens. 2011, 32, 3285–3308. [Google Scholar] [CrossRef] [Green Version]
- Tooke, T.R.; Coops, N.C.; Goodwin, N.R.; Voogt, J.A. Extracting urban vegetation characteristics using spectral mixture analysis and decision tree classifications. Remote Sens. Environ. 2009, 113, 398–407. [Google Scholar] [CrossRef]
- Le Louarn, M.; Clergeau, P.; Briche, E.; Deschamps-Cottin, M. “Kill Two birds with one stone”: Urban tree species classification using bi-temporal pléiades images to study nesting preferences of an invasive bird. Remote Sens. 2017, 9, 916. [Google Scholar] [CrossRef] [Green Version]
- Pu, R.; Landry, S.; Yu, Q. Assessing the potential of multi-seasonal high resolution Pléiades satellite imagery for mapping urban tree species. Int. J. Appl. Earth Obs. Geoinf. 2018, 71, 144–158. [Google Scholar] [CrossRef]
- Di, S.; Li, Z.L.; Tang, R.; Pan, X.; Liu, H.; Niu, Y. Urban green space classification and water consumption analysis with remote-sensing technology: A case study in Beijing, China. Int. J. Remote Sens. 2019, 40, 1909–1929. [Google Scholar] [CrossRef]
- Yan, J.; Zhou, W.; Han, L.; Qian, Y. Mapping vegetation functional types in urban areas with WorldView-2 imagery: Integrating object-based classification with phenology. Urban For. Urban Green. 2018, 31, 230–240. [Google Scholar] [CrossRef]
- Zhang, Z.; Kazakova, A.; Moskal, L.M.; Styers, D.M. Object-based tree species classification in urban ecosystems using LiDAR and hyperspectral data. Forests 2016, 7, 122. [Google Scholar] [CrossRef] [Green Version]
- Zhang, C.; Qiu, F. Mapping individual tree species in an urban forest using airborne lidar data and hyperspectral imagery. Photogramm. Eng. Remote Sens. 2012, 78, 1079–1087. [Google Scholar] [CrossRef] [Green Version]
- Abdollahi, A.; Pradhan, B. Urban Vegetation Mapping from Aerial Imagery Using Explainable AI (XAI). Sensors 2021, 21, 4738. [Google Scholar] [CrossRef]
- Martins, G.B.; La Rosa, L.E.C.; Happ, P.N.; Coelho Filho, L.C.T.; Santos, C.J.F.; Feitosa, R.Q.; Ferreira, M.P. Deep learning-based tree species mapping in a highly diverse tropical urban setting. Urban For. Urban Green. 2021, 64, 127241. [Google Scholar] [CrossRef]
- Lobo Torres, D.; Queiroz Feitosa, R.; Nigri Happ, P.; Elena Cue La Rosa, L.; Marcato Junior, J.; Martins, J.; Ola Bressan, P.; Gonçalves, W.N.; Liesenberg, V. Applying fully convolutional architectures for semantic segmentation of a single tree species in urban environment on high resolution UAV optical imagery. Sensors 2020, 20, 563. [Google Scholar] [CrossRef] [Green Version]
- Zhang, C.; Xia, K.; Feng, H.; Yang, Y.; Du, X. Tree species classification using deep learning and RGB optical images obtained by an unmanned aerial vehicle. J. For. Res. 2020, 32, 1879–1888. [Google Scholar] [CrossRef]
- Wang, J.; Banzhaf, E. Derive an understanding of Green Infrastructure for the quality of life in cities by means of integrated RS mapping tools. In Proceedings of the 2017 Joint Urban Remote Sensing Event (JURSE), Dubai, United Arab Emirates, 6–8 March 2017; pp. 1–4. [Google Scholar]
- Hermosilla, T.; Ruiz, L.A.; Recio, J.A.; Balsa-Barreiro, J. Land-use mapping of Valencia city area from aerial images and LiDAR data. In Proceedings of the GEOProcessing 2012: The Fourth International Conference in Advanced Geographic Information Systems, Applications and Services, Valencia, Spain, 30 January 30–4 February 2012; pp. 232–237. [Google Scholar]
- Zhou, J.; Qin, J.; Gao, K.; Leng, H. SVM-based soft classification of urban tree species using very high-spatial resolution remote-sensing imagery. Int. J. Remote Sens. 2016, 37, 2541–2559. [Google Scholar] [CrossRef]
- Mozgeris, G.; Gadal, S.; Jonikavičius, D.; Straigytė, L.; Ouerghemmi, W.; Juodkienė, V. Hyperspectral and color-infrared imaging from ultralight aircraft: Potential to recognize tree species in urban environments. In Proceedings of the 2016 8th Workshop on Hyperspectral Image and Signal Processing: Evolution in Remote Sensing (WHISPERS), Los Angeles, CA, USA, 21–24 August 2016; pp. 1–5. [Google Scholar]
- Ma, J.; Yu, W.; Chen, C.; Liang, P.; Guo, X.; Jiang, J. Pan-GAN: An unsupervised pan-sharpening method for remote sensing image fusion. Inf. Fusion 2020, 62, 110–120. [Google Scholar] [CrossRef]
- Persson, Å.; Holmgren, J.; Söderman, U.; Olsson, H. Tree species classification of individual trees in Sweden by combining high resolution laser data with high resolution near-infrared digital images. Int. Arch. Photogramm. Remote Sens. Spat. Inf. Sci. 2004, 36, 204–207. [Google Scholar]
- Li, J.; Hu, B.; Noland, T.L. Classification of tree species based on structural features derived from high density LiDAR data. Agric. For. Meteorol. 2013, 171, 104–114. [Google Scholar] [CrossRef]
- Burr, A.; Schaeg, N.; Hall, D.M. Assessing residential front yards using Google Street View and geospatial video: A virtual survey approach for urban pollinator conservation. Appl. Geogr. 2018, 92, 12–20. [Google Scholar] [CrossRef]
- Richards, D.R.; Edwards, P.J. Quantifying street tree regulating ecosystem services using Google Street View. Ecol. Indic. 2017, 77, 31–40. [Google Scholar] [CrossRef]
- Seiferling, I.; Naik, N.; Ratti, C.; Proulx, R. Green streets- Quantifying and mapping urban trees with street-level imagery and computer vision. Landsc. Urban Plan. 2017, 165, 93–101. [Google Scholar] [CrossRef]
- Berland, A.; Lange, D.A. Google Street View shows promise for virtual street tree surveys. Urban For. Urban Green. 2017, 21, 11–15. [Google Scholar] [CrossRef]
- Berland, A.; Roman, L.A.; Vogt, J. Can field crews telecommute? Varied data quality from citizen science tree inventories conducted using street-level imagery. Forests 2019, 10, 349. [Google Scholar] [CrossRef] [Green Version]
- Branson, S.; Wegner, J.D.; Hall, D.; Lang, N.; Schindler, K.; Perona, P. From Google Maps to a fine-grained catalog of street trees. ISPRS J. Photogramm. Remote Sens. 2018, 135, 13–30. [Google Scholar] [CrossRef] [Green Version]
- Puttonen, E.; Jaakkola, A.; Litkey, P.; Hyyppä, J. Tree classification with fused mobile laser scanning and hyperspectral data. Sensors 2011, 11, 5158–5182. [Google Scholar] [CrossRef]
- Chen, Y.; Wang, S.; Li, J.; Ma, L.; Wu, R.; Luo, Z.; Wang, C. Rapid urban roadside tree inventory using a mobile laser scanning system. IEEE J. Sel. Top. Appl. Earth Obs. Remote Sens. 2019, 12, 3690–3700. [Google Scholar] [CrossRef]
- Wu, J.; Yao, W.; Polewski, P. Mapping individual tree species and vitality along urban road corridors with LiDAR and imaging sensors: Point density versus view perspective. Remote Sens. 2018, 10, 1403. [Google Scholar] [CrossRef] [Green Version]
- Mokroš, M.; Liang, X.; Surovỳ, P.; Valent, P.; Čerňava, J.; Chudỳ, F.; Tunák, D.; Saloň, Š.; Merganič, J. Evaluation of close-range photogrammetry image collection methods for estimating tree diameters. ISPRS Int. J. Geo-Inf. 2018, 7, 93. [Google Scholar] [CrossRef] [Green Version]
- Balsa-Barreiro, J.; Fritsch, D. Generation of visually aesthetic and detailed 3D models of historical cities by using laser scanning and digital photogrammetry. Digit. Appl. Archaeol. Cult. Herit. 2018, 8, 57–64. [Google Scholar] [CrossRef]
- Kwong, I.H.; Fung, T. Tree height mapping and crown delineation using LiDAR, large format aerial photographs, and unmanned aerial vehicle photogrammetry in subtropical urban forest. Int. J. Remote Sens. 2020, 41, 5228–5256. [Google Scholar] [CrossRef]
- Ghanbari Parmehr, E.; Amati, M. Individual Tree Canopy Parameters Estimation Using UAV-Based Photogrammetric and LiDAR Point Clouds in an Urban Park. Remote Sens. 2021, 13, 2062. [Google Scholar] [CrossRef]
- Hill, R.; Wilson, A.; George, M.; Hinsley, S. Mapping tree species in temperate deciduous woodland using time-series multi-spectral data. Appl. Veg. Sci. 2010, 13, 86–99. [Google Scholar] [CrossRef]
- Polgar, C.A.; Primack, R.B. Leaf-out phenology of temperate woody plants: From trees to ecosystems. New Phytol. 2011, 191, 926–941. [Google Scholar] [CrossRef]
- Abbas, S.; Peng, Q.; Wong, M.S.; Li, Z.; Wang, J.; Ng, K.T.K.; Kwok, C.Y.T.; Hui, K.K.W. Characterizing and classifying urban tree species using bi-monthly terrestrial hyperspectral images in Hong Kong. ISPRS J. Photogramm. Remote Sens. 2021, 177, 204–216. [Google Scholar] [CrossRef]
- Feng, Q.; Liu, J.; Gong, J. UAV remote sensing for urban vegetation mapping using random forest and texture analysis. Remote Sens. 2015, 7, 1074–1094. [Google Scholar] [CrossRef] [Green Version]
- Wen, D.; Huang, X.; Liu, H.; Liao, W.; Zhang, L. Semantic classification of urban trees using very high resolution satellite imagery. IEEE J. Sel. Top. Appl. Earth Obs. Remote Sens. 2017, 10, 1413–1424. [Google Scholar] [CrossRef]
- Haralick, R.M.; Shanmugam, K.; Dinstein, I.H. Textural features for image classification. IEEE Trans. Syst. Man Cybern. 1973, SMC-3, 610–621. [Google Scholar] [CrossRef] [Green Version]
- Shojanoori, R.; Shafri, H.Z.; Mansor, S.; Ismail, M.H. The use of WorldView-2 satellite data in urban tree species mapping by object-based image analysis technique. Sains Malays. 2016, 45, 1025–1034. [Google Scholar]
- Clark, M.L.; Roberts, D.A.; Clark, D.B. Hyperspectral discrimination of tropical rain forest tree species at leaf to crown scales. Remote Sens. Environ. 2005, 96, 375–398. [Google Scholar] [CrossRef]
- Youjing, Z.; Hengtong, F. Identification scales for urban vegetation classification using high spatial resolution satellite data. In Proceedings of the 2007 IEEE International Geoscience and Remote Sensing Symposium, Barcelona, Spain, 23–27 July 2007; pp. 1472–1475. [Google Scholar]
- Li, C.; Yin, J.; Zhao, J. Extraction of urban vegetation from high resolution remote sensing image. In Proceedings of the 2010 International Conference On Computer Design and Applications, Qinhuangdao, China, 25–27 June 2010; Volume 4, pp. V4–V403. [Google Scholar]
- Wegner, J.D.; Branson, S.; Hall, D.; Schindler, K.; Perona, P. Cataloging public objects using aerial and street-level images-urban trees. In Proceedings of the IEEE Conference on Computer Vision and Pattern Recognition, Las Vegas, NV, USA, 27–30 June 2016; pp. 6014–6023. [Google Scholar]
- Huang, G.; Liu, Z.; Van Der Maaten, L.; Weinberger, K.Q. Densely connected convolutional networks. In Proceedings of the IEEE Conference on Computer Vision and Pattern Recognition, Honolulu, HI, USA, 21–26 July 2017; pp. 4700–4708. [Google Scholar]
- Shi, D.; Yang, X. Mapping vegetation and land cover in a large urban area using a multiple classifier system. Int. J. Remote Sens. 2017, 38, 4700–4721. [Google Scholar] [CrossRef]
- Degerickx, J.; Hermy, M.; Somers, B. Mapping functional urban green types using hyperspectral remote sensing. In Proceedings of the 2017 Joint Urban Remote Sensing Event (JURSE), Dubai, United Arab Emirates, 6–8 March 2017; pp. 1–4. [Google Scholar]
- Pontius, J.; Hanavan, R.P.; Hallett, R.A.; Cook, B.D.; Corp, L.A. High spatial resolution spectral unmixing for mapping ash species across a complex urban environment. Remote Sens. Environ. 2017, 199, 360–369. [Google Scholar] [CrossRef]
- Guan, H.; Yu, Y.; Ji, Z.; Li, J.; Zhang, Q. Deep learning-based tree classification using mobile LiDAR data. Remote Sens. Lett. 2015, 6, 864–873. [Google Scholar] [CrossRef]
- Blanusa, T.; Garratt, M.; Cathcart-James, M.; Hunt, L.; Cameron, R.W. Urban hedges: A review of plant species and cultivars for ecosystem service delivery in north-west Europe. Urban For. Urban Green. 2019, 44, 126391. [Google Scholar] [CrossRef]
- Klaus, V.H. Urban grassland restoration: A neglected opportunity for biodiversity conservation. Restor. Ecol. 2013, 21, 665–669. [Google Scholar] [CrossRef]
- Haase, D.; Jänicke, C.; Wellmann, T. Front and back yard green analysis with subpixel vegetation fractions from earth observation data in a city. Landsc. Urban Plan. 2019, 182, 44–54. [Google Scholar] [CrossRef]
- Cameron, R.W.; Blanuša, T.; Taylor, J.E.; Salisbury, A.; Halstead, A.J.; Henricot, B.; Thompson, K. The domestic garden–Its contribution to urban green infrastructure. Urban For. Urban Green. 2012, 11, 129–137. [Google Scholar] [CrossRef]
- Crawford, M.M.; Tuia, D.; Yang, H.L. Active learning: Any value for classification of remotely sensed data? Proc. IEEE 2013, 101, 593–608. [Google Scholar] [CrossRef] [Green Version]
- Chatterjee, A.; Saha, J.; Mukherjee, J.; Aikat, S.; Misra, A. Unsupervised land cover classification of hybrid and dual-polarized images using deep convolutional neural network. IEEE Geosci. Remote Sens. Lett. 2020, 18, 969–973. [Google Scholar] [CrossRef]
- Fang, B.; Li, Y.; Zhang, H.; Chan, J.C.W. Collaborative learning of lightweight convolutional neural network and deep clustering for hyperspectral image semi-supervised classification with limited training samples. ISPRS J. Photogramm. Remote Sens. 2020, 161, 164–178. [Google Scholar] [CrossRef]
- Sainte Fare Garnot, V.; Landrieu, L.; Giordano, S.; Chehata, N. Satellite Image Time Series Classification with Pixel-Set Encoders and Temporal Self-Attention. In Proceedings of the IEEE/CVF Conference on Computer Vision and Pattern Recognition, Seattle, WA, USA, 14–19 June 2020. [Google Scholar]
Figure 1.
Papers on urban green mapping published between 2000 and 2021 and included in the review.

Figure 2.
Overview of the number of papers per country/region (left) and of the different vegetation typologies that were addressed in these papers (right).
Figure 2.
Overview of the number of papers per country/region (left) and of the different vegetation typologies that were addressed in these papers (right).

Figure 3.
Overview of the different algorithms used in the reviewed studies. N refers to the number of papers adopting each of the classification approaches discussed.
Figure 3.
Overview of the different algorithms used in the reviewed studies. N refers to the number of papers adopting each of the classification approaches discussed.

Table 1.
Commonly used terminology in the field of urban remote sensing.
| Term | Explanation |
|---|---|
| Functional vegetation type | Or plant functional type (PFT) is a general term that groups plants according to their function in ecosystems and their use of resources. The term has gained popularity among researchers looking at the interaction between vegetation and climate change [27]. |
| Green infrastructure | Green infrastructure is defined by the European Commission as “a strategically planned network of natural and semi-natural areas with other environmental features designed and managed to deliver a wide range of ecosystem services such as water purification, air quality...” [28]. It is mostly used in the context of climate studies (e.g., [12]) and urban planning. |
| Green space | Green space is often defined in different ways in different disciplines. Two broad interpretations are identified by Taylor and Hochuli [29]: (a) as a synonym for nature or (b) explicitly as urban vegetation. Within the scope of this review study, the term will be used as a broad term for vegetated urban areas. |
| Urban green element | Assemblage of individual plants together providing similar functions and services [30]. |
| Vegetation life form | The similarities in structure and function of plant species allow them to be grouped into life forms. A life form is generally known to display an obvious relationship with important environmental factors, although many different interpretations exist [31]. |
| Vegetation species | Plants are taxonomically divided into families, genera, species, varieties, etc. For the mapping of trees, researchers often choose to focus on the taxonomic level of the species. |
| Vegetation type | Vegetation types can be defined at different levels, mainly depending on the set of characteristics used for discrimination. A proper scheme of vegetation types allows decision-makers and land managers to develop and apply appropriate land management practices [32]. Within the scope of urban vegetation mapping, the term is often used to indicate a broader distinction between plants that have either morphological or spectral similarities. The level of detail depends on the context of the study. |
Table 3.
Overview of the studies that include LiDAR in their analysis. Studies based on terrestrial laser scanning are not included in this table.
Publisher’s Note: MDPI stays neutral with regard to jurisdictional claims in published maps and institutional affiliations. |
© 2022 by the authors. Licensee MDPI, Basel, Switzerland. This article is an open access article distributed under the terms and conditions of the Creative Commons Attribution (CC BY) license (https://creativecommons.org/licenses/by/4.0/).
Share and Cite
MDPI and ACS Style
Neyns, R.; Canters, F. Mapping of Urban Vegetation with High-Resolution Remote Sensing: A Review. Remote Sens. 2022, 14, 1031. https://doi.org/10.3390/rs14041031
AMA Style
Neyns R, Canters F. Mapping of Urban Vegetation with High-Resolution Remote Sensing: A Review. Remote Sensing. 2022; 14(4):1031. https://doi.org/10.3390/rs14041031
Chicago/Turabian StyleNeyns, Robbe, and Frank Canters. 2022. "Mapping of Urban Vegetation with High-Resolution Remote Sensing: A Review" Remote Sensing 14, no. 4: 1031. https://doi.org/10.3390/rs14041031
Note that from the first issue of 2016, this journal uses article numbers instead of page numbers. See further details here.