
Estimation of Evapotranspiration in the Yellow River Basin from 2002 to 2020 Based on GRACE and GRACE Follow-On Observations


Abstract
:1. Introduction
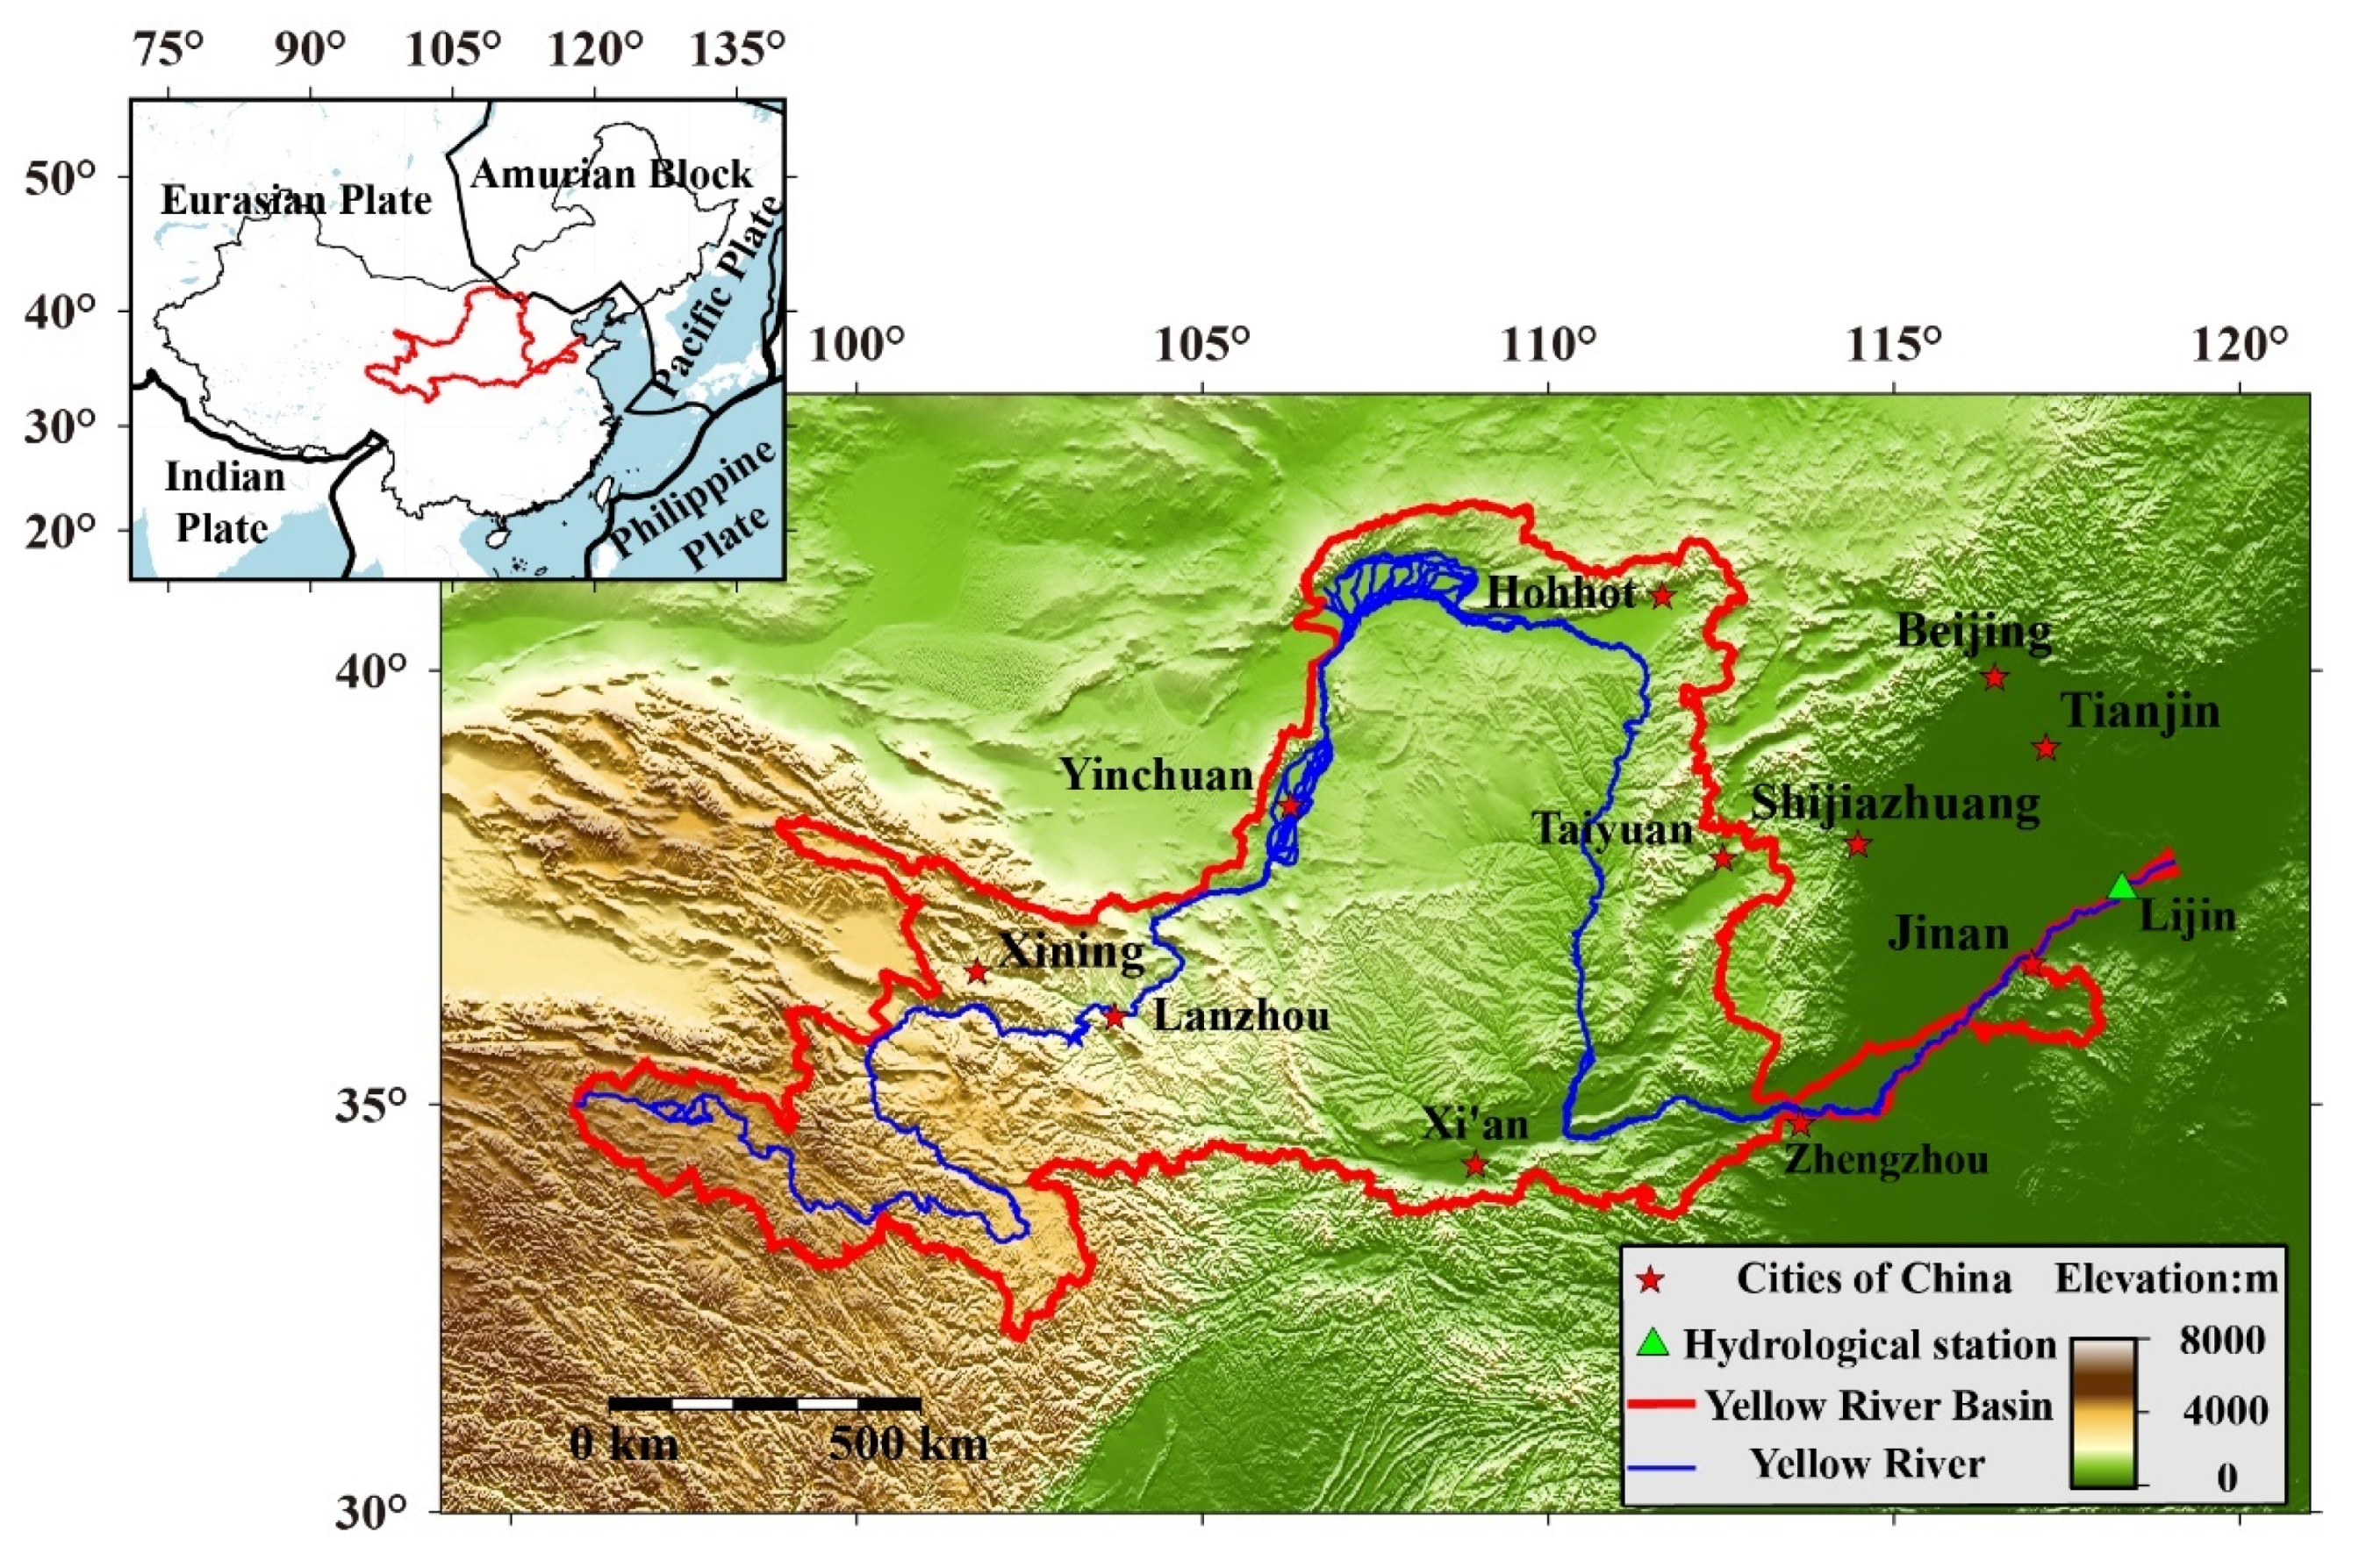
2. Data
2.1. GRACE and GRACE-FO Data
2.2. Precipitation and Runoff Data
2.3. ET Products
2.3.1. GLDAS Products
2.3.2. GLEAM Products
2.3.3. ERA5 Reanalysis Products
2.3.4. CR Products
3. Methods
3.1. Water Budget Equation
3.2. Mann–Kendall (MK) Trend Test Method
4. Results and Analysis
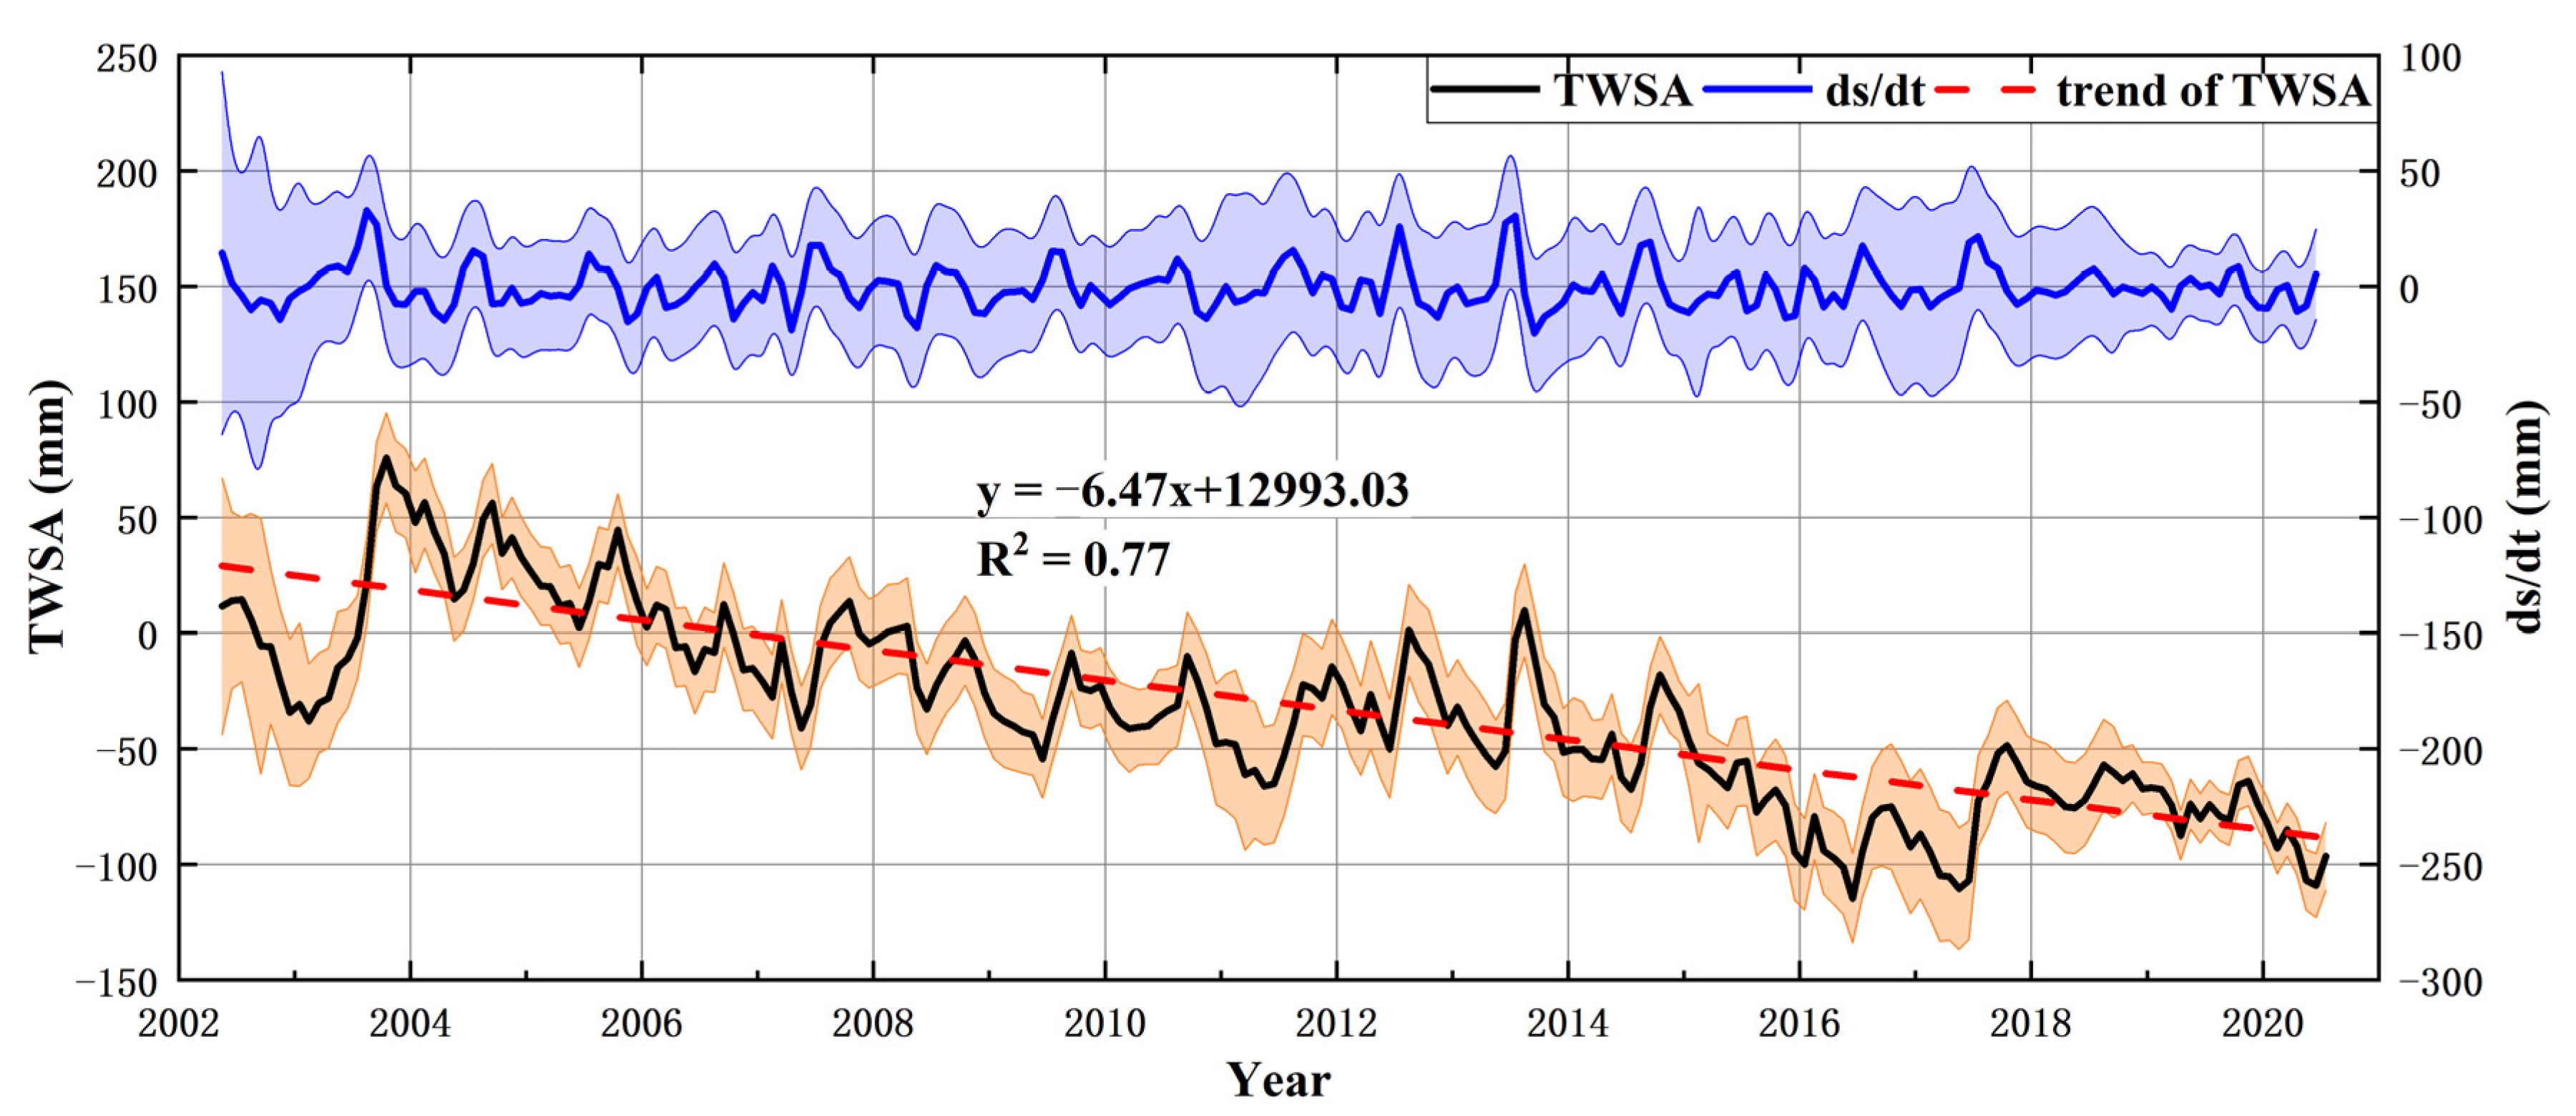
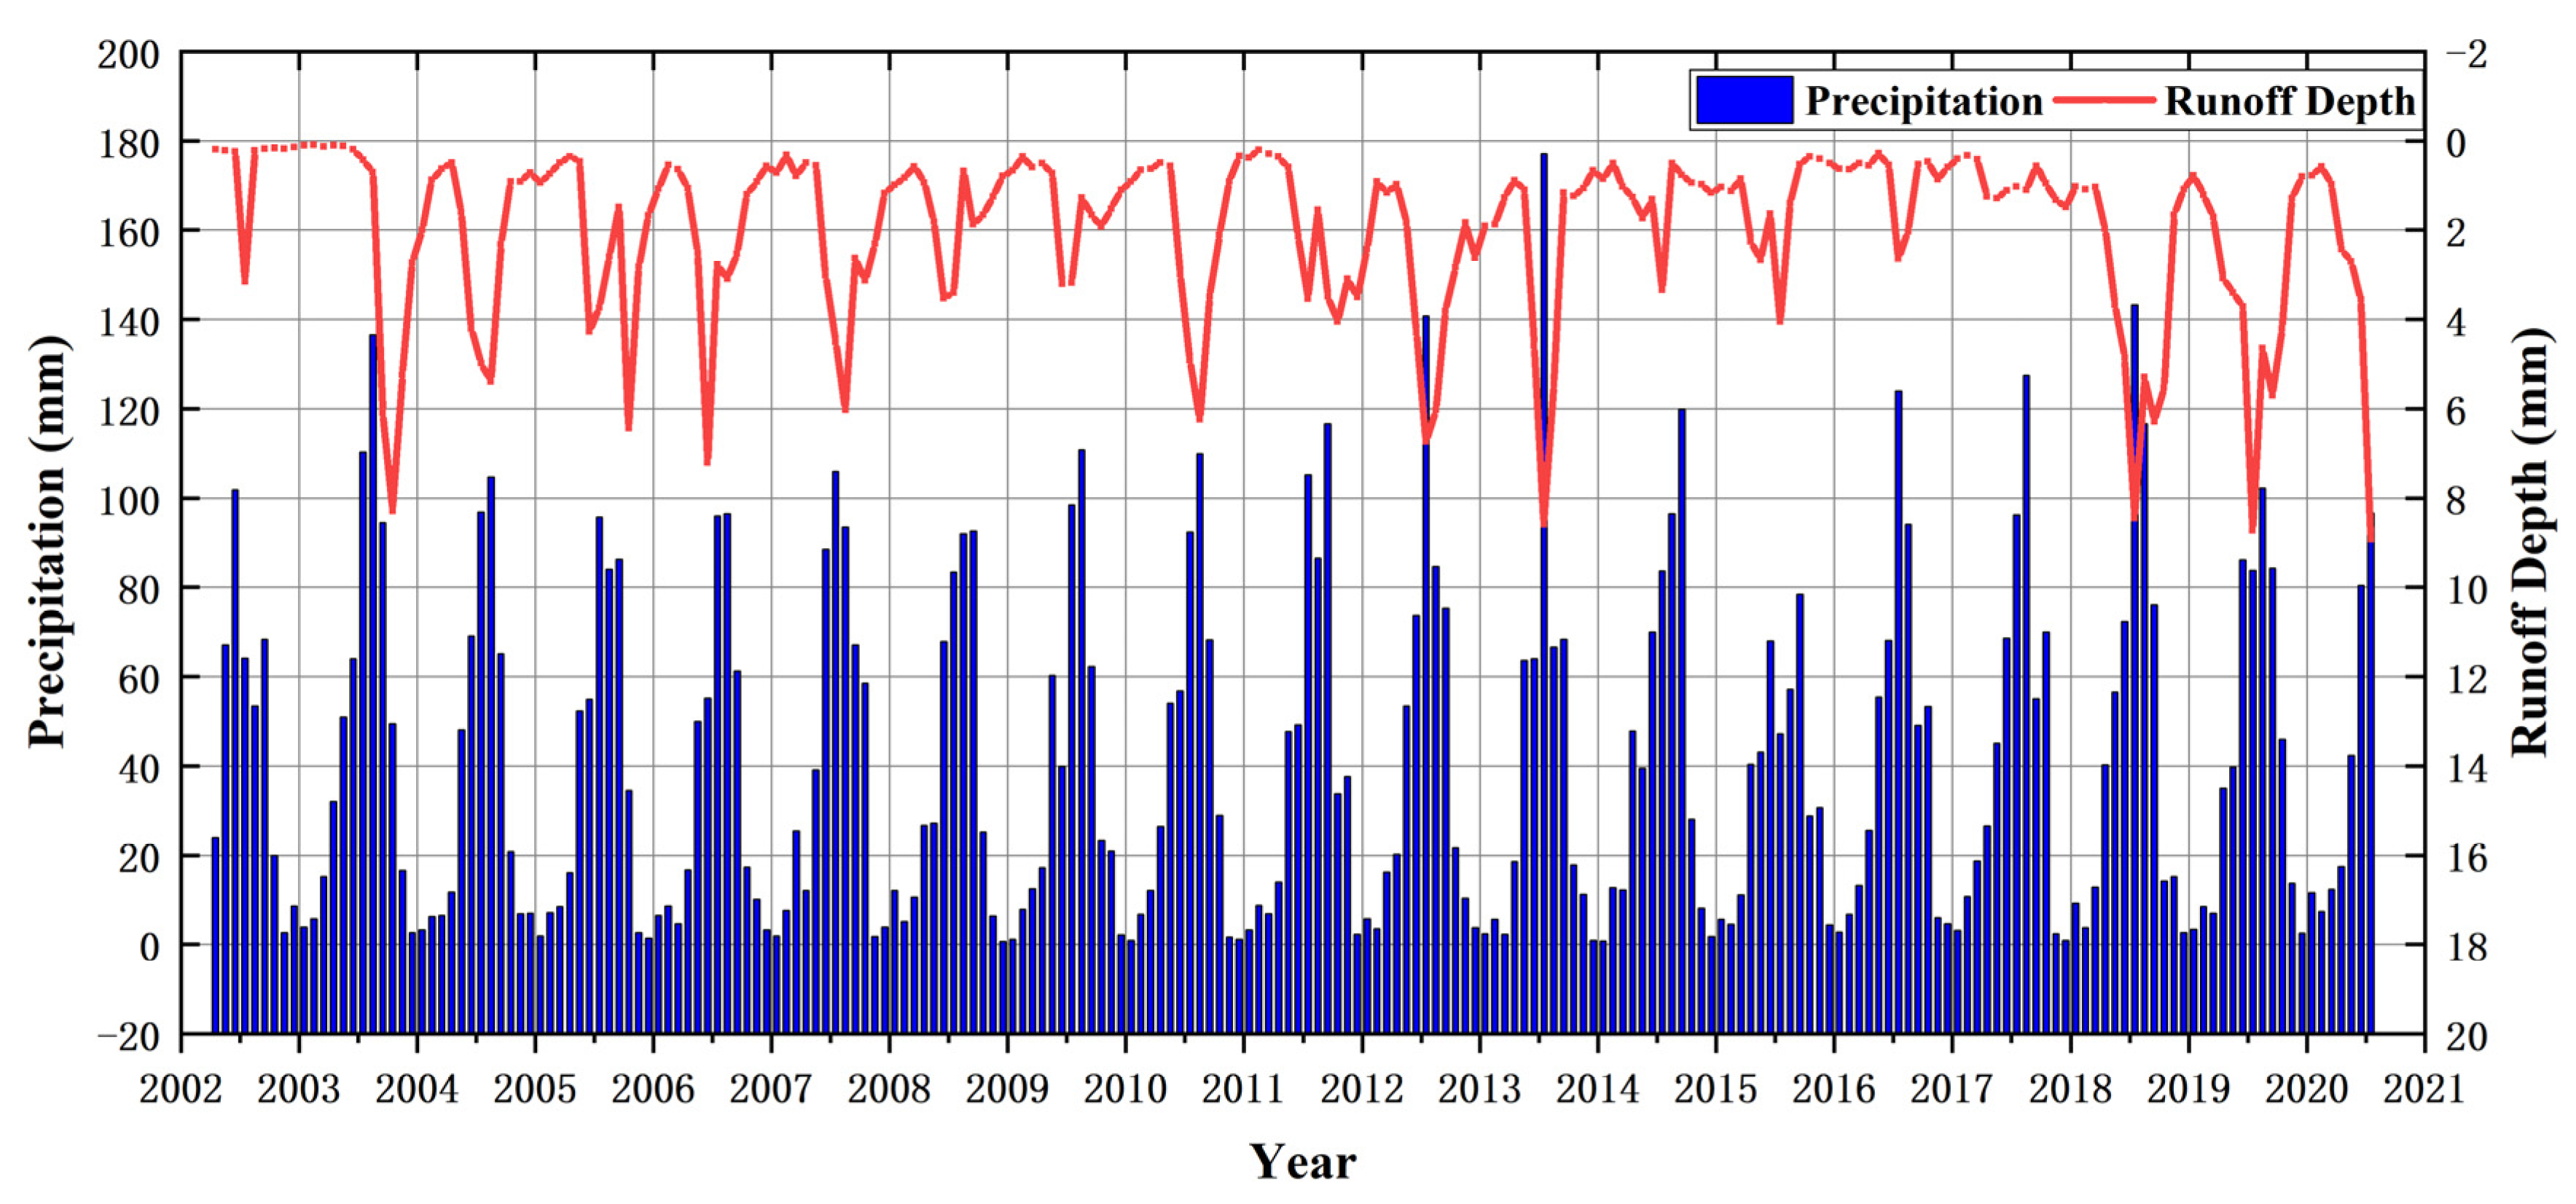
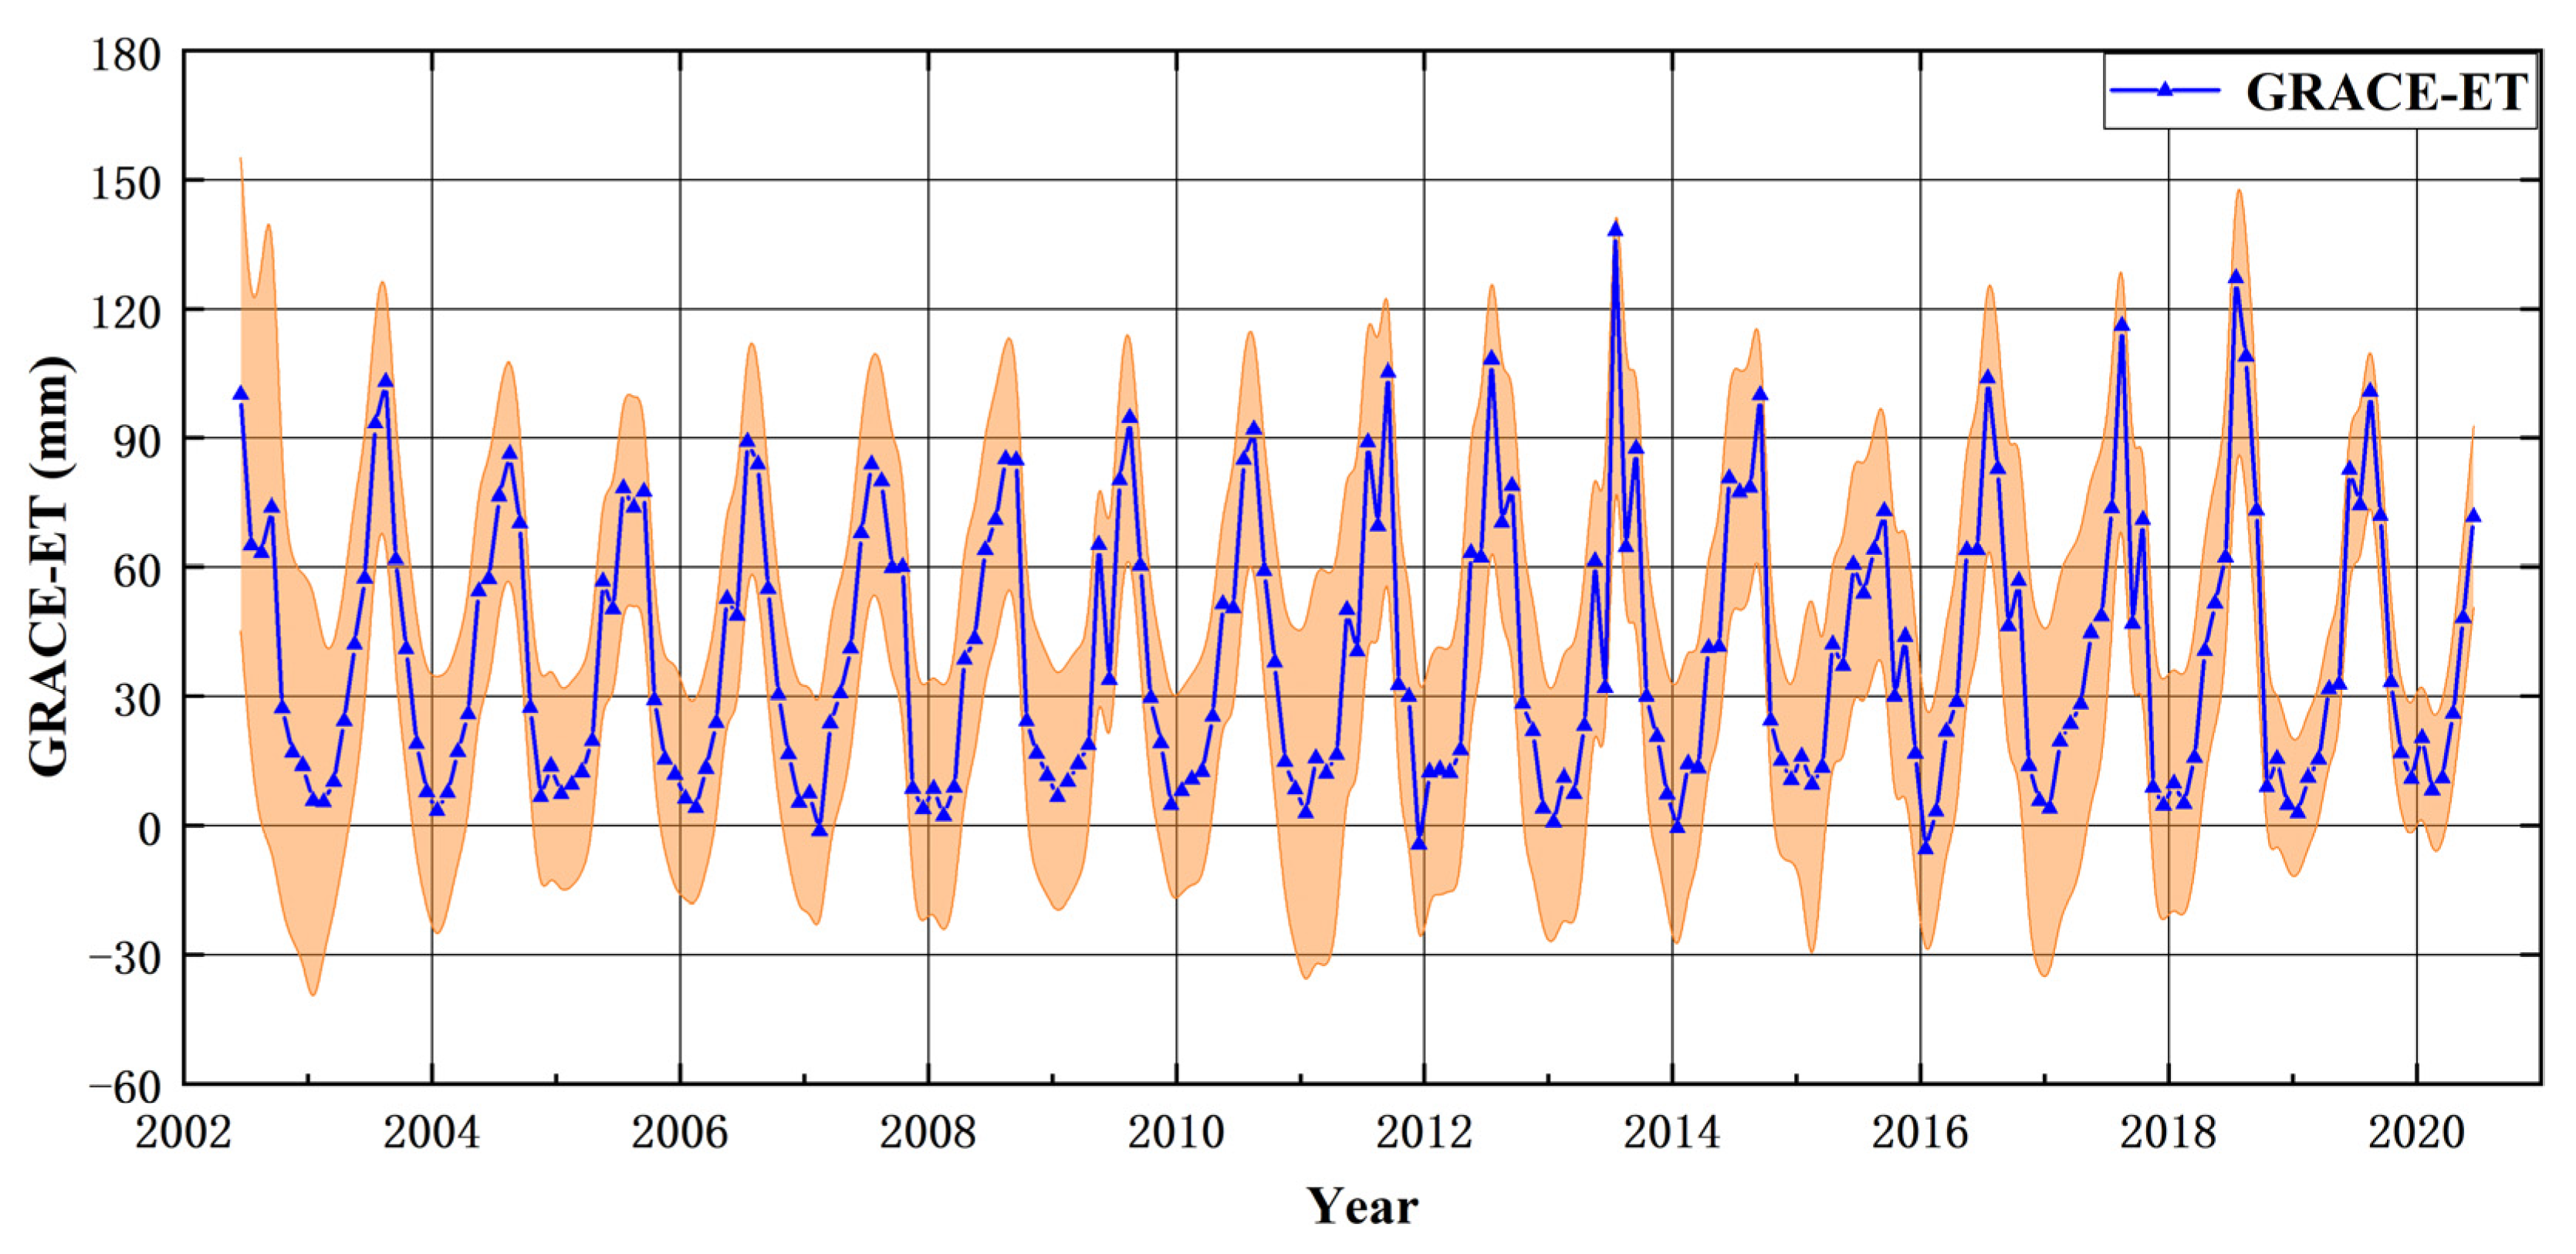
4.1. TWSA, Precipitation, and Runoff Characteristics in the YRB
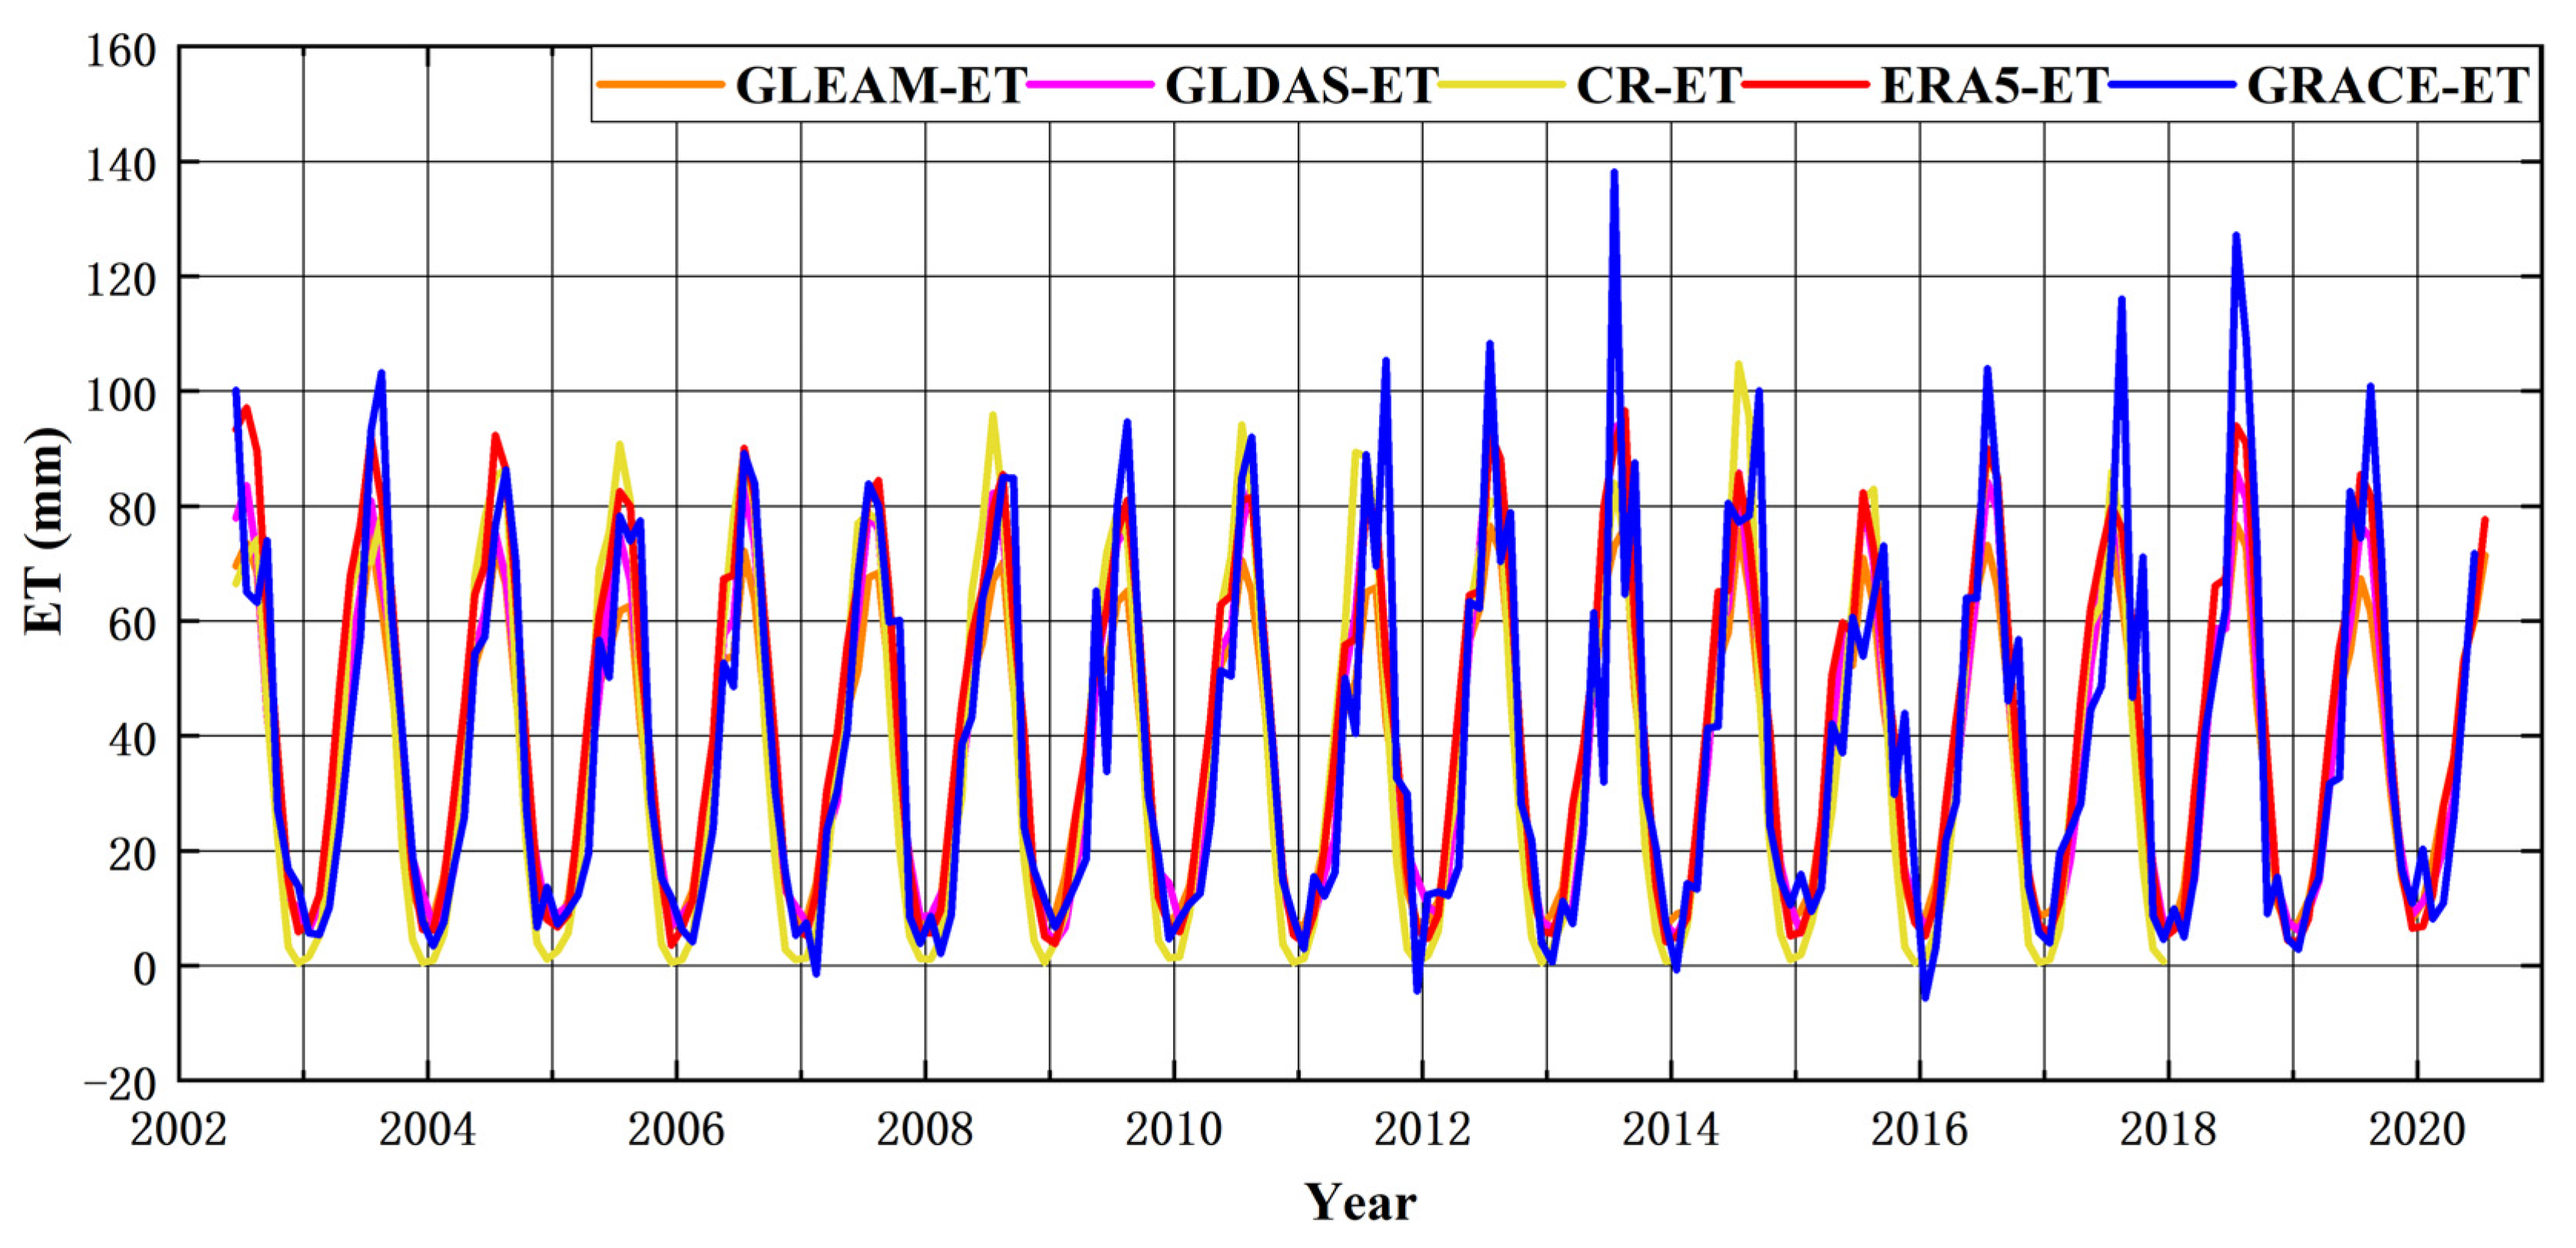
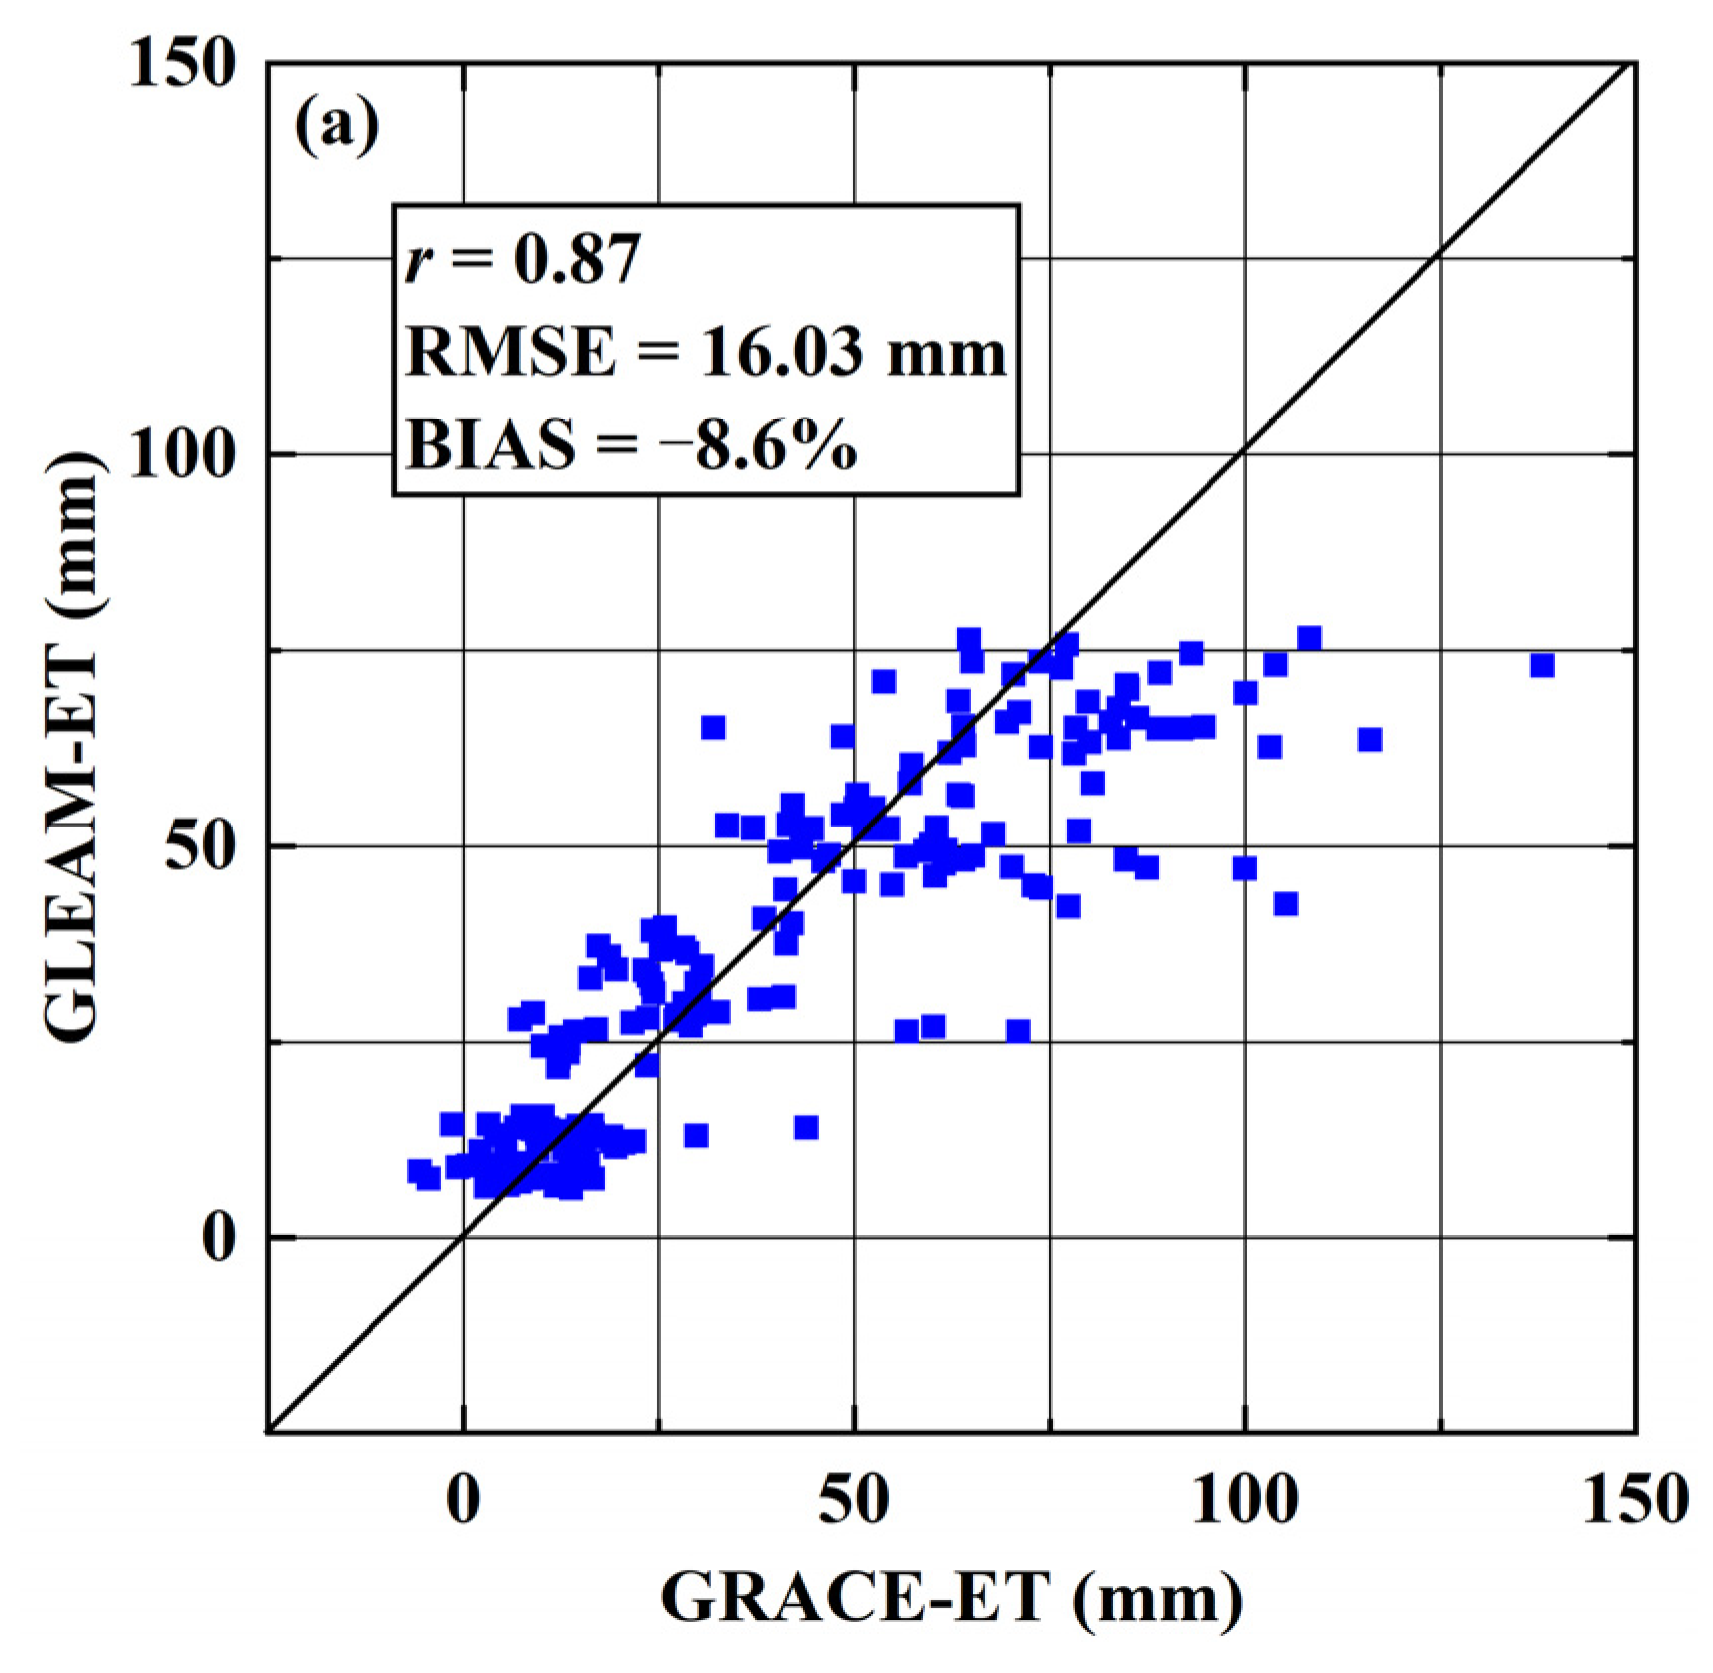
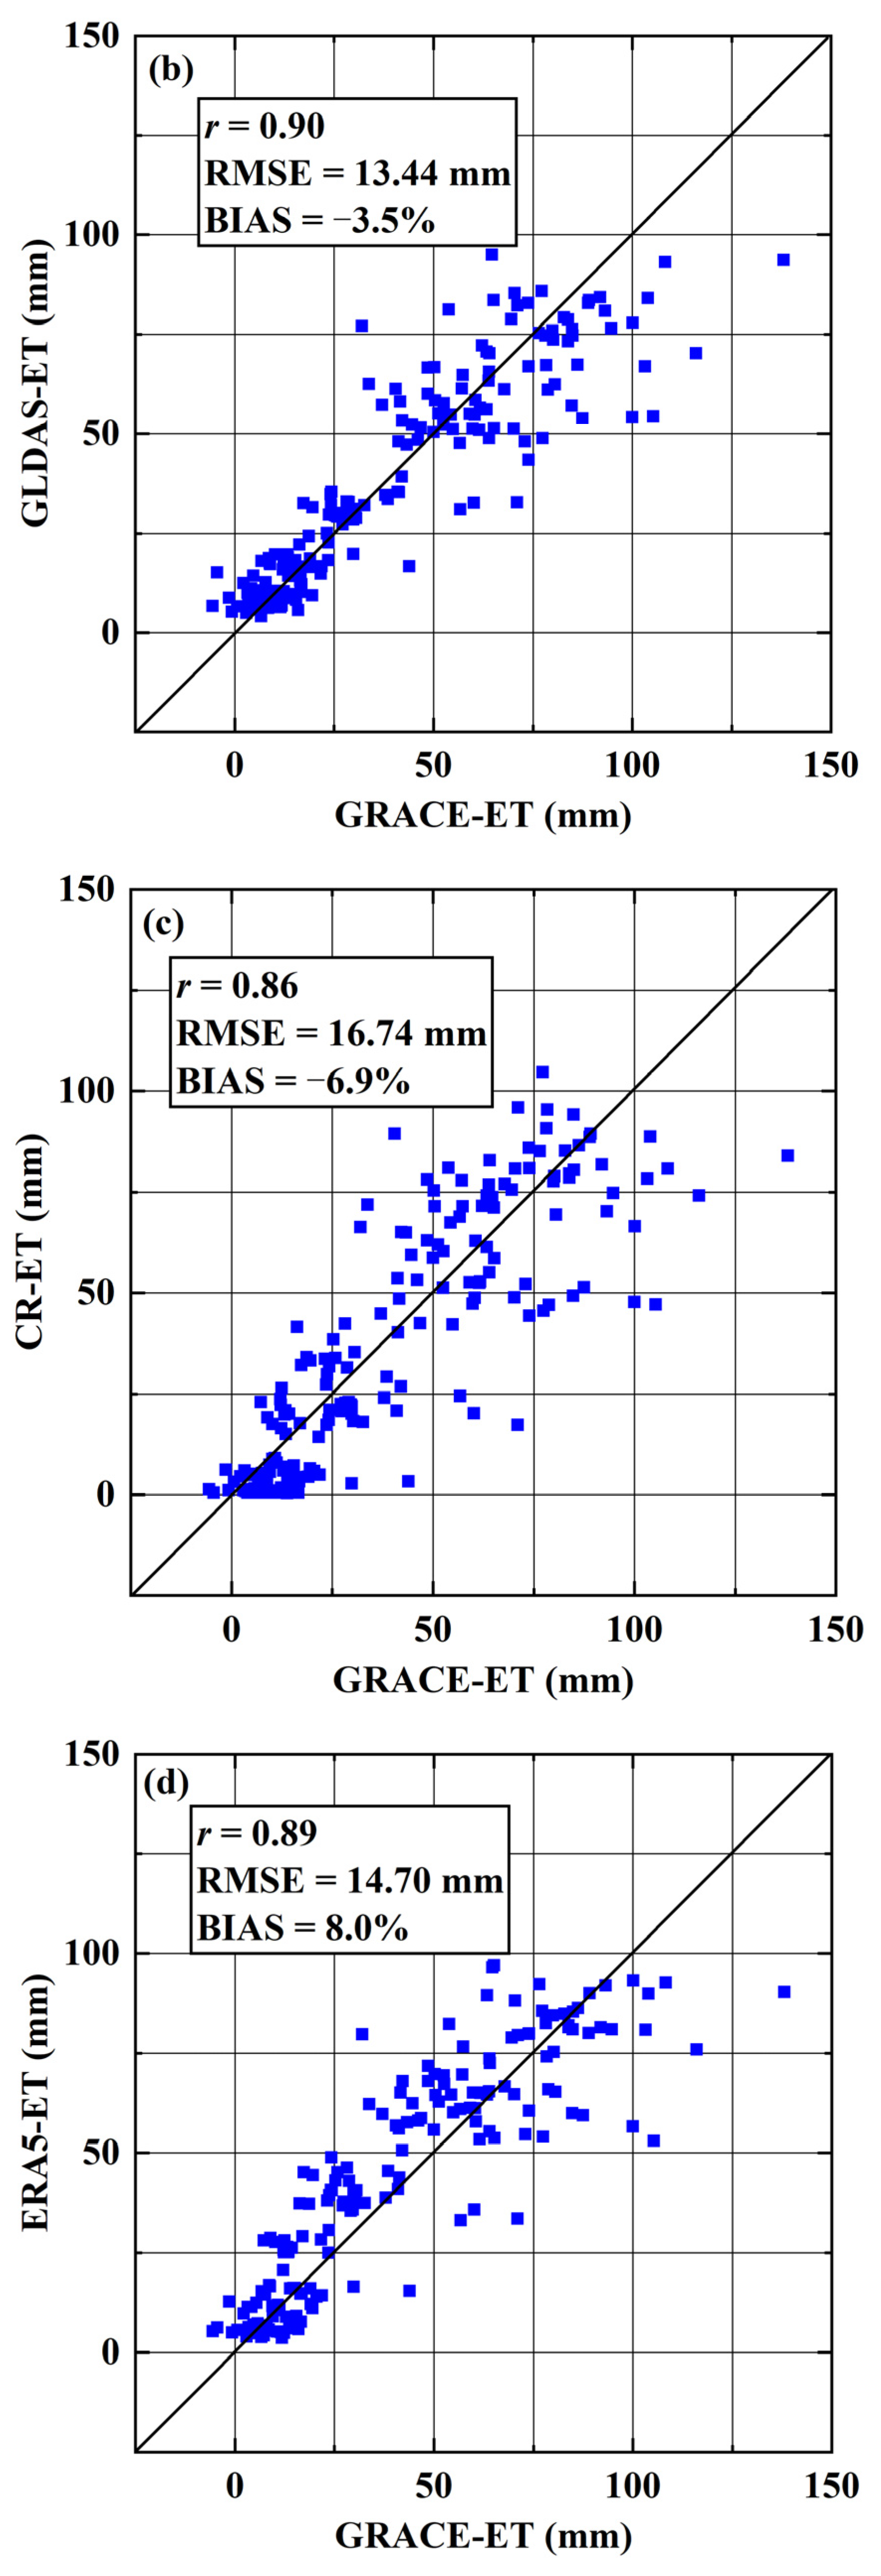
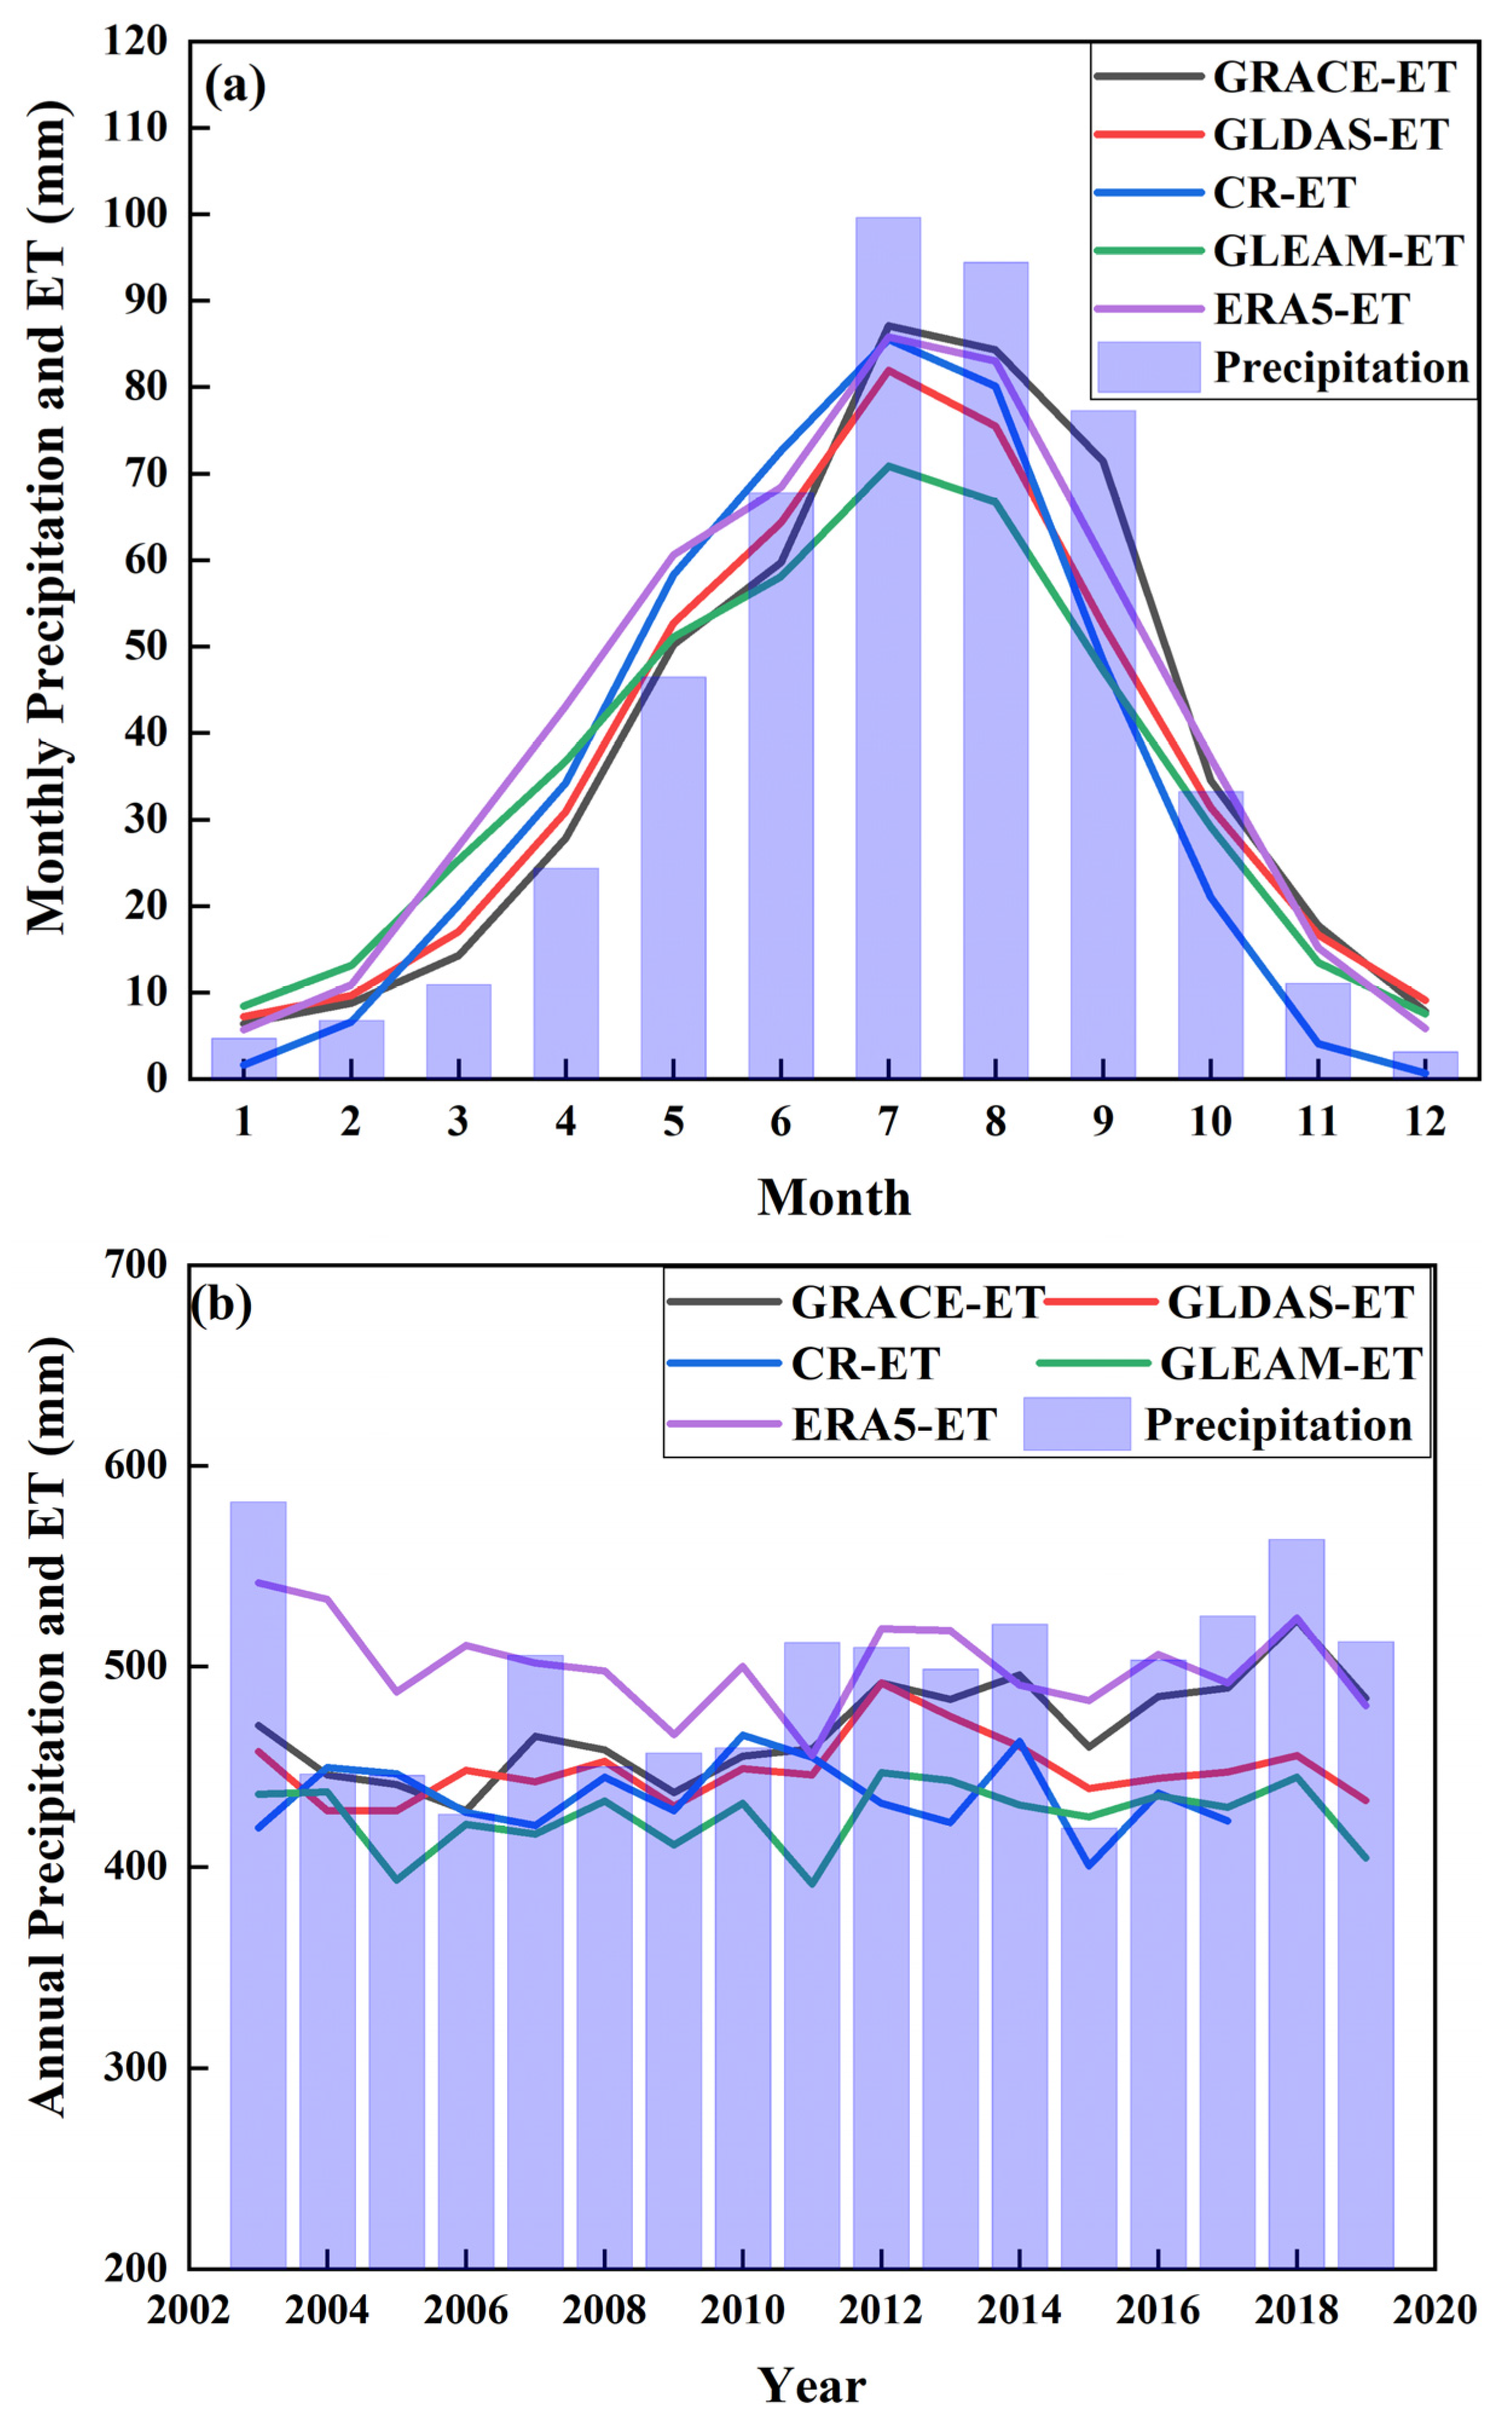
4.2. Comparison of ET Estimated by GRACE/GRACE-FO with ET from Other Products
4.3. Interannual and Seasonal ET Variations in the YRB
5. Discussion
5.1. Analysis of the Differences in the ET Estimated by Different ET Products
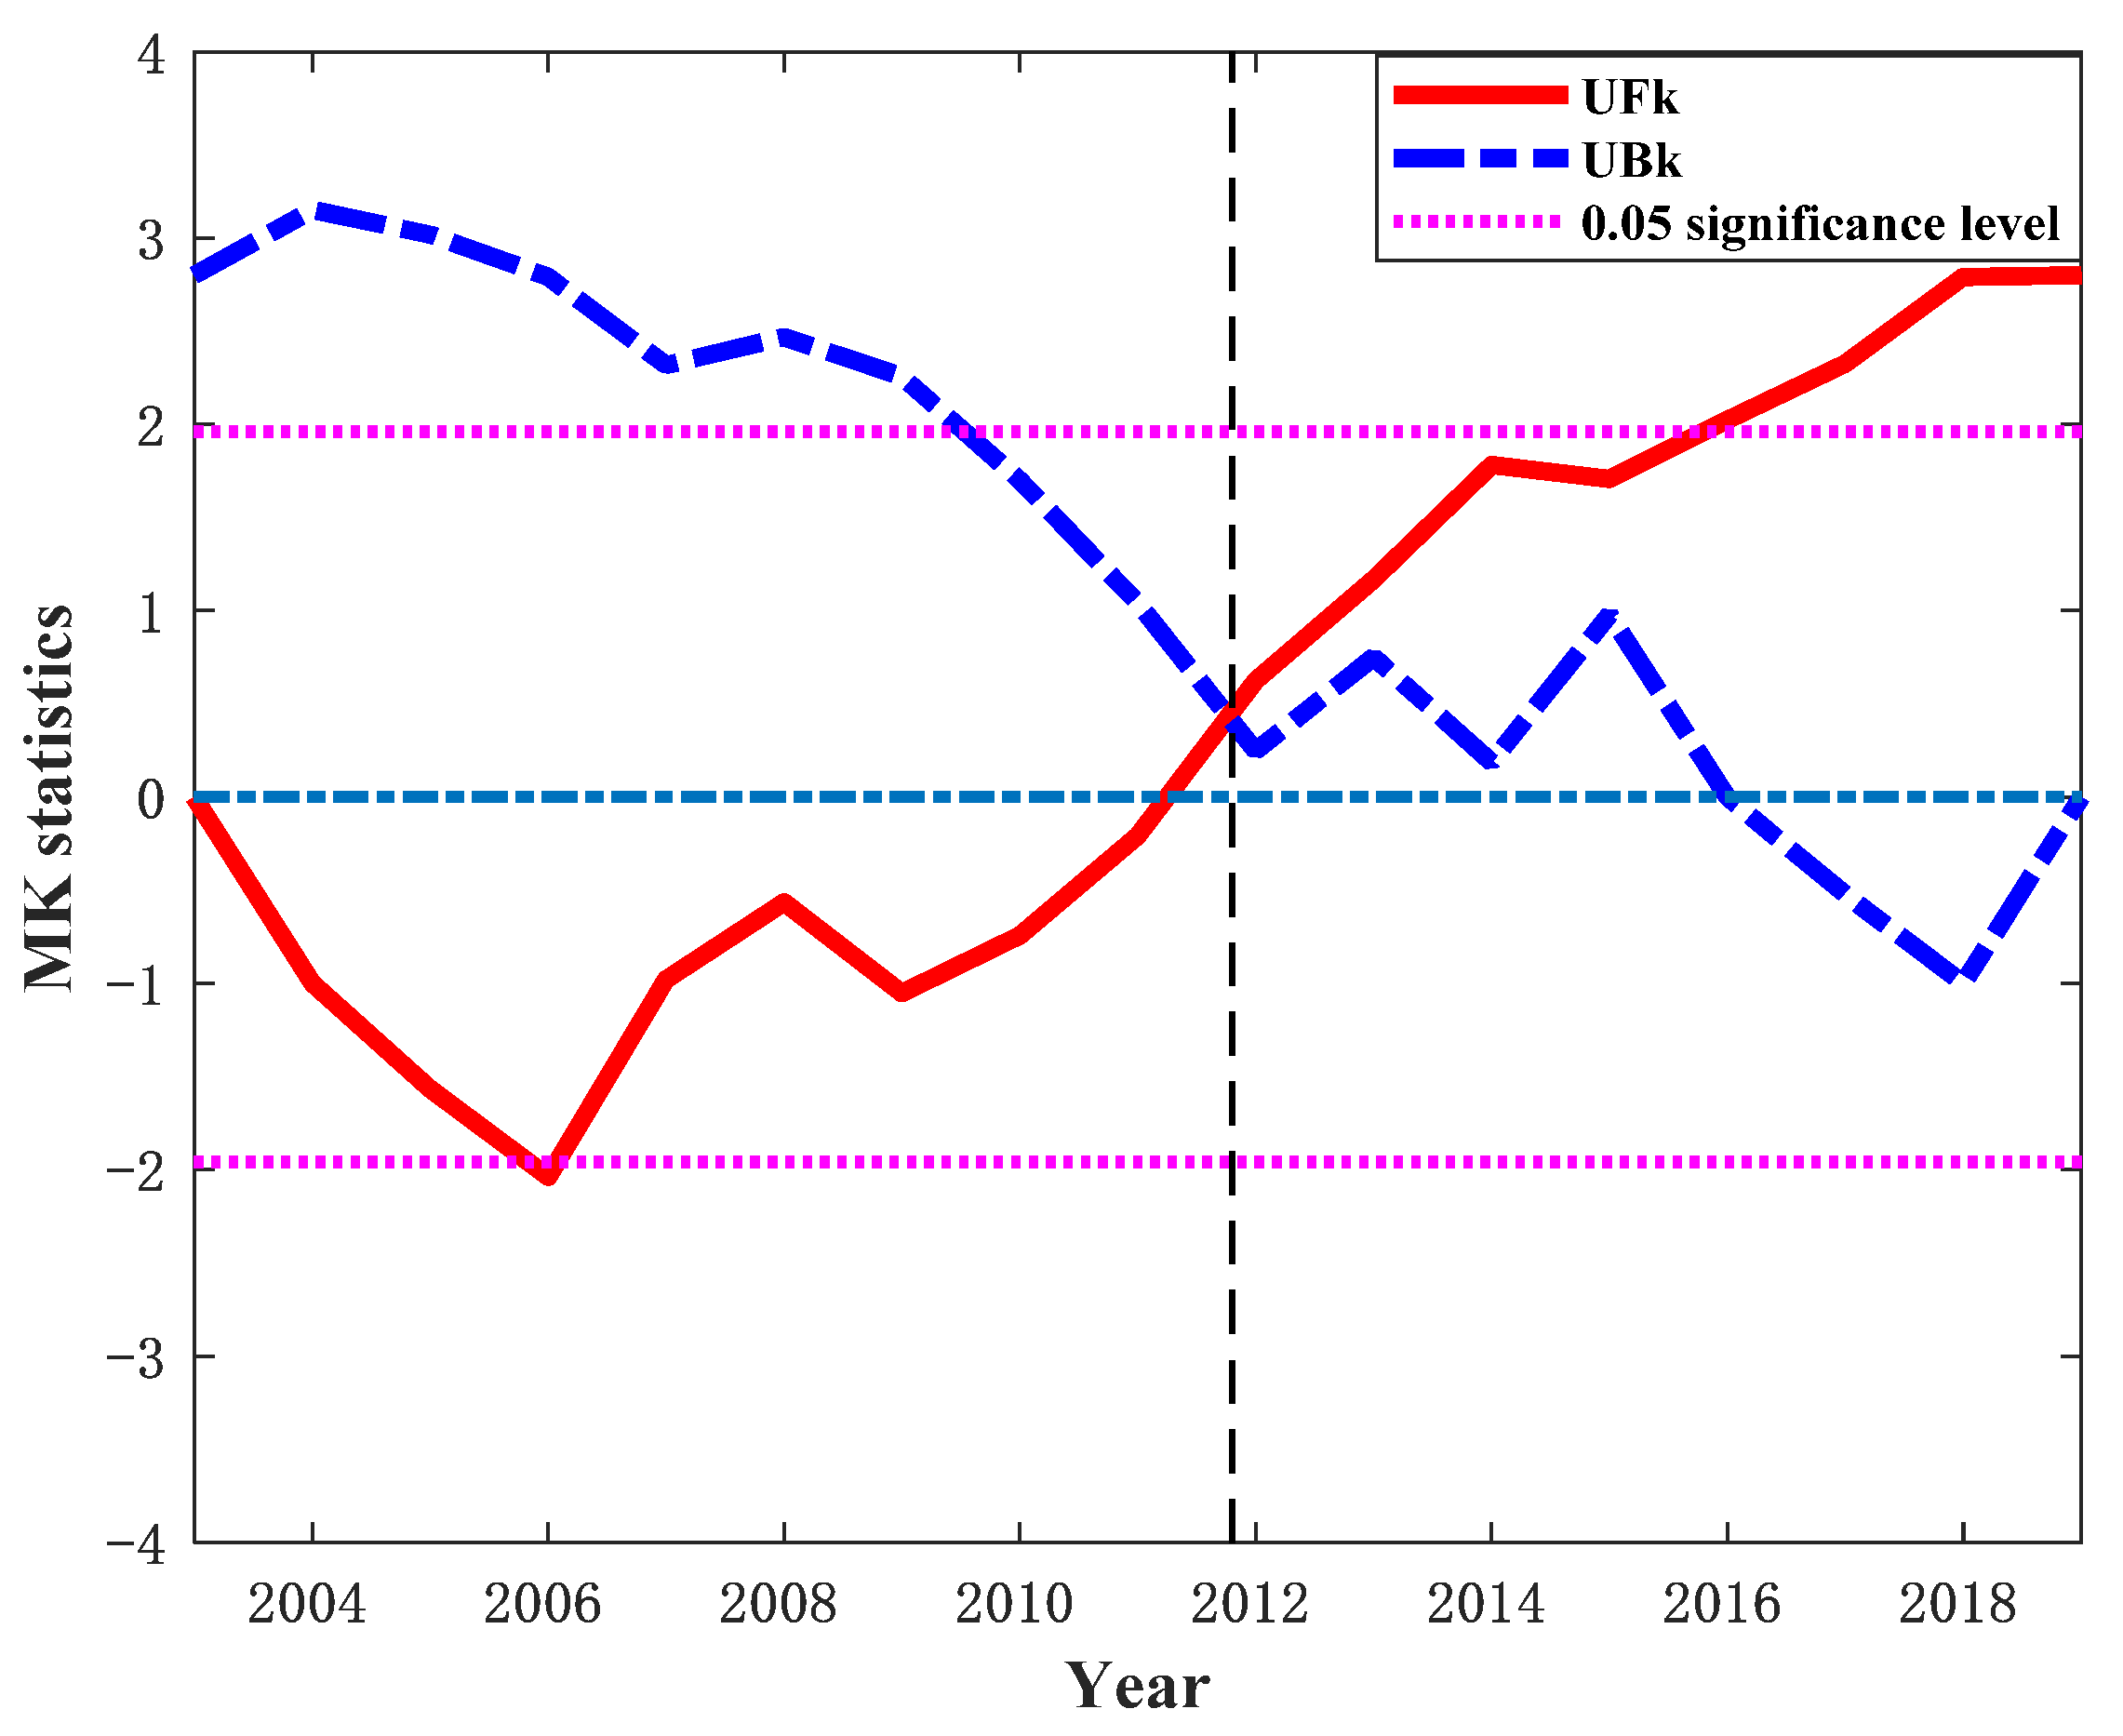
5.2. Trend in Interannual ET Variations Revealed by the MK Mutation Method in the YRB
6. Conclusions
- The actual ET in the YRB estimated by GRACE/GRACE-FO was in good agreement with the GLDAS, GLEAM, ERA5, and CR ET products. Among them, the GLDAS ET products had the highest consistency with the ET calculated by GRACE/GRACE-FO. The ET estimated by GLEAM in the seasons with low precipitation was in good agreement with the GRACE/GRACE-FO results; however, the difference was relatively large in the seasons with high precipitation.
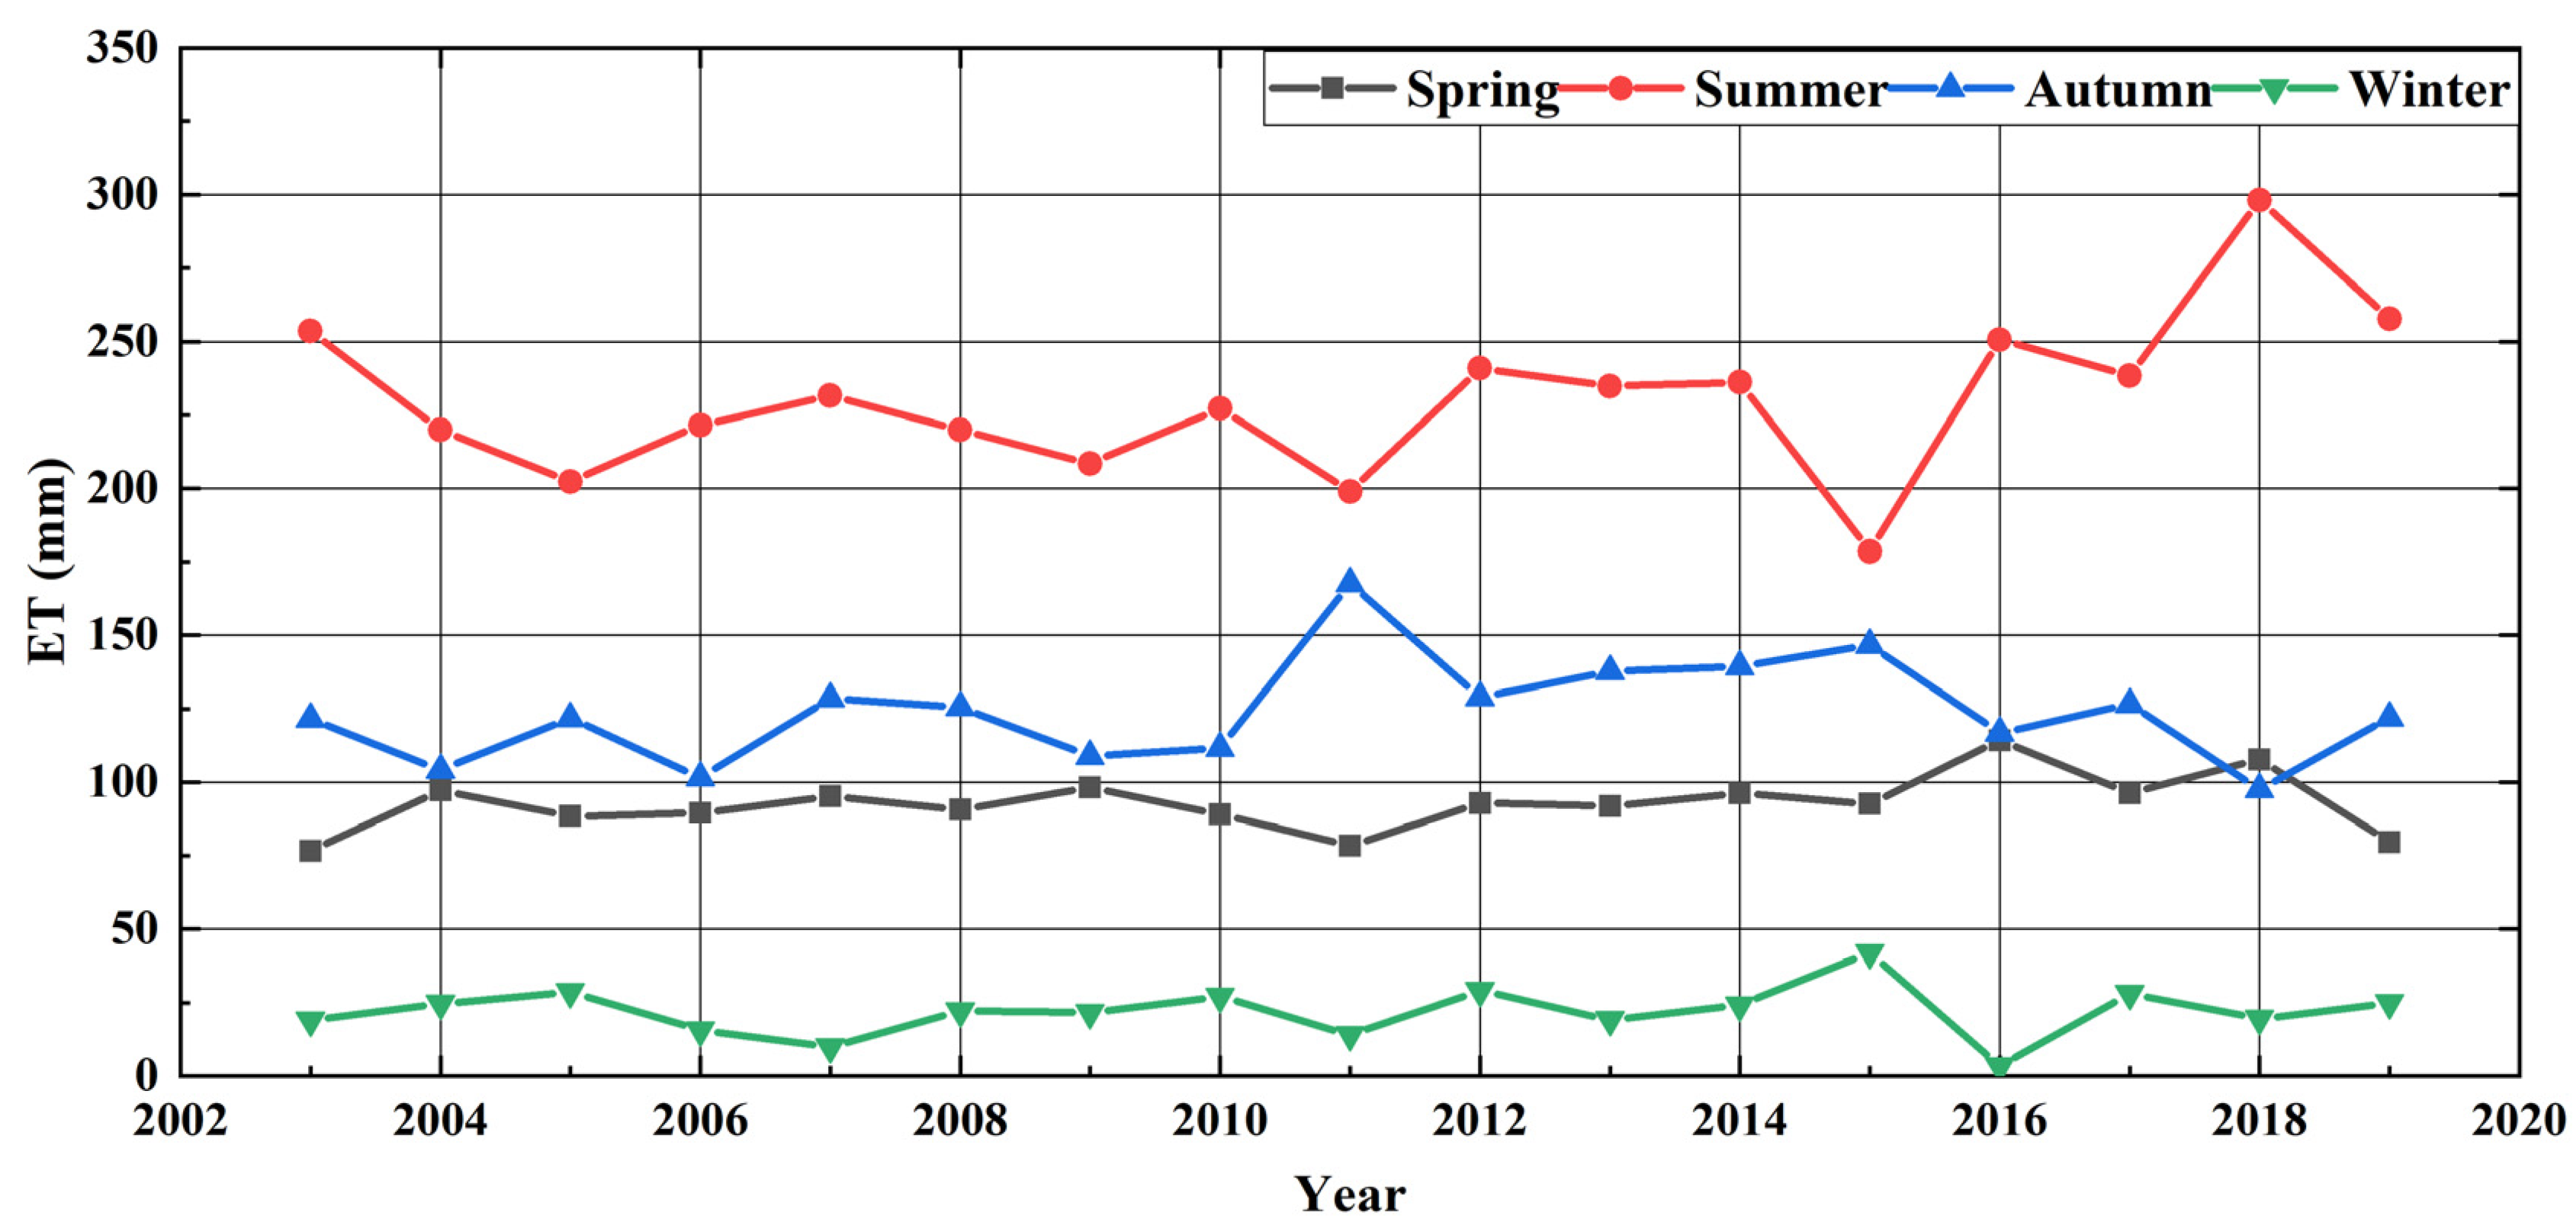
- ET in the YRB was closely related to precipitation. ET levels increased from January to July, with the increase in precipitation, and decreased from August to December with the decrease in precipitation. There was little difference between ET and precipitation in the YRB.
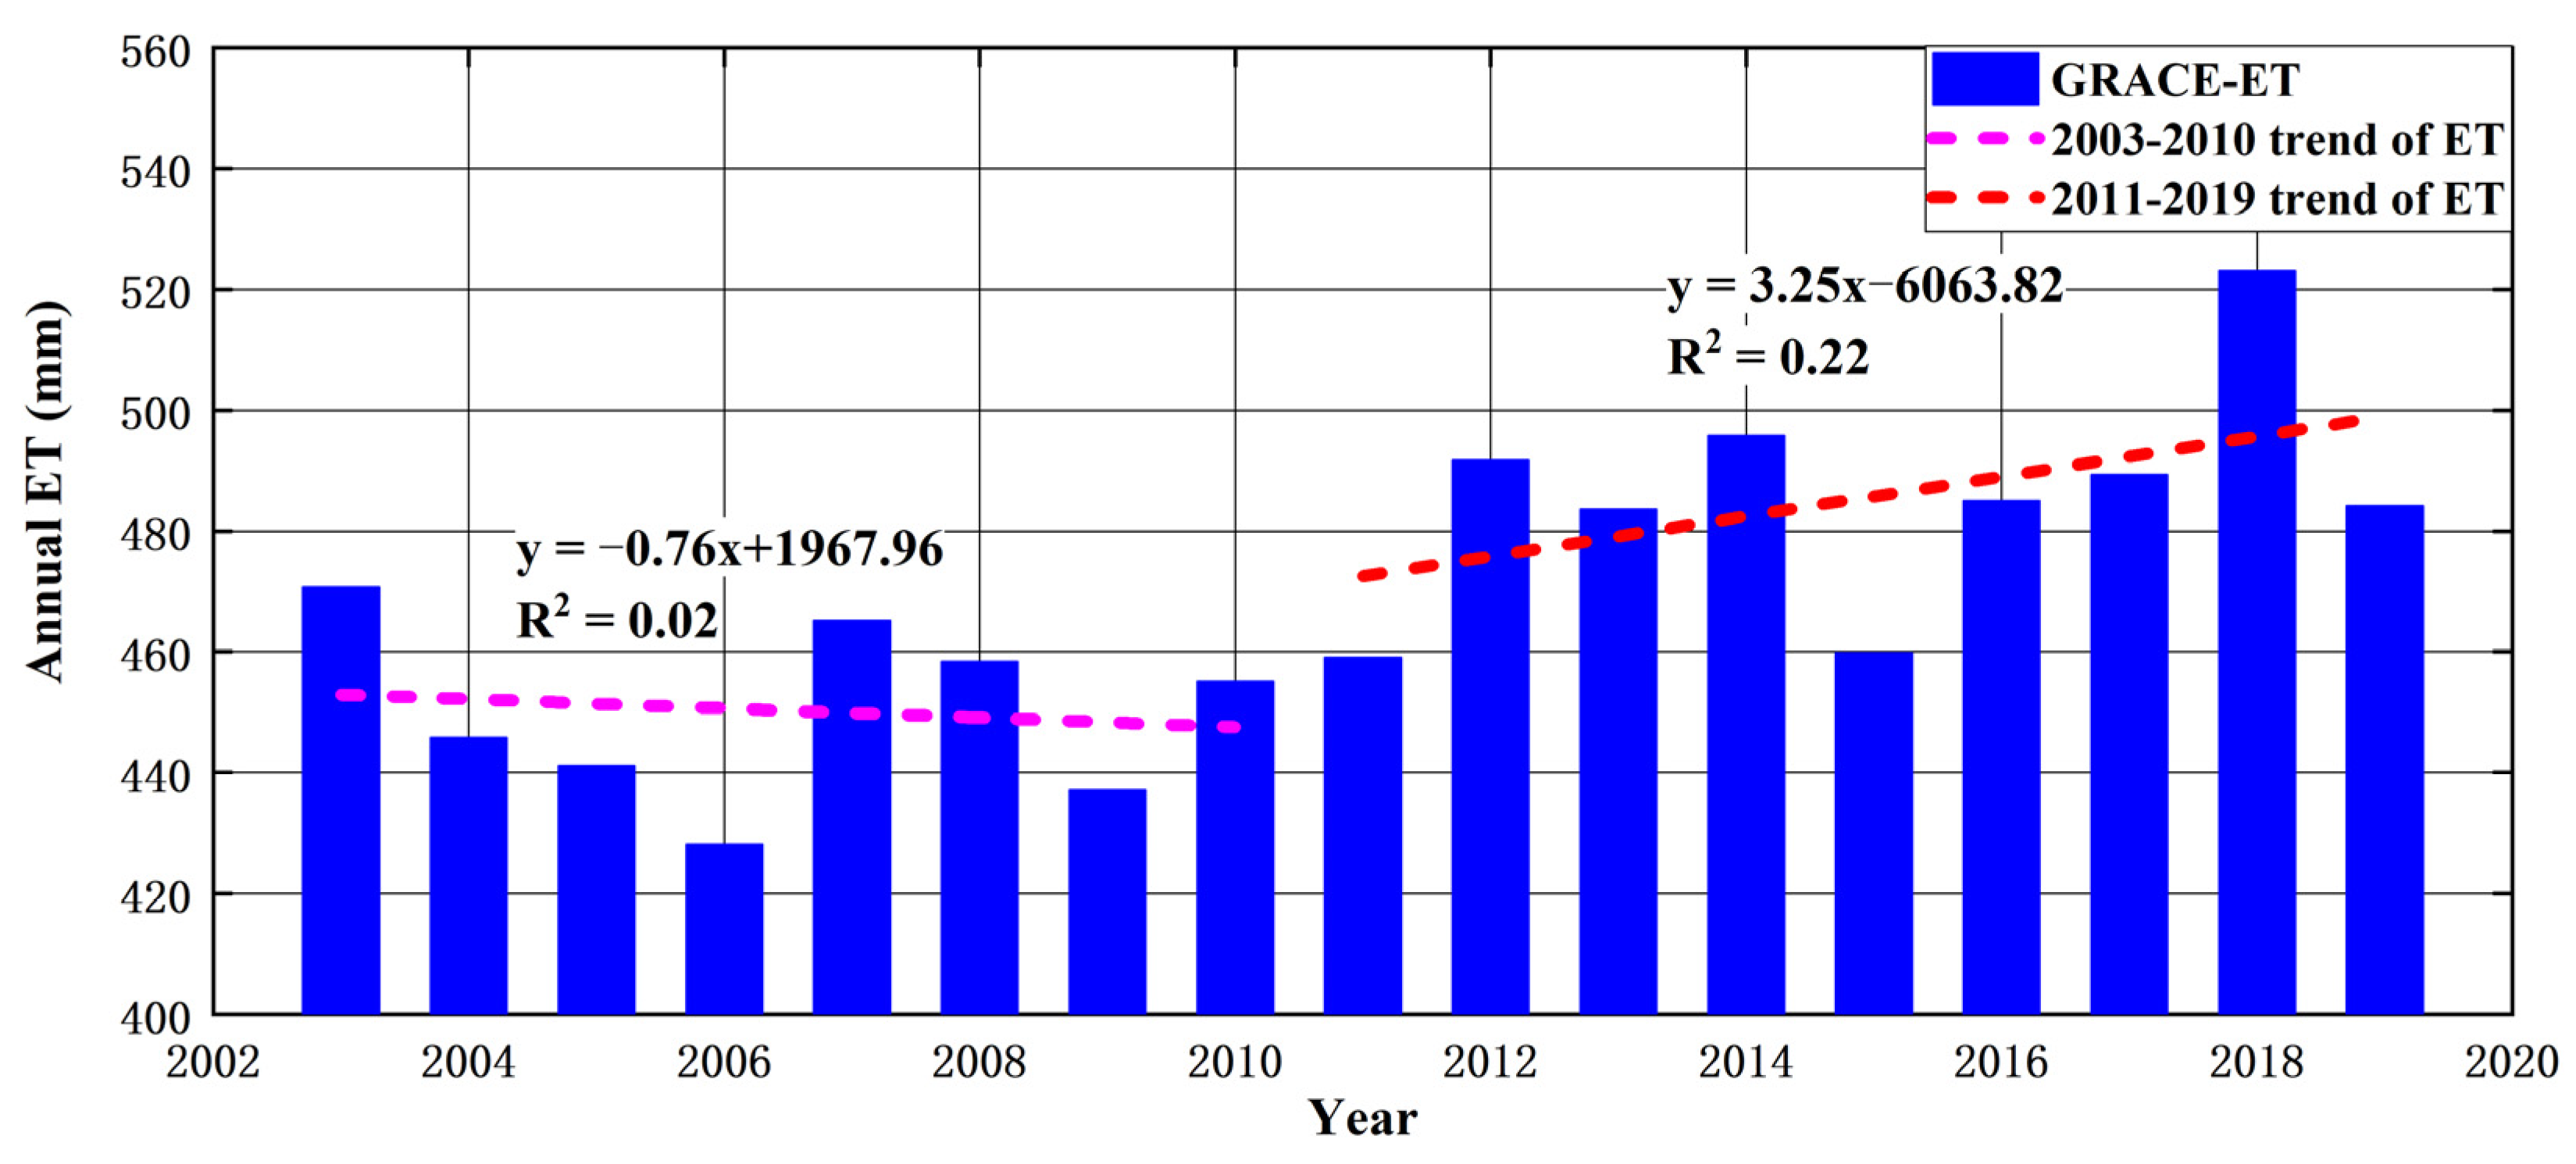
- The annual mean ET of the YRB exhibited a sudden change around 2011; it showed an insignificant downward trend from 2003 to 2010 and an increasing trend from 2011 to 2019, especially after 2016. The multi-year mean ET values in the four seasons in the YRB decreased from summer > autumn > spring > winter.
Author Contributions
Funding
Institutional Review Board Statement
Informed Consent Statement
Data Availability Statement
Acknowledgments
Conflicts of Interest
References
- Huo, Z.; Dai, X.; Feng, S.; Kang, S.; Huang, G. Effect of climate change on reference evapotranspiration and aridity index in arid region of China. J. Hydrol. 2017, 492, 24–34. [Google Scholar] [CrossRef]
- Alsdorf, D.E.; Lettenmaier, D.P. Tracking Fresh Water from Space. Science 2003, 301, 1491–1494. [Google Scholar] [CrossRef] [PubMed] [Green Version]
- Abbasi, A.; Khalili, K.; Behmanesh, J.; Shirzad, A. Drought monitoring and prediction using SPEI index and gene expression programming model in the west of Urmia Lake. Theor. Appl. Climatol. 2019, 138, 553–567. [Google Scholar] [CrossRef]
- Miah, M.G.; Abdullah, H.M.; Jeong, C. Exploring standardized precipitation evapotranspiration index for drought assessment in Bangladesh. Environ. Monit. Assess. 2017, 189, 547. [Google Scholar] [CrossRef] [PubMed]
- Rodell, M.; Famiglietti, J.S.; Chen, J.; Seneviratne, S.I.; Viterbo, P.; Holl, S.; Wilson, C.R. Basin scale estimates of evapotranspiration using GRACE and other observations. Geophys. Res. Lett. 2004, 31, L20504. [Google Scholar] [CrossRef] [Green Version]
- Zhong, Y.; Zhong, M.; Feng, W.; Yan, H.; Li, C. Evaluation of the Evapotranspiration in the West Liaohe River Basin Based on GRACE Satellite and in Situ Measurements. J. Wuhan Univ. Inf. Sci. 2020, 45, 173–178, (In Chinese with English Abstract). [Google Scholar]
- Wang, F.; Wang, Z.; Yang, H.; Zhao, Y. Study of the temporal and spatial patterns of drought in the Yellow River basin based on SPEI. Sci. China Earth Sci. 2018, 61, 1098–1111. [Google Scholar] [CrossRef]
- Zhang, Q.; Xu, C.Y.; Chen, Y.D.; Ren, L. Comparison of evapotranspiration variations between the Yellow River and Pearl River basin, China. Stoch. Environ. Res. Risk Assess. 2011, 25, 139–150. [Google Scholar] [CrossRef]
- Yeh, P.J.F.; Famiglietti, J.S. Regional terrestrial water storage change and evapotranspiration from terrestrial and atmospheric water balance computations. J. Geophys. Res. 2008, 113, D09108. [Google Scholar] [CrossRef]
- Ferguson, C.R.; Sheffield, J.; Wood, E.F.; Gao, H. Quantifying uncertainty in a remote sensing-based estimate of evapotranspiration over the continental United States. Int. J. Remote Sens. 2010, 31, 3821–3865. [Google Scholar] [CrossRef]
- Karam, H.N.; Bras, R.L. Climatological basin-scale Amazonian evapotranspiration estimated through a water budget analysis. J. Hydrometeorol. 2008, 9, 1048–1060. [Google Scholar] [CrossRef]
- Cesanelli, A.; Guarracino, L. Estimation of regional evapotranspiration in the extended Salado Basin (Argentina) from satellite gravity measurements. Hydrogeol. J. 2011, 19, 629–639. [Google Scholar] [CrossRef]
- Castle, S.L.; Reager, J.T.; Thomas, B.F.; Purdy, A.J.; Lo, M.-H.; Famiglietti, J.S.; Tang, Q. Remote detection of water management impacts on evapotranspiration in the Colorado River basin. Geophys. Res. Lett. 2016, 43, 5089–5097. [Google Scholar] [CrossRef] [Green Version]
- Sun, C.; Ren, L. Assessment of surface water resources and evapotranspiration in the Haihe River basin of China using SWAT model. Hydrol. Processes 2013, 27, 1200–1222. [Google Scholar] [CrossRef]
- Pan, Y.; Zhang, C.; Gong, H.; Yeh, P.J.F.; Shen, Y.; Guo, Y.; Huang, Z.; Li, X. Detection of human-induced evapotranspiration using GRACE satellite observations in the Haihe River basin of China. Geophys. Res. Lett. 2017, 44, 190–199. [Google Scholar] [CrossRef]
- Syed, T.H.; Webster, P.J.; Famiglietti, J.S. Assessing variability of evapotranspiration over the ganga river basin using water balance computations. Water Resour. Res. 2014, 50, 2551–2565. [Google Scholar] [CrossRef] [Green Version]
- Cao, G.; Han, D.; Song, X. Evaluating actual evapotranspiration and impacts of groundwater storage change in the North China Plain. Hydrol. Processes 2014, 28, 1797–1808. [Google Scholar] [CrossRef]
- Fisher, J.B.; Tu, K.P.; Baldocchi, D.D. Global estimates of the land-atmosphere water flux based on monthly AVHRR and ISLSCP-II data, validated at 16 FLUXNET sites. Remote Sens. Environ. 2008, 112, 901–919. [Google Scholar] [CrossRef]
- Mu, Q.; Heinsch, F.A.; Zhao, M.; Running, S.W. Development of a global evapotranspiration algorithm based on MODIS and global meteorology data. Remote Sens. Environ. 2007, 111, 519–536. [Google Scholar] [CrossRef]
- Zhang, K.; Kimball, J.S.; Nemani, R.R.; Running, S.W. A continuous satellite-derived global record of land surface evapotranspiration from 1983 to 2006. Water Resour. Res. 2010, 46, W09522. [Google Scholar] [CrossRef] [Green Version]
- Vinukollu, R.K.; Meynadier, R.; Sheffield, J.; Wood, E.F. Multi-model, multi-sensor estimates of global evapotranspiration: Climatology, uncertainties and trends. Hydrol. Processes 2011, 25, 3993–4010. [Google Scholar] [CrossRef]
- Vinukollu, R.K.; Wood, E.F.; Ferguson, C.R.; Fisher, J.B. Global estimates of evapotranspiration for climate studies using multisensor remote sensing data: Evaluation of three process-based approaches. Remote Sens. Environ. 2011, 115, 801–823. [Google Scholar] [CrossRef]
- Wang, K.; Dickinson, R.E. A review of global terrestrial evapotranspiration: Observation, modeling, climatology, and climatic variability. Rev. Geophys. 2012, 50, RG2005. [Google Scholar] [CrossRef]
- Zeng, Z.; Wang, T.; Zhou, F.; Ciais, P.; Mao, J.; Shi, X.; Piao, S. A worldwide analysis of spatiotemporal changes in water balance-based evapotranspiration from 1982 to 2009. J. Geophys. Res. Atmos. 2014, 119, 1186–1202. [Google Scholar] [CrossRef]
- Yang, S.; Rui, S.; Mao, D.; Zhang, X.; Cui, J. Estimation of daily evapotranspiration in the Yellow River Basin by using MODIS data. IEEE Int. Geosci. Remote Sens. Symp. 2004, 2, 1343–1345. [Google Scholar]
- Liu, Q.; Yang, Z. Quantitative estimation of the impact of climate change on actual evapotranspiration in the Yellow River Basin, China. J. Hydrol. 2010, 395, 226–234. [Google Scholar] [CrossRef]
- Tong, R.; Yang, X.; Ren, L.; Liu, Y.; Ma, M. Temporal and spatial characteristics of evapotranspiration in the Yellow River Basin during 1961–2012 and analysis of its influence factors. Water Resour. Prot. 2015, 31, 16–21, (In Chinese with English Abstract). [Google Scholar]
- Wang, G.; Pan, J.; Shen, C.; Li, S.; Lu, J.; Lou, D.; Hagan, D. Evaluation of Evapotranspiration Estimates in the Yellow River Basin against the Water Balance Method. Water 2018, 10, 1884. [Google Scholar] [CrossRef] [Green Version]
- Yin, L.; Wang, X.; Feng, X.; Fu, B.; Chen, Y. A Comparison of SSEBop-Model-Based Evapotranspiration with Eight Evapotranspiration Products in the Yellow River Basin, China. Remote Sens. 2020, 12, 2528. [Google Scholar] [CrossRef]
- Zhuo, Y.; Zhao, H.; Wei, M.; Sui, X.; Liu, H. Temporal and Spatial Changes of Pan Evaporation and Its Influence Factors in the Yellow River Basin in Recent 59 Years. Yellow River 2021, 43, 28–34, (In Chinese with English Abstract). [Google Scholar]
- Liu, B.; Xiao, Z.; Ma, Z. Relationship between Pan Evaporation and Actual Evaporation in Different Humid and Arid Regions of China. Plateau Meteor. 2010, 29, 629–636, (In Chinese with English Abstract). [Google Scholar]
- Wang, Y.; Liu, B.; Zhai, J.; Su, B.; Luo, Y.; Zhang, Z. Relationship Between Potential and Actual Evaporation in Yangtze River Basin. Adv. Clim. Change Res. 2011, 7, 393–399. [Google Scholar]
- Feng, W.; Shum, C.; Zhong, M.; Pan, Y. Groundwater Storage Changes in China from Satellite Gravity: An Overview. Remote Sens. 2018, 10, 674. [Google Scholar] [CrossRef] [Green Version]
- Zhong, Y.; Feng, W.; Humphrey, V.; Zhong, M. Human-Induced and Climate-Driven Contributions to Water Storage Variations in the Haihe River Basin, China. Remote Sens. 2019, 11, 3050. [Google Scholar] [CrossRef] [Green Version]
- Rodell, M.; McWilliams, E.B.; Famiglietti, J.S.; Beaudoing, H.K.; Nigro, J. Estimating evapotranspiration using an observation based terrestrial water budget. Hydrol. Processes 2011, 25, 4082–4092. [Google Scholar] [CrossRef]
- Billah, M.M.; Goodall, J.L.; Narayan, U.; Reager, J.T.; Lakshmi, V.; Famiglietti, J.S. A methodology for evaluating evapotranspiration estimates at the watershed-scale using GRACE. J. Hydrol. 2015, 523, 574–586. [Google Scholar] [CrossRef] [Green Version]
- Madeleine, A.; Pascolini, C.; Reager, J.T.; Fisher, J.B. GRACE-based Mass Conservation as a Validation Target for Basin-Scale Evapotranspiration in the Contiguous United States. Water Resour. Res. 2020, 56, e2019WR026594. [Google Scholar]
- Liu, Y.; Yue, Q.; Wang, Q.; Yu, J.; Zheng, Y.; Yao, X.; Xu, S. A Framework for Actual Evapotranspiration Assessment and Projection Based on Meteorological, Vegetation and Hydrological Remote Sensing Products. Remote Sens. 2021, 13, 3643. [Google Scholar] [CrossRef]
- Chao, L.; Zhang, K.; Wang, J.; Feng, J.; Zhang, M. A Comprehensive Evaluation of Five Evapotranspiration Datasets Based on Ground and GRACE Satellite Observations: Implications for Improvement of Evapotranspiration Retrieval Algorithm. Remote Sens. 2021, 13, 2414. [Google Scholar] [CrossRef]
- Boronina, A.; Ramillien, G. Application of AVHRR imagery and GRACE measurements for calculation of actual evapotranspiration over the Quaternary aquifer (Lake Chad basin) and validation of groundwater models. J. Hydrol. 2008, 348, 98–109. [Google Scholar] [CrossRef]
- Liu, Y.; Mo, X.; Hu, S.; Chen, X.; Liu, S. Assessment of human-induced evapotranspiration with GRACE satellites in the Ziya-Daqing Basins, China. Hydrol. Sci. J. 2020, 65, 2577–2589. [Google Scholar] [CrossRef]
- Ramillien, G.; Frappart, F.; Güntner, A.; Ngo-Duc, T.; Cazenave, A.; Laval, K. Time variations of the regional evapotranspiration rate from Gravity Recovery and Climate Experiment (GRACE) satellite gravimetry. Water Resour. Res. 2006, 42, 1–8. [Google Scholar] [CrossRef] [Green Version]
- Rodell, M.; Houser, P.R.; Jambor, U. The global land data assimilation system. Bull. Am. Meteorol. Soc. 2004, 85, 381–394. [Google Scholar] [CrossRef] [Green Version]
- Martens, B.; Gonzalez Miralles, D.; Lievens, H.; Van Der Schalie, R.; De Jeu, R.A.M.; Fernández-Prieto, D.; Beck, H.E.; Dorigo, W.A.; Verhoest, N. GLEAM v3: Satellite-based land evaporation and root-zone soil moisture. Geosci. Model Dev. 2017, 10, 1903–1925. [Google Scholar] [CrossRef] [Green Version]
- Hersbach, H.; Bell, B.; Berrisford, P.; Hirahara, S.; Horányi, A.; Muñoz-Sabater, J.; Nicolas, J.; Peubey, C.; Radu, R.; Schepers, D.; et al. The ERA5 global reanalysis. Q. J. R. Meteorol. Soc. 2020, 146, 1999–2049. [Google Scholar] [CrossRef]
- Ma, N.; Szilagyi, J.; Zhang, Y.; Liu, W. Complementary-relationship-based modeling of terrestrial evapotranspiration across China during 1982–2012: Validations and spatiotemporal analyses. Geophys. Res. Atmos. 2019, 124, 4326–4351. [Google Scholar] [CrossRef]
- Ma, N.; Szilagyi, J. The CR of evaporation: A calibration-free diagnostic and benchmarking tool for large-scale terrestrial evapotranspiration modeling. Water Resour. Res. 2019, 55, 7246–7274. [Google Scholar] [CrossRef] [Green Version]
- Ferreira, V.G.; Gong, Z.; He, X.; Zhang, Y.; Andam-Akorful, S.A. Estimating total discharge in the Yangtze River Basin using satellite-based observations. Remote Sens. 2013, 5, 3415–3430. [Google Scholar] [CrossRef] [Green Version]
- Long, D.; Longuevergne, L.; Scanlon, B.R. Uncertainty in evapotranspiration from land surface modeling, remote sensing, and GRACE satellites. Water Resour. Res. 2014, 50, 1131–1151. [Google Scholar] [CrossRef] [Green Version]
- Kendall, M.G. A new measure of rank correlation. Biometrika 1938, 30, 81–93. [Google Scholar] [CrossRef]
- Hamed, K.H.; Rao, A.R. A modified Mann-Kendall trend test for autocorrelated data. J. Hydrol. 1998, 204, 182–196. [Google Scholar] [CrossRef]
- Kendall, M.G. Rank Correlation Methods. Br. J. Psychol. 1990, 25, 86–91. [Google Scholar] [CrossRef]
- Ketema, A.; Siddaramaiah, D.G. Trend and variability of hydrometeorological variables of Tikur Wuha watershed in Ethiopia. Arab. J. Geosci. 2020, 13, 142. [Google Scholar] [CrossRef]
- Guo, M.; Li, J.; He, H.; Xu, J.; Jin, Y. Detecting Global Vegetation Changes Using Mann-Kendall (MK) Trend Test for 1982–2015 Time Period. Chin. Geogr. Sci. 2018, 28, 907–919. [Google Scholar] [CrossRef] [Green Version]
- Shadmani, M.; Marofi, S.; Roknian, M. Trend Analysis in Reference Evapotranspiration Using Mann-Kendall and Spearman’s Rho Tests in Arid Regions of Iran. Water Resour. Manag. 2012, 26, 211–224. [Google Scholar] [CrossRef] [Green Version]
- Feng, W.; Lu, H.; Yao, T.; Yu, Q. Drought characteristics and its elevation dependence in the Qinghai-Tibet plateau during the last half-century. Sci. Rep. 2020, 10, 14323. [Google Scholar] [CrossRef] [PubMed]
- Wang, W.; Zhu, Y.; Xu, R.; Liu, J. Drought severity change in China during 1961–2012 indicated by SPI and SPEI. Nat. Hazards 2015, 75, 2437–2451. [Google Scholar] [CrossRef]
- Dinpashoh, Y.; Babamiri, O. Trends in reference crop evapotranspiration in Urmia Lake basin. Arab. J. Geosci. 2020, 13, 372. [Google Scholar] [CrossRef]
- Dey, S.; Bhatt, D.; Haq, S.; Mall, R.K. Potential impact of rainfall variability on groundwater resources: A case study in Uttar Pradesh, India. Arab. J. Geosci. 2020, 13, 114. [Google Scholar] [CrossRef]
- Yang, X.; Tian, S.; Feng, W.; Ran, J.; You, W.; Jiang, Z.; Gong, X. Spatio-Temporal Evaluation of Water Storage Trends from Hydrological Models over Australia Using GRACE Mascon Solutions. Remote Sens. 2020, 12, 3578. [Google Scholar] [CrossRef]
- Jing, W.; Yao, L.; Zhao, X.; Zhang, P.; Liu, Y.; Xia, X.; Song, J.; Yang, J.; Li, Y.; Zhou, C. Understanding terrestrial water storage declining trends in the Yellow River Basin. Geophys. Res. Atmos. 2019, 124, 12963–12984. [Google Scholar] [CrossRef]
- Zhong, Y.; Zhong, M. Evaluation of Evapotranspiration for Exorheic Catchments of China during the GRACE Era: From a Water Balance Perspective. Remote Sens. 2020, 12, 511. [Google Scholar] [CrossRef] [Green Version]
- Cheng, M.; Jiao, X.; Jin, X.; Li, B.; Liu, K.; Shi, L. Satellite time series data reveal interannual and seasonal spatiotemporal evapotranspiration patterns in China in response to effect factors. Agric. Water Manag. 2021, 255, 107046. [Google Scholar] [CrossRef]
- Kumar, S.V.; Peters-Lidard, C.D.; Tian, Y.; Houser, P.R.; Geiger, J.; Olden, S.; Lighty, L.; Eastman, J.L.; Doty, B.; Dirmeyer, P.; et al. Land information system: An interoperable framework for high resolution land surface modeling. Environ. Model Softw. 2006, 21, 1402–1415. [Google Scholar] [CrossRef]
- Derber, J.C.; Parrish, D.F.; Lord, S.J. The new global operational analysis system at the National Meteorological Center. Weather Forecast. 1991, 6, 538–547. [Google Scholar] [CrossRef] [Green Version]
- Adler, R.F.; Huffman, G.J.; Chang, A.; Ferraro, R.; Xie, P.; Janowiak, J.; Rudolf, B.; Schneider, U.; Curtis, S.; Bolvin, D.; et al. The Version 2 Global Precipitation Climatology Project (GPCP) Monthly Precipitation Analysis (1979–Present). J. Hydrometeor. 2003, 4, 1147–1167. [Google Scholar] [CrossRef]
- Or, D.; Lehmann, P. Surface Evaporative Capacitance: How Soil Type and Rainfall Characteristics Affect Global-Scale Surface Evaporation. Water Resour. Res. 2019, 55, 519–539. [Google Scholar] [CrossRef] [Green Version]
- Hisdal, H.; Stahl, K. Have stream flow droughts in Europe become more severe or frequent. Int. J. Climatol. 2001, 21, 317–333. [Google Scholar] [CrossRef]
- Wu, H.; Soh, L.K.; Samal, A.; Chen, X.H. Trend analysis of stream flow drought events in Nebraska. Water Resour. Manag. 2008, 22, 145–164. [Google Scholar] [CrossRef]
- Edoga, R.N.; Suzzy, A.B.U. Effect of Temperature Changes on Evapotranspiration in Minna, Niger State. J. Eng. Appl. Sci. 2012, 3, 482–486. [Google Scholar]
- Liu, X.; Zhang, D. Trend analysis of reference evapotranspiration in Northwest China: The roles of changing wind speed and surface air temperature. Hydrol. Processes 2013, 27, 3941–3948. [Google Scholar] [CrossRef]
- Wang, X.; Tan, K.; Chen, B.; Du, P. Assessing the Spatiotemporal Variation and Impact Factors of Net Primary Productivity in China. Sci. Rep. 2017, 7, 44415. [Google Scholar] [CrossRef] [PubMed] [Green Version]
- Ji, Y.; Zhou, G.S.; Wang, S.; Wang, L. Prominent vegetation greening and its correlation with climatic variables in northern China. Environ. Monit. Assess. 2020, 192, 636. [Google Scholar] [CrossRef] [PubMed]
- Landerer, F.W.; Flechtner, F.M.; Save, H.; Webb, F.H.; Bandikova, T.; Bertiger, W.I.; Bettadpur, S.V.; Byun, S.H.; Dahle, C.; Dobslaw, H.; et al. Extending the global mass change data record: GRACE Follow-On instrument and science data performance. Geophys. Res. Lett. 2020, 47, e2020GL088306. [Google Scholar] [CrossRef]


| Time Period | Annual Precipitation | GRACE-ET | GLEAM-ET | GLDAS-ET | ERA5-ET |
|---|---|---|---|---|---|
| 2003–2010 | 47.14 | 26.92 | 14.26 | 11.68 | 24.21 |
| 2011–2019 | 50.71 | 29.05 | 17.73 | 18.57 | 22.24 |
| 2003–2019 | 49.03 | 28.05 | 16.41 | 16.56 | 22.85 |
Publisher’s Note: MDPI stays neutral with regard to jurisdictional claims in published maps and institutional affiliations. |
© 2022 by the authors. Licensee MDPI, Basel, Switzerland. This article is an open access article distributed under the terms and conditions of the Creative Commons Attribution (CC BY) license (https://creativecommons.org/licenses/by/4.0/).
Share and Cite
Qu, W.; Jin, Z.; Zhang, Q.; Gao, Y.; Zhang, P.; Chen, P. Estimation of Evapotranspiration in the Yellow River Basin from 2002 to 2020 Based on GRACE and GRACE Follow-On Observations. Remote Sens. 2022, 14, 730. https://doi.org/10.3390/rs14030730
Qu W, Jin Z, Zhang Q, Gao Y, Zhang P, Chen P. Estimation of Evapotranspiration in the Yellow River Basin from 2002 to 2020 Based on GRACE and GRACE Follow-On Observations. Remote Sensing. 2022; 14(3):730. https://doi.org/10.3390/rs14030730
Chicago/Turabian StyleQu, Wei, Zehui Jin, Qin Zhang, Yuan Gao, Pufang Zhang, and Peinan Chen. 2022. "Estimation of Evapotranspiration in the Yellow River Basin from 2002 to 2020 Based on GRACE and GRACE Follow-On Observations" Remote Sensing 14, no. 3: 730. https://doi.org/10.3390/rs14030730
APA StyleQu, W., Jin, Z., Zhang, Q., Gao, Y., Zhang, P., & Chen, P. (2022). Estimation of Evapotranspiration in the Yellow River Basin from 2002 to 2020 Based on GRACE and GRACE Follow-On Observations. Remote Sensing, 14(3), 730. https://doi.org/10.3390/rs14030730