Abstract
Basin water supply, planning, and its allocation requires runoff measurements near an estuary mouth. However, insufficient financial budget results in no further runoff measurements at critical in situ stations. This has recently promoted the runoff reconstruction via regression between the runoff and nearby remotely-sensed variables on a monthly scale. Nonetheless, reconstructing daily runoff from individual basin-upstream remotely-sensed climatic variables is yet to be explored. This study investigates standardized data regression approach to reconstruct daily runoff from the individual remotely-sensed climatic variables at the Mekong Basin’s upstream. Compared to simple linear regression, the daily runoff reconstructed and forecasted from the presented approach were improved by at most 5% and 10%, respectively. Reconstructed runoffs using neural network models yielded ~0.5% further improvement. The improvement was largely a function of the reduced discrepancy during dry and wet seasons. The best forecasted runoff obtained from the basin-upstream standardized precipitation index, yielded the lowest normalized root-mean-square error of 0.093.
1. Introduction
Water resources management requires in situ river discharge measurements for predicting potential hydrological hazards. The decreasing number of global river discharge stations have promoted the river discharge reconstruction via linear regression between remotely-sensed data and in situ river discharge [1]. This reconstruction method has provided an initiative to complement the decreasing number of in situ river discharge time series worldwide.
Previous studies regressed in situ river discharge directly with localized passive remotely-sensed data (e.g., vegetation index, temperature [2,3], estuary dimension [4], and flood extent mapping [5]) for the river discharge reconstruction, as long as these remotely-sensed data are well correlated with the in situ river discharge. Nonetheless, these data are sensitive to land cover types and present no direct causal relationship with the in situ river discharge. The reconstruction accuracy is also spatially-varying. As a result, remote-sensed climatic variables should be preferable, since they present direct causal relations to the in situ river discharge (in particular when it is considered at a basin scale).
Precipitation, water level, and land water storage are the climate variables that can be remotely measured or inferred from tropical rainfall measuring mission (TRMM) satellite [6], satellite altimetry [7], and satellite gravimetry (e.g., gravity recovery and climate experiment (GRACE)) [8], respectively. These remotely-sensed climatic variables have been widely used in hydrologic and climatic studies, including river discharge and/or runoff reconstruction. For instance, TRMM monthly precipitation was used for hydrologic prediction [9,10], drought [11,12] and flood [13,14] monitoring, their climatologies [15], and their evaluation against in situ precipitation [16,17,18]. Nonetheless, the potential usage of daily precipitation inferred from TRMM remain elusive [19,20].
In addition, near-biweekly water level recorded by satellite altimetry (e.g., Sentinel, Envisat, and Jason-3) was used for monitoring land water bodies, such as small rivers in Indonesia [21], global continental lakes [22], and dams (or reservoirs) in the upper Mekong Basin [23]. A power function relation between the recorded water level and the in situ river discharge [24,25] enables river discharge reconstruction in the Mekong Basin [26]. Similar practices applied to runoff of the basin, this being the river discharge at the estuary divided by a basin area. Specifically, the monthly basin-averaged land water storage inferred from GRACE can relate to in situ runoff via the power function [27,28], or via the water balance equation when precipitation and evapotranspiration are given [29,30]. However, the potential of daily land water storage inferred from GRACE for daily runoff reconstruction remains unexplored.
Notably, in hydrological practice, linear regression, hydraulic functional relationship, time series model, and the neural networks (NN) model are the four methods employed for the runoff reconstruction and forecast. The linear regression and hydraulic functional relationship are commonly employed for the runoff reconstruction using remotely-sensed data. For instance, the in situ runoff is related to TRMM precipitation via linear regression, while it is related to the monthly basin-averaged land water storage (or water level) via hydraulic functional relationship (e.g., the power function). Furthermore, time series model and NN model are widely used, in which NN model gives a relatively more accurate results that of other methods [31]. However, under normal circumstances, data, taking no account of potential biases, are input directly into the above models. Note also that data are input into NN model in different orders with several runs that generate different numerical results during training and testing stage.
Given the disadvantages from the above, a method that reduces the potential biases with unique numerical result should be advocated. Data standardization, (i.e., numerical values in the time series subtracted from their mean divided by corresponding standard deviation) is the method that improves the sensitivity of detecting potential biases when compared against the averaged time series [32,33]. This method allows partial reduction of potential biases, and hence better capturing extreme conditions [34] which is why it is being employed in this study.
Notably, the in situ runoff was seasonally distorted by artificial reservoirs in the downstream Mekong Basin that releases (traps) the streamflow during dry (wet) season while keeping annual runoff unchanged [35]. The cascade effect due to all artificial reservoir operations from the entry of the downstream Mekong Basin to the delta of the river is found to be systematic for each season every year [36]. Tonle Sap Lake, being a natural reservoir, also provides similar functionality [37]. This partial systematic effect justifies the usage of data standardization to mitigate potential biases for a particular data time period [34]. Hence, the proposed standardized data regression approach is expected to reduce the peak and trough discrepancies against the in situ one in this study.
This paper aims at regressing upstream standardized remotely-sensed climatic variables with the standardized in situ runoff on a daily scale, making use of time-lagged relationship with the downstream water level [38] and/or runoff [39]. Its forecast ability is assessed by the direct linear regression and the NN-based models, in order to show the effectiveness of our proposed method. Comparison of the numerical results proposed from this study against the best achievable monthly and daily [40,41,42] relative error has also been made in the recent literature.
2. Study Area
The Mekong Basin is a latitudinal basin across two climate zones, where it is subdivided into upstream (i.e., Lancang river within Yunnan province in China) and downstream (i.e., from the exit of China transboundary at Manwan to the river delta) area (Figure 1). Therefore, Yunnan province in China is a critical upstream area of the Mekong Basin, with an obvious wet season driven by the Indian monsoon in summer [43,44]. Notice that occasional events, such as El Niño Southern Oscillation (ENSO), cannot be underestimated in the Mekong Basin, since it seriously distorts the spatiotemporal precipitation pattern, and consequently, the runoff [45,46].
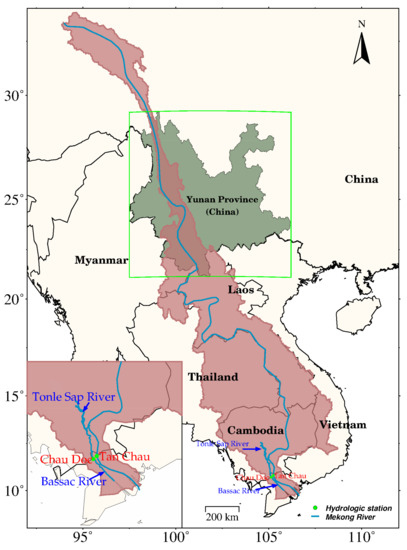
Figure 1.
The Mekong River Basin (red area) overlapping with Yunnan province of China (dark green area) covered with the hydrologic stations at the river delta entrance (green dot).
Besides climate, the regulation effect due to Tonle Sap Lake [47] and the tidal backwater effect causing salt intrusion [48] also provide substantial effects on the water level and runoff in the river delta. Additionally, human activities, such as sand mining, dike construction, groundwater extraction, and reservoir operations [49] also amplify the tidal backwater effect and salt intrusion [50]. Above all, artificial reservoir operation is the main cause of long-term seasonal runoff alteration, due to a multitude number of artificial reservoirs built during 1990s, particularly when the in situ runoff time series were compared before and after 2002 [51,52,53]. Notably, most reliable remotely-sensed climatic variables were unavailable before 2002 (in particular GRACE land water storage. The usage of the two remotely-sensed climatic variables after 2002 eliminates the need for assessing the reconstructed runoff changes before and after 2002.
3. Data
3.1. In Situ Discharge Data
Two in situ discharge stations (i.e., Tan Chau and Chau Doc) situated in the two main branches (i.e., Tien River and Han River) of the river delta entrance are employed (Figure 1), since the station pair at the river delta entrance experienced lesser tidal backwater influence than that of the station pair near the estuary mouth (i.e., Can Tho and My Thuan) [54,55]. These data were purchased from the Mekong River Commission website (http://www.mrcmekong.org) (accessed on 19 April 2021). Despite water loss to the floodplain diversion in the river delta, the time series of Tan Chau and Chau Doc (hereinafter called TC-CD) station were summed up in order to approximately represent the total discharge of the entire Mekong Basin. To obtain the daily runoff of TC-CD station (in mm/day), the daily runoff of TC-CD (in m3/s) were divided by the total area of the Mekong Basin with the unit conversion from meter to millimeter, and from second to day. The daily runoff time series displays seasonality with irregular peaks and troughs, in particular during 2009–2014 (Figure 2).
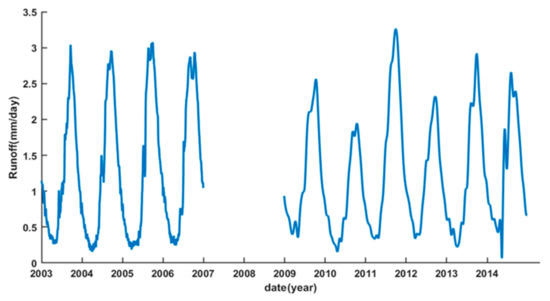
Figure 2.
Daily runoff time series of TC-CD stations within the river delta during 2003–2006 and 2009–2014.
Due to the time series data availability during 2003–2006 and 2009–2014, the daily runoff time series of TC-CD station during 2003–2006 were employed for time lag analysis against the upstream TRMM (GRACE) daily precipitation (land water storage), respectively. The time series during 2009–2012 and 2013–2014 were used for the reconstruction and forecast, respectively.
3.2. Two Remotely-Sensed Climatic Variables
Being the third-level TRMM data product, daily quarter-gridded precipitation with latitude coverage between 50°N and 50°S generated from the seventh edition of TRMM Multi-Satellite Precipitation Analysis (TRMA) product 3B42 datasets during 1998–2014 were employed. These data could be accessible at https://disc.gsfc.nasa.gov/ (accessed on 6 June 2021). Note that these data might not be independent of the in situ precipitation from Global Precipitation Climatology Center [6].
Being the second-level GRACE data product, daily 40-degree spherical harmonic coefficients, equivalent to a spatial resolution of 4.5°, were computed by Institute of Geodesy at Graz University of Technology (ITSG) (i.e., ITSG-GRACE2018 [56]). Datasets during 2003–2014 were employed to calculate land water storage. These data can be downloaded from International Center for Global Earth Models (ICGEM) at http://icgem.gfz-potsdam.de/series (accessed on 6 March 2019).
3.3. El Niño and Southern Oscilation (ENSO) Indices
ENSO is a large-scale aperiodic event caused by atmosphere-ocean interaction in the tropical Pacific Ocean. This causes floods and droughts at different places non-uniformly around the world [45]. Manifested from pressure and sea surface temperature anomalies [57], El Niño (La Niña) yields the warm (cold) phase of the ENSO events respectively. ENSO indices, including Oceanic Nino Index (ONI) and Multivariate ENSO Index (MEI), were employed to visually examine whether the influence of a particular ENSO event on the runoff is substantial, in particular for the prolonged strong La Niña events during 2010–2011 (Figure 3). All indices are available at https://www.esrl.noaa.gov/psd/data/climateindices/list/ (accessed on 6 June 2021).
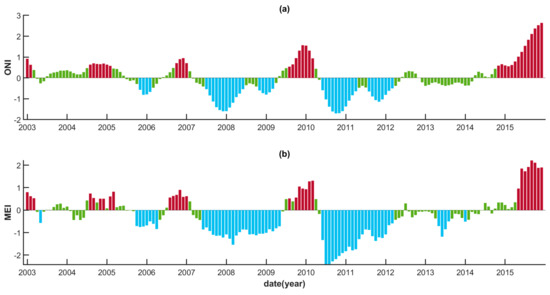
Figure 3.
The monthly time series of (a) ONI and (b) MEI. Green, blue, and red bars represent the neutral parts, the cold phase (La Niña event), and the warm phase (El Niño event), respectively.
4. Methodology
The flow of our methodology, including data post-processing, data standardization steps, methods for regressing each variable for runoff reconstruction and forecast, and validation, is illustrated in Figure 4.
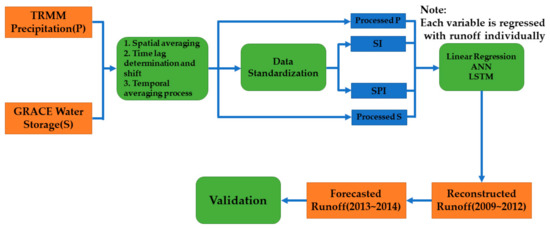
Figure 4.
The methodology flowchart.
4.1. Data Pre- and Post-Processing along with Their Standardizations
In terms of data preprocessing, while TRMM daily precipitation are ready for post-processing, pre-processing for GRACE daily land water storage data is required. Due to the low spatial resolution of the daily land water storage data, and the lack of daily geocentric motion and geoidal surface (representing as the second-degree term, C20, in the GRACE data in terms of spherical harmonic coefficients) generated from satellite laser ranging, the data processing steps are different from the regular monthly land water storage inferred from GRACE. First, the daily geocentric motion data provided by Graz University of Technology was added to the first-degree spherical harmonic coefficients, while the C20 of these daily data was retained. Note that the daily land water storage data inferred from GRACE has been stabilized by regularized constraints with Kalman filtering during the data generation process, and no spatial filtering is further required for post-processing.
In terms of data post-processing, all remotely-sensed climate variables within Yunnan province are first spatially averaged to generate a single time series, followed by applying a two-month moving averaging process. Time-lagged shift between the upstream remotely-sensed climate variables and the in situ runoff is applied before direct linear regression. This reconstructed and forecasted runoff served as a baseline result against the proposed data standardization method.
Non-rainy days yield zero precipitation values, making that precipitation does not follow normal distribution. Therefore, McKee et al. (1993) [58] standardization process was employed to calculate the standardized precipitation index (SPI) from TRMM precipitation data time span during 1998–2014. The standardization process adjusted the data to follow normal distribution via gamma function [59]. Note that the the-month time scale of SPI was selected [60].
Since the land water storage should be continuous for non-rainy days, the conventional form of data standardization used in statistics was employed for GRACE data, except the daily median values were used to calculate the standardized land water storage [34] as follows:
where i and j are the year and day of year (DOY), respectively, is the land water storage on the j th day of the year i, and represent the median value and standard deviation of the land water storage on j day of each year. Therefore, the processed TRMM precipitation and its SPI, and GRACE land water storage and its SI are ready for linear regression analysis.
4.2. Time Lag Determination, Linear Regression Model, and NN-Based Model
Owing to the hysteretic process between the remotely-sensed climatic variables (i.e., TRMM precipitation and GRACE land water storage) and the runoff within a river basin, there exists a time lag between the remotely-sensed climatic variables and the runoff time series, particularly for the Mekong Basin across different climate zones. Previous studies have shown that the runoff lagged behind the upstream TRMM precipitation [61,62] and GRACE land water storage [28] by a month or more, which is controlled by climate, geomorphology, and hydrogeology [29]. Thus, the time lag between the in situ runoff and the upstream spatially-averaged TRMM precipitation (or GRACE land water storage) has to be determined before the linear regression.
To conduct the linear regression, a simple linear model between the in situ runoff and TRMM precipitation (or GRACE land water storage) is set up as:
where and are the in situ runoff and individual upstream TRMM precipitation (or GRACE land water storage) at day t, respectively, with lagged time shifting X forward when compared to runoff as mentioned from the above; and are the parameters to be empirically estimated via a least-squares solution. The estimated parameters are then used to reconstruct runoff using the upstream TRMM precipitation (or GRACE land water storage) time series during 2009–2012.
In order to correlate the standardized precipitation (i.e., SPI) (and the standardized land water storage (i.e., SI)) inferred from TRMM and GRACE at the upstream, respectively, with the standardized in situ runoff in this study, the in situ runoff is standardized as
which is analogous to that of Equation (1). Equation (2) is further used to estimate the corresponding and between the standardized runoff (i.e., SR) and the SPI (or SI)) at the upstream. These two estimated parameters are then used to compute the corresponding standardized runoff from SPI and SI, and subsequently, recovering back to the reconstructed runoff time series via Equation (3). The estimated parameters and same methodology are also applied to the runoff forecast during 2013–2014.
Meanwhile, we compare our above approach with two NN-based models (i.e., artificial neural network (ANN) [63] and long short-term memory (LSTM) algorithm belonging to recurrent neural networks [64]) chosen in this study. Previous study indicated their excellent performances for both short- and long-term discharge forecasting over the linear regression, time series analysis, and conceptual models [31].
For the NN-based model settings, the ANN model consists of an input, an output, and a hidden layer. Two hidden layers with four neurons each layer were set (as this was tested and determined to be the best choice for this study). Cybenko [65] also concluded that continuous-valued NN with two hidden layers were sufficient. The upstream TRMM precipitation and GRACE land water stage (or SPI and SI) were placed in the input layer, while the in situ runoff (or SR) was placed in the output layer, respectively. A leave-one-out training-validation-test procedure was applied, similar to that of [66]. A scaled exponential linear unit [67] was chosen as an activation function and adaptive moment (i.e., Adam) optimizer [68] was employed for training. The neural network structure of LSTM was set the same as that of ANN. After all, LSTM is an improved RNNs that solves the gradient divergence problem in recurrent neural networks [69]. Random choice of the initial weights, the members of the validation set, and difference order of sequences employed in the training process would result in different numerical results for each run [66]. Therefore, the above two models were run ten times individually. The mean value of each time epoch was used.
After the above procedures, the runoff time series reconstructed and forecasted from our approach were compared with the results from the chosen NN-based models in order to further validate our approach in this study.
4.3. Model Validation Metrics
To evaluate the runoff reconstruction and forecast accuracy against the in situ runoff, the following unitless metrics, including the normalized root-mean-square error (NRMSE), the Nash–Sutcliffe efficiency model coefficient (NSEMC), and the Pearson correlation coefficient (PCC), were adopted due to their conventional usage and representation of consistency in a relative sense.
The NRMSE represents the relative error of the RMSE [40], which is computed as
The NSEMC [70] is widely employed to evaluate the efficiency gain in the performance of the reconstructed or forecasted runoff against the in situ runoff. It is computed as
The PCC determines the temporal agreement between the reconstructed and forecasted runoff. It is computed as
where and are the observed and reconstructed (or forecasted) runoff for day k; and are the average of and , respectively, and and are maximum and minimum values of the in situ time series, , respectively.
5. Results
After spatially averaging over the whole Yunnan Province for a single TRMM daily precipitation and GRACE daily land water storage time series, the time lag between the in situ runoff and TRMM precipitation (or GRACE land water storage) at the upstream during 2003–2006 was calculated for every lagged day up to 90 days (or 30 days), respectively (Figure 5). The maximum PCC between the in situ runoff and TRMM precipitation (or GRACE land water storage) at the upstream was attained when the lagged time was 66 days (or 16 days), respectively. This is due to the fact that the upstream available water takes 66 days (or 16 days) for precipitation and land water storage to reach the estuary mouth. This implies that TRMM precipitation (or GRACE land water storage) at the upstream, when available in advance, can be able to forecast the runoff. Hence, the established empirical relationship should provide an early warning of extreme hydrological events in the river delta. As a result, the in situ runoff was shifted 66 days (16 days) backward with respect to precipitation (land water storage), respectively, before the linear regression using Equation (2).
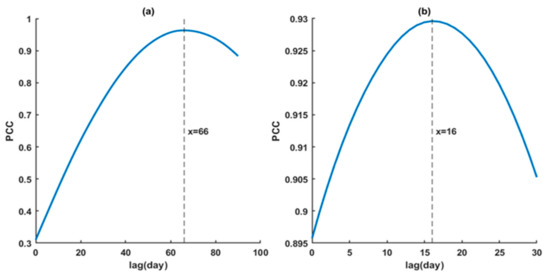
Figure 5.
Pearson Correlation coefficient between the in situ runoff and (a) TRMM precipitation or (b) GRACE land water storage in Yunnan Province up to 90-day (or 30-day) lagged time.
After shifting the lagged time, Figure 6 displays the time series of TRMM precipitation and GRACE land water storage at the upstream against the in situ runoff from 2009 to 2014. In general, seasonal fluctuations of the upstream TRMM precipitation and GRACE land water storage are consistent with that of the in situ runoff. However, the upstream GRACE land water storage exhibits a slower storage decrease than that of the in situ runoff during streamflow recession period. This might be attributable to the hydrogeological property of the storage-discharge relation of the upstream different from that of the downstream. In addition, a further time shift of GRACE land water storage is observed in 2014. This might be attributable to poor quality data from GRACE satellite during the end-of-mission phase, amid the negligible ENSO effect during the period (as shown in Figure 3). In summary, the similarity between the in situ runoff and the upstream TRMM precipitation (or GRACE land water storage) provides a good basis for the direct usage of Equation (2) for reconstructing runoff.
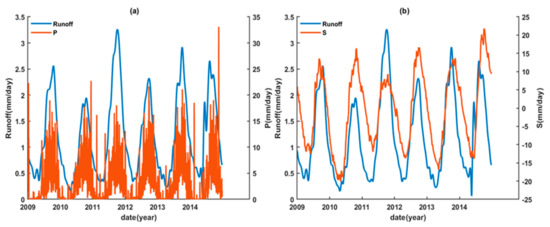
Figure 6.
Time series of (a) TRMM daily precipitation (i.e., P) (66 lagged days) and (b) GRACE daily land water storage (i.e., S) (16 lagged days) spatially averaged over Yunnan Province at the upstream Mekong Basin against the in situ runoff during 2009–2014.
We then examined the performances of the reconstructed (during 2009–2012) and forecasted (during 2013–2014) runoff time series using the upstream TRMM precipitation, GRACE land water storage, and their standardized forms, generated from the linear regression, ANN, and LSTM models. For the runoff time series reconstructed and forecasted from the upstream TRMM precipitation and GRACE land water storage, the runoff time series resulting from three different methods are similar (Figure 7 and Figure 8).

Figure 7.
The reconstructed (during 2009–2012) and forecasted (during 2013–2014) runoff using the upstream TRMM precipitation (i.e., P-runoff) based on (a) linear regression, (b) ANN, and (c) LSTM models.
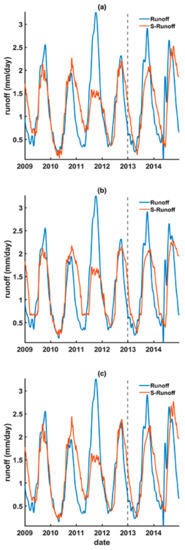
Figure 8.
The reconstructed (during 2009–2012) and forecasted (during 2013–2014) runoff using the upstream GRACE land water storage (i.e., S-runoff) based on (a) linear regression, (b) ANN, and (c) LSTM models.
We observe that the peaks of runoff reconstructed and forecasted from the upstream TRMM precipitation by the linear regression (Figure 7a) are generally the same as that of ANN (Figure 7b) and LSTM (Figure 7c). Except that the reconstructed peak value in 2010 is higher than that of the in situ runoff, the peaks for the other year are basically lower. This is particularly apparent in 2011. This should be attributable to the strong La Niña event in 2011 (Figure 3) which distorts the normal conditions of climatic variables between the upstream and the downstream (and which will be qualitatively explained below). Meanwhile, similar troughs resulting from the three different methods are observed.
Unlike runoff time series reconstructed and forecasted from the upstream TRMM precipitation, the runoff time series reconstructed and forecasted from GRACE land water storage (Figure 8) decreases slower than the in situ runoff in autumn and winter (i.e., streamflow recession period) in 2010, 2012, 2013, and 2014 when compared to that in Figure 7. The reason for this might be the fact that the hydrogeological property of the storage-discharge relation of the upstream is different from that of the downstream. Other characteristics of the runoff time series reconstructed and forecasted from the upstream GRACE land water storage are similar to that of the upstream TRMM precipitation.
In any occasion, runoff time series reconstructed and forecasted by NN-based models account for less than 0.5% improvement when compared to that of the linear regression (Table 1). Overall, the reconstructed runoff based directly on the upstream TRMM precipitation and GRACE land water storage yield the PCC (NRMSE) of 0.85 (~13%) and 0.80 (~15%), respectively. These evaluation statistics are slightly inferior to the best achievable daily relative error (i.e., 12%) in the recent literature [42], which might be attributable to different time spans being employed. Nonetheless, the above numerical results are served as baselines for our proposed standardization approach.

Table 1.
Evaluation of runoff reconstruction and forecast.
The reconstructed runoff based on the standardized remotely-sensed climate variables (i.e., SPI and SI) are shown to have better outcomes than that of the direct linear regression between the in situ runoff and TRMM precipitation (or GRACE land water storage) at the upstream (Table 1). In general, the reconstructed runoff based on SPI and SI match the peaks and troughs better when compared to the in situ runoff, particularly apparent in capturing the worst estimated peak in 2011 (Figure 9 and Figure 10).

Figure 9.
The reconstructed (during 2009–2012) and forecasted (during 2013–2014) runoff using the upstream TRMM SPI (i.e., SPI-runoff) based on (a) linear regression, (b) ANN, and (c) LSTM models.

Figure 10.
The reconstructed (during 2009–2012) and forecasted (during 2013–2014) runoff using the upstream GRACE SI (i.e., SI-runoff) based on (a) linear regression, (b) ANN, and (c) LSTM models.
Compared to the result based on the direct linear regression between the in situ runoff and TRMM precipitation (or GRACE land water storage) at the upstream, the reconstructed runoff based on SPI and SI is improved by 3% and 5%, while the forecasted runoff based on SPI and SI is improved by 1.5% and 10%, respectively (Table 1). This is due to the fact that the standardization can minimize the systematic influences [32]. In addition, the relative accuracies for both the reconstructed and forecasted runoff are less than 10%, which is slightly better than the best achievable accuracy in the recent literature (i.e., 12%).
6. Discussion
In the presence of the moderate (strong) El Niño (La Niña) event during 2009–2010 (2010–2011), apparent discrepancies in the peaks against the in situ runoff during 2010–2011 are still present, notwithstanding the reconstructed runoff based on SPI and SI. As a result, the time series of the SPI and SI at the upstream during 2009–2012 were examined against the in situ SR for further possible reasons (Figure 11).
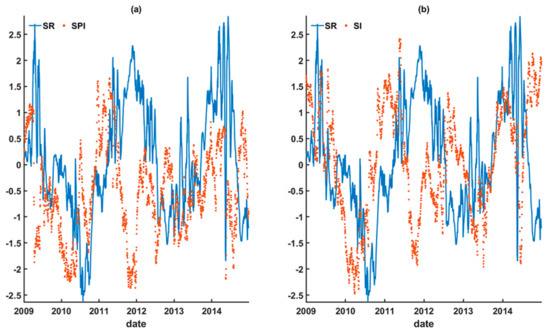
Figure 11.
The time series of the upstream (a) SPI from TRMM and (b) SI from GRACE spatially averaged in Yunnan Province against the in situ runoff during 2009–2014.
Comparing SPI and SI against the in situ SR during 2009–2014, both the SPI and SI time series exhibit random patterns against the in situ SR, except for the reverse (i.e., anti-phase) temporal pattern against SR between June and September 2010, January and April 2011, and July 2011 and February 2012. This is attributable to the occurrence of the moderate (strong) El Niño (La Niña) events during 2009–2010 (2010–2011). Notice that the effect of the moderately strong ENSO events on the runoff normally comes after six to nine months [71]. This implies the downstream climatic variables (as manifested from SR) were dry (humid) while that of the upstream were humid (dry) during the moderate (strong) El Niño (La Niña) event that distorted the typical precipitation pattern of the upstream and the downstream Mekong Basin, respectively. We speculate that SPI and SI might be potentially assisted by ENSO index during linear regression in order to yield a better reconstructed and forecasted runoff. However, it is challenging to make monthly ENSO index and its metric unit to be compatible with the daily TRMM precipitation and GRACE land water storage.
Based on the above result and discussion, the upstream standardized climatic variables are observed to have a substantial discrepancy against the standardized in situ runoff when moderately strong ENSO events are taken place. This limits further accuracy improvement of the runoff reconstruction. Although the standardization approach reduces part of the inconsistency when a strong La Niña event was present, the discrepancy is still considerably present (as displayed in Figure 9 and Figure 10). In addition, besides the chosen value of the difference (i.e., SPI and SI), the chosen mean (or median) value of each day within the year for the entire time series is also a critical component for the recovery of the standardized runoff back to the runoff time series, similar to that of datum fixing in a GPS network [72]. These shortcomings represent the limitations of this study.
7. Conclusions
This paper shows the feasibility of reconstructing and forecasting daily Mekong Basin runoff using daily remotely-sensed climatic variables (e.g., TRMM precipitation and GRACE land water storage) at the upstream area. Using results generated from the direct the linear regression and neural network-based models as the baselines, we present and examine our standardization approach that reduce the discrepancy against the in situ runoff data (in particular in the presence of the moderate (strong) El Niño (La Niña) events).
Employing the linear regression, the reconstructed and forecasted runoff based on the upstream TRMM precipitation (GRACE land water storage) are at the acceptable level, with PCC larger than 0.85 (0.73) and relative discrepancy less than 13% (20%) in terms of NRMSE, respectively. The reconstructed and forecasted runoff via neural network-based models yield around 0.5% improvement over those results from the linear regression. Employing the presented standardization approach, the reconstructed runoff based on the standardized precipitation (i.e., SPI) and land water storage (i.e., SI) show the NRMSE improvement by 3% and 5%, respectively, when compared to the direct linear regression, while the forecasted ones are improved by 1.5% and 10%, respectively. Overall, the forecasted runoff generated from the SPI averaged over the whole upstream area yielded the lowest relative error in terms of NRMSE (i.e., 0.093 or 9.3%).
However, the discrepancies are still considerably present during the abnormal conditions. Further investigation should consist in examining the chosen mean (or median) values for different data time spans in the standardization process under normal and abnormal conditions (e.g., under strong ENSO events). Potential incorporation of ENSO and/or a monsoon index into the linear regression model which assists the runoff reconstruction and forecast during the abnormal conditions can be further explored, subject to consistent unit among the explanatory variables (i.e., climatic variables and ENSO and/or monsoon index) and the response variable (i.e., runoff). This would yield a more detailed research findings and further substantial improvement in the runoff reconstruction and forecast using daily remotely-sensed climatic variables at the upstream.
Author Contributions
Conceptualization, H.S.F.; methodology, H.S.F. and L.Z.; software, L.Z.; validation, H.S.F., Y.C. and L.Z.; formal analysis, H.S.F.; investigation, H.S.F.; resources, H.S.F.; data curation, L.Z.; writing—original draft preparation, H.S.F.; writing—review and editing, H.S.F., L.Z. and Y.C.; visualization, Y.C.; supervision, H.S.F.; project administration, H.S.F.; funding acquisition, H.S.F. All authors have read and agreed to the published version of the manuscript.
Funding
This study was financially supported by the National Natural Science Foundation of China (NSFC) (Grant Nos.: 41974003, 41674007, 41374010).
Institutional Review Board Statement
Not applicable.
Informed Consent Statement
Not applicable.
Data Availability Statement
Not applicable.
Acknowledgments
We acknowledge the river discharge data supplied by the Mekong River Commission (http://www.mrcmekong.org) (accessed on 19 April 2021) under agreement and purchase using NSFC Grant No.: 41374010.
Conflicts of Interest
The authors declare no conflict of interest.
References
- Sneeuw, N.; Lorenz, C.; Devaraju, B.; Tourian, M.J.; Riegger, J.; Kunstmann, H.; Bardossy, A. Estimating runoff using hydro-geodetic approaches. Surv. Geophys. 2014, 35, 1333–1359. [Google Scholar] [CrossRef]
- Zhou, L.; Fok, H.S.; Ma, Z.; Chen, Q. Upstream Remotely-Sensed Hydrological Variables and Their Standardization for Surface Runoff Reconstruction and Estimation of the Entire Mekong River Basin. Remote Sens. 2019, 11, 1064. [Google Scholar] [CrossRef] [Green Version]
- Yue, W.; Xu, J.; Tan, W.; Wu, L. The relationship between land surface temperature and NDVI with remote sensing: Application to shanghai Landsat 7 ETM+ data. Int. J. Remote Sens. 2007, 28, 3205–3226. [Google Scholar] [CrossRef]
- Gleason, C.J.; Smith, L.C. Toward global mapping of river discharge using satellite images and at-many-stations hydraulic geometry. Proc. Natl. Acad. Sci. USA 2014, 111, 4788–4791. [Google Scholar] [CrossRef] [Green Version]
- Pan, F.; Nichols, J. Remote sensing of river stage using the cross-sectional inundation area-river stage relationship (IARSR) constructed from digital elevation model data. Hydrol. Process. 2013, 27, 3596–3606. [Google Scholar] [CrossRef]
- Huffman, G.J.; Adler, R.F.; Bolvin, D.T.; Gu, G.; Nelkin, E.J.; Bowman, K.P.; Hong, Y.; Stocker, E.F.; Wolff, D.B. The TRMM Multi-satellite Precipitation Analysis: Quasi-Global, Multi-Year, Combined-Sensor Precipitation Estimates at Fine Scale. J. Hydrometeorol. 2007, 8, 38–55. [Google Scholar] [CrossRef]
- Frappart, F.; Minh, K.D.; L’Hermitte, J.; Cazenave, A.; Ramillien, G.; Le Toan, T.; Mognard-Campbell, N. Water volume change in the lower Mekong from satellite altimetry and imagery data. Geophys. J. Int. 2006, 167, 570–584. [Google Scholar] [CrossRef] [Green Version]
- Wahr, J.; Swenson, S.; Zlotnicki, V.; Velicogna, I. Time-variable gravity from GRACE: First results. Geophys. Res. Lett. 2004, 31, L11501. [Google Scholar] [CrossRef] [Green Version]
- Su, F.; Hong, Y.; Lettenmaier, D.P. Evaluation of TRMM Multisatellite Precipitation Analysis (TMPA) and its utility in hydrologic prediction in the La Plata Basin. J. Hydrometeorol. 2008, 9, 622–640. [Google Scholar] [CrossRef] [Green Version]
- He, Q.; Fok, H.S.; Chen, Q.; Chun, K.P. Water Level Reconstruction and Prediction Based on Space-Borne Sensors: A Case Study in the Mekong and Yangtze River Basins. Sensors 2018, 18, 3076. [Google Scholar] [CrossRef] [PubMed] [Green Version]
- Mutuga, K.J.; Nyadawa, M.O.; Home, P.G. Use of downscaled tropical rainfall measuring mission data for meteorological drought monitoring: Case study of Narumoru catchment. Int. J. Adv. Eng. Technol. 2014, 7, 1375–1385. [Google Scholar]
- Naumann, G.; Barbosa, P.; Carrao, H.; Singleton, A.; Vogt, J. Monitoring drought conditions and their uncertainties in Africa using TRMM data. J. Appl. Meteorol. Climatol. 2012, 51, 1867–1874. [Google Scholar] [CrossRef] [Green Version]
- Harris, A.; Rahman, S.; Hossain, F.; Yarborough, L.; Bagtzoglou, A.C.; Easson, G. Satellite-based flood modeling using TRMM-based rainfall products. Sensors 2007, 7, 3416–3427. [Google Scholar] [CrossRef] [PubMed] [Green Version]
- Tekeli, A.E.; Fouli, H. Evaluation of TRMM satellite-based precipitation indexes for flood forecasting over Riyadh City, Saudi Arabia. J. Hydrol. 2016, 541, 471–479. [Google Scholar] [CrossRef]
- Yan, Y.; Wu, H.; Gu, G.; Huang, Z.; Alfieri, L.; Li, X.; Nanding, N.; Pan, X.; Tang, Q. Climatology and interannual variability of floods during the TRMM era (1998–2013). J. Clim. 2020, 33, 3289–3305. [Google Scholar] [CrossRef]
- Li, X.; Zhang, Q.; Ye, X. Dry/wet conditions monitoring based on TRMM rainfall data and its reliability validation over Poyang Lake Basin, China. Water 2013, 5, 1848–1864. [Google Scholar] [CrossRef]
- Tao, H.; Fischer, T.; Zeng, Y.; Fraedrich, K. Evaluation of TRMM 3B43 precipitation data for drought monitoring in Jiangsu Province, China. Water 2016, 8, 221. [Google Scholar] [CrossRef] [Green Version]
- Yan, N.; Wu, B.; Chang, S.; Bao, X. Evaluation of TRMM Precipitation Product for Meteorological Drought Monitoring in Hai Basin. IOP Conf. Ser. Earth Environ. Sci. 2014, 17, 012093. [Google Scholar] [CrossRef] [Green Version]
- Shirmohammadi-Aliakbarkhani, Z.; Akbari, A. Ground validation of diurnal TRMM 3B42 V7 and GPM precipitation products over the northeast of Iran. Theor. Appl. Climatol. 2020, 142, 1413–1423. [Google Scholar] [CrossRef]
- Su, F.; Gao, H.; Huffman, G.J.; Lettenmaier, D.P. Potential utility of the real-time TMPA-RT precipitation estimates in streamflow prediction. J. Hydrometeorol. 2011, 12, 444–455. [Google Scholar] [CrossRef] [Green Version]
- Sulistioadi, Y.B.; Tseng, K.H.; Shum, C.K.; Hidayat, H.; Sumaryono, M.; Suhardiman, A.; Setiawan, F.; Sunarso, S. Satellite radar altimetry for monitoring small rivers and lakes in Indonesia. Hydrol. Earth Syst. Sci. 2015, 19, 341–359. [Google Scholar] [CrossRef] [Green Version]
- Calmant, S.; Seyler, F.; Cretaux, J.F. Monitoring continental surface waters by satellite altimetry. Surv. Geophys. 2008, 29, 247–269. [Google Scholar] [CrossRef]
- Liu, K.T.; Tseng, K.; Shum, C.K.; Liu, C.Y.; Kuo, C.Y.; Liu, G.; Jia, Y.; Shang, K. Assessment of the impact of reservoirs in the upper Mekong River using satellite radar altimetry and remote sensing imageries. Remote Sens. 2016, 8, 367. [Google Scholar] [CrossRef] [Green Version]
- Beven, K.J. Rainfall-Runoff Modelling: The Primer; John Wiley Sons Chichester: Hoboken, NJ, USA, 2001. [Google Scholar]
- Tourian, M.J.; Sneeuw, N.; Bárdossy, A. A quantile function approach to discharge estimation from satellite altimetry (ENVISAT). Water Resour. Res. 2013, 49, 4174–4186. [Google Scholar] [CrossRef]
- Birkinshaw, S.J.; O’Donnell, G.M.; Moore, P.; Kilsby, C.G.; Fowler, H.J.; Berry, P.A.M. Using satellite altimetry data to augment flow estimation techniques on the Mekong River. Hydrol. Process. 2010, 24, 3811–3825. [Google Scholar] [CrossRef]
- Riegger, J.; Tourian, M.J. Characterization of runoff-storage relationships by satellite gravimetry and remote sensing. Water Resour. Res. 2014, 50, 3444–3466. [Google Scholar] [CrossRef]
- Sproles, E.A.; Leibowitz, S.G.; Reager, J.T.; Wigington, P.J.; Famiglietti, J.S.; Patil, S.D. GRACE storage-runoff hystereses reveal the dynamics of regional watersheds. Hydrol. Earth Syst. Sci. 2015, 19, 3253–3272. [Google Scholar] [CrossRef] [Green Version]
- Chen, Y.; Fok, H.S.; Ma, Z.; Tenzer, R. Improved Remotely Sensed Total Basin Discharge and Its Seasonal Error Characterization in the Yangtze River Basin. Sensors 2019, 19, 3386. [Google Scholar] [CrossRef] [Green Version]
- Syed, T.H.; Famiglietti, J.S.; Chambers, D.P. GRACE-based estimates of terrestrial freshwater discharge from basin to continental scales. J. Hydrometeorol. 2009, 10, 22–40. [Google Scholar] [CrossRef]
- Wang, W.-C.; Chau, K.-W.; Cheng, C.-T.; Qiu, L. A comparison of performance of several artificial intelligence methods for forecasting monthly discharge time series. J. Hydrol. 2009, 374, 294–306. [Google Scholar] [CrossRef] [Green Version]
- Ferreira, V.G.; Montecino, H.C.; Ndehedehe, C.E.; Heck, B.; Gong, Z.; De Freitas, S.R.C.; Westerhaus, M. Space-based observations of crustal deflections for drought characterization in brazil. Sci. Total Environ. 2018, 644, 256–273. [Google Scholar] [CrossRef] [PubMed]
- Jones, P.D.; Hulme, M. Calculating regional climatic time series for temperature and precipitation: Methods and illustrations. Int. J. Climatol. 1996, 16, 361–377. [Google Scholar] [CrossRef]
- Fok, H.S.; He, Q. Water Level Reconstruction Based on Satellite Gravimetry in the Yangtze River Basin. ISPRS Int. J. Geo-Inf. 2018, 7, 286. [Google Scholar] [CrossRef] [Green Version]
- Räsänen, T.A.; Someth, P.; Lauri, H.; Koponen, J.; Sarkkula, J.; Kummu, M. Observed river discharge changes due to hydropower operations in the Upper Mekong Basin. J. Hydrol. 2017, 545, 28–41. [Google Scholar] [CrossRef]
- Hecht, J.S.; Lacombe, G.; Arias, M.E.; Dang, T.D.; Piman, T. Hydropower dams of the Mekong River basin: A review of their hydrological impacts. J. Hydrol. 2019, 568, 285–300. [Google Scholar] [CrossRef]
- Campbell, I.C.; Say, S.; Beardall, J. Tonle Sap Lake, the heart of the Lower Mekong. In The Mekong: Biophysical Environment of an International River Basin, Aquatic Ecology; Academic Press: San Diego, CA, USA, 2009; pp. 251–272. [Google Scholar]
- Biancamaria, S.; Hossain, F.; Lettenmaier, D.P. Forecasting transboundary river water elevations from space. Geophys. Res. Lett. 2011, 38. [Google Scholar] [CrossRef] [Green Version]
- Hirpa, F.A.; Hopson, T.M.; De Groeve, T.; Brakenridge, G.R.; Gebremichael, M.; Restrepo, P.J. Upstream satellite remote sensing for river discharge forecasting: Application to major rivers in South Asia. Remote Sens. Environ. 2013, 131, 140–151. [Google Scholar] [CrossRef]
- Fok, H.S.; Zhou, L.; Liu, Y.; Tenzer, R.; Ma, Z.; Zou, F. Water balance standardization approach for reconstructing runoff using GPS at the basin upstream. Remote Sens. 2020, 12, 1767. [Google Scholar] [CrossRef]
- Zakharova, E.; Nielsen, K.; Kamenev, G.; Kouraev, A. River discharge estimation from radar altimetry: Assessment of satellite performance, river scales and methods. J. Hydrol. 2020, 583, 124561. [Google Scholar] [CrossRef]
- Tourian, M.J.; Schwatke, C.; Sneeuw, N. River discharge estimation at daily resolution from satellite altimetry over an entire river basin. J. Hydrol. 2017, 546, 230–247. [Google Scholar] [CrossRef]
- Tang, J.; Yin, X.A.; Yang, P.; Yang, Z.F. Assessment of contributions of climatic variation and human activities to streamflow changes in the Lancang River, China. Water Resour. Manag. 2014, 28, 2953–2966. [Google Scholar] [CrossRef]
- Colin, C.; Siani, G.; Sicre, M.-A.; Liu, Z. Impact of the East Asian monsoon rainfall changes on the erosion of the Mekong River basin over the past 25,000 years. Mar. Geol. 2010, 271, 84–92. [Google Scholar] [CrossRef]
- Räsänen, T.A.; Kummu, M. Spatiotemporal influences of ENSO on precipitation and flood pulse in the Mekong River Basin. J. Hydrol. 2013, 476, 154–168. [Google Scholar] [CrossRef]
- Xue, Z.; Liu, J.P.; Ge, Q. Changes in hydrology and sediment delivery of the Mekong River in the last 50 years: Connection to damming, monsoon, and ENSO. Earth Surf. Process. Landf. 2011, 36, 296–308. [Google Scholar] [CrossRef]
- Chang, C.H.; Lee, H.; Kim, D.; Hwang, E.; Hossain, F.; Chishtie, F.; Jayasinghe, S.; Basnayake, S. Hindcast and forecast of daily inundation extents using satellite SAR and altimetry data with rotated empirical orthogonal function analysis: Case study in Tonle Sap Lake Floodplain. Remote Sens. Environ. 2020, 241, 111732. [Google Scholar] [CrossRef]
- Peng, H.; Fok, H.S.; Gong, J.; Wang, L. Improving stage–discharge relation in the Mekong River Estuary by remotely sensed long-period ocean tides. Remote Sens. 2020, 12, 3648. [Google Scholar] [CrossRef]
- Loc, H.H.; Van Binh, D.; Park, E.; Shrestha, S.; Dung, T.D.; Son, V.H.; Truc, N.H.T.; Mai, N.P.; Seijger, C. Intensifying Saline Water Intrusion and Drought in the Mekong Delta: From Physical Evidence to Policy Outlooks. Sci. Total. Environ. 2021, 757, 143919. [Google Scholar] [CrossRef]
- Eslami, S.; Hoekstra, P.; Trung, N.N.; Kantoush, S.A.; Van Binh, D.; Dung, D.D.; Quang, T.T.; Van Der Vegt, M. Tidal amplification and salt intrusion in the Mekong Delta driven by anthropogenic sediment starvation. Sci. Rep. 2019, 9, 18746. [Google Scholar] [CrossRef]
- Li, X.; Liu, J.P.; Saito, Y.; Nguyen, V.L. Recent evolution of the Mekong Delta and the impacts of dams. Earth Sci. Rev. 2017, 175, 1–17. [Google Scholar] [CrossRef]
- Lu, X.X.; Li, S.; Kummu, M.; Padawangi, R.; Wang, J.J. Observed changes in the water flow at Chiang Saen in the lower Mekong: Impacts of Chinese dams? Quat. Int. 2014, 336, 145–157. [Google Scholar] [CrossRef]
- Cochrane, T.A.; Arias, M.E.; Piman, T. Historical impact of water infrastructure on water levels of the Mekong River and the Tonle Sap system. Hydrol. Earth Syst. Sci. 2014, 18, 4529–4541. [Google Scholar] [CrossRef] [Green Version]
- Arias, M.E.; Cochrane, T.A.; Piman, T.; Kummu, M.; Caruso, B.S.; Killeen, T.J. Quantifying changes in flooding and habitats in the Tonle Sap Lake (Cambodia) caused by water infrastructure development and climate change in the Mekong Basin. J. Environ. Manag. 2012, 112, 53–66. [Google Scholar] [CrossRef] [PubMed]
- Gugliotta, M.; Saito, Y.; Nguyen, V.L.; Ta, T.K.O.; Tamura, T. Sediment distribution and depositional processes along the fluvial to marine transition zone of the Mekong River delta, Vietnam. Sedimentology 2019, 66, 146–164. [Google Scholar] [CrossRef]
- Kvas, A.; Behzadpour, S.; Ellmer, M.; Klinger, B.; Strasser, S.; Zehentner, N.; Mayer-Gürr, T. ITSG-Grace2018: Overview and evaluation of a new GRACE-only gravity field time series. J. Geophys. Res. Solid Earth 2019, 124, 9332–9344. [Google Scholar] [CrossRef] [Green Version]
- Kiem, A.S.; Franks, S.W. On the identification of ENSO-induced rainfall and runoff variability: A comparison of methods and indices. Hydrol. Sci. J. 2001, 46, 715–727. [Google Scholar] [CrossRef]
- McKee, T.B.; Doesken, N.J.; Kleist, J. The relationship of drought frequency and duration to time scales. In Proceedings of the 8th Conference on Applied Climatology, Anaheim, CA, USA, 17–22 January 1993. [Google Scholar]
- Naresh Kumar, M.; Murthy, C.S.; Sesha Sai, M.V.R.; Roy, P.S. On the use of Standardized Precipitation Index (SPI) for drought intensity assessment. Meteorol. Appl. 2009, 16, 381–389. [Google Scholar] [CrossRef] [Green Version]
- Lloyd-Hughes, B.; Saunders, M.A. A drought climatology for Europe. Int. J. Clim. 2002, 22, 1571–1592. [Google Scholar] [CrossRef]
- Zhang, S.; Liu, C.; Yao, Z.; Guo, L. Experimental study on lag time for a small watershed. Hydrol. Process. 2007, 21, 1045–1054. [Google Scholar] [CrossRef]
- Du, H.; Fok, H.S.; Chen, Y.; Ma, Z. Characterization of the Recharge-Storage-Runoff Process of the Yangtze River Source Region under Climate Change. Water 2020, 12, 1940. [Google Scholar] [CrossRef]
- Hassoun, M.H. Fundamentals of Artificial Neural Networks; MIT Press: Cambridge, MA, USA, 1995. [Google Scholar]
- Rumelhart, D.E.; Hinton, G.E.; Williams, R.J. Learning representations by back-propagating errors. Nature 1986, 323, 533–536. [Google Scholar] [CrossRef]
- Cybenko, G. Continuous Valued Neural Networks with Two Hidden Layers are Sufficient; Technical Report for Department of Computer Science; Tufts University: Medford, MA, USA, 1988. [Google Scholar]
- Pasini, A.; Racca, P.; Amendola, S.; Cartocci, G.; Cassardo, C. Attribution of recent temperature behaviour reassessed by a neural-network method. Sci. Rep. 2017, 7, 17681. [Google Scholar] [CrossRef] [PubMed] [Green Version]
- Klambauer, G.; Unterthiner, T.; Mayr, A.; Hochreiter, S. Self-normalizing neural networks. arXiv 2017, arXiv:1706.02515. [Google Scholar]
- Kingma, D.P.; Ba, J. Adam: A method for stochastic optimization. arXiv 2014, arXiv:1412.6980. [Google Scholar]
- Hochreiter, S.; Schmidhuber, J. Long short-term memory. Neural Comput. 1997, 9, 1735–1780. [Google Scholar] [CrossRef] [PubMed]
- Nash, J.E.; Sutcliffe, J.V. River flow forecasting through conceptual models part I—A discussion of principles. J. Hydrol. 1970, 10, 282–290. [Google Scholar] [CrossRef]
- Fok, H.S.; He, Q.; Chun, K.P.; Zhou, Z.; Chu, T. Application of ENSO and drought indices for water level reconstruction and prediction: A case study in the lower Mekong river estuary. Water 2018, 10, 58. [Google Scholar] [CrossRef] [Green Version]
- Fok, H.S.; Iz, H.B.; Schaffrin, B. Comparison of Four Geodetic Network Densification Solutions. Surv. Rev. 2009, 41, 44–56. [Google Scholar] [CrossRef]
Publisher’s Note: MDPI stays neutral with regard to jurisdictional claims in published maps and institutional affiliations. |
© 2022 by the authors. Licensee MDPI, Basel, Switzerland. This article is an open access article distributed under the terms and conditions of the Creative Commons Attribution (CC BY) license (https://creativecommons.org/licenses/by/4.0/).