Abstract
Timely and accurate cropland information at large spatial scales can improve crop management and support the government in decision making. Mapping the spatial extent and distribution of crops on a large spatial scale is challenging work due to the spatial variability. A multi-task spatiotemporal deep learning model, named LSTM-MTL, was developed in this study for large-scale rice mapping by utilizing time-series Sentinel-1 SAR data. The model showed a reasonable rice classification accuracy in the major rice production areas of the U.S. (OA = 98.3%, F1 score = 0.804), even when it only utilized SAR data. The model learned region-specific and common features simultaneously, and yielded a significant improved performance compared with RF and AtBiLSTM in both global and local training scenarios. We found that the LSTM-MTL model achieved a regional F1 score up to 10% higher than both global and local baseline models. The results demonstrated that the consideration of spatial variability via LSTM-MTL approach yielded an improved crop classification performance at a large spatial scale. We analyzed the input-output relationship through gradient backpropagation and found that low VH value in the early period and high VH value in the latter period were critical for rice classification. The results of in-season analysis showed that the model was able to yield a high accuracy (F1 score = 0.746) two months before rice maturity. The integration between multi-task learning and multi-temporal deep learning approach provides a promising approach for crop mapping at large spatial scales.
1. Introduction
Sufficient food supply is critical for the increased global population, but it has become more vulnerable under the increased occurrence of extreme climate events caused by global warming [1]. Timely and accurate crop mapping at large spatial scales can provide fundamental information (e.g., crop types, locations, and periods) to improve crop management, production forecasts, and disaster assessment [2]. For example, it can provide new insights into the spatial variances of crop production and their driving factors. This digital information can be used to help farmers and the government to improve the allocation of agricultural resources, such as optimizing water management and supply chain logistics. Therefore, it is essential to develop accurate crop mapping approaches that can be applied at large spatial scales to support food security.
Remote sensing technology can provide low-cost, multi-temporal, multi-band, and large-scale observation data for crop information extraction repeatedly and consistently [3]. With the advent of the increased number of remote sensing data, numerous studies have been conducted for large-scale crop mapping based on various satellite products (Table 1). Most existing crop mapping products at large spatial scales are usually based on simplified approaches and evaluated in the selected samples of a study area. A large-scale crop mapping product with sub-field level resolution and high accuracy evaluated in the whole study area is still needed for a thorough understanding for the crop production at regional to global scales. In addition, existing crop mapping products are usually based on the optical remote sensing products, such as MODIS and Landsat. The optical remote sensing products are principally hampered by cloud cover, which is persistent in many parts of the world during the crop growth period, particularly for rice in tropical areas. The cloud coverage influences the completeness of the observation time series that hinders the monitoring of the crop growth process.

Table 1.
An overview of existing crop mapping at large spatial scales.
Note: ‘N/A’ means not available; ‘Multiclass’ means more than three categories; ‘S’ means calculated by selected samples; ‘W’ means calculated by whole study area.
Synthetic Aperture Radar (SAR) imagery has great potential for crop mapping in tropical areas because of its all-time and all-weather imaging capacity. SAR has shown its benefit for dynamic change information extraction in recent studies, such as land cover mapping, urban change monitoring, crop monitoring, and tropical forest disturbance alerts [4,5,6]. Crop growth is a typical dynamical process from planting to maturity. The complete temporal information on crop growth provided by SAR at high spatial resolution globally that could potentially improve the crop mapping results.
Previous studies have demonstrated the potential of utilizing the similarity of the crop growth process across different regions in improving the crop classification accuracy at large scales [7,8]. The life cycles of specific crop have similar development patterns, despite the spatial heterogeneity of physiological response to environmental conditions. For example, rice would go through a series of physiological processes from planting to mature. This progress is a common time-series of rice and remote sensing would reflect responding temporal characteristics. These commonalities provide opportunities for expending crop classification models to a large spatial scale. Many multi-temporal approaches were developed by extracting phenological metrics from the time-series of satellite observation [9,10]. These approaches usually include two steps: fitting time-series curves by mathematical functions, and extracting phenological metrics or parameters using empirical methods, such as predefined thresholds [11,12]. These approaches, however, heavily rely on domain knowledge and are usually only suitable for a certain area since the extracted information is limited.
The data-driven machine learning algorithm, as another alternative, is becoming one of the predominant approaches for crop mapping under various spatial scales and resolutions. These approaches, such as decision tree (DT), random forest (RF), and support vector machine (SVM), can extract the useful patterns for crop classification from the high-dimensional time-series of remote sensing data [13,14,15]. The Cropland Data Layer (CDL), as one typical large-scale crop type map product published by the United States Department of Agriculture (USDA), provides crop type maps at 30-m resolution updated annually based on a DT-based classifier [16]. Such approaches, however, are not originally designed for processing time-series of remote sensing data, resulting in the sequential relationship hidden in time-series profiles being not explicitly used, thereby necessitating the incorporation of handcrafted and pre-defined temporal features into input variable collections.
Deep learning, as an end-to-end network approach, can extract and automatically organize intricate relationships from high-dimensional data through multiple levels for representation [24]. The most commonly used deep learning models in the land cover mapping field are convolutional neural networks (CNNs) and recurrent neural networks (RNNs). Unlike CNN, which is mainly adopted to extract spatial-spectral features [25], RNN focuses on learning sequential relationships by explicitly linking adjacent observations [26]. Long Short-Term Memory (LSTM) is the most well-known variant of RNN, facilitating time-series analysis and allowing exhibiting long-term temporal dependencies through gated mechanisms [27]. The multi-temporal architecture of LSTM renders it inherently suitable for modeling vegetation cycles and extracting common crop growth features of different regions from time-series satellite observations. Recently, LSTM has been widely applied to develop a generalized model that can be applied across different geographical locations. Rußwurm and Korner [28] employed an LSTM network to extract dynamic temporal characteristics from a sequence of satellite observations to classify crop types. Xu et al. [29] developed an attention-based bidirectional LSTM model and achieved improved generalizability for large-scale dynamic corn and soybean mapping. These end-to-end deep learning approaches with higher generalizability have effectively reduced the cumbersome efforts in feature construction efforts and showed potential for large-scale applications.
Mapping the spatial extent and distribution of crops on a large spatial scale is a challenging work due to the spatial variability, such as the diverse cropland landscape and crop calendar. The variances are influenced by the environmental conditions (e.g., climate, soil, and topography) and farm management (e.g., plant date, land size, and irrigation) across space. Therefore, the information extracted from satellite images, such as cropland spectral, texture, and shape characteristics, varies over space and time. The CDL is one of the most widely used large-scale crop type maps, however, the workflow to generate CDL needs substantial labeled samples collected by time- and labor-cost field survey, which are not readily available in other countries. Its processing and methodology also lead to some limitations, such as lag of release time and inconsistencies across states [30,31]. Prior studies at large spatial scales usually develop a global model for the entire study area and simplify the spatial variability [21,32,33]. The lack of consideration of spatial variability leads to their comparatively low overall performance and large inconsistencies across regions. Some studies focus on constructing deep learning models with high transferability to ensure the accuracy of large-scale crop mapping [7,34,35]. However, there is a significant degradation in transfer performance compared with relatively high local performance, hindering practical applications of these approaches on large spatial scales.
Multi-Task Learning (MTL) is a learning paradigm in machine learning that aims to improve the performance of multiple related learning tasks by leveraging useful information among them [36]. MTL generalizes the previous concept of transfer learning because the information is shared among all tasks [37]. It enables the model to learn multiple related tasks and share information across the tasks simultaneously. Previous studies have demonstrated that the MTL mechanism can improve the generalization performance compared to independently learning each task [38,39]. In remote sensing field, MTL is mainly used to improve the classification performance of target detection tasks (e.g., road and building footprints) in high-resolution satellite images [40,41]. In large-scale crop mapping, crop classification tasks in different regions can also be regarded as related learning tasks suitable for MTL. The temporal patterns of crop growth are generally consistent across regions but have domain-specific characteristics due to variances in environmental and farm management. The MTL mechanism can utilize the domain-specific features while considering the common features across regions. The integration of MTL into multi-temporal deep learning model can potentially address the spatial variability challenges in large-scale crop mapping and improve the crop classification on a large spatial scale.
We developed a multi-task spatiotemporal deep learning model using time-series Sentinel-1 SAR data for rice classification at large spatial scales. The major rice production area in the U.S. was used to demonstrate the model development. We designed an Attention-based Bidirectional Long Short-Term Memory (AtBiLSTM) network to extract the common temporal features of different regions from the time-series SAR images. Then, we utilized multi-task learning by treating the rice classification of each region as related tasks to learn both common and region-specific features under the consideration of the variability at large spatial scales. We used a gradient backpropagation approach to evaluate the contribution of each temporal input to the rice classification for a superior comprehension on the effect of temporal input on rice classification. Specifically, we aimed to answer the following research questions in this study:
- (1)
- Can the LSTM-based model using the Sentinel-1 SAR data perform well for large-scale rice mapping?
- (2)
- How much benefit can MTL bring to improve the crop mapping at a large spatial scale?
- (3)
- What is the contribution of the temporal input to the rice classification as the growing season progresses?
2. Materials
2.1. Study Area
The study was conducted in the major U.S. rice production areas, which consists of South Central region (Arkansas, Mississippi, Missouri, Louisiana, and Texas) and the Sacramento Valley of California. Rice production requires particular agronomic conditions, such as a plentiful water supplement, high average temperatures during the growing season, and a smooth land surface. Therefore, rice production in the U.S. is limited to certain areas. According to the statistics data retrieved from the USDA National Agricultural Statistics Service (NASS) Quick Stats portal [42], the U.S. rice production areas are distributed in six states, including Arkansas, California, Mississippi, Missouri, Louisiana, and Texas.
The study area was determined by a two-step method: (1) we acquired the US-wide 30-m resolution CDL maps from 2014 to 2018 and divided them into a regular grid of 20 km × 20 km blocks. (2) We calculated the 5-year average rice percentage for every block, and then excluded the blocks with a very low rice percentage (<0.02%) and far away from the six states. Finally, the study area consisted of 561 blocks and cumulatively accounting for more than 99% of the total rice area of the U.S. (Figure 1). The total number of pixels is 249,334,001, corresponding to 224,400 km2.
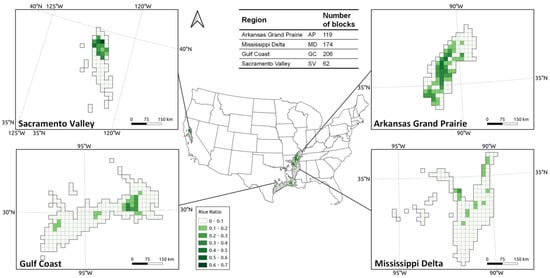
Figure 1.
Block-level rice area ratios of the four rice production regions in the U.S. The size of each block is 20 km × 20 km.
Unlike other parts of the world where rice production is divided between irrigated and non-irrigated fields, all U.S. rice is produced in irrigated fields [43]. However, different types of rice (i.e., long-, medium-, or short-grain) are grown over the U.S. determined by regional soil conditions. Moreover, the rice growing seasons vary by region due to various environmental conditions and farmers’ decisions. We divided the entire study area into the following four regions based on their rice phenology and growth environments: Arkansas Grand Prairie (AP), Mississippi Delta (MD), Gulf Coast (GC), and Sacramento Valley (SV) [44,45].
2.2. Data
2.2.1. Sentinel-1 Time-Series Data
The Sentinel-1 mission provides free C-band SAR imagery globally with a two-satellite configuration [46]. In this study, the Sentinel-1 Level-1 Ground Range Detected (GRD) dual-polarized (VV + VH) data in Interferometric Wide Swath (IW) mode at a 10-m resolution was used. All available Sentinel-1 scenes in ascending orbit covering the study area were accessed through the Google Earth Engine (GEE). Each scene of data was pre-processed using the following steps, as implemented by the Sentinel-1 toolbox in GEE: (1) orbit file application, (2) GRD border noise removal, (3) thermal noise removal, (4) radiometric calibration, and (5) terrain correction. An extra pre-processing step, the Refined Lee filter, was applied to reduce the speckle noise [47]. Finally, we reduce the resolution of the SAR images to 30 m by calculating the average of each pixel to match the CDL label data. Both Sentinel-1 satellites have a 12-day revisit cycle at the equator. A 6-day revisit time can be achieved with two satellites operating. However, this frequency of observation in a specific orbit is currently available only in a limited region. In this study, the time interval of Sentinel-1 time-series data was 12 days, determined by the maximum revisit time in the study area. Although we used all available Sentinel-1 scenes in ascending orbit, some were still missing. A pixel-level linear interpolation was applied to fill the gaps in the time-series data.
The U.S. rice-growing season varies by region. Planting in Texas and southwest Louisiana typically begins in early or mid-March, Delta States in April, and California in late April. A typical rice growing season in the U.S. lasts 6 months. We assumed the earliest planted date of different regions, as well as the start of Sentinel-1 time-series data was determined according to the state-level 5-year average Crop Progress Report (CPR) of rice [42], (Table 2). The length of time-series data was set to 16 to cover the entire rice-growing season. Finally, we used a total of 1245 Sentinel-1 images to construct time-series data at 12-day interval with 16 time steps in 2018 and 2019.

Table 2.
Summary of the planted date, sample set size, and category proportions in each region in 2018 and 2019.
2.2.2. USDA Cropland Data Layer
The CDL was used as a reference map for both the training and test datasets. The CDL is an annual publicly available land cover classification map provided by the USDA, NASS [16]. The 30-m CDL was based on the information from the Common Land Unit (CLU), NASS June Agriculture Survey, National Land Cover Dataset (NLCD), and imagery from several satellites including Landsat 5/7/8, RESOURCESAT-1/2, Sentinel-2, Disaster Monitoring Constellation (DMC) DEIMOS-1 and UK2. Providing more than 100 land cover and crop type categories, CDL has a high accuracy for the major crop types [31].
3. Methodology
3.1. LSTM-Based Multi-Task Learning Model
The overall structure of the LSTM-based Multi-task Learning (LSTM-MTL) model included a shared Attention-based Bidirectional LSTM (AtBiLSTM) Network and four MTL-based region-specific output layers (Figure 2). We combined MTL and a multi-temporal model to utilize the common and region-specific features of different regions simultaneously. The model obtained a pixel-level time-series of satellite observations during the rice growing season as the input and yielded a predicted category as the output. The AtBiLSTM network used multiple LSTM layers to extract common temporal features of different regions hierarchically from satellite time-series data. Then, the model classified the pixels through the region-specific output layers to adequately extract the spatial variances across different regions.
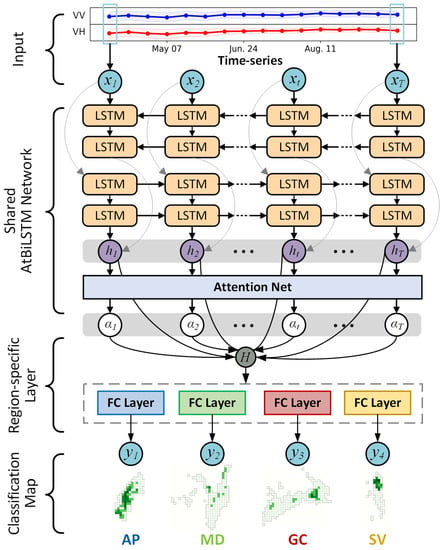
Figure 2.
Overall structure of the LSTM-based Multi-task Learning (LSTM-MTL) model for rice classification.
Shared AtBiLSTM Network. The entire time-series data of the study area was fed into the shared AtBiLSTM network to extract the common crop growth features of different regions. The input data is a time sequence {} and is a vector that includes multiple radar polarization bands in the time step during the rice growing season. A two-layer bidirectional LSTM network is built to learn general temporal features from the input sequence. The details of the AtBiLSTM network are well introduced in our prior work [29]. We set the dimension of hidden feature of AtBiLSTM as 128 after testing the candidate values of 32, 64, 128 and 256.
MTL-based region-specific output layers. In this study, we used MTL to conduct the region-specific output layers based on regional characteristics. The study area was divided into four regions according to variances of environmental condition and farm management. Rice classification tasks in different regions were regarded as related learning task with commonalities and differences. Each individual region-specific output layer was designed to extract domain-specific feature but trained jointly. The structure of the output layer for each task was the same, consisting of a single fully connected layer with the Softmax function.
In a single specific task, the layer received the hidden feature from the shared AtBiLSTM network as input and produced a discrete probability distribution consisting of two predicted probabilities corresponding to “rice” and “other” categories. The highest probability was adopted as the predicted category, and the cross-entropy function was used as the loss function. The adjusted loss function was calculated as follows:
where is the size of the training set of a single task; is the index of the sample; is the number of categories; is the category index; and are the true and predicted probabilities that the -th sample belongs to the -th category, respectively. is the L2 regularization parameter, and is the weight matrix including all learnable parameters in the model.
We jointly learned the four tasks to share potentially related features of different regions. We assumed that each task had the same contribution to the U.S. rice mapping to obtain global optimal classification performance. The multi-loss function was defined as follows:
where is the number of tasks, is the loss function to be minimized of task , and is the combined loss of all tasks. The backpropagation algorithm with the Adam optimizer was used for training the network [48]. The dropout technique and L2 norm regularization were applied to prevent the model from overfitting.
3.2. Baseline Classification Models
Two baseline methods, including Random Forest (RF) and AtBiLSTM were developed to evaluate the performance of the LSTM-MTL model. RF is an ensemble machine learning algorithm using bagging strategy [49], and it is well-known to avoid overfitting [50]. The AtBiLSTM model is a spatially generalizable model that can learn temporal features efficiently and automatically. The main structure of AtBiLSTM is the same as the share network in the LSTM-MTL model; the difference is that the AtBiLSTM has only one output layer. The comparison between LSTM-MTL and AtBiLSTM can highlight the advantages of MTL-based region-specific pattern extraction.
We searched the optimal values of the hyperparameter configuration of the RF and AtBiLSTM models for each region in a certain range. For RF, we optimized two hyperparameters to adjust the rice mapping task in this study: the number of trees called n_estimator, and the number of features to consider for the best split called max_feature. We determined the optimal values of n_estimator after testing the candidate values of the range {100, 200, 400, 800}, and the max_feature was determined after searching in {2,4, , }. For AtBiLSTM, the dimension of the hidden feature was tested for candidate values of 32, 64, 128, and 256. The cross-entropy function was used as the loss function. The configurations of the optimizer, L2 norm regularization, and dropout were the same as those used in the LSTM-MTL model.
3.3. Model Evaluation
We compared the classification results with the CDL map of the year 2019 to evaluate the performance of all models, which has been widely used as reference data in previous studies [21,23]. Overall accuracy, F1 score, Cohen’s kappa coefficient, user’s accuracy, and producer’s accuracy were computed as performance indicators for all models.
The user’s accuracy was the proportion of correctly classified samples of the -th category to the total samples of the -th category in the classified image (Equation (3)). Producer’s accuracy was the proportion of correctly classified samples of the -th category to the total samples of the -th category in the reference image (Equation (4)). The F1 score is the harmonic mean of the user’s and producer’s accuracy for each class (Equation (5)):
where is the index of the category, is the number of correctly classified samples in the -th category, and are the sample size in the -th predicted and reference category, respectively. is the user’s accuracy of the -th category, and is the producer’s accuracy of the -th category, and is the F1 score of the -th category. The Cohen’s kappa coefficient was calculated from the probability of the observed agreement and the expected agreement was given by a hypothetical random classifier using Equations (6)–(8):
3.4. Experiments
We performed several experiments to comprehensively analyze the classification capability of the LSTM-MTL model (Figure 3). To mimic real-life situations, we used historical data to build models and applied them to rice mapping for the following year. Our study area covered more than 99% of the rice production area in the US, with a total of 249,334,001 pixels at a 30-m resolution. For the LSTM-MTL model, the training set consisted of four parts, and each part randomly sampled 10% of the pixels from the four regions in 2018. The entire 2019 sample set was used as the test set. To better demonstrate the generalization abilities of the LSTM-MTL model, we trained the baseline models (RF and AtBiLSTM) in two ways: globally trained and locally trained. For the globally trained baseline models, the training set was consistent with the LSTM-MTL model. The locally trained baseline models were trained in each region separately. We fed 24,933,398 randomly sampled pixels from a single region to train a local model, making the size of the training set the same as that of the LSTM-MTL model and baseline global models. Specifically, we built an LSTM-MTL model, two global baseline models (RF and AtBiLSTM trained globally in the entire study area), and a total of eight local baseline models (RF and AtBiLSTM trained locally in four regions). We also designed an in-season classification experiment to obtain insights into how the models dynamically establish crop mapping from the early-season to end-season. In this scenario, the model could only see the partially unmasked time series with a limited length. The length of the input observation sequence gradually increased until full sequences were included.
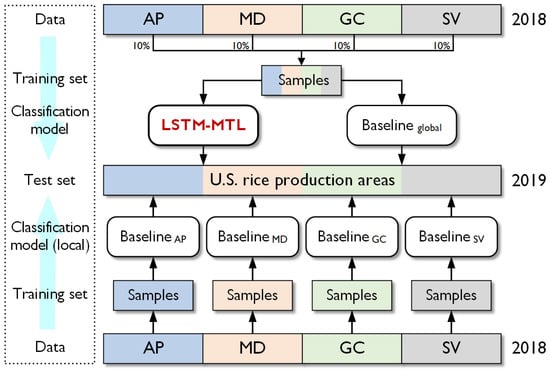
Figure 3.
Diagram of experiment design. An LSTM-MTL model, two global baseline models (RF and AtbiLSTM trained globally in the entire study area), and eight local baseline models (RF and AtbiLSTM trained locally in four regions) were built.
The experiments were performed on a Linux workstation (Ubuntu 16.04 LTS) with two Intel Xeon Gold Processors (2.1G/20 Core/27.5M), 128 GB of RAM, and four NVIDIA GeForce RTX 2080 Ti graphics cards (11 GB of RAM). All the deep learning models were implemented on the Python platform using the PyTorch, whereas RF was implemented using the Python Scikit-learn library.
4. Results and Discussion
4.1. Spatial Variance Analysis across Different Rice Production Regions
The VV and VH time-series curves of rice and other types exhibited different patterns during the rice growing season (Figure 4). The shapes of radar backscatter curves of rice in the four regions exhibited some common patterns: the VV and VH of rice land had a decreasing trend in the early stages and then rose as the rice grew. After the rice reached its peak growth, the radar backscatter achieved convergence with a slight decrease during maturity. The change in radar curves is related to the change of the canopy structure and the underlying soil surface during the rice growth period [51,52]. The common patterns indicated the similar development patterns of rice life cycles in different regions. We also found that the radar backscatter distributions varied across regions. For example, SV had the lowest values of both VV and VH for rice and other types. The values of radar backscatter in SV in the planted period were lower than those in the other three regions and had a higher decreasing rate. This pattern could reflect the specific rice management strategy in SV, in which rice was grown in flooded fields at planting to aid in weed suppression in this region. In the other regions, flooding occurred after the rice plant developed 4–5 leaves, three to four weeks after emergence [45,53]. The difference in radar backscatter time-series between regions reflected the variation in farm management and rice-based cropping systems across the rice production regions in the U.S.
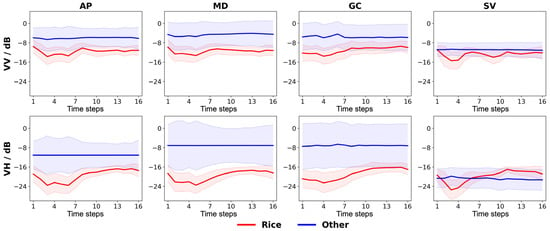
Figure 4.
Time-series curves of radar backscatter (VV and VH) of four rice production regions in 2019. The X-axis is the time step after planted, and the Y-axis is the value of radar backscatter of VV and VH. The red lines represent the average values of “rice,” and blue lines represent the average values of “other.” The light buffer areas indicate a standard deviation from the average value.
We observed that the components of the main land cover type category varied across regions in 2019 (Figure 5) that potentially challenged the rice classification at large scales. For example, many crops including soybeans, corn, cotton, and rice were grown in AP and MD, but were relatively rarely grown in the other two regions. Rice’s proportion of farm production value varied among regions, accounting for 30% in MD, 50% in AP, 65% in GC, and 80% in SV [45]. Wetlands were the major non-cropland cover in AP, MD, and GC, while there were relatively less wetlands in SV. The landscape of rice production regions also showed spatial heterogeneity. For example, more than half crop land in the SV was only grown to rice because of impeded drainage [54]. Therefore, the sample purity of rice was higher in SV, whereas rice from other regions was mixed with other crops. The spatial variability made it difficult to build an acceptable global model or a high transferability local model for the U.S. rice mapping.
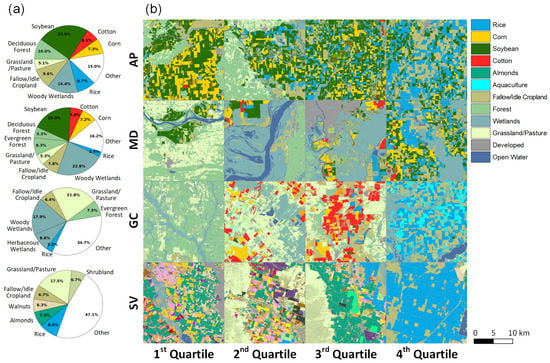
Figure 5.
Representative blocks in the four rice production regions of the U.S. in 2019. (a) The ratio of major land cover types (>5%) in four regions calculated by CDL and (b) The CDL map of the blocks selected according to the quartiles of rice ratios in each region.
4.2. Performance Evaluation of LSTM-MTL Model
4.2.1. Assessment of Classification Accuracy with CDL
The LSTM-MTL model provided a good classification accuracy for the rice mapping in the U.S. with overall accuracy equaled 98.3% and F1 score equaled to 0.804 (Table 3). For the U.S., the producer’s accuracy of rice was 74.6%, the user’s accuracy was 87.2%, and the kappa score was 0.795. It is noteworthy that we only used the Sentinel-1 SAR data to achieve the reasonable classification performance. The results showed the potential of combing deep learning and cloud-free SAR data for large-scale crop mapping. The model performance varied among the four regions that SV had the highest F1 score (0.936) while GC achieved the lowest classification F1 score (0.640). By definition, the overall accuracy has an emphasis on the major class (“other”) rather than the rare class (“rice”), which made the OA in the four regions similar. However, the F1 score, producer’s accuracies, user’s accuracies, and kappa were with large difference in the four regions. The spatial variance was related to the different rice area ratios in each region. We found that higher F1 scores occurred in the regions with higher rice area ratios. For example, both AP and SV had the highest rice area ratios (8.6%) in 2019.

Table 3.
Accuracy indices of the LSTM-MTL model for rice mapping in the U.S.
4.2.2. Comparison with Global Baseline Models
The LSTM-MTL model exhibited the highest rice mapping accuracy compared to the global AtBiLSTM and RF models (Figure 6). The LSTM-MTL model achieved an F1 score of 0.804 in the U.S., which was superior to AtBiLSTM (0.762) and RF (0.745). The LSTM-based models showed a superior rice mapping performance than RF with an overall F1 score increase of 0.011–0.080 in all regions. This improvement can be explained by the unique temporal learning structure of the LSTM network. The gate mechanism of the LSTM cell enabled the model to selectively accumulate the temporal information from the SAR time-series during the crop growth period. The results indicate that considering the temporal characteristics of the dynamical crop growth process can lead to a more accurate crop classification.
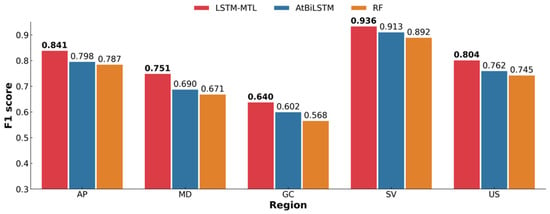
Figure 6.
Rice classification performance (F1 score) of LSTM-MTL, AtBiLSTM (global) and RF (global). All three models were trained and tested globally based on data from the entire study area. The bold values stand for the best score of the three models.
Multi-task learning (MTL) significantly improved the performance of the LSTM-based model, which enabled the model to achieve a higher F1 score, increasing from 0.762 to 0.804 in the U.S. (Figure 6). Notably, the improvements by MTL occurred in all regions and the largest improvement by MTL was in the MD, with an increase in the F1 score by 0.061. Compared with global baseline models, the regional F1 score was increased by 0.023–0.080 (2.5–12.7%). The comparison in the kappa score of rice showed similar results that the LSTM-MTL model performed better than baseline models (Figure S1). As mentioned in Section 4.1, there exist spatial variances and local patterns in each region, which makes large-scale crop mapping challenging. Compared to traditional global models without considering spatial variability at large scales, the MTL model can utilize the region-specific patterns while considering the common patterns of each region. The results implied that applying MTL to learn the region-specific patterns was a promising method for dealing with the spatial variability under large-scale crop mapping.
4.2.3. Comparison with Local Baseline Models
The local baseline models of the four rice production regions were trained and tested locally. The results showed that the LSTM-MTL model also provided superior performance than the local-trained models of all regions (Figure 7a). The local-trained models, both AtBiLSTM and RF, yielded improved classification accuracy in all regions compared to the model trained globally; however, the LSTM-MTL model was the most accurate model in all regions, with an F1 score increased by 0.003–0.070 (0.4–10.3%). The LSTM-MTL model showed similar improvement over AtBiLSTM and RF when evaluated by the kappa score of rice (Figure S2a). The outperformance can be attributed to the shared layers of the LSTM-MTL model trained based on all regions. The features learned by related tasks in other regions could help local rice classification. The MTL enabled the model to better capture the common features from all regions so that the rice classification in each region benefited from the data in other regions.
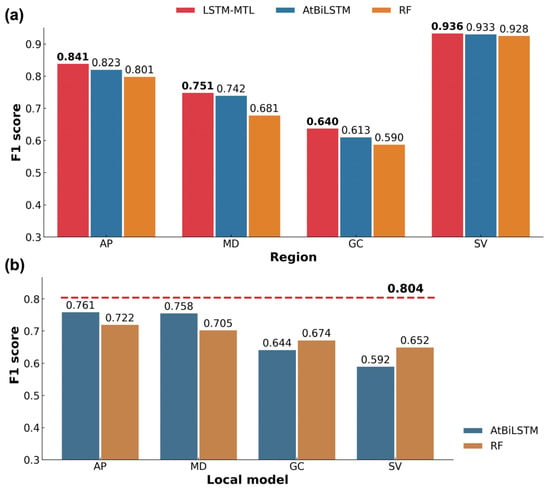
Figure 7.
Performance comparison with local baseline models: (a) local rice classification performance in terms of rice’s F1 score of the LSTM-MTL, AtBiLSTM (local), and RF (local). The LSTM-MTL model was trained globally. The AtBiLSTM and RF models were trained only based on local data. The bold values stand for the best score of the three models. (b) Rice classification performance in terms of rice’s F1 score, all local baseline models were test in the U.S. The red dotted line represents the performance of the LSTM-MTL in the U.S.
We also conducted a spatial transfer experiment using local baseline models. Both the classification accuracies of AtBiLSTM and RF dropped when models were trained in one region and transferred to the remaining regions (Table S1). The improvement of LSTM-MTL over AtBiLSTM and that over RF in the F1 score of the U.S. reached 0.043–0.212 and 0.082–0.152, respectively (Figure 7b). This improvement was also similar in the comparison of rice’s kappa score (Figure S2b). We also observed inconsistencies in the performance of local models when tested locally and globally. For example, although models trained in SV had the best performance locally (0.933 for AtBiLSTM and 0.928 for RF), their transfer performance in the U.S. was the worst (0.592 for AtBiLSTM and 0.652 for RF). The model showed a trend to capture patterns suitable for SV but not suitable for the remaining three regions due to the spatial variability. The rice features extracted from satellite images in SV are quite different from those in the southern regions because of variances in environmental conditions and farm management. For example, rice producers in SV particularly prefer medium-grain cultivars while long-grain rice is grown almost exclusively in the southern regions [43,54]. The results indicated that the application of transfer learning for crop mapping on a large spatial scale is still challenging. We suggest that MTL is a promising deep learning approach for improved feature extraction at large spatial scales to address the spatial variability challenge.
4.3. Understanding the Behavior of the LSTM-MTL Model for Rice Mapping
4.3.1. Temporal Feature Importance Evaluation
We applied a gradient backpropagation method to analyze the importance of temporal input on rice classification [55]. Based on the well-trained LSTM-MTL model, we propagated gradients from the classification probability value in a backward fashion through the entire network via the chain rule to the individual temporal input variables. The gradients () reflect the influence of each input variable on the rice classification.
The gradient backpropagation results reflected the influence of the temporal input on the rice classification of the LSTM-MTL model (Figure 8). Positive (negative) gradients would suggest an increase (decrease) in the probability of classifying the pixel as its true category when the input changes at certain times. For example, the VH’s gradient of rice category in AP reached a negative peak value at time step seven, indicating that a lower VH value at that time could lead to a higher probability of rice classification. We found that the gradients of rice and other pixels always showed converse values, illustrating how the model classified the pixels according to the temporal inputs. The results indicated that low VH values in the early period and high VH values in the latter period led to the rice classification. This pattern was similar across different regions, indicating that the model captured common features during the rice growth in all regions to establish the classification. We also found that the gradients reflected the spatial variances across different regions. For example, the curve of the VH gradients showed a left-shift compared to those in the other three regions, which could reflect the earlier phenological process there. The USDA CPR report showed that the rice in SV was headed 1–2 weeks earlier from the planted stage in 2019 [42]. Based on this result, we suggest that our model can capture the spatial variability of rice growth at large spatial scales, which is essential for the widespread application of crop mapping.
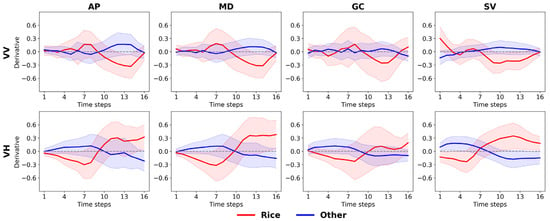
Figure 8.
Temporal input importance analysis by gradient backpropagation. The gradients reflect the influence of each temporal input on the rice classification. Positive or negative gradients would suggest an increase or decrease of the probability to classify the sample as its ground truth category: “rice” or “other.”.
4.3.2. In-Season Classification
The classification accuracy improved as additional time-series data were fed into the model, with the overall F1 score increasing from 0.312 to 0.804 (Figure 9). The improvement mainly occurred in the early period and achieved convergence at time step 12. In the later periods till rice maturation, the model’s performance exhibited less variability, with the standard deviation of the overall F1 score being 0.02. The dynamical changes in the model performance were similar to the temporal process of rice growth, which also showed fewer differences when rice was near the mature stage. The results suggest that the model can achieve a high classification accuracy (F1 score = 0.746) of approximately two months prior to the rice mature stage. Early rice mapping information can be instructive for agricultural system simulation, for example, rice yield prediction.
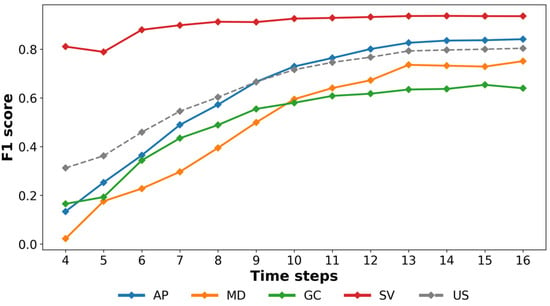
Figure 9.
Classification F1 score of the LSTM-MTL model over time in different regions and in the entire study area. Each point reflects the classification F1 score of the LSTM-MTL model using temporal input until corresponding time steps. The comparison among the four regions highlights the similar trends and regional characteristics during the in-season rice classification process.
The dynamic change in the in-season classification varied in the four regions. SV showed a larger difference than the other three regions. In the early stage, the model in SV had already achieved a high rice classification F1 score (0.811). After a short improvement period, the model’s performance showed convergence. The southern regions (AP, MD, and GC) were similar in the in-season rice classification process. The regional F1 scores ranged from 0.022 to 0.165 in the beginning and reached the highest at the end of the season, ranging from 0.640 to 0.841. The regional differences reflected that the temporal learning process of the model was different due to the spatial variance. For example, the various rice area ratios across the four regions might be one of the driving factors. SV had the largest rice area ratio (8.6%) and the purest rice sample in the four regions in 2019. This pattern enabled the model to better extract the rice characteristics with less influence from other land cover types.
4.4. Rice Area Estimation Compared with CDL
The rice area estimated by the LSTM-MTL model showed similar distribution with the CDL at block-level (Figure 10). It is important to highlight that our deep learning model only utilized Sentinel-1 SAR data to achieve a comparable performance with the CDL. The results showed that the model estimated the planted rice area of the U.S. in 2019 as 8924.4 ha, with an underestimation of 14.4% compared with the CDL and with an underestimation of 10.8% with the harvest area reported by the USDA NASS’s survey [42]. The underestimation occurred in all regions according to the mapping results (Figure 10). The rice area estimation performance also varied across the four regions. The underestimation ratios were −8.9%, −2.5%, −37.9%, and −7.4% in AP, MD, GC, and SV, respectively. The highest underestimation level in GC resulted from a localized underestimation pattern occurring in the eastern region. One possible reason is the higher estimated area of CDL compared to the USDA statistical data. We compared the 2019 rice area of CDL and USDA statistics and found that GC had two states with large overestimation of the rice area of CDL. Compared with the rice harvest area reported by the USDA NASS’s survey, the CDL based rice area of 2019 was overestimated by 17% and 30% in Louisiana and Texas, respectively (Table S2). The pixel-level rice mapping results suggested that the varied area estimation performance could be driven by the different environmental conditions and farm management (Figure S3). The spatial variances in the four rice production regions led to inconsistencies in the complexity of the classification tasks in different regions. For example, rotational practices vary among regions in the U.S. In AP and MD, rice is commonly grown in rotation with another crop, mostly soybean. In GC, rice-fallow-rice or rice-fallow-fallow-rice is the most predominant system. In SV, most rice area is in continuous rice culture due to a lack of viable rotation options in the poorly drained soils [43]. Therefore, the distribution of rice in SV is more concentrated, making rice classification easier than that in the other three regions.
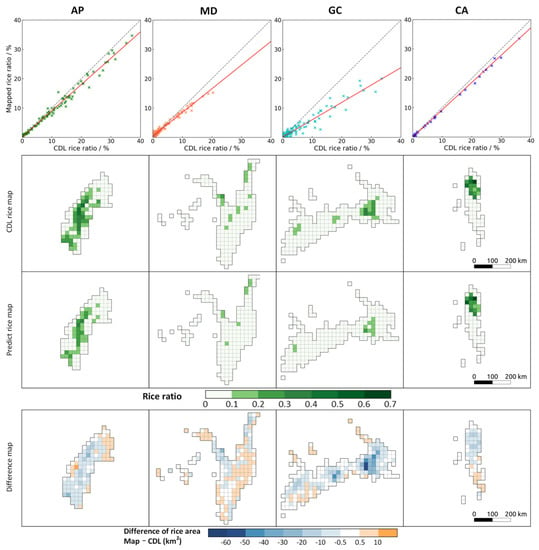
Figure 10.
Maps of block-level errors of rice estimation area in 2019 compared to the CDL map in each region and the scatter plots between classified and actual rice area at block-level.
The LSTM-MTL model learned region-specific and common features simultaneously and achieved reasonable performance improvement in rice mapping on a large spatial scale through the combination of MTL and AtBiLSTM network. It should be noted that the deep learning model only used Sentinel-1 SAR data to well capture the rice growth patterns for classification. Although the LSTM-MTL model here is for rice in the U.S., it can possibly be applied to other crops and in other regions. The cloud-free characteristics of SAR data also provided a potential to achieve global crop mapping through our deep learning framework that could provide new data-driven insights for the global food production. The model showed potentials for application of crop mapping across regions with spatial variances, including the accuracy, timing, and transparency. Many possibilities remain to further refine the deep learning crop mapping framework. For example, the model’s ability to deal with the unbalanced data should be further improved. Rice is a relatively rare and infrequent crop in the entire U.S., which leads to a class imbalance problem in rice mapping. It is a pervasive problem in many real-world applications of deep learning techniques [56,57]. One possible improvement is to apply balancing methods (e.g., Random Oversampling and Synthetic Minority Oversampling Technique) to boost the accuracy of rice [58]. Another typical further improvement is multi-source data fusion. Combinations of optical and radar satellite images have been studied to address land cover classification tasks [3,59,60]. Using bands or vegetation indices from multiple satellites such as Sentinel-1, Landsat, and MODIS as input features is conducive to Information extraction and time-series construction, especially for large-scale study. With the increased data sources of remote sensing, the multi-task learning approach can be possibly improved to address spatial variability and identify common features. In addition, our model achieved reasonable pixel-level rice classification results, there is still room for improvements toward field recognition. Further improvements, include adopting object-based image analysis approaches [61,62] and combining CNN into the LSTM-MTL model [63,64], have the potential to generate the configuration of the crop field at large spatial scales.
5. Conclusions
This study developed a multi-task spatiotemporal deep learning model named LSTM-MTL that uses time-series Sentinel-1 SAR data for large-scale rice mapping. The model integrated AtBiLSTM network for temporal feature learning and MTL for region-specific pattern learning. The model was applied in the major rice production area in the U.S. to map its cropping patterns in 2019. Results showed that: (1) even when we only used the Sentinel-1 SAR data, the LSTM-MTL model showed reasonable rice classification accuracy in the major rice production areas of the U.S. (OA = 98.3%, F1 score = 0.804) and outperformed the RF and AtBiLSTM models. (2) The LSTM-MTL model achieved better crop classification accuracy than the model without MTL, suggesting that the consideration of spatial variances based on MTL led to improved crop classification performance at large spatial scales. (3) The gradient backpropagation analysis reflected that a low VH value in the early period and high VH value in the latter period could lead to the rice classification by the model. (4) The LSTM-MTL model achieved more accurate classification performance as the time-series of observations increased through the rice growth season and was able to achieve a high accuracy approximately two months before rice maturing. Together, these findings demonstrated that considering spatial variances based on the combination of MTL mechanism and AtBiLSTM network is a promising approach for crop mapping at large spatial scales with the support of Sentinel-1 SAR time-series data. The input-output nexus of the model found in this study could provide new data-driven insights for deep learning based crop mapping. This study provided a viable option toward large scale crop mapping and could be applied to other crops and in other regions.
Supplementary Materials
The following are available online at https://www.mdpi.com/article/10.3390/rs14030699/s1, Figure S1: Rice classification performance (Cohen’s kappa coefficient) of LSTM-MTL, AtBiLSTM (global), and RF (global). All three models were trained and tested globally based on data from the entire study area. The bold values stand for the highest score of the three models, Figure S2: Performance comparison with local baseline models: (a) local rice classification performance (Cohen’s kappa coefficient) of LSTM-MTL, AtBiLSTM (local), and RF (local). The LSTM-MTL model was trained globally. The AtBiLSTM and RF models were trained only based on local data. The bold values stand for the best score of the three models (b) Rice classification performance (Cohen’s kappa coefficient), all local baseline models were tested in the U.S. The red dotted line represents the performance of the LSTM-MTL model in the U.S., Figure S3: Representative blocks in the four rice production regions of the U.S. (a) The predicted rice results generated by the LSTM-MTL model; the binary reference of rice land from the CDL; the cropland type maps from the CDL; and the very-high-resolution (VHR) remotely sensed imagery of the four blocks. (b) The ratios of the major cropland types in corresponding blocks, Figure S4. Confusion matrices of the test set by the LSTM-MTL model. Values in confusion matrices represent the number of samples. Diagonal values stand for the number of correctly classified samples, Table S1: Transfer performance (F1 score) of local baseline models, Table S2: Comparison between the rice area of the CDL estimation and USDA statistics at state level in 2019.
Author Contributions
Conceptualization, J.H. and T.L.; Funding acquisition, T.L.; Methodology, Z.L., and R.Z.; Project administration, J.H. and T.L.; Resources, J.H. and T.L.; Software, Z.L.; Supervision, Y.Y., K.C.T., J.H. and T.L.; Validation, Z.L., R.Z., X.X., J.X. (Jinfan Xu) and Y.Z.; Visualization, Z.L.; Writing – original draft, Z.L. and R.Z.; Writing—review & editing, C.G., J.X. (Jialu Xu), Y.Y., K.C.T., J.H. and T.L. All authors have read and agreed to the published version of the manuscript.
Funding
This research was partially funded by National Natural Science Foundation of China under Grant Number 32071894 and Zhejiang University.
Institutional Review Board Statement
Not applicable.
Informed Consent Statement
Not applicable.
Data Availability Statement
Not applicable.
Acknowledgments
The authors would like to thank the European Space Agency (ESA) for providing the multi-temporal Sentinel-1 datasets. Many thanks are also given to the USDA-NASS for providing the Cropland Data Layer.
Conflicts of Interest
The authors declare no conflict of interest.
References
- FAO. The State of Food Security and Nutrition in the World 2018: Building Climate Resilience for Food Security and Nutrition; Food & Agriculture Organization: Rome, Italy, 2018; ISBN 9251305714. [Google Scholar]
- Cai, Y.; Guan, K.; Peng, J.; Wang, S.; Seifert, C.; Wardlow, B.; Li, Z. A high-performance and in-season classification system of field-level crop types using time-series Landsat data and a machine learning approach. Remote Sens. Environ. 2018, 210, 35–47. [Google Scholar] [CrossRef]
- You, N.; Dong, J. Examining earliest identifiable timing of crops using all available Sentinel 1/2 imagery and Google Earth Engine. ISPRS J. Photogramm. Remote Sens. 2020, 161, 109–123. [Google Scholar] [CrossRef]
- Ballère, M.; Bouvet, A.; Mermoz, S.; Le Toan, T.; Koleck, T.; Bedeau, C.; André, M.; Forestier, E.; Frison, P.-L.; Lardeux, C. SAR data for tropical forest disturbance alerts in French Guiana: Benefit over optical imagery. Remote Sens. Environ. 2021, 252, 112159. [Google Scholar] [CrossRef]
- Ho Tong Minh, D.; Ienco, D.; Gaetano, R.; Lalande, N.; Ndikumana, E.; Osman, F.; Maurel, P. Deep Recurrent Neural Networks for Winter Vegetation Quality Mapping via Multitemporal SAR Sentinel-1. IEEE Geosci. Remote Sens. Lett. 2018, 15, 464–468. [Google Scholar] [CrossRef]
- Wei, S.; Zhang, H.; Wang, C.; Wang, Y.; Xu, L. Multi-Temporal SAR Data Large-Scale Crop Mapping Based on U-Net Model. Remote Sens. 2019, 11, 68. [Google Scholar] [CrossRef] [Green Version]
- Hao, P.; Di, L.; Zhang, C.; Guo, L. Transfer Learning for Crop classification with Cropland Data Layer data (CDL) as training samples. Sci. Total Environ. 2020, 733, 138869. [Google Scholar] [CrossRef] [PubMed]
- Skakun, S.; Franch, B.; Vermote, E.; Roger, J.-C.; Becker-Reshef, I.; Justice, C.; Kussul, N. Early season large-area winter crop mapping using MODIS NDVI data, growing degree days information and a Gaussian mixture model. Remote Sens. Environ. 2017, 195, 244–258. [Google Scholar] [CrossRef]
- Gao, F.; Anderson, M.; Daughtry, C.; Karnieli, A.; Hively, D.; Kustas, W. A within-season approach for detecting early growth stages in corn and soybean using high temporal and spatial resolution imagery. Remote Sens. Environ. 2020, 242, 111752. [Google Scholar] [CrossRef]
- Wang, S.; Azzari, G.; Lobell, D.B. Crop type mapping without field-level labels: Random forest transfer and unsupervised clustering techniques. Remote Sens. Environ. 2019, 222, 303–317. [Google Scholar] [CrossRef]
- Dong, J.; Xiao, X.; Menarguez, M.A.; Zhang, G.; Qin, Y.; Thau, D.; Biradar, C.; Moore, B. Mapping paddy rice planting area in northeastern Asia with Landsat 8 images, phenology-based algorithm and Google Earth Engine. Remote Sens. Environ. 2016, 185, 142–154. [Google Scholar] [CrossRef] [Green Version]
- Yang, Y.; Tao, B.; Ren, W.; Zourarakis, D.P.; Masri, B.E.; Sun, Z.; Tian, Q. An Improved Approach Considering Intraclass Variability for Mapping Winter Wheat Using Multitemporal MODIS EVI Images. Remote Sens. 2019, 11, 1191. [Google Scholar] [CrossRef] [Green Version]
- Griffiths, P.; Nendel, C.; Hostert, P. Intra-annual reflectance composites from Sentinel-2 and Landsat for national-scale crop and land cover mapping. Remote Sens. Environ. 2019, 220, 135–151. [Google Scholar] [CrossRef]
- Zhang, G.; Xiao, X.; Dong, J.; Kou, W.; Jin, C.; Qin, Y.; Zhou, Y.; Wang, J.; Menarguez, M.A.; Biradar, C. Mapping paddy rice planting areas through time series analysis of MODIS land surface temperature and vegetation index data. ISPRS J. Photogramm. Remote Sens. 2015, 106, 157–171. [Google Scholar] [CrossRef] [PubMed] [Green Version]
- Pan, L.; Xia, H.; Zhao, X.; Guo, Y.; Qin, Y. Mapping Winter Crops Using a Phenology Algorithm, Time-Series Sentinel-2 and Landsat-7/8 Images, and Google Earth Engine. Remote Sens. 2021, 13, 2510. [Google Scholar] [CrossRef]
- NASS, U. USDA-National Agricultural Statistics Service, Cropland Data Layer. United States Department of Agriculture, National Agricultural Statistics Service, Marketing and Information Services Office, Washington, DC, USA. 2020. Available online: https://nassgeodata.gmu.edu/Crop-Scape (accessed on 10 September 2020).
- Xiao, X.; Boles, S.; Frolking, S.; Li, C.; Babu, J.Y.; Salas, W.; Moore, B. Mapping paddy rice agriculture in South and Southeast Asia using multi-temporal MODIS images. Remote Sens. Environ. 2006, 100, 95–113. [Google Scholar] [CrossRef]
- Dong, J.; Fu, Y.; Wang, J.; Tian, H.; Fu, S.; Niu, Z.; Han, W.; Zheng, Y.; Huang, J.; Yuan, W. Early-season mapping of winter wheat in China based on Landsat and Sentinel images. Earth Syst. Sci. Data 2020, 12, 3081–3095. [Google Scholar] [CrossRef]
- Massey, R.; Sankey, T.T.; Congalton, R.G.; Yadav, K.; Thenkabail, P.S.; Ozdogan, M.; Sánchez Meador, A.J. MODIS phenology-derived, multi-year distribution of conterminous U.S. crop types. Remote Sens. Environ. 2017, 198, 490–503. [Google Scholar] [CrossRef]
- King, L.; Adusei, B.; Stehman, S.V.; Potapov, P.V.; Song, X.-P.; Krylov, A.; Di Bella, C.; Loveland, T.R.; Johnson, D.M.; Hansen, M.C. A multi-resolution approach to national-scale cultivated area estimation of soybean. Remote Sens. Environ. 2017, 195, 13–29. [Google Scholar] [CrossRef]
- Song, X.-P.; Potapov, P.V.; Krylov, A.; King, L.; Di Bella, C.M.; Hudson, A.; Khan, A.; Adusei, B.; Stehman, S.V.; Hansen, M.C. National-scale soybean mapping and area estimation in the United States using medium resolution satellite imagery and field survey. Remote Sens. Environ. 2017, 190, 383–395. [Google Scholar] [CrossRef]
- Zhong, L.; Hu, L.; Zhou, H.; Tao, X. Deep learning based winter wheat mapping using statistical data as ground references in Kansas and northern Texas, US. Remote Sens. Environ. 2019, 233, 111411. [Google Scholar] [CrossRef]
- Wei, P.; Chai, D.; Lin, T.; Tang, C.; Du, M.; Huang, J. Large-scale rice mapping under different years based on time-series Sentinel-1 images using deep semantic segmentation model. ISPRS J. Photogramm. Remote Sens. 2021, 174, 198–214. [Google Scholar] [CrossRef]
- LeCun, Y.; Bengio, Y.; Hinton, G. Deep learning. Nature 2015, 521, 436–444. [Google Scholar] [CrossRef] [PubMed]
- Kussul, N.; Lavreniuk, M.; Skakun, S.; Shelestov, A. Deep learning classification of land cover and crop types using remote sensing data. IEEE Geosci. Remote Sens. Lett. 2017, 14, 778–782. [Google Scholar] [CrossRef]
- Werbos, P.J. Backpropagation through time: What it does and how to do it. Proc. IEEE 1990, 78, 1550–1560. [Google Scholar] [CrossRef] [Green Version]
- Hochreiter, S.; Schmidhuber, J. Long short-term memory. Neural Comput. 1997, 9, 1735–1780. [Google Scholar] [CrossRef]
- Rußwurm, M.; Korner, M. Temporal vegetation modelling using long short-term memory networks for crop identification from medium-resolution multi-spectral satellite images. In Proceedings of the IEEE Conference on Computer Vision and Pattern Recognition Workshops, Honolulu, HI, USA, 21–26 July 2017; pp. 11–19. [Google Scholar]
- Xu, J.; Zhu, Y.; Zhong, R.; Lin, Z.; Xu, J.; Jiang, H.; Huang, J.; Li, H.; Lin, T. DeepCropMapping: A multi-temporal deep learning approach with improved spatial generalizability for dynamic corn and soybean mapping. Remote Sens. Environ. 2020, 247, 111946. [Google Scholar] [CrossRef]
- Lark, T.J.; Mueller, R.M.; Johnson, D.M.; Gibbs, H.K. Measuring land-use and land-cover change using the U.S. department of agriculture’s cropland data layer: Cautions and recommendations. Int. J. Appl. Earth Obs. Geoinf. 2017, 62, 224–235. [Google Scholar] [CrossRef]
- Boryan, C.; Yang, Z.; Mueller, R.; Craig, M. Monitoring US agriculture: The US Department of Agriculture, National Agricultural Statistics Service, Cropland Data Layer Program. Geocarto. Int. 2011, 26, 341–358. [Google Scholar] [CrossRef]
- Zhan, P.; Zhu, W.; Li, N. An automated rice mapping method based on flooding signals in synthetic aperture radar time series. Remote Sens. Environ. 2021, 252, 112112. [Google Scholar] [CrossRef]
- Zhang, D.; Pan, Y.; Zhang, J.; Hu, T.; Zhao, J.; Li, N.; Chen, Q. A generalized approach based on convolutional neural networks for large area cropland mapping at very high resolution. Remote Sens. Environ. 2020, 247, 111912. [Google Scholar] [CrossRef]
- Tong, X.-Y.; Xia, G.-S.; Lu, Q.; Shen, H.; Li, S.; You, S.; Zhang, L. Land-cover classification with high-resolution remote sensing images using transferable deep models. Remote Sens. Environ. 2020, 237, 111322. [Google Scholar] [CrossRef] [Green Version]
- Wei, P.; Huang, R.; Lin, T.; Huang, J. Rice Mapping in Training Sample Shortage Regions Using a Deep Semantic Segmentation Model Trained on Pseudo-Labels. Remote Sens. 2022, 14, 328. [Google Scholar] [CrossRef]
- Zhang, Y.; Yang, Q. An overview of multi-task learning. Natl. Sci. Rev. 2018, 5, 30–43. [Google Scholar] [CrossRef] [Green Version]
- Leiva-Murillo, J.M.; Gomez-Chova, L.; Camps-Valls, G. Multitask Remote Sensing Data Classification. IEEE Trans. Geosci. Remote Sens. 2013, 51, 151–161. [Google Scholar] [CrossRef]
- Liu, S.; Johns, E.; Davison, A.J. End-To-End Multi-Task Learning With Attention. In Proceedings of the 2019 IEEE/CVF Conference on Computer Vision and Pattern Recognition (CVPR), Long Beach, CA, USA, 15–20 June 2019; IEEE: Long Beach, CA, USA, 2019; pp. 1871–1880. [Google Scholar]
- Long, M.; Wang, J. Learning multiple tasks with deep relationship networks. arXiv 2015, arXiv:1506.02117. [Google Scholar]
- Lu, X.; Zhong, Y.; Zheng, Z.; Liu, Y.; Zhao, J.; Ma, A.; Yang, J. Multi-Scale and Multi-Task Deep Learning Framework for Automatic Road Extraction. IEEE Trans. Geosci. Remote Sens. 2019, 57, 9362–9377. [Google Scholar] [CrossRef]
- Wang, C.; Pei, J.; Wang, Z.; Huang, Y.; Wu, J.; Yang, H.; Yang, J. When Deep Learning Meets Multi-Task Learning in SAR ATR: Simultaneous Target Recognition and Segmentation. Remote Sens. 2020, 12, 3863. [Google Scholar] [CrossRef]
- USDA-NASS Quick Stats 2.0. SDA-NASS, Washington, DC. 2020. Available online: http://www.nass.usda.gov/quickstats/ (accessed on 10 September 2020).
- Singh, V.; Zhou, S.; Ganie, Z.; Valverde, B.; Avila, L.; Marchesan, E.; Merotto, A.; Zorrilla, G.; Burgos, N.; Norsworthy, J.; et al. Rice Production in the Americas. In Rice Production Worldwide; Chauhan, B.S., Jabran, K., Mahajan, G., Eds.; Springer International Publishing: Cham, Switzerland, 2017; pp. 137–168. ISBN 978-3-319-47516-5. [Google Scholar]
- Livezey, J.; Foreman, L. Characteristics and Production Costs of U.S. Rice Farms; Social Science Research Network: Rochester, NY, USA, 2005. [Google Scholar]
- McBride, W.D. US Rice Production in the New Millennium: Changes in Structure, Practices, and Costs. Econ. Res. Serv. Econ. Res. Bull. 2018, 1–56. [Google Scholar]
- Torres, R.; Snoeij, P.; Geudtner, D.; Bibby, D.; Davidson, M.; Attema, E.; Potin, P.; Rommen, B.; Floury, N.; Brown, M. GMES Sentinel-1 mission. Remote Sens. Environ. 2012, 120, 9–24. [Google Scholar] [CrossRef]
- Yommy, A.S.; Liu, R.; Wu, S. SAR image despeckling using refined Lee filter. In Proceedings of the 2015 7th International Conference on Intelligent Human-Machine Systems and Cybernetics, Washington, DC, USA, 26–27 August 2015; IEEE: Piscataway, NJ, USA, 2015; Volume 2, pp. 260–265. [Google Scholar]
- Kingma, D.P.; Ba, J. Adam: A method for stochastic optimization. arXiv 2014, arXiv:1412.6980. [Google Scholar]
- Breiman, L. Bagging predictors. Mach. Learn. 1996, 24, 123–140. [Google Scholar] [CrossRef] [Green Version]
- Breiman, L. Random forests. Mach. Learn. 2001, 45, 5–32. [Google Scholar] [CrossRef] [Green Version]
- Bouman, B.A.M. Crop modelling and remote sensing for yield prediction. NJAS Wagening. J. Life Sci. 1995, 43, 143–161. [Google Scholar] [CrossRef]
- Kuenzer, C.; Knauer, K. Remote sensing of rice crop areas. Int. J. Remote Sens. 2013, 34, 2101–2139. [Google Scholar] [CrossRef]
- Hardke, J.T. Trends in Arkansas rice production, 2016. In Arkansas Rice Research Studies; Norman, R.J., Moldenhauer, K.A.K., Eds.; University of Arkansas Division of Agriculture Cooperative Extension Service: Little Rock, AR, USA, 2017; pp. 11–21. [Google Scholar]
- Hill, J.E.; Williams, J.F.; Mutters, R.G.; Greer, C.A. The California rice cropping system: Agronomic and natural resource issues for long-term sustainability. Paddy Water Env. 2006, 4, 13–19. [Google Scholar] [CrossRef]
- Xu, J.; Yang, J.; Xiong, X.; Li, H.; Huang, J.; Ting, K.C.; Ying, Y.; Lin, T. Towards interpreting multi-temporal deep learning models in crop mapping. Remote Sens. Environ. 2021, 264, 112599. [Google Scholar] [CrossRef]
- Johnson, J.M.; Khoshgoftaar, T.M. Survey on deep learning with class imbalance. J. Big Data 2019, 6, 27. [Google Scholar] [CrossRef]
- Liu, Z.; Miao, Z.; Zhan, X.; Wang, J.; Gong, B.; Yu, S.X. Large-Scale Long-Tailed Recognition in an Open World. arXiv 2019, arXiv:1904.05160. [Google Scholar]
- Waldner, F.; Chen, Y.; Lawes, R.; Hochman, Z. Needle in a haystack: Mapping rare and infrequent crops using satellite imagery and data balancing methods. Remote Sens. Environ. 2019, 233, 111375. [Google Scholar] [CrossRef]
- Ienco, D.; Interdonato, R.; Gaetano, R.; Ho Tong Minh, D. Combining Sentinel-1 and Sentinel-2 Satellite Image Time Series for land cover mapping via a multi-source deep learning architecture. ISPRS J. Photogramm. Remote Sens. 2019, 158, 11–22. [Google Scholar] [CrossRef]
- Wang, J.; Xiao, X.; Liu, L.; Wu, X.; Qin, Y.; Steiner, J.L.; Dong, J. Mapping sugarcane plantation dynamics in Guangxi, China, by time series Sentinel-1, Sentinel-2 and Landsat images. Remote Sens. Environ. 2020, 247, 111951. [Google Scholar] [CrossRef]
- Watkins, B.; van Niekerk, A. A comparison of object-based image analysis approaches for field boundary delineation using multi-temporal Sentinel-2 imagery. Comput. Electron. Agric. 2019, 158, 294–302. [Google Scholar] [CrossRef]
- Johansen, K.; Lopez, O.; Tu, Y.-H.; Li, T.; McCabe, M.F. Center pivot field delineation and mapping: A satellite-driven object-based image analysis approach for national scale accounting. ISPRS J. Photogramm. Remote Sens. 2021, 175, 1–19. [Google Scholar] [CrossRef]
- Yang, L.; Huang, R.; Huang, J.; Lin, T.; Wang, L.; Mijiti, R.; Wei, P.; Tang, C.; Shao, J.; Li, Q.; et al. Semantic Segmentation Based on Temporal Features: Learning of Temporal–Spatial Information From Time-Series SAR Images for Paddy Rice Mapping. IEEE Trans. Geosci. Remote Sens. 2022, 60, 1–16. [Google Scholar] [CrossRef]
- Persello, C.; Tolpekin, V.A.; Bergado, J.R.; de By, R.A. Delineation of agricultural fields in smallholder farms from satellite images using fully convolutional networks and combinatorial grouping. Remote Sens. Environ. 2019, 231, 111253. [Google Scholar] [CrossRef] [PubMed]
Publisher’s Note: MDPI stays neutral with regard to jurisdictional claims in published maps and institutional affiliations. |
© 2022 by the authors. Licensee MDPI, Basel, Switzerland. This article is an open access article distributed under the terms and conditions of the Creative Commons Attribution (CC BY) license (https://creativecommons.org/licenses/by/4.0/).