
Understanding the Present-Day Spatiotemporal Variability of Precipitable Water Vapor over Ethiopia: A Comparative Study between ERA5 and GPS


Abstract
:1. Introduction
2. Datasets and Processing Strategies
2.1. GPS Observations and GAMIT-PWV
2.1.1. Tropospheric Modelling in GPS Data Processing
2.1.2. PWV Retrieval from GPS Observations
2.2. Radiosonde Data
2.3. ERA5 Reanalysis Data
2.4. IGS Tropospheric Product
2.5. Surface Meteorological Measurements
3. Validation of GPS Processing
3.1. Validation of the GAMIT-ZTD Based on the IGS-ZTD
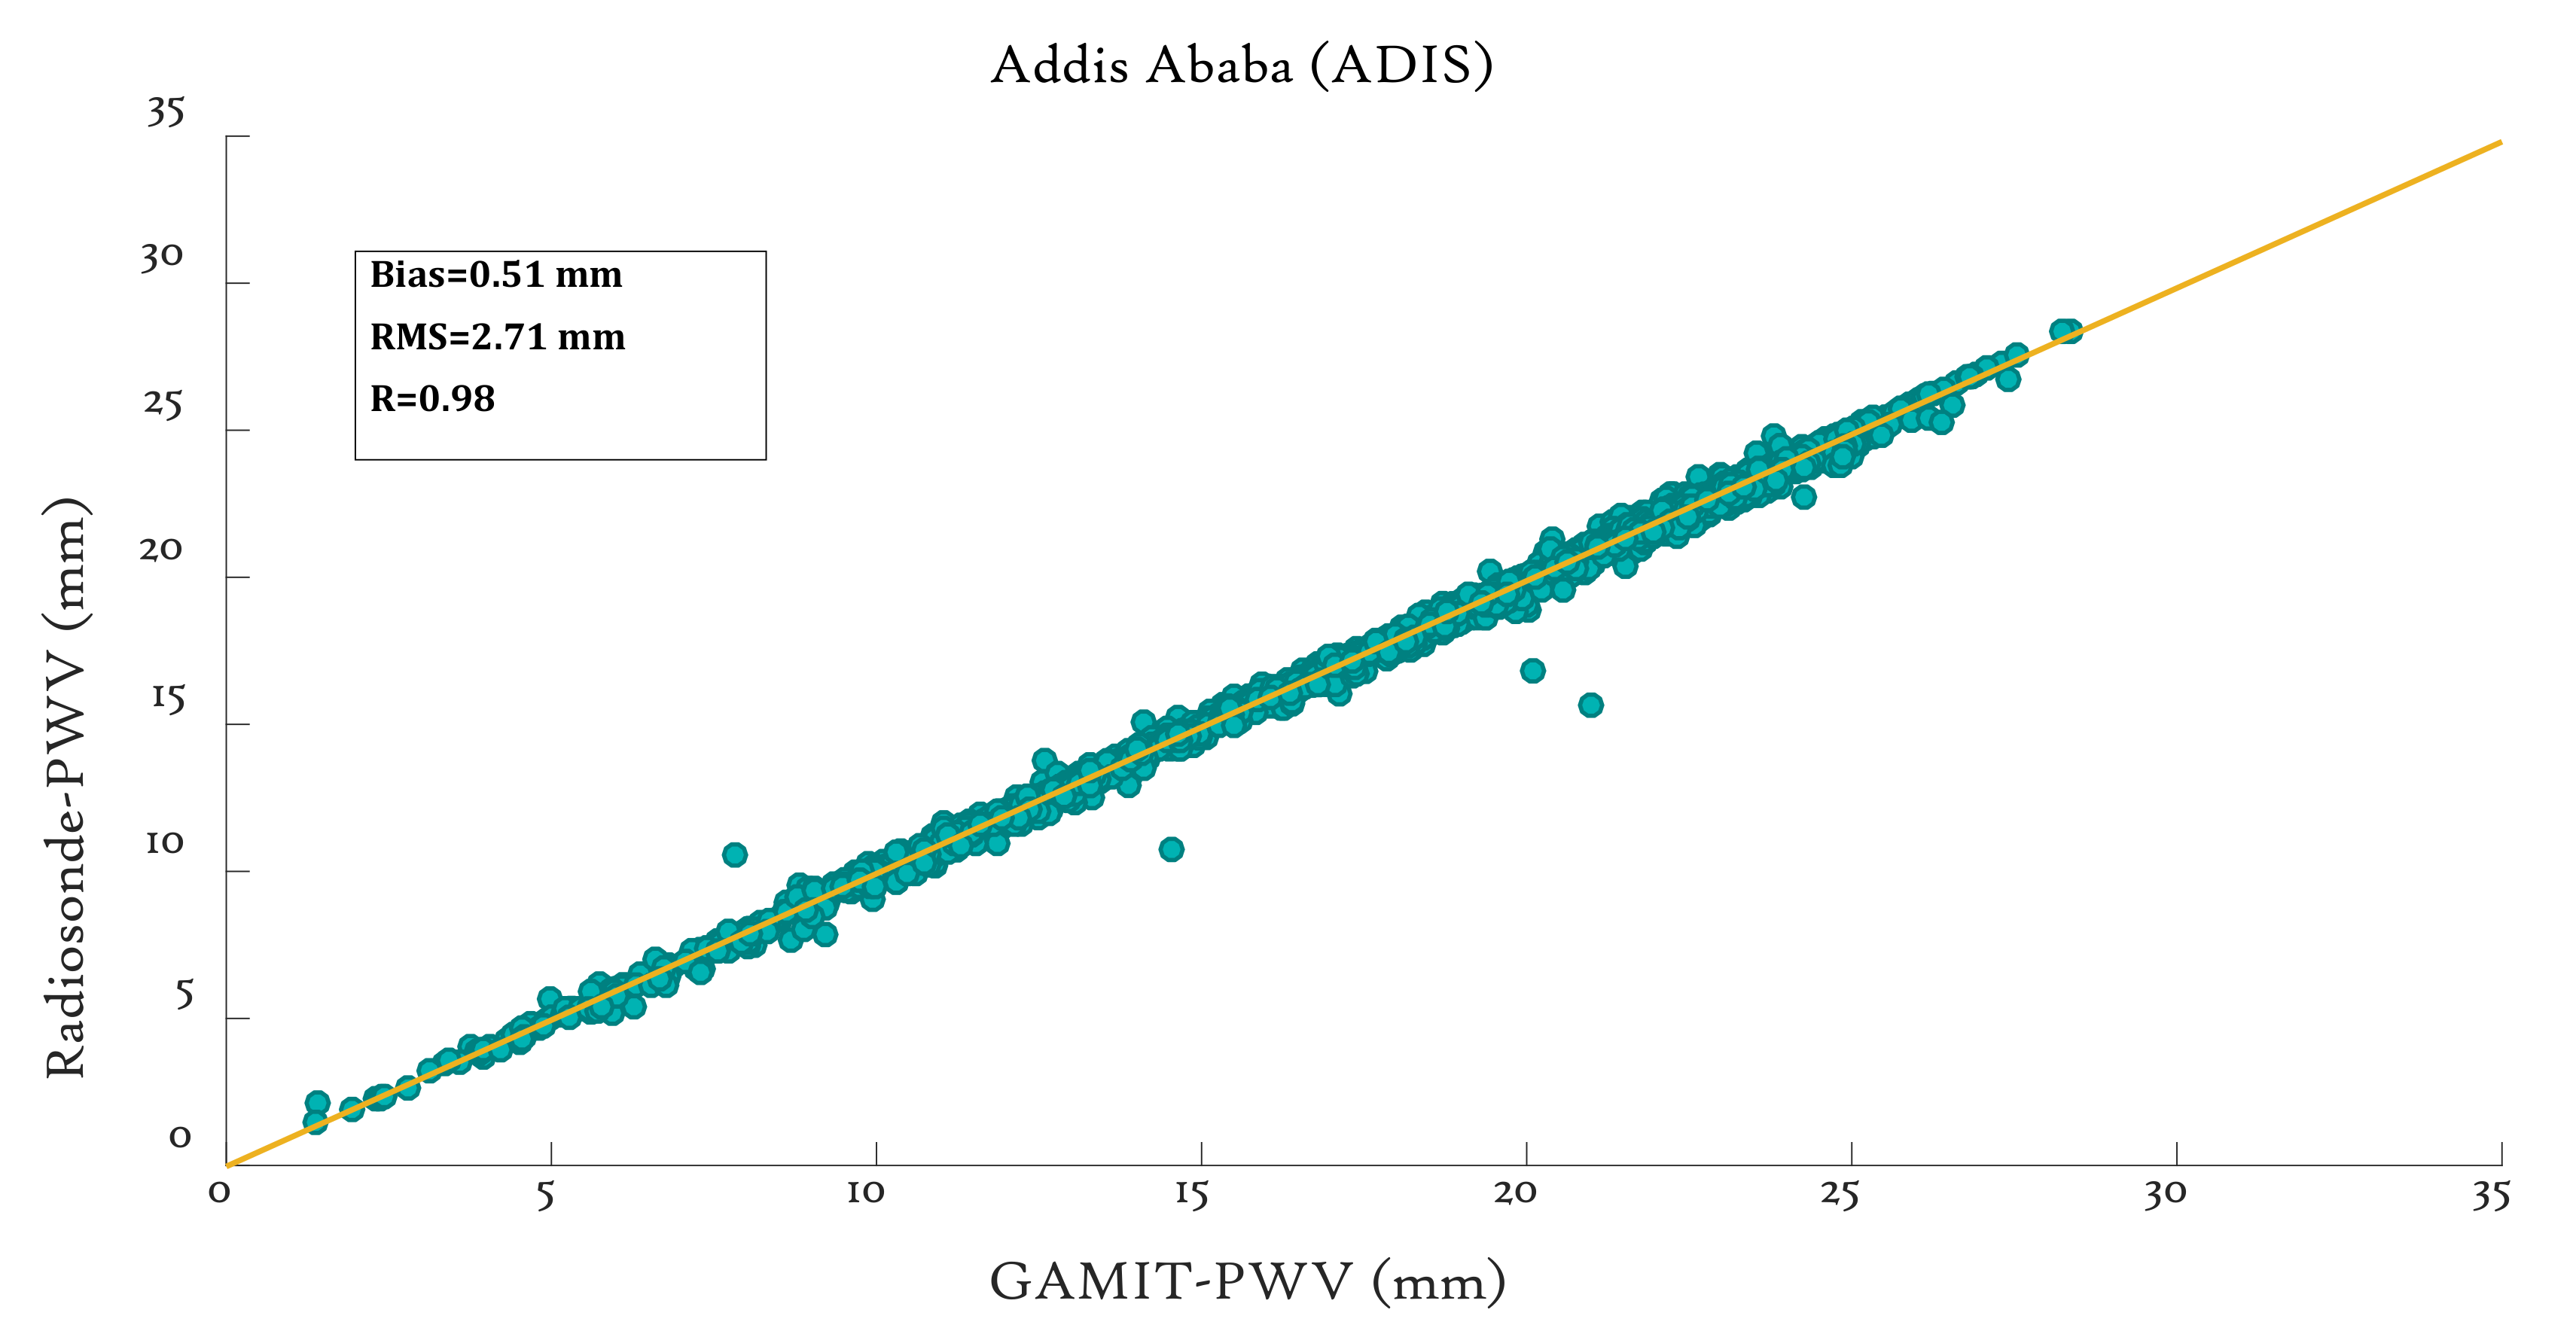
3.2. Validation of GAMIT-PWV with Radiosonde Observations
4. Spatiotemporal PWV Variability in Ethiopia from GPS and ERA5 PWV
4.1. Comparison of GAMIT-PWV and ERA5-PWV over Ethiopia
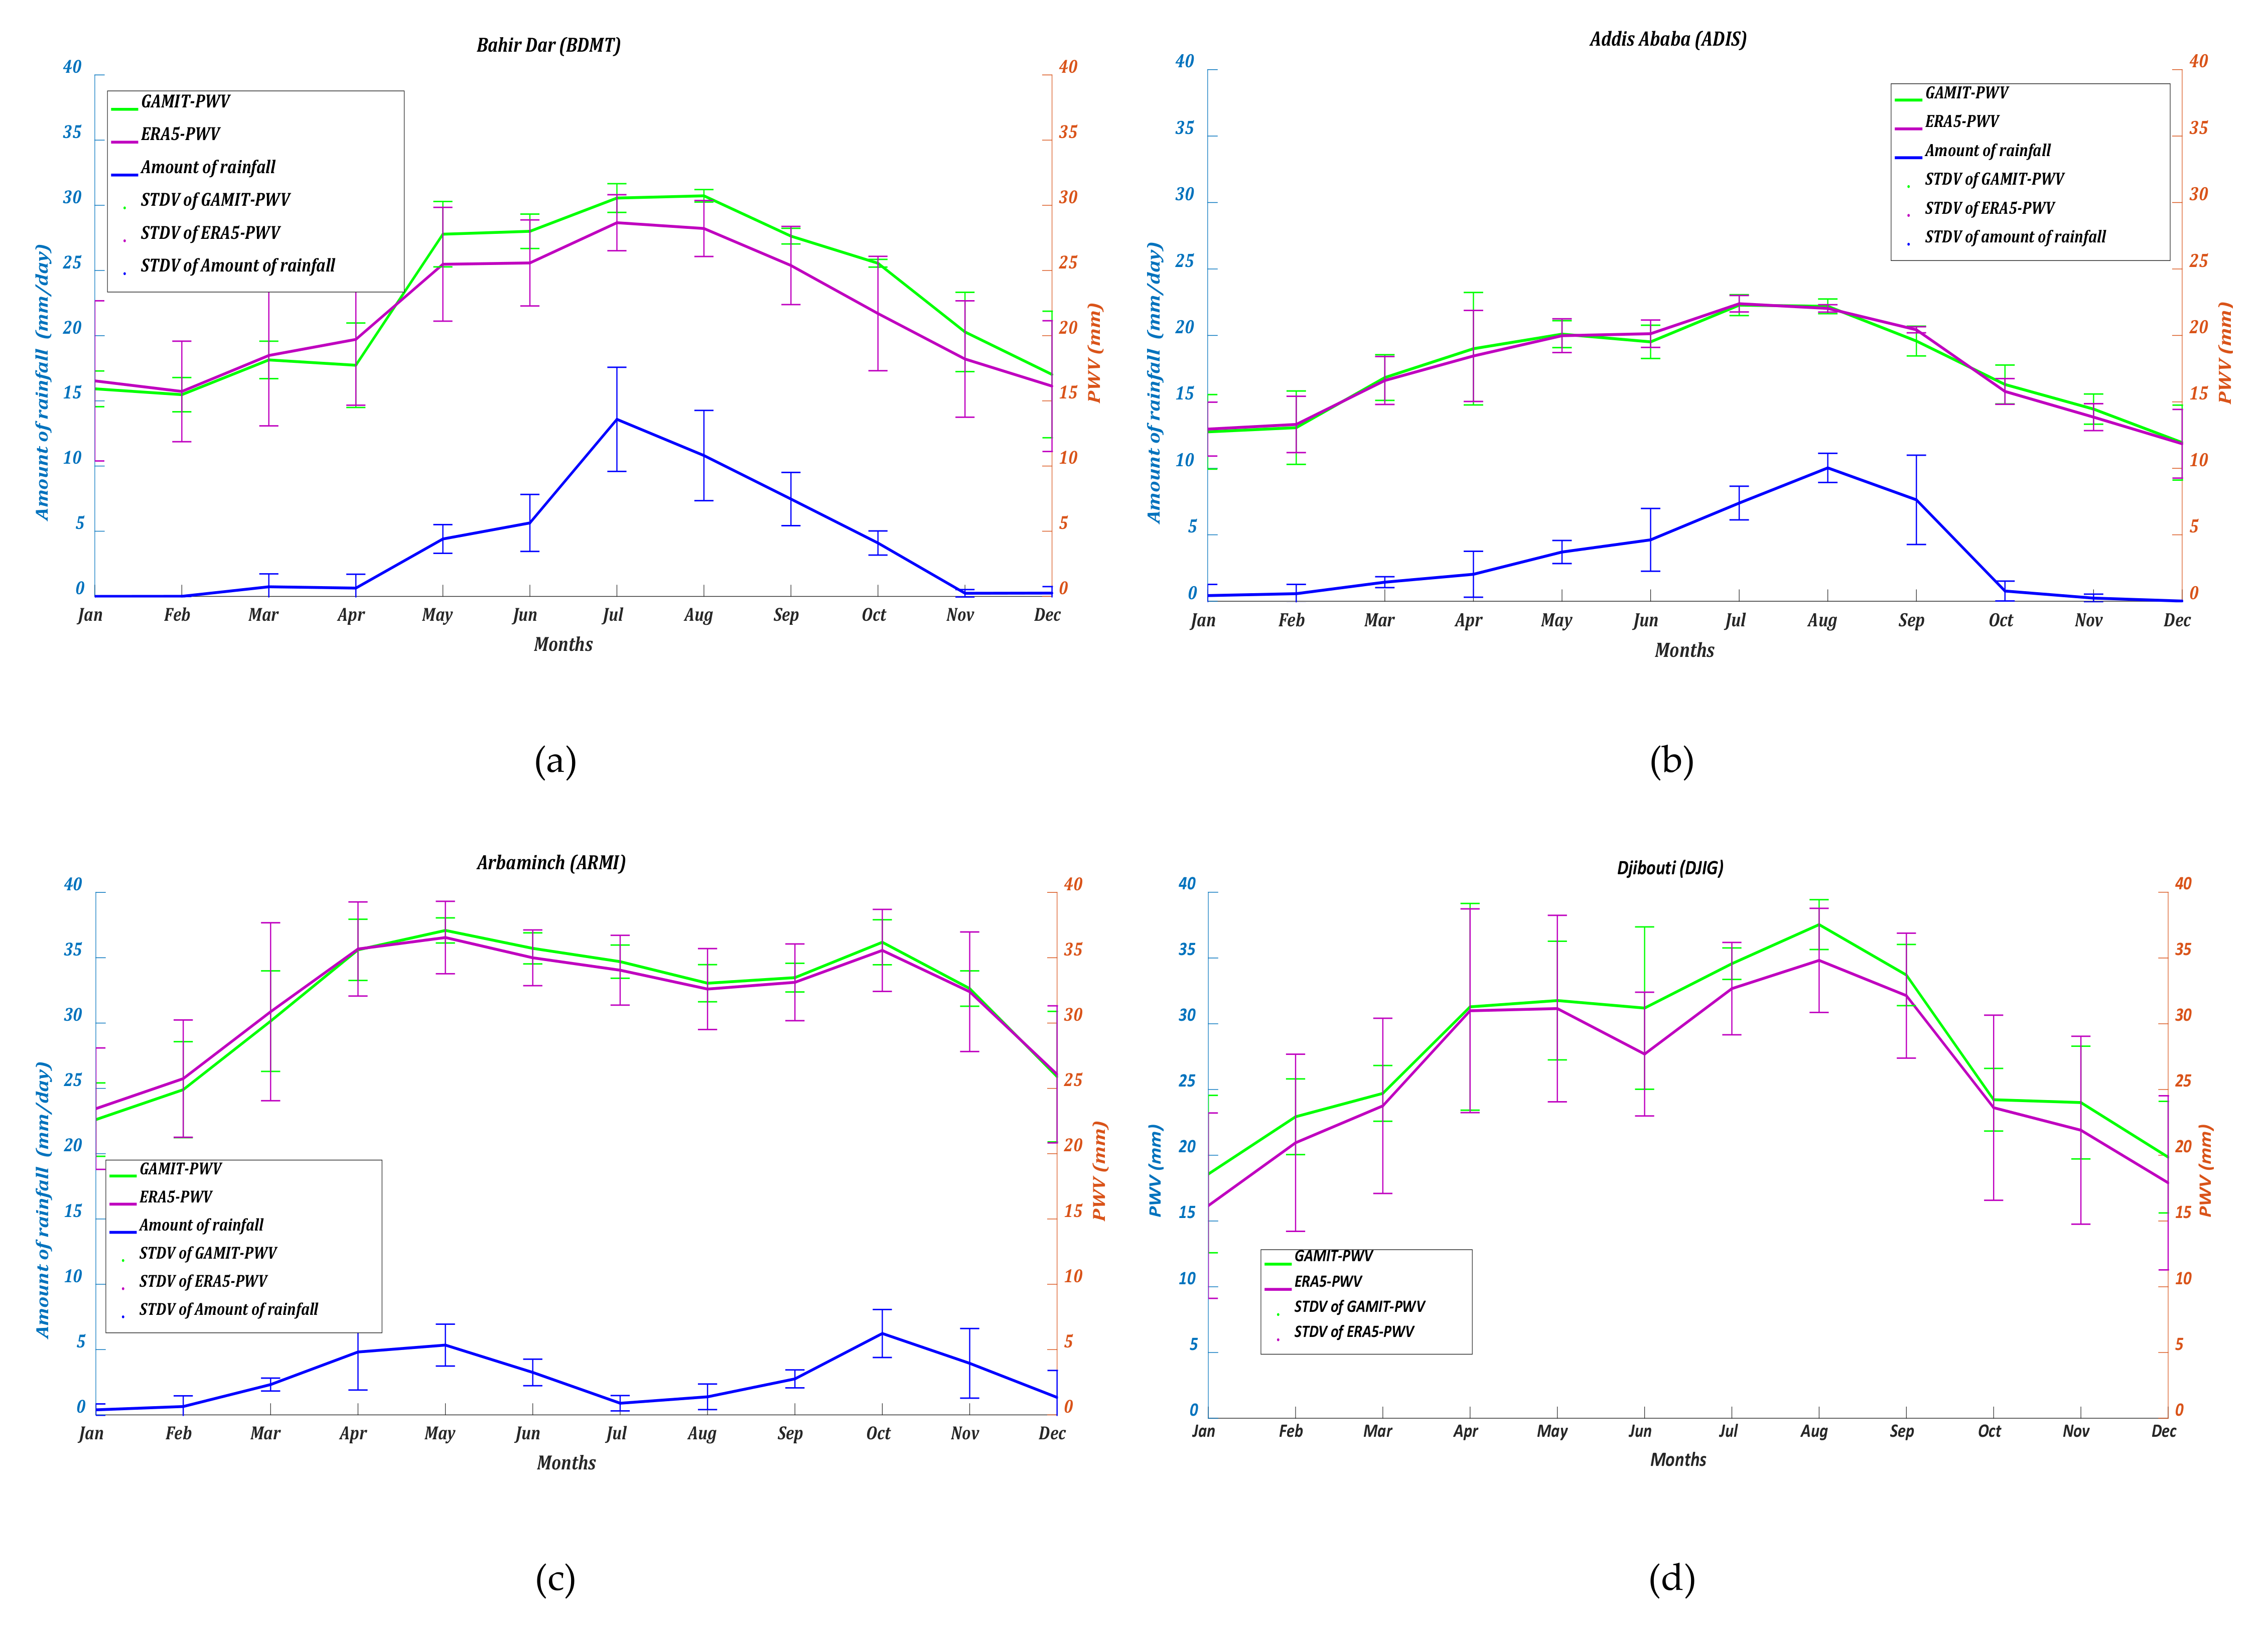
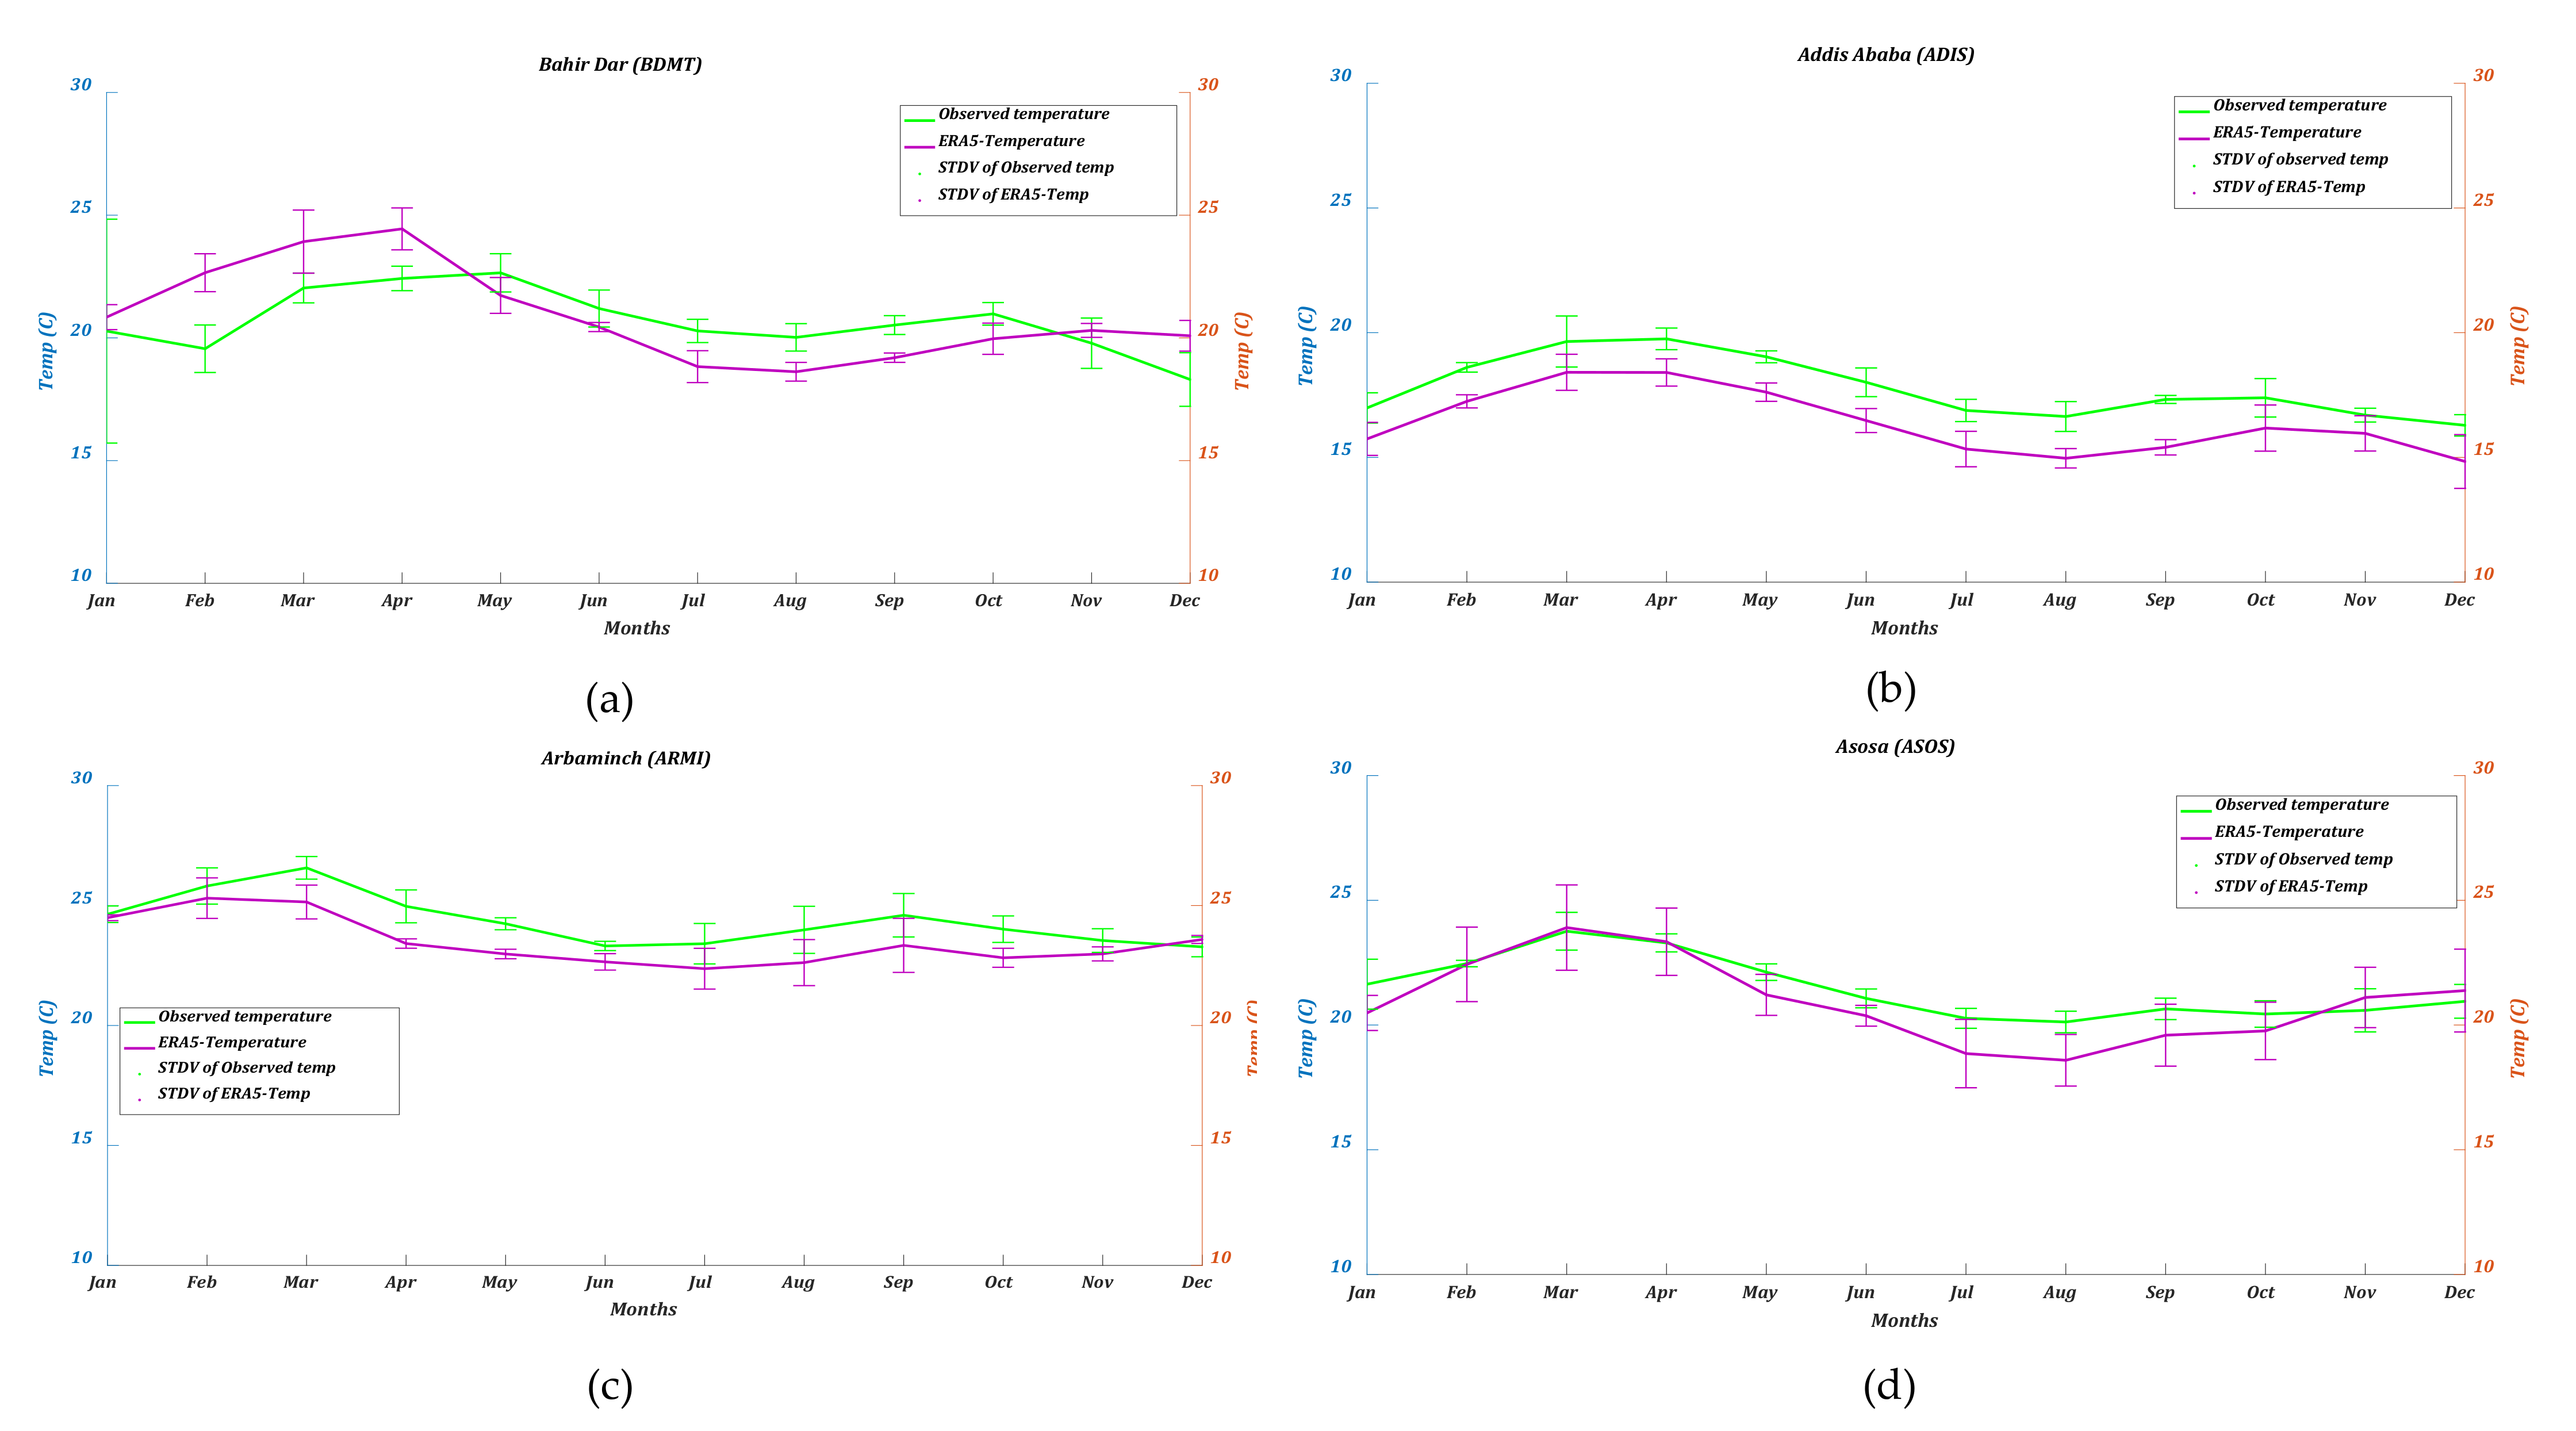
4.2. Seasonal Cycle
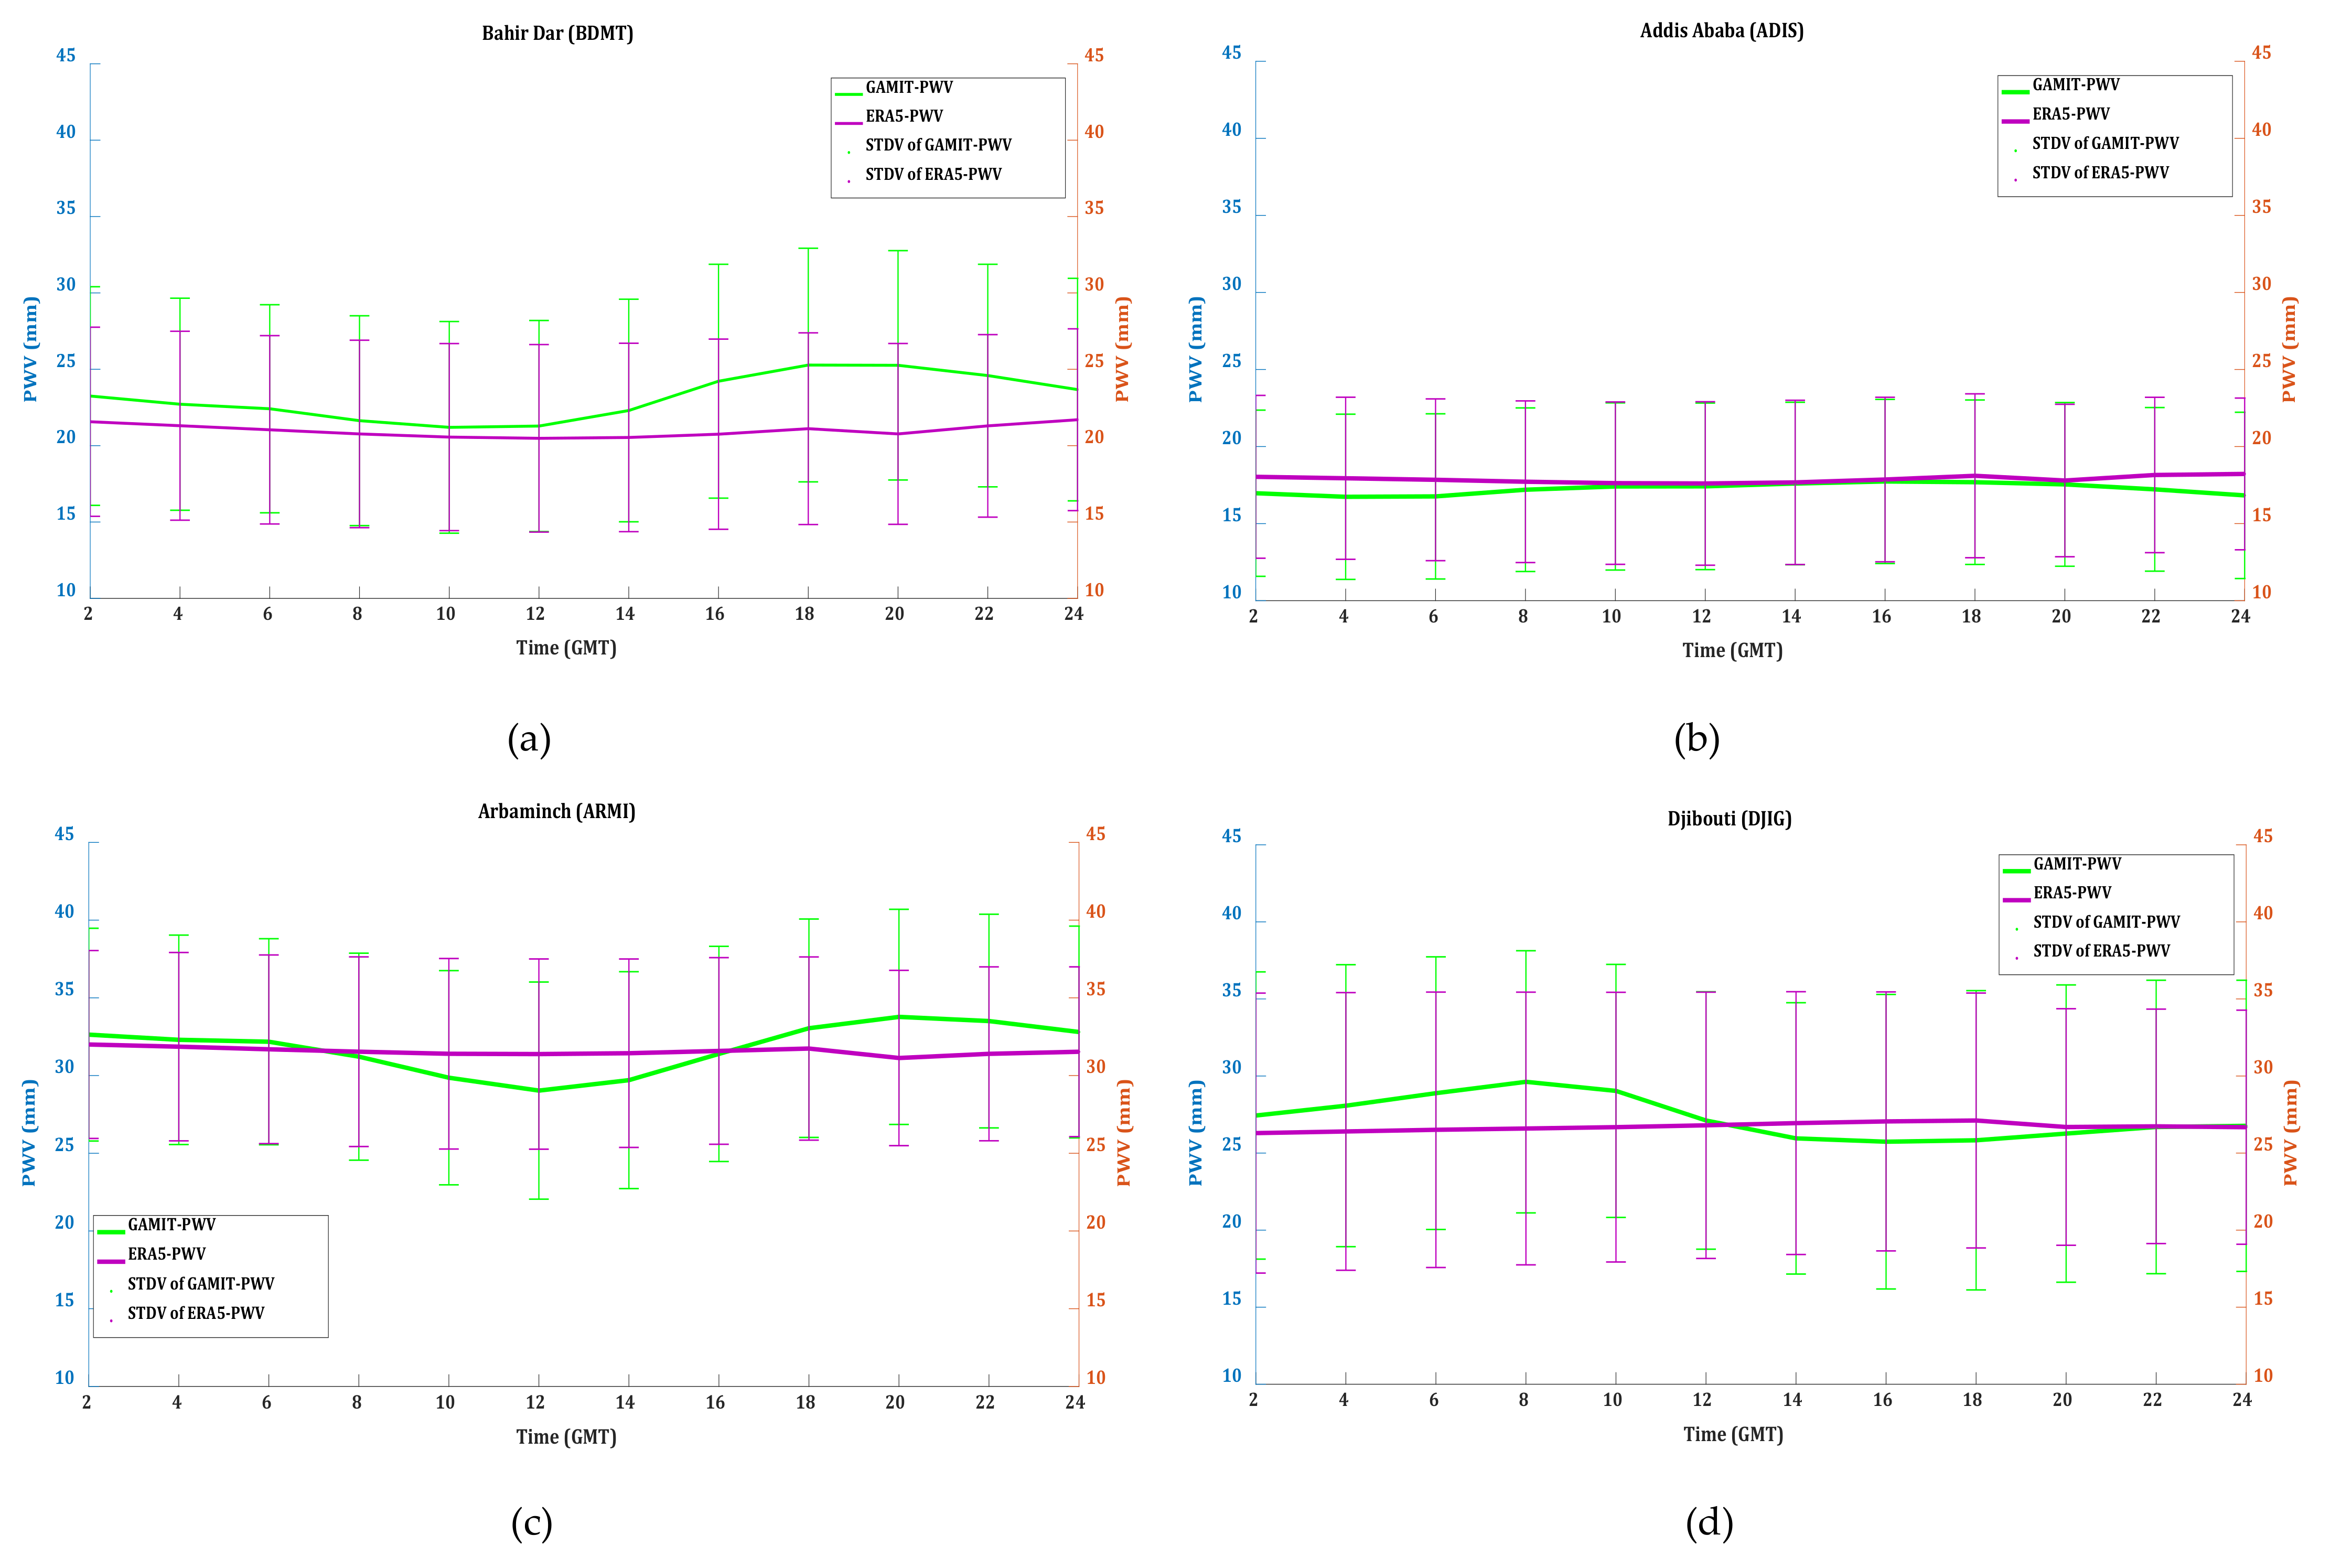
4.3. Diurnal Cycle
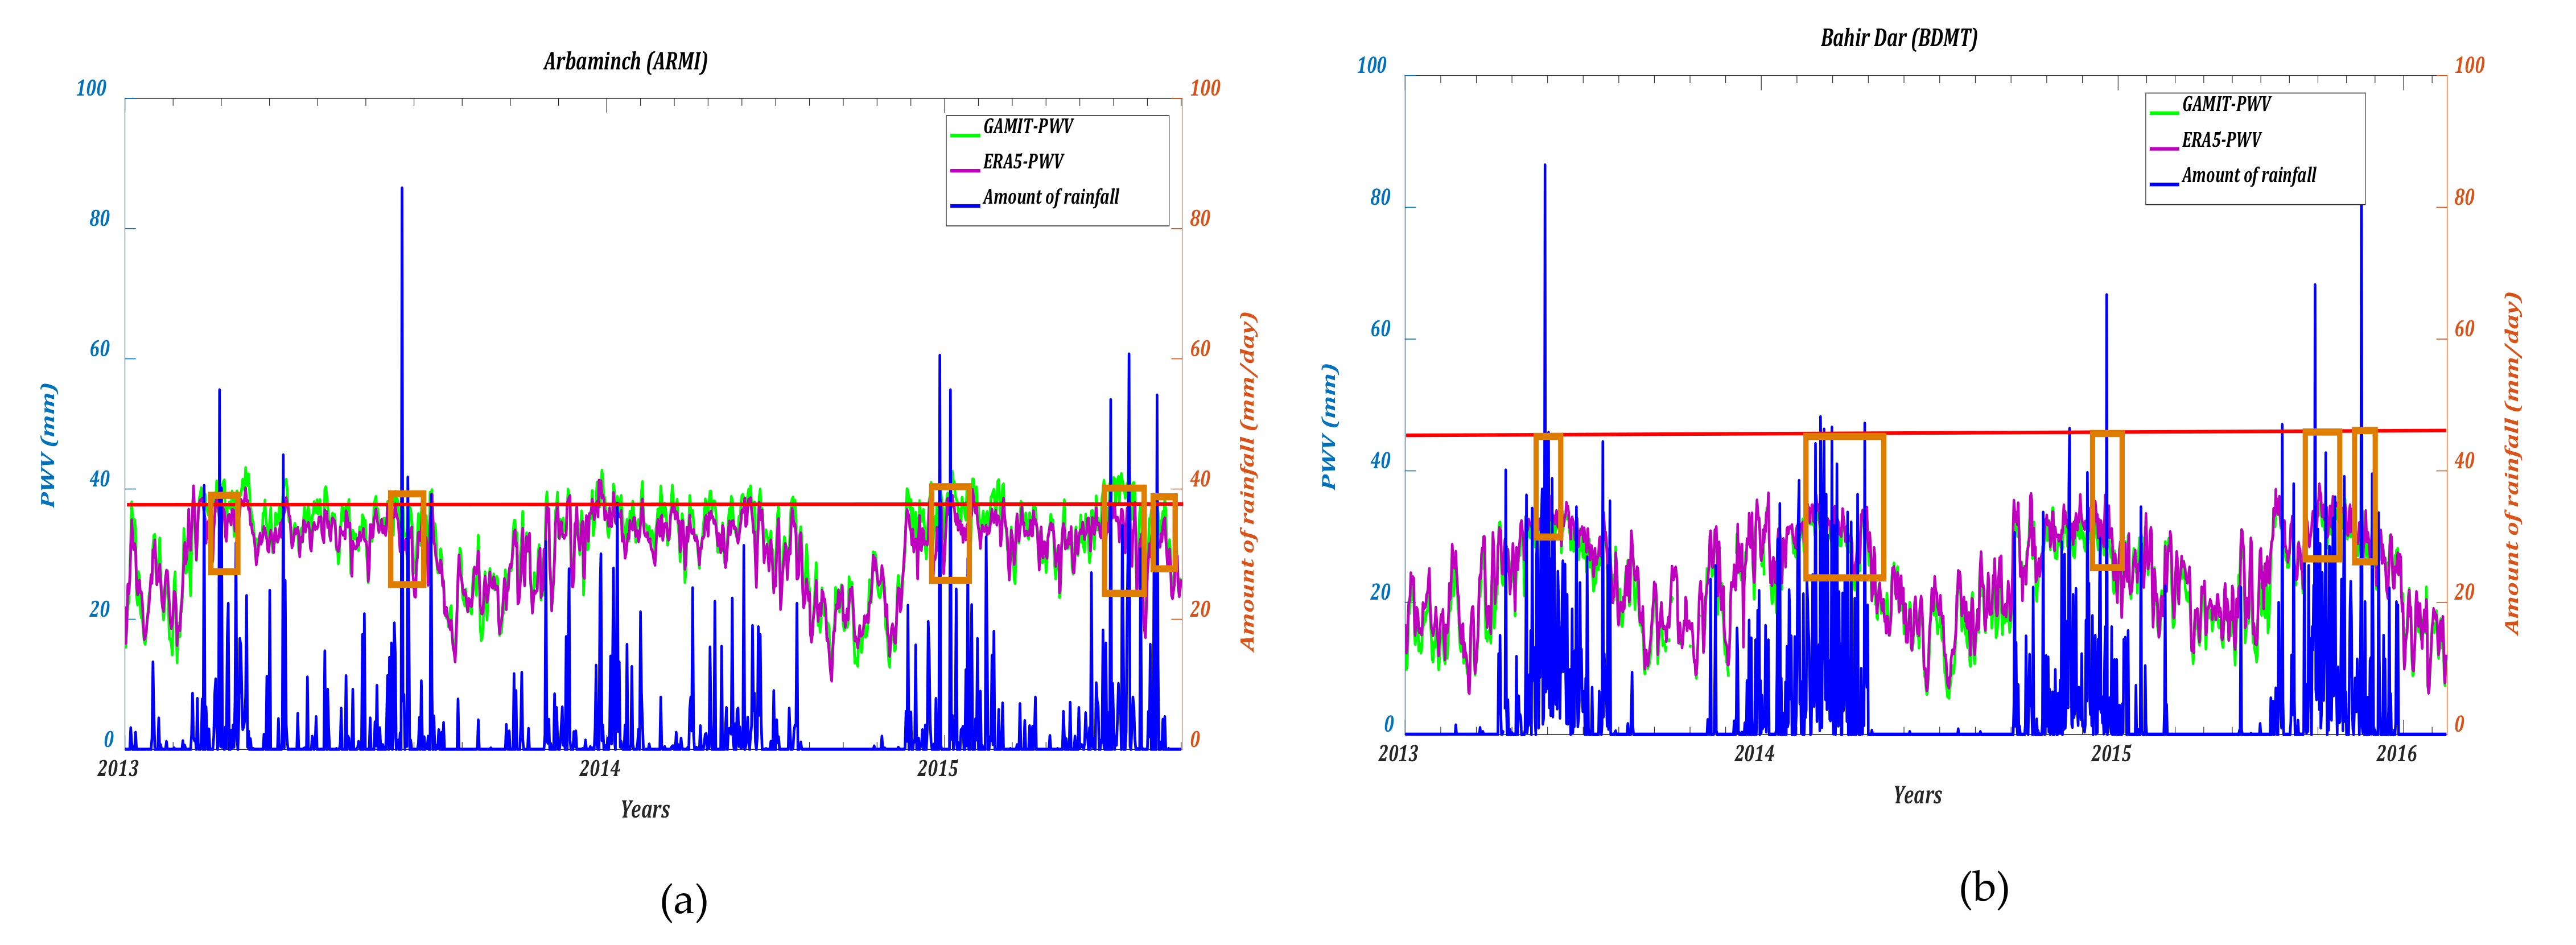
5. Analysis of the Relationship between GPS-PWV and Heavy Rainfall
6. Conclusions and Outlook
Author Contributions
Funding
Data Availability Statement
Acknowledgments
Conflicts of Interest
References
- Jones, J.; Guerova, G.; Douša, J.; Dick, G.; de Haan, S.; Pottiaux, E.; Van Malderen, R. Advanced GNSS Tropospheric Products for Monitoring Severe Weather Events and Climate. COST Action ES1206 Final Action Dissemination Report; Springer: Berlin/Heidelberg, Germany, 2019; p. 563. [Google Scholar] [CrossRef]
- Ning, T.; Elgered, G.; Willén, U.; Johansson, J.M. Evaluation of the atmospheric water vapour content in a regional climate model using ground-based GPS measurements. J. Geophys. Res. Atmos. 2013, 118, 329–339. [Google Scholar] [CrossRef] [Green Version]
- Bonafoni, S.; Biondi, R.; Brenot, H.; Anthes, R. Radio occultation and ground-based GNSS products for observing, understanding and predicting extreme events. Atmos. Res. 2019, 230, 104624. [Google Scholar] [CrossRef]
- Priego, E.; Jones, J.; Porres, M.J.; Seco, A. Monitoring water vapour with GNSS during a heavy rainfall event in the Spanish Mediterranean area. Geomat. Nat. Hazards Risk 2017, 8, 282–294. [Google Scholar] [CrossRef]
- Sapucci, L.F.; Machado, L.A.T.; de Souza, E.M.; Campos, T.B. Global Positioning System precipitable water vapour (GPS-PWV) jumps before intense rain events: A potential application to nowcasting. Meteorol. Appl. 2018, 26, 49–63. [Google Scholar] [CrossRef] [Green Version]
- Li, H.; Wang, X.; Wu, S.; Zhang, K.; Chen, X.; Qiu, C.; Zhang, S.; Zhang, J.; Xie, M.; Li, L. Development of an Improved Model for Prediction of Short-Term Heavy Precipitation Based on GNSS-Derived PWV. Remote Sens. 2020, 12, 4101. [Google Scholar] [CrossRef]
- Kämpfer, N. Monitoring Atmospheric Water Vapour; ISSI Scientific Report Series; Springer: New York, NY, USA, 2013. [Google Scholar] [CrossRef]
- Gui, K.; Che, H.; Chen, Q.; Zeng, Z.; Liu, H.; Wang, Y.; Zheng, Y.; Sun, T.; Liao, T.; Wang, H.; et al. Evaluation of radiosonde, MODIS-NIR-Clear, and AERONET precipitable water vapor using IGS ground-based GPS measurements over China. Atmos. Res. 2017, 197, 461–473. [Google Scholar] [CrossRef]
- Guerova, G.; Jones, J.; Douša, J.; Dick, G.; de Haan, S.; Pottiaux, E.; Bock, O.; Pacione, R.; Elgered, G.; Vedel, H.; et al. Review of the state of the art and future prospects of the ground-based GNSS meteorology in Europe. Atmos. Meas. Tech. 2016, 9, 5385–5406. [Google Scholar] [CrossRef] [Green Version]
- Elgered, G.; Davis, J.L.; Herring, T.A.; Shapiro, I. Geodesy by radio interferometry: Water vapour radiometry for estimation of the wet delay. J. Geophys. Res. 1991, 96, 6541–6555. [Google Scholar] [CrossRef]
- Duan, J.P.; Bevis, M.; Fang, P.; Bock, Y.; Chiswell, S.; Businger, S.; Rocken, C.; Solheim, F.; van Hove, T.; Ware, R.; et al. GPS meteorology: Direct estimation of the absolute value of precipitable water. J. Appl. Meteorol. 1996, 35, 830–838. [Google Scholar] [CrossRef] [Green Version]
- Pérez-Ramírez, D.; Whiteman, D.N.; Smirnov, A.; Lyamani, H.; Holben, B.N.; Pinker, R.; Andrade, M.; Alados-Arboledas, L. Evaluation of AERONET precipitable water vapor versus microwave radiometry, GPS, and radiosondes at ARM sites. J. Geophys. Res. Atmos. 2014, 119, 9596–9613. [Google Scholar] [CrossRef] [Green Version]
- Van Malderen, R. IWV Intercomparisons. In Advanced GNSS Tropospheric Products for Monitoring Severe Weather Events and Climate: COST Action ES1206 Final Action Dissemination Report; Jones, J., Guerova, G., Douša, J., Dick, G., de Haan, S., Pottiaux, E., Bock, O., Pacione, R., Van Malderen, R., Eds.; Springer International Publishing: Cham, Switzerland, 2020; Chapter 5; pp. 339–358. [Google Scholar] [CrossRef]
- Vaquero-Martinez, J.; Anton, M. Review on the Role of GNSS Meteorology in Monitoring Water Vapor for Atmospheric Physics. Remote Sens. 2021, 13, 2287. [Google Scholar] [CrossRef]
- Dubache, G.; Ogwang, B.A.; Ongoma, V. The effect of Indian Ocean on Ethiopian seasonal rainfall. Meteorol. Atmos. Phys. 2019, 131, 1753–1761. [Google Scholar] [CrossRef]
- Gleixner, S.; Demissie, T.; Diro, G.T. Did ERA5 Improve Temperature and Precipitation Reanalysis over East Africa? Atmosphere 2020, 11, 996. [Google Scholar] [CrossRef]
- Seleshi, Y.; Demaree, G.R. Rainfall variability in the Ethiopian and Eritrean highlands and its links with the Southern Oscillation Index. J. Biogeogr. 1995, 22, 945–952. [Google Scholar] [CrossRef]
- Zeleke, T.T.; Giorgi, F.; Diro, G.T.; Zaitchik, B.F. Trend and periodicity of drought over Ethiopia. Int. J. Climatol. 2017, 37, 4733–4748. [Google Scholar] [CrossRef]
- McSweeney, C.; New, M.; Lizcano, G. UNDP Climate Change Country Profiles: Ethiopia. 2008. Available online: http://ncsp.undp.org/sites/default/files/Ethiopia.oxford.report.pdf (accessed on 5 September 2021).
- Dosio, A.; Jones, R.G.; Jack, C.; Lennard, C.; Nikulin, G.; Hewitson, B. What Can We Know about Future Precipitation in Africa? Robustness, Significance and Added Value of Projections from a Large Ensemble of Regional Climate Models. Clim. Dyn. 2019, 53, 5833–5858. [Google Scholar] [CrossRef] [Green Version]
- Kendon, E.J.; Stratton, R.A.; Tucker, S.; Marsham, J.H.; Berthou, S.; Rowell, D.P.; Senior, C.A. Enhanced future changes in wet and dry extremes over Africa at convection-permitting scale. Nat. Commun. 2019, 10, 1794. [Google Scholar] [CrossRef] [Green Version]
- Van Vooren, S.; Van Schaeybroeck, B.; Nyssen, J.; Van Ginderachter, M.; Termonia, P. Evaluation of CORDEX rainfall in northwest Ethiopia: Sensitivity to the model representation of the orography. Int. J. Climatol. 2019, 39, 2569–2586. [Google Scholar] [CrossRef]
- Ssenyunzi, R.C.; Oruru, B.; D’ujanga, F.M.; Realini, E.; Barindelli, S.; Tagliaferro, G.; von Engeln, A.; van de Giesen, N. Performance of ERA5 data in retrieving Precipitable Water Vapour over East African tropical region. Adv. Space Res. 2020, 65, 1877–1893. [Google Scholar] [CrossRef]
- Abraha, K.E.; Lewi, E.; Masson, F.; Boy, J. Spatial-temporal variations of water vapour content over Ethiopia: A study using GPS observations and the ECMWF model. GPS Solut. 2017, 21, 89–99. [Google Scholar] [CrossRef] [Green Version]
- Mengistu, T.G.; Blumenstock, T.; Hase, F. Observations of precipitable water vapour over complex topography of Ethiopia from ground-based GPS, FTIR, radiosonde and ERA-Interim reanalysis. Atmos. Meas. Tech. 2015, 8, 3277–3295. [Google Scholar] [CrossRef] [Green Version]
- Hersbach, H.; Bell, B.; Berrisford, P.; Hirahara, S.; Horányi, A.; Muñoz-Sabater, J.; Thépaut, J.N. The ERA5 global reanalysis. Q. J. R. Meteorol. Soc. 2020, 146, 1999–2049. [Google Scholar] [CrossRef]
- Yehun, A.; Gogie, T.; Vermeer, M.; Hunegnaw, A. Estimating precipitable water vapour using the global positioning system and radio occultation over Ethiopian regions. Int. J. Remote Sens. 2021, 42, 6577–6602. [Google Scholar] [CrossRef]
- Dee, D. The ERA-Interim reanalysis: Configuration and performance of the data assimilation system. Q. J. R. Meteorol. Soc. 2011, 137, 553–597. [Google Scholar] [CrossRef]
- Dubache, G.; Asmerom, B.; Ullah, W.; Ogwang, B.A.; Amiraslani, F.; Weijun, Z.; Gul, C. Testing the accuracy of high-resolution satellite-based and numerical model output precipitation products over Ethiopia. Theor. Appl. Climatol. 2021, 146, 1127–1142. [Google Scholar] [CrossRef]
- Yuan, P.; Hunegnaw, A.; Alshawaf, F.; Awange, J.; Klos, A.; Teferle, F.N.; Kutterer, H. Feasibility of ERA5 integrated water vapor trends for climate change analysis in continental Europe: An evaluation with GPS (1994–2019) by considering statistical significance. Remote Sens. Environ. 2021, 260, 112416. [Google Scholar] [CrossRef]
- Wang, S.; Xu, T.; Nie, W.; Jiang, C.; Yang, Y.; Fang, Z.; Li, M.; Zhang, Z. Evaluation of Precipitable Water Vapor from Five Reanalysis Products with Ground-Based GNSS Observations. Remote Sens. 2020, 12, 1817. [Google Scholar] [CrossRef]
- Hackman, C.; Byram, S. IGS Troposphere Working Group 2012. Int. GPS Serv. Tech. Rep. 2012, 195–199. Available online: ftp://igs.org/pub/resource/pubs/2012_techreport.pdf (accessed on 12 June 2021).
- Herring, T.A.; King, R.W.; Floyd, M.A.; McCluskey, S.C. Introduction to GAMIT/GLOBK; MIT: Cambridge, MA, USA, 2018. [Google Scholar]
- Wessel, P.; Luis, J.F.; Uieda, L.; Scharroo, R.; Wobbe, F.; Smith, W.H.F.; Tian, D. The Generic Mapping Tools version 6. Geochem. Geophy. Geosyst. 2019, 20, 5556–5564. [Google Scholar] [CrossRef] [Green Version]
- Zuheir, A.; Paul, R.; Laurent, M.; Xavier, C. ITRF2014: A new release of the International Terrestrial Reference Frame modeling nonlinear station motions. J. Geophys. Res. Solid Earth 2016, 121, 6109–6131. [Google Scholar] [CrossRef] [Green Version]
- Petit, G.; Luzum, B. (Eds.) IERS Technical Note, 36; Verlag des Bundesamts für Kartographie und Geodäsie: Frankfurt am Main, Germany, 2010; p. 179. ISBN 3-89888-989-6. [Google Scholar]
- Letellier, T.; Lyard, F.; Lefevre, F. The new global tidal solution: Fes2004. In Proceedings of the Ocean Surface Topography Science Team Meeting, St. Petersburg, FL, USA, 4–6 November 2004. [Google Scholar]
- Kouba, J. Implementation and testing of the gridded Vienna Mapping Function 1 (VMF1). J. Geod. 2008, 82, 193–205. [Google Scholar] [CrossRef]
- Böhm, J.; Möller, G.; Schindelegger, M.; Pain, G.; Weber, R. Development of an improved empirical model for slant delays in the troposphere (GPT2w). GPS Solut. 2015, 19, 433–441. [Google Scholar] [CrossRef] [Green Version]
- Davis, J.L.; Elgered, G.; Niell, A.E.; Kuehn, C.E. Ground-based measurements of gradients in the “wet” radio refractivity of air. Radio Sci. 1993, 28, 1003–1018. [Google Scholar] [CrossRef]
- MacMillan, D.S. Atmospheric gradients from very long baseline interferometry observations. Geophys. Res. Lett. 1995, 22, 1041–1044. [Google Scholar] [CrossRef]
- Bar-Sever, Y.E.; Kroger, P.M.; Borjesson, J.A. Estimating horizontal gradients of tropospheric path delay with a single GPS receiver. J. Geophys. Res. 1998, 103, 5019–5035. [Google Scholar] [CrossRef] [Green Version]
- Chen, G.; Herring, T.A. Effects of atmospheric azimuthal asymmetry on the analysis from space geodetic data. J. Geophys. Res. 1997, 102, 20489–20502. [Google Scholar] [CrossRef]
- Marini, J.W. Correction of satellite tracking data for an arbitrary tropospheric profile. Radio Sci. 1972, 7, 223–231. [Google Scholar] [CrossRef]
- Niell, A.E. Global mapping functions for the atmosphere delay at radio wavelengths. J. Geophys. Res. 1996, 101, 3227–3246. [Google Scholar] [CrossRef]
- Böhm, J.; Werl, B.; Schuh, H. Troposphere mapping functions for GPS and very long baseline interferometry from European Center for Medium-Range Weather Forecasts operational analysis data. J. Geophys. Res. 2006, 111, B02406. [Google Scholar] [CrossRef]
- Saastamoinen, J. Atmospheric correction for the troposphere and stratosphere in radio ranging of satellites. Geophys. Monogr. 1972, 15, 247–251. [Google Scholar] [CrossRef]
- Bevis, M.; Businger, S.; Chiswell, S. GPS meteorology: Mapping zenith wet delays onto precipitable water. J. Appl. Meteorol. 1994, 33, 379–386. [Google Scholar] [CrossRef]
- Askne, J.; Nordius, H. Estimation of tropospheric delay for microwaves from surface weather data. Radio Sci. 1987, 22, 379–386. [Google Scholar] [CrossRef]
- Durre, I.; Vose, S.; Wuertz, D. Overview of the integrated global radiosonde archive. J. Clim. 2006, 19, 53–68. [Google Scholar] [CrossRef] [Green Version]
- Wang, J.; Zhang, L. Systematic errors in global radiosonde precipitable water data from comparisons with ground-based GPS measurements. J. Clim. 2008, 21, 2218–2238. [Google Scholar] [CrossRef]
- Haase, J.S.; Ge, M.; Vedel, H.; Calais, E. Accuracy and variability of GPS tropospheric delay measurements of water vapour in the western Mediterranean. J. Appl. Meteorol. 2003, 42, 1547–1568. [Google Scholar] [CrossRef]
- Wang, J.; Zhang, L.; Dai, A.; Hove, T.V.; Baelen, J.V. A near global, 2-hourly data set of atmospheric precipitable water from ground-based GPS measurements. J. Geophys. Res. 2007, 112. [Google Scholar] [CrossRef] [Green Version]
- Albergel, C.; Dutra, E.; Munier, S.; Calvet, J.C.; Munoz-Sabater, J.; de Rosnay, P.; Balsamo, G. ERA5 and ERA-Interim driven ISBA land surface model simulations: Which one performs better? Hydrol. Earth Syst. Sci. 2018, 22, 3515–3532. [Google Scholar] [CrossRef] [Green Version]
- Bock, O.; Keil, C.; Richard, E.; Flamant, C.; Bouin, M.N. Validation of precipitable water from ECMWF model analyses with GPS and radiosonde data during the MAP SOP. Q. J. R. Meteorol. Soc. 2005, 131, 3013–3036. [Google Scholar] [CrossRef]
- Vömel, H.; Selkirk, H.; Miloshevich, L.; Valverde, J.; Valdés, J.; Kyrö, E.; Kivi, R.; Stolz, W.; Peng, G.; Diaz, J.A. Radiation dry bias of the Vaisala RS92 humidity sensor. J. Atmos. Ocean. Tech. 2007, 24, 953–963. [Google Scholar] [CrossRef] [Green Version]
- Böhm, J.; Heinkelmann, R.; Schuh, H. A global model of pressure and temperature for geodetic applications. J. Geod. 2007, 81, 679–683. [Google Scholar] [CrossRef]
- Diro, G.T.; Toniazzo, T.; Shaffrey, L. Ethiopian rainfall in climate models. In African Climate and Climate Change; Springer: Dordrecht, The Netherlands, 2011; pp. 51–69. [Google Scholar] [CrossRef]
- Takele, R.; Tesfaye, K.; Traore, P.C.S. Seasonal Climate Predictability in Ethiopia: Identifying Best Predictor Sets for Subseasonal to Seasonal Forecasting; CCAFS Working Paper No. 301; CGIAR Research Program on Climate Change, Agriculture and Food Security (CCAFS): Wageningen, The Netherlands, 2020. [Google Scholar]
- Dabar, A.; Silah-Eddine, C.; Pohl, W. Spatial and temporal variability of rainfall over the Republic of Djibouti from 1946 to 2017. Int. J. Climatol. 2021, 41, 2729–2748. [Google Scholar] [CrossRef]
- Dai, A.; Trenberth, K.E.; Karl, T.R. Effects of clouds, soil moisture, precipitation and water vapour on diurnal temperature range. J. Clim. 1999, 12, 2451–2473. [Google Scholar] [CrossRef]
- Dai, A.; Giorgi, F.; Trenberth, K.E. Observed and model-simulated precipitation diurnal cycle over the contiguous United States. J. Geophys. Res. 1999, 104, 6377–6402. [Google Scholar] [CrossRef]
- World Bank Group. Climate Change Knowledge Portal. 2021. Available online: https://climateknowledgeportal.worldbank.org/country/ethiopia/vulnerability (accessed on 24 December 2021).
- Bayable, G.; Gedamu, A.; Getenet, A.; Temesgen, G. Spatiotemporal variability and trends of rainfall and its association with Pacific Ocean Sea surface temperature in West Harerge Zone, Eastern Ethiopia. Environ. Syst. Res. 2021, 10, 7. [Google Scholar] [CrossRef]
- Zhang, T.; Manning, S.W.; Rohm, S.C. Capturing the signature of severe weather events in Australia using GPS measurements. IEEE J. Sele. Top. Appl. Earth Obs. Remote Sens. 2015, 8, 1839–1847. [Google Scholar] [CrossRef]
- Benevides, P.; Catalao, J.S.; Miranda, P. On the inclusion of GPS precipitable water vapour in the nowcasting of rainfall. Nat. Hazards Earth Syst. Sci. 2015, 15, 2605–2616. [Google Scholar] [CrossRef] [Green Version]
- Van den Hende, C.; Van Schaeybroeck, B.; Nyssen, J.; Van Vooren, S.; Van Ginderachter, M.; Termonia, P. Analysis of rain-shadows in the Ethiopian Mountains using climatological model data. Clim. Dyn. 2021, 56, 1663–1679. [Google Scholar] [CrossRef]


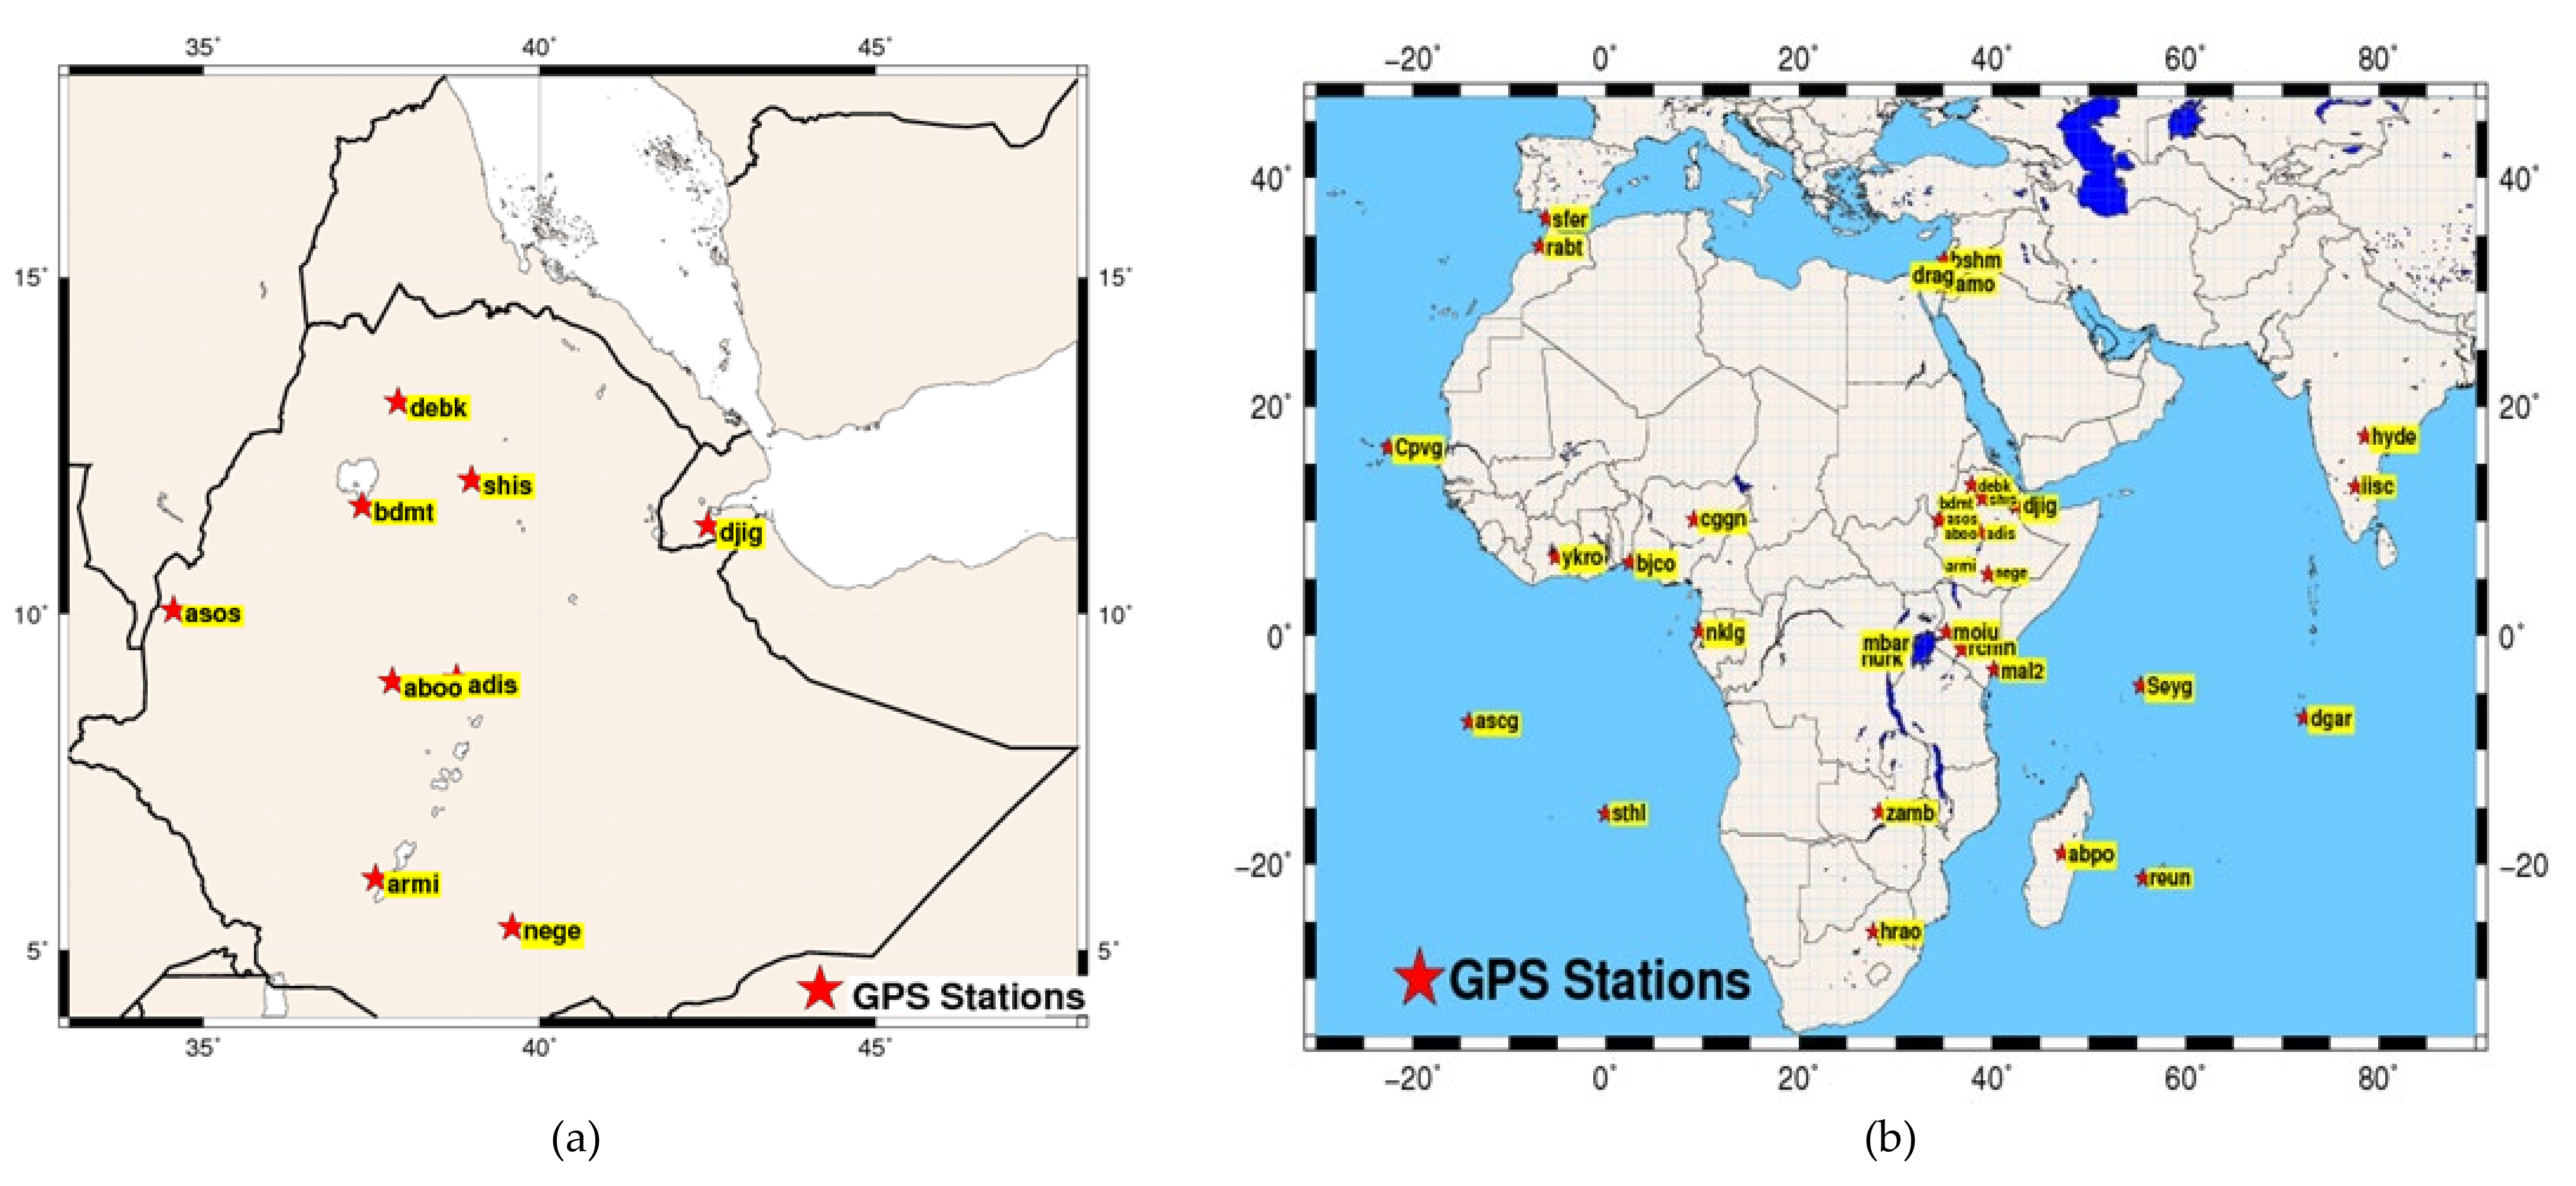
| Station | Latitude (°) | Longitude (°) | Altitude (m) | City/Town Station Location | Geographical Area | Observation Period |
|---|---|---|---|---|---|---|
| ADIS 1 | 9.02 | 38.46 | 2439.15 | Addis-Ababa | Subtropical highland climate, located in the central highland | 2013–2020 |
| ABOO 1 | 8.59 | 37.48 | 1979 | Ambo town | subtropical highland, located in the central highland | 2013–2018 |
| ARMI 1 | 6.03 | 37.33 | 1201.8 | Arbaminch town | Very warm temperature, low land and surrounded by many water bodies and located in the African great rift valley in the southern part of Ethiopia | 2013–2015 |
| ASOS 1 | 10.03 | 34.33 | 1626 | Asosa town | Warm temperature and located in the western part of the country | 2013–2017 |
| BDMT 1 | 11.36 | 37.21 | 1793.38 | Bahir Dar city | highland and near lake Tana and located in the north-western part of the country | 2013–2017 |
| DEBK | 13.09 | 37.53 | 2862 | Debark town | Cold temperature, highland and near the high peak mountain, Ras-Dashin, located in the northern part of the country | 2013–2017 |
| NEGE 1 | 5.20 | 39.35 | 1554 | Negele-Borena town | Warm area, Arid climate and located in the southern part of Ethiopia | 2013–2020 |
| SHIS | 11.59 | 38.59 | 2010.5 | Shimsheha town | Highland, located in the northern part of the country | 2013–2017 |
| DJIG | 11.31 | 42.50 | 711 | Djibouti | warm and located near the Red Sea | 2016–2020 |
| Software Used | GAMIT v10.71 [33,34] |
|---|---|
| Processing Mode | Multi-epoch joint least squares adjustment |
| Sampling Interval | 30 s |
| Frame of Reference | International terrestrial reference frame ITRF2014 [35] |
| Antenna PCO/PCV Model | IGS14.ATX |
| Solid Earth Corrections | Solid earth tides, ocean loading induced earth tides, and polar motion induced earth tides according to the IERS 2010 convention [36] |
| Ocean Loading Model | Finite element solution FES2004 [37] |
| Ionospheric Model | Ionospheric-free |
| Observation Elevation Cut-off | 10 degree |
| Mapping Functions | Vienna mapping function VMF1(grid) [38] |
| A priori Hydrostatic and Wet Tropospheric Model y | VMF1(grid) [38] Initial hydrostatic delay estimated with Saastamoinen model using the global pressure and temperature (GPT2w) as input [39] |
| Orbits and Satellite Clocks Time Resolution | IGS Final 2 h |
| Station | No. Obs. | Mean Difference (mm) | RMSE (mm) | R | Altitude (m) | (m) |
|---|---|---|---|---|---|---|
| ADIS | 31194 | −0.04 | 0.62 | 0.99 | 2439.15 | 58.31 |
| ABOO | 21710 | 0.14 | 0.63 | 0.98 | 1979 | 76.37 |
| ARMI | 14226 | 0.08 | 0.57 | 0.99 | 1200 | −468.88 |
| ASOS | 18910 | 3.62 | 3.80 | 0.96 | 1626 | 864.6 |
| BDMT | 17235 | 1.25 | 2.05 | 0.97 | 1793.38 | −353.16 |
| DEBK | 18240 | 2.84 | 2.94 | 0.98 | 2862 | 1218.47 |
| NEGE | 27452 | 1.27 | 1.42 | 0.98 | 1554 | 397 |
| SHIS | 18913 | −0.21 | 1.15 | 0.97 | 2010 | −225.46 |
| DJIG | 18012 | 1.72 | 1.94 | 0.99 | 711.41 | 303.2 |
| Datasets | Obs. Type | Time Resolution | Obs. Start | Obs. End | Nb. Sites |
|---|---|---|---|---|---|
| GAMIT-ZTD/PWV | Point | 2 h | 2013 | 2017/2020 | ZTD: 34 PWV: 9 (8 Ethiopian+ DJIG) |
| IGS-ZTD | Point | 5 min | 2013 | 2020 | 27 (26 outside Ethiopia + ADIS) |
| ERA5-PWV | Gridded | 1 h | 2013 | 2020 | 9 |
| Radiosonde-PWV | Vertical profiles | 12 h | 2013 | 2020 | 1 |
| Surface temperature | Point | Max and min | 2013 | 2019 | 6 |
| Rainfall amount | Point | Daily | 2013 | 2019 | 6 |
| Site | Seasonal Cycle | Diurnal Cycle | ||||||
|---|---|---|---|---|---|---|---|---|
| GAMIT-PWV | ERA5-PWV | GAMIT-PWV | ERA5-PWV | |||||
| Abs. Ampl. (mm) | Rel. Ampl. (%) | Abs. Ampl. (mm) | Rel. Ampl. (%) | Abs. Ampl. (mm) | Rel. Ampl. (%) | Abs. Ampl. (mm) | Rel. Ampl. (%) | |
| ADIS | 10.34 | 59.66 | 10.54 | 60.85 | 0.99 | 5.76 | 1.14 | 6.29 |
| ABOO | 12.21 | 53.63 | 13.05 | 57.65 | 1.70 | 7.45 | 1.87 | 8.25 |
| ASOS | 17.15 | 66.40 | 14.64 | 65.94 | 1.50 | 5.70 | 0.46 | 2.08 |
| ARMI | 14.48 | 45.50 | 13.10 | 41.26 | 4.74 | 14.91 | 1.21 | 3.81 |
| BDMT | 15.25 | 66.60 | 12.94 | 59.78 | 4.10 | 17.61 | 2.33 | 10.74 |
| DEBK | 10.93 | 76.65 | 9.03 | 79.18 | 2.87 | 20.60 | 1.27 | 11.15 |
| DJIG | 18.97 | 68.09 | 18.65 | 71.34 | 3.89 | 14.24 | 2.071 | 7.92 |
| NEGE | 12.47 | 50.41 | 13.11 | 55.88 | 1.51 | 6.12 | 0.85 | 3.64 |
| SHIS | 15.25 | 77.97 | 12.68 | 64.13 | 1.94 | 9.90 | 2.35 | 11.88 |
Publisher’s Note: MDPI stays neutral with regard to jurisdictional claims in published maps and institutional affiliations. |
© 2022 by the authors. Licensee MDPI, Basel, Switzerland. This article is an open access article distributed under the terms and conditions of the Creative Commons Attribution (CC BY) license (https://creativecommons.org/licenses/by/4.0/).
Share and Cite
Koji, A.K.; Van Malderen, R.; Pottiaux, E.; Van Schaeybroeck, B. Understanding the Present-Day Spatiotemporal Variability of Precipitable Water Vapor over Ethiopia: A Comparative Study between ERA5 and GPS. Remote Sens. 2022, 14, 686. https://doi.org/10.3390/rs14030686
Koji AK, Van Malderen R, Pottiaux E, Van Schaeybroeck B. Understanding the Present-Day Spatiotemporal Variability of Precipitable Water Vapor over Ethiopia: A Comparative Study between ERA5 and GPS. Remote Sensing. 2022; 14(3):686. https://doi.org/10.3390/rs14030686
Chicago/Turabian StyleKoji, Abdisa Kawo, Roeland Van Malderen, Eric Pottiaux, and Bert Van Schaeybroeck. 2022. "Understanding the Present-Day Spatiotemporal Variability of Precipitable Water Vapor over Ethiopia: A Comparative Study between ERA5 and GPS" Remote Sensing 14, no. 3: 686. https://doi.org/10.3390/rs14030686
APA StyleKoji, A. K., Van Malderen, R., Pottiaux, E., & Van Schaeybroeck, B. (2022). Understanding the Present-Day Spatiotemporal Variability of Precipitable Water Vapor over Ethiopia: A Comparative Study between ERA5 and GPS. Remote Sensing, 14(3), 686. https://doi.org/10.3390/rs14030686