Technical Note

Influence of Energy and Water Cycle Key Parameters on Drought in Mongolian Plateau during 1979–2020

1
State Key Laboratory of Remote Sensing Science, Aerospace Information Research Institute, Chinese Academy of Sciences, Beijing 100094, China
2
College of Geography Science, Inner Mongolia Normal University, Hohhot 010022, China
3
Institute of Geographic Sciences and Natural Resources Research, Chinese Academy of Sciences, Beijing 100101, China
4
National Space Science Center, Chinese Academy of Sciences, Beijing 100190, China
*
Author to whom correspondence should be addressed.
Remote Sens. 2022, 14(3), 685; https://doi.org/10.3390/rs14030685
Submission received: 24 November 2021 / Revised: 26 January 2022 / Accepted: 27 January 2022 / Published: 31 January 2022
(This article belongs to the Special Issue Advances on Land–Ocean Heat Fluxes Using Remote Sensing)

Abstract

:
Drought in the Mongolian Plateau (MP) has gradually intensified in recent decades. The energy and water cycles are key factors affecting drought. However, there are few quantitative studies on the mechanism of aridity change in this region. This study uses the ERA5, Moderate Resolution Imaging Spectroradiometer (MODIS) and Himawari 8 datasets and investigated the mechanism of drought change over the MP. The aridity index (the ratio of potential evaporation and total precipitation) is employed to detect drought changes. The results showed that the annual mean of aridity index increased by 0.73% per year (increased significantly since 1999) during the period 1979–2020. Moreover, the drought was most severe in the January to April of 2016–2020, mainly concentrated in the central and western parts of the MP. The potential evaporation increased (0.72% per year) and total precipitation decreased (0.16% per year) from 1979 to 2020. However, the surface temperature continued increasing from August to December in the period 2016–2020 (1.67% per year). This may result in an increase in potential evaporation and a decrease in volumetric soil water from August to December last year. The decrease of volumetric soil water resulted in the decrease of total cloud cover (0.25% per year) and total precipitation from January to April. The surface net radiation (increased by 0.42% per year) and the potential evaporation increased, which may aggravate the drought from January to April. The evaporation paradox is studied over the MP. The results show that the variation in evaporation is consistent with that of total precipitation, and the surface temperature will promote an increase in evaporation and potential evaporation. This study reveals that global warming, desertification and increased surface net radiation contribute to the increase in potential evaporation and reduced volumetric soil water, which together contribute to drought.

1. Introduction

Drought is a shortage of moisture in the climatic sense of the term, and its causes are closely related to the availability of key parameters of the energy and water cycle such as precipitation, evaporation, vegetation, surface radiation, water vapor and temperature, and their interactions [1,2,3,4]. Therefore, the in-depth study of drought formation mechanism based on multiple dependent variables is important for environmental protection, desertification prevention and drought prediction. The Mongolian Plateau (MP) is an arid and semiarid region with large temperature variations and little precipitation. The annual mean temperature increased 0.96 °C per year approximately from 1901 to 1998 over the MP [5]. Drought threatens grassland productivity, livestock and human societies and has attracted much attention in this region.
At present, drought studies over the MP have focused on independent consideration of vegetation degradation, precipitation reduction and mesoscale atmospheric circulation, and have yielded some results [6,7,8,9,10]. For example, atmospheric circulation can affect drought over the MP because the weakening of the subtropical high in the western Pacific and the increase in the East Asian Arctic vortex negatively impact spring precipitation transport [11]. Soil moisture on dry days is related to soil temperature, while that on rainy days is related to atmospheric precipitation [12,13]. Drought over the MP can lead to a decrease in vegetation cover, which further leads to a decrease in seasonal latent heat and surface temperature [14]. The rapid warming of the MP at the beginning of the 20th century exacerbated the drought, which was relatively severe in the central and western parts of the MP [15]. Vegetation cover on the MP formerly continued to increase in the mid-1990s with increases in precipitation and temperature, but decreased after 1999 when precipitation decreased [16]. The findings suggest that the frequent droughts in the northeastern part of the MP from 1996–2015 may be related to overgrazing, which led to an increase in temperature and a decrease in soil water content [17].
Drought studies usually use precipitation and evaporation parameters, and it might involve the evaporation paradox. The evaporation paradox states that global warming will lead to an increase in potential evaporation, but there has been a significant decrease in potential evaporation in the Northern Hemisphere. The results show that evaporation in some areas of China decreased from 1985 to 2008 [18]. There are also some studies that used multiple drought indexes to prove the drought situation over the MP. The drought index is the ratio of potential evapotranspiration to total precipitation, and it can reflect the impact of drought degree on energy and water cycle [19]. For example, the Palmer drought severity index (PDSI) began to decrease from 4 to −2 during the period 1960–2010 over the MP [9,20]. Drought was most severe in spring over the MP during the period 1980–2015 [6]. The standardized precipitation evapotranspiration index (SPEI) for MP decreased after 1999 (SPEI < −4.307) due to the influence of the surrounding climate forcing, indicating that the drought has become more severe [8,21]. The SPEI study also showed that MP had the most severe in spring drought during 1980–2015 [6].
In summary, although the drought causes of MP have been studied from many perspectives and some useful results have been obtained, studies that combine multiple parameters of energy and water cycle to analyze the drought mechanism of MP are relatively rare. Therefore, this paper analyzes the temporal and spatial distribution of droughts over the MP region and the impact of key parameters of the energy and water cycles on droughts for the period 1979–2020. The paper is organized as follows. Section 2 describes the datasets and methods. Section 3 describes the spatiotemporal distribution characteristics of drought, energy and the water cycle over the MP. The interaction of energy and water cycles are also analyzed. Finally, conclusions are presented in Section 4.

2. Materials and Methods

2.1. Data

ERA5 is the global climate reanalysis dataset that was released on 17 July 2017 by the Copernican climate change service operated by the ECMWF and mainly includes atmospheric parameters and surface parameter data [22,23]. The ERA5 reanalysis dataset is produced by using the existing observation data assimilation method. Compared with other available reanalysis datasets, for example, the ECMWF/ERA15 and the ERA-INTERIM [22,23], the National Center for Environmental Prediction/National Center for Atmospheric Research (NCEP/NCAR) reanalysis dataset [24] and the NASA Goddard Earth Observing System (GEOS) reanalysis dataset [25,26], the latest ERA5 reanalysis dataset has longer time series and higher spatial and temporal resolutions (0.25° and 1 h) [27]. The ERA5 reanalysis dataset used in this paper is the ERA5 monthly averaged data on single levels from 1979 to the present. This study uses total cloud cover, volumetric soil water layer 1 (which is defined as the water content at 0–7 cm below the surface), volumetric soil water layer 2 (which is defined as the water content at 7–28 cm below the surface), surface net radiation (surface net shortwave radiation minus surface net longwave radiation), surface temperature, total precipitation, potential evaporation, evaporation, total column water vapor from ERA5 data for the period 1979-2020, with a spatial resolution of 0.25° and a temporal resolution of months. This study utilizes ERA5 data with a spatial resolution of 0.25° and a temporal resolution of months for the period 1979-2020. The ERA5 data were provided by the Climate Data Store and are available from https://cds.climate.copernicus.eu/ (last accessed date is 29 January 2022).
The Moderate Resolution Imaging Spectroradiometer (MODIS) normalized difference vegetation index (NDVI) was used to assist the analysis of drought intensity. MODIS is a key instrument aboard the American National Aeronautics and Space Administration (NASA) Terra and Aqua satellites. The NDVI product is MODIS/Aqua Level 3 (Monthly) Vegetation Indexes for the period 2003–2020, with a spatial resolution of 0.05°. MODIS NDVI products are available from https://search.earthdata.nasa.gov/ (last accessed date is 29 January 2022).
The QA parameters of Himawari-8 Level 2 cloud product data from the Japan Aerospace Exploration Agency (JAXA) P-Tree system are used for the spatial distribution analysis of total cloud cover for the period 2003–2020, with a spatial resolution of 0.05° and a temporal resolution of 10 min [28]. Clear and probably clear conditions were defined as clear skies and probably cloudy and cloudy conditions were defined as clouds for the QA parameters. To match the spatial resolution of ERA5, we define the percentage of cloud pixels in 5 × 5 pixels as the total cloud cover. The cloud property products are available from https://www.eorc.jaxa.jp/ptree/index.html (last accessed date is 29 January 2022).

2.2. Study Area

The study areas include the whole MP and surrounding areas as shown in Figure 1. The latitude range is 37 °N to 53.5 °N, and the longitude range is 87.5 °E to 126 °E. Composed mainly of mountains and high-elevation plains, the MP is a complex terrain with elevations of 900–3000 m. The central and western parts of the MP are the most arid, with the annual mean of NDVI values less than 0.1.

2.3. Methods

The aridity index is normally defined as aridity index = potential evaporation/total precipitation [3,4]. The aridity index not only involves key parameters of the water cycle, but also potential evaporation related to energy cycle parameters, air temperature, soil heat flux density, slope vapor pressure curve, slope vapor pressure curve, radiation and wind speed [19]. We calculated the annual mean aridity index and determined the drought conditions of the region according to the value range: humid (aridity index < 1.00), subhumid (1.00 ≤ Aridity index < 1.50), semiarid (1.50 ≤ Aridity index < 4.00) and arid (Aridity index ≥ 4.00) [4].
The interaction of key energy and water cycle parameters is studied using the Pearson correlation coefficient. As shown in Equation (1), the monthly mean pixel values of ERA5′s parameters are extracted as x i and y i .The total number of data points is n. The x ¯ and y ¯ are the mean values of the energy or water cycle parameters. r is the correlation coefficient of key paramters.
r = i = 1 n x i x ¯ y i y ¯ i = 1 n x i x ¯ 2 i = 1 n y i y ¯ 2
Equation (2) is potential evaporation that is calculated using the Penman–Monteith algorithm [29]. This algorithm represents the combined effects of surface net radiation (Rn), temperature (T), soil heat flux density (G), slope vapor pressure curve ( Δ ), psychrometric constant ( γ ), wind speed (u), saturation vapor pressure ( e s ) and actual vapor pressure ( e a ). In this paper, potential evaporation is derived by the ERA5 potential evaporation product.
potential   evaporation = 0.408 Δ R n Δ G + γ 900 T + 273 u e s e a Δ + γ 1 + 0.34 u 2

3. Results and Discussion

3.1. Spatiotemporal Variation Characteristics of Drought

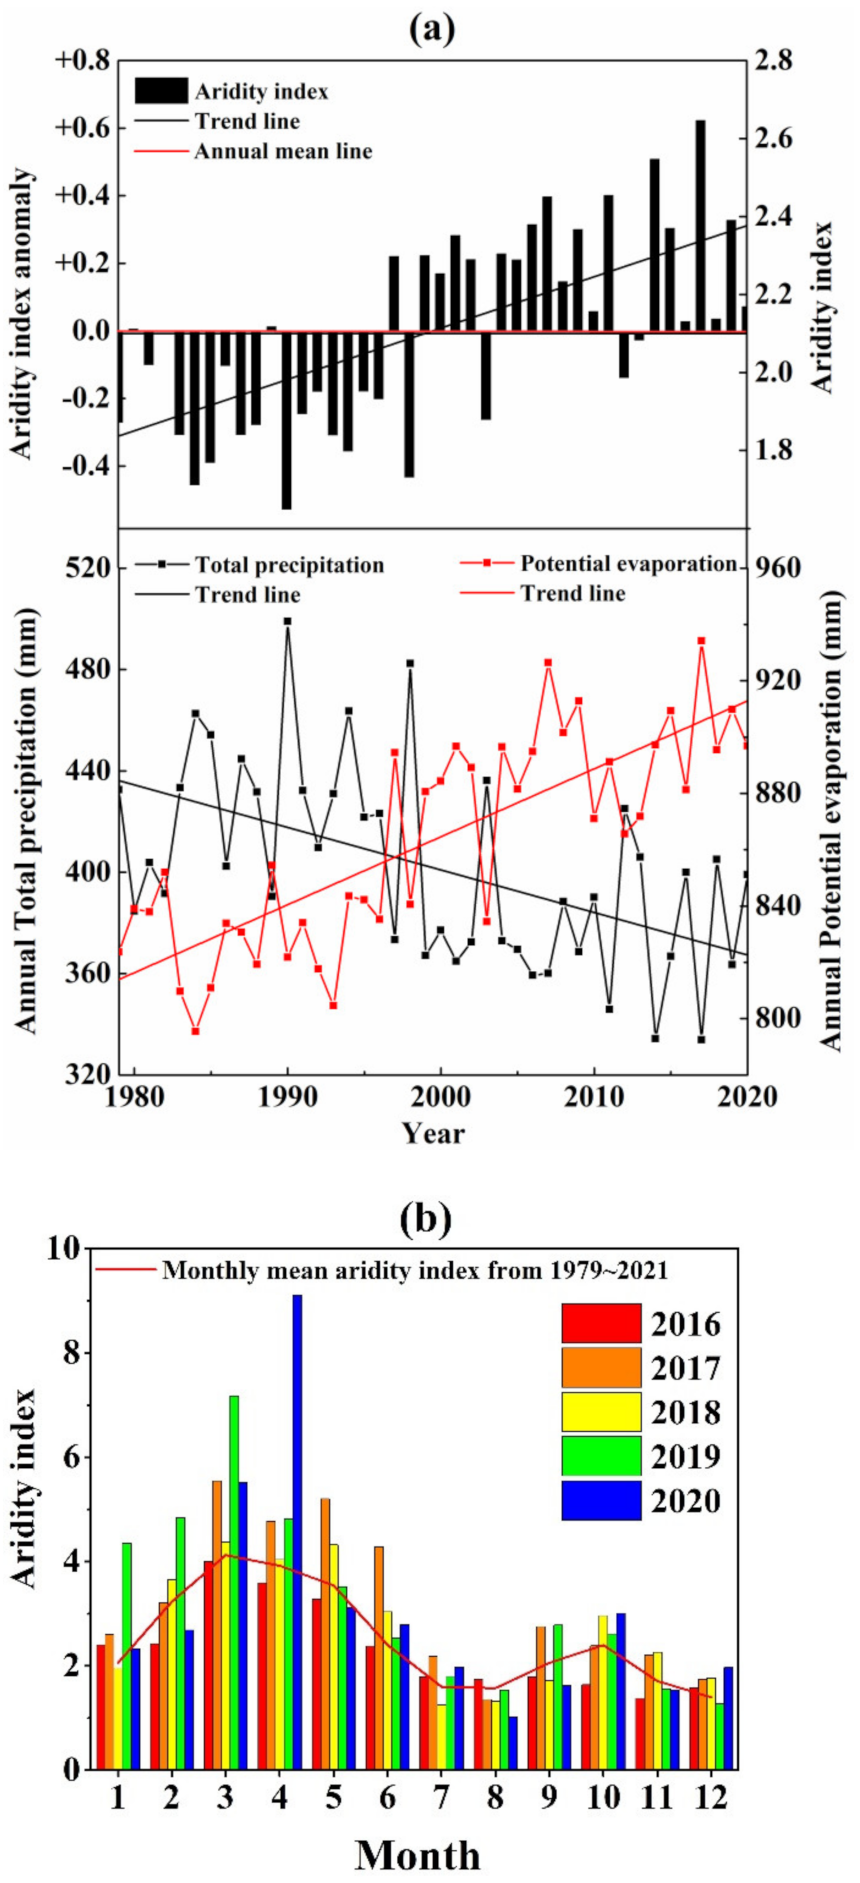
We used the linear regression method to calculate trends. Figure 2a shows that the annual potential evaporation had an increasing trend (0.72% per year), and the total precipitation decreased (0.16% per year) significantly during the period 1979–2020 over the MP. The annual mean of aridity index increased by 0.73% per year (through the 0.05 level of significance test). The switch point of the annual mean aridity index was around the 1999. The 21st century drying has lasted for approximately 20 years, posing serious threats to ecosystems and societies. As the temperature rises, potential evaporation shows an increasing trend (through the 0.05 level of significance test) and becomes an increasingly important factor in the severity of drought.
Figure 2b shows the two most severe periods of drought during the period 2016–2020. As shown in Figure 2a, we found that drought was the most severe during the periods 2016–2020. Drought mainly occurred from January to April. The aridity index was above an average of 40%, and the drought conditions presented a fluctuating trend. It presented a significant trend of drought.
The spatial distribution characteristics of the spring aridity index during the period 2016–2020 are shown in Figure 3. The drought area in 2020 was the largest. In the northern part of Chinese Gansu Province and the western part of Inner Mongolia Province, the southern part of Mongolia’s Omnogovi and Ovorkhangai Provinces, there were the worst drought (aridity index > 12). Areas with aridity index exceeding 12 accounted for 21.46%, 20.18%, 17.98%, 29.85% and 32.14% over the MP during the period of 2016–2020. Compared with the average during the 1979–2020 period (15.33%), the drought regions increased by 2.65–16.81%.

3.2. Spatiotemporal Variation Characteristics of Key Energy and Water Cycle Parameters

3.2.1. Energy Cycle Key Parameters

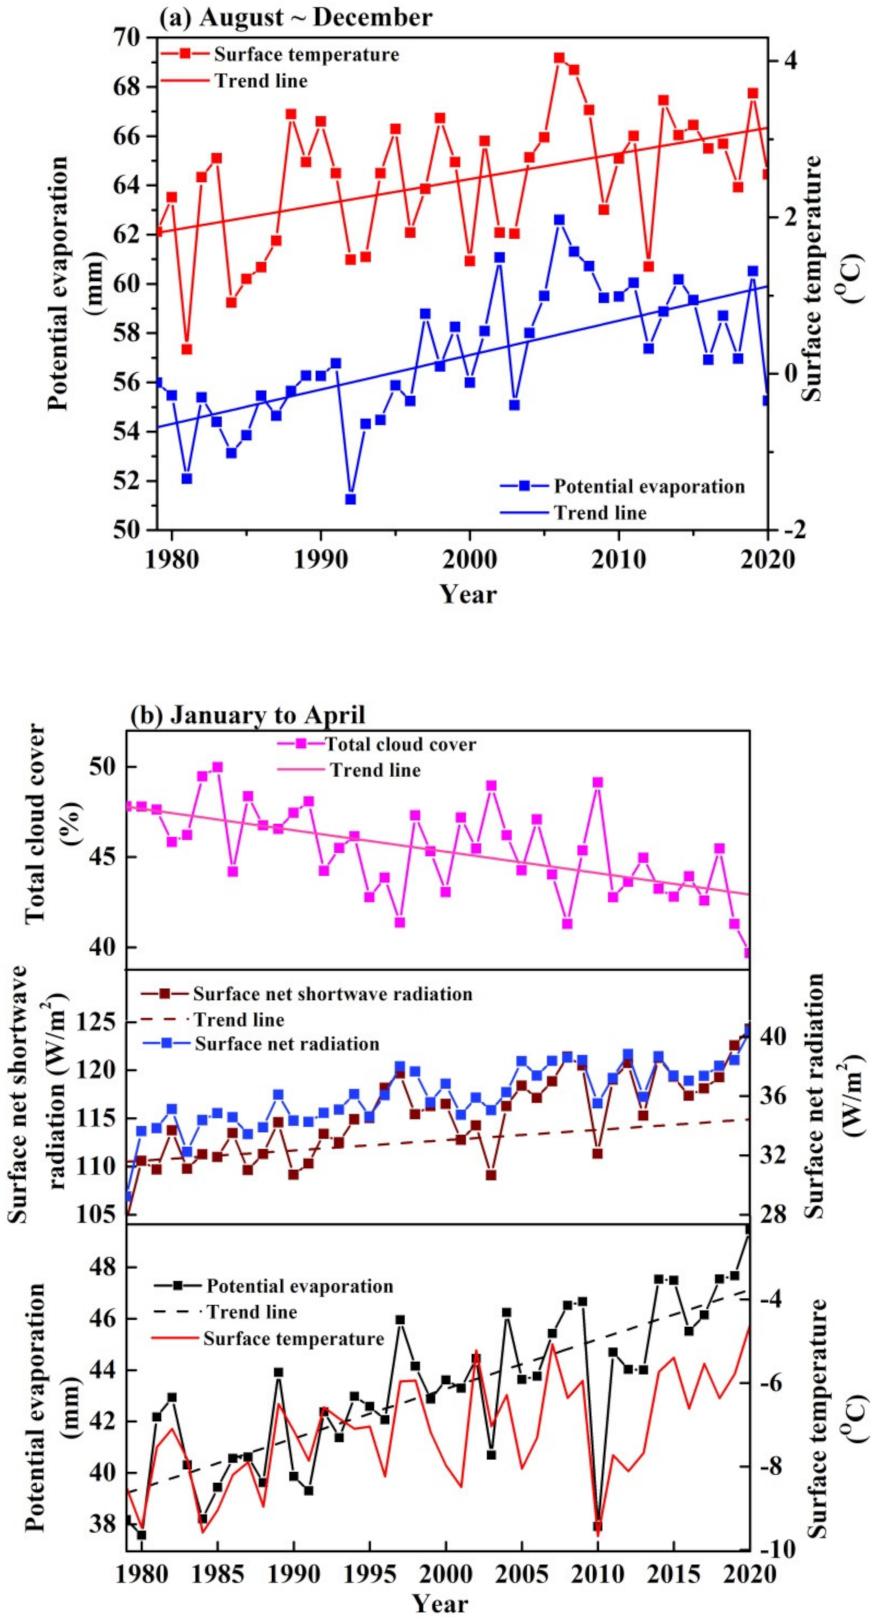
As shown in Figure 4a, the surface temperature continued to increase (1.67% per year) during the period of August–December, and the potential evaporation had a similar curve (0.26% per year) during the period of 2016–2020. As shown in Figure 4b, the total cloud cover decreased during the period January–April (0.25% per year), resulting in increased surface net radiation. The potential evaporation continued to rise, mainly due to the increase in surface temperature (0.67% per year) and surface net radiation (0.42% per year). The results show that there is less monthly mean total cloud cover (<50%) in the spring over MP, and previous studies have shown that the cloud radiative forcing effect on solar radiation is reduced over MP [30]. The lower NDVI and high altitude (>2000 m) in the central and western regions of the study region resulted in the higher surface net shortwave radiation in this region, which in turn resulted in the rise of surface temperature and comprehensively promoted the increase of potential evaporation.
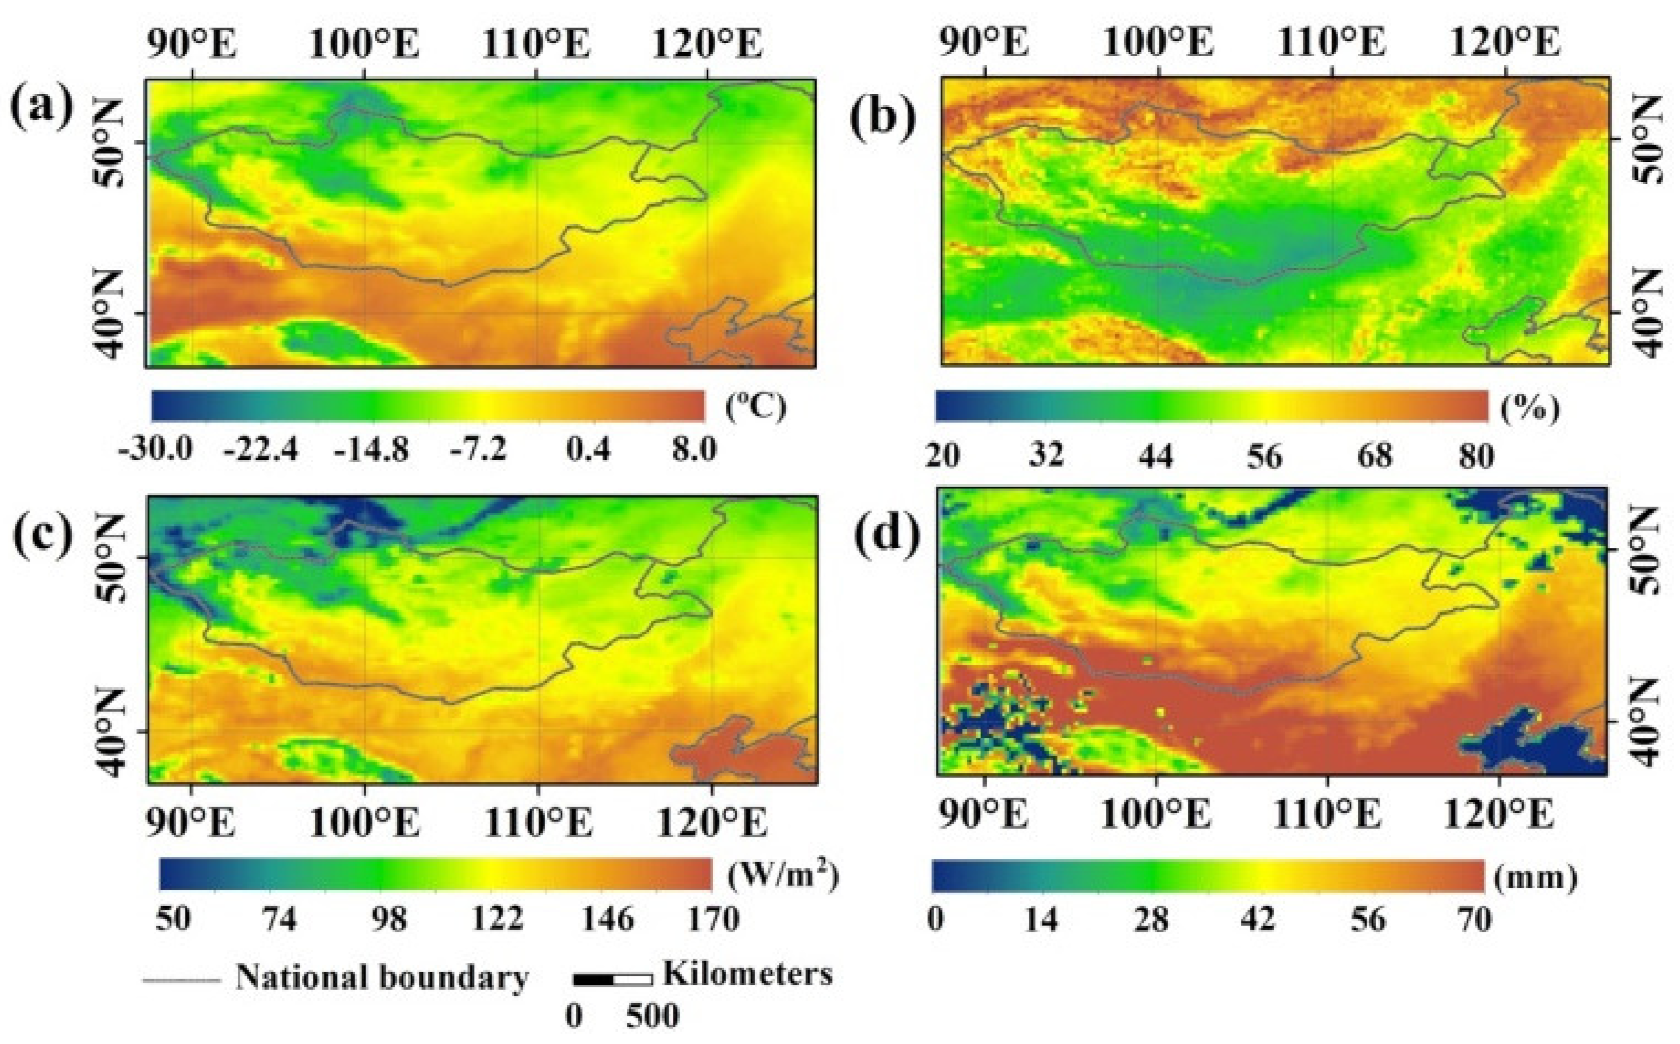
As shown in Figure 5, we found that the monthly mean potential evaporation was higher (>70 mm) in the central and western regions than in the north and southwest (<30 mm) in January–April during the period of 2016–2020. We analyzed the reasons for the high potential evaporation. First, the monthly mean total cloud cover was <40% in the central and western regions, while in the north and southwest regions it was >70%. Because the high altitude (>2000 meters) makes it difficult to input southeast ocean water vapor and NDVI is <0.1, the above factors make it difficult to form clouds in the central and western regions of the MP. Second, studies have shown that cloud radiative forcing over the MP is a cooling effect. Low total cloud cover in the central and western regions is correlated with high surface net radiation [1,30]. Therefore, due to low cloud cover, low latitude (<45° N) and low NDVI (<0.1), the monthly mean surface net radiation was >140 W/m2 in the central and western regions, while that in the north and southwest regions it was <100 W/m2. These causes can lead to higher surface temperatures (>8 °C), which in combination contribute to higher potential evaporation than in the central and western regions over MP.

3.2.2. Water Cycle Key Parameters

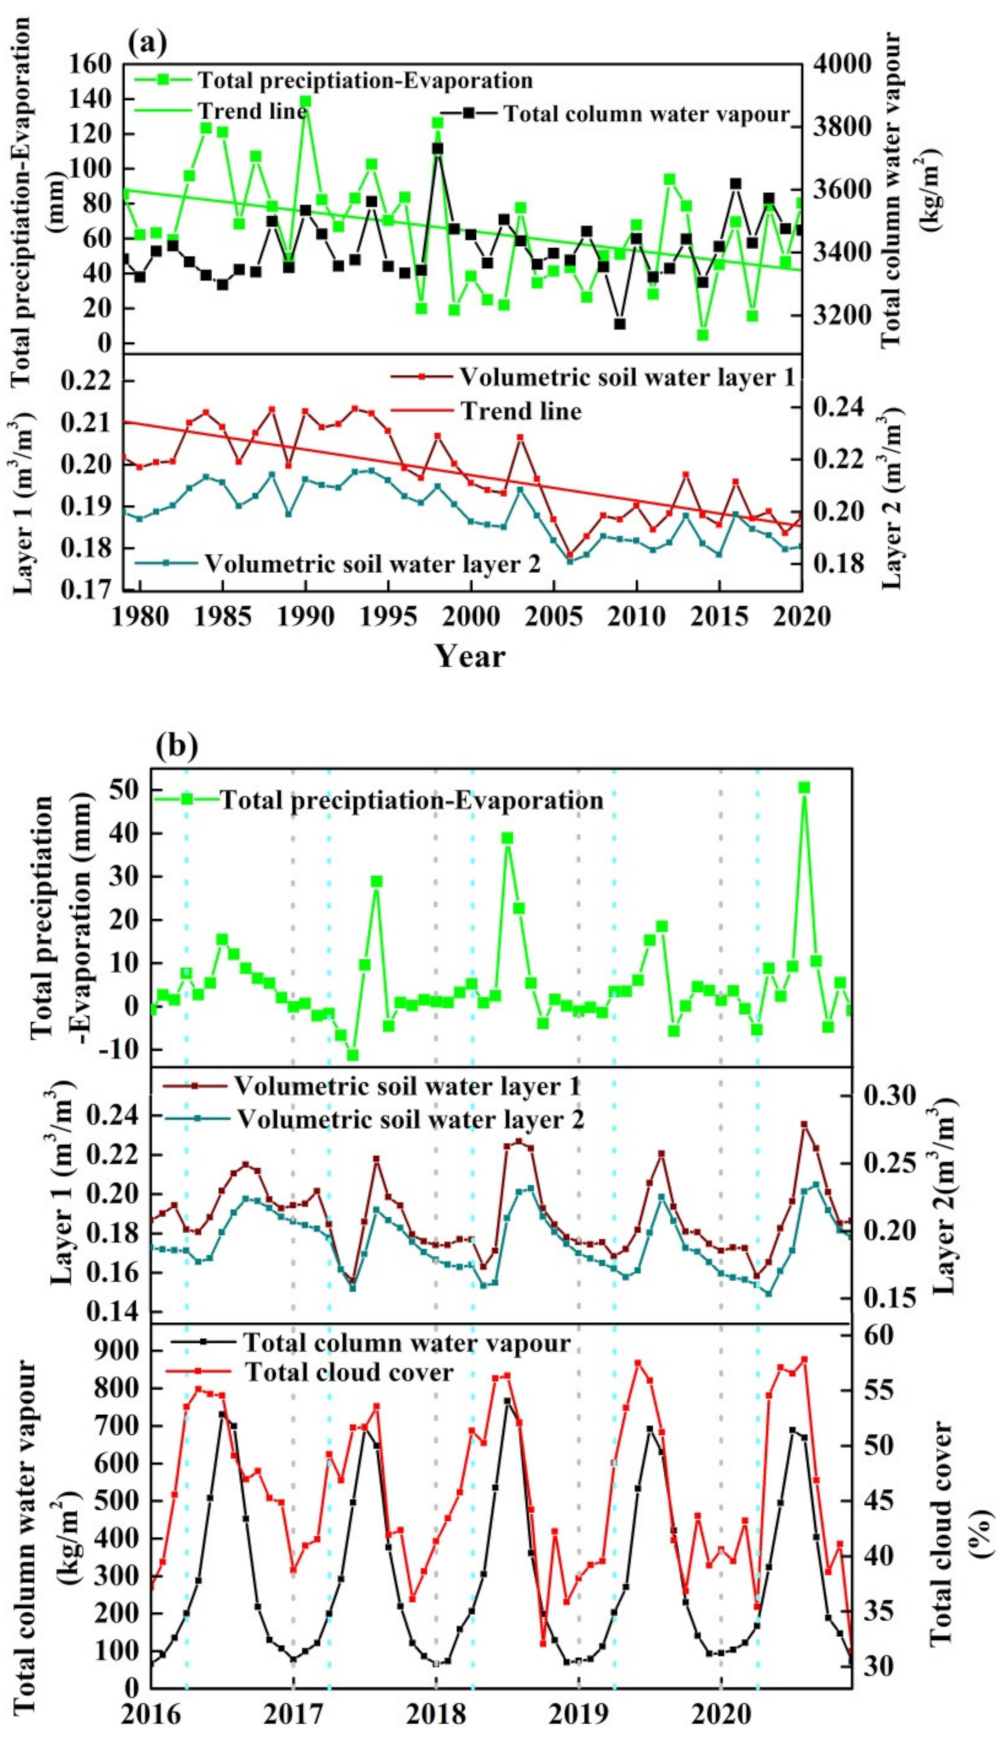
As shown in Figure 6a, the annual volumetric soil water decreased during the period 1979–2020 (decreased by 9.52% during the period 1979–2020). Its variation trend is consistent with the difference between total precipitation and evaporation (decreased by 25% during the period 1979–2020, through the 0.05 level of significance test). We found that the peak and trough of total column water vapor were consistent, but there was no obvious trend. As shown in Figure 6b, volumetric soil water in spring was lower than that in August to December of the last year. This reduced total column water vapor, which in turn reduced total cloud cover during the period of January to April. However, we also found that deep soil water content did not show a downwards trend, indicating that shallow soil water content has an impact on drought. The variation trend is consistent with the difference between total precipitation and evaporation. In particular, the annual volumetric soil water in 2019 decreased by 0.06 compared with that in 2018. The changes in volumetric soil water, total cloud cover, total precipitation and NDVI were significantly consistent, which highlights that the clouds in the MP are mainly formed by local vegetation evapotranspiration.
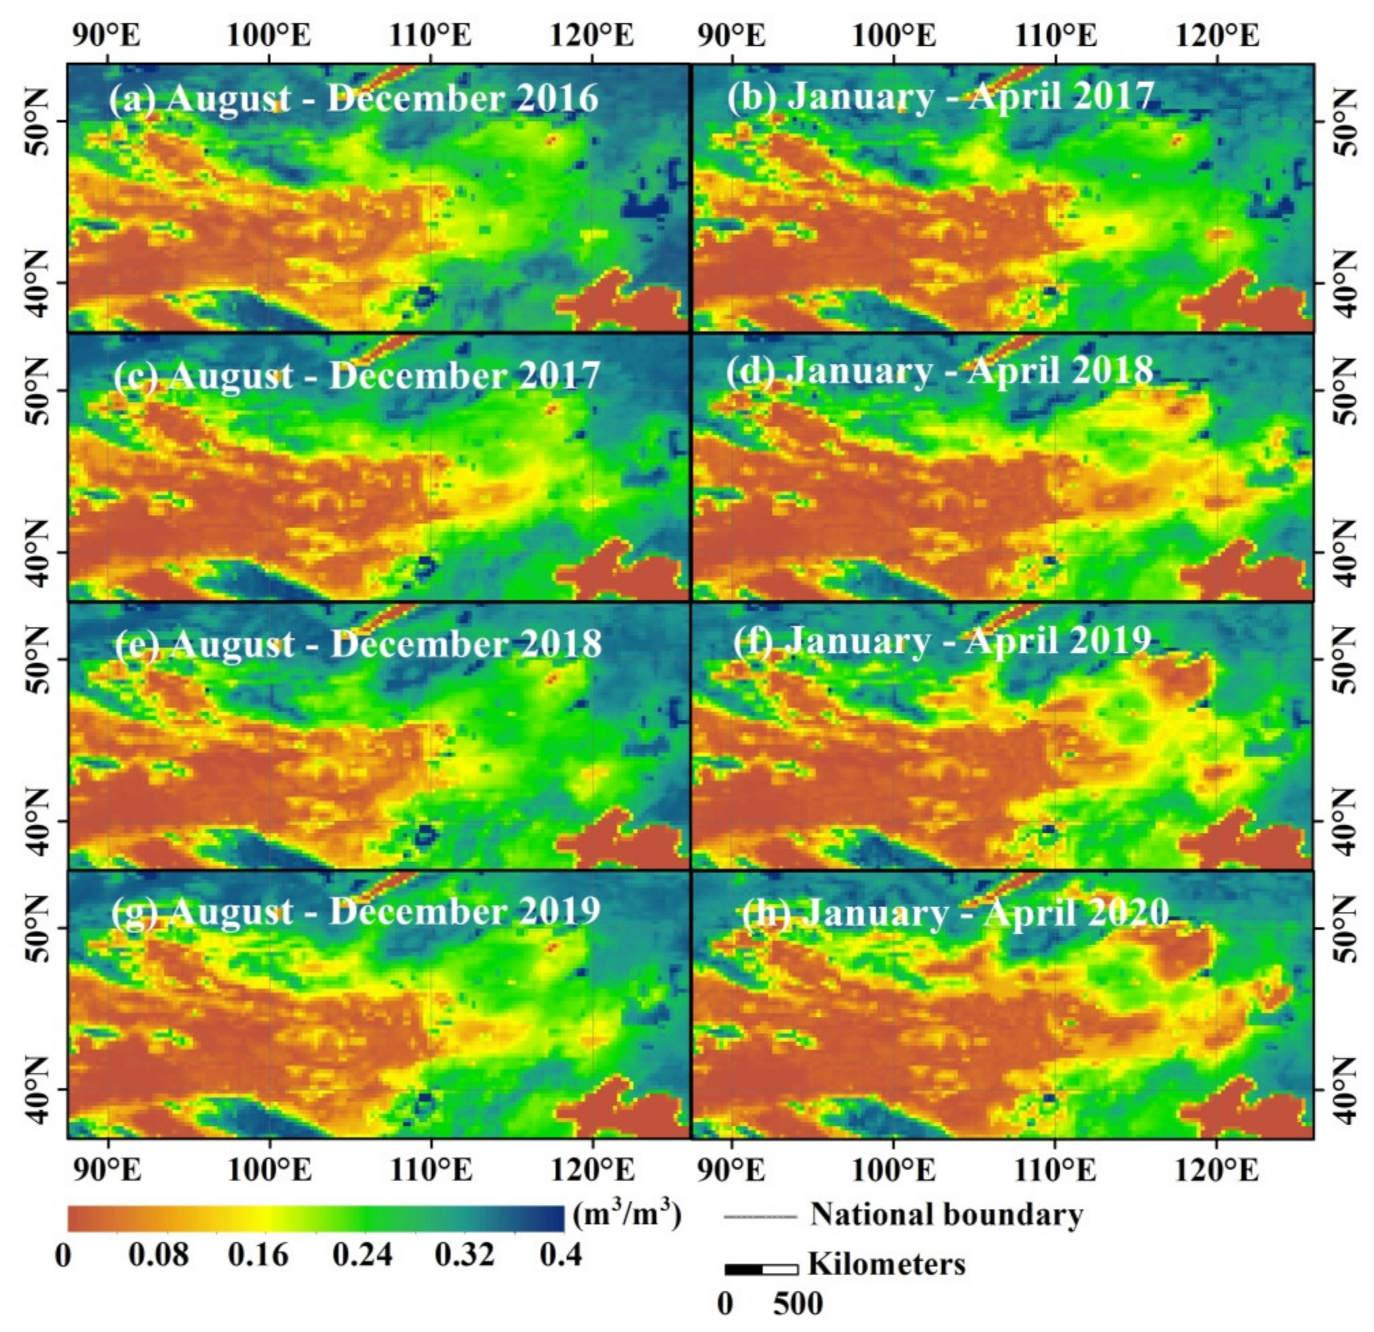
As shown in Figure 7, we found that the low volumetric soil water during the period August to December of the last year affected the volumetric soil water in the next spring year. In the central and western regions over MP, volumetric soil water layers one and two were low from 2019 to spring 2020, and NDVI was low, leading to low total column cloud water and further low total precipitation. The total precipitation was less than 6 mm in the central and western regions over the MP. The 85.20% area of the total precipitation was <12 mm. Low total precipitation is directly related to total column cloud water. Total column cloud water is significantly consistent with the spatial distribution of total precipitation. In addition to the clouds transported, the formation of local clouds is related to volumetric soil water. In the central and western regions, NDVI is low, and volumetric soil water is low, so it is difficult to form clouds.

3.2.3. The Interaction of Energy and Water Cycle Parameters

As shown in Figure 8, we investigated the interrelationship between key parameters of the energy and water cycle. As shown in Figure 8a, there is a significant negative correlation between total precipitation and potential evaporation over the MP. The correlation coefficient of the western part is close to 0. It is speculated that the reason is that there is little precipitation in desert areas. As shown in Figure 8b, we found a significant positive correlation between total precipitation evaporation and volumetric soil water (volumetric soil water layer one + volumetric soil water layer two) in the northern and eastern parts of the research area. These are subhumid and humid areas with high shallow volumetric soil water. This highlights that shallow volumetric soil water is mainly affected by precipitation–evaporation differences. Figure 8c shows a significant negative correlation between total cloud cover and potential evaporation, indicating that the decrease in total cloud cover will promote the increase in potential evaporation over MP. Figure 8g shows a significant correlation between surface net radiation and potential evaporation, and this result proves the correctness of Equation (2).
As shown in Figure 8d–f, we studied the relationship between surface temperature and potential evaporation and evaporation for the evaporation paradox. We found that there was a positive correlation (r > 0.5) between surface temperature and evaporation, especially in humid, subhumid and partially semiarid regions over MP (r > 0.9). There is a significant positive correlation between land surface temperature and potential evaporation (r > 0.8), especially in arid and semiarid regions (r > 0.92). There is a significant positive correlation (r > 0.8) between surface temperature and total precipitation in humid and subhumid regions over MP. Therefore, we believe that the reason for this difference is that evaporation is more influenced by local total precipitation. Areas with high surface temperatures have high evaporation. Potential evaporation is influenced by surface net radiation and surface temperature.
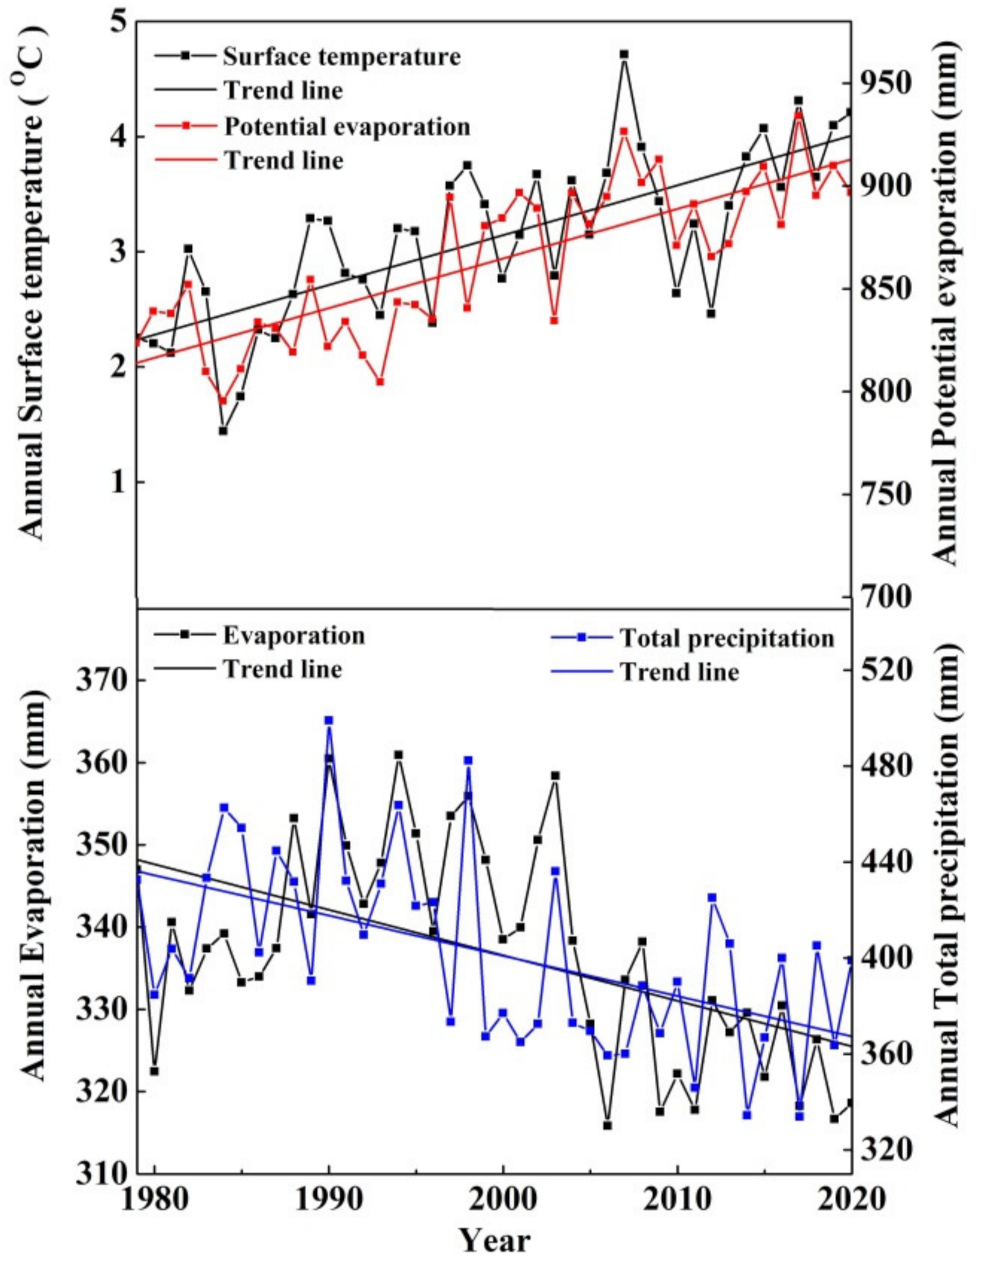
As shown in Figure 9, to study the evaporation paradox we investigated the temporal distribution of the surface temperature, potential evaporation, total precipitation and evaporation. We found that surface temperature and potential evaporation had an increasing trend over the MP and surrounding areas during the period of 1979–2020. However, evaporation and total precipitation changed in a consistent trend of reduction. Therefore, combined with the results in Figure 8, we think the change in evaporation is related to the way it is measured. The change in total precipitation will affect the change in evaporation. High surface temperature will lead to increased evaporation and potential evaporation.

4. Conclusions

Drought increased significantly (0.73% per year) during the period of 1979–2020, and the drought was severe after 1999 over the MP. The drought was most severe from January to April during the period of 2016–2020. The arid areas had an NDVI < 0.1 and volumetric soil water <0.16 m3/m3 in January to April during the period 2016–2020. The potential evaporation had an increasing trend (0.72% per year), and the total precipitation decreased (0.16% per year).
The direct cause of the drought from January to April may be closely related to the abnormal energy and water cycle parameters from August to December the previous year. From August to December, the surface temperature continued to increase (1.67% per year) during the period 2016–2020, contributing to 0.26% per year increase in potential evaporation. At the same time, the volumetric soil water decreased from August to December due to the decrease in total precipitation. The results show that the parameters of the downward trend include total cloud cover and total precipitation. The parameters of increasing trend include surface temperature, surface net radiation and potential evaporation from January to April. We hypothesize that the changes in these parameters may be the cause of the drought. We found that the peak and trough of total column water vapor were consistent with the difference between total precipitation and evaporation, but there was no obvious trend. This indicates that the increase of evaporation and the decrease of total precipitation may be related to the balance trend of total column water vapor.
Difficult-to-form clouds are likely related to low volumetric soil water, resulting in increased surface net radiation and decreased total precipitation. Global warming increases surface temperatures. These factors contribute to the growth of potential evaporation. For the evaporation paradox, the measurement of evaporation is influenced by local total precipitation. High surface temperature will lead to increased evaporation and potential evaporation.
There are several studies that support our results. The results show that there is a significant correlation between the reduction in surface net radiation and drought, and the surface net radiation is low in arid areas due to the low surface vegetation cover. This result is because a reduction in surface net radiation leads to a reduction in air pressure and evapotranspiration, which in turn reduces water vapor transport in the surrounding area [31,32]. Clouds can reduce surface net radiation flux through cloud radiative forcing [2]. The current study shows that the total cloud cover in China has decreased by 0.88% per decade; in contrast, the total cloud cover over the MP and surrounding areas has dropped by 2.04% per decade [33]. In our study, the decrease in cloud cover was the result of an increase in surface net radiation. This paper studies the influence of energy and water cycle parameters on drought, and the conclusion is helpful for disaster prevention and mitigation over the MP and surrounding areas.
The effects of energy and water cycle parameters on drought were studied, and the conclusion is helpful for drought prevention over the MP and surrounding areas. However, we did not combine wind, atmospheric circulation or other comprehensive factors to study drought over the MP and surrounding areas, so this combination will be addressed in our future research work.

Author Contributions

Conceptualization, H.L., J.H., Y.L. and Y.Z.; original draft preparation, J.H.; editing, J.H., E.G., S.B.; review H.L., Y.L., E.G., S.B., Y.Z., G.T., Y.B. All authors have read and agreed to the published version of the manuscript.

Funding

This research was supported by the National Natural Science Foundation of China under Grants 41905023, 41961058 and 41771395.

Institutional Review Board Statement

Not applicable.

Informed Consent Statement

Not applicable.

Data Availability Statement

The European Centre for Medium Range Weather Forecasting (ECMWF) ERA5 data presented in this study are openly available at (https://cds.climate.copernicus.eu/cdsapp#!/dataset/10.24381/cds.f17050d7?tab=form, last accessed date is 29 January 2022) at (DOI: 10.24381/cds.f17050d7). The NASA Moderate Resolution Imaging Spectroradiometer (MODIS) data presented in this study are openly available in (https://ladsweb.nascom.nasa.gov/, last accessed date is 29 January 2022). The Japan Aerospace Exploration Agency (JAXA) Himawari 8 data presented in this study are openly available at (https://www.eorc.jaxa.jp/ptree/index.html, last accessed date is 29 January 2022).

Acknowledgments

The authors are very grateful to the European Centre for Medium Range Weather Forecasting (ECMWF) ERA5 for making the data available and providing elaborate documentation of the algorithms. We thank the Japan Aerospace Exploration Agency (JAXA) Himawari 8 satellite and NASA Moderate Resolution Imaging Spectroradiometer (MODIS) projects for making the datasets available.

Conflicts of Interest

The authors declare no conflict of interest.

References

  1. Bao, S.; Letu, H.; Zhao, J.; Lei, Y.; Zhao, C.; Li, J.; Tana, G.; Liu, C.; Guo, E.; Zhang, J.; et al. Spatiotemporal distributions of cloud radiative forcing and response to cloud parameters over the Mongolian Plateau during 2003–2017. Int. J. Clim. 2020, 40, 4082–4101. [Google Scholar] [CrossRef]
  2. Allen, R.G.; Pereira, L.S.; Raes, D.; Smith, M. Crop Evapotranspiration—Guidelines for Computing Crop Water Requirements—FAO Irrigation and Drainage Paper 56; FAO: Rome, Italy, 1998; ISBN 92-5-104219-5. [Google Scholar]
  3. Wu, S.; Yin, Y.; Zheng, D.; Yang, Q. Moisture conditions and climate trends in China during the period 1971–2000. Int. J. Clim. 2006, 26, 193–206. [Google Scholar] [CrossRef]
  4. Weerts, A.; Winsemius, H.; Dutra, E.; Beckers, J.; Brolsma, R.J.; Van Beek, L.P.H.; Pappenberger, F.; Westerhoff, R.; Bierkens, M.F.P. Seasonal Predictability of Water Scarcity at the Global Scale. Geophys. Res. Abstr. 2013, 15, EGU2013-6060. [Google Scholar]
  5. Ma, Z.G.; Huang, G.G.; Gan, W.G.; Chen, M. Multiscale temporal characteristics of the dryness/wetness over northern China during the last century. China J. Atmos. Sci. 2005, 29, 671–681. [Google Scholar]
  6. Jin, L.; Zhang, J.; Wang, R.; Bao, Y.; Guo, E. Analysis for Spatio-Temporal Variation Characteristics of Droughts in Different Climatic Regions of the Mongolian Plateau Based on SPEI. Sustainability 2019, 11, 5767. [Google Scholar] [CrossRef] [Green Version]
  7. Li, C.; Filho, W.L.; Yin, J.; Hu, R.; Wang, J.; Yang, C.; Yin, S.; Bao, Y.; Ayal, D.Y. Assessing vegetation response to multi-time-scale drought across inner Mongolia plateau. J. Clean. Prod. 2018, 179, 210–216. [Google Scholar] [CrossRef]
  8. Bao, G.; Liu, Y.; Liu, N.; Linderholm, H. Drought variability in eastern Mongolian Plateau and its linkages to the large-scale climate forcing. Clim. Dyn. 2015, 44, 717–733. [Google Scholar] [CrossRef]
  9. Hessl, A.E.; Anchukaitis, K.J.; Jelsema, C.; Cook, B.; Byambasuren, O.; Leland, C.; Nachin, B.; Pederson, N.; Tian, H.; Hayles, L.A. Past and future drought in Mongolia. Sci. Adv. 2018, 4, e1701832. [Google Scholar] [CrossRef] [Green Version]
  10. Tong, S.; Lai, Q.; Zhang, J.; Bao, Y.; Lusi, A.; Ma, Q.; Li, X.; Zhang, F. Spatiotemporal drought variability on the Mongolian Plateau from 1980–2014 based on the SPEI-PM, intensity analysis and Hurst exponent. Sci. Total Environ. 2018, 615, 1557–1565. [Google Scholar] [CrossRef]
  11. Gao, T.; Si, Y.; Yu, X.; Wulan; Yang, P.; Gao, J. A seasonal forecast scheme for the Inner Mongolia spring drought. Arch. Meteorol. Geophys. Bioclimatol. B 2018, 135, 519–532. [Google Scholar] [CrossRef]
  12. Pedram, S.; Wang, X.; Liu, T.; Duan, L. Simulated dynamics of soil water and pore vapor in a semiarid sandy ecosystem. J. Arid Environ. 2018, 151, 58–82. [Google Scholar] [CrossRef] [Green Version]
  13. Cao, X.; Feng, Y.; Wang, J. Remote sensing monitoring the spatio-temporal changes of aridification in the Mongolian Plateau based on the general Ts-NDVI space, 1981–2012. J. Earth Syst. Sci. 2017, 126, 58. [Google Scholar] [CrossRef]
  14. Bremer, D.J.; Auen, L.M.; Ham, J.M.; Owensby, C.E. Evapotranspiration in a Prairie Ecosystem. Agron. J. 2001, 93, 338–348. [Google Scholar] [CrossRef] [Green Version]
  15. Zhu, L.; Cooper, D.J.; Han, S.; Zhu, L.; Cooper, D.J.; Han, S.; Yang, J.; Zhang, Y.; Li, Z.; Zhao, H.; et al. Influence of the Atlantic Multidecadal Oscillation on drought in northern Daxing’an Mountains, Northeast China. Catena 2021, 198, 105017. [Google Scholar] [CrossRef]
  16. Hu, Y.; Wen, J.; Ma, Y.; Huang, Y.; Xu, J. Research on the Relationship Between the Spatial and Temporal Variation of Greenup and Precipitation in Mongolian Plateau. In Proceedings of the 2018 7th International Conference on Agro-Geoinformatics (Agro-Geoinformatics), Hangzhou, China, 6–9 August 2018; pp. 1–5. [Google Scholar]
  17. Nandintsetseg, B.; Boldgiv, B.J.; Chang, J.; Ciais, P.; Davaanyam, E.; Batbold, A.; Bat-Oyun, T.; Stenseth, N.C. Risk and vulnerability of Mongolian grasslands under climate change. Environ. Res. Lett. 2021, 16, 034035. [Google Scholar] [CrossRef]
  18. Dimitriadou, S.; Nikolakopoulos, K.G. Evapotranspiration Trends and Interactions in Light of the Anthropogenic Footprint and the Climate Crisis: A Review. Hydrology 2021, 8, 163. [Google Scholar] [CrossRef]
  19. Penman, H.L. Natural evaporation from open water, bare soil and grass. Proc. R. Soc. A 1948, 193, 120–145. [Google Scholar]
  20. Alley, W.M. The Palmer drought severity index: Limitations and assumptions. J. Appl. Meteorol. Climatol. 1984, 23, 1100–1109. [Google Scholar] [CrossRef] [Green Version]
  21. Vicente-Serrano, S.M.; Beguería, S.; López-Moreno, J.I. A Multiscalar Drought Index Sensitive to Global Warming: The Standardized Precipitation Evapotranspiration Index. J. Clim. 2010, 23, 1696–1718. [Google Scholar] [CrossRef] [Green Version]
  22. Bauer, P.; Lopez, P.; Moreau, E.; Chevallier, F.; Benedetti, A.; Bonazzola, M. The European Centre for Medium-Range Weather Forecasts Global Rainfall Data Assimilation Experimentation. In Measuring Precipitation from Space; Springer: Berlin/Heidelberg, Germany, 2007; pp. 447–457. [Google Scholar]
  23. Balsamo, G.; Albergel, C.; Beljaars, A.; Boussetta, S.; Brun, E.; Cloke, H.; Dee, D.; Dutra, E.; Muñoz-Sabater, J.; Pappenberger, F.; et al. ERA-Interim/Land: A global land surface reanalysis data set. Hydrol. Earth Syst. Sci. 2015, 19, 389–407. [Google Scholar] [CrossRef] [Green Version]
  24. Betts, A.K.; Hong, S.-Y.; Pan, H.-L. Comparison of NCEP-NCAR Reanalysis with 1987 FIFE Data. Mon. Weather Rev. 1996, 124, 1480–1498. [Google Scholar] [CrossRef] [Green Version]
  25. Young, D.T.; Perraut, S.; Roux, A.; de Villedary, C.; Gendrin, R.; Korth, A.; Kremser, G.; Jones, D. Wave-particle interactions near ΩHe+observed on GEOS 1 and 2 1. Propagation of ion cyclotron waves in He+-rich plasma. J. Geophys. Res. Earth Surf. 1981, 86, 6755–6772. [Google Scholar] [CrossRef]
  26. Molod, A.; Hackert, E.; Vikhliaev, Y.; Zhao, B.; Barahona, D.; Vernieres, G.; Borovikov, A.; Kovach, R.M.; Marshak, J.; Schubert, S.; et al. GEOS-S2S Version 2: The GMAO High-Resolution Coupled Model and Assimilation System for Seasonal Prediction. J. Geophys. Res. Atmos. 2020, 125, e2019JD031767. [Google Scholar] [CrossRef]
  27. Urraca, R.; Huld, T.; Gracia-Amillo, A.; Martínez-De-Pisón, F.; Kaspar, F.; Sanz-Garcia, A. Evaluation of global horizontal irradiance estimates from ERA5 and COSMO-REA6 reanalyses using ground and satellite-based data. Sol. Energy 2018, 164, 339–354. [Google Scholar] [CrossRef]
  28. Letu, H.; Nakajima, T.Y.; Wang, T.X.; Shang, H.Z.; Ma, R.; Yang, K.; Baran, A.J.; Riedi, J.; Ishimoto, H.; Yoshida, M.; et al. A new benchmark for surface radiation products over the East Asia-Pacific region retrieved from the Himawari-8/AHI next-generation geostationary satellite. Bull. Am. Meteorol. Soc. 2021, 16, 034035. [Google Scholar] [CrossRef]
  29. Bengtsson, L.; Hagemann, S.; Hodges, K.I. Can climate trends be calculated from reanalysis data? J. Geophys. Res. Earth Surf. 2004, 109, D11111. [Google Scholar] [CrossRef] [Green Version]
  30. Bao, S.; Letu, H.; Zhao, C.; Tana, G.; Shang, H.; Wang, T.; Lige, B.; Bao, Y.; Purevjav, G.; He, J.; et al. Spatiotemporal Distributions of Cloud Parameters and the Temperature Response Over the Mongolian Plateau During 2006–2015 Based on MODIS Data. IEEE J. Sel. Top. Appl. Earth Obs. Remote Sens. 2019, 12, 549–558. [Google Scholar] [CrossRef]
  31. Torres-Alavez, J. Quantifying the Relative Roles of Land Use Change and Remote Forcing on the 1930s Dust Bowl Drought. Ph.D. Thesis, The University of Nebraska, Lincoln, NE, USA, 2018. [Google Scholar]
  32. Yao, Y.; Liang, S.; Qin, Q.; Wang, K.; Zhao, S. Monitoring global land surface drought based on a hybrid evapotranspiration model. Int. J. Appl. Earth Obs. Geoinf. 2011, 13, 447–457. [Google Scholar] [CrossRef]
  33. Qian, Y.; Kaiser, D.P.; Leung, L.R.; Xu, M. More frequent cloud-free sky and less surface solar radiation in China from 1955 to 2000. Geophys. Res. Lett. 2006, 33, L01812. [Google Scholar] [CrossRef] [Green Version]
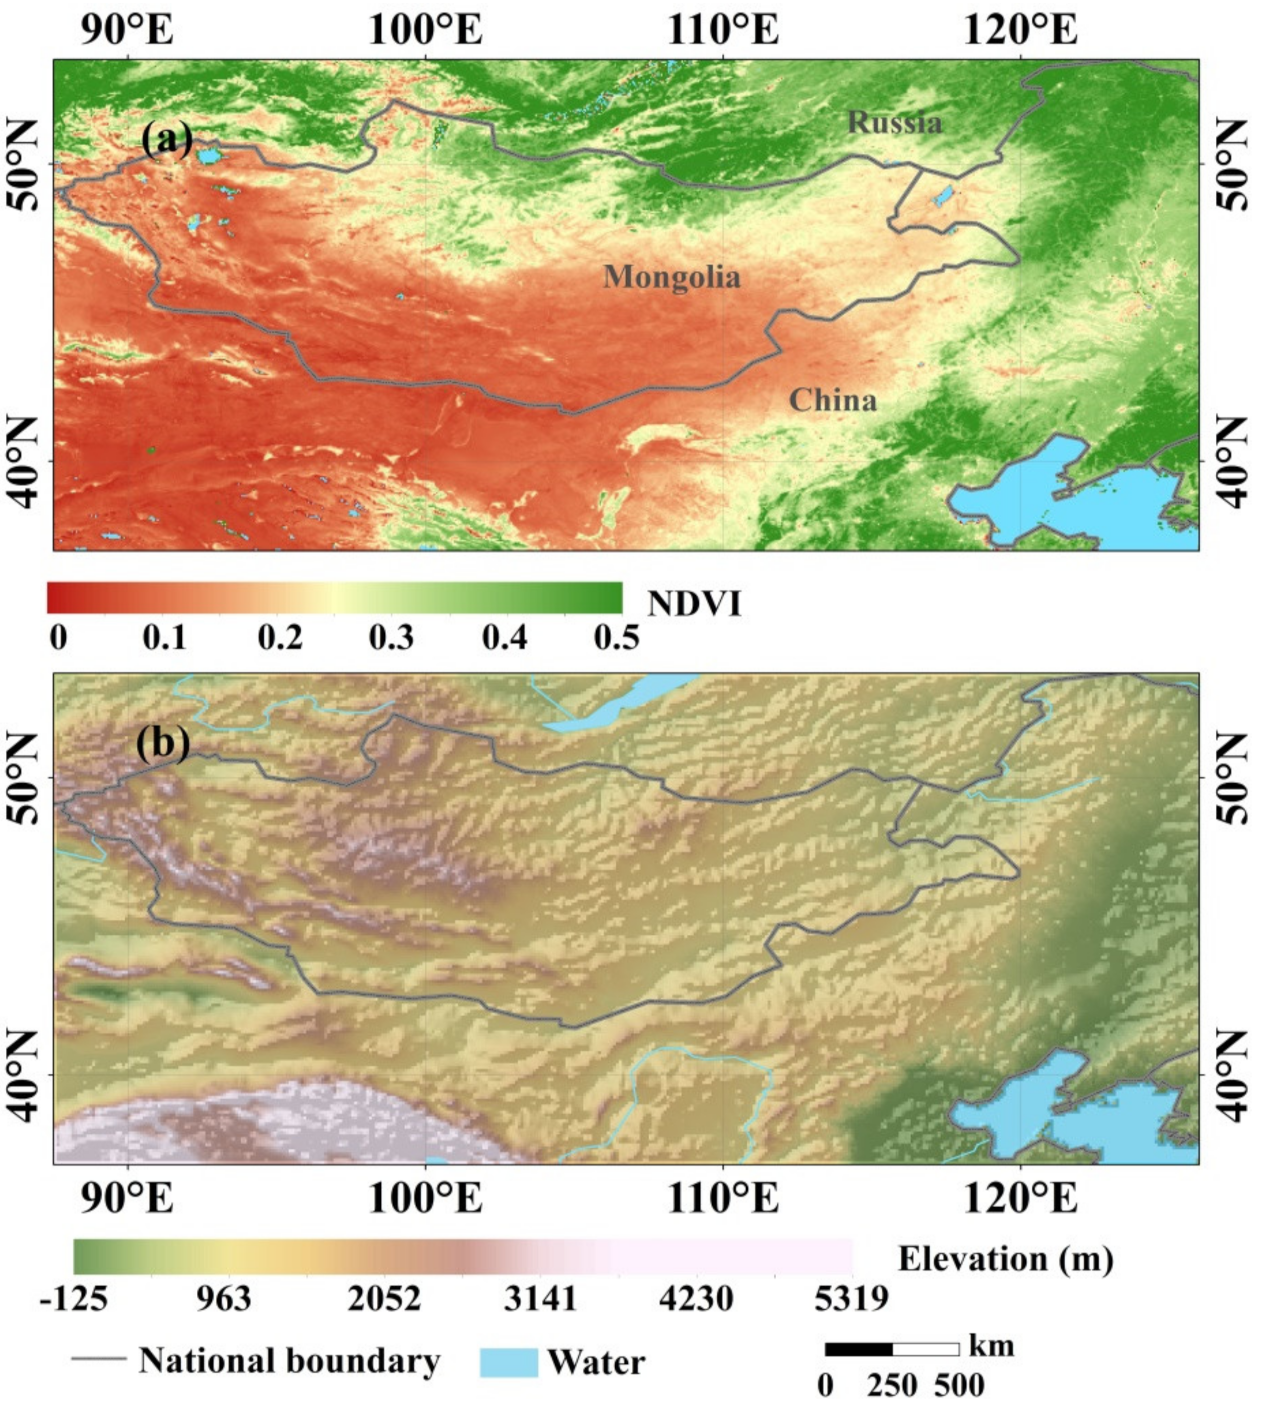
Figure 1. Overview of research area. (a) The annual MODIS normalized difference vegetation index (NDVI) during the period 2003–2020, (b) digital elevation map.
Remotesensing 14 00685 g001
Figure 2. Temporal distribution of the aridity index, potential evaporation and total precipitation over the MP and surrounding areas. We used the linear regression method to calculate trends. (a) Annual mean aridity index, potential evaporation and total precipitation during the 1979–2020 period. The aridity index is expressed as the ratio of potential evaporation and total precipitation. (b) Monthly mean aridity index during the period 2016–2020.
Remotesensing 14 00685 g002
Figure 3. Spatial distribution of the average January to April aridity index over the MP and surrounding areas during the period of 2016–2020. (a) 2016. (b) 2017. (c) 2018. (d) 2019. (e) 2020.
Remotesensing 14 00685 g003
Figure 4. Temporal distribution of key monthly mean energy cycle parameters during the period 2016–2020. We used the linear regression method to calculate trends. (a) August–December, (b) January–April.
Remotesensing 14 00685 g004
Figure 5. Spatial distribution of key monthly mean energy cycle parameters over the MP and surrounding areas in January–April of 2016–2020. (a) Monthly mean surface temperature. (b) Monthly mean Himawari 8 total cloud cover. (c) Monthly mean surface net shortwave radiation. (d) Monthly mean potential evaporation.
Remotesensing 14 00685 g005
Figure 6. Temporal distribution of key water cycle parameters. We used the linear regression method to calculate trends. (a) Annual average parameter change curve and trend. (b) Monthly average parameters change curve. The grey dotted line is January, and the blue dotted line is April.
Remotesensing 14 00685 g006
Figure 7. Spatial distribution of volumetric soil water parameters over the MP and surrounding areas during the period of 2016–2020. (a) Monthly mean from August to December 2016. (b) Monthly mean from January to April 2017. (c) Monthly mean from August to December 2017. (d) Monthly mean from January to April 2018. (e) Monthly mean from August to December 2018. (f) Monthly mean from January to April 2019. (g) Monthly mean from August to December 2019. (h) Monthly mean from January to April 2020.
Remotesensing 14 00685 g007
Figure 8. Annual mean correlation coefficient of key energy and water cycle parameters over the MP and surrounding areas during the 1979–2020 period. (a) Total precipitation and potential evaporation, (b) total precipitation evaporation and volumetric soil water, (c) total cloud cover and potential evaporation, (d) surface temperature and evaporation, (e) surface temperature and potential evaporation, (f) surface temperature and total precipitation, (g) surface net radiation and potential evaporation.
Remotesensing 14 00685 g008
Figure 9. Temporal distribution of the surface temperature, potential evaporation, total precipitation and evaporation over the MP and surrounding areas during the period of 1979–2020. We used the linear regression method to calculate trends.
Remotesensing 14 00685 g009
Publisher’s Note: MDPI stays neutral with regard to jurisdictional claims in published maps and institutional affiliations.