Abstract
A changing climate has been posing significant impacts on vegetation growth, especially in the Yellow River Basin (YRB) where agriculture and ecosystems are extremely vulnerable. In this study, the data for normalized difference vegetation index (NDVI) obtained from moderate-resolution imaging spectroradiometer (MODIS) sensors and climate data (precipitation and temperature) derived from the national meteorological stations were employed to examine the spatiotemporal differences in vegetation growth and its reaction to climate changes in the YRB from 2000–2019, using several sophisticated statistical methods. The results showed that both NDVI and climatic variables exhibited overall increasing trends during this period, and positive correlations at different significant levels were found between temperature/precipitation and NDVI. Furthermore, NDVI in spring had the strongest response to temperature/precipitation, and the correlation coefficient of NDVI with temperature and precipitation was 0.485 and 0.726, respectively. However, an opposite situation was detected in autumn (September to November) since NDVIs exhibited the weakest responses to temperatures/precipitation, and the NDVI’s correlation with both temperature and precipitation was 0.13. This indicated that, compared to other seasons, increasing the temperature and precipitation has the most significant effect on NDVI in spring (March to May). Except for a few places in the northern, southern, and southwestern regions of the YRB, NDVI was positively correlated with precipitation in most areas. There was an inverse relationship between NDVI and temperature in most parts of the central YRB, especially in summer (June to August) and growing season (May to September); however, there was a positive correlation in most areas of the YRB in spring. Finally, continuous attention must be given to the influence of other factors in the YRB.
1. Introduction
Vegetation growth has been deemed important for water balance, carbon cycling, and energy flow [1,2]. The normalized difference vegetation index (NDVI), strongly correlated with vegetation dynamics [3,4], has been frequently used as an indicator of variation in vegetation structure [5,6,7,8,9]. However, vegetation changes are constantly affected by climatic variables [10]. Furthermore, climate change predominantly affects vegetation by variations in precipitation and temperature, which can further influence the processes of photosynthesis, respiration, and the decomposition of soil organic carbon [11,12,13]. The two most significant climatic parameters that affect vegetation are precipitation and temperature [14]. Global surface average temperature has increased by about 1.0 °C compared with the baseline of 1850–1900, and it is expected to reach or exceed 1.5 °C in about twenty years, according to the Sixth Assessment Report of the Intergovernmental Panel on Climate Change (IPCC AR6) [15]. Research has revealed that the decrease in NDVI in summer during the 1997–2006 period in northern Eurasia was closely related to the significant decrease in precipitation [16]. Furthermore, the evident warming in spring after 2002 in Central Eurasia improved vegetation growth in this season, whereas vegetation growth during the growing season and summer mainly pertained to increased precipitation [17].
As one of the most important grain-producing regions in China, the Yellow River Basin (YRB) has been affected by the warming climate [18,19]. Therefore, investigating the changes in vegetation driven by climate factors is critical for determining the relationship between changes in vegetation cover and climate change in YRB, promoting regional ecological protection, and maintaining highly efficient development.
Previous studies have indicated that the use of long-term remotely sensed data is an efficient approach to study vegetation variations and atmospheric processes at different spatiotemporal scales [20]. For a number of years, remote sensing-derived NDVI, which is calculated by the red and near-infrared reflectance ratios, has been considered an indicator of vegetation cover [21]. Among all NDVI products, the moderate-resolution imaging spectroradiometer (MODIS) NDVI is the most widely used, owing to its high spatial and temporal resolution at the same time [22]. The MODIS NDVI product provides consistent data on global vegetation, which can be utilized to understand vegetation dynamics. Owing to its simplicity and ease of use, the MODIS NDVI is widely used in studies on hydrology, ecology, and biogeochemistry.
In this study, remotely sensed NDVI (MOD13A2) and climate data were utilized to examine the changes in NDVI and elucidate the relationships between these changes and temperature/precipitation in the YRB during 2000–2019. A four-season approach was used to understand seasonal variations in NDVI and climate factors: growing season (May through September), spring (March through May), summer (June through August), and autumn (September through October). This study examined spatiotemporal changes in vegetation cover in the YRB and investigated how temperature and precipitation affect it. We also assessed the relationships between precipitation, temperature, and NDVI. We will receive a better understanding of the effects of climate change on vegetation variations in the YRB as a result of this study, which will contribute to ecological research on the YRB under changing climate conditions.
2. Materials and Methods
2.1. Study Area
In terms of length, the Yellow River ranks second in China (5464 km), located between 32°10′–41°50′ N and 95°53′–119°05′ E and exhibits an area of 752,443 km2 (Figure 1). In an east–west direction, the YRB encompasses the Qinghai-Tibet Plateau, the Inner Mongolia Plateau, and the Huang-Huai Plain. The climate in the YRB is influenced by its complex topography and physiographic features, including wet and dry seasons [23]. Most areas in the YRB are semi-arid or arid and have chronically insufficient water resources, with mean annual precipitation of 470 mm [24]. The average annual temperature ranges from 14–24 °C [25]. YRB produces more than 14% of China’s grain harvest, using only 2% of the nation’s water resources [26]. Therefore, investigating the changes in the vegetation growth in the YRB and determining the influential factors are critical for understanding the role of climate change in this region.
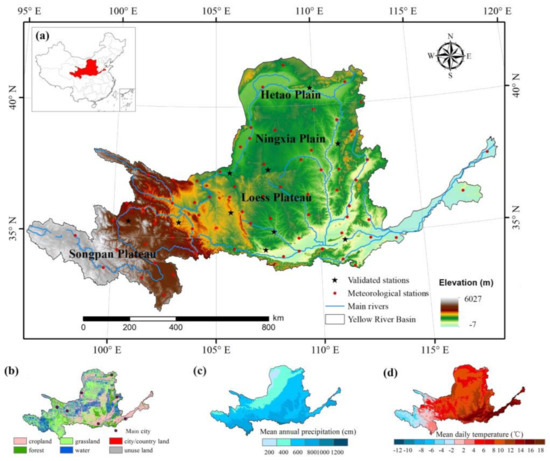
Figure 1.
Location of study area. (a) Altitude, meteorological stations, and main rivers in the Yellow River Basin (YRB). (b) Major land-use types in the YRB. (c) Multi-year mean daily temperatures in the YRB. (d) Multi-year mean annual precipitation in the YRB.
2.2. Data
2.2.1. Observations at Climate Stations
The National Meteorological Information Center of the China Meteorological Administration provided the daily precipitation and mean air temperatures for 93 weather stations. The dataset of climatic factors with a 1000 m grid resolution was produced based on meteorological station observations by using the ANUSPLINE interpolation algorithm [27]. The ANUSPLINE interpolation algorithm is a thin plate-smoothing spline algorithm, whereas the core algorithm is a partial plate smoothing spline algorithm.
As input, we used daily climatic data, a digital elevation model (DEM), which was derived from Shuttle Radar Topography Mission (SRTM, http://srtm.csi.cgiar.org, accessed on 28 January 2021), and the geographic coordinates of meteorological stations. All the station observations used have undergone strict quality control, including the extrema detection, internal consistency check, and spatial consistency check, before the interpolation operation. Stations with more than 10% missing records were considered invalid and excluded from the analysis. Inverse distance weighted interpolation was used to estimate missing data from valid stations to compensate for imbalanced distribution of climate stations [28]. Finally, the annual total precipitation and annual averaged temperature for different seasons were calculated for the 2000–2019 period.
2.2.2. NDVI Data
The MODIS NDVI dataset (MOD13A2) for the 2000–2019 period was compiled from NASA’s Earth Observing System (EOS), with a spatial resolution of 1000 m and a temporal resolution of 16 days. The MOD13A2 dataset contained two main vegetation layers. NDVI, denoted as the continuity index for the existing National Oceanic and Atmospheric Administration-Advanced Very High Resolution Radiometer (NOAA-AVHRR)-derived NDVI, was the first layer with effective values ranging from −2000 to 10,000 and the scale conversion coefficient of 0.0001. The dataset contained 23 NDVI observations per year, and the YRB spans five tiles in the MODIS images. The preprocessing of NDVI used in present study was complemented by MODIS Reprojection Tool (widely known as MRT).
The maximum value compositing approach, carried out in this study by using ENVI/IDL environment, was used for the NDVI study, which picks (at pixel scale) the highest observed value from a predetermined compositing period to represent the period of interest (i.e., growing season, spring, summer, or autumn). This was predicated on the presumption that low-value observations were either incorrect or had less abundant vegetation throughout the study period.
2.3. Methods
2.3.1. NDVI and Climatic Factors Trend Analysis
Climate factor and NDVI trends were examined from 2000 to 2019 using the least-squares approach to fit the slope at the pixel and basin scales [9], which can be obtained by Equations (1) and (2):
where y represents the NDVI (or climatic factor, e.g., precipitation and temperature) time series; x represents time changes during 2000–2019; a indicates the liner regressing intercept; b is the linear regressing line slope; ε denotes the error; n is the monitoring years (1–20); and Vi is the seasonal value of NDVI (or precipitation and temperature) of monitoring year i. When b > 0, the seasonal NDVI (precipitation or temperature) increased during the study period.
The significance level for NDVI and climatic variation was determined by the t-test. The formula is listed as Equation (3):
where n is the analysis period, ranging from 1 to 20 in this study; Vi is the seasonal value of year i (NDVI, precipitation, and temperature); and Sig is the regression slope. When Sig > 0, the seasonal NDVI, precipitation and temperature increased; otherwise, the seasonal NDVI, precipitation, and temperature decreased during the study period.
2.3.2. Mann–Kendall
There has been considerable use of the non-parametric Mann–Kendall (M–K) test for analyzing the factors that affect the trend and variation characteristics of meteorological time series [29,30]. Based on a given dataset, (), a new data series () can be calculated using Equations (4) and (5):
where and are quantities at times i and j, respectively, and n is the dataset length. If the time series are independent and random, the statistic can be obtained by Equations (6) and (7):
where and has an approximately normal distribution. The calculated values were compared with the standard normal distribution table with confidence levels α = 10%, 5%, and 1%. If , the trend was statistically significant. Otherwise, the trend was not statistically significant.
By reversing the order, the data series and the were also calculated, which can be expressed as Equation (8):
A positive value showed that the dataset increased, whereas a negative value indicated a decreasing trend. The intersection of and curves was the turning point that occurred at a certain confidence level. In this study, the M–K test results were computed and obtained by using Matlab language.
2.3.3. NDVI and Climate Variables Relationship
To analyze the correlations between precipitation/temperature and changes in NDVI, Pearson’s correlation coefficients need to be calculated by Equation (9):
where x and y denote NDVI and climatic factor (precipitation and temperature) time series; is the correlation coefficient between x and y; and and are mean x and y values, respectively.
Using a t-test, we evaluated the level of significance of the correlation coefficient t between NDVI and precipitation/temperature. It can be calculated by Equation (10):
where is the partial correlation coefficient; n is the sample size; and m is the number of independent variables. The critical value of the significance level was obtained from the t-table. If t ≥ ta, the results indicated a significant correlation; if t < ta, the correlation was not significant. Many studies have used the t-test to identify the NDVI and climatic parameters’ relationship [31,32]. To analyze the temporal changes in NDVI in response to climatic variations, partial correlations were also carried out.
In order to quantify the effect of each climate variable on NDVI, we conducted a multivariate linear regression analysis (MLR). We also determined the adjusted multiple coefficients of determination (adj-R2) associated with the total effects of the climate factors on NDVI. Each pixel’s adj-R2 value and its significance were calculated. Adj-R2 is a measure of the total amount of variation in the response variable (NDVI) that can be explained by the predictor variables (precipitation and temperature) [33]. The larger the adj-R2, the larger the percentage that governs the change in NDVI due to climate change [18]. Vegetation changes are influenced not only by climate factors but also by human activity. The residual value, which may be determined as the difference between the observed and anticipated NDVI values, can initially explain the impacts of human activities on vegetation change [34]. When the residual trend is negligible, the NDVI fluctuations can be explained only by climatic variables; otherwise, human activities can contribute to variations in the index.
In this study, both trend analysis and relationship results were carried out by using ENVI/IDL environment.
3. Results
3.1. Interpolation Quality Assessment
To determine the accuracy of the interpolated meteorological data, the sum of daily precipitation in a month (hereinafter referred to as monthly precipitation) and the average of daily mean temperature in a month (hereinafter referred to as monthly temperature) from verified climate stations (Figure 1) were compared to the interpolated values (Figure 2). There was a linear correlation between the interpolation results and the observed data from meteorological stations. The determination coefficient (R2) of the linear regression was 0.898 for the monthly precipitation data, with the significance level of 0.01 (p < 0.01) (Figure 2a). The observed and interpolated precipitation frequencies were consistent (Figure 2b). The temperature interpolation matched the observed value very well, with an R2 of 0.982 (p < 0.01), implying that the interpolated values can explain the spatiotemporal variability of 98% of the observed temperatures at the stations (Figure 2c,d).
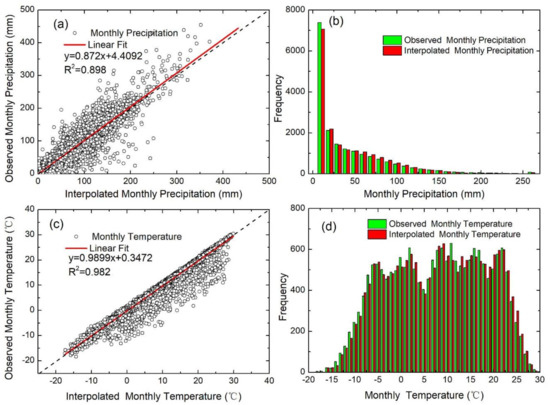
Figure 2.
Comparisons of (a) interpolated and observed precipitations and (c) interpolated and observed temperatures. Comparison of the frequency of (b) interpolated and observed precipitations and (d) interpolated and observed temperatures. Note: monthly precipitation means the sum of daily precipitation in a month; monthly temperature means the average of daily mean temperature in a month.
3.2. Spatial–Temporal Climate and Vegetation Variations
3.2.1. Climate and Vegetation Variations at the Basin Scale
At the YRB scale, the YRB tended to become warmer, wetter, and greener in different seasons during 2000–2019 (Figure 3). As shown in Figure 3a–d, temperature exhibited an increasing tendency at rates of 0.046 °C/yr in spring, 0.020 °C/yr in summer, 0.022 °C/yr in autumn, and 0.015 °C/yr in the growing season, but was not statistically significant at the level of 0.1 (p > 0.1) except in spring. In terms of precipitation (Figure 3e–h), there was a significantly increasing precipitation rate of 1.519 mm/yr (p < 0.05) in spring, while no significant increasing trend at rates of 1.884 mm/yr (p > 0.1) in summer, 0.253 mm/yr (p > 0.1) in autumn, and 2.210 mm/yr (p > 0.1) in the growing season. Consequently, due to the joint effect of temperature and precipitation, NDVI presented a sharp increasing trend at rates of 0.0052 per year (p < 0.01), 0.0051 per year (p < 0.01), and 0.005 per year (p < 0.01) in spring, summer, autumn, and the growing season, respectively.
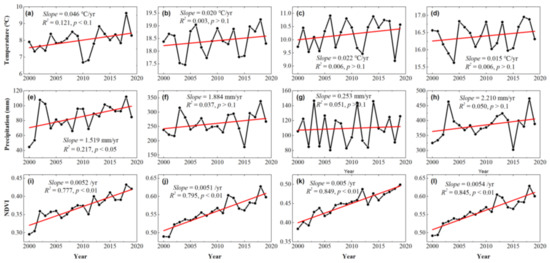
Figure 3.
Interannual changes of temperatures, precipitation, and normalized difference vegetation index (NDVI) in the Yellow River Basin during the spring (a,e,i), summer (b,f,j), autumn (c,g,k), and the growing seasons (d,h,l) of 2000–2019.
We examined changes in climate variables and NDVI at the basin scale from 2000 to 2019 by using the M–K method (Figure 4). The temporal variations of climatic factors and NDVI varied across different seasons. During spring, precipitation decreased slightly before 2011 and then increased significantly after 2011. Temperatures increased significantly before 2008, decreased from 2009–2012, and increased significantly again after 2012. The NDVI increased slightly before 2011, but the increase was more significant after 2011. During summer, both precipitation and temperature increased slightly from 2000–2019. The NDVI increased more significantly after 2006 than before 2006. Precipitation and temperature in autumn increased slightly and insignificantly; however, the NDVI in autumn increased significantly, particularly after 2008. In the growing season, precipitation exhibited a wave-like pattern from 2000–2019, the temperatures increased significantly after 2016, and the NDVI had a lower rate of increase after 2007 than before 2007. During the growing season, variations in temperature, precipitation, and NDVI were more noticeable.
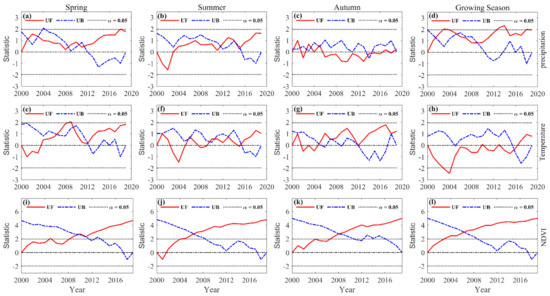
Figure 4.
Mann–Kendall test results of inter-annual precipitation, temperatures, and NDVI in the Yellow River Basin during spring (first column), summer (second column), autumn (third column), and the growing seasons (fourth column) from 2000–2019. The first (a–d), second (e–h), and third (i–l) rows denote precipitation, temperature, and NDVI, respectively. Both UF and UB are statistics of a certain variable, in which positive UF values denote an increase trend for a time series, whereas negative UF values indicate a decreasing trend. In terms of UB, it is the inverse order of UF.
3.2.2. Climatic Variables and NDVI Spatial Patterns
The spatial variations of the precipitation, temperature, and NDVI were heterogeneous in the YRB from 2000–2019 (Figure 5). In spring, almost all of the pixels exhibited an increasing precipitation trend. In general, precipitation increased in the southern part of the plateau (Loess Plateau, at a 5.6 mm/yr rate) but decreased in the northern part of the Hetao Plain at a 1.0 mm/yr rate. The temperature in most of the YRB increased from 2000–2019 at a maximum rate of 0.1 °C/yr; however, it decreased in the southern region at a maximum rate of −0.04 °C/yr. The NDVI increased throughout the entire YRB, particularly in the eastern and southwestern parts, with a maximum rate of 0.05 per year. In a few areas of the northern and southern parts of the YRB, NDVI decreased at a maximum rate of −0.02 per year.
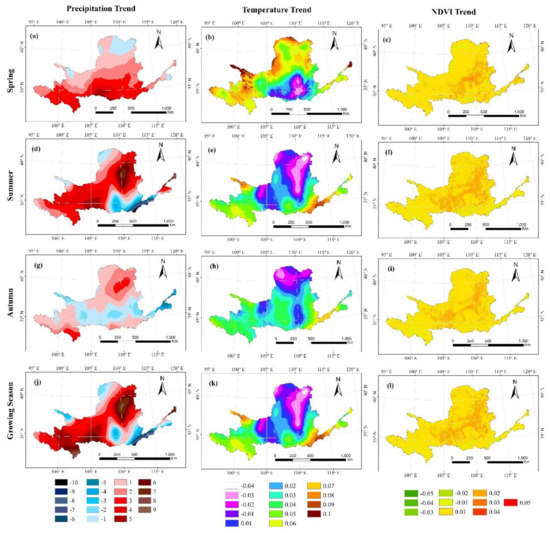
Figure 5.
Spatial distributions of the normalized difference vegetation index (NDVI) (per year), temperature (°C/yr), and precipitation (mm/yr) trends in the Yellow River Basin during (a–c) spring, (d–f) summer, (g–i) autumn, and (j–l) the growing seasons of 2000–2019.
In summer, precipitation changed and exhibited the maximum increase in the northeastern part of the YRB (9 mm/yr). In the southeastern parts, precipitation decreased at a maximum rate of −10 and −3 mm/yr in the northwestern parts. Temperatures only decreased in the central and northeastern parts of the YRB at a maximum rate of −0.04 °C/yr. The NDVI increased significantly in the eastern part of the Ningxia Plain and the western part of the Loess Plateau at a maximum rate of 0.04 per year; however, it increased slightly in other parts of the basin, with a maximum decreasing rate of −0.03 per year from 2000–2019.
In the central part of the YRB in autumn, precipitation increased by 2 mm/yr (e.g., most of the Loess Plateau), followed by 4 mm/yr in the northern (e.g., Hetao Plain) and southern parts of the YRB (e.g., Songpan Plateau). Temperatures increased throughout the basin, except in the northern part (e.g., Hetao Plain), and the largest increases occurred in the western, eastern, and central parts (0.06 °C/yr). The NDVI increased throughout the basin, particularly in the eastern part of the Ningxia Plain and the western Loess Plateau, at a rate of 0.02 per year.
During the growing season, the spatial variations of precipitation were similar to those during summer. Precipitation increased in most areas of the YRB (maximum increase of 9 mm/yr), except in the southeastern and northwestern parts (maximum decrease of 10 mm/yr). Temperature increased in the southwestern and southeastern parts of the basin at a rate of 0.1 °C/yr, whereas it decreased in the central and northeastern parts at a maximum rate of −0.04 °C/yr. The NDVI generally increased except in some areas of the southern and southeastern parts, where it exhibited a maximum decreasing rate of −0.05 per year. The NDVI increased significantly in the eastern part of the Ningxia Plain and the western part of the Loess Plateau at a maximum rate of 0.05 per year from 2000–2019.
In summary, precipitation increased overall in the YRB during the different seasons from 2000–2019, except in some regions such as the Loess Plateau. Among all the seasons, autumn had the most heterogeneous precipitation distribution. Temperatures increased throughout the YRB, except for a few areas in the northern part. The NDVI increased during all seasons, with the eastern Ningxia Plain and the western Loess Plateau exhibiting the largest increases.
3.3. NDVI and Climatic Variations Correlations
3.3.1. Temporal Changes in Correlations between NDVI and a Single Climate Factor
Vegetation changes are affected by climatic variables, especially precipitation and temperature. The respective correlation coefficients between NDVI and precipitation (RNDVI-P) and temperature (RNDVI-T) were calculated for different seasons in order to investigate the relationships between vegetation and climatic factors from 2000–2019 in the YRB (Table 1). Between the four seasons studied in this study, there were positive correlations between NDVI and temperature, with precipitation and NDVI showing higher positive correlations. The growing season’s NDVI showed a significant positive correlation with precipitation (RNDVI-P = 0.559) and temperature (RNDVI-T = 0.24). The spring NDVI had the most significant positive correlations with precipitation (RNDVI-P = 0.726) and temperature (RNDVI-T = 0.485). Precipitation/temperature and summer NDVI showed similar correlations to those during the growing season. Meanwhile, the autumn NDVI had the least correlation with precipitation (RNDVI-P = 0.13) and temperature (RNDVI-T = 0.13). Precipitation and temperature were both significant factors affecting vegetation changes on the YRB during the different seasons from 2000–2019; however, precipitation was the most influential climatic factor. The spring NDVI had the strongest correlation with climatic factors, whereas climatic changes in autumn had the least influence on vegetation variations, which shows that sufficient precipitation had a significant positive influence on vegetation growth in the YRB.

Table 1.
Respective correlation coefficients between NDVI and precipitation (RNDVI-P), temperature (RNDVI-T) for different seasons in the Yellow River Basin during 2000–2019.
For a better view of the overall response of vegetation to climate changes in the YRB, the partial correlation coefficients of different conditions were calculated (e.g., NDVI and temperature with a fixed precipitation (PNDVI-P), NDVI, and precipitation with a fixed temperature (PNDVI-T)) (Table 2). The growing season’s NDVI showed a positive partial correlation with precipitation under the 0.05 significance level (PNDVI-P = 0.563) and was less positively correlated with temperature under the 0.1 significance level (PNDVI-T = 0.251). Among the seasons, the NDVI in spring showed the most positive partial correlations with precipitation (PNDVI-P = 0.722) and temperature (PNDVI-T = 0.476) at significance levels of 0.01 and 0.05, respectively. The summer NDVI exhibited similar partial correlations with climatic factors as those observed in the growing season (PNDVI-P = 0.521, PNDVI-T = 0.206). The autumn NDVI had the slightest partial correlations with precipitation and temperature (PNDVI-P = 0.114 and PNDVI-T = 0.114, respectively). Overall, the NDVI in the YRB is more significantly correlated with precipitation than with temperature, which implies that precipitation was the main determinant of vegetation changes over the period 2000–2019.
Table 2.
Partial correlations between NDVI, precipitation (RNDVI-P), and temperature (RNDVI-T) for different seasons in the Yellow River Basin during 2000–2019.
3.3.2. Spatial Changes in NDVI and Precipitation/Temperature Correlation
The RNDVI-T and RNDVI-P values for different seasons at the pixel scale in the YRB from 2000–2019 are shown in Figure 6. The results showed that the spring NDVI was positively correlated with precipitation in the majority of pixels (90%), with an RNDVI-P of 0.4–0.8; it was mainly distributed in the Ningxia Plain and Loess Plateau. In the northern, southwestern, and southeastern YRBs, which contain cropland and grassland prone to droughts, negative correlations were observed. The temperature was positively correlated with 70% of the total pixels during spring, with correlation coefficients ranging from 0.2 to 0.6. A negative correlation was observed in the southern YRB (part of the Loess Plateau), with an RNDVI-T of 0.2–0.4. In most parts of the YRB, NDVI and precipitation had a positive correlation in summer, with a significant RNDVI-P of 0.4–1; precipitation had a stronger influence on the NDVI values in the northern, central, and western YRB than in other areas. There was a negative correlation only in a few areas of the southern YRB (eastern Loess Plateau). The southeastern YRB had high precipitation, whereas the northwestern YRB was arid. Precipitation in the mountainous areas was higher than that in plain areas, and annual precipitation decreased from southeast to northwest. In the northern YRB, where temperature had a negative effect on NDVI, nearly half of the pixels exhibited a negative correlation between summer NDVI and temperature. In the northern and western YRB, the autumn NDVI is positively correlated with precipitation; however, it is negatively correlated with precipitation in the central and southwest parts of the basin. NDVI and temperature were negatively correlated in the northern, western, and southeastern parts of the YRB during the autumn. The growing season NDVI and precipitation had similar correlations; however, the NDVI was negatively correlated with precipitation in areas of the southeastern YRB. During the growing season, most of the YRB showed a negative correlation between temperature and NDVI.
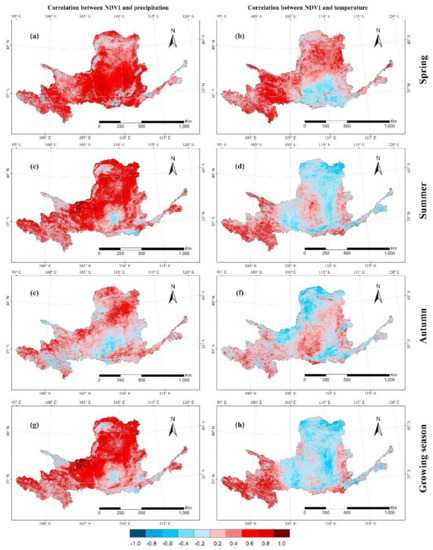
Figure 6.
Pearson’s correlation coefficients spatial distributions between seasonal averaged NDVI and climatic factors in the Yellow River Basin during 2000–2019. Correlations between NDVI and precipitation in (a) spring, (c) summer, (e) autumn, and (g) the growing seasons. NDVI and temperature correlations are provided in (b) spring, (d) summer, (f) autumn, and (h) the growing seasons.
With the exception of a few areas in northern, southern, and southwestern parts of the YRB, NDVI was positively correlated with precipitation during most seasons analyzed. However, NDVI was negatively correlated with temperature in most areas in the central part of the YRB (especially in summer and the growing season) but was positively correlated in most areas of the YRB in spring.
Unlike seasonal changes, positive correlations between the annual averaged temperature and NDVI were exhibited in 65.4% of the YRB (9.4% was significantly positive, p < 0.05). However, negative correlations were observed in 17.8% of the YRB, of which only 0.4% were significant at the 0.05 level (mainly in the northern part). NDVI and precipitation correlated positively in 83% of the YRB, with 38.6% being significant (p < 0.05). Meanwhile, 17% of the YRB had a negative correlation mainly in the southern part, with 0.9% being significant (p < 0.05). The bulk part of the central and eastern plateaus had highly significant positive correlations between temperature and NDVI, with a maximum correlation coefficient of 0.884. There were negative correlations in some parts of the YRB’s western, southern, and northern parts, with a maximum of 0.857 (Figure 7a). A significant positive correlation existed between annual NDVI and accumulated precipitation as compared to annual average temperature. Positive correlations were exhibited mainly in the northwestern and central parts of the YRB between annual averaged NDVI and annual accumulated precipitation, with a maximum positive correlation coefficient of 0.932. Across the YRB, significant negative correlations between NDVI and precipitation were only observed in a few areas. Compared to temperature, precipitation was more significantly positively correlated with the annually averaged NDVI. This phenomenon was mainly due to the unique climatic environment in the YRB, where there are high temperatures and low precipitation. The temperature increases may not have significantly positively affected the NDVI; however, a slight increase in precipitation could lead to significant influences on the NDVI, especially in the Loess Plateau, Ningxia Plain, and Hetao Plain, where water resources are in short supply.
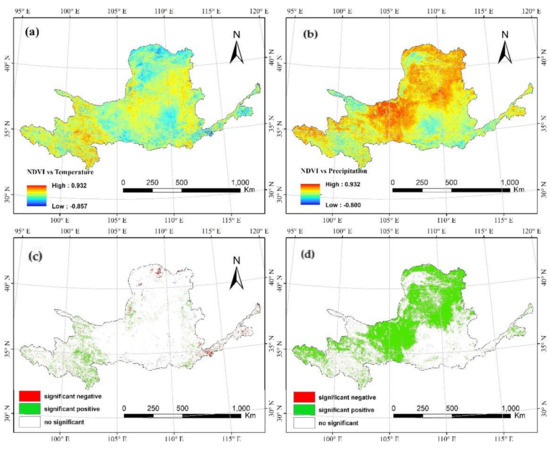
Figure 7.
Spatial distribution of correlations in the Yellow River Basin between (a) the annual averaged NDVI and temperature, and (b) NDVI and annual precipitation. (c) Significant correlations between NDVI and temperature and (d) between NDVI and precipitation.
4. Discussion
4.1. NDVI Response to Human Activities
In addition to climatic influences [9], human activity impacts vegetation cover. Thus, the effects of human activity on vegetation growth should not be ignored. The seasonal residual (i.e., the difference between observed and predicted NDVI values), which can initially explain the effects of anthropogenic factors on vegetation changes, was calculated in this study to differentiate between the anthropogenic and climate impact in the period from 2000–2019. The residual trend was categorized into significant or insignificant. The results of the MLR analyses for the different seasons are shown in Figure 8.
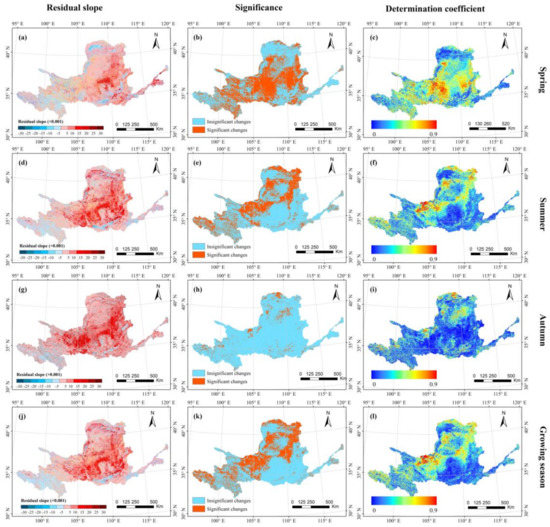
Figure 8.
Adjusted-R2 of the multivariate linear regression between NDVI and temperature and precipitation in the Yellow River Basin during (a–c) spring, (d–f) summer, (g–i) autumn, and (j–l) the growing seasons from 2000–2019.
Most areas of the YRB experienced positive residual trends during the different seasons. In spring, pixels exhibited significant positive residual trends in the Ningxia Plain, western Loess Plateau, and western mountainous area. It appears that the MLR method fitted using temperature and precipitation is insufficient to explain vegetation changes in these areas and that these changes may have been influenced by human activity. Significant positive residual trends were observed in the northern Hetao Plain, southwestern Ningxia Plain, and mountainous areas of the Songpan Plateau during summer. Autumn residual trends did not exhibit significant changes in the YRB. During the growing season, residual vegetation changes exhibited significant trends in parts of the Ningxia Plain along the Yellow River and on the western Loess Plateau. The significant residual changes indicated that the MLR did not perform well with respect to climatic trends and that the changes may have been attributable to human activity. Based on the residual trends, vegetation changes in the Ningxia Plain and southwestern Loess Plateau were likely due to human activity, which may be related to the conversion of cultivated land to forests and grassland. The same upward tendency in NDVI has been reported by Li et al. [35] as the result of the conversion of sloping farmland to forestland or grassland under the national Grain-for-Green program in YRB. We believe that climate factors and human activities go hand-in-hand in improving vegetation cover in the study area. Increasing precipitation and temperature improves soil water availability and vegetation growth season, which, along with the implementation of proper land management, could enhance NDVI. For instance, according to Guan et al. [36], vegetation management along with the rising tendency of precipitation have resulted in vegetation improvement and hence NDVI growth in Qilian area of China. Most of the impact of human activities occur in flat areas and higher elevations and steeper slopes are less affected and hence produced smaller residuals. The same results have been reported by Liu et al. [37] for the whole country of China. According to their report, as the elevation and slope increased, the correlation between NDVI and precipitation index gradually increased, whereas the impact of human activities on vegetation decreased. The impact of farming activities in the low-lying areas along with the grassland restoration and reforestation projects in the study area are the main influential factors on NDVI values and the generated residuals [38].
To investigate more the impact of human activity, we calculated and compared the MLR determination coefficients of the climatic and NDVI factors at basin scale as provided in Table 3. Climatic changes in spring had the most significant positive regression correlation with NDVI (0.796). In autumn, climatic changes had a slight influence on NDVI, with a determination coefficient of 0.172. It is obvious that the coefficient of determination decreases towards the end of the growing season. According to the study of Du et al. [38], vegetation is mostly under the influence of precipitation during the spring and growing season and temperature in the fall and the beginning of the dormant season. According to Chu et al. [9], climatic variables are less correlated with NDVI during autumn. The authors claimed that burning croplands during autumn along with the reforestation projects could influence NDVI during autumn as compared with the climatic variables in China. Therefore, the lower correlation between NDVI and climatic parameters in autumn could be explained by the paucity of precipitation and largely by the impact of human activities. These impacts, including precipitation shortage and intensive human activities, are more pronounced during the wet years. Wang et al. [39] argued that extreme weather events such as drought could offset the impact of vegetation restoration projects in hilly southern China, and hence it could close the gap between the predicted and observed NDVI values. On the contrary, during the wet years, by the vegetation improvement as the result of the land restoration projects, the difference between the predicted and observed NDVI values, and hence the human impact, would be greater.
Table 3.
Correlations between NDVI and climatic factors (precipitation and temperature, RNDVI-T-P) during different seasons in the Yellow River Basin during 2000–2019.
4.2. NDVI Responses to Climatic Factors
The NDVI in YRB showed an overall increasing trend. The same trend has been detected in the work of Wang et al. [39], Ma et al. [40], and Shi et al. [41], contrary to Chu et al. [9], who found human impact and climate change to negatively impacting vegetation cover in China. We found significant spatial heterogeneity in NDVI changes similar to Wang et al. [39], and Sun et al. [42]. The NDVI showed a decreasing tendency in a few areas in the source area, northern parts, and lower reaches, where both precipitation and temperature decreased. The NDVI tended to increase in most areas of the YRB where precipitation and temperature increased. An increasing temperature has a positive effect on enhancing vegetation dynamics, which is mainly reflected in the influence of photosynthesis, respiration, etc. [43]. Increases in spring temperatures had a more significant effect on promoting NDVI than increases in other seasons [44]. Higher temperatures in spring enhance germination of seeds, leaf development, and photosynthesis in plants and hence improve NDVI. In contrast, high temperatures in summer could negatively impact NDVI since excessive warming may accelerate soil water evaporation and water deficit [45]. Consequently, vegetation will reduce its leaf area as an adaption to increased temperature, resulting in reduced vegetation growth [46]. Temperature variation’s impact depends greatly on the vegetation type. Since most of the area is covered with croplands and grasslands, temperature had a greater role at the early stages of the growth season [47]. We also found an increasing trend in precipitation in the study area. Precipitation enhances NDVI through improving soil moisture content [48]. Water is involved in physio-bio-chemical processes such as photosynthesis end evapotranspiration. In order for plants to absorb soil nutrients and minerals, they must be dissolved in water first. Therefore, increased precipitation will strengthen the photosynthetic rate and promote vegetation coverage dynamics [49].
As previously mentioned, changes in vegetation were spatially heterogeneous. Previous researchers indicated that the influence of climate factors on vegetation presented obvious spatial variation. For example, climate change had a much greater impact on vegetation at high latitudes than at low latitudes, due to greater temperature increases at high latitudes [8,50]. The climate change impact on vegetation in the upper basin was greater than that in middle and lower watersheds of the YRB. Similar results were reported by Qu et al. [51]. In arid areas of the YRB, vegetation growth was mainly limited by precipitation. A higher precipitation level may increase vegetation growth, whereas a higher temperature level could intensify evapotranspiration [52]. Similar to the results of Qu et al. [53] and Qu et al. [51], a high soil moisture content, as well as an increase in temperature, could lead to an increase in vegetation growth and dry matter accumulation in humid and semi-humid areas of the YRB; therefore, vegetation growth was positively correlated with temperature.
In addition to temperature and precipitation, sunlight is also a prerequisite climatic factor for vegetation growth [54]. However, this requires further research since some authors, such as Wang et al. [55] and Cai et al. [56], found positive correlation between sunshine and NDVI, while Liu et al. [57] reported that sunshine does not impact NDVI significantly. We found that sunlight is directly associated with spring and fall temperatures, where temperature rises for a brief period in regions with high sunlight, leading to an increase in NDVI. Therefore, the role of sunlight is still somewhat uncertain.
5. Conclusions
Using meteorological measurements and remotely sensed NDVI data, this study observed spatiotemporal patterns in NDVI and climatic parameters and assessed the relationships between them at seasonal and yearly time scales in the YRB from 2000 to 2019. The main conclusions are as follows:
- (1)
- The YRB tended to become warmer, wetter, and greener in different seasons during 2000–2019; however, this varied among seasons.
- (2)
- The NDVI in the growing season increased the most significantly at a rate of 0.0054/yr. Temperature increased the most in spring at a rate of 0.046 °C/yr (p < 0.1). Meanwhile, precipitation increased the most in the growing season at a rate of 2.210 mm/yr.
- (3)
- Variations in NDVI and precipitation/temperature clearly exhibited spatial heterogeneity.
- (4)
- The NDVI increased during all seasons, with the eastern Ningxia Plain and the western Loess Plateau exhibiting the largest increases.
- (5)
- Climatic factors have had a significant positive impact on vegetation changes in the YRB from 2000–2019. Among all seasons, spring temperatures had the strongest correlations with NDVI, whereas autumn temperatures had the weakest correlations with NDVI. The seasonal relationships between NDVI and precipitation were similarly positive, although there were significant seasonal and geographical fluctuations. Annual precipitation exhibited more significant positive correlations across a wider area as compared to temperature, which indicated that precipitation was a major factor driving vegetation growth in these areas of the YRB.
- (6)
- Climate was the main cause of increase in NDVI, with 65.4% of the NDVI increase being closely related to temperature increases (i.e., the correlation between temperature and NDVI was significant in 9.4% of the area); meanwhile, 83% of increases in NDVI were closely related to precipitation increases (i.e., the correlation between precipitation and NDVI was significant in 38.6% of the area).
The overall findings of this study will help in understanding the changes in NDVI and the spatiotemporal relationships with climatic changes in the YRB from 2000–2019. The YRB is generally dry and lacks precipitation; therefore, increased precipitation can improve vegetation growth and lead to a greener basin, particularly in the central (Ningxia Plain) and southern parts (Loess Plateau), which are the two driest regions in the YRB. In general, increases in temperature can accelerate vegetation metabolism, which can also improve vegetation growth. In addition to temperature and precipitation, the NDVI can also be influenced by other factors (e.g., human activity and topography). This study contributes to improving current understandings of NDVI and precipitation/temperature relationships in the YRB and will guide the efforts aimed at restoring functional ecosystems in the YRB.
Author Contributions
Y.R. and J.L. conceived the idea; J.L., Y.R., S.L., Z.W. and T.L. designed the experiment; Y.R. collected and analyzed the data; Y.R. took the lead in writing the manuscript; M.J.S. polished the manuscript. All authors provided critical feedback and helped shape the research, analyses, and manuscript. All authors have read and agreed to the published version of the manuscript.
Funding
This research was made possible by Key Laboratory of Water Cycle and Related Land Surface Processes, Institute of Geographic Sciences and Natural Resources Research, Chinese Academy of Sciences under Grant WL2019001, The Belt and Road Special Foundation of the State Key Laboratory of Hydrology-Water Resources and Hydraulic Engineering under Grant No. 2021491411, K. C. Wong Education Foundation Grant No. GJTD-2020-14 and International Collaboration Project of CAS under Grant 131965KYSB20200029.
Data Availability Statement
The data presented in this study are available on request from the corresponding author.
Acknowledgments
The authors would like to thank the National Meteorological Information Center (NMIC) and National Aeronautics and Space Administration’s (NASA) for providing support with the observational data. Additionally, we thank the anonymous reviewers for their useful feedback that improved this paper.
Conflicts of Interest
The authors declare no conflict of interest.
References
- Liu, Y.; Lei, H. Responses of natural vegetation dynamics to climate drivers in China from 1982 to 2011. Remote Sens. 2015, 7, 10243–10268. [Google Scholar] [CrossRef]
- Cao, M.; Woodward, F.I. Dynamic responses of terrestrial ecosystem carbon cycling to global climate change. Nature 1998, 393, 249–252. [Google Scholar] [CrossRef]
- Anyamba, A.; Tucker, C.J. Analysis of Sahelian vegetation dynamics using NOAA-AVHRR NDVI data from 1981–2003. J. Arid. Environ. 2005, 63, 596–614. [Google Scholar] [CrossRef]
- Eastman, J.R.; Sangermano, F.; Machado, E.A.; Rogan, J.; Anyamba, A. Global trends in seasonality of normalized difference vegetation index (NDVI), 1982–2011. Remote Sens. 2013, 5, 4799–4818. [Google Scholar] [CrossRef]
- Rouse, J.W.; Haas, R.H.; Schell, J.A.; Deering, D.W. Monitoring vegetation systems in the Great Plains with ERTS. NASA Spec. Publ. 1974, 351, 309. [Google Scholar]
- Wang, J.; Rich, P.M.; Price, K.P. Temporal responses of NDVI to precipitation and temperature in the central Great Plains, USA. Int. J. Remote Sens. 2003, 24, 2345–2364. [Google Scholar] [CrossRef]
- Mao, D.; Wang, Z.; Luo, L.; Ren, C. Integrating AVHRR and MODIS data to monitor NDVI changes and their relationships with climatic parameters in Northeast China. Int. J. Appl. Earth Obs. Geoinf. 2012, 18, 528–536. [Google Scholar] [CrossRef]
- Duo, A.; Zhao, W.; Qu, X.; Jing, R.; Xiong, K. Spatio-temporal variation of vegetation coverage and its response to climate change in North China plain in the last 33 years. Int. J. Appl. Earth Obs. Geoinf. 2016, 53, 103–117. [Google Scholar]
- Chu, H.; Venevsky, S.; Wu, C.; Wang, M. NDVI-based vegetation dynamics and its response to climate changes at Amur-Heilongjiang River Basin from 1982 to 2015. Sci. Total Environ. 2019, 650, 2051–2062. [Google Scholar] [CrossRef]
- De Keersmaecker, W.; Lhermitte, S.; Hill, M.; Tits, L.; Coppin, P.; Somers, B. Assessment of Regional Vegetation Response to Climate Anomalies: A Case Study for Australia Using GIMMS NDVI Time Series between 1982 and 2006. Remote Sens. 2017, 9, 34. [Google Scholar] [CrossRef]
- Miao, C.; Yang, L.; Chen, X.; Gao, Y. The vegetation cover dynamics (1982–2006) in different erosion regions of the Yellow River Basin, China. Land Degrad. Dev. 2012, 23, 62–71. [Google Scholar] [CrossRef]
- Horion, S.; Cornet, Y.; Erpicum, M.; Tychon, B. Studying interactions between climate variability and vegetation dynamic using a phenology based approach. Int. J. Appl. Earth Obs. Geoinf. 2013, 20, 20–32. [Google Scholar] [CrossRef]
- Foley, J.A.; Levis, S.; Costa, M.H.; Cramer, W.; Pollard, D. Incorporating dynamic vegetation cover within global climate models. Ecol. Appl. 2000, 10, 1620–1632. [Google Scholar] [CrossRef]
- He, B.; Chen, A.; Wang, H.; Wang, Q. Dynamic response of satellite-derived vegetation growth to climate change in the Three North Shelter Forest Region in China. Remote Sens. 2015, 7, 9998–10016. [Google Scholar] [CrossRef]
- Stocker, T. Climate Change 2013: The Physical Science Basis: Working Group I Contribution to the Fifth Assessment Report of the Intergovernmental Panel on Climate Change; Cambridge University Press: Cambridge, UK, 2014. [Google Scholar]
- Piao, S.; Mohammat, A.; Fang, J.; Cai, Q.; Feng, J. NDVI-based increase in growth of temperate grasslands and its responses to climate changes in China. Glob. Environ. Chang. 2006, 16, 340–348. [Google Scholar] [CrossRef]
- Xu, H.-j.; Wang, X.-p.; Yang, T.-b. Trend shifts in satellite-derived vegetation growth in Central Eurasia, 1982–2013. Sci. Total Environ. 2017, 579, 1658–1674. [Google Scholar] [CrossRef]
- Zhang, W.; Wang, L.; Xiang, F.; Qin, W.; Jiang, W. Vegetation dynamics and the relations with climate change at multiple time scales in the Yangtze River and Yellow River Basin, China. Ecol. Indic. 2020, 110, 105892. [Google Scholar] [CrossRef]
- Yuan, M.; Wang, L.; Lin, A.; Liu, Z.; Li, Q.; Qu, S. Vegetation green up under the influence of daily minimum temperature and urbanization in the Yellow River Basin, China. Ecol. Indic. 2020, 108, 105760. [Google Scholar] [CrossRef]
- Yang, J.; Gong, P.; Fu, R.; Zhang, M.; Chen, J.; Liang, S.; Xu, B.; Shi, J.; Dickinson, R. The role of satellite Remote Sensing in climate change studies. Nat. Clim. Chang. 2013, 3, 875–883. [Google Scholar] [CrossRef]
- Baniya, B.; Tang, Q.; Huang, Z.; Sun, S.; Techato, K.-a. Spatial and temporal variation of NDVI in response to climate change and the implication for carbon dynamics in Nepal. Forests 2018, 9, 329. [Google Scholar] [CrossRef]
- Beck, P.S.; Atzberger, C.; Høgda, K.A.; Johansen, B.; Skidmore, A.K. Improved monitoring of vegetation dynamics at very high latitudes: A new method using MODIS NDVI. Remote Sens. Environ. 2006, 100, 321–334. [Google Scholar] [CrossRef]
- Yao, R.; Wang, L.; Gui, X.; Zheng, Y.; Zhang, H.; Huang, X. Urbanization effects on vegetation and surface urban heat islands in China’s Yangtze River Basin. Remote Sens. 2017, 9, 540. [Google Scholar] [CrossRef]
- Sun, P. The effect of a small initial distortion of the basic flow on the subcritical transition in plane Poiseuille flow. Q. Appl. Math. 2001, 59, 667–699. [Google Scholar] [CrossRef][Green Version]
- Xu, H.; Taylor, R.; Xu, Y. Quantifying uncertainty in the impacts of climate change on river discharge in sub-catchments of the Yangtze and Yellow River Basins, China. Hydrol. Earth Syst. Sci. 2011, 15, 333–344. [Google Scholar] [CrossRef]
- Ringler, C.; Cai, X.; Wang, J.; Ahmed, A.; Xue, Y.; Xu, Z.; Yang, E.; Jianshi, Z.; Zhu, T.; Cheng, L.; et al. Yellow River basin: Living with scarcity. Water Int. 2010, 35, 681–701. [Google Scholar] [CrossRef]
- Hutchinson, M.F. A new procedure for gridding elevation and stream line data with automatic removal of spurious pits. J. Hydrol. 1989, 106, 211–232. [Google Scholar] [CrossRef]
- Wang, J.; Wang, J.; Ye, H.; Liu, Y.; He, H. An interpolated temperature and precipitation dataset at 1-km grid resolution in China (2000–2012). China Sci. Data 2017, 2, 73–80. [Google Scholar]
- Kendall, M.G. Rank Correlation Methods; Griffin: London, UK, 1948. [Google Scholar]
- Mann, H.B. Nonparametric tests against trend. Econom. J. Econom. Soc. 1945, 13, 245–259. [Google Scholar] [CrossRef]
- Pang, G.; Wang, X.; Yang, M. Using the NDVI to identify variations in, and responses of, vegetation to climate change on the Tibetan Plateau from 1982 to 2012. Quat. Int. 2017, 444, 87–96. [Google Scholar] [CrossRef]
- Sun, J.; Qin, X. Precipitation and temperature regulate the seasonal changes of NDVI across the Tibetan Plateau. Environ. Earth Sci. 2016, 75, 291. [Google Scholar] [CrossRef]
- Xu, B.; Gong, P.; Pu, R. Crown closure estimation of oak savannah in a dry season with Landsat TM imagery: Comparison of various indices through correlation analysis. Int. J. Remote Sens. 2003, 24, 1811–1822. [Google Scholar] [CrossRef]
- Wen, Z.; Wu, S.; Chen, J.; Lü, M. NDVI indicated long-term interannual changes in vegetation activities and their responses to climatic and anthropogenic factors in the Three Gorges Reservoir Region, China. Sci. Total Environ. 2017, 574, 947–959. [Google Scholar] [CrossRef]
- Li, S.; Yang, S.; Liu, X.; Liu, Y.; Shi, M. NDVI-based analysis on the influence of climate change and human activities on vegetation restoration in the Shaanxi-Gansu-Ningxia Region, Central China. Remote Sens. 2015, 7, 11163–11182. [Google Scholar] [CrossRef]
- Guan, Q.; Yang, L.; Guan, W.; Wang, F.; Liu, Z.; Xu, C. Assessing vegetation response to climatic variations and human activities: Spatiotemporal NDVI variations in the Hexi Corridor and surrounding areas from 2000 to 2010. Theor. Appl. Climatol. 2019, 135, 1179–1193. [Google Scholar] [CrossRef]
- Liu, Y.; Tian, J.; Liu, R.; Ding, L. Influences of Climate Change and Human Activities on NDVI Changes in China. Remote Sens. 2021, 13, 4326. [Google Scholar] [CrossRef]
- Du, J.; Jiaerheng, A.; Zhao, C.; Fang, G.; Yin, J.; Xiang, B.; Yuan, X.; Fang, S. Dynamic changes in vegetation NDVI from 1982 to 2012 and its responses to climate change and human activities in Xinjiang, China. Ying Yong Sheng Tai Xue Bao = J. Appl. Ecol. 2015, 26, 3567–3578. [Google Scholar]
- Wang, J.; Wang, K.; Zhang, M.; Zhang, C. Impacts of climate change and human activities on vegetation cover in hilly southern China. Ecol. Eng. 2015, 81, 451–461. [Google Scholar] [CrossRef]
- Ma, Q.; Long, Y.; Jia, X.; Wang, H.; Li, Y. Vegetation response to climatic variation and human activities on the Ordos Plateau from 2000 to 2016. Environ. Earth Sci. 2019, 78, 709. [Google Scholar] [CrossRef]
- Shi, Y.; Jin, N.; Ma, X.; Wu, B.; He, Q.; Yue, C.; Yu, Q. Attribution of climate and human activities to vegetation change in China using machine learning techniques. Agric. For. Meteorol. 2020, 294, 108146. [Google Scholar] [CrossRef]
- Sun, Y.; Yang, Y.; Zhang, L.; Wang, Z. The relative roles of climate variations and human activities in vegetation change in North China. Phys. Chem. Earth Parts A/B/C 2015, 87–88, 67–78. [Google Scholar] [CrossRef]
- Lucht, W.; Prentice, I.C.; Myneni, R.B.; Sitch, S.; Friedlingstein, P.; Cramer, W.; Bousquet, P.; Buermann, W.; Smith, B. Climatic control of the high-latitude vegetation greening trend and Pinatubo effect. Science 2002, 296, 1687–1689. [Google Scholar] [CrossRef] [PubMed]
- Peng, S.; Piao, S.; Ciais, P.; Myneni, R.B.; Chen, A.; Chevallier, F.; Dolman, A.J.; Janssens, I.A.; Penuelas, J.; Zhang, G. Asymmetric effects of daytime and night-time warming on Northern Hemisphere vegetation. Nature 2013, 501, 88–92. [Google Scholar] [CrossRef]
- Liu, Y.; Li, Z.; Chen, Y. Continuous warming shift greening towards browning in the Southeast and Northwest High Mountain Asia. Sci. Rep. 2021, 11, 17920. [Google Scholar] [CrossRef] [PubMed]
- Zhang, K.; Kimball, J.S.; Nemani, R.R.; Running, S.W.; Hong, Y.; Gourley, J.J.; Yu, Z. Vegetation greening and climate change promote multidecadal rises of global land evapotranspiration. Sci. Rep. 2015, 5, 15956. [Google Scholar] [CrossRef]
- Chuai, X.; Huang, X.; Wang, W.; Bao, G. NDVI, temperature and precipitation changes and their relationships with different vegetation types during 1998–2007 in Inner Mongolia, China. Int. J. Climatol. 2013, 33, 1696–1706. [Google Scholar] [CrossRef]
- Cui, L.; Shi, J. Temporal and spatial response of vegetation NDVI to temperature and precipitation in eastern China. J. Geogr. Sci. 2010, 20, 163–176. [Google Scholar] [CrossRef]
- Gourdji, S.M.; Sibley, A.M.; Lobell, D.B. Global crop exposure to critical high temperatures in the reproductive period: Historical trends and future projections. Environ. Res. Lett. 2013, 8, 024041. [Google Scholar] [CrossRef]
- Wang, Q.; Zhao, P.; Ren, H.; Kakubari, Y. Spatiotemporal dynamics of forest net primary production in China over the past two decades. Glob. Planet. Chang. 2008, 61, 267–274. [Google Scholar] [CrossRef]
- Qu, S.; Wang, L.; Lin, A.; Yu, D.; Yuan, M.; Li, C.a. Distinguishing the impacts of climate change and anthropogenic factors on vegetation dynamics in the Yangtze River Basin, China. Ecol. Indic. 2020, 108, 105724. [Google Scholar] [CrossRef]
- Feng, X.; Fu, B.; Piao, S.; Wang, S.; Ciais, P.; Zeng, Z.; Lü, Y.; Zeng, Y.; Li, Y.; Jiang, X. Revegetation in China’s Loess Plateau is approaching sustainable water resource limits. Nat. Clim. Chang. 2016, 6, 1019–1022. [Google Scholar] [CrossRef]
- Qu, S.; Wang, L.; Lin, A.; Zhu, H.; Yuan, M. What drives the vegetation restoration in Yangtze River basin, China: Climate change or anthropogenic factors? Ecol. Indic. 2018, 90, 438–450. [Google Scholar] [CrossRef]
- Eiserhardt, W.L.; Svenning, J.-C.; Kissling, W.D.; Balslev, H. Geographical ecology of the palms (Arecaceae): Determinants of diversity and distributions across spatial scales. Ann. Bot. 2011, 108, 1391–1416. [Google Scholar] [CrossRef] [PubMed]
- Wang, F.; Wang, X.; Zhao, Y.; Yang, Z. Temporal variations of NDVI and correlations between NDVI and hydro-climatological variables at Lake Baiyangdian, China. Int. J. Biometeorol. 2014, 58, 1531–1543. [Google Scholar] [CrossRef]
- Cai, D.-h.; Wang, R.-y.; Guo, N.; Zhang, X.-w. Relation between NDVI and Spring Wheat Yields and Their Response to Climate Warming in Minqin, Gansu. J. Desert Res. 2010, 30, 376–382. [Google Scholar]
- Lu, C.; Hou, M.; Liu, Z.; Li, H.; Lu, C. Variation Characteristic of NDVI and its Response to Climate Change in the Middle and Upper Reaches of Yellow River Basin, China. IEEE J. Sel. Top. Appl. Earth Obs. Remote Sens. 2021, 14, 8484–8496. [Google Scholar] [CrossRef]


Publisher’s Note: MDPI stays neutral with regard to jurisdictional claims in published maps and institutional affiliations. |
© 2022 by the authors. Licensee MDPI, Basel, Switzerland. This article is an open access article distributed under the terms and conditions of the Creative Commons Attribution (CC BY) license (https://creativecommons.org/licenses/by/4.0/).