Abstract
Fast and accurate acquisition of the outline of rural buildings on remote sensing images is an efficient method to monitor illegal rural buildings. The traditional object detection method produces useless background information when detecting rural buildings; the semantic segmentation method cannot accurately segment the contours between buildings; the instance segmentation method cannot obtain regular building contours. The rotated object detection methods can effectively solve the problem that the traditional artificial intelligence method cannot accurately extract the outline of buildings. However, the rotated object detection methods are easy to lose location information of small objects in advanced feature maps and are sensitive to noise. To resolve these problems, this paper proposes a two-stage rotated object detection network for rural buildings (TRDet) by using a deep feature fusion network (DFF-Net) and a pixel attention module (PAM). Specifically, TRDet first fuses low-level location and high-level semantic information through the DFF-Net and then reduces the interference of noise information to the network through the PAM. The experimental results show that the mean average precession (mAP), precision, recall rate, and F1 score of the proposed TRDet are 83.57%, 91.11%, 86.5%, and 88.74%, respectively, which outperform the R2CNN model by 15%, 15.54%, 4.01%, and 9.87%. The results demonstrate that the TRDet can achieve better detection in small rural buildings and dense rural buildings.
1. Introduction
For a long time, many cultivated lands have been illegally occupied as homesteads, especially in rural China, due to the lack of unified planning and random location of rural building construction. Remote sensing technology is widely used in hydrological analysis, dynamic detection, fire severity, and habitat monitoring, etc. [1,2,3,4,5,6]. With the rapid development of remote sensing technology, remote sensing image acquisition has become more convenient and low-cost [7]. The effective and scientific management of rural buildings based on remote sensing images has proved a competitive method, which is of great significance to the sustainable development of urban and rural areas [8,9,10].
Deep learning (DL) has become increasingly popular recently, which has obtained the most advanced results in buildings datasets [11,12]. According to the different detection principles and results, this paper divides the building detection methods based on DL into three categories: object detection, semantic segmentation, and instance segmentation.
The semantic segmentation method is a classification algorithm for each pixel [13]. The contour of buildings can be extracted from remote sensing images by using the semantic segmentation method. In recent years, semantic segmentation methods have been widely used in building area extraction and change detection [14,15,16]. To introduce the semantic segmentation method in the natural scene into the building extraction task of remote sensing image, Saito et al. [17] improved the accuracy of building segmentation by the convolutional neural network (CNN) through the slice learning method. Guo et al. [18] proposed integrating ESPCN and UNET to identify buildings from low-resolution images by super-resolution. Some researchers also improved the model from the characteristics of the structure, texture, and semantics [19]. In Prathap et al. [20], the binary distance transform was first used to improve the data marking process, and then the batch normalization and random gradient descent algorithm were added to U-Net so that the results of semantic segmentation were closer to the building contour. However, the boundary of the pixel-wise semantic segmentation task is always not regular. It can not effectively segment the boundary between buildings or extract the instance of rural buildings with regular boundaries. Even if the instance segmentation method can identify buildings [21,22,23,24], it is still unable to outline compact rural buildings.
As a robust and accurate technique, object detection performs well in extracting buildings from remote sensing images. It is generally used in application scenarios that only need to locate the building coordinate information, such as post-disaster building detection and illegal buildings detection [25]. Feng et al. [26] used multi-stage convolution neural network Cascade R-CNN to realize automatic building detection. Dong et al. [27] proposed a new network model based on Yolo V3 to improve the detection accuracy of small buildings by modifying the size of the feature map and the dimension of a priori box. Although the above detection methods have been successful in general use, the horizontal detection box cannot generate the actual posture of rural buildings in specific application scenarios. And due to the limitations of horizontal NMS, it is easy to ignore small buildings in dense arrangements of buildings [28].
To overcome the above obstacles, researchers proposed a series of rotated object detection models. The rotated object detection is a relatively challenging task in object detection, which needs to predict not only the position and size of the object but also the rotation angle [29]. Current popular rotated object detection methods can be broadly characterized as two types: one-stage rotated object detectors and two-stage rotated object detectors [30,31]. The two-stage method has achieved better results, while the single-stage has a faster detection speed. In the practical application scenario using remote sensing images, the performance of the single-stage method is not as high as that of the two-stage method in small and intensive tasks, such as East [32], Textboxes++ [33], PIoU [34], DRN [35], and R3Det [36]. Two-stage detection has an advantage in this field because the region proposes layers to generate dense anchors. Ma et al. [37] constructed the rotation region propose network (RRPN) based on the idea of RPN. The RRPN generates a series of rotation anchors with angle information to obtain the rotation region of interest and extract the corresponding features. However, due to the error caused by the angle information, the network can not obtain all the feature information during the classification and the regression, resulting in poor detection accuracy. Then, Jiang et al. [38] proposed R2CNN based on Faster RCNN, which used the horizontal box to retain feature information in the RPN and finally carried out angle regression. Xue et al. [28] improved the feature extraction module and loss function of R2CNN to improve the detection accuracy of small objects. Based on R2CNN and FPN structure, Zhang et al. [39] proposed CAD-Net and exploits attention-modulated to integrate global and local contexts. These studies show that the series of algorithms based on R2CNN can have good robustness and accuracy in remote sensing image detection.
It is generally believed that pooling layers in the general DL algorithms can easily lead to missing the location information of small objects in advanced feature maps. With the increase of the network depth, the resolution of the feature map decreases, and the stride of anchor (SA) [40] increases, which may lead to an insufficient sample of small objects. In addition, there is much background noise information due to the complexity of the features in the remote sensing images. This problem is particularly evident in detecting small and densely distributed rural buildings.
To solve the above issues, this paper proposes a two-stage rotated object detection model for small and dense rural buildings, called a two-stage rotated detection network (TRDet). TRDet uses DFF-Net to fuse the semantic information in different scale-spaces adds PAM to suppress the interference of noise information on the network and uses IoU (intersection over union) loss function to regress the object frame. Experiments show that our network model achieves good detection performance.
The rest of this paper is organized as follows. In Section 2, the dataset and method are explained. Section 3 introduces the experimental settings. Section 4 presents the results of the experiment. Section 5 shows a brief discussion of this work. Finally, Section 6 introduces the conclusion of the paper.
2. Dataset and Methods
This Section shows the relevant information of the dataset, then introduces the proposed methods used to detect rural buildings, including DFF-Net and PAM. DFF-Net can solve the problem of small objects’ lost location information and insufficient sampling with the increase of the network depth, and PAM can effectively reduce the interference of noise information on the network.
2.1. Rural Building Dataset
The study area was located in Yichang City in China. Due to the multiple-source and multiple-time of remote sensing dataset images, it was easy to cause errors in model validation [41]. To overcome these problems, the data source of this dataset was the unmanned aerial vehicle (UAV) images of rural areas in Zigui County in 2014 and Dianjun District in 2020, with a spatial resolution of 0.2 m. The UAV used in this paper was a vertical take-off and landing UAV (the China Three Gorges University independently researched and equipped with a power suit and flight control navigation system), equipped with a positioning system (GPS/GLONASS) and a modified camera. The camera has an effective pixel size of 42 million, sensor size is 35.8 mm × 23.9 mm, and a focal length of 40 mm. Raw images were stored in RGB mode (aspect ratio: 7952 × 5304 pixels) in JPEG format. The UAV’s average flight relative altitude was 1800 m, the image course overlap rate was 80%, the side overlap rate was 70%.
To improve the diversity of the data, the selected images included buildings of different building densities, distribution directions, and sizes. In addition, during the selection process, we recorded precise geographic coordinates to ensure that there were no duplicate images in the selected picture. We cropped the UAV images to pixel, using five-value labeling to mark the image [41]. At the same time, to ensure that the data distribution of the training and validation sets was approximately the same, we randomly divided the datasets into training and validation sets, as shown in Table 1.

Table 1.
Description of the training set and validation set: RBox is short of rotated object boxes and Avg. RBox quantity represents the average number of rotated object boxes of each image.
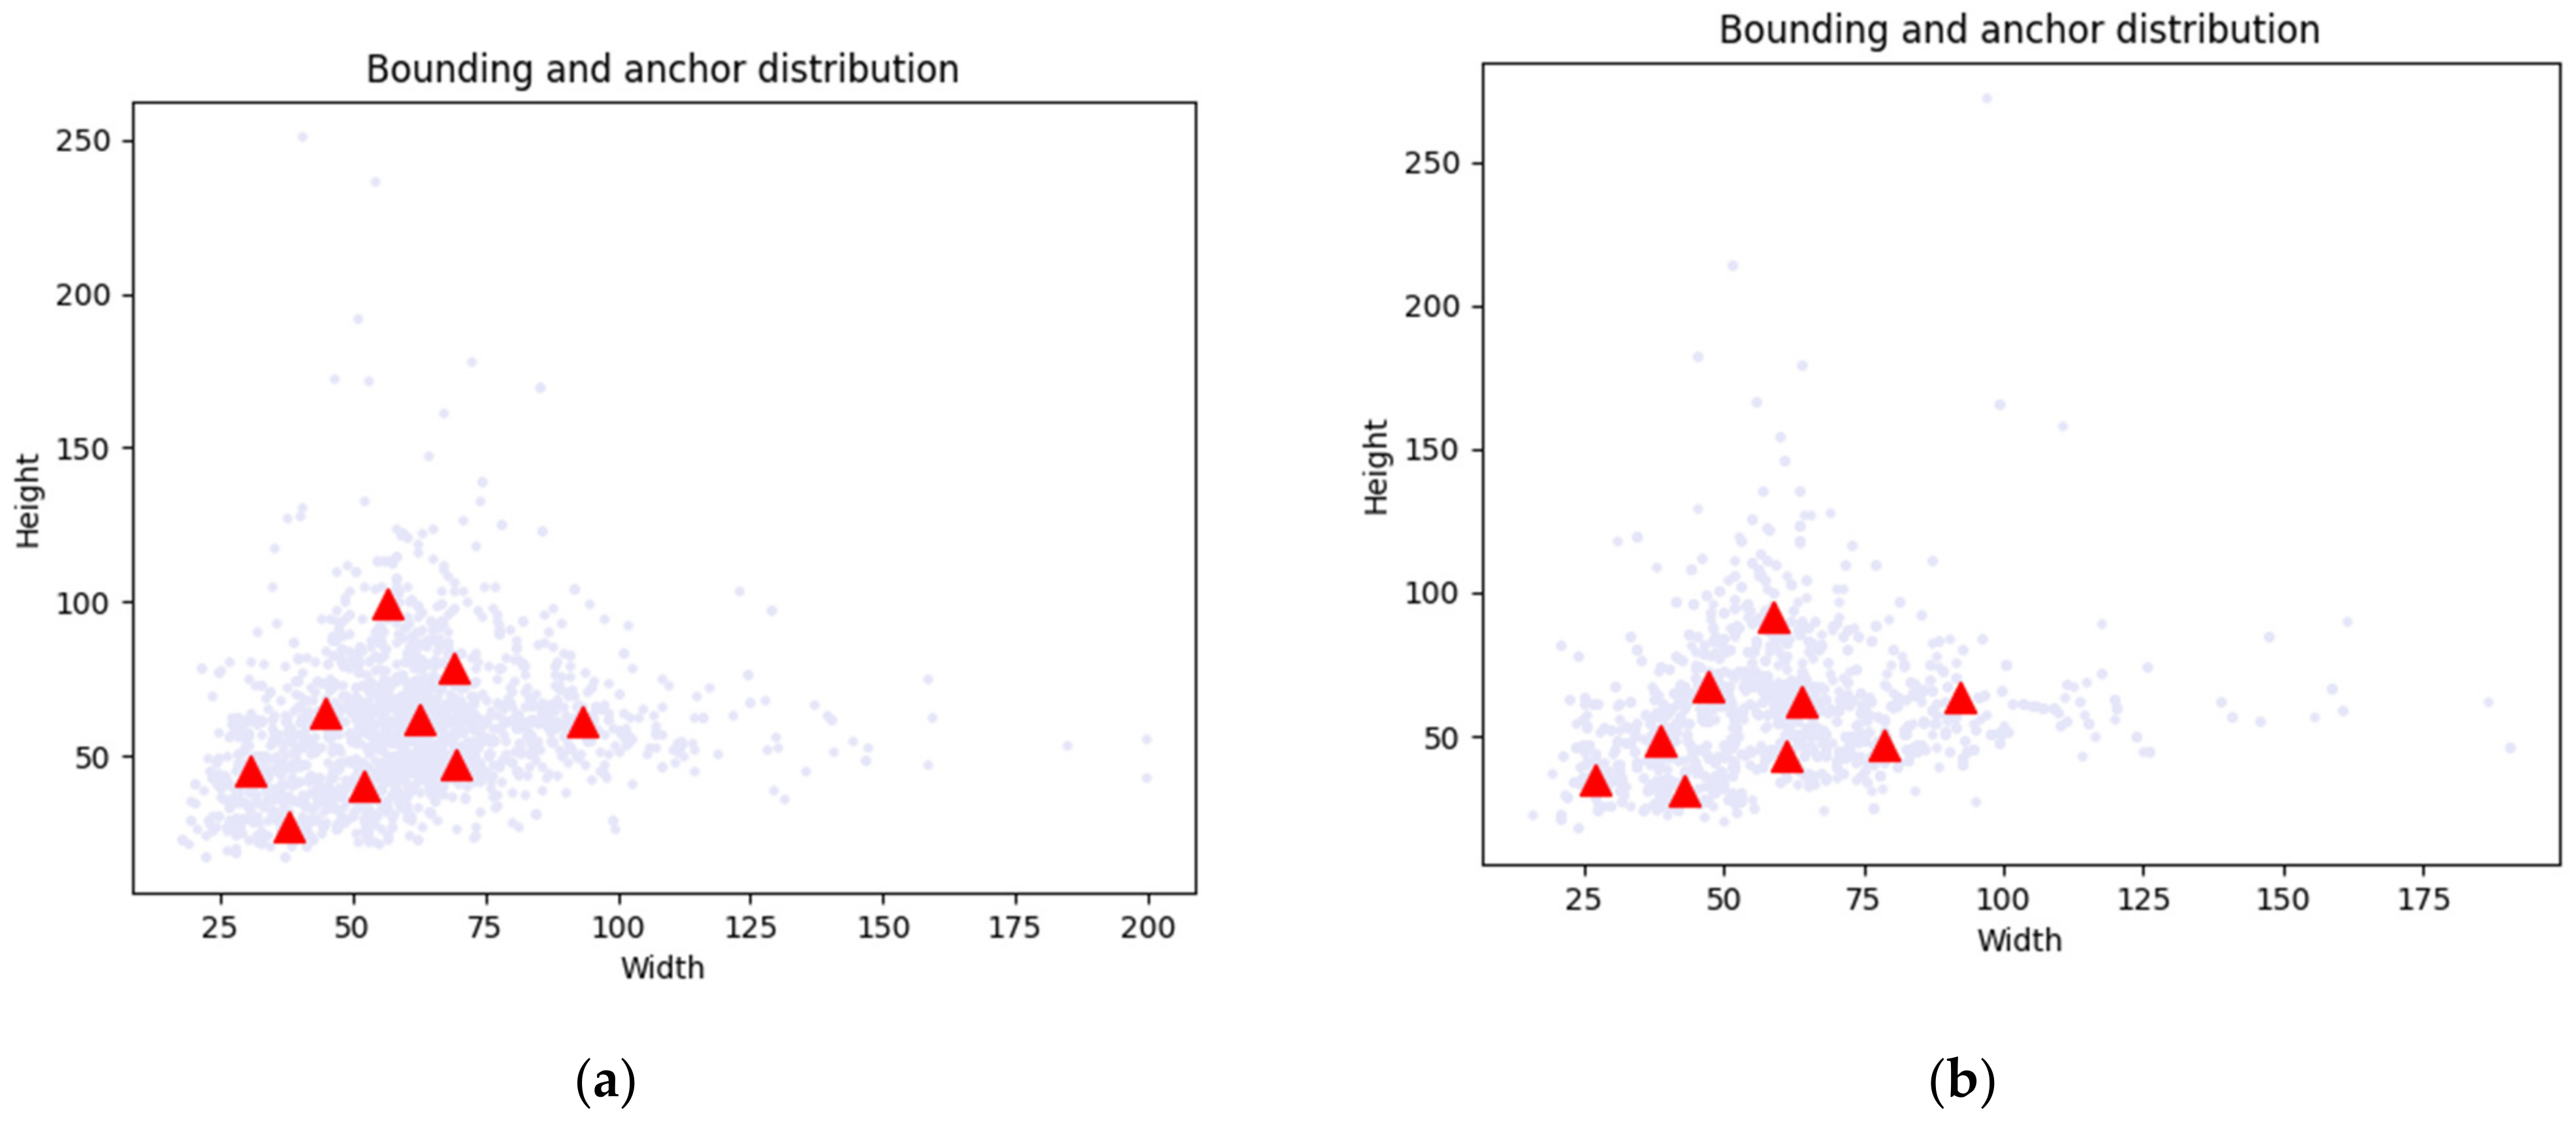
When the UAV takes images, the difference in flight altitude leads to slight changes in image resolution, especially in mountainous areas. As shown in Figure 1, the pixel size of rural buildings in our data set was within 15 to 270 pixels. In addition, as shown in Table 2, we divided all instances in the dataset into three parts according to the height of the horizontal bounding box, and judged the object size according to the threshold defined in [42]. Rural buildings under 32 pixels were small objects, rural buildings over 96 pixels were large objects, and rural buildings of other pixel sizes were medium objects.
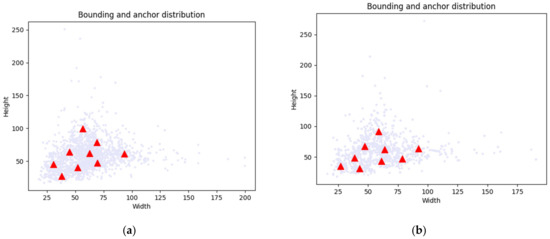
Figure 1.
Objects’ size scatter of the dataset: red triangle represents the pixel size in the most concentrated rural buildings: (a) Training set; (b) Validation set.
Table 2.
Rural buildings size statistics in datasets.
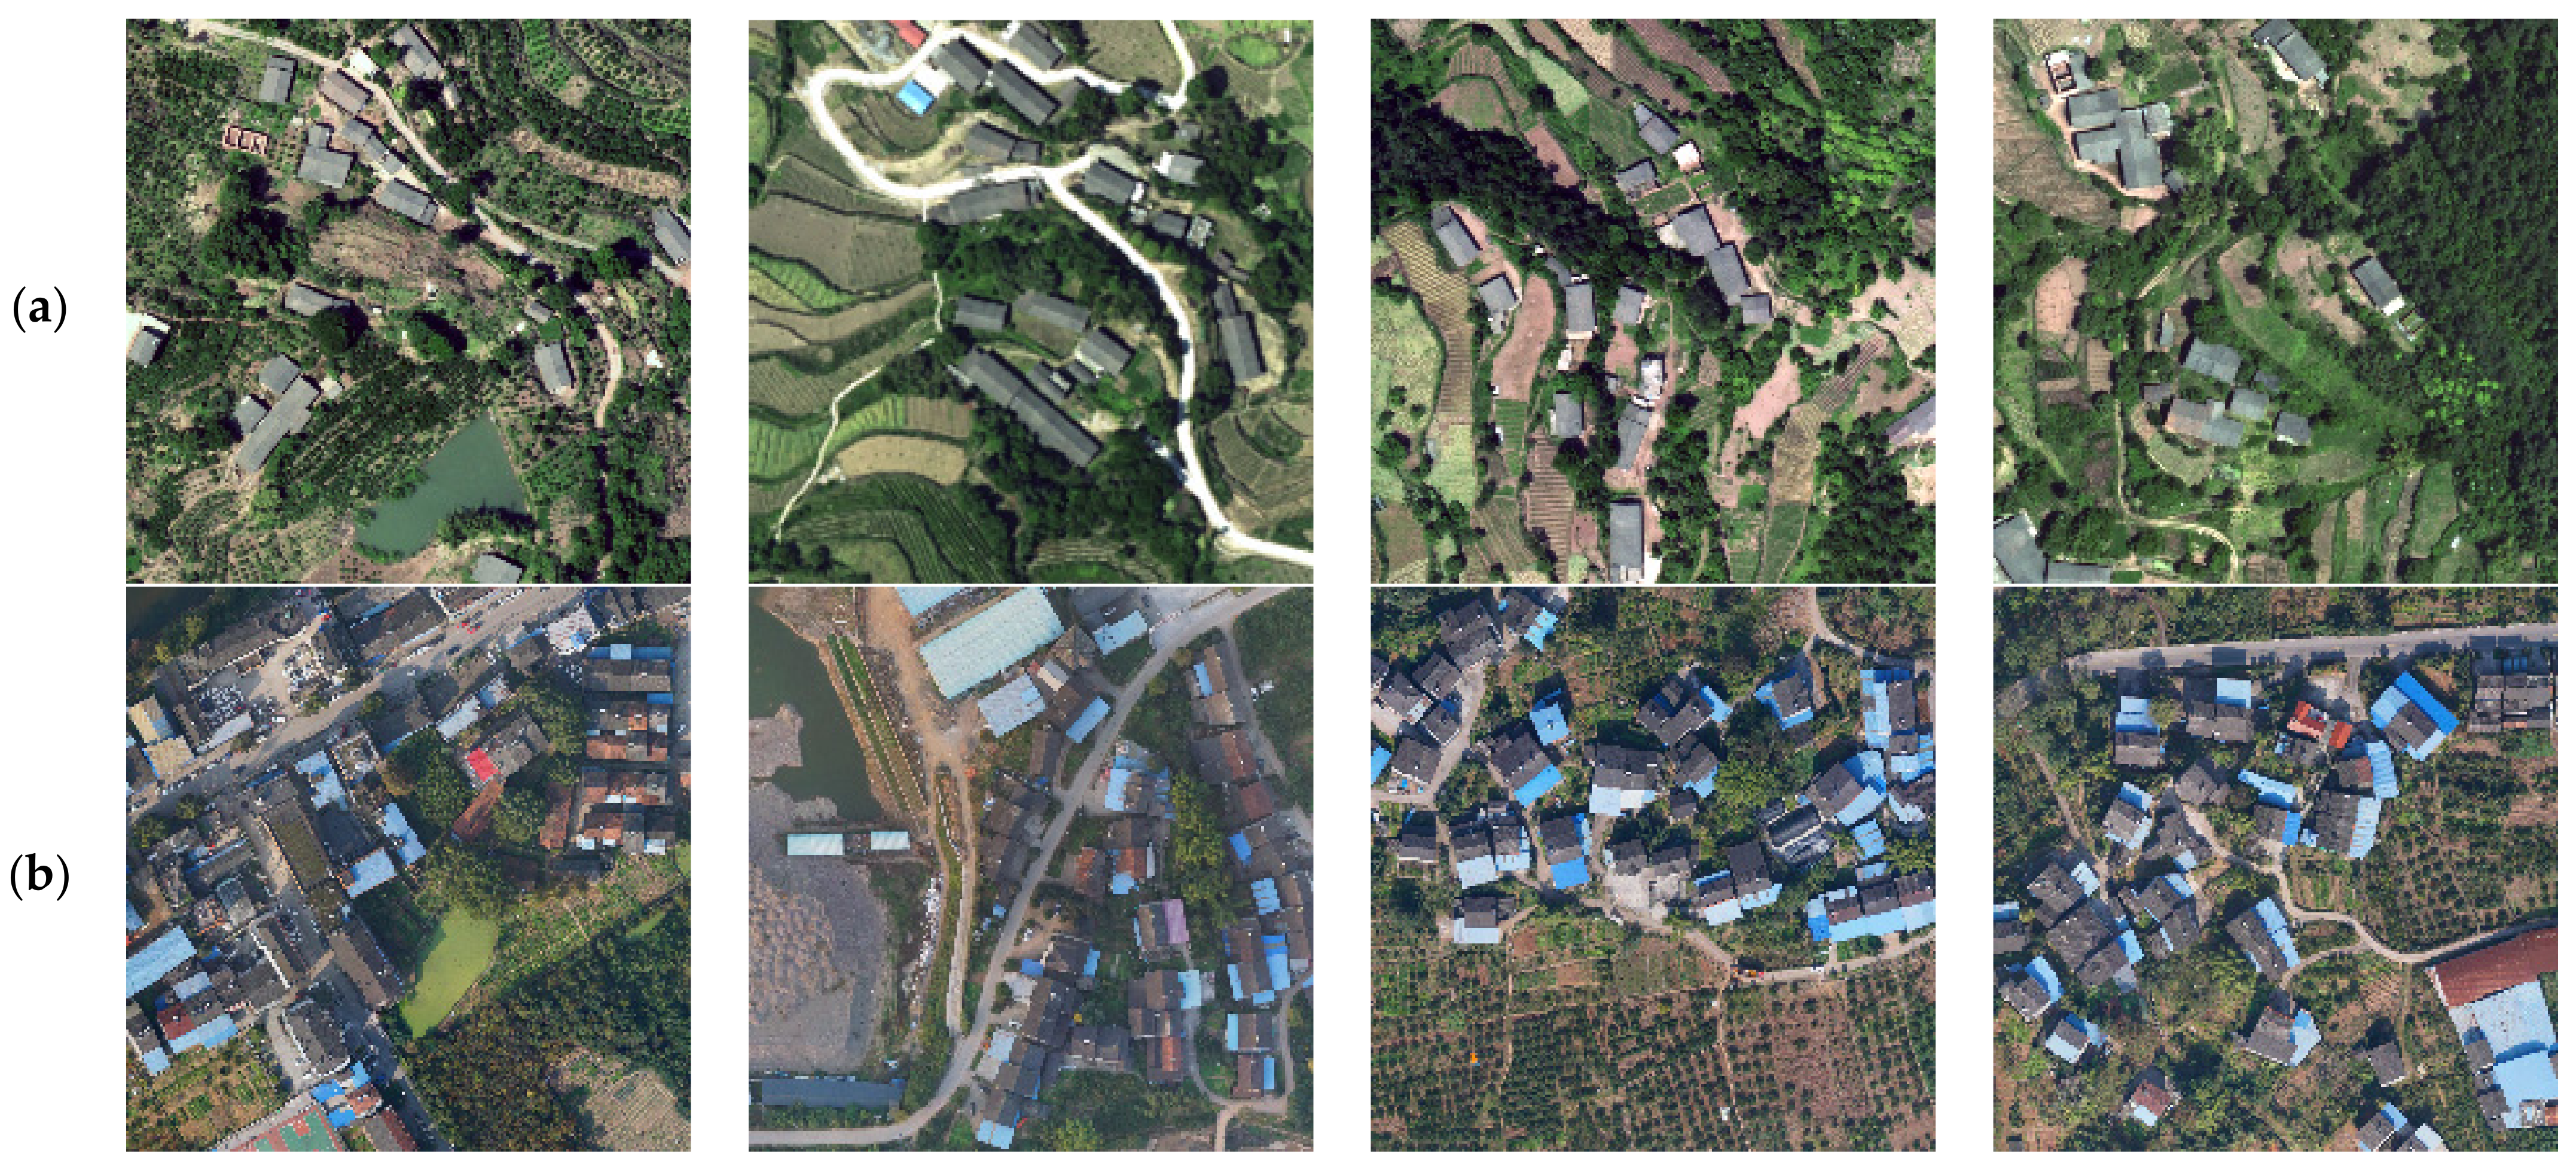
As shown in Figure 2, we can find various building patterns, architectures, scene features, lighting conditions, and styles in the dataset. Although these various rural buildings can be easily identified by visual inspection, DL is not easy. The challenges of datasets include small rural buildings, different building densities, confusing details, and complex land cover types in object areas.
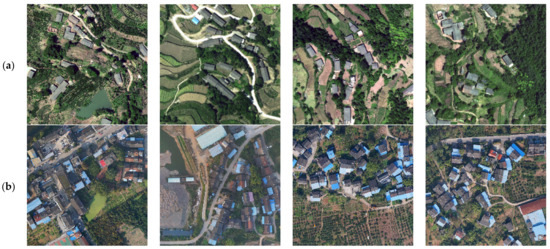

Figure 2.
Different rural building targets in the dataset: (a) mountain dense rural buildings; (b) suburb dense rural buildings; (c) sparse rural buildings; (d) small rural buildings; (e) large rural buildings.
2.2. Method
This Section outlines the two-stage rotating target detection model for TRDet. As shown in Figure 3, in the first stage, TRDet uses the first four layers of ResNet101 [43] as the backbone network to extract features from top to bottom, by DFF-Net and PAM can obtain more feature information and reduce noise. In the second stage, RPN is first used to generate dense horizontal anchors, and then the regression is based on five parameters and rotation non-maximum suppression (R-NMS), carried out to obtain results under any rotated frame. This paper adopts the ROI Align [21] alignment features and uses the global average pooling layer (GAP) instead of the full connection layer.
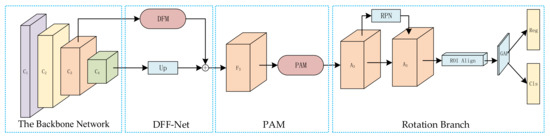
Figure 3.
TRDet network architecture: TRDet consists of two phases: feature extraction and rotation branch. In the feature extraction phase, multiple levels’ abundant features are extracted and integrated by DFF-Net and PAM. Then, RPN generates a series of horizontal anchors, the ROI Align to align features, and the GAP to replace the fully connected layer. By Combining the above predictions, R-NMS produces the final detection results.
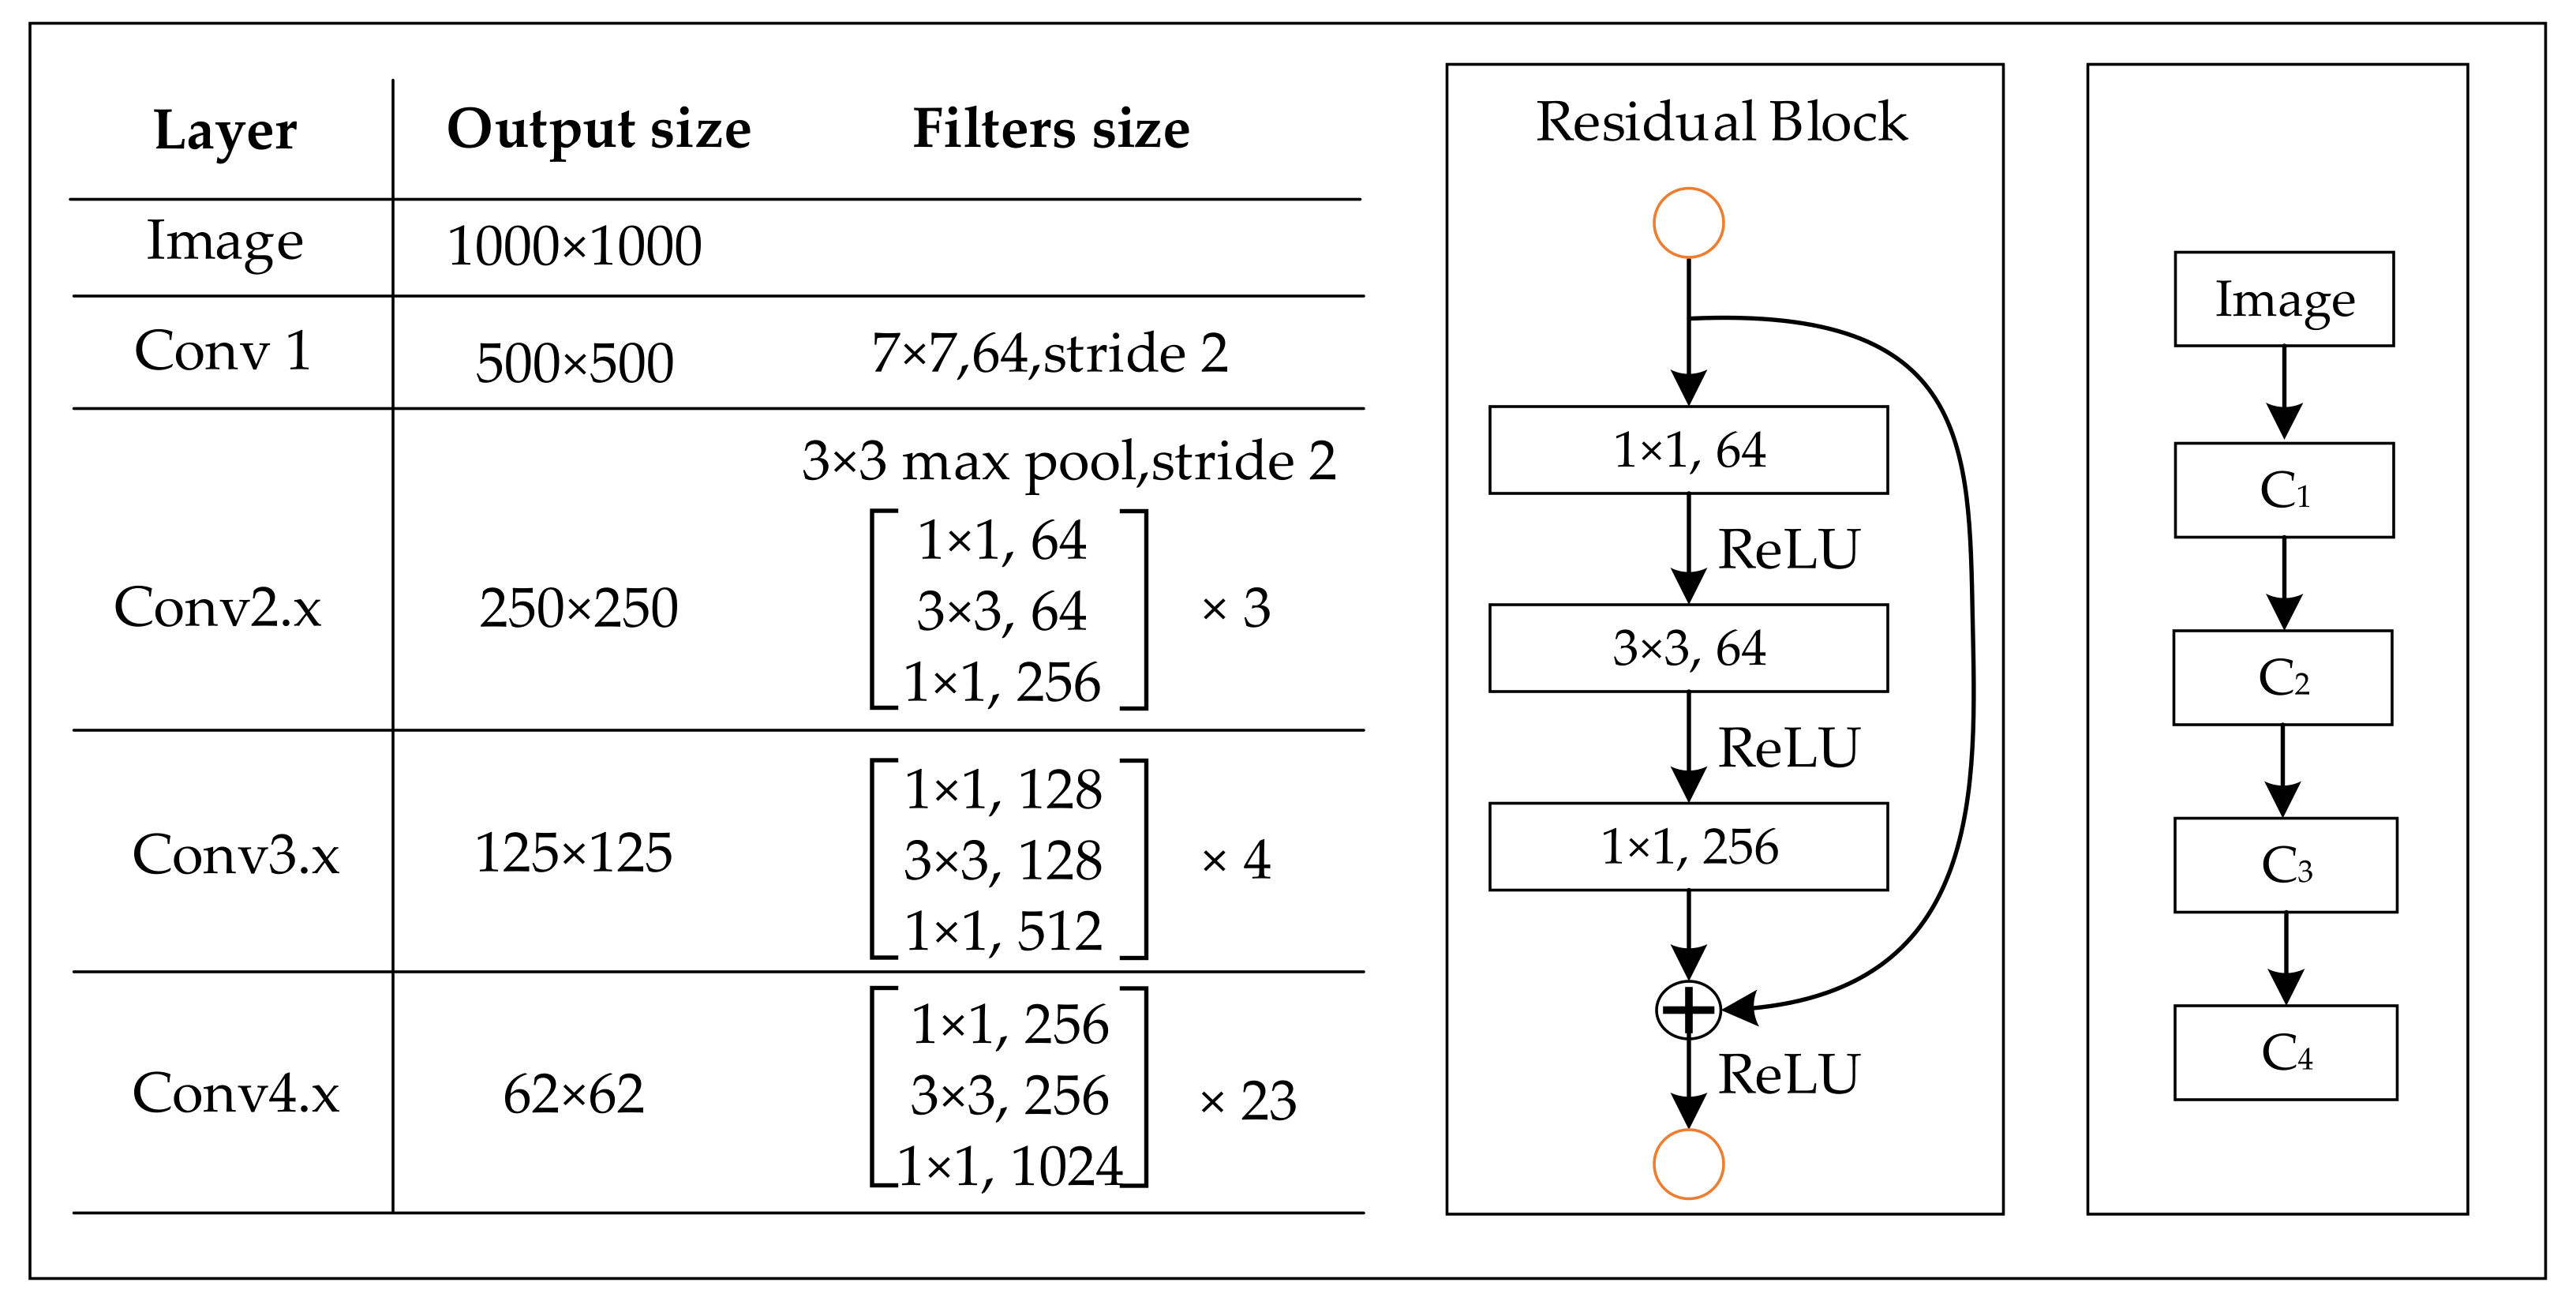
The backbone network used in TRDet is shown in Figure 4. ResNet is mainly composed of residual block structures with the convolutional layers of sizes of , , and . The backbone network of TRDet contains 91 convolutional layers, and a ReLU layer follows each convolutional layer. Enter an image and get the feature maps of C* = {C1, C2, C3, C4} after the backbone network. The feature maps’ size is , , , times the original image size, and the number of channels is 64, 256, 512, 1024, respectively.
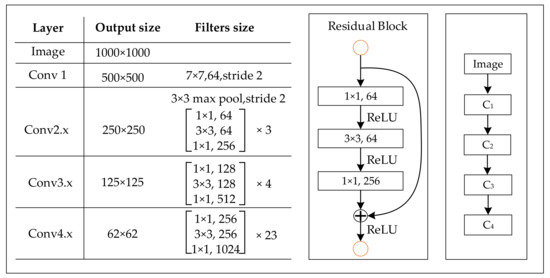
Figure 4.
Structure of the backbone network.
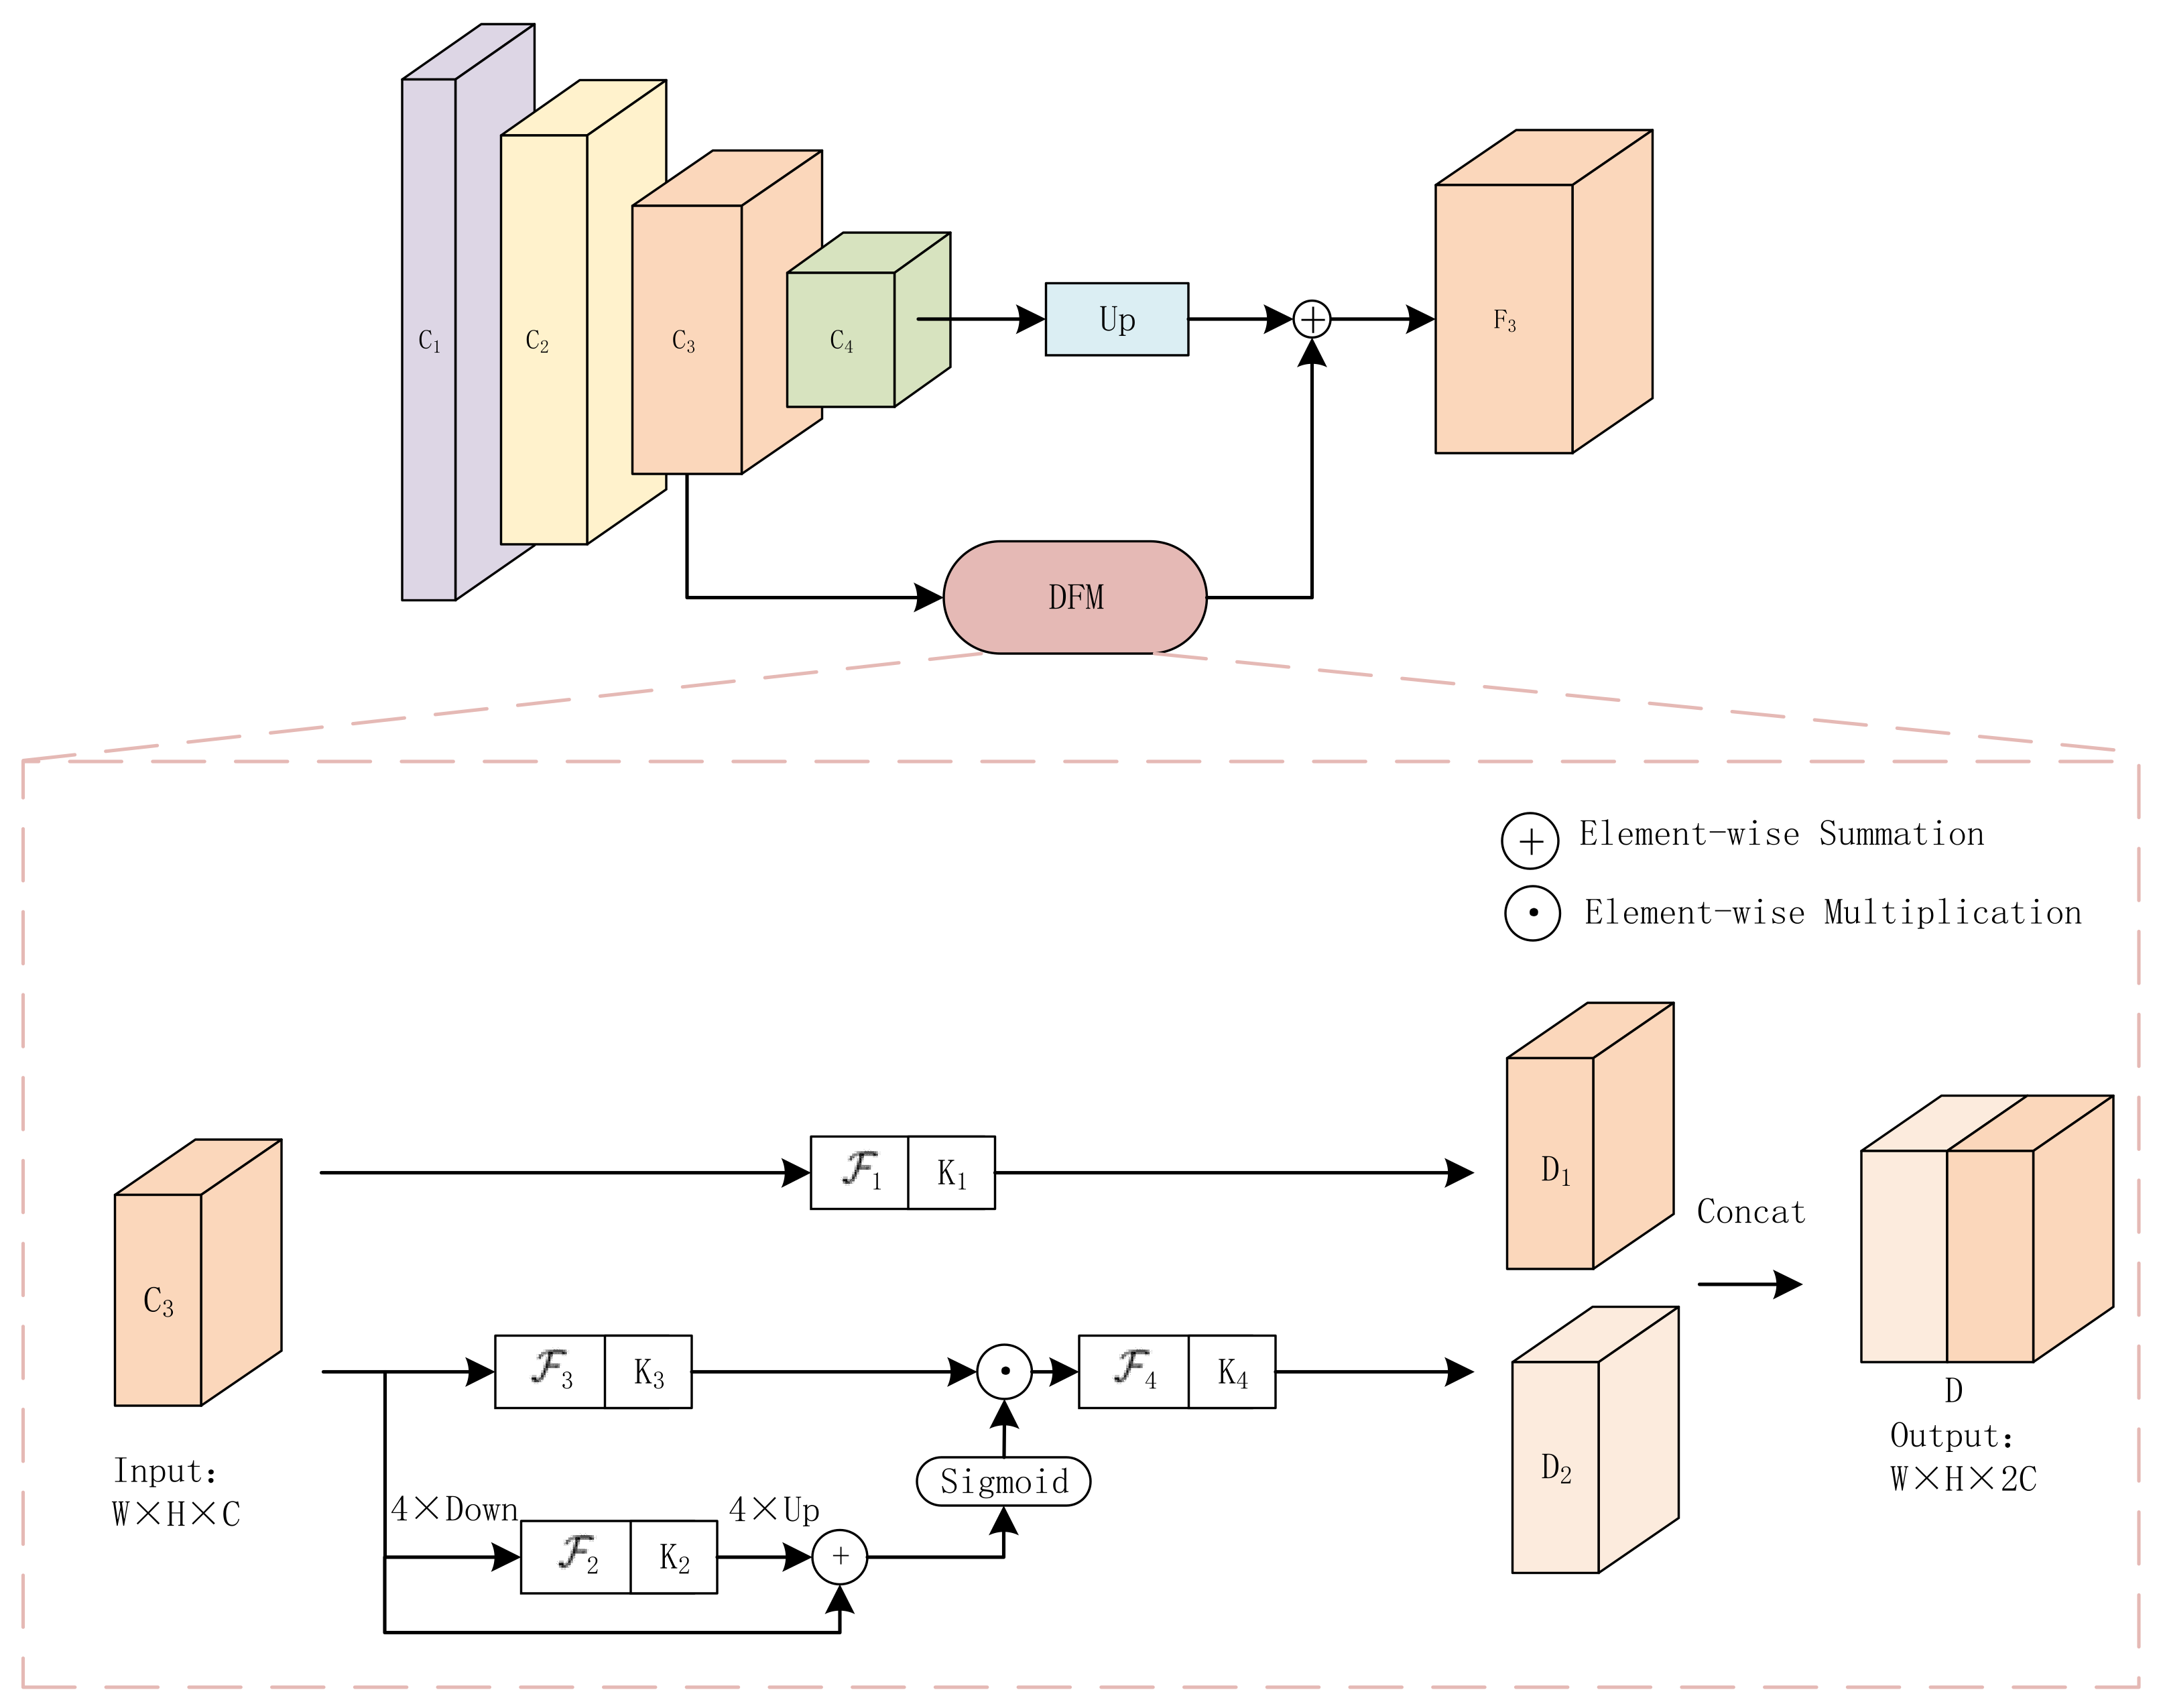
2.2.1. DFF-Net
To solve the issues of small buildings’ lost location information and insufficient sampling in advanced feature maps, we fuse the features of C3 and C4 by DFF-Net and set the stride of the anchor to an appropriate size to ensure sufficient anchor samples of small targets. Correctly, the DFF-Net first sample C3 and C4 to n times the original image size, and the number of channels in C3 is expanded through the deep feature module (DFM) to make. The D obtained in layer C3 has the same number of channels as that in layer C4. Finally, the D is fused with the down-sampled C4 to obtain the final feature map F3.
As shown in Figure 5, the DFM is divided into two parts: one part retains the original feature information, and the other part fuses the spatial information of different scales to guide the feature transformation process in the original feature space C3; the convolution feature operation in two different scales can especially expand the receptive field.
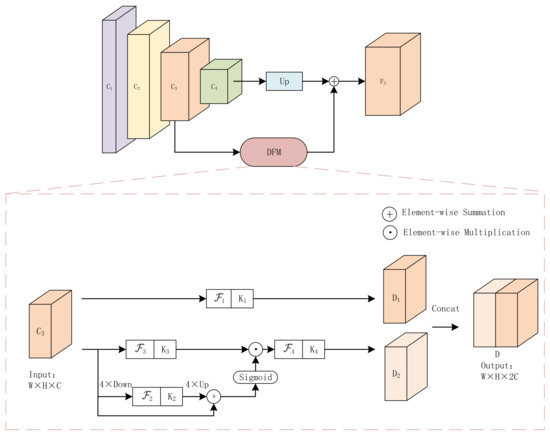
Figure 5.
DFF-Net: firstly, C3 is expanded the number of channels in the feature map by DFM, and then the deep feature fusion is carried out with C4.
Given the input to output , a conventional 2D convolutional layer is transformed with a group of filter sets , where denotes the -th set of filters with size n. And the output feature map at the channel can be written as:
where denotes convolution and
- Part One: Feature transformations on C3 is performed based on :
- Part Two: First, we adopt the average pooling with filter size and stride 4 on C3 as follows:
The second step fuses the two features at different scales by element-wise summation:
where and is a bilinear interpolation operator that converts the feature map to the same size as C3. The weight value is gotten through the sigmoid function to guide the transformation of the original feature map. The third operation can be formulated as follows:
where is the sigmoid function, and denotes element-wise multiplication. After that, the feature map D2 is obtained through the convolution operation:
Finally, D1 and D2 are collocated to get the same number of D as equal C4 channels. Eventually, DFF-Net fuses the feature maps of up-sampled C4 and D by element-wise summation to reach F3. The feature map F3 obtained by our fusion method can well balance the semantic information with the location information. Compared with FPN [44], DFF-NET only increases a few parameters and reduces the interference of useless information in the underlying feature map.
This paper sampled the different sizes of pre-fusion feature maps to accommodate further SA. In Table 3, the detection accuracy and the time consumption were listed on the different stride detections. We found that the detection mAP of the rotated detection (RD) task and the horizontal detection (HD) task was 0.01% and 0.26% higher than when the stride was 8 while the value of SA is equal to 4, respectively. It further validated that the smaller the SA, the higher the expected max overlapping score [40], and the better the model captured small buildings. However, our model took nearly twice as long as 8 on the condition that the score of SA was equal to 4, therefore, TRDet set the SA to the most efficient 8.
Table 3.
Detection accuracy and average training time consumption of models at various SA.
2.2.2. PAM
In remote sensing images, the ground objects are complex, thus, the RPN network can easily introduce a lot of noise information into ROI. The noise information will cause interference to the network, thus increasing the probability of false detection and missed detection. At present, a great quantity studies have shown that attention mechanisms can effectively reduce the interference of noise information on the network [45,46,47].
We compared several attention mechanisms experimentally and introduced a supervised PAM to reduce the interference of noise information on the network. As shown in Figure 6, the feature map F3 was convoluted to obtain a two-channel saliency map. Because the saliency map is continuous, non-object information will not be eliminated entirely. Then the value of the saliency map was limited to by the softmax function and element-wise was multiplied by F3 to get the final feature map A3. In addition, the PAM produced a binary image (background 0, foreground 1) based on the ground truth. The loss of cross-entropy between binary image and saliency map was used as part of the loss function to guide model learning.
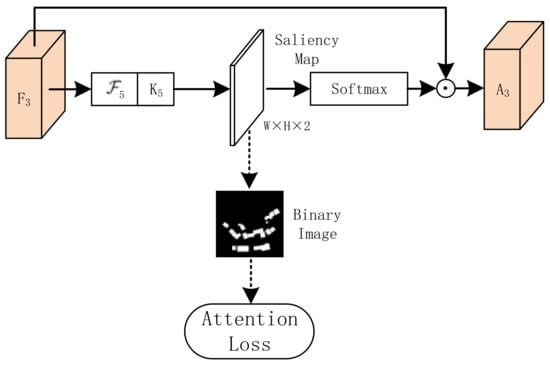
Figure 6.
PAM: the sensitive position score map obtained by F3 strengthens the building characteristics.
2.2.3. IoU Loss Function
The IoU loss function is defined as [28]
where denote the proposed box center coordinates, width, height, and angle, respectively; represents the number of boxes; is a binary value (for foreground , background , and background have no regression); and represent the true and predicted vector of targets; and represent the labeled and predicted masked pixel, respectively; is the probability distribution for each category calculated by the softmax function; is the object label; and , and are the super-parameters. In addition, the regression loss is the IoU smooth L1 loss [28], the classification loss is the softmax cross-entropy [48], and the pixel attention loss is pixel-wise softmax cross-entropy. The extra parameter in the equation was set to , , .
3. Experimental Settings
This Section describes the evaluation metrics and related implementation details used in this paper.
3.1. Evaluation Metrics
This paper adopted the mAP, the Recall (R), the Precision (P), and the F1 score (F1) to evaluate the performance of the proposed methods quantitatively. The mAP is widely used to estimate the quality of object detectors, and the DOTA metric was adopted to compute mAP. P is the model’s ability to find only relevant objects, that is, the proportion of all prediction results given by the model that hit the true objects. R is the ability of the model to find all the relevant objects, that is, the number of true objects that the model’s prediction results can cover at most. The F1 score was used to evaluate the overall performance of the model. The P, R, and F1 were calculated by:
where TP is true positive, FP is false positive, FN is false negative. If the IoU between a ground-truth and a prediction exceeds 0.5, TP is when there is the same class label, FP is when there is a different label. The ground-truths without corresponding TP predictions were labeled as FN. As shown in Figure 7, in the HD task, the calculation of IoU is as follows:
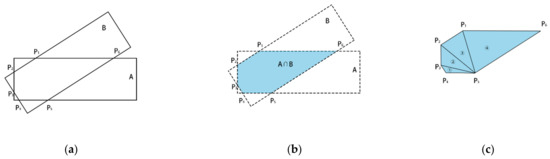
Figure 7.
Calculation of : (a) the intersection area of two rotated boxes A and B; (b) calculation convex hull (P1, ... , Pn); (c) division of the convex hull.
3.2. Implementation Details
All the experiments were performed in TensorFlow [49] version 1.12 and run with Intel Xeon E5-2680 v3 processor (produced by Intel, Taiwan, China), 128 G memory, Nvidia Geforce RTX 2080Ti GPU (produced by Leadtek, Taiwan, China) with 11 Gb memory.
This paper adopted the ResNet101 [43] as the pre-trained model to initialize the parameters of the feature extractor. To fully use the weight file of the pre-training model, the full connection layer was replaced by the C5 block of the pre-training model to initialize the parameters. The result of the ablation study in Section 2.2.1 showed that the suitable SA was 8, the size of the base anchor was 256, and the ratios of the anchor were . The model was trained for 300,000 rounds with a learning rate of 0.0003. When , the anchor was assigned as a positive sample, and when , the anchor sample was negative. To test the possible configurations and the performance of the super parameters, we conducted several experiments and finally set it to the optimal specific value above.
4. Results
This Section explores the potential of TRDet in the detection and classification of rural buildings in remote sensing images of urban and suburban areas. Section 4.1 is the Ablation study, and Section 4.2 is the result of the rural building detection dataset.
4.1. Ablation Study
An ablation study is carried out to verify the effectiveness of the proposed modules on the results of experiments. This Section introduces the influence of DFF-Net, PAM, and IoU loss function on the R, P, F1, and mAP, respectively.
4.1.1. Effect of DFF-Net
Feature fusion and reducing the SA were effective means to improve building detection. In Table 4, after adding DFF, the mAP increased by 12.03%. We also compared the SF-Net [28]. This method can improve the results of building detection, but it cannot obtain the best detection results. We attribute the improvement in accuracy to our proposed DFM. The feature map F3 obtained by the DFF-Net can better balance semantic information and location information.
Table 4.
In the RD task, the ablation study of each component in our proposed method.
4.1.2. Effect of PAM
As described in Section 2.2.2, the PAM can effectively eliminate the interference of noise information on the network. Compared with the results of various attention mechanisms shown in Table 4, the performance of PAM is better than the other, resulting in a 1.74% increase in network mAP.
4.1.3. Effect of the IoU Loss Function
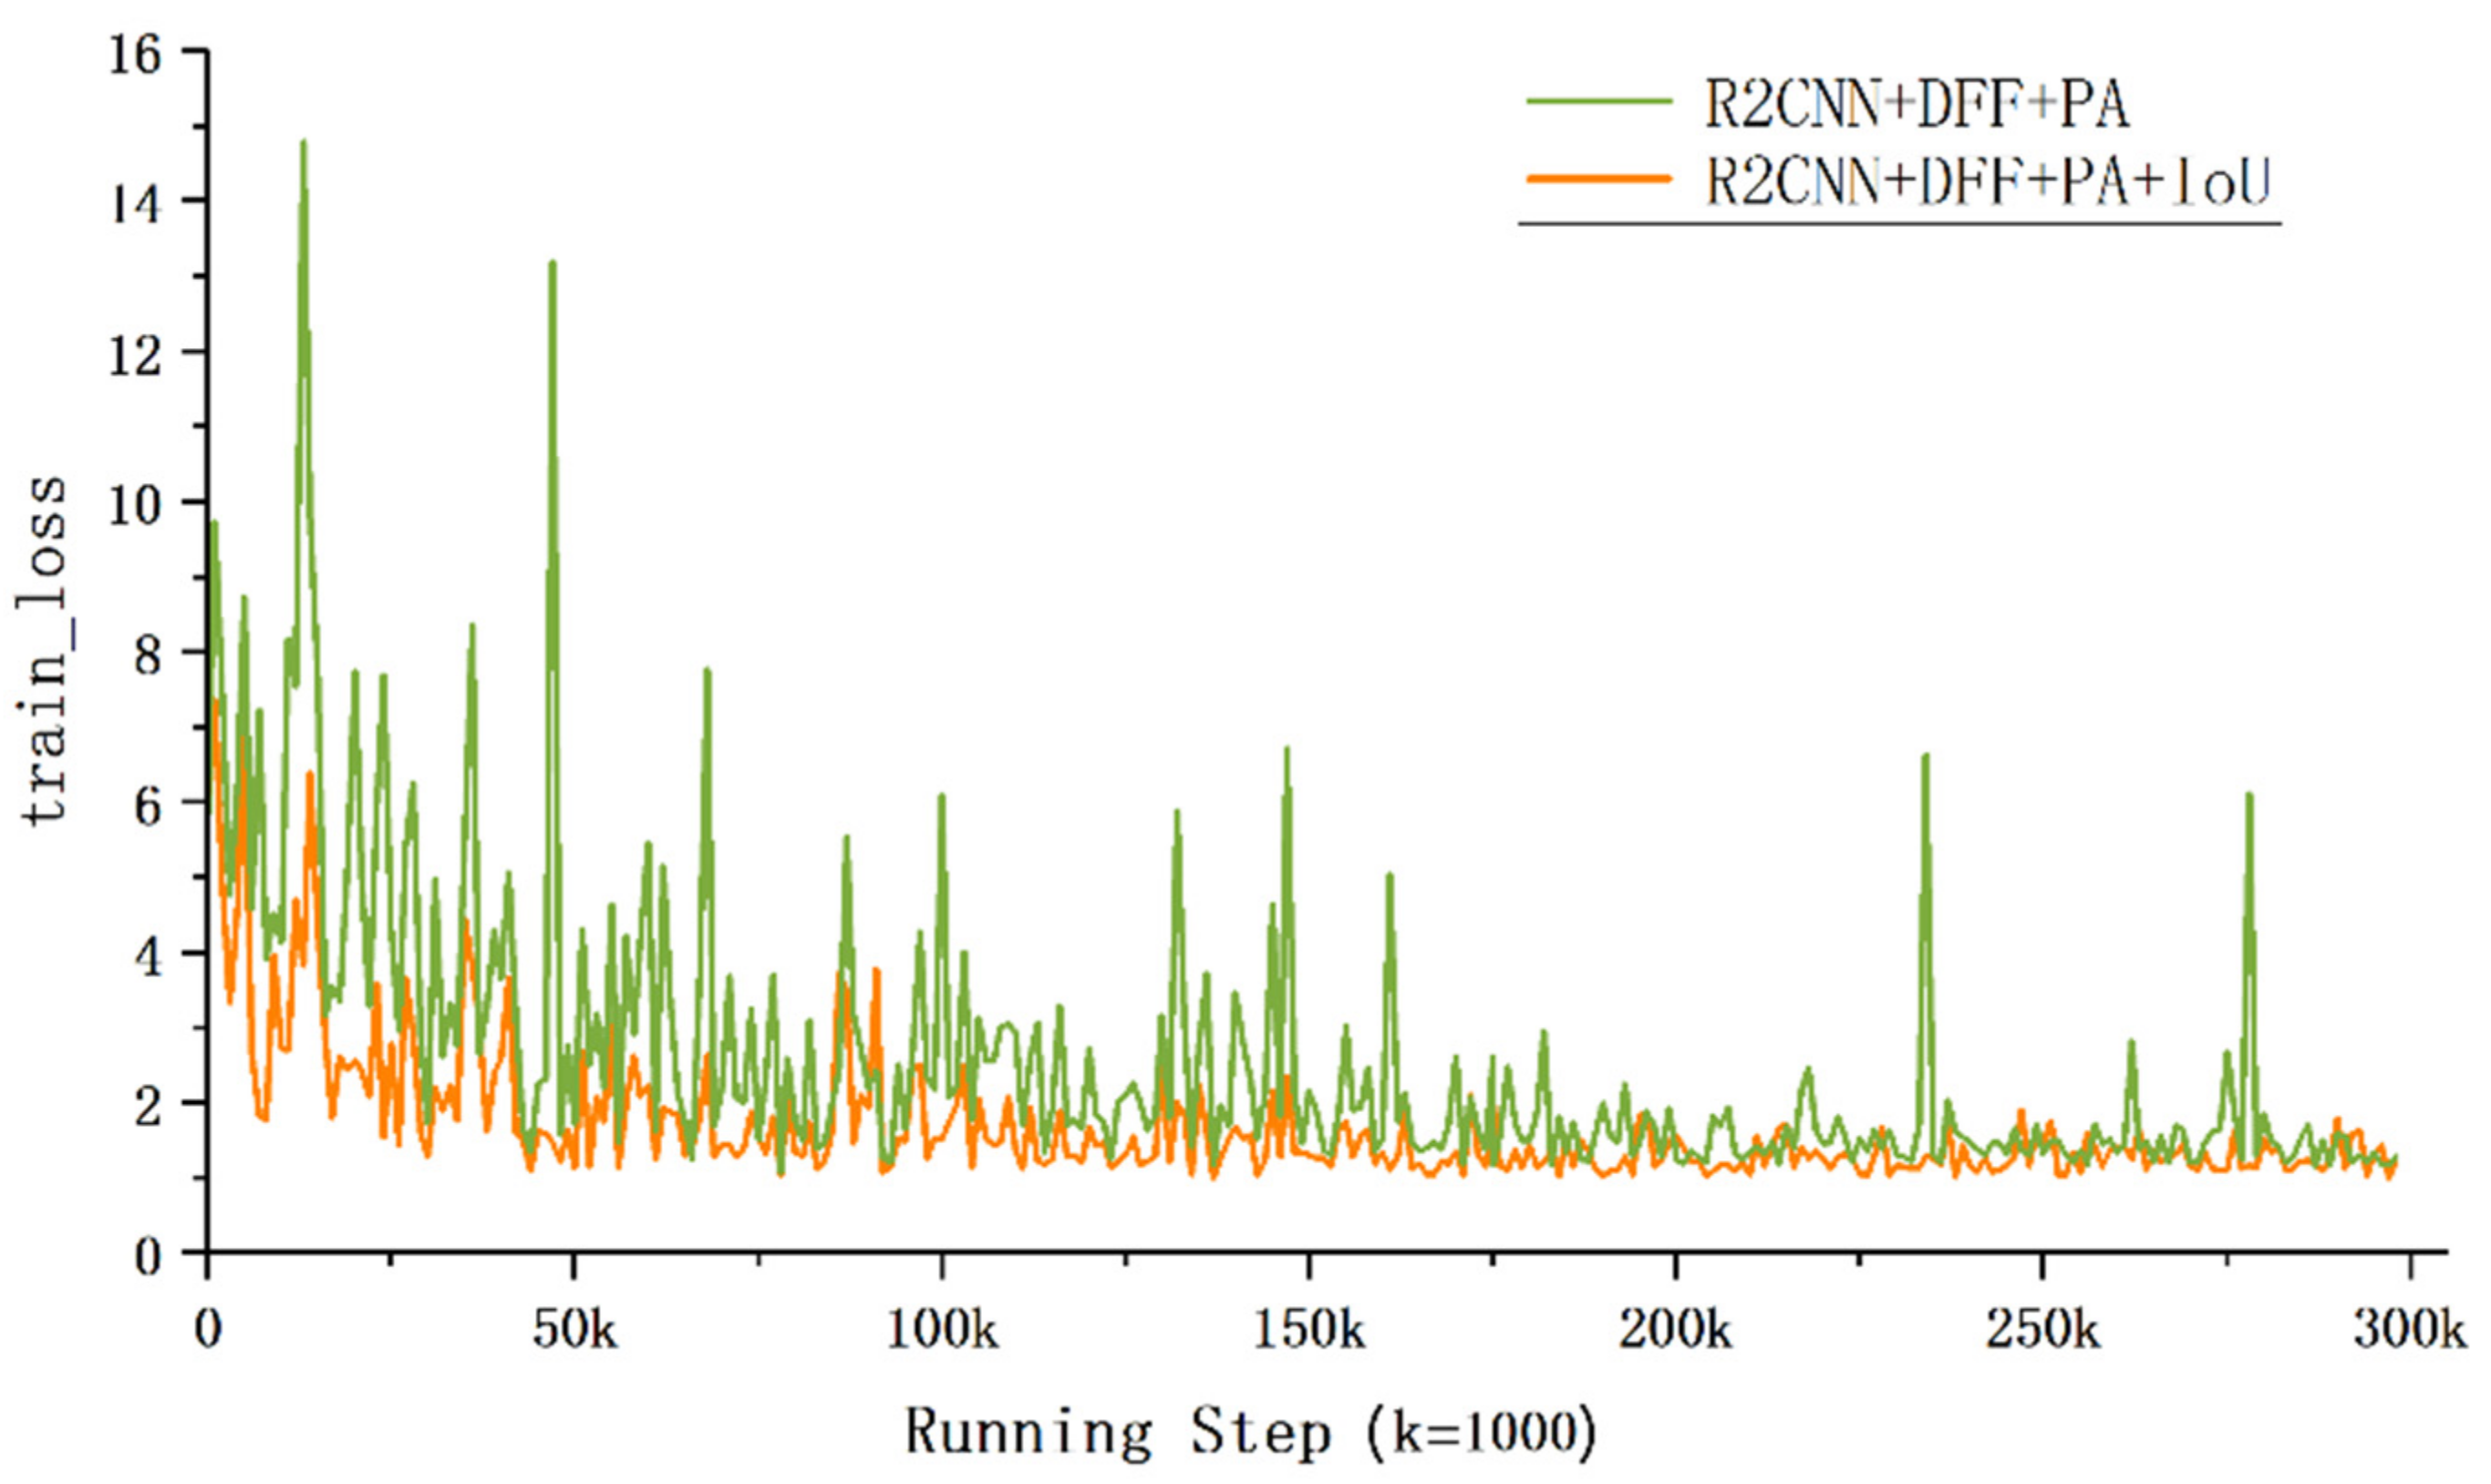
With the IoU loss function, the mAP increased by 1.23%. As shown in Figure 8, it can effectively guide the network to learn and make the model easier to obtain the object coordinates.
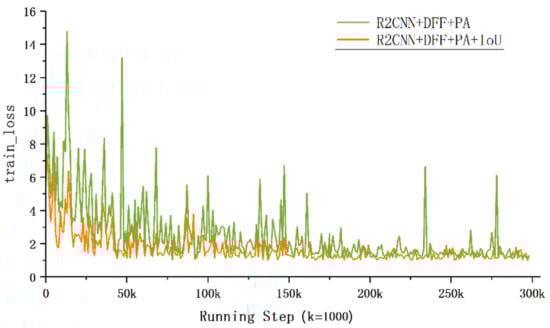
Figure 8.
Different convergence processes of loss value during the training stage.
4.2. Result on the Rural Building Dataset
We compared the model performance on four different models in our dataset: R2CNN [38], R3Det [36], SCRDet [28], and our TRDet model. All experimental data and parameter settings remained the same to validate the ability of models.
4.2.1. RD Task
The purpose of the experiment was to detect the performance of evaluating rotated detection. The experimental results of four models on the validation set are as shown in Table 5. Our proposed TRDet model achieved state-of-the-art performance with a mAP of 83.57%, P of 91.11%, R of 86.5%, and F1 of 88.74%. As shown in Figure 9, our model has great detection results in small and dense buildings. And we can perfectly identify small buildings sandwiched between two large buildings in Figure 9b. Compared with the R2CNN model, our model significantly improved by 15%, 15.54%, 4.01%, and 9.87% in performance indicators, respectively.
Table 5.
Performance comparison of the RD task.
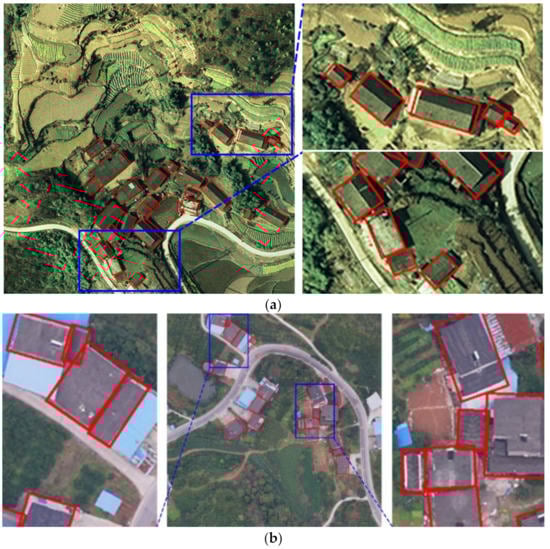
Figure 9.
Example of TRDet model detection results: (a) image for the rural building in Zigui; (b) image for the rural building in Dianjun.
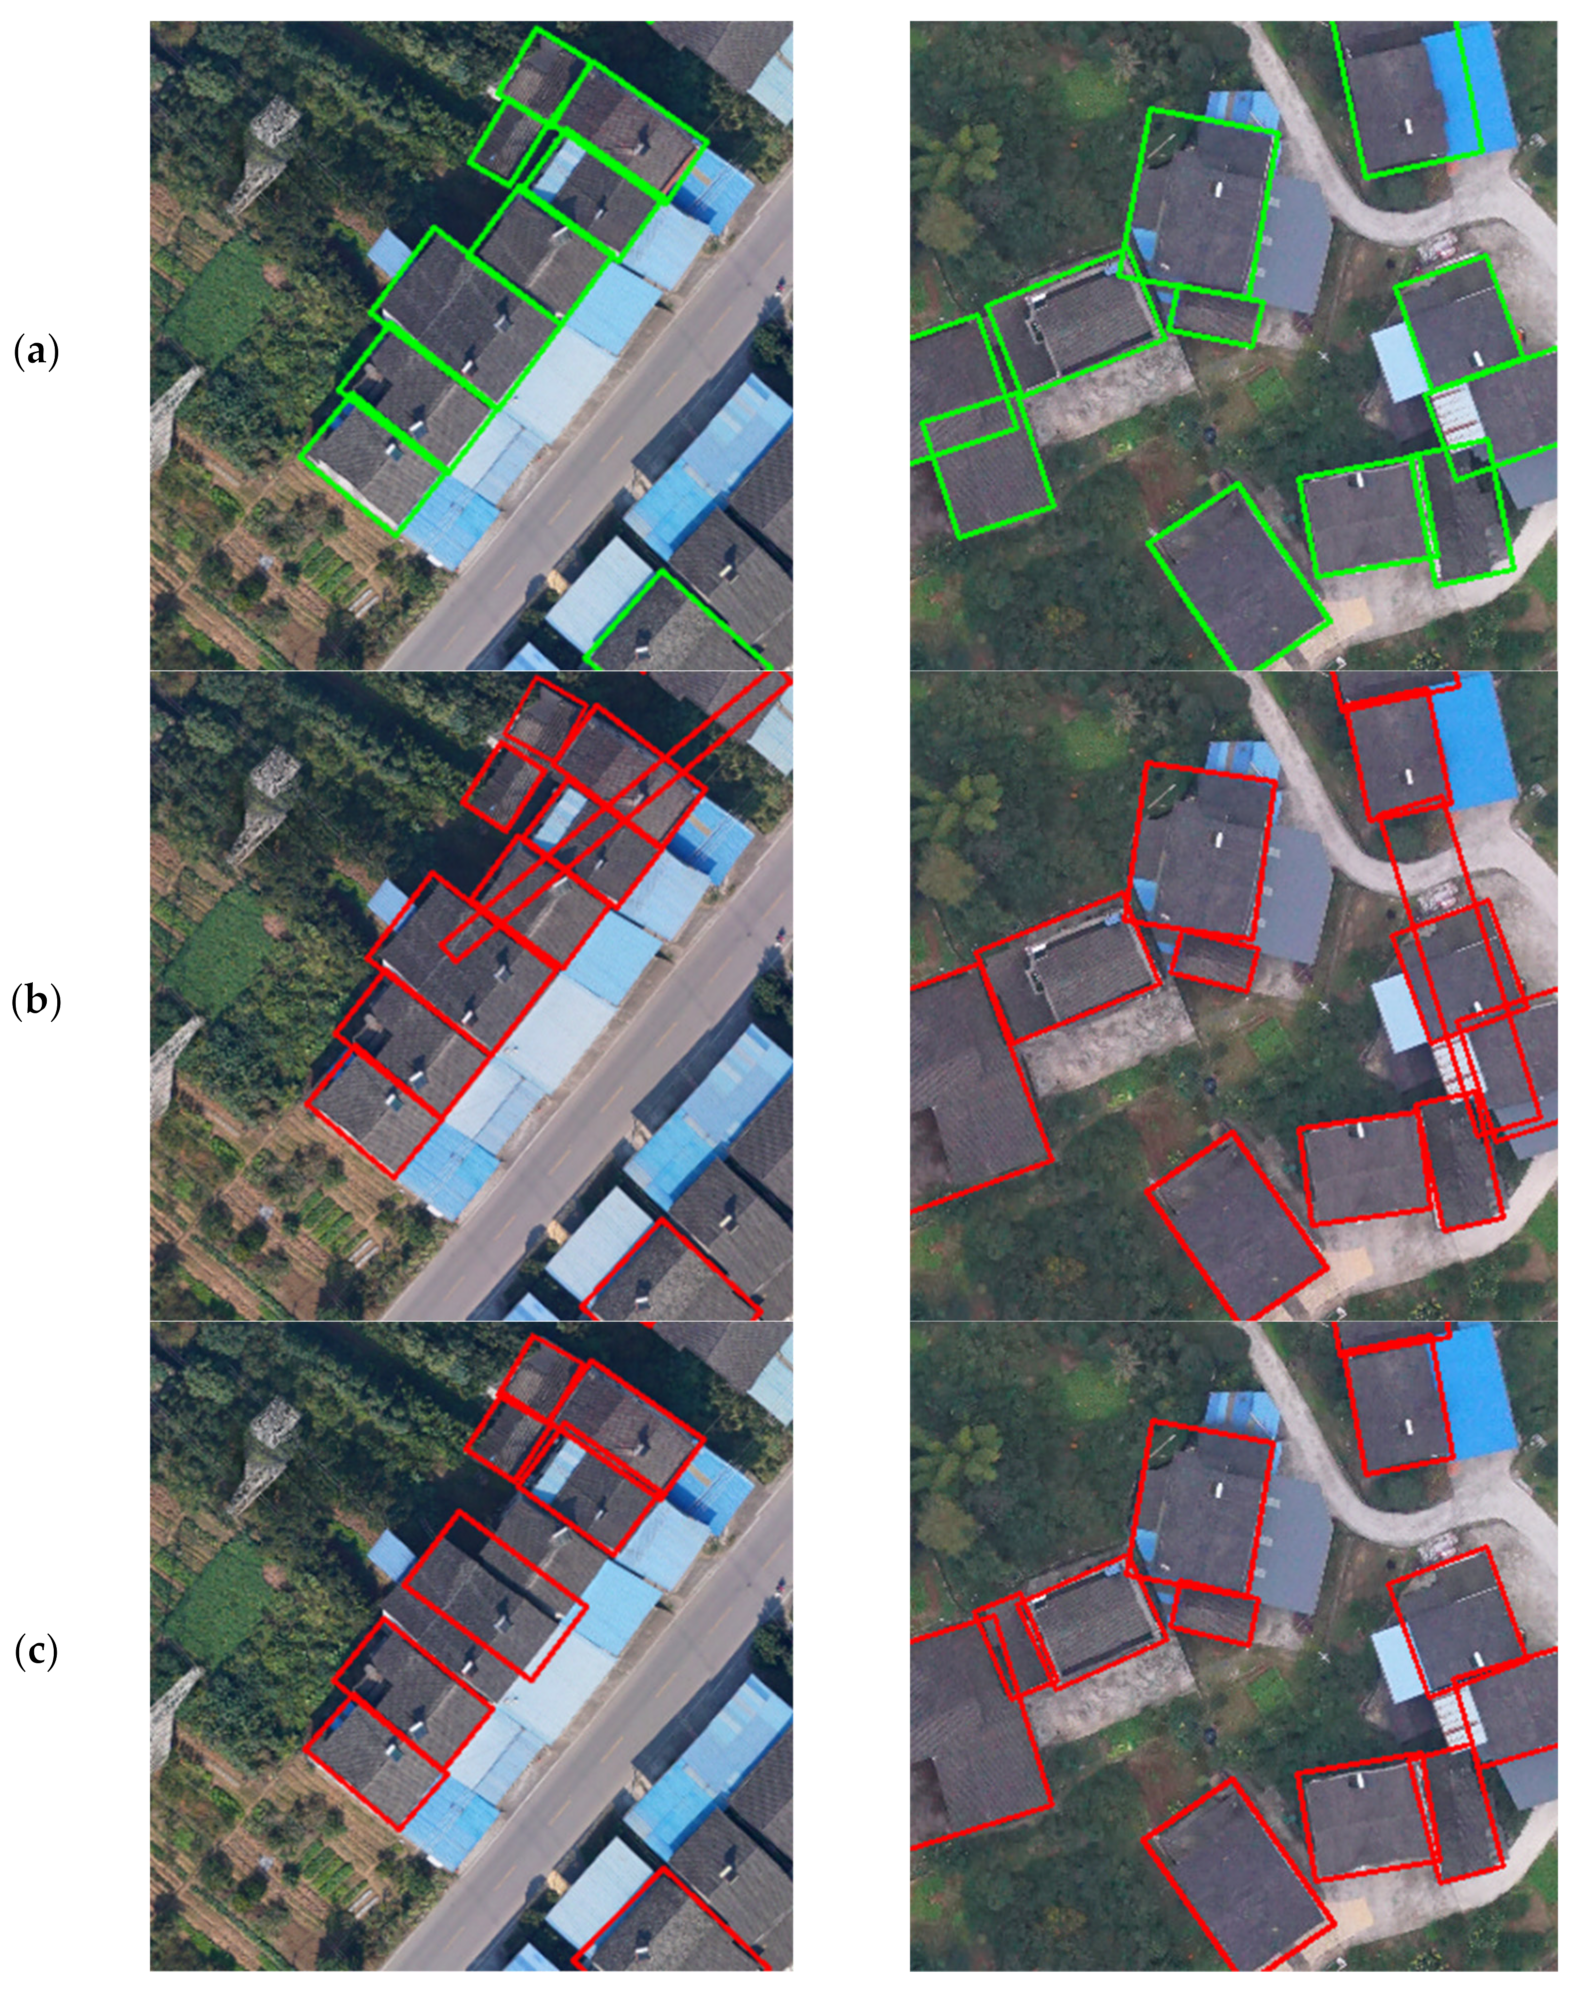
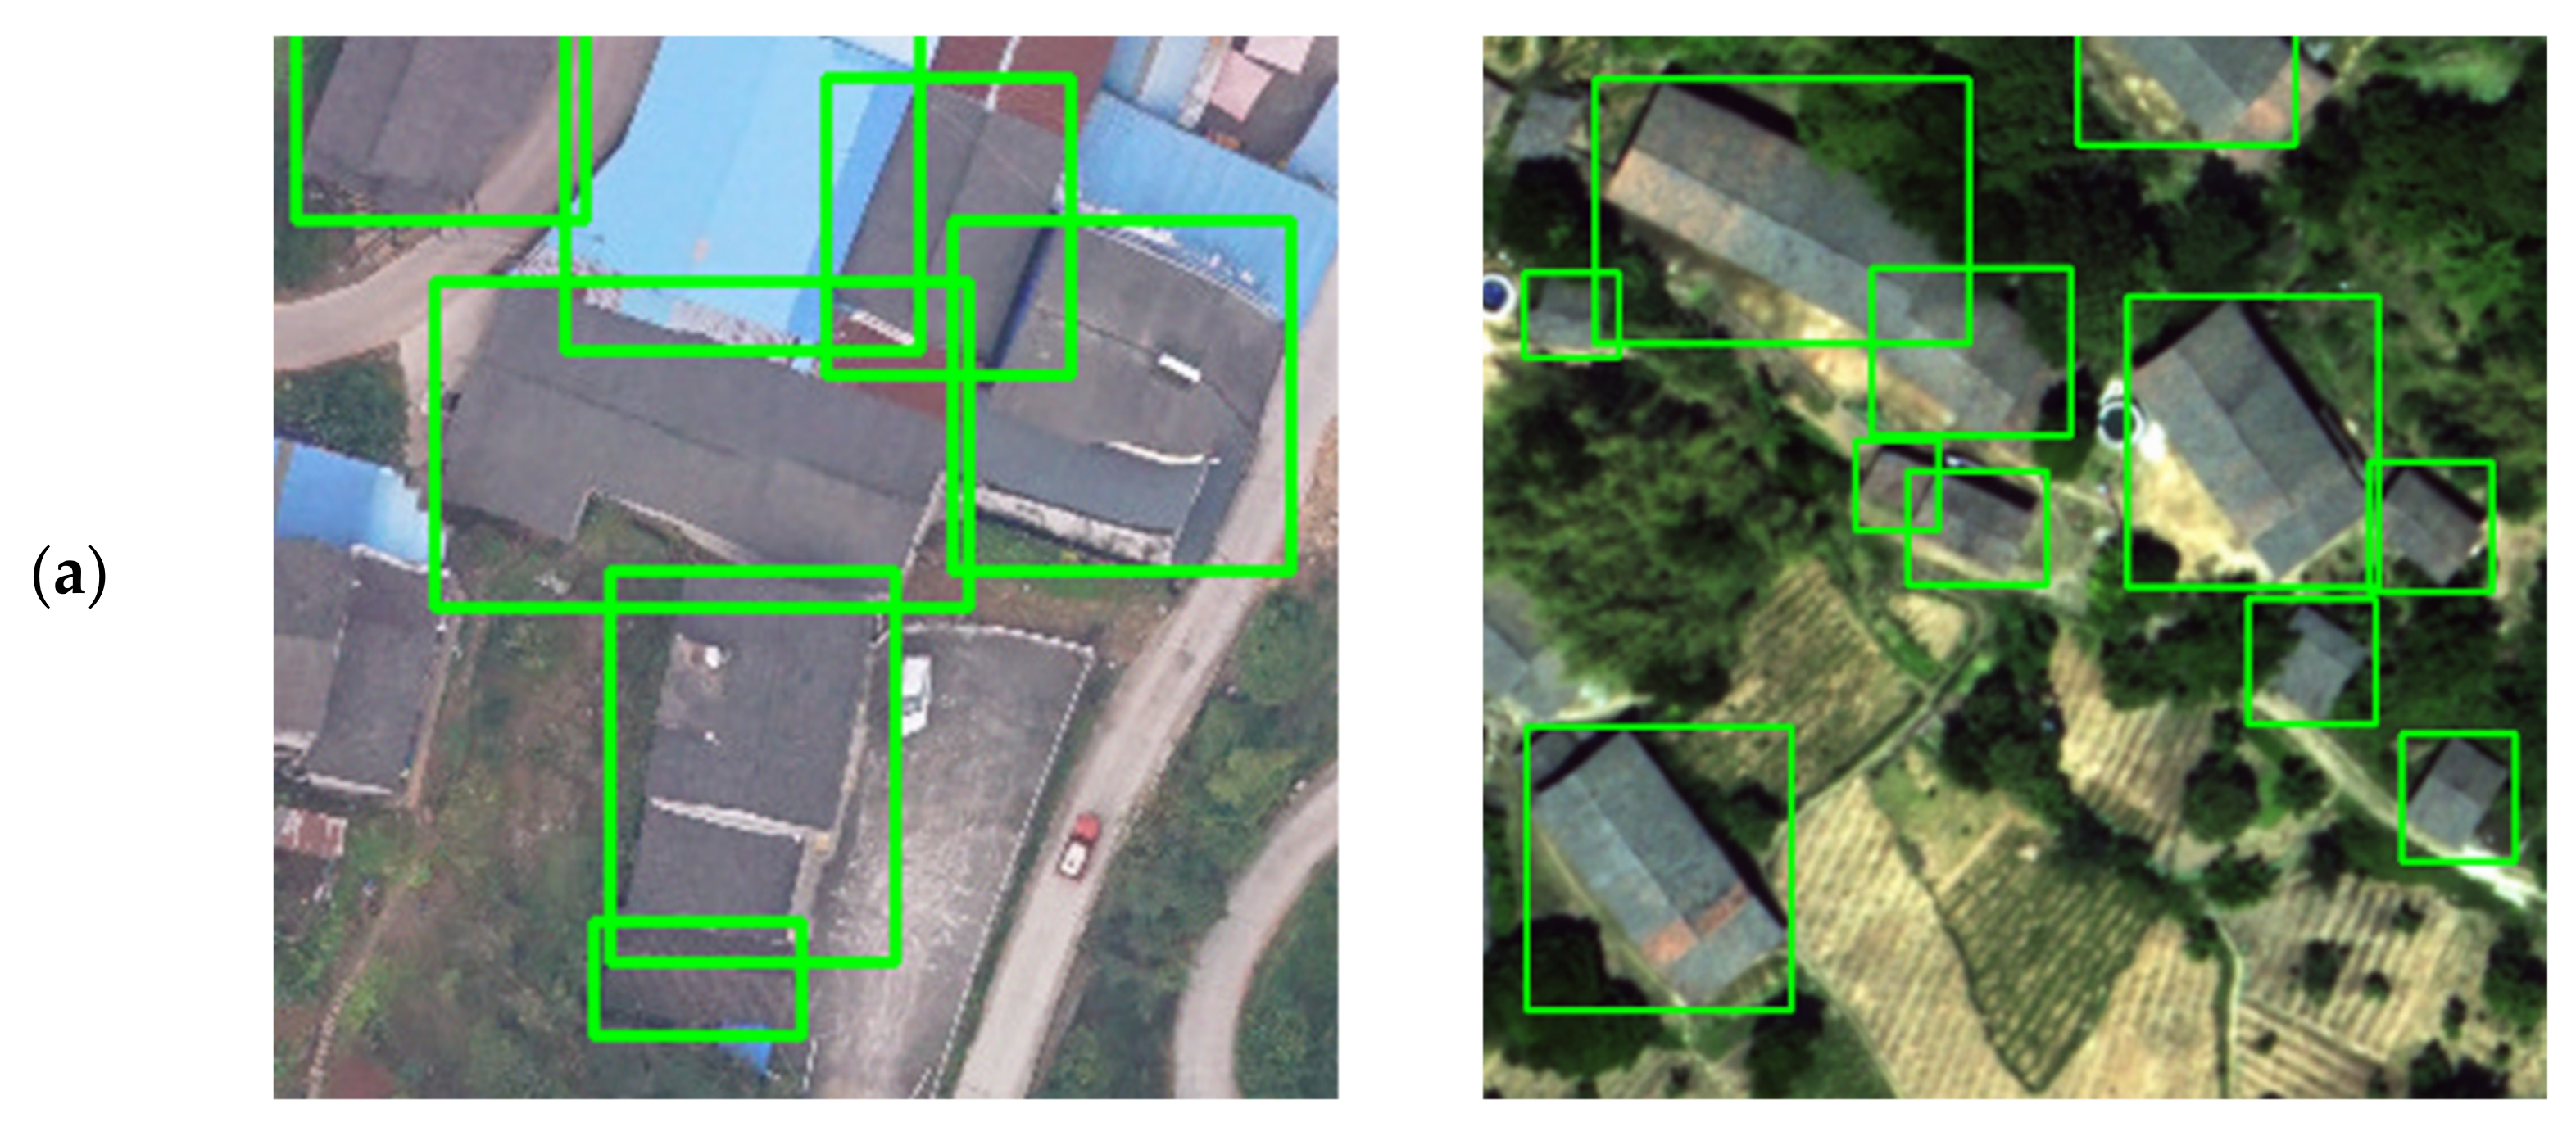
As shown in Figure 10, many small buildings were ignored on R2CNN detection, and even R2CNN identified incorrect fields as buildings. In the first row, the detection result of R2CNN missed the rural building with a special roof, and our model detected this building with high confidence. In the second row, the R2CNN model mistakenly regarded the large truck and canopy as rural buildings, while the TRDet correctly identified them as the background. In the third row, the R2CNN model was not as good as the TRDet in positioning the coordinate edge of rural buildings. In the third and fourth row, the R2CNN model considered arable land as the rural building while the TRDet identified it as the background. The TRDet can also play a good role in complex environments. The detection results prove the superiority of our algorithm.

Figure 10.
Comparison of detection of R2CNN and TRDet: R2CNN ignores many hard samples and identifies incorrect fields as buildings. (a) Are the ground truth bounding boxes of buildings; (b) are the R2CNN detection results; (c) are TRDet detection results.
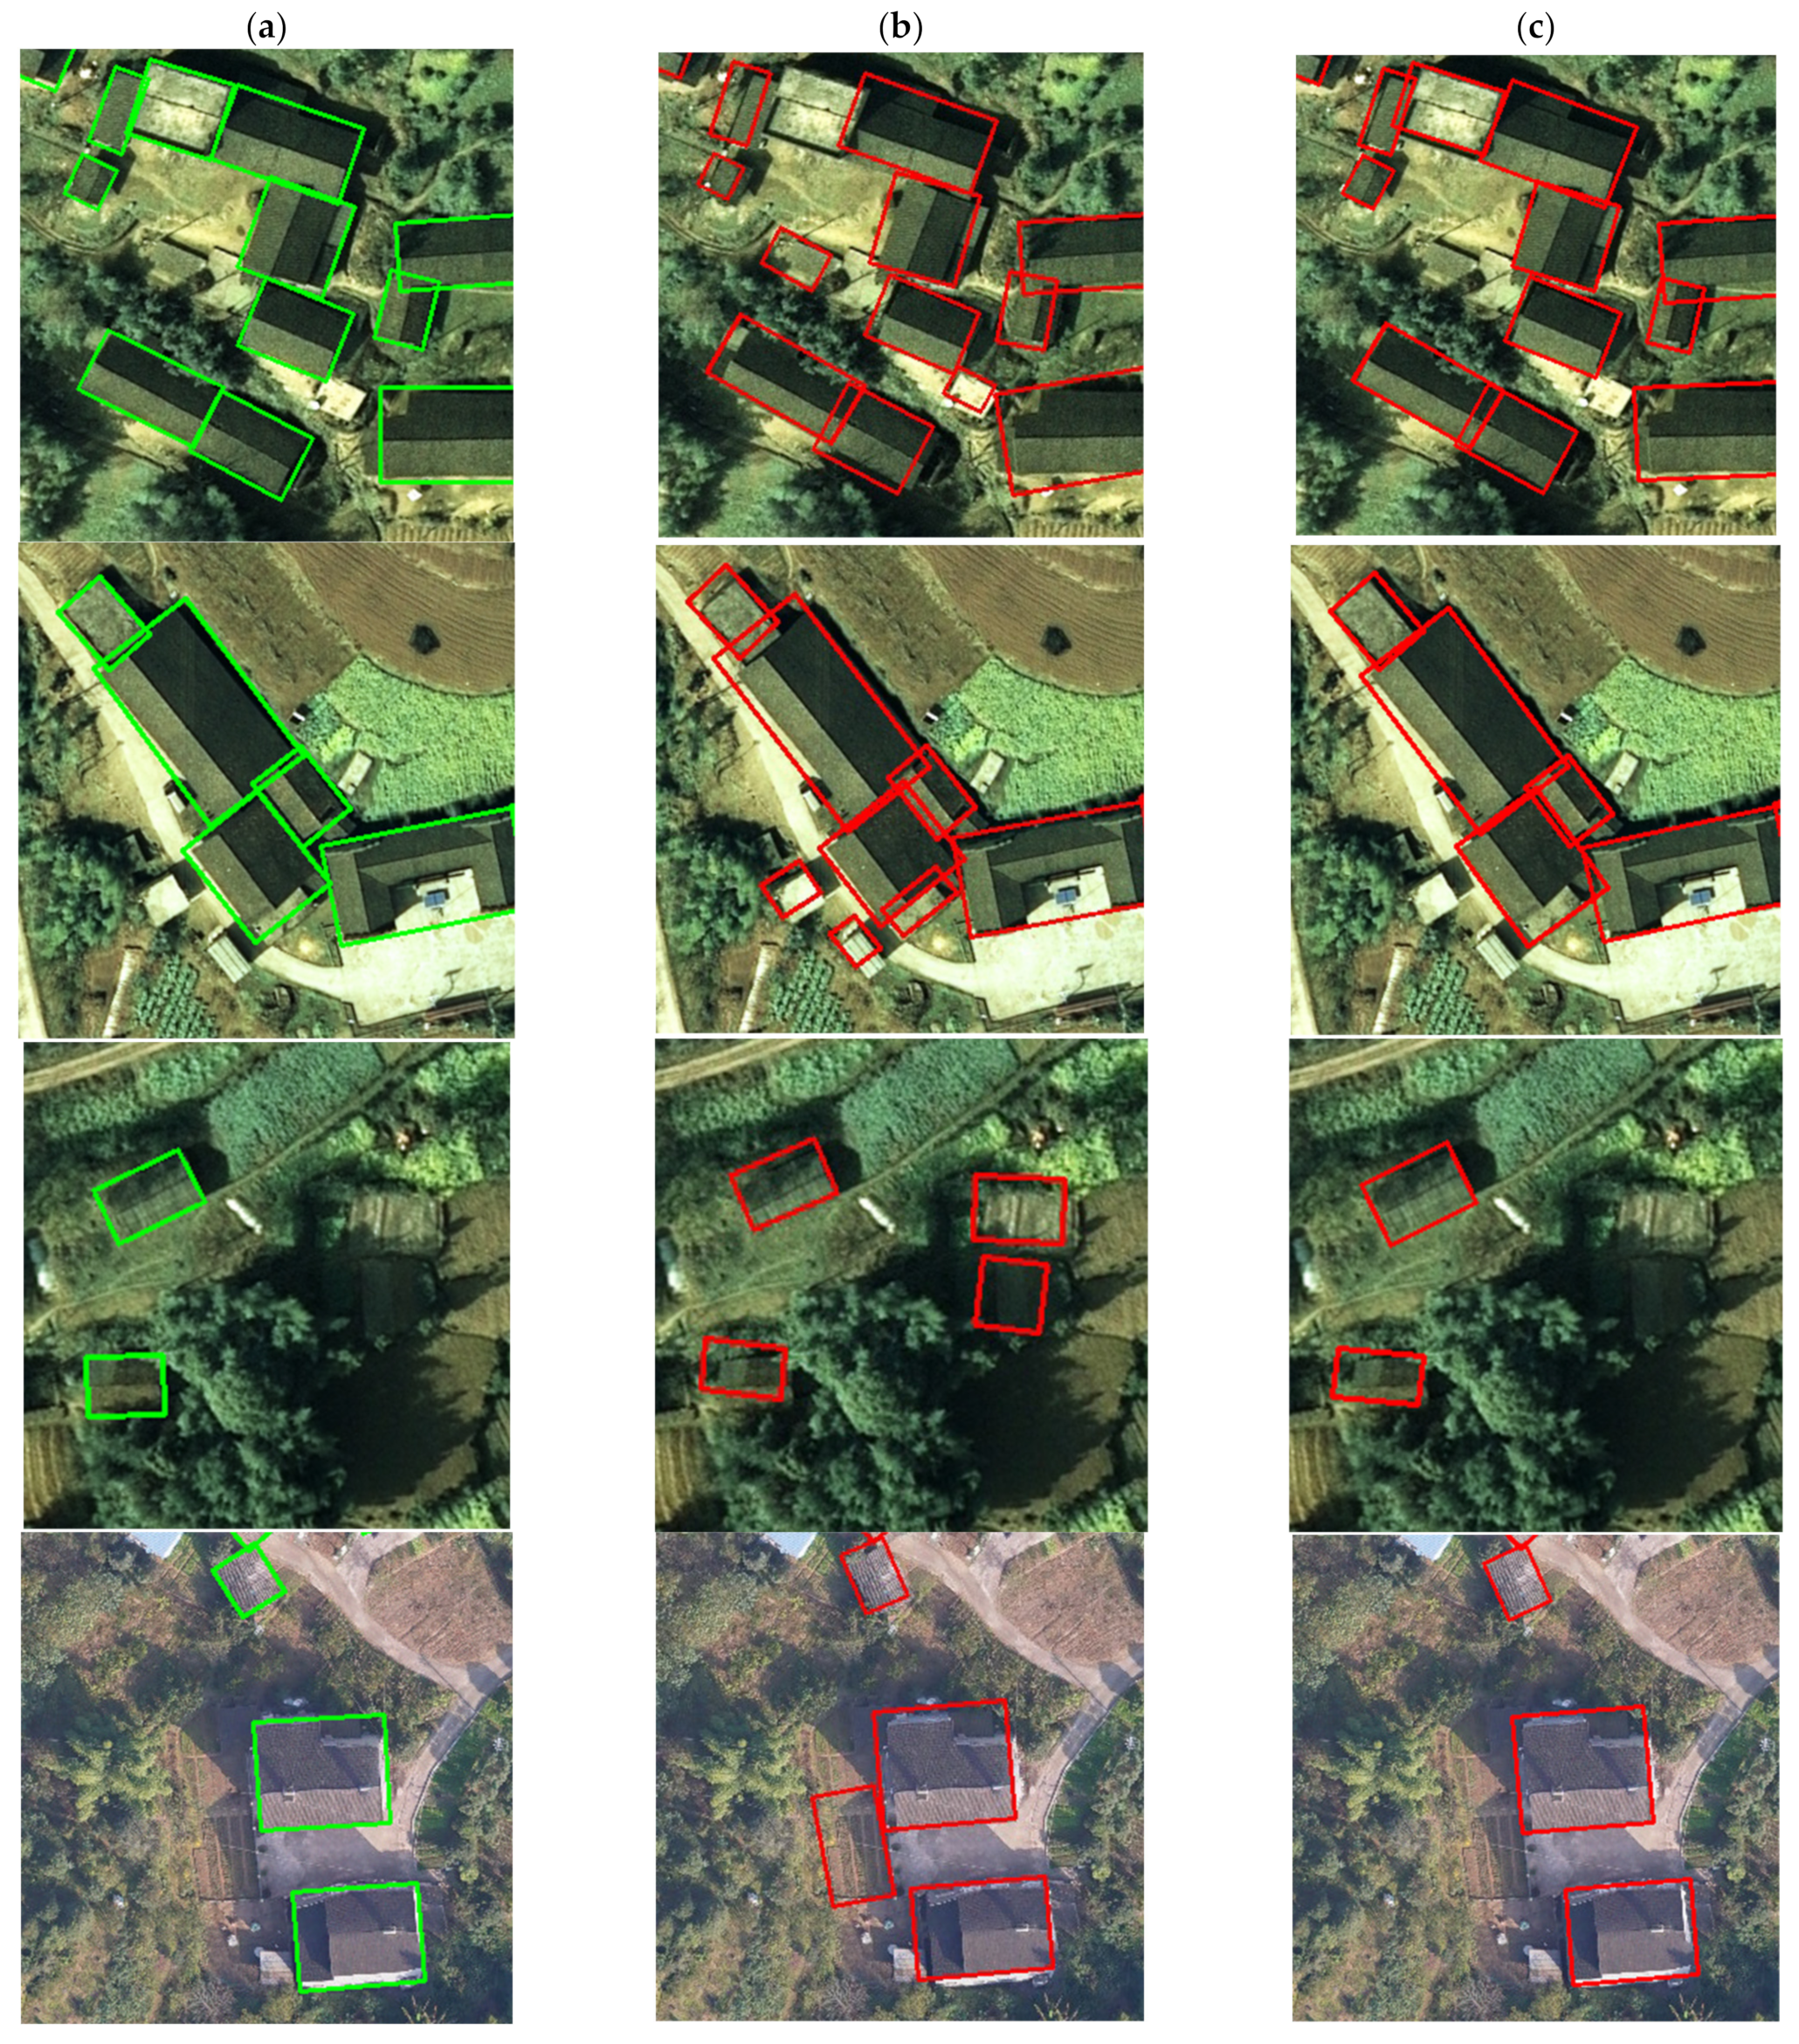
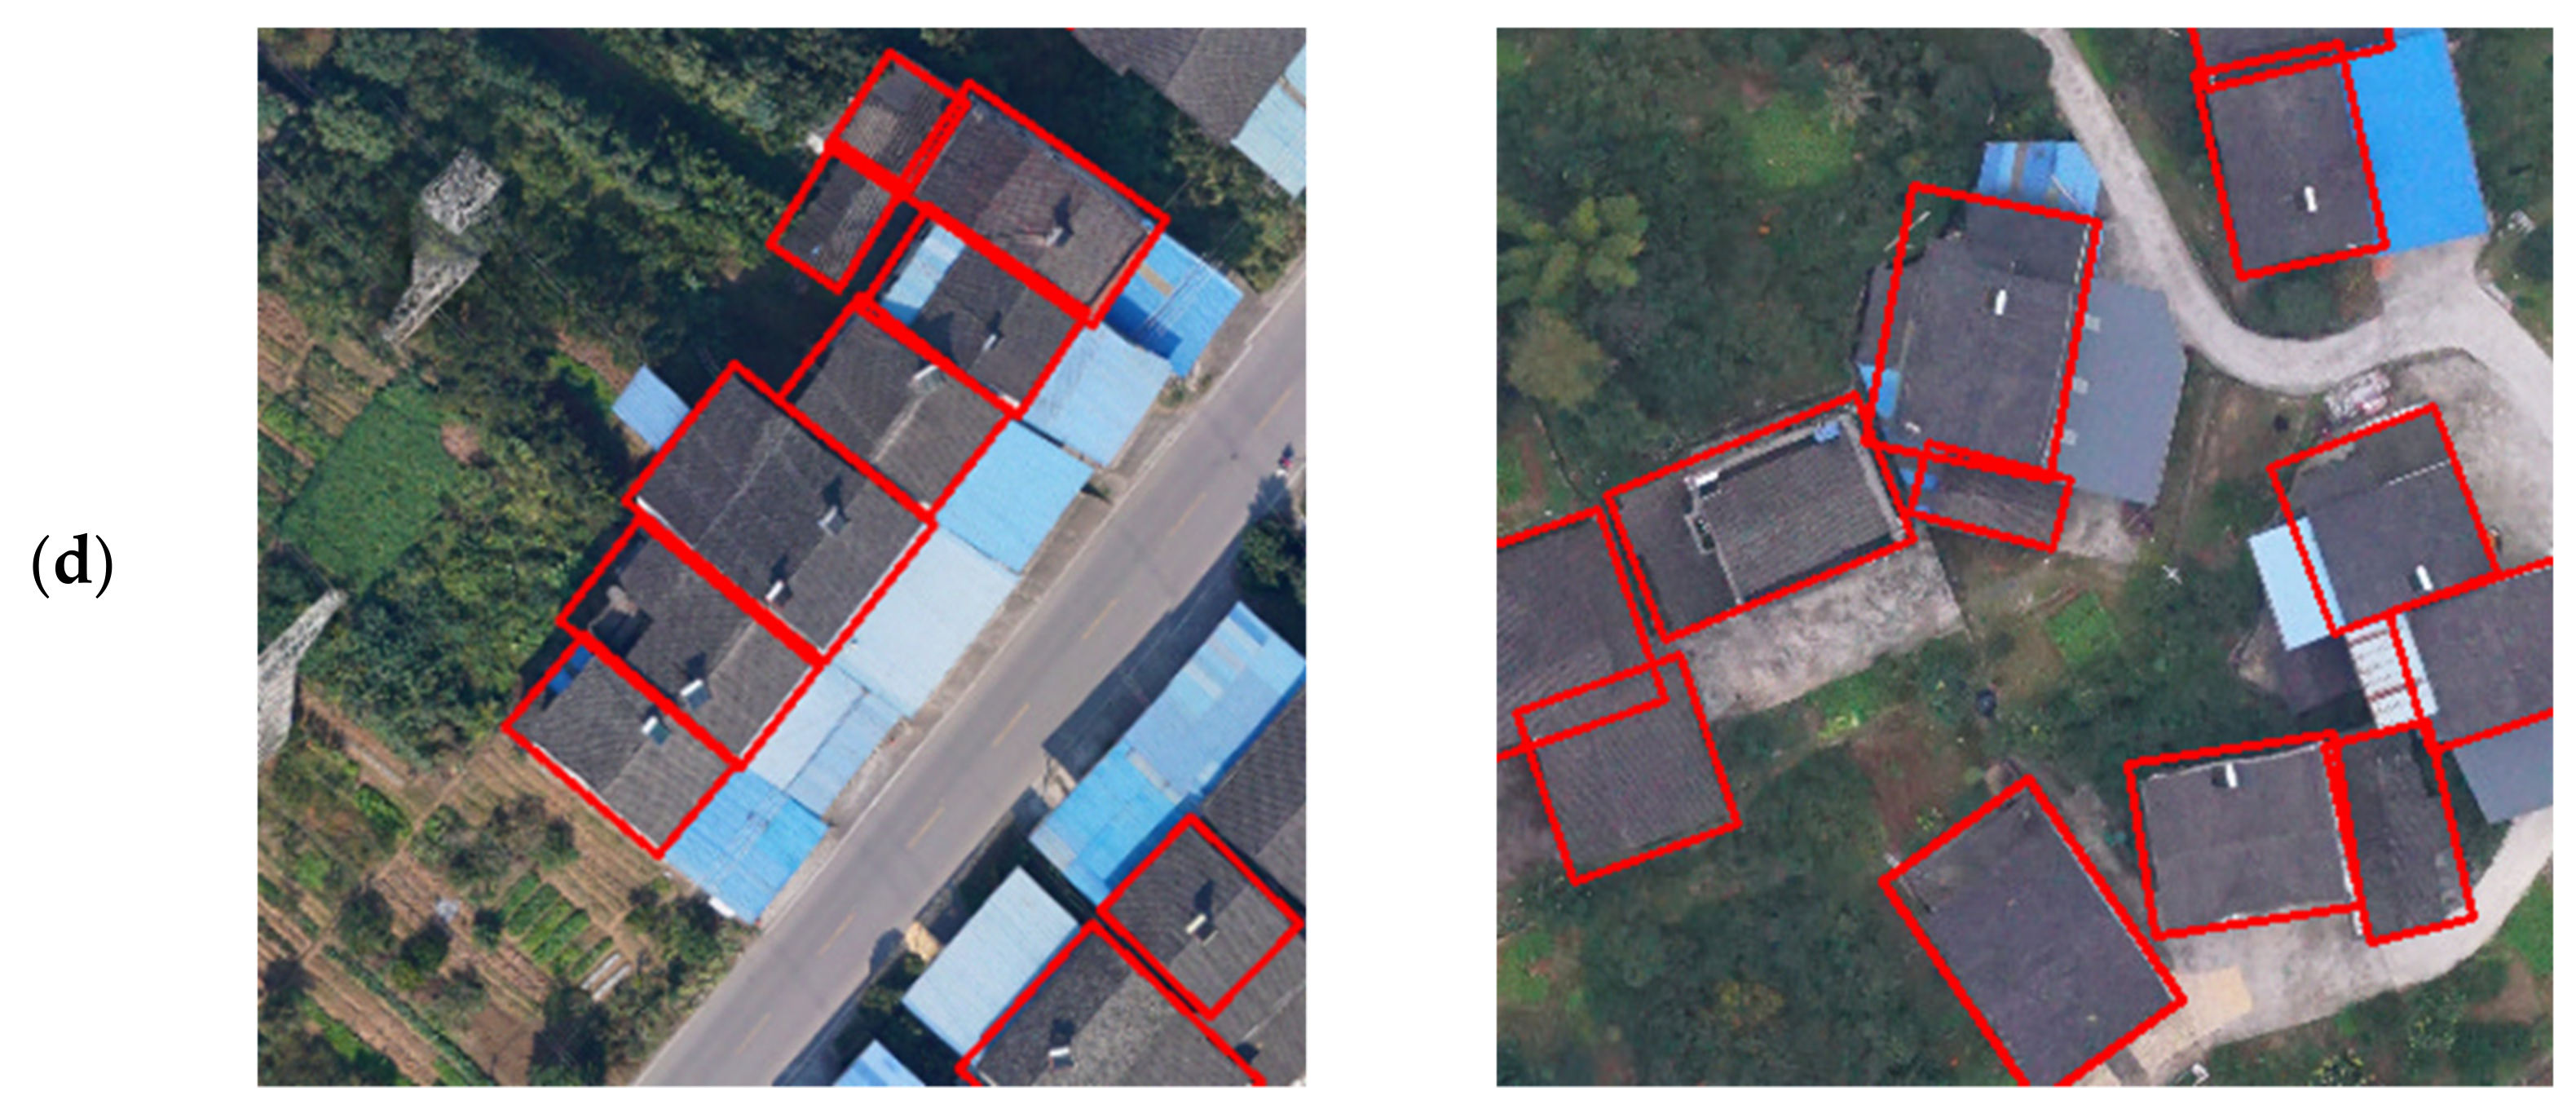
Compared with the SCRDet model, which is an improved R2CNN model, the proposed TRDet model increased by 3.07% of mAP. The mainstream single-stage R3Det model achieved 77.35% of mAP, 82.64% of P, 85.96% of R, and 84.26% of F1. As shown in Figure 11, TRDet worked better than the other two models. In the second row, R3Det had un-suppressed detection boxes with R-NMS in the case of relatively dense buildings. In the third row, R2cnn incorrectly identified two buildings as one. This further proved that our modules could make the network achieve a wonderful recognition effect in difficult scenarios.
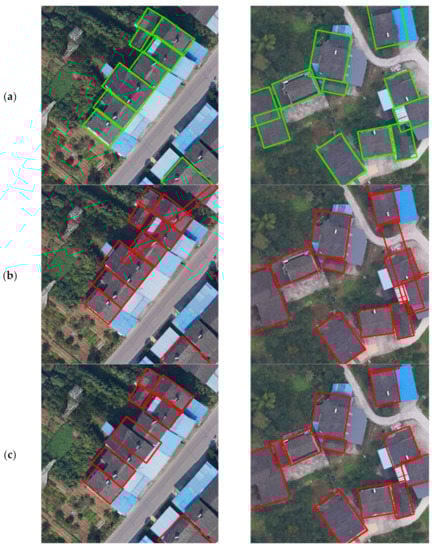

Figure 11.
Comparison of detection of R3Det, SCRDet, and TRDet: TRDet has better performance in detecting dense buildings. (a) Represents the ground truth; (b) represents the R3Det detection results; (c) denotes SCRDet detection results; (d) denotes TRDet detection results.
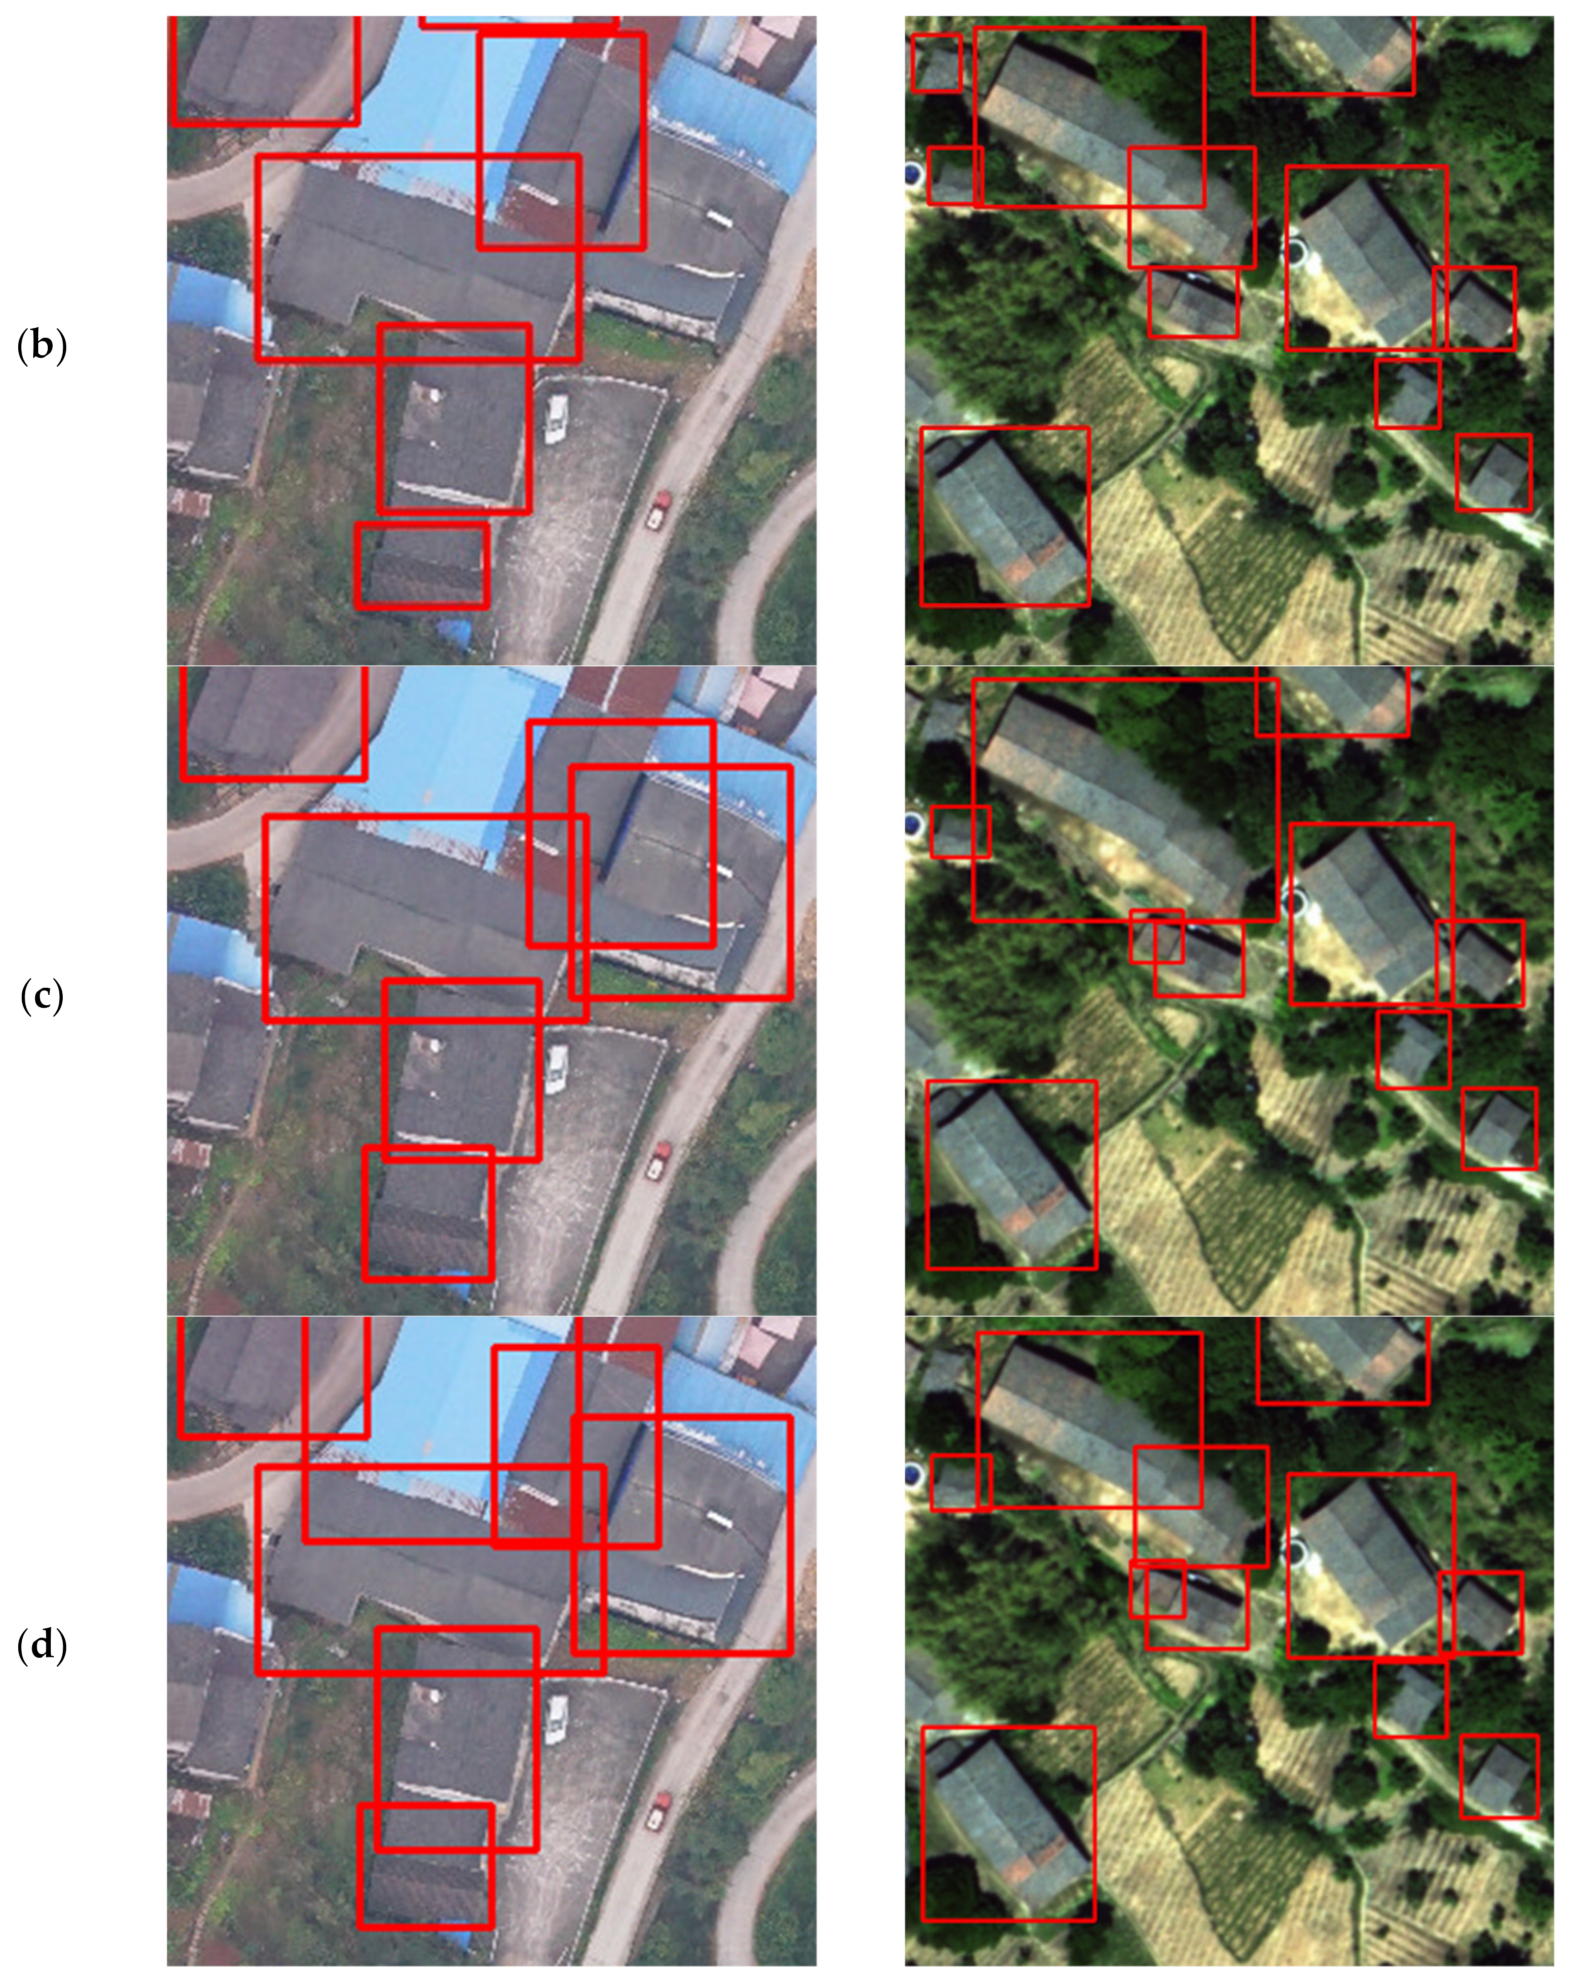
4.2.2. HD Task
This experiment detects the performance of evaluating horizontal detection. The results of the HD task in three models are shown in Table 6, our model also achieves the best performance, and the scores of mAP, P, R, and F1 reach 86.21%, 91.11%, 88.77%, and 89.92%, respectively. As shown in Figure 12, the detection results of the HD box contain a large amount of useless information, and the detection results in dense scenes are messy and difficult to identify. R2CNN missed many objects, and the performance of the SCRDet was also unsatisfactory.
Table 6.
Performance comparison of HD task.
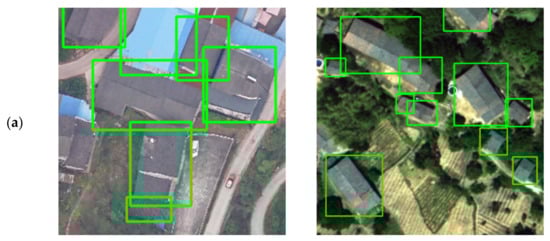
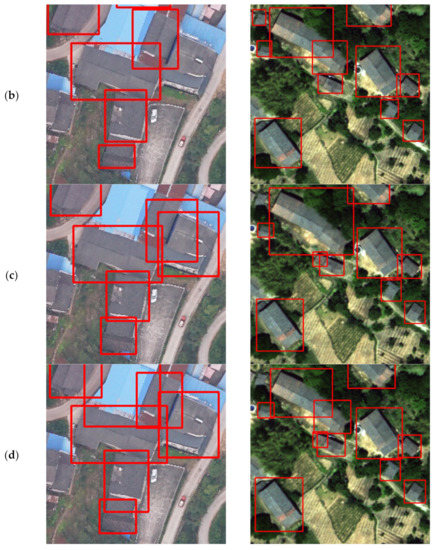
Figure 12.
Comparison of detection of R2CNN, SCRDet, and TRDet: TRDet has better performance in the horizontal detection task. (a) the ground truth; (b) the R2CNN detection results; (c) SCRDet detection results; (d) TRDet detection results.
5. Discussions
5.1. Comparison of Similar Studies and the Contribution of TRDet
The area detected in traditional object detection will contain much background information. Figure 12 shows the result of horizontal bounding box detection. Many limitations will arise in practical applications of this detection result, such as estimating the area of buildings. Rotated object detection can more accurately locate the position information of tilted objects. Dickenson et al. [50] proposed a rotated object detection model based on VGG and BFP, experimented on four cities (Las Vegas, Paris, Shanghai, Khartoum) in the DeepGlobe challenge dataset, obtained in dense scenes building detection results are poor. In this paper, the feature network adopted ResNet to obtain better accuracy. Wen et al. [51] introduced RRPN in Mask RCNN for building rotation detection. Still, RRPN needs to generate enough boxes with different angles in practical applications, resulting in an ample time overhead. If the spacing of the angles increases, the model’s accuracy decreases.
R2CNN is a network converted from Faster-RCNN, which first generates a series of horizontal boxes and then performs rotation regression. However, due to R2CNN directly performing regression and classification in the last layer, the features learned by the network are relatively single, and there is a lot of false detections. In the RD and the HD task, the result of P obtained by TRDet was 15.54% and 7.48% higher than R2CNN, respectively. As a single-stage rotated object detection method, R3Det introduced FRM, and the accuracy was improved compared with other single-stage rotated object detection networks, but the training speed was slow. In the RD task, the mAP of the TRDet method was 15% and 6.22% higher than R2CNN and R3det, respectively.
This paper provides a highly effective method to detect rural buildings with rotated object detection. The proposed methodology can effectively solve that the rotated object detection methods are easy to lose location information of small objects in advanced feature maps and sensitive to noise. SCRDet is also a method to improve network accuracy through feature fusion and attention model, but TRDet obtains 3.07% higher mAP in the RD task. As shown in Figure 9, we can observe from the experimental results that TRDet had effective detection performance on small and dense rural buildings.
5.2. Comparison of Different Models
As in Section 4.1, we compared similar models to demonstrate the effectiveness and superiority of our method, and the experimental results are satisfactory. The proposed methods have the following three advantages:
- In rural building detection, the size of buildings may vary greatly due to different altitudes. The proposed DFF-Net can extract the rural buildings of different scales. Different from the traditional feature fusion methods, the feature map by DFM integrates the information of two scales. Compared with ordinary channel expansion, D better balances the semantic information and location informants and obtains a larger receptive field. As a common feature extraction network, FPN has a complex structure and large parameters. In the HD task, the mAP of the TRDet method was 11.64% higher than FPN, the P was close, and the R was 12.89% different. The DFF-Net used the feature maps of C3 and C4 layers to ignore the bottom other less relevant features and only increased a small number of parameters. In Table 4, the mAP of our DFF-Net was 3.03% higher than that of SF-Net. We attribute the improvement in accuracy to our proposed DFM. As shown in Figure 10, the proposed model DFF-Net can perfectly fit the contours of large buildings and can also capture small buildings.
- The noise in remote sensing images will affect the model in the training phase, resulting in false detection and missed detection. The attention mechanism is a common method to alleviate noise interference. However, not all attention mechanisms are effective for it. In Section 4.1.2, we can see that the accuracy decreased by 1.24% after adding SE [46] (a typical channel attention module). The MDA [28] using channel attention was also unsatisfactory. Specifically, channel attention assigns different weights to each channel, which improves the weights of simple samples and ignores the information of hard samples. It leads to the accuracy of hard samples detections reduces. The PAM module was utilized to assign the supervised weights for each pixel to control the scores of generated feature maps from zeros to one, which reduced the noise influence, enhanced the information of target objects, and did not eliminate the non-object information. Therefore, it had great proficiency in alleviating problems with false detections and missed detections. In Figure 12, SCRDet cannot effectively distinguish the boundary between two buildings in the case of dense buildings.
- Due to the periodicity of angle, the traditional smooth L1 function is prone to sudden increase. Therefore, the IoU loss in this paper under the boundary condition, , can eliminate this surge. As shown in Figure 8, the IoU loss can accurately evaluate the loss of the prediction box relative to the true box in the training process.
5.3. Future Work
In this paper, the model is trained with an image size of pixels, so it is necessary to cut images to the required size. However, this may cause some buildings to be divided into multiple parts. Figure 11d shows the proposed method can find incomplete buildings, but the confidence of such objects is lower than common buildings. Therefore, it is only necessary to reasonably set the screening conditions of the confidence level, and the false detection phenomenon can be effectively avoided. In the actual test, changing the repetition rate of the cropped image according to the resolution size can also avoid the missed detection phenomenon in this case.
Building extraction is still an open problem that needs more research. In the future, we will plan to establish a larger dataset, including common buildings, buildings under construction, buildings with special shapes, and buildings with complex backgrounds, then design and train special networks to detect these buildings.
6. Conclusions
This paper presents a two-stage rotated object detection model for rural buildings based on deep feature fusion and pixel attention modules. Compared with R2CNN networks, our DFF-Net can effectively increase the size of the receptive field and fuse the characteristic information at different scales, and use PAM to eliminate the interference of noise information to the network. Experiment results on a newly collected large remote sensing dataset with diverse rural buildings under complex backgrounds show that each module has played an effective role, and our TRDet network model achieves good recognition results; it improves the mAP by 15% and achieves good performance in rural building detection. Future work can be focused on how to improve the speed of model training and the generalization ability of the network. In addition, we will also try to extend our rural building detection model to other object detection.
Author Contributions
All authors contributed in a substantial way to the manuscript. B.P. conceived, designed, and performed the research and wrote the manuscript. D.R., C.Z. and A.L. made contributions to the design of the research and data analysis. All authors discussed the basic structure of the manuscript. All authors have read and agreed to the published version of the manuscript.
Funding
This work was supported in part by the National Key Research and Development Program of China under Grant 2016YFD0800902, and the National Natural Science Foundation of China under Grant 41901341.
Institutional Review Board Statement
Not applicable.
Informed Consent Statement
Not applicable.
Data Availability Statement
The data are not publicly available because it is commercial data. The code and model are available at https://github.com/xxx0320/TRDet.git (accessed on 26 December 2021).
Acknowledgments
This paper has been supported by the China Three Gorges University and the Hubei Engineering Technology Research Center for Farmland Environmental Monitoring.
Conflicts of Interest
The authors declare that they have no known competing financial interests or personal relationships that could have appeared to influence the work reported in this paper.
References
- Zhu, Y.; Luo, P.; Zhang, S.; Sun, B. Spatiotemporal Analysis of Hydrological Variations and Their Impacts on Vegetation in Semiarid Areas from Multiple Satellite Data. Remote Sens. 2020, 12, 4177. [Google Scholar] [CrossRef]
- Duan, W.; Maskey, S.; Chaffe, P.; Luo, P.; He, B.; Wu, Y.; Hou, J. Recent advancement in remote sensing technology for hydrology analysis and water resources management. Remote Sens. 2021, 13, 1097. [Google Scholar] [CrossRef]
- Modica, G.; De Luca, G.; Messina, G.; Praticò, S. Comparison and assessment of different object-based classifications using machine learning algorithms and UAVs multispectral imagery: A case study in a citrus orchard and an onion crop. Eur. J. Remote Sens. 2021, 54, 431–460. [Google Scholar] [CrossRef]
- Parks, S.A.; Holsinger, L.M.; Koontz, M.J.; Collins, L.; Whitman, E.; Parisien, M.-A.; Loehman, R.A.; Barnes, J.L.; Bourdon, J.-F.; Boucher, J.; et al. Giving Ecological Meaning to Satellite-Derived Fire Severity Metrics across North American Forests. Remote Sens. 2019, 11, 1735. [Google Scholar] [CrossRef] [Green Version]
- Weiers, S.; Bock, M.; Wissen, M.; Rossner, G. Mapping and indicator approaches for the assessment of habitats at different scales using remote sensing and GIS methods. Landsc. Urban Plan. 2004, 67, 43–65. [Google Scholar] [CrossRef]
- Solano, F.; Colonna, N.; Marani, M.; Pollino, M. Geospatial analysis to assess natural park biomass resources for energy uses in the context of the rome metropolitan area. In International Symposium on New Metropolitan Perspectives; Springer: Cham, Switzerland, 2019; Volume 100, pp. 173–181. [Google Scholar]
- Esch, T.; Heldens, W.; Hirner, A.; Keil, M.; Marconcini, M.; Roth, A.; Zeidler, J.; Dech, S.; Strano, E. Breaking new ground inmapping human settlements from space–The Global Urban Footprint. ISPRS J. Photogramm. Remote Sens. 2017, 134, 30–42. [Google Scholar] [CrossRef] [Green Version]
- Fang, L. Study on Evolution Process and Optimal Regulation of Rural Homestead in Guangxi Based on the Differentiation of Farmers’ Livelihoods. Master’s Thesis, Nanning Normal University, Nanning, China, 2019. [Google Scholar]
- Zheng, W. Design and Implementation of Rural Homestead Registration Management System. Master’s Thesis, University of Electronic Science and Technology of China, Chengdu, China, 2012. [Google Scholar]
- Wei, X.; Wang, N.; Luo, P.; Yang, J.; Zhang, J.; Lin, K. Spatiotemporal Assessment of Land Marketization and Its Driving Forces for Sustainable Urban–Rural Development in Shaanxi Province in China. Sustainability 2021, 13, 7755. [Google Scholar] [CrossRef]
- Li, L.; Zhu, J.; Cheng, G.; Zhang, B. Detecting High-Rise Buildings from Sentinel-2 Data Based on Deep Learning Method. Remote Sens. 2021, 13, 4073. [Google Scholar] [CrossRef]
- Ji, M.; Liu, L.; Buchroithner, M. Identifying Collapsed Buildings Using Post-Earthquake Satellite Imagery and Convolutional Neural Networks: A Case Study of the 2010 Haiti Earthquake. Remote Sens. 2018, 10, 1689. [Google Scholar] [CrossRef] [Green Version]
- Tian, X.; Wang, L.; Ding, Q. Review of Image Semantic Segmentation Based on Deep Learning. J. Softw. 2019, 30, 440–468. [Google Scholar]
- Boonpook, W.; Tan, Y.; Ye, Y.; Torteeka, P.; Torsri, K.; Dong, S. A Deep Learning Approach on Building Detection from Unmanned Aerial Vehicle-Based Images in Riverbank Monitoring. Sensors 2018, 18, 3921. [Google Scholar] [CrossRef] [PubMed] [Green Version]
- Wu, G.; Shao, X.; Guo, Z.; Chen, Q.; Yuan, W.; Shi, X.; Xu, Y.; Shibasaki, R. Automatic Building Segmentation of Aerial Imagery Using Multi-Constraint Fully Convolutional Networks. Remote Sens. 2018, 10, 407. [Google Scholar] [CrossRef] [Green Version]
- Marin, C.; Bovolo, F.; Bruzzone, L. Building change detection in multitemporal very high resolution SAR images. IEEE Trans. Geosci. Remote Sens. 2014, 53, 2664–2682. [Google Scholar] [CrossRef]
- Saito, S.; Aokiet, Y. Building and road detection from large aerial imagery. In Image Processing: Machine Vision Applications VIII. San Francisco, CA, USA, 27 February 2015; p. 94050. Available online: https://spie.org/Publications/Proceedings/Paper/10.1117/12.2083273?SSO=1 (accessed on 26 December 2021).
- Guo, Z.; Wu, G.; Song, X.; Yuan, W.; Chen, Q.; Zhang, H.; Shi, X.; Xu, M.; Xu, Y.; Shibasaki, R.; et al. Super-Resolution Integrated Building Semantic Segmentation for Multi-Source Remote Sensing Imagery. IEEE Access 2019, 7, 99381–99397. [Google Scholar] [CrossRef]
- Chen, J.; Wang, C.; Zhang, H.; Wu, F.; Zhang, B.; Lei, W. Automatic Detection of Low-Rise Gable-Roof Building from Single Submeter SAR Images Based on Local Multilevel Segmentation. Remote Sens. 2017, 9, 263. [Google Scholar] [CrossRef] [Green Version]
- Prathap, G.; Afanasyev, I. Deep learning approach for building detection in satellite multispectral imagery. In Proceedings of the 2018 International Conference on Intelligent Systems (IS), Funchal, Portugal, 25–27 September 2018; pp. 461–465. [Google Scholar]
- He, K.; Gkioxari, G.; Dollár, P.; Girshick, R. Mask R-CNN. In Proceedings of the IEEE International Conference on Computer Vision and Pattern Recognition, Honolulu, HI, USA, 21–26 July 2017; pp. 2961–2969. [Google Scholar]
- Zhang, L.; Wu, J.; Fan, Y.; Gao, H.; Shao, Y. An Efficient Building Extraction Method from High Spatial Resolution Remote Sensing Images Based on Improved Mask R-CNN. Sensors 2020, 20, 1465. [Google Scholar] [CrossRef] [PubMed] [Green Version]
- Li, D.; He, W.; Guo, B.; Li, M.; Chen, M. Building target detection algorithm based on Mask-RCNN. Sci. Surv. Mapp. 2019, 44, 172–180. [Google Scholar]
- Han, Q.; Yin, Q.; Zheng, X.; Chen, Z. Remote sensing image building detection method based on Mask R-CNN. Complex Intell. Syst. 2021, 27, 1–9. [Google Scholar] [CrossRef]
- Ma, H.; Liu, Y.; Ren, Y.; Yu, J. Detection of Collapsed Buildings in Post-Earthquake Remote Sensing Images Based on the Improved YOLOv3. Remote Sens. 2020, 12, 44. [Google Scholar] [CrossRef] [Green Version]
- Feng, J.; Hu, X. An Automatic Building Detection Method of Remote Sensing Image Based on Cascade R-CNN. J. Geomat. 2021, 46, 53–58. [Google Scholar]
- Dong, B.; Xiong, F.; Han, X.; Kuan, L.; Xu, Q. Research on Remote Sensing Building Detection Based on Improved Yolo v3 Algorithm. Comput. Eng. Appl. 2020, 56, 209–213. [Google Scholar]
- Yang, X.; Yang, J.; Yan, J.; Zhang, Y.; Zhang, T.; Guo, Z.; Sun, X.; Fu, K. Scrdet: Towards more robust detection for small, cluttered and rotated objects. In Proceedings of the IEEE/CVF International Conference on Computer Vision, Seoul, Korea, 27 October–2 November 2019; pp. 8231–8240. [Google Scholar]
- Tan, Z.; Zhang, Z.; Xing, T.; Huang, X.; Gong, J.; Ma, J. Exploit Direction Information for Remote Ship Detection. Remote Sens. 2021, 13, 2155. [Google Scholar] [CrossRef]
- Han, J.; Ding, J.; Xue, N.; Xia, G. Redet: A rotation-equivariant detector for aerial object detection. In Proceedings of the IEEE International Conference on Computer Vision and Pattern Recognition, Online, 19–25 June 2021; pp. 2786–2795. [Google Scholar]
- Ding, J.; Xue, N.; Long, Y.; Xia, G.; Lu, Q. Learning roi transformer for oriented object detection in aerial images. In Proceedings of the IEEE International Conference on Computer Vision and Pattern Recognition, Long Beach, CA, USA, 15–21 June 2019; pp. 2849–2858. [Google Scholar]
- Zhou, X.; Yao, C.; Wen, H.; Wang, Y.; Zhou, S.; He, W.; Liang, J. East: An efficient and accurate scene text detector. In Proceedings of the IEEE International Conference on Computer Vision and Pattern Recognition, Honolulu, HI, USA, 21–26 July 2017; pp. 5551–5560. [Google Scholar]
- Liao, M.; Shi, B.; Bai, X. Textboxes++: A single-shot oriented scene text detector. IEEE Trans. Image Processing 2018, 27, 3676–3690. [Google Scholar] [CrossRef] [PubMed] [Green Version]
- Chen, Z.; Chen, K.; Lin, W.; See, J.; Yu, H.; Ke, Y.; Yang, C. PIoU Loss: Towards Accurate Oriented Object Detection in Complex Environments. In Proceedings of the European Conference on Computer Vision, Glasgow, UK, 23–28 August 2020; pp. 195–211. [Google Scholar]
- Pan, X.; Ren, Y.; Sheng, K.; Dong, W.; Yuan, H.; Guo, X.; Ma, C.; Xu, C. Dynamic Refinement Network for Oriented and Densely Packed Object Detection. In Proceedings of the IEEE International Conference on Computer Vision and Pattern Recognition, Seattle, WA, USA, 16–18 June 2020; pp. 11207–11216. [Google Scholar]
- Yang, X.; Yan, J.; Feng, Z.; He, T. R3det: Refined single-stage detector with feature refinement for rotating object. In Proceedings of the AAAI Conference on Artificial Intelligence, New York, NY, USA, 2–9 February 2021; pp. 3163–3171. [Google Scholar]
- Ma, J.; Shao, W.; Ye, H.; Wang, L.; Zheng, Y.; Xue, X. Arbitrary-oriented scene text detection via rotation proposals. IEEE Trans. Multimed. 2018, 20, 3111–3122. [Google Scholar] [CrossRef] [Green Version]
- Jiang, Y.; Zhu, X.; Wang, X.; Yang, S.; Li, W.; Wang, H.; Fu, P.; Luo, Z. R2cnn: Rotational region cnn for orientation robust scene text detection. arXiv 2017, arXiv:1706.09579. [Google Scholar]
- Zhang, G.; Lu, S.; Zhang, W. CAD-Net: A context-aware detection network for objects in remote sensing imagery. IEEE Trans. Geosci. Remote Sens. 2019, 57, 10015–10024. [Google Scholar] [CrossRef] [Green Version]
- Zhu, C.; Tao, R.; Luu, K.; Savvides, M. Seeing small faces from robust anchor’s perspective. In Proceedings of the IEEE International Conference on Computer Vision and Pattern Recognition, Salt Lake City, UT, USA, 18–22 June 2018; pp. 5127–5136. [Google Scholar]
- Xia, G.; Bai, X.; Ding, J.; Zhu, Z.; Belongie, S.; Luo, J.; Datcu, M.; Pelillo, M.; Zhang, L. DOTA: A large-scale dataset for object detection in aerial images. In Proceedings of the IEEE International Conference on Computer Vision and Pattern Recognition, Salt Lake City, UT, USA, 18–22 June 2018; pp. 3974–3983. [Google Scholar]
- Kisantal, M.; Wojna, Z.; Murawski, J.; Naruniec, J.; Cho, K. Augmentation for small object detection. arXiv 2019, arXiv:1902.07296. [Google Scholar]
- He, K.; Zhang, X.; Ren, S.; Sun, J. Deep residual learning for image recognition. In Proceedings of the IEEE International Conference on Computer Vision and Pattern Recognition, Las Vegas, NV, USA, 27–30 June 2016; pp. 770–778. [Google Scholar]
- Lin, T.; Dollar, P.; Girshick, R.; He, K.; Hariharan, B.; Belongie, S. Feature pyramid networks for object detection. In Proceedings of the IEEE International Conference on Computer Vision and Pattern Recognition, Honolulu, HI, USA, 21–26 July 2017; pp. 2117–2125. [Google Scholar]
- Hou, Q.; Zhou, D.; Feng, J. Coordinate attention for efficient mobile network design. In Proceedings of the IEEE International Conference on Computer Vision and Pattern Recognition, Online, 19–25 June 2021; pp. 13713–13722. [Google Scholar]
- Hu, J.; Shen, L.; Sun, G. Squeeze-and-excitation networks. In Proceedings of the IEEE International Conference on Computer Vision and Pattern Recognition, Salt Lake City, UT, USA, 18–22 June 2018; pp. 7132–7141. [Google Scholar]
- Woo, S.; Park, J.; Lee, J.; Kweon, I.-S. Cbam: Convolutional block attention module. In Proceedings of the European Conference on Computer Vision, Munich, Germany, 8–14 September 2018; pp. 3–19. [Google Scholar]
- Girshick, R. Fast R-CNN. In Proceedings of the IEEE International Conference on Computer Vision, Santiago, Chile, 13–16 December 2015; pp. 1440–1448. [Google Scholar]
- Abadi, M.; Barham, P.; Chen, J.; Chen, Z.; Davis, A.; Dean, J.; Devin, M.; Ghemawat, S.; Irving, G.; Isard, M.; et al. Tensorflow: A system for large-scale machine learning. In Proceedings of the Symposium on Operating Systems Design and Implementation, Savannah, GA, USA, 2–4 November 2016; pp. 265–283. [Google Scholar]
- Dickenson, M.; Gueguen, L. Rotated Rectangles for Symbolized Building Footprint Extraction. In Proceedings of the IEEE International Conference on Computer Vision and Pattern Recognition, Salt Lake City, UT, USA, 18–22 June 2018; pp. 225–228. [Google Scholar]
- Wen, Q.; Jiang, K.; Wang, W.; Liu, Q.; Guo, Q.; Li, L.; Wang, P. Automatic Building Extraction from Google Earth Images under Complex Backgrounds Based on Deep Instance Segmentation Network. Sensors 2019, 19, 333. [Google Scholar] [CrossRef] [Green Version]


Publisher’s Note: MDPI stays neutral with regard to jurisdictional claims in published maps and institutional affiliations. |
© 2022 by the authors. Licensee MDPI, Basel, Switzerland. This article is an open access article distributed under the terms and conditions of the Creative Commons Attribution (CC BY) license (https://creativecommons.org/licenses/by/4.0/).