
Assessing the Sensitivity of Vegetation Cover to Climate Change in the Yarlung Zangbo River Basin Using Machine Learning Algorithms

 ,
,  ,
,  ,
, 
Abstract
:
1. Introduction
2. Materials and Methods
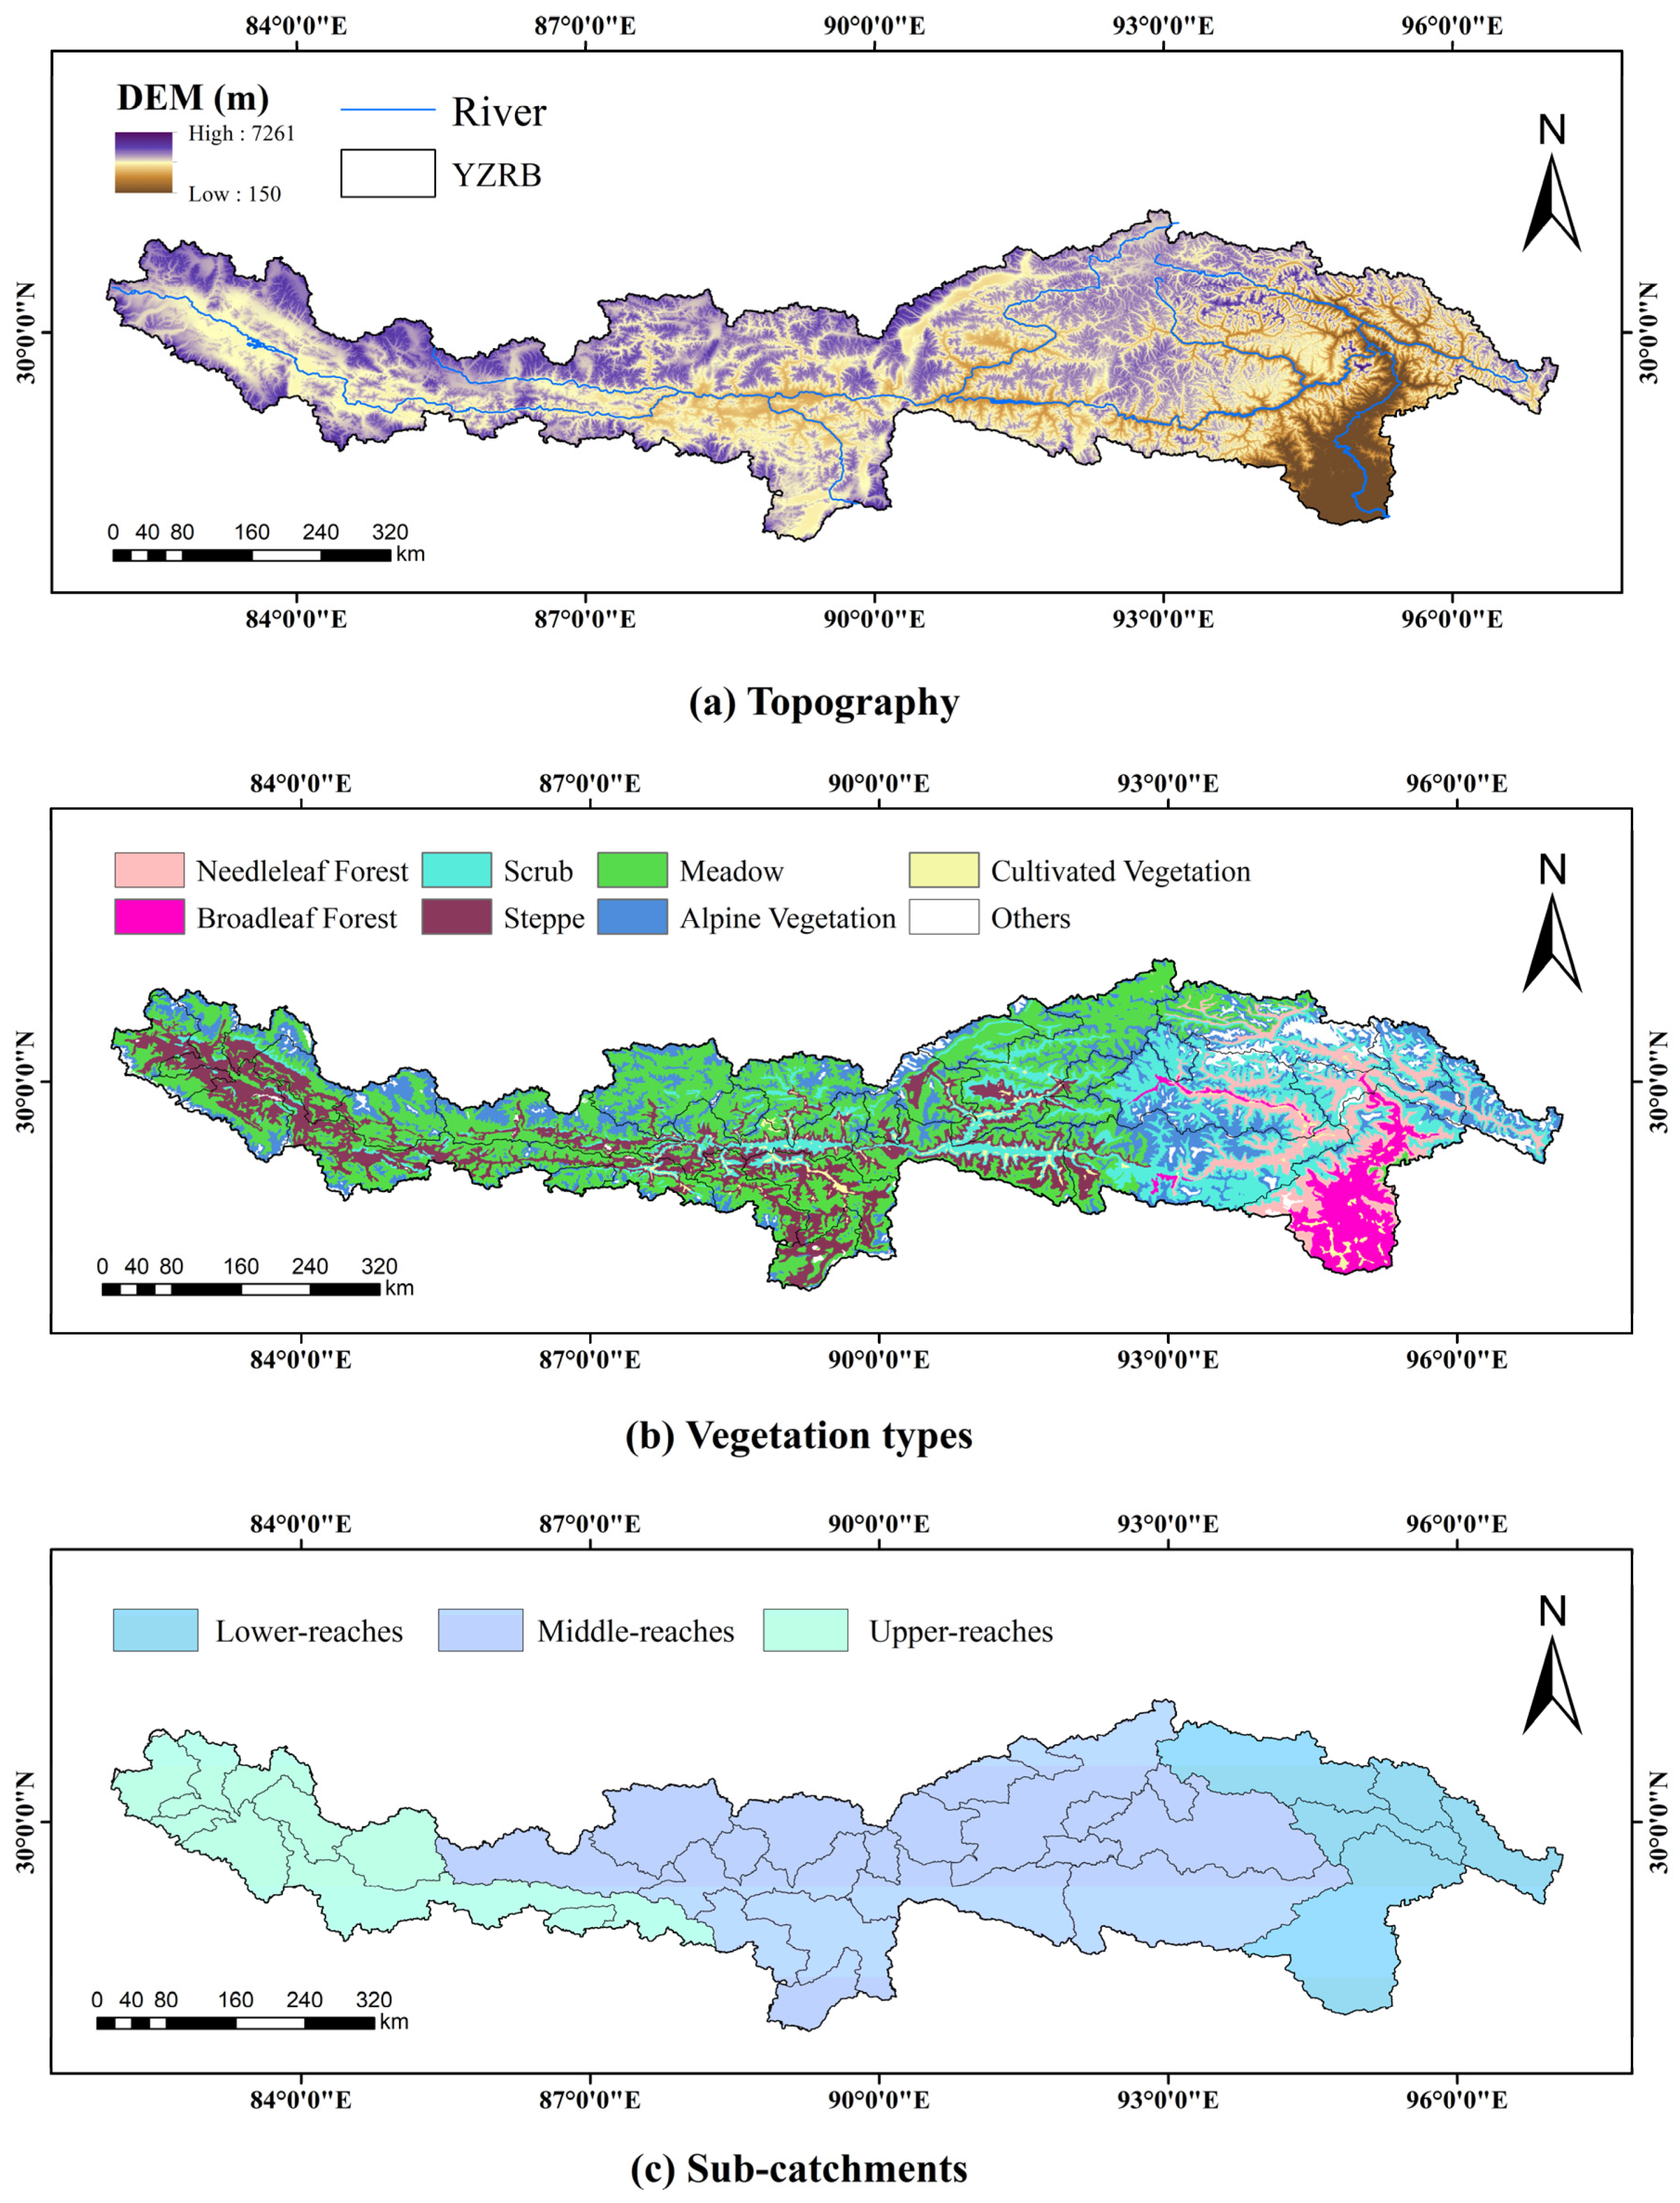
2.1. Study Area and Data
2.1.1. Study Area
2.1.2. Data Collection
2.2. Methodology
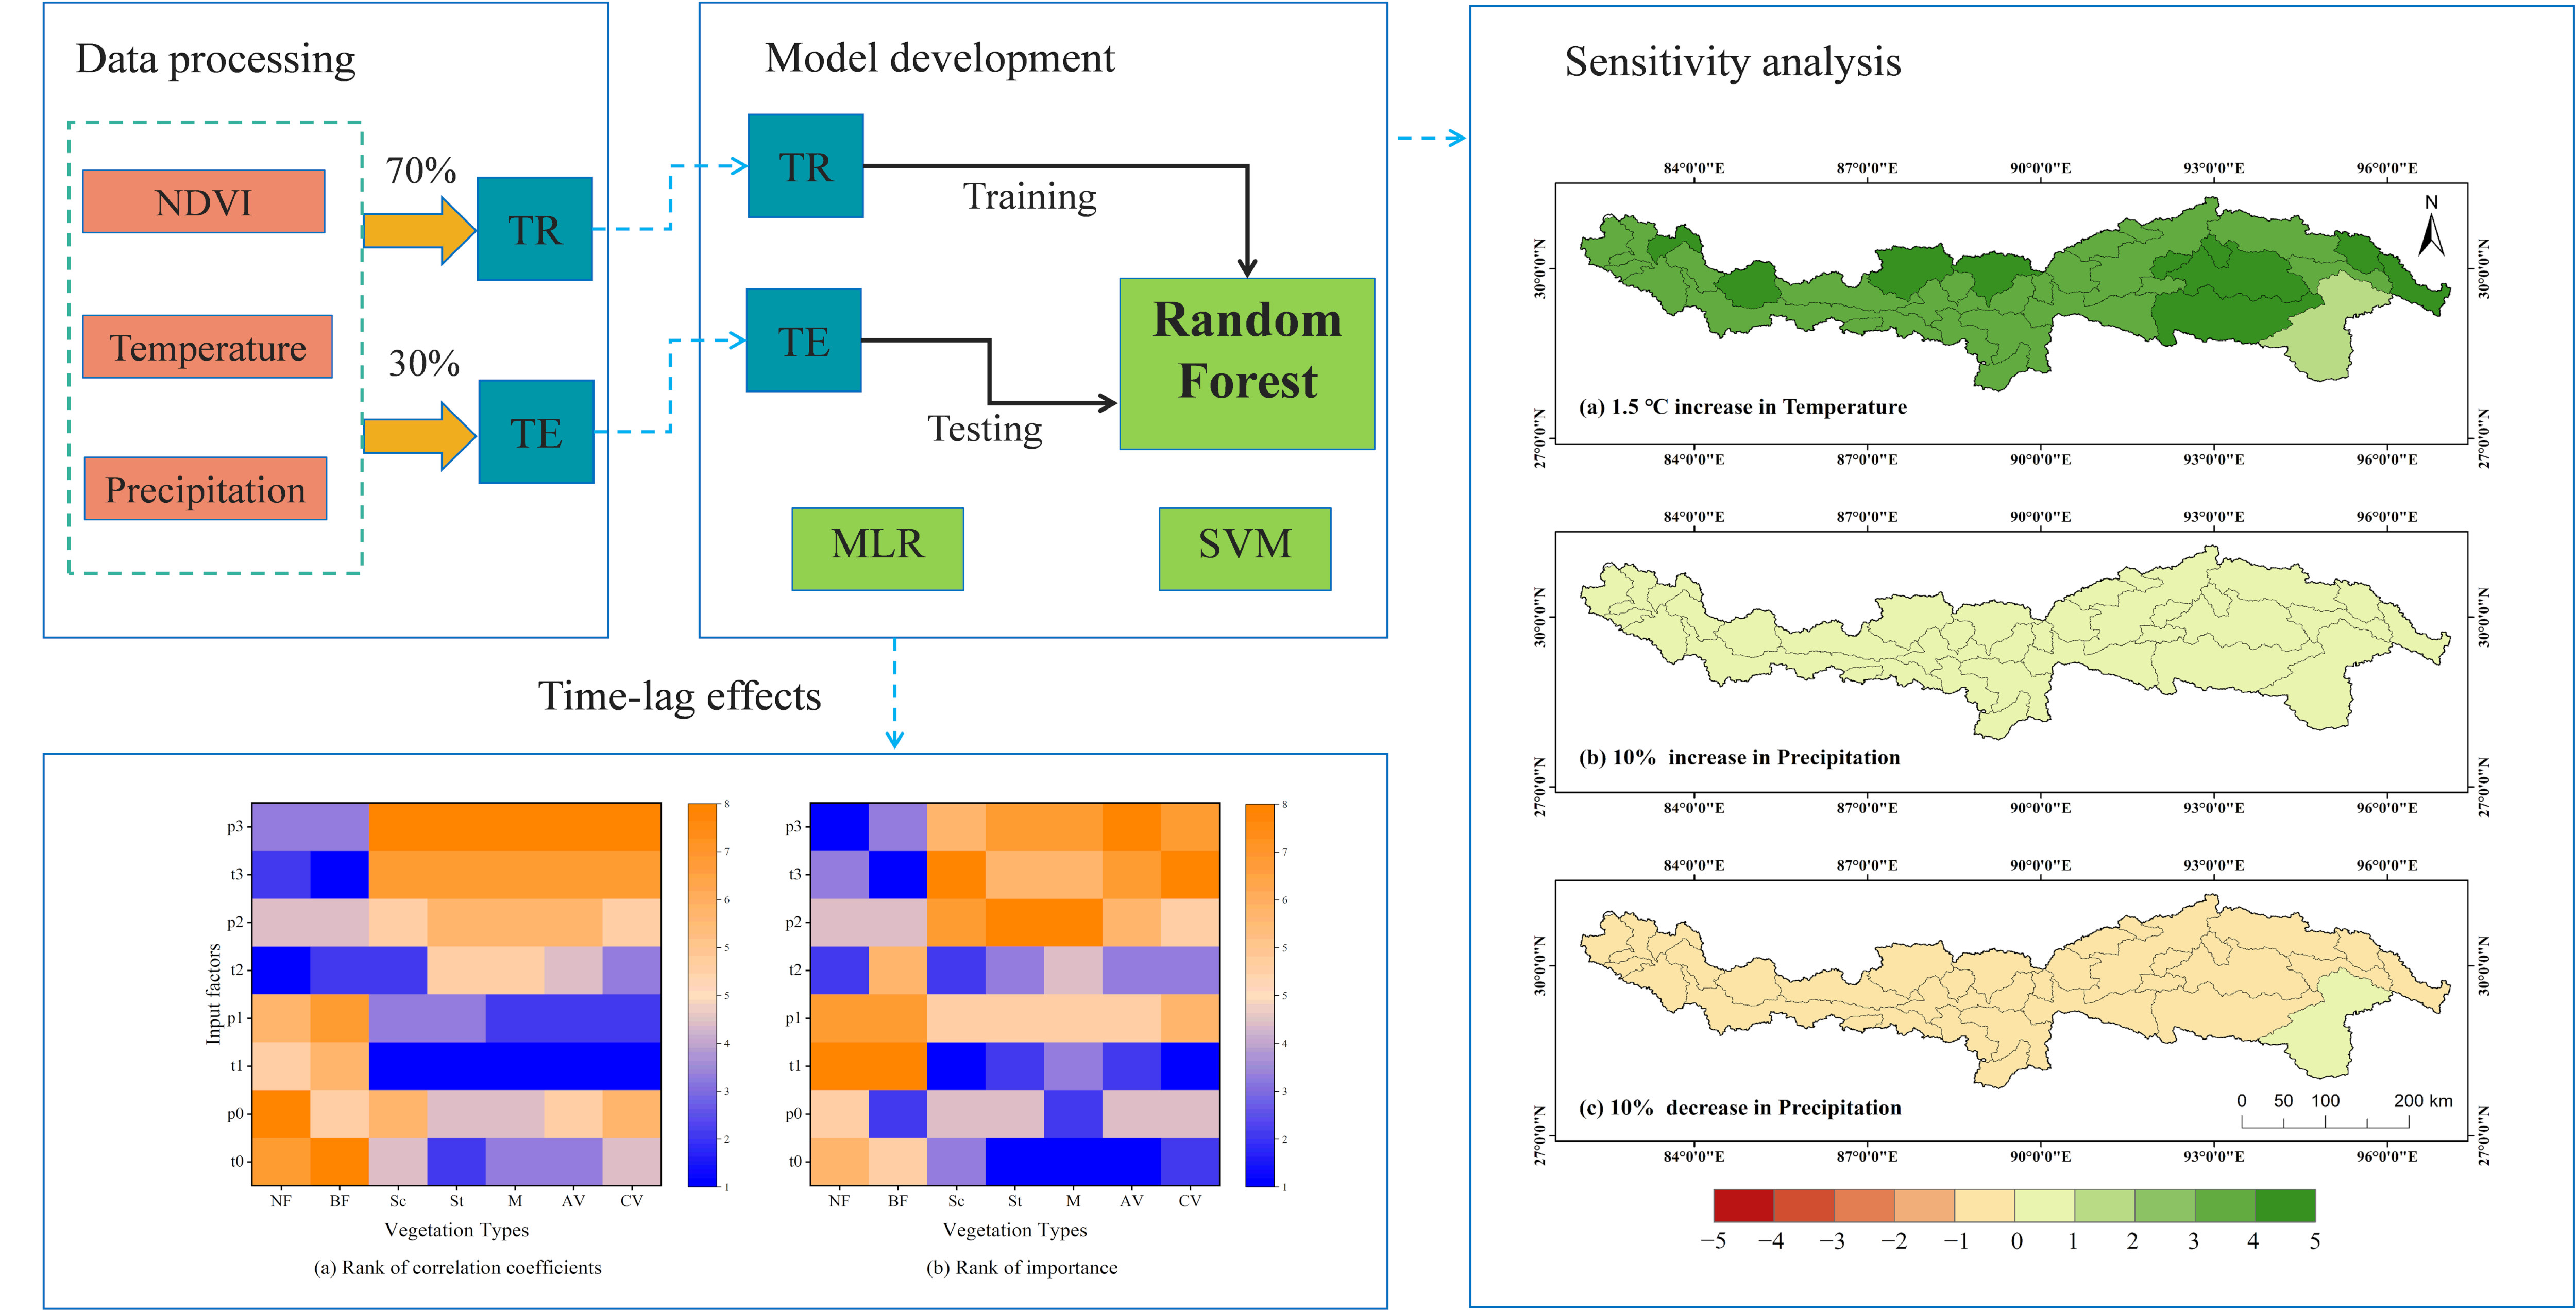
2.2.1. NDVI Models
2.2.2. The Sensitivity of NDVI to Climate Change
3. Results
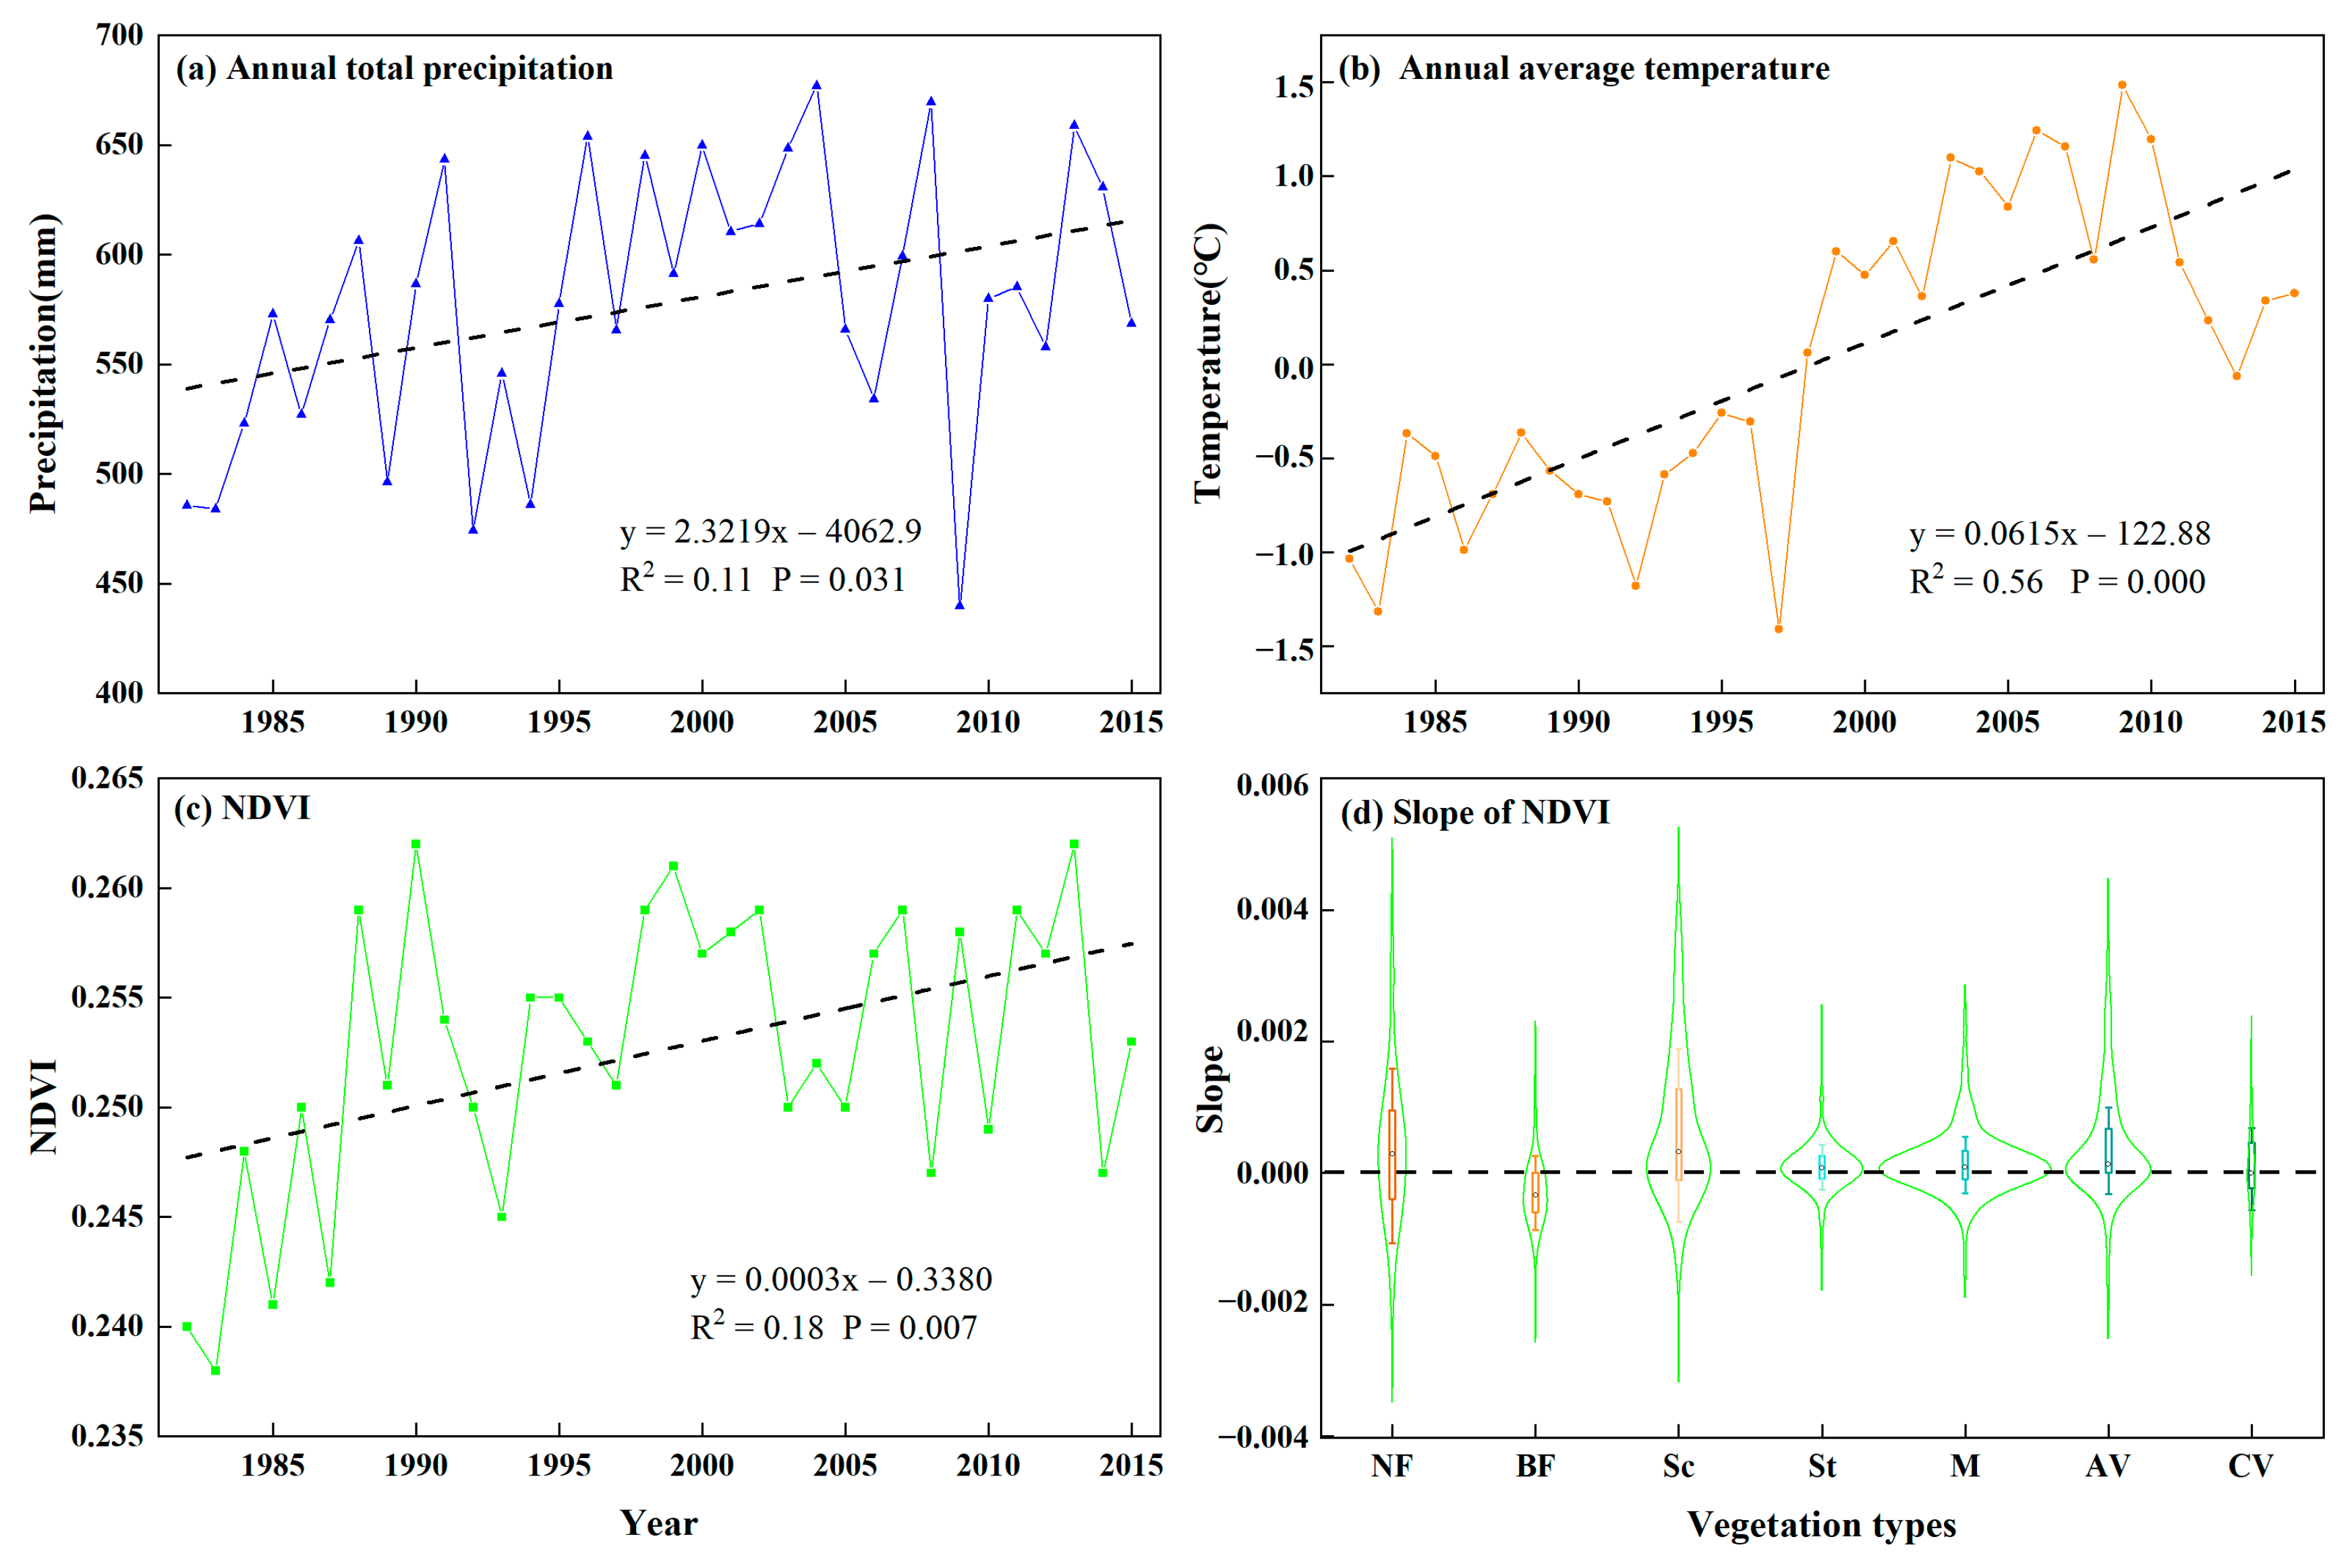
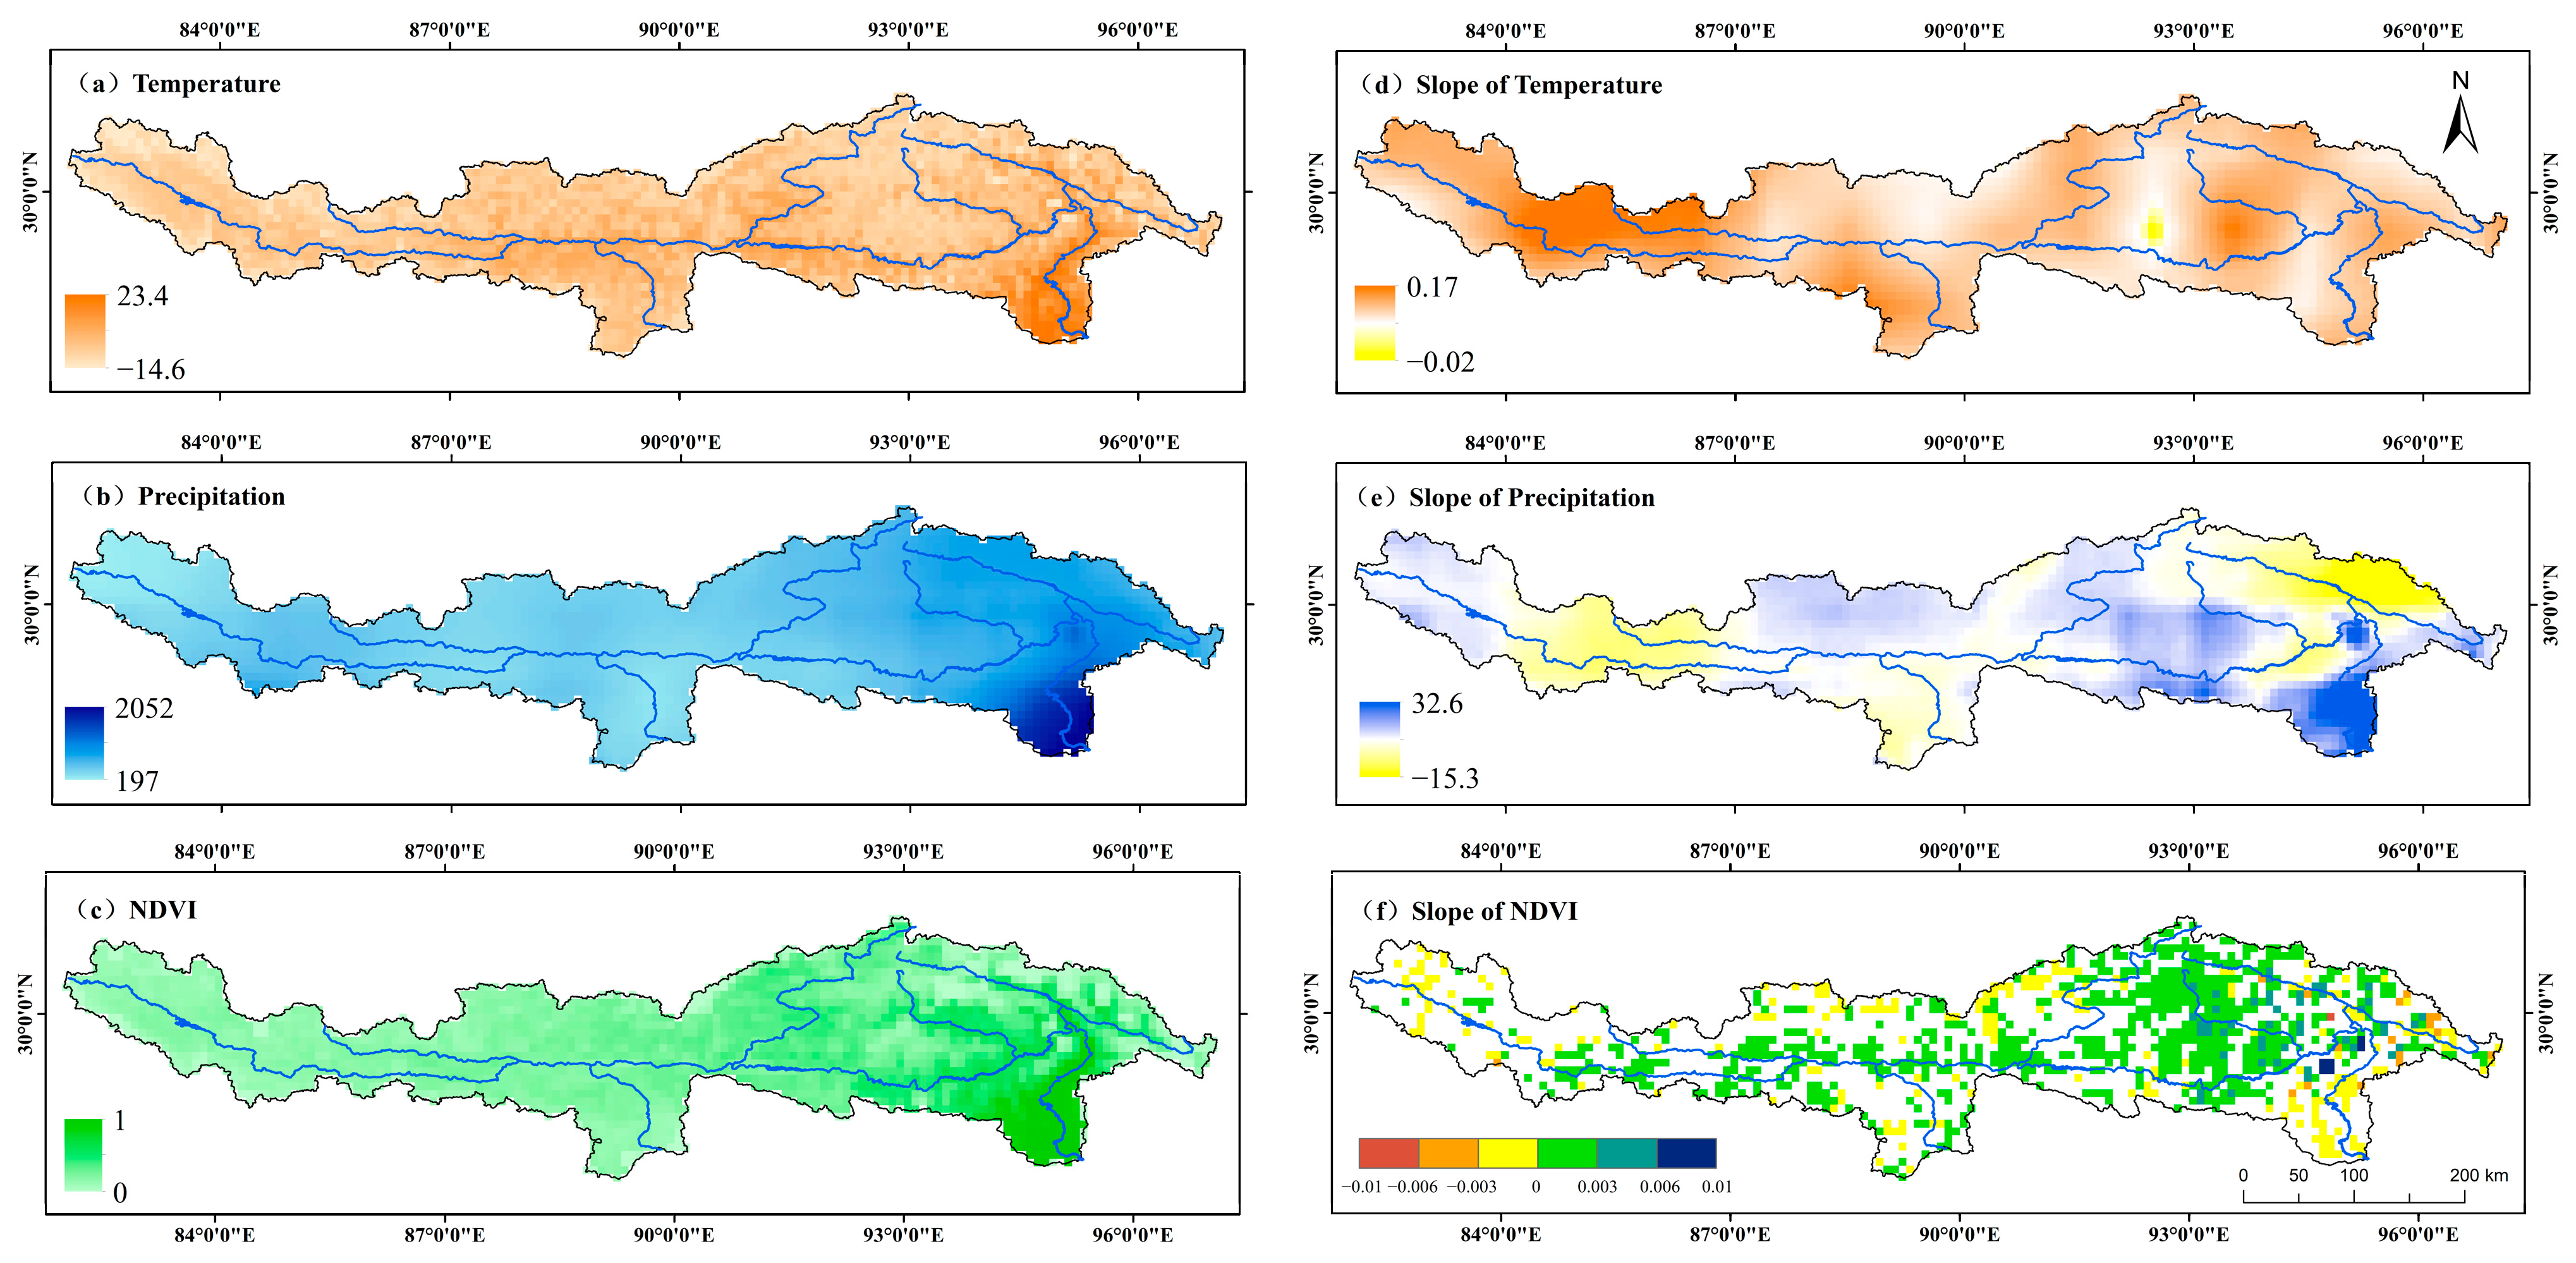
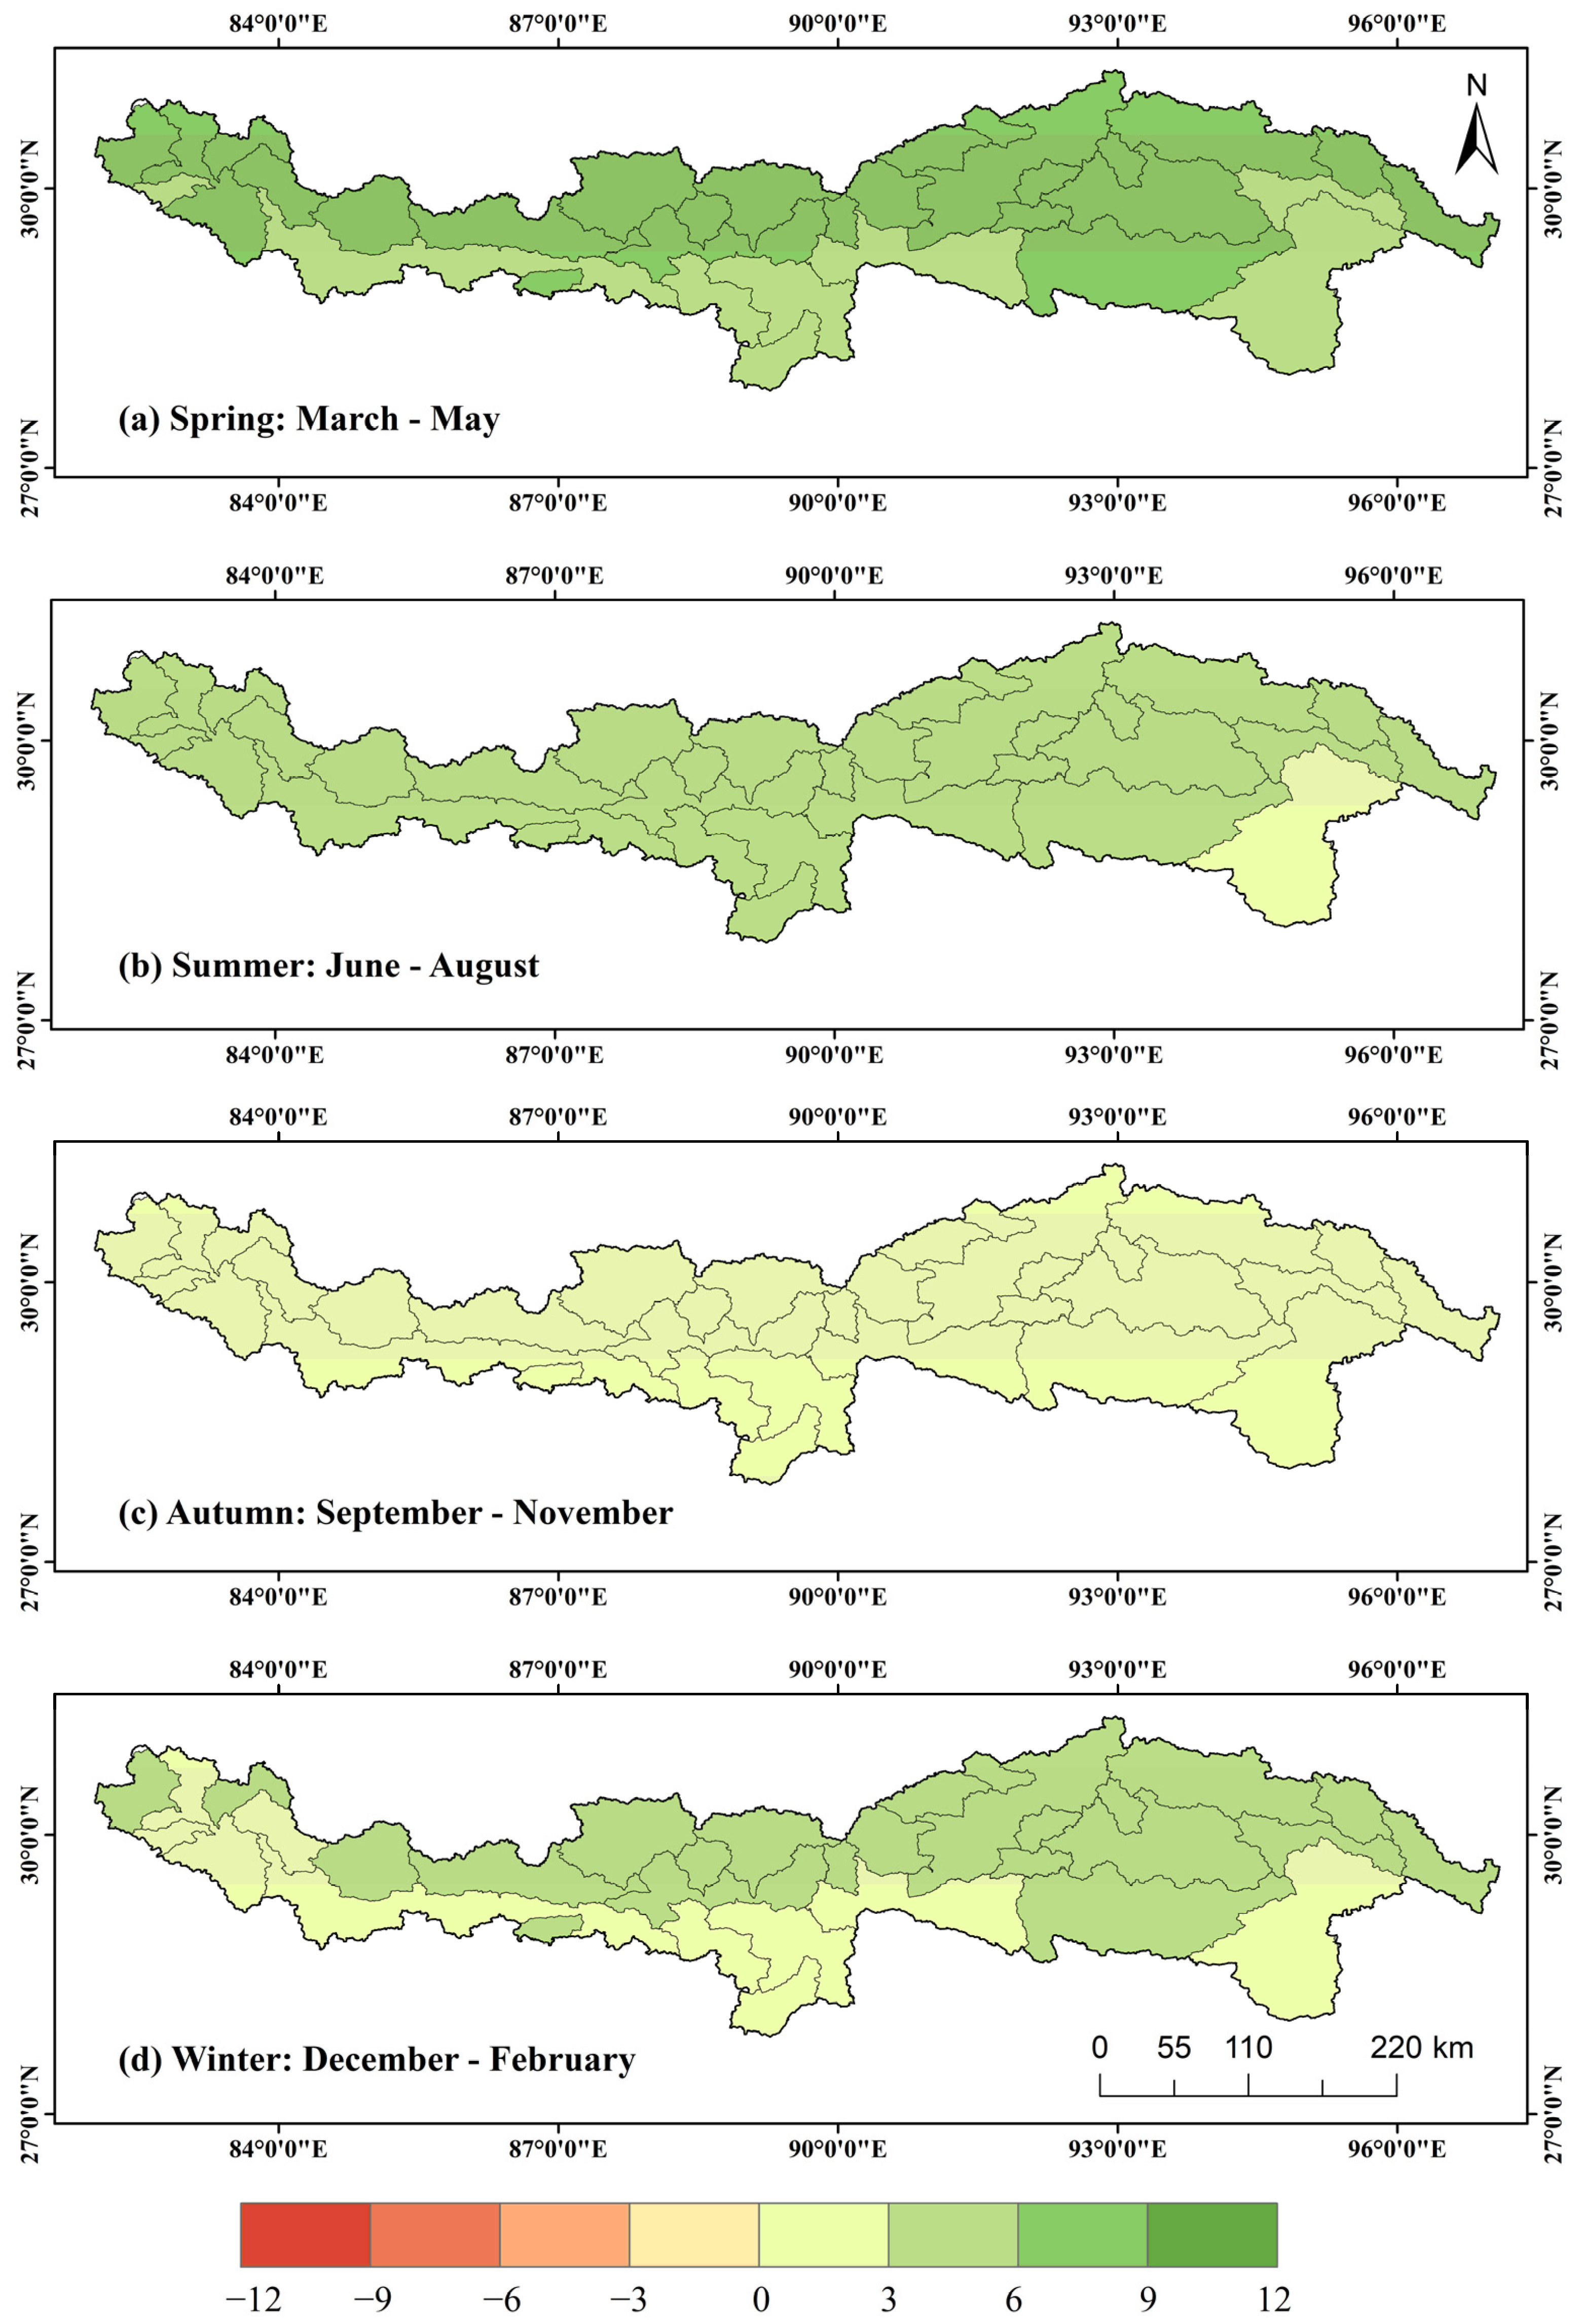
3.1. The Spatiotemporal Variations of the NDVI and Climatic Variables
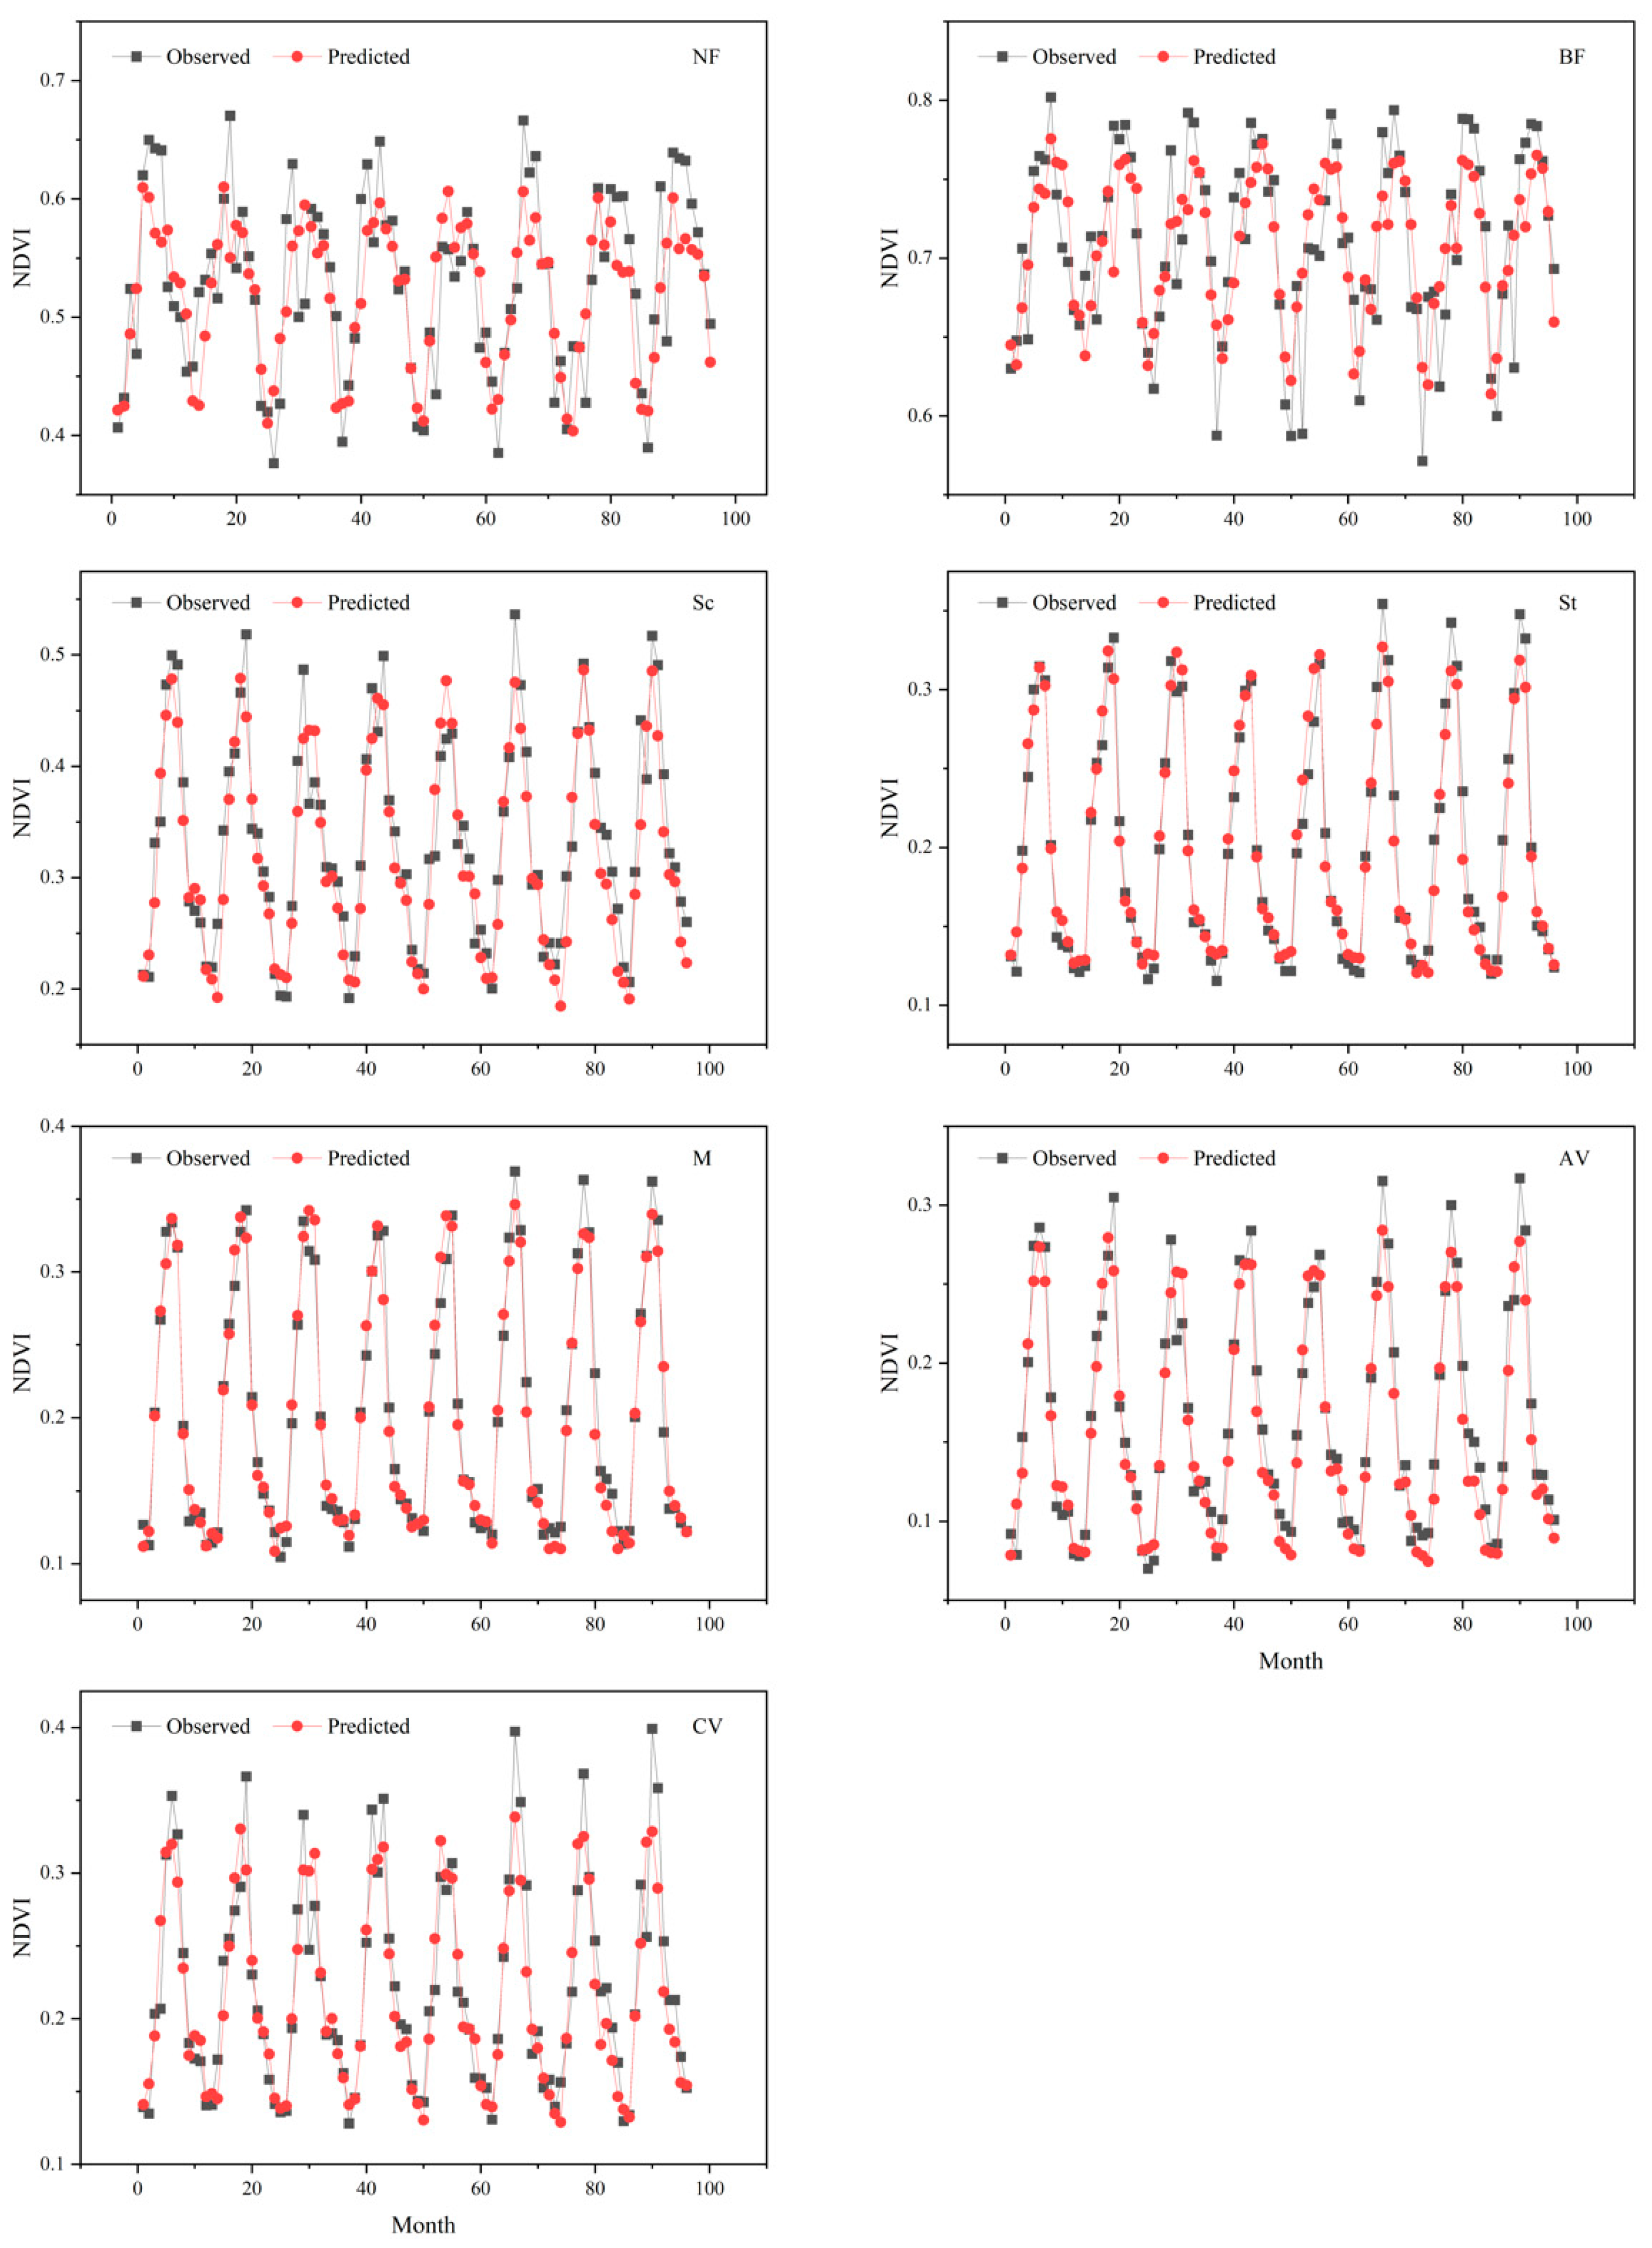
3.2. NDVI Modeling
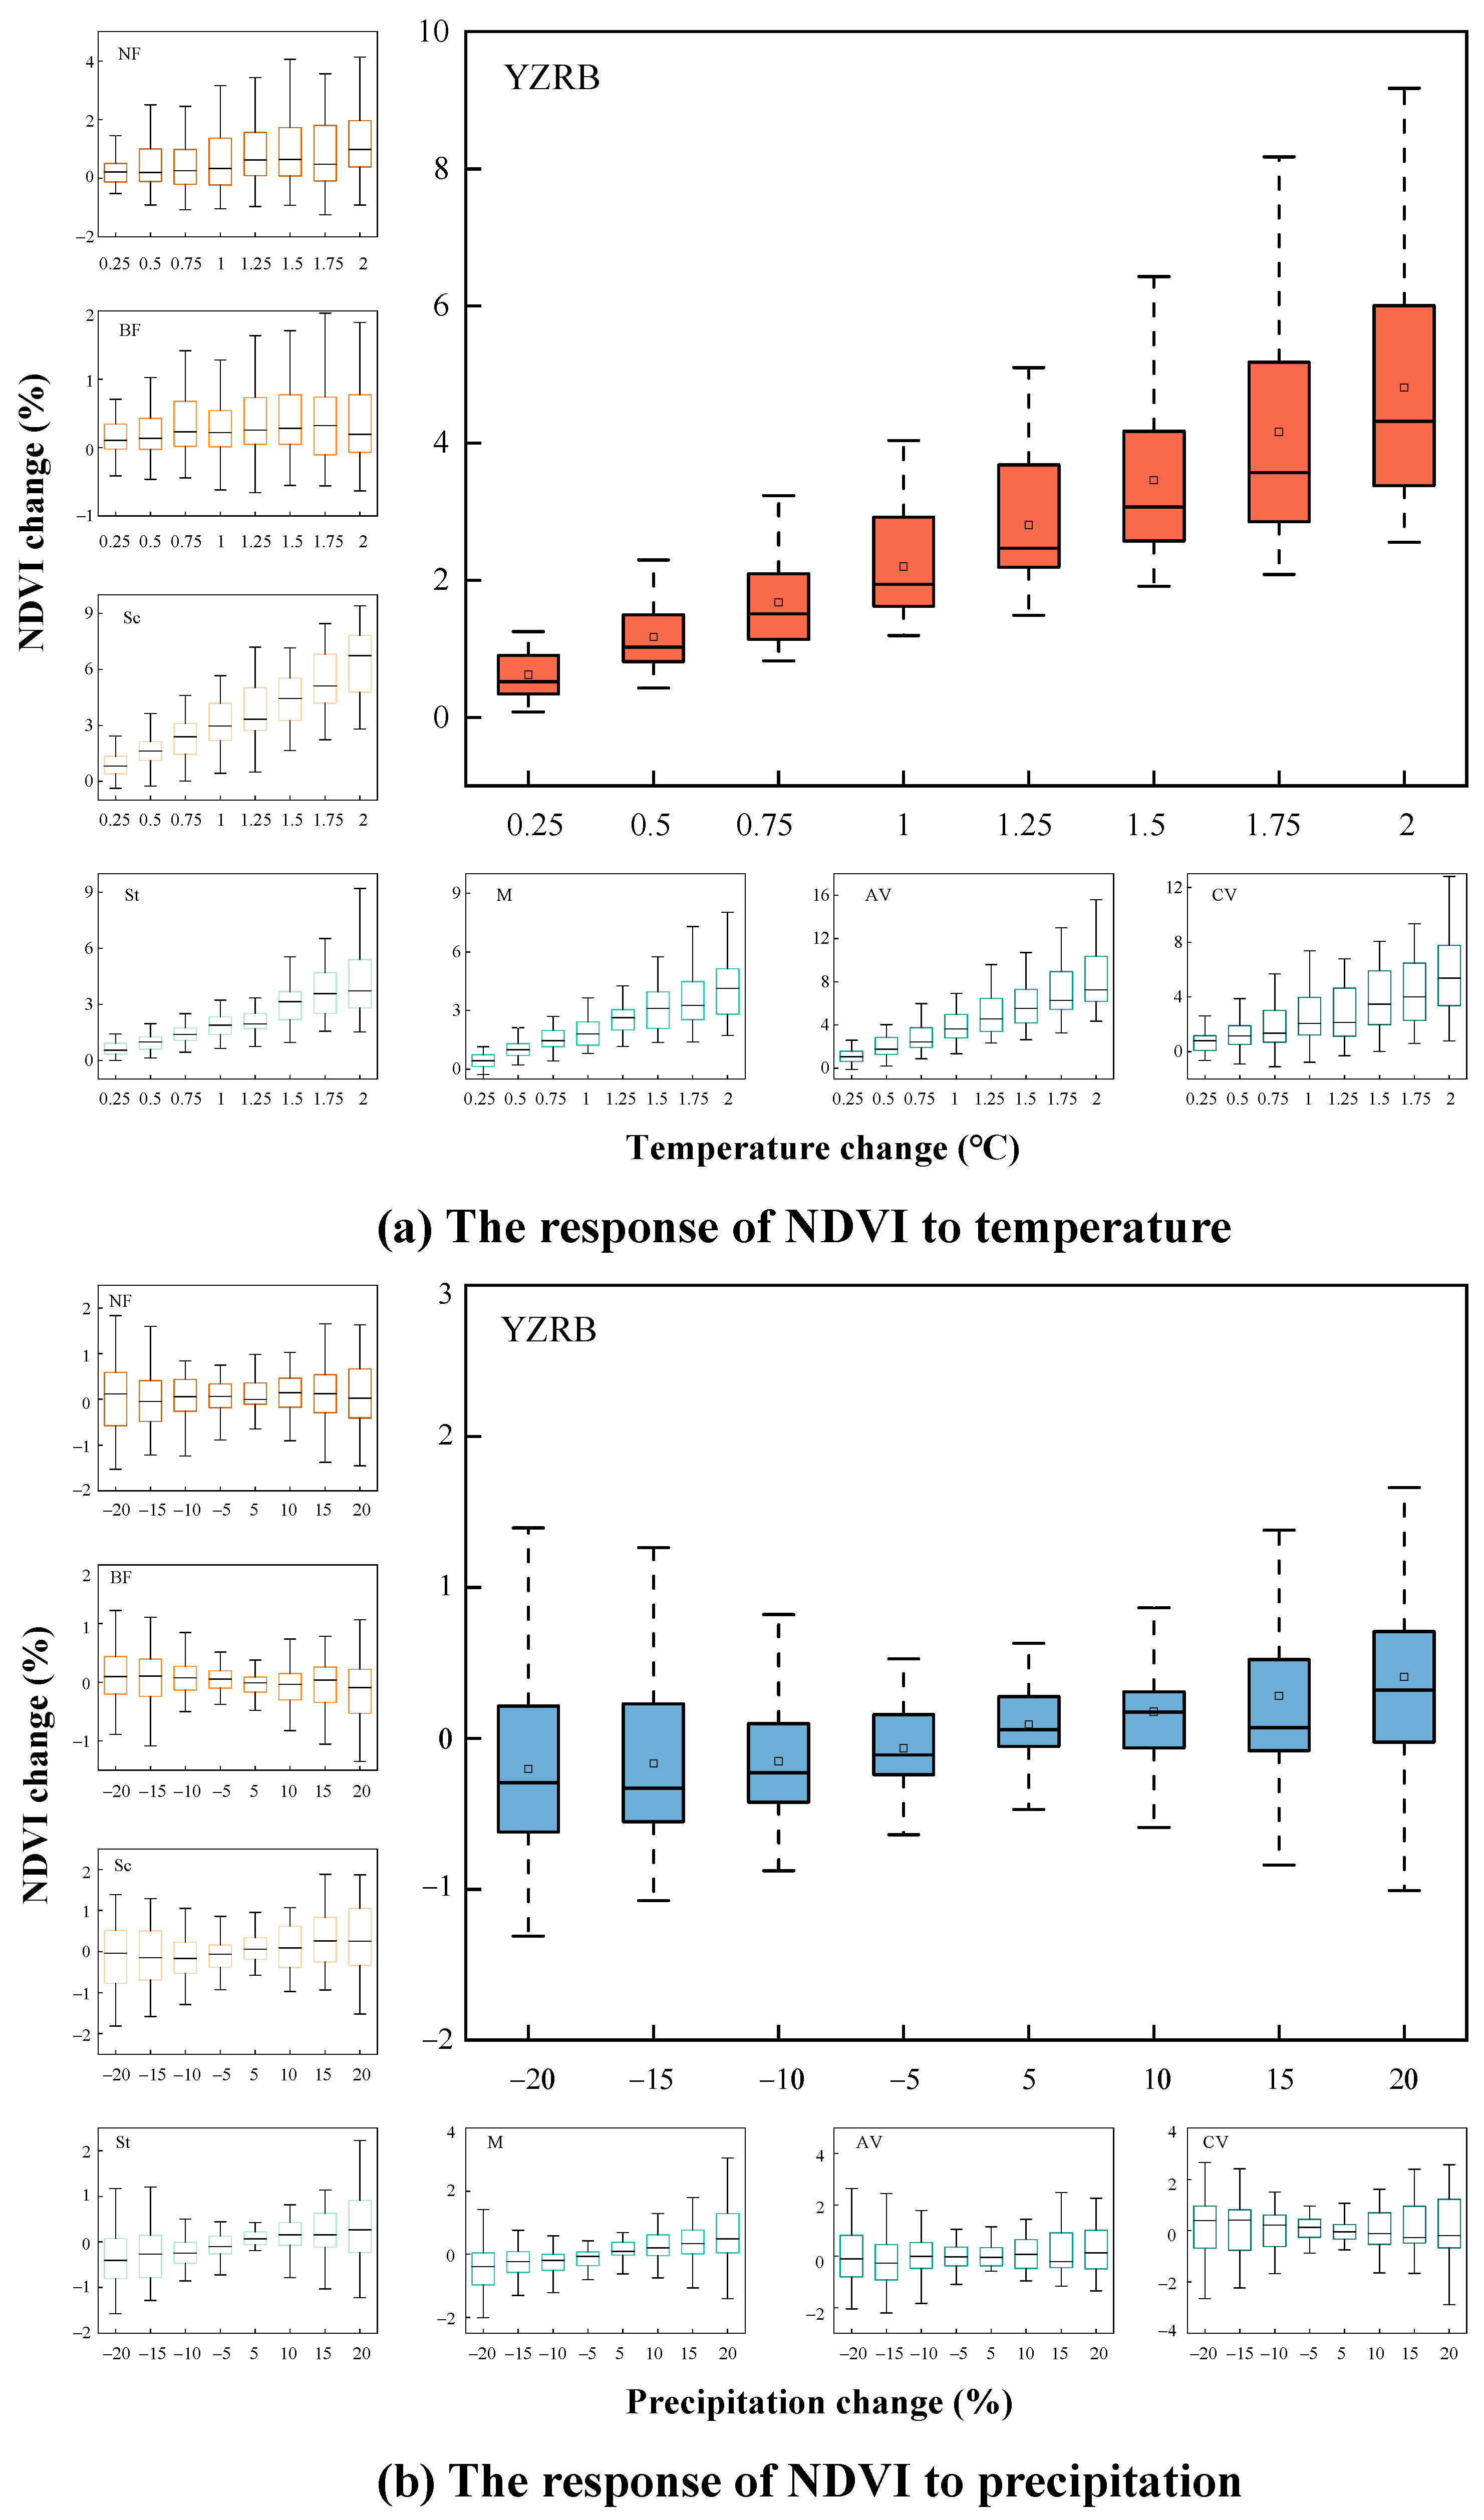
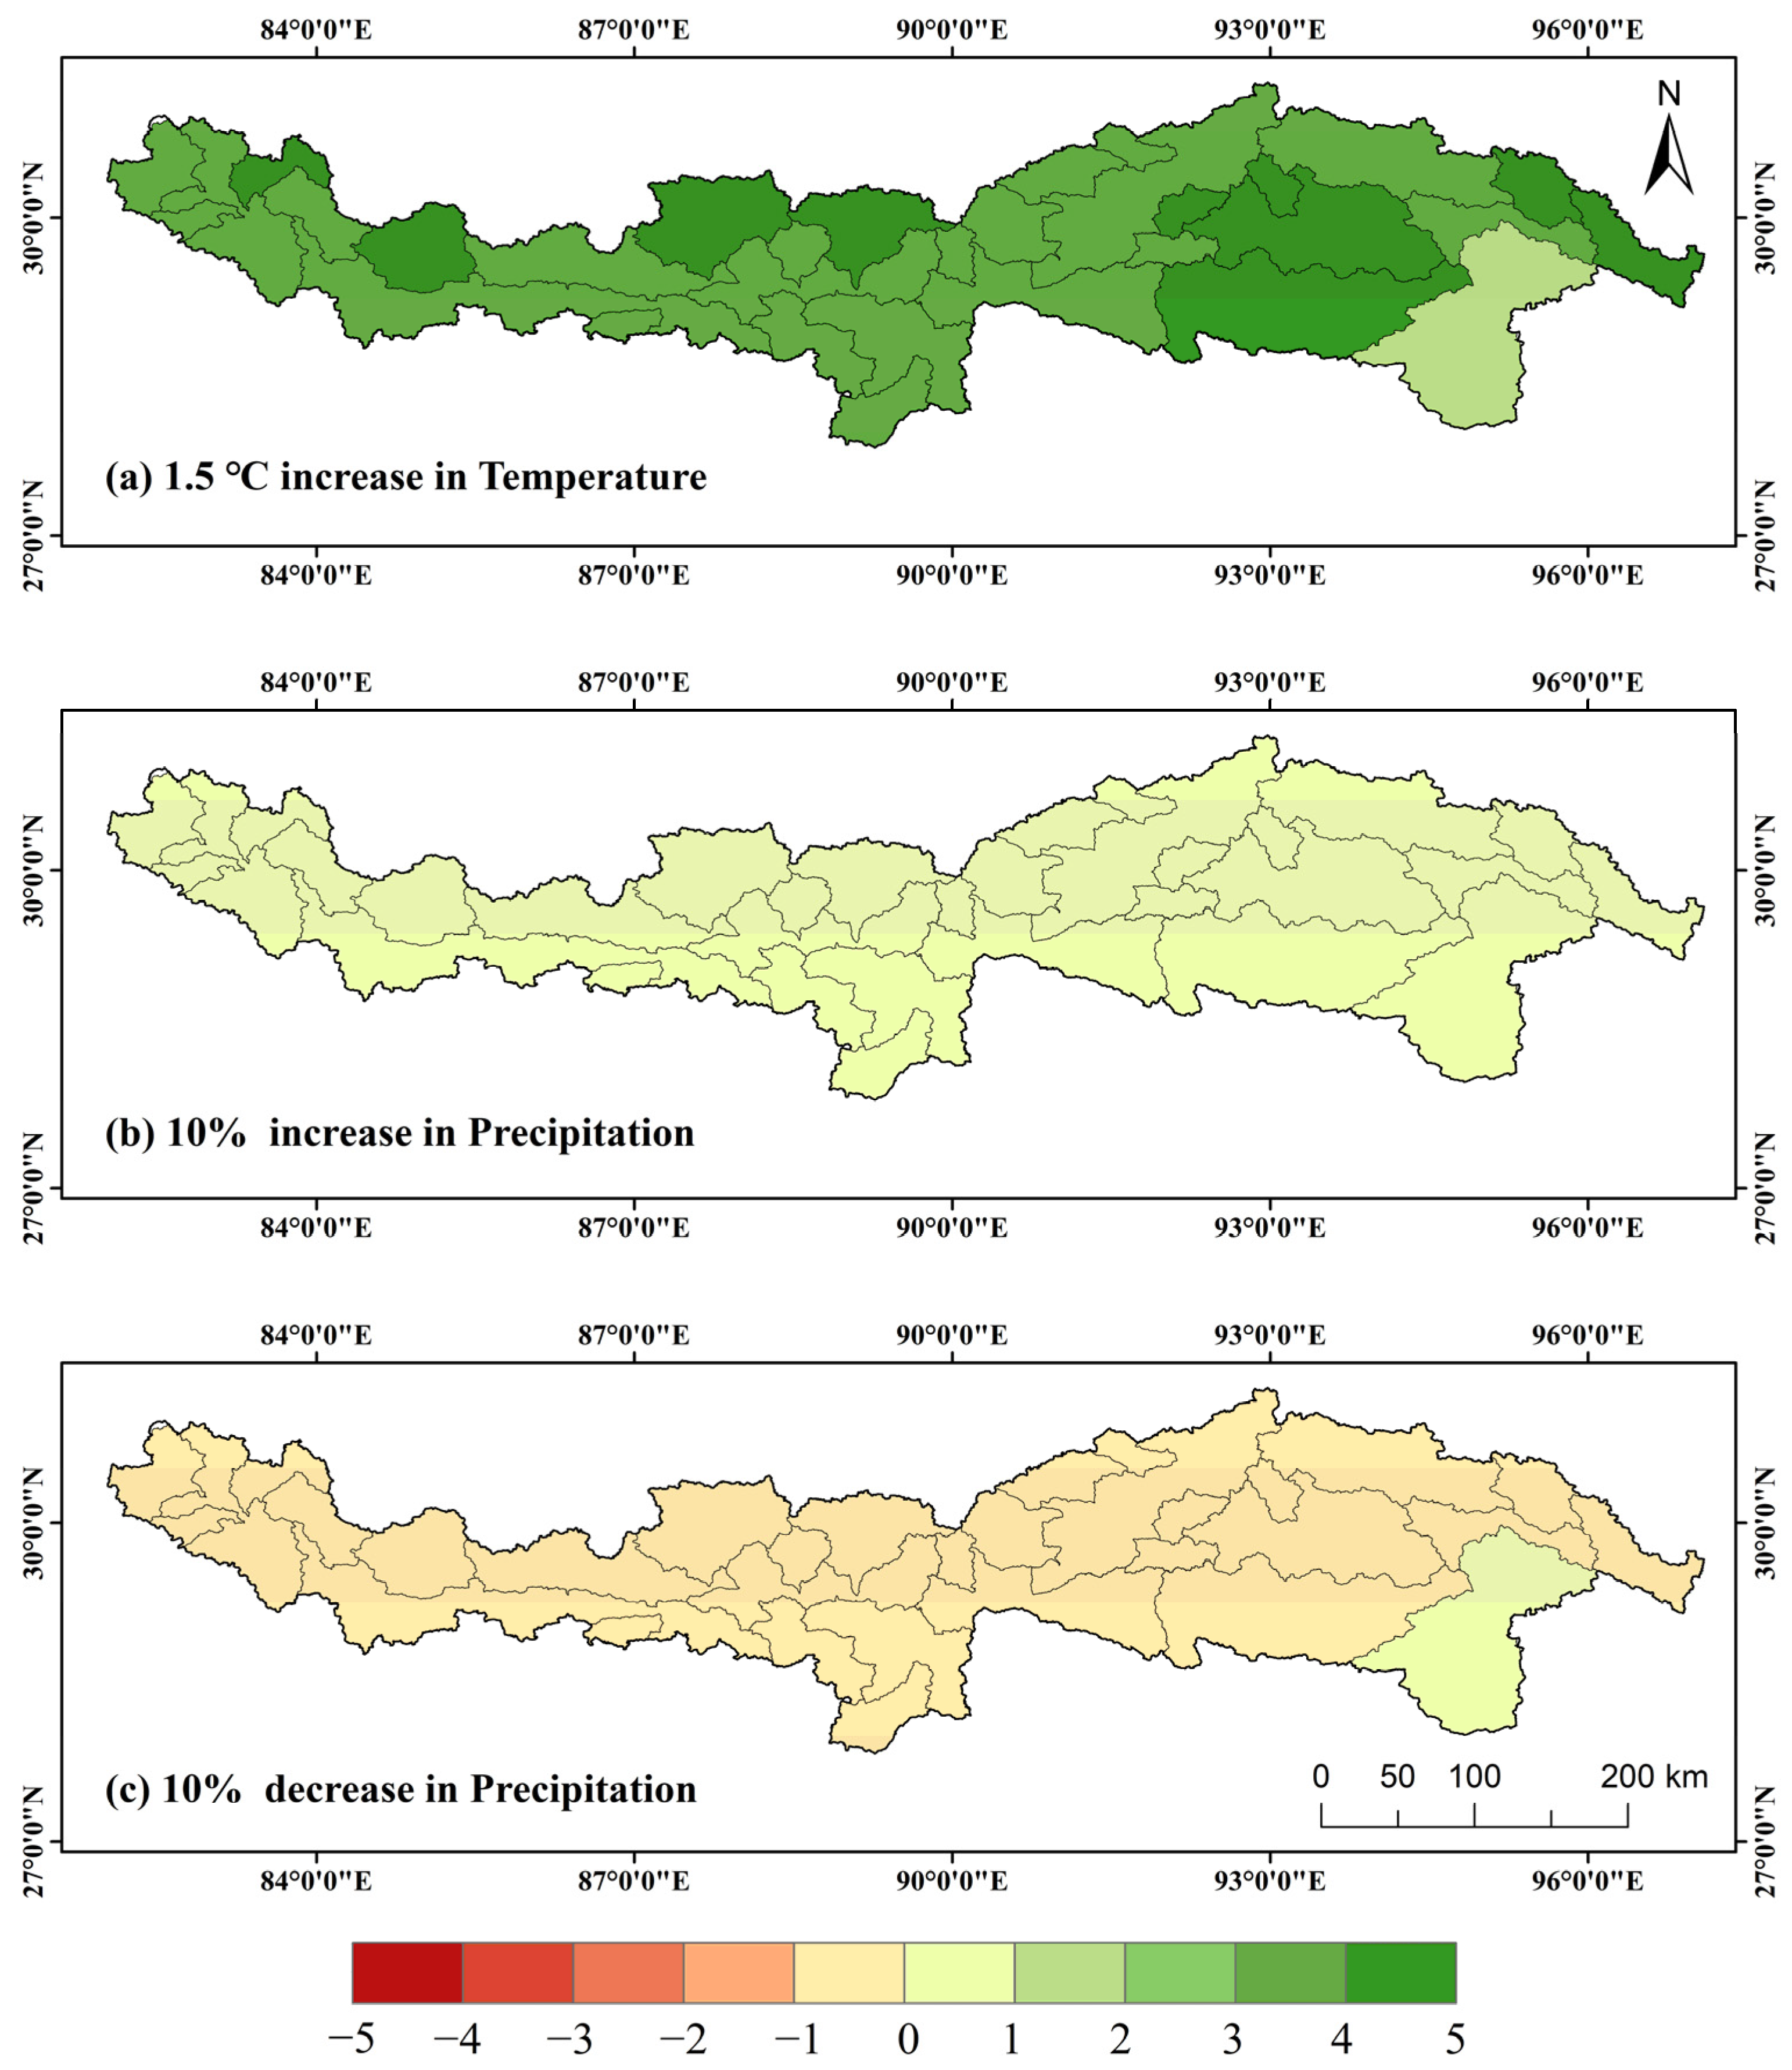
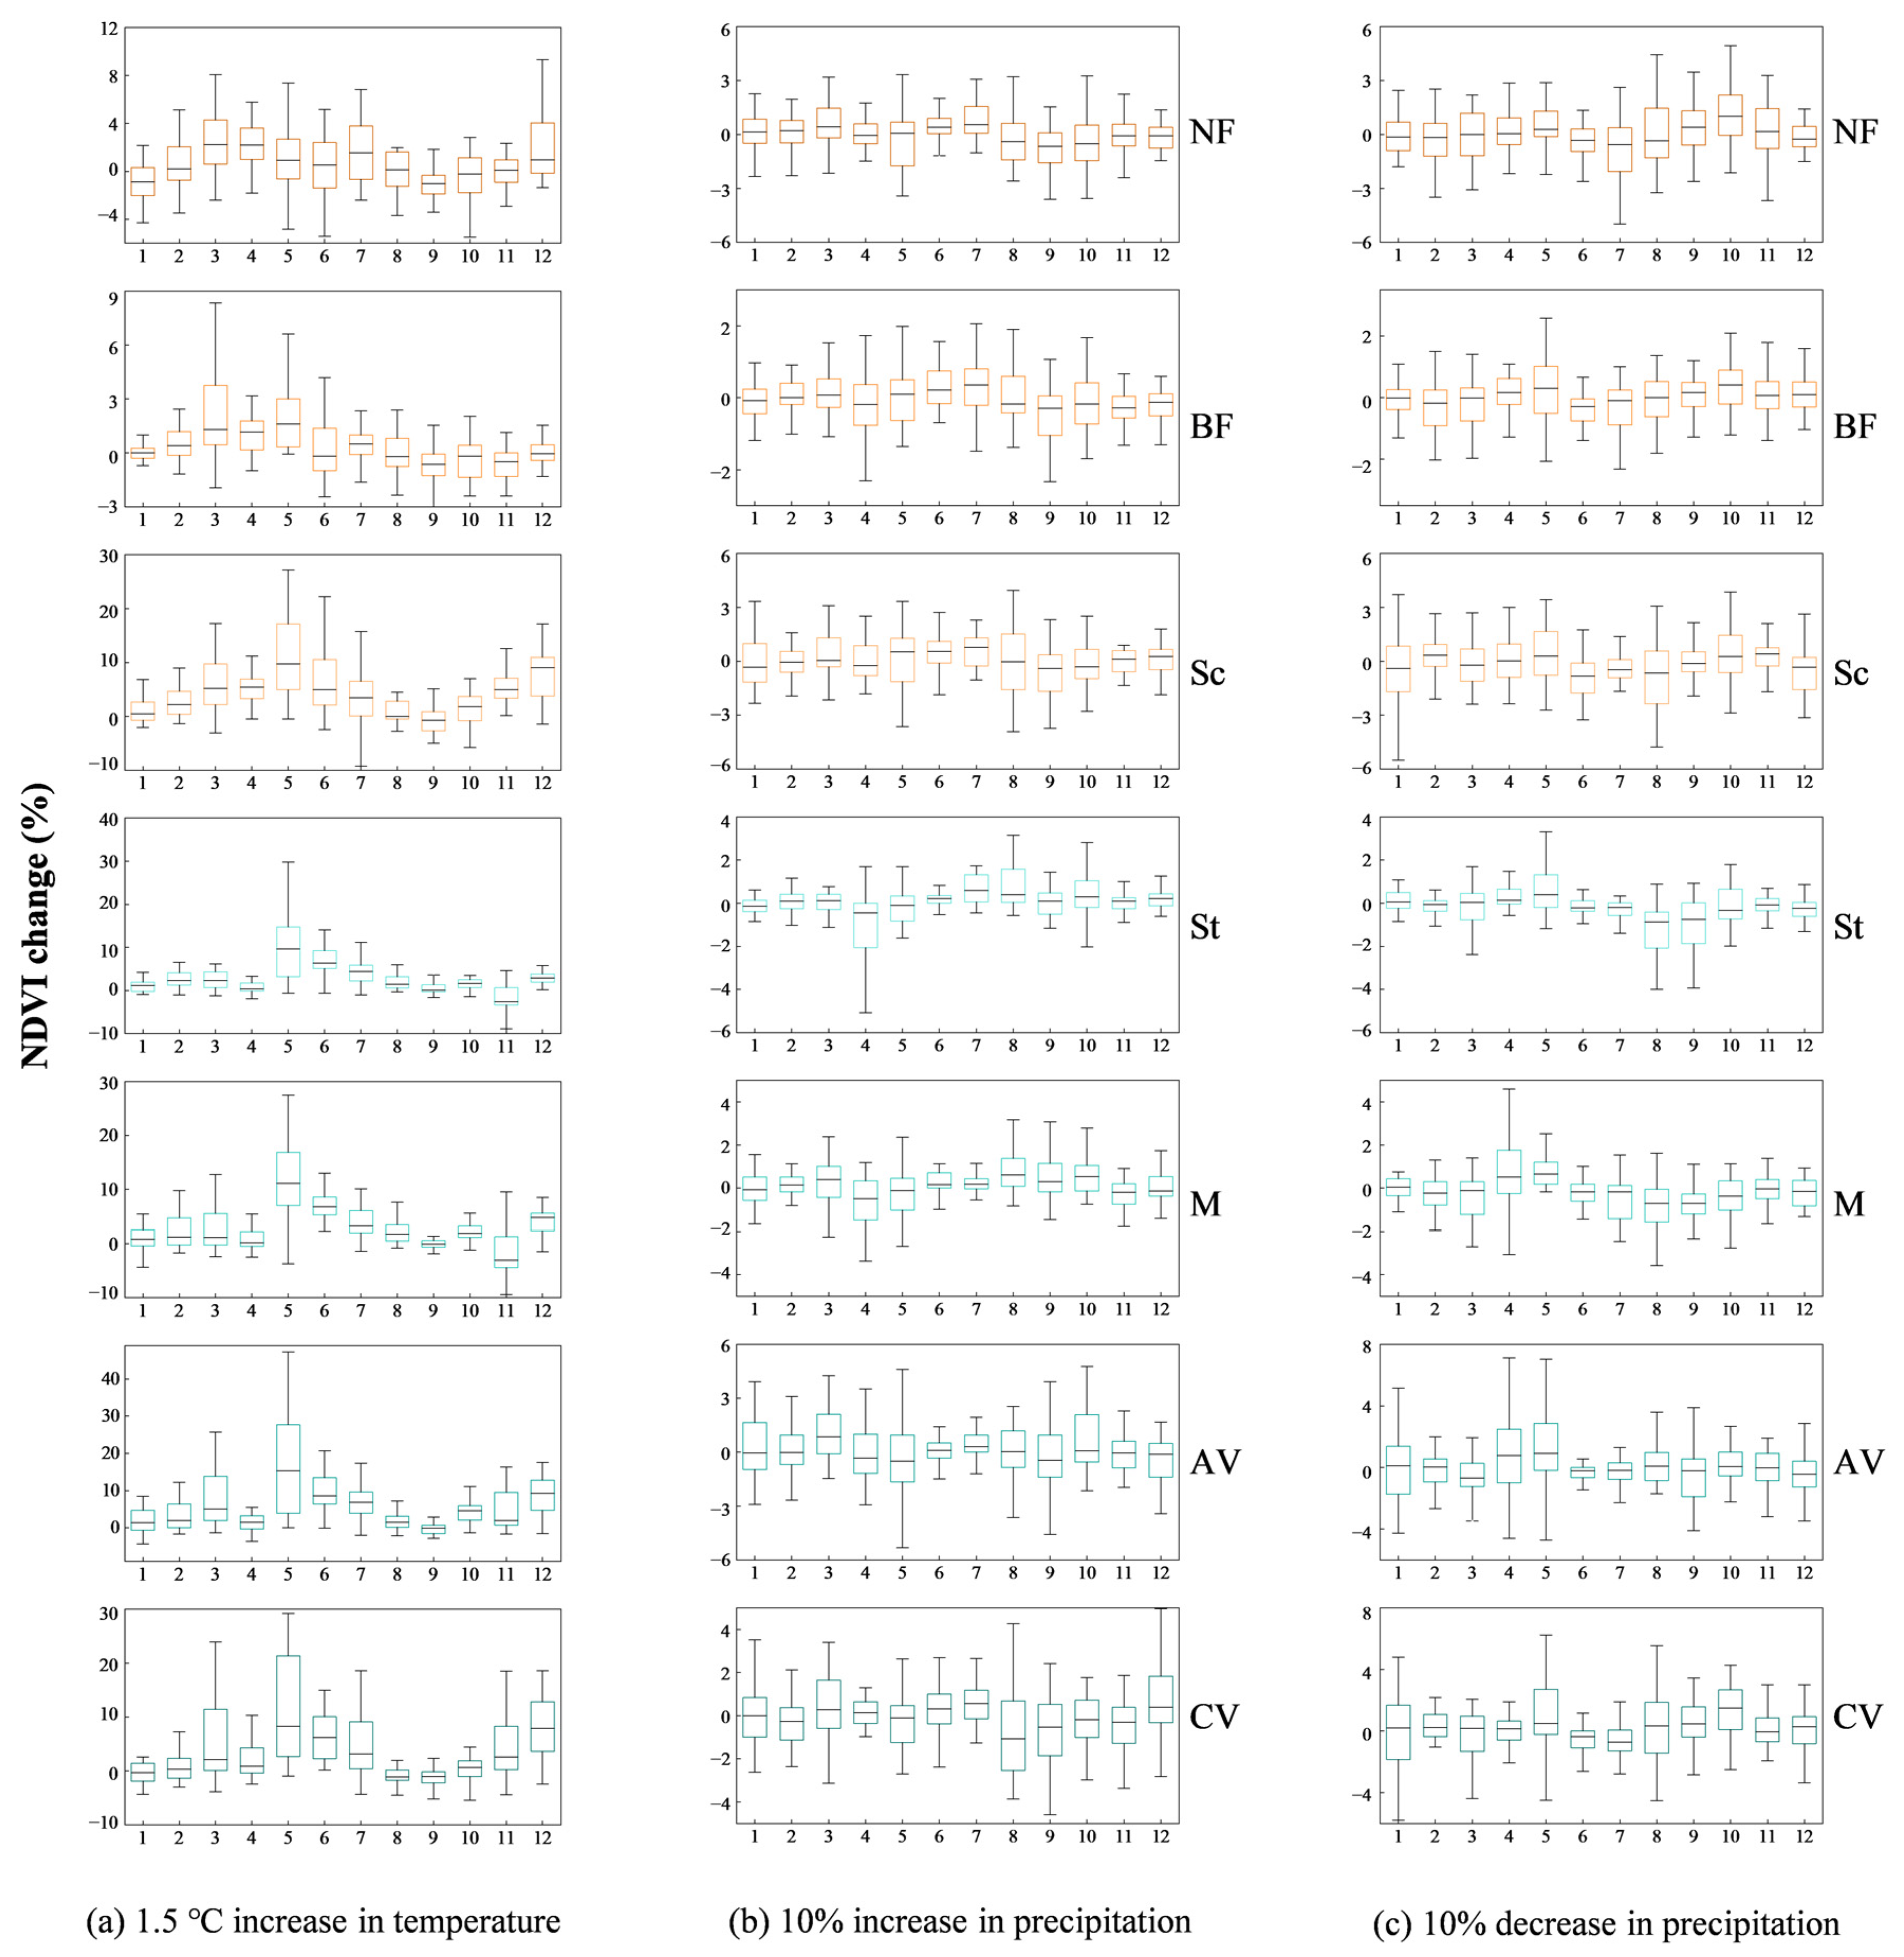
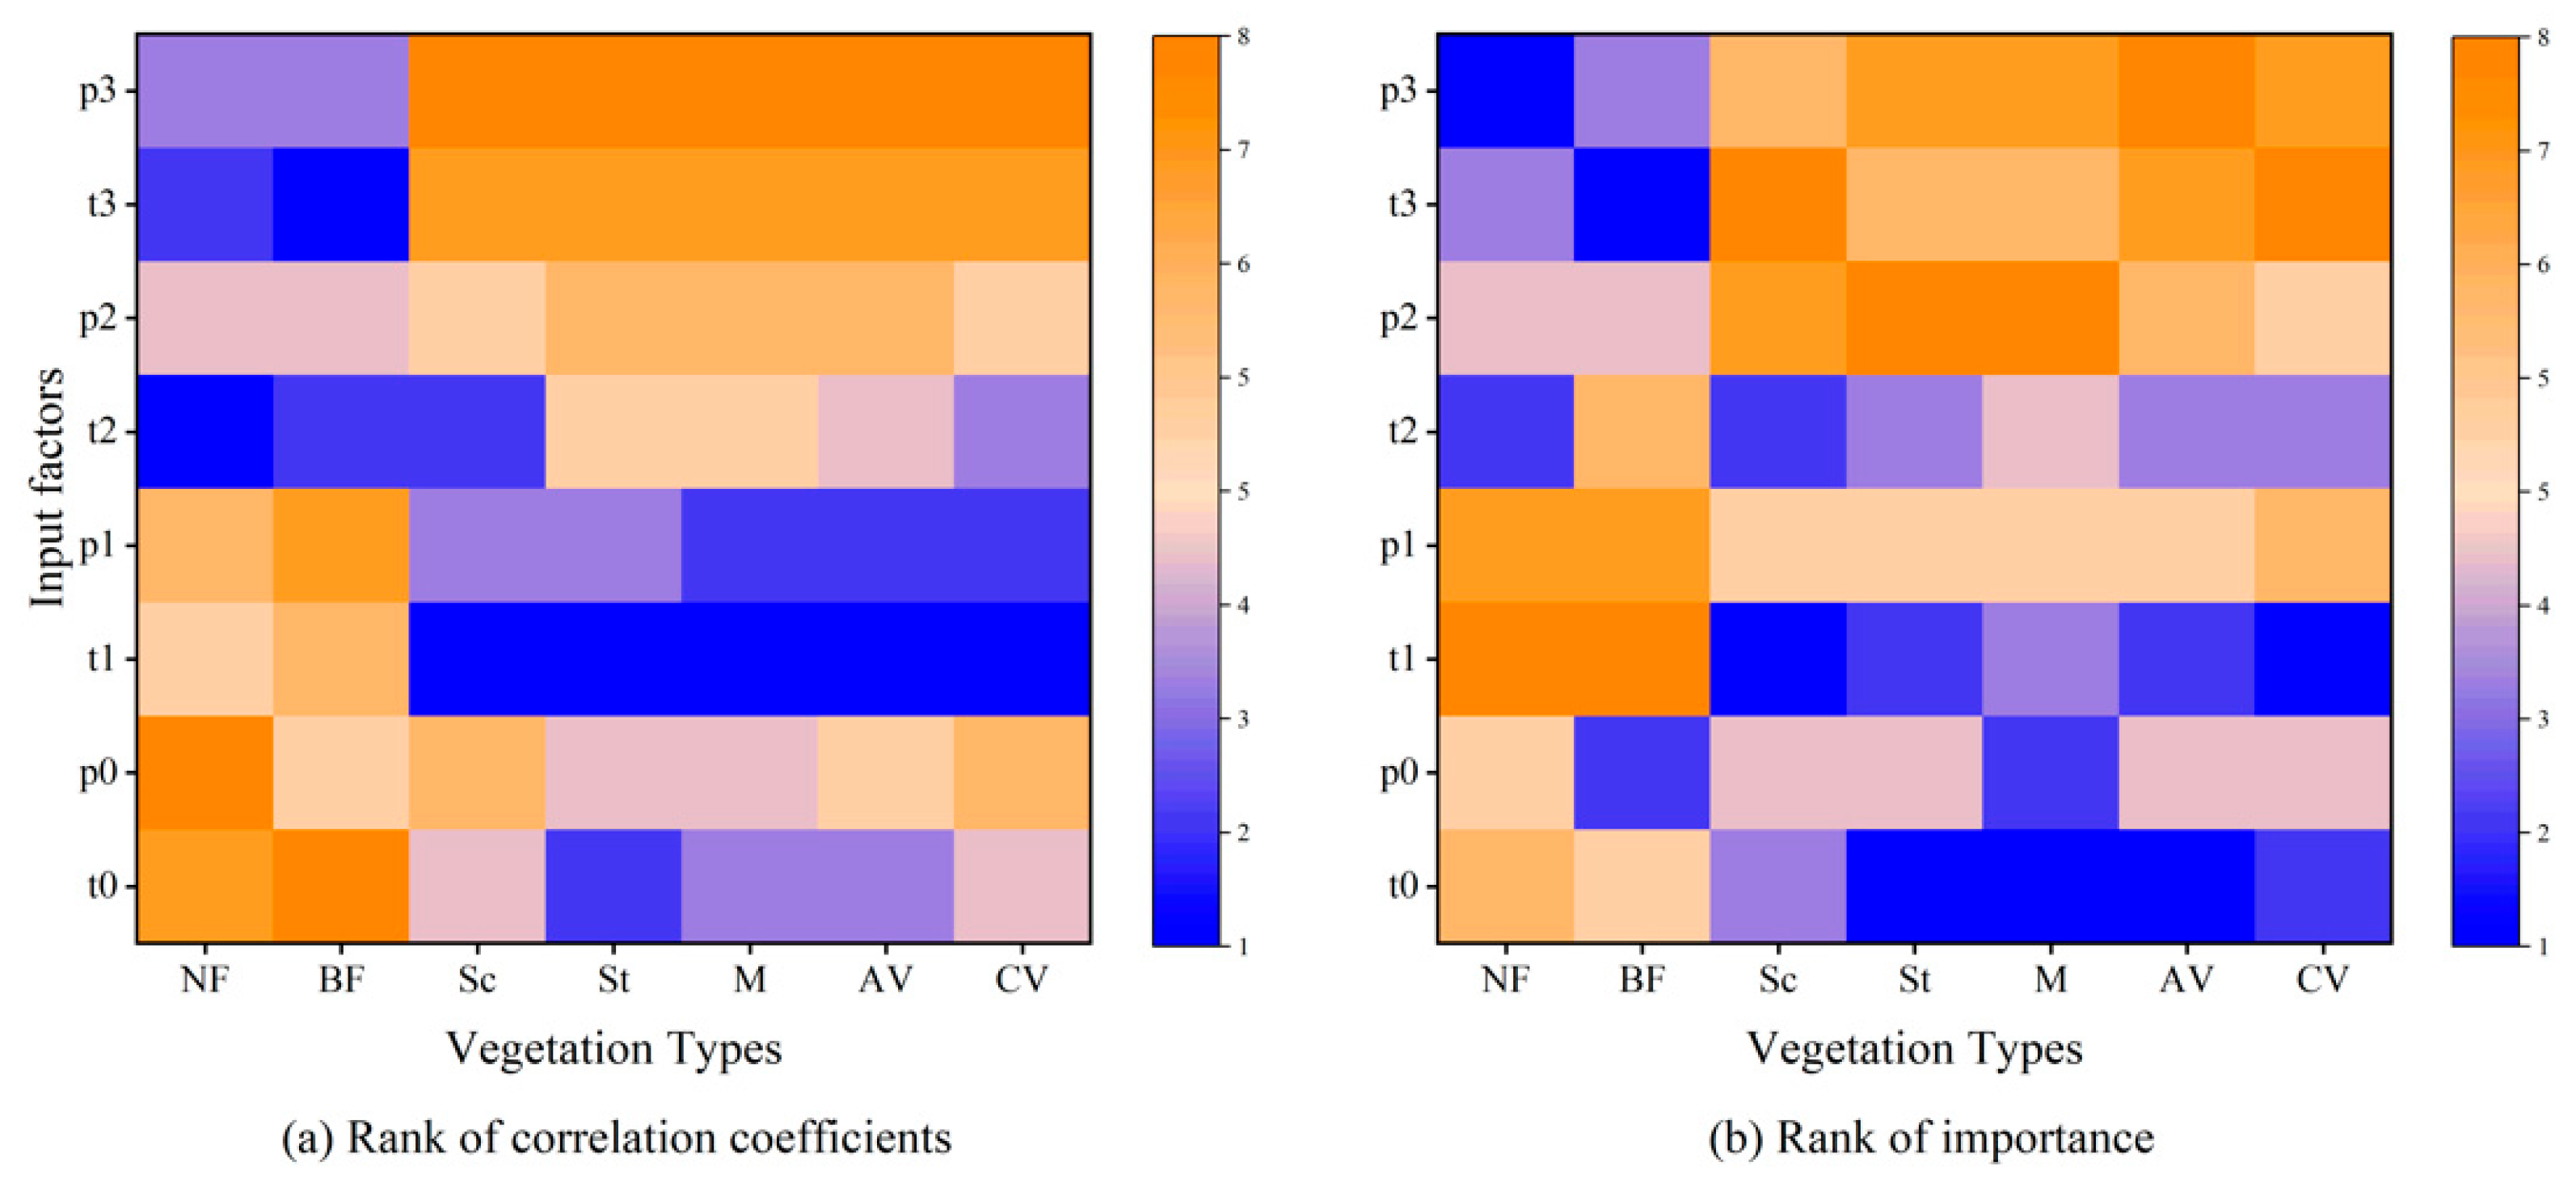
3.3. The Sensitivity to Climate Change for Different Vegetation Types
4. Discussion
4.1. The Time-Lag Effects of Temperature and Precipitation on Different Types of Vegetation
4.2. Limitations
5. Conclusions
Author Contributions
Funding
Institutional Review Board Statement
Informed Consent Statement
Data Availability Statement
Acknowledgments
Conflicts of Interest
References
- Piao, S.; Mohammat, A.; Fang, J.; Cai, Q.; Feng, J. NDVI-based increase in growth of temperate grasslands and its responses to climate changes in China. Glob. Environ. Chang. 2006, 16, 340–348. [Google Scholar] [CrossRef]
- Huang, S.; Ming, B.; Huang, Q.; Leng, G.; Hou, B. A case study on a combination NDVI forecasting model based on the entropy weight method. Water Resour. Manag. 2017, 31, 3667–3681. [Google Scholar] [CrossRef]
- Kumar, A.; Kumar, M.; Pandey, R.; Yu, Z.G.; Cabral-Pinto, M. Forest soil nutrient stocks along altitudinal range of Uttarakhand Himalayas: An aid to Nature Based Climate Solutions. Catena 2021, 207, 105667. [Google Scholar] [CrossRef]
- Lemordant, L.; Gentine, P.; Swann, A.S.; Cook, B.I.; Scheff, J. Critical impact of vegetation physiology on the continental hydrologic cycle in response to increasing CO2. Proc. Natl. Acad. Sci. USA 2018, 115, 4093–4098. [Google Scholar] [CrossRef] [PubMed] [Green Version]
- Wu, D.H.; Zhao, X.; Liang, S.L.; Zhou, T.; Huang, K.C.; Tang, B.J.; Zhao, W.Q. Time-lag effects of global vegetation responses to climate change. Glob. Chang. Biol. 2015, 21, 3520–3531. [Google Scholar] [CrossRef] [PubMed]
- Seddon, A.W.R.; Macias-Fauria, M.; Long, P.R.; Benz, D.; Willis, K.J. Sensitivity of global terrestrial ecosystems to climate variability. Nature 2016, 531, 229–232. [Google Scholar] [CrossRef] [Green Version]
- Wei, X.; Wang, N.; Luo, P.; Yang, J.; Zhang, J.; Lin, K. Spatiotemporal assessment of land marketization and its driving forces for sustainable Urban–Rural development in Shaanxi Province in China. Sustainability 2021, 13, 7755. [Google Scholar] [CrossRef]
- Luo, P.; Mu, Y.; Wang, S.; Zhu, W.; Mishra, B.K.; Huo, A.; Zhou, M.; Lyu, J.; Hu, M.; Duan, W.; et al. Exploring sustainable solutions for the water environment in Chinese and Southeast Asian cities. Ambio 2021, 51, 1199–1218. [Google Scholar] [CrossRef] [PubMed]
- Fu, J.; Niu, J.; Sivakumar, B. Prediction of vegetation anomalies over an inland river basin in north-western China. Hydrol. Process. 2018, 32, 1814–1827. [Google Scholar] [CrossRef]
- Ge, J.; Meng, B.; Liang, T.; Feng, Q.; Gao, J.; Yang, S.; Huang, X.; Xie, H. Modeling alpine grassland cover based on MODIS data and support vector machine regression in the headwater region of the Huanghe River, China. Remote Sens. Environ. 2018, 218, 162–173. [Google Scholar] [CrossRef]
- Kim, J.B.; Kerns, B.K.; Drapek, R.J.; Pitts, G.S.; Halofsky, J.E. Simulating vegetation response to climate change in the Blue Mountains with MC2 dynamic global vegetation model. Clim. Serv. 2018, 10, 20–32. [Google Scholar] [CrossRef]
- Bao, Z.; Zhang, J.; Wang, G.; Guan, T.; Jin, J.; Liu, Y.; Li, M.; Ma, T. The sensitivity of vegetation cover to climate change in multiple climatic zones using machine learning algorithms. Ecol. Indic. 2021, 124, 107443. [Google Scholar] [CrossRef]
- Gerten, D.; Schaphoff, S.; Haberlandt, U.; Lucht, W.; Sitch, S. Terrestrial vegetation and water balance—Hydrological evaluation of a dynamic global vegetation model. J. Hydrol. 2004, 286, 249–270. [Google Scholar] [CrossRef]
- Winter, J.M.; Pal, J.S.; Eltahir, E.A.B. Coupling of integrated biosphere simulator to Regional Climate Model Version 3. J. Clim. 2009, 22, 2743–2757. [Google Scholar] [CrossRef]
- Piao, S.; Wang, X.; Ciais, P.; Zhu, B.; Wang, T.A.O.; Liu, J.I.E. Changes in satellite-derived vegetation growth trend in temperate and boreal Eurasia from 1982 to 2006. Glob. Chang. Biol. 2011, 17, 3228–3239. [Google Scholar] [CrossRef]
- Bondeau, A.; Smith, P.C.; Zaehle, S.; Schaphoff, S.; Lucht, W.; Cramer, W.; Gerten, D.; Lotze-Campen, H.; Müller, C.; Reichstein, M.; et al. Modelling the role of agriculture for the 20th century global terrestrial carbon balance. Glob. Chang. Biol. 2007, 13, 679–706. [Google Scholar] [CrossRef]
- Smith, B.; Knorr, W.; Widlowski, J.-L.; Pinty, B.; Gobron, N. Combining remote sensing data with process modeling to monitor boreal conifer forest carbon balances. For. Ecol. Manag. 2008, 255, 3985–3994. [Google Scholar] [CrossRef]
- Schroter, D.; Cramer, W.; Leemans, R.; Prentice, I.C.; Araujo, M.B.; Arnell, N.W.; Bondeau, A.; Bugmann, H.; Carter, T.R.; Gracia, C.A.; et al. Ecosystem service supply and vulnerability to global change in Europe. Science 2005, 310, 1333–1337. [Google Scholar] [CrossRef] [Green Version]
- Zaehle, S.; Sitch, S.; Smith, B.; Hatterman, F. Effects of parameter uncertainties on the modeling of terrestrial biosphere dynamics. Glob. Biogeochem. Cycles 2005, 19, GB3020. [Google Scholar] [CrossRef]
- Zuo, D.; Han, Y.; Xu, Z.; Li, P.; Ban, C.; Sun, W.; Pang, B.; Peng, D.; Kan, G.; Zhang, R.; et al. Time-lag effects of climatic change and drought on vegetation dynamics in an alpine river basin of the Tibet Plateau, China. J. Hydrol. 2021, 600, 126532. [Google Scholar] [CrossRef]
- Zheng, K.; Wei, J.Z.; Pei, J.Y.; Cheng, H.; Zhang, X.L.; Huang, F.Q.; Li, F.M.; Ye, J.S. Impacts of climate change and human activities on grassland vegetation variation in the Chinese Loess Plateau. Sci. Total Environ. 2019, 660, 236–244. [Google Scholar] [CrossRef]
- Yuan, H.H.; Yang, G.J.; Li, C.C.; Wang, Y.J.; Liu, J.G.; Yu, H.Y.; Feng, H.K.; Xu, B.; Zhao, X.Q.; Yang, X.D. Retrieving soybean leaf area index from unmanned aerial vehicle hyperspectral remote sensing: Analysis of RF, ANN, and SVM regression models. Remote Sens. 2017, 9, 309. [Google Scholar] [CrossRef] [Green Version]
- Sun, W.; Wang, Y.; Fu, Y.H.; Xue, B.; Wang, G.; Yu, J.; Zuo, D.; Xu, Z. Spatial heterogeneity of changes in vegetation growth and their driving forces based on satellite observations of the Yarlung Zangbo River Basin in the Tibetan Plateau. J. Hydrol. 2019, 574, 324–332. [Google Scholar] [CrossRef]
- Li, H.; Jiang, J.; Chen, B.; Li, Y.; Xu, Y.; Shen, W. Pattern of NDVI-based vegetation greening along an altitudinal gradient in the eastern Himalayas and its response to global warming. Environ. Monit. Assess. 2016, 188, 186. [Google Scholar] [CrossRef]
- Krakauer, N.; Lakhankar, T.; Anadón, J. Mapping and attributing normalized difference vegetation index trends for Nepal. Remote Sens. 2017, 9, 986. [Google Scholar] [CrossRef] [Green Version]
- Chi, K.; Pang, B.; Cui, L.; Peng, D.; Zhu, Z.; Zhao, G.; Shi, S. Modelling the vegetation response to climate changes in the Yarlung Zangbo River Basin using random forest. Water 2020, 12, 1433. [Google Scholar] [CrossRef]
- You, Q.; Kang, S.; Wu, Y.; Yan, Y. Climate change over the Yarlung Zangbo River Basin during 1961–2005. J. Geogr. Sci. 2007, 17, 409–420. [Google Scholar] [CrossRef]
- Guo, B.; Han, F.; Jiang, L. An improved dimidiated pixel model for vegetation fraction in the Yarlung Zangbo River Basin of Qinghai-Tibet Plateau. J. Indian Soc. Remote Sens. 2017, 46, 219–231. [Google Scholar] [CrossRef]
- Yang, K.; Ye, B.; Zhou, D.; Wu, B.; Foken, T.; Qin, J.; Zhou, Z. Response of hydrological cycle to recent climate changes in the Tibetan Plateau. Clim. Chang. 2011, 109, 517–534. [Google Scholar] [CrossRef]
- Li, F.; Xu, Z.; Liu, W.; Zhang, Y. The impact of climate change on runoff in the Yarlung Tsangpo River basin in the Tibetan Plateau. Stoch. Environ. Res. Risk Assess. 2013, 28, 517–526. [Google Scholar] [CrossRef]
- Xu, Z.X.; Liu, W.; Li, F.P.; Liu, P. Vegetation change and its relationship with precipitation on the southern Tibetan Plateau. IAHS Publ. 2013, 359, 418–424. [Google Scholar]
- Ren, M.; Pang, B.; Xu, Z.; Yue, J.; Zhang, R. Downscaling of daily extreme temperatures in the Yarlung Zangbo River Basin using machine learning techniques. Theor. Appl. Climatol. 2018, 136, 1275–1288. [Google Scholar] [CrossRef]
- Mohammadi, B.; Mehdizadeh, S. Modeling daily reference evapotranspiration via a novel approach based on support vector regression coupled with whale optimization algorithm. Agric. Water Manag. 2020, 237, 106145. [Google Scholar] [CrossRef]
- Breiman, L. Random forests. Mach. Learn. 2001, 45, 5–32. [Google Scholar] [CrossRef] [Green Version]
- Pang, B.; Yue, J.; Zhao, G.; Xu, Z. Statistical Downscaling of Temperature with the Random Forest Model. Adv. Meteorol. 2017, 2017, 7265178. [Google Scholar] [CrossRef] [Green Version]
- Nash, J.E.; Sutcliffe, J.V. River flow forecasting through conceptual models Part I—A discussion of principles. J. Hydrol. 1970, 3, 282–290. [Google Scholar] [CrossRef]
- Simon, H.; Baker, K.R.; Phillips, S. Compilation and interpretation of photochemical model performance statistics published between 2006 and 2012. Atmos. Environ. 2012, 61, 124–139. [Google Scholar] [CrossRef]
- Su, F.G.; Duan, X.L.; Chen, D.L.; Hao, Z.C.; Cuo, L. Evaluation of the global climate, models in the CMIP5 over the Tibetan Plateau. Int. J. Climatol. 2013, 26, 3187–3208. [Google Scholar] [CrossRef] [Green Version]
- Gao, Q.Z.; Guo, Y.Q.; Xu, H.M.; Ganjurjav, H.; Li, Y.; Wan, Y.F.; Qin, X.B.; Ma, X.; Liu, S. Climate change and its impacts on vegetation distribution and net primary productivity of the alpine ecosystem in the Qinghai-Tibetan Plateau. Sci. Total Environ. 2016, 554, 34–41. [Google Scholar] [CrossRef]
- Zhang, J.Y.; Lun, Y.R.; Liu, L.; Liu, Y.X.; Li, X.; Xu, Z.X. CMIP6 evaluation and projection of climate change over the Tibetan Plateau. J. Beijing Norm. Univ. Nat. Sci. 2022, 58, 77–89. [Google Scholar] [CrossRef]
- Sen, P.K. Estimates of the regression coefficient based on Kendall’s Tau. J. Am. Stat. Assoc. 1968, 63, 1379–1389. [Google Scholar] [CrossRef]
- Park, H.; Jeong, S.J.; Ho, C.H.; Kim, J.; Brown, M.E.; Schaepman, M.E. Nonlinear response of vegetation green-up to local temperature variations in temperate and boreal forests in the Northern Hemisphere. Remote Sens. Environ. 2015, 165, 100–108. [Google Scholar] [CrossRef]
- Han, X.M.; Zuo, D.P.; Xu, Z.X.; Cai, S.Y.; Gao, X.X. Analysis of vegetation condition and its relationship with meteorological variables in the Yarlung Zangbo River Basin of China. Proc. Int. Assoc. Hydrol. Sci. 2018, 379, 105–112. [Google Scholar] [CrossRef] [Green Version]
- Li, H.D.; Li, Y.K.; Shen, W.S.; Li, Y.N.; Lin, J.; Lu, X.Y.; Xu, X.; Jiang, J. Elevation-dependent vegetation greening of the Yarlung Zangbo River Basin in the Southern Tibetan Plateau, 1999–2013. Remote Sens. 2015, 7, 16672–16687. [Google Scholar] [CrossRef] [Green Version]
- Wang, K.; Zhang, L.; Qiu, Y.B.; Ji, L.; Tian, F.; Wang, C.Z.; Wang, Z.Y. Snow effects on alpine vegetation in the Qinghai-Tibetan Plateau. Int. J. Digit. Earth 2015, 8, 56–73. [Google Scholar] [CrossRef]
- Wan, Y.F.; Gao, Q.Z.; Li, Y.; Qin, X.B.; Ganjurjav; Zhang, W.N.; Ma, X.; Liu, S. Change of snow cover and its impact on alpine vegetation in the source regions of large rivers on the Qinghai-Tibetan Plateau, China. Arct. Antarct. Alp. Res. 2014, 46, 632–644. [Google Scholar] [CrossRef] [Green Version]
- Ban, C.; Xu, Z.; Zuo, D.; Zhang, R.; Chen, H.; Ye, C.; Wang, J.; Waciren, D. Impact of variability in the hydrological cycle components on vegetation growth in an alpine basin of the southeastern Tibet Plateau, China. Hydrol. Res. 2022, 53, 124–140. [Google Scholar] [CrossRef]
- Liu, X.W.; Xu, Z.X.; Liu, W.F.; Liu, L. Responses of hydrological processes to climate change in the Yarlung Zangbo River basin. Hydrol. Sci. J. 2019, 64, 2057–2067. [Google Scholar] [CrossRef]
- Lu, Y.Y.; Liu, F.; Zhao, Y.G.; Song, X.D.; Zhang, G.L. An integrated method of selecting environmental covariates for predictive soil depth mapping. J. Integr. Agric. 2019, 18, 301–315. [Google Scholar] [CrossRef]
- Fabris, F.; Doherty, A.; Palmer, D.; de Magalhaes, J.P.; Freitas, A.A. A new approach for interpreting Random Forest models and its application to the biology of ageing. Bioinformatics 2018, 34, 2449–2456. [Google Scholar] [CrossRef] [PubMed]
- Li, H.; Liu, L.; Liu, X.; Li, X.; Xu, Z. Greening Implication Inferred from Vegetation Dynamics interacted with climate change and human activities over the Southeast Qinghai–Tibet Plateau. Remote Sens. 2019, 11, 2421. [Google Scholar] [CrossRef] [Green Version]
- Liu, L.; Niu, Q.; Heng, J.; Li, H.; Xu, Z. Transition characteristics of the Dry-Wet regime and vegetation dynamic responses over the Yarlung Zangbo River Basin, Southeast Qinghai-Tibet Plateau. Remote Sens. 2019, 11, 1254. [Google Scholar] [CrossRef] [Green Version]
- Filippa, G.; Cremonese, E.; Galvagno, M.; Isabellon, M.; Bayle, A.; Choler, P.; Carlson, B.Z.; Gabellani, S.; di Cella, U.M.; Migliavacca, M. Climatic drivers of greening trends in the Alps. Remote Sens. 2019, 11, 2527. [Google Scholar] [CrossRef] [Green Version]
- Jiao, K.W.; Gao, J.B.; Wu, S.H.; Hou, W.J. Research progress on the response processes of vegetation activity to climate change. Acta Ecol. Sin. 2018, 38, 2229–2238. [Google Scholar]
- Afuye, G.A.; Kalumba, A.M.; Orimoloye, I.R. Characterisation of vegetation response to climate change: A review. Sustainability 2021, 13, 7265. [Google Scholar] [CrossRef]
- Zha, X.B.; Luo, P.P.; Zhu, W.; Wang, S.T.; Lyu, J.Q.; Zhou, M.M.; Huo, A.D.; Wang, Z.H. A bibliometric analysis of the research on Sponge City: Current situation and future development direction. Ecohydrology 2021, 14, e2328. [Google Scholar] [CrossRef]
- Luo, P.P.; Xu, C.Y.; Kang, S.X.; Huo, A.D.; Lyu, J.; Zhou, M.M.; Nover, D. Heavy metals in water and surface sediments of the Fenghe River Basin, China: Assessment and source analysis. Water Sci. Technol. 2021, 84, 3072–3090. [Google Scholar] [CrossRef] [PubMed]


| Climatic Variables | Temperature | Precipitation | ||||||||||
|---|---|---|---|---|---|---|---|---|---|---|---|---|
| Time lags (month) | 0 | 1 | 2 | 3 | 4 | 5 | 0 | 1 | 2 | 3 | 4 | 5 |
| Input factors | t0 | t1 | t2 | t3 | t4 | t5 | p0 | p1 | p2 | p3 | p4 | p5 |
| Vegetation Types | Models | Calibration | Validation | ||||||||
|---|---|---|---|---|---|---|---|---|---|---|---|
| NASH | RMSE | MAE | r | NMB | NASH | RMSE | MAE | r | NMB | ||
| Needleleaf Forest | MLR | 0.67 | 0.04 | 0.03 | 0.82 | 0.00 | 0.64 | 0.05 | 0.04 | 0.80 | −0.28 |
| SVM | 0.65 | 0.04 | 0.04 | 0.81 | 0.23 | 0.59 | 0.04 | 0.03 | 0.72 | −1.53 | |
| RF | 0.95 | 0.02 | 0.01 | 0.98 | 0.04 | 0.61 | 0.05 | 0.04 | 0.78 | −0.85 | |
| Broadleaf Forest | MLR | 0.68 | 0.03 | 0.03 | 0.82 | 0.00 | 0.68 | 0.03 | 0.03 | 0.83 | 0.46 |
| SVM | 0.81 | 0.04 | 0.03 | 0.91 | 1.69 | 0.62 | 0.05 | 0.04 | 0.78 | −3.52 | |
| RF | 0.95 | 0.01 | 0.01 | 0.98 | −0.01 | 0.65 | 0.04 | 0.04 | 0.81 | −0.01 | |
| Scrub | MLR | 0.86 | 0.04 | 0.03 | 0.93 | 0.00 | 0.82 | 0.04 | 0.03 | 0.91 | −2.11 |
| SVM | 0.81 | 0.04 | 0.03 | 0.91 | 0.16 | 0.80 | 0.04 | 0.03 | 0.89 | −1.00 | |
| RF | 0.99 | 0.01 | 0.01 | 0.99 | 0.01 | 0.87 | 0.03 | 0.03 | 0.94 | −3.75 | |
| Steppe | MLR | 0.94 | 0.02 | 0.01 | 0.97 | 0.00 | 0.92 | 0.02 | 0.02 | 0.96 | 1.03 |
| SVM | 0.71 | 0.03 | 0.03 | 0.85 | 3.07 | 0.89 | 0.02 | 0.02 | 0.95 | 2.11 | |
| RF | 1.00 | 0.00 | 0.00 | 1.00 | −0.06 | 0.96 | 0.01 | 0.01 | 0.98 | −0.71 | |
| Meadow | MLR | 0.94 | 0.02 | 0.02 | 0.97 | 0.00 | 0.94 | 0.02 | 0.02 | 0.97 | 0.48 |
| SVM | 0.67 | 0.03 | 0.03 | 0.81 | 6.73 | 0.93 | 0.02 | 0.02 | 0.98 | 0.55 | |
| RF | 1.00 | 0.01 | 0.00 | 1.00 | 0.02 | 0.97 | 0.01 | 0.01 | 0.99 | −0.93 | |
| Alpine Vegetation | MLR | 0.91 | 0.02 | 0.02 | 0.96 | 0.00 | 0.89 | 0.02 | 0.02 | 0.95 | −3.58 |
| SVM | 0.68 | 0.03 | 0.03 | 0.83 | 6.77 | 0.87 | 0.03 | 0.03 | 0.94 | 7.11 | |
| RF | 0.99 | 0.01 | 0.00 | 1.00 | 0.02 | 0.94 | 0.02 | 0.01 | 0.97 | −4.52 | |
| Cultivated Vegetation | MLR | 0.83 | 0.03 | 0.02 | 0.91 | 0.00 | 0.79 | 0.03 | 0.02 | 0.89 | −1.08 |
| SVM | 0.92 | 0.02 | 0.02 | 0.96 | 0.19 | 0.76 | 0.04 | 0.03 | 0.87 | 3.11 | |
| RF | 0.99 | 0.01 | 0.01 | 0.99 | 0.04 | 0.87 | 0.03 | 0.02 | 0.93 | −2.38 | |
| Average | MLR | 0.83 | 0.03 | 0.02 | 0.91 | 0.00 | 0.81 | 0.03 | 0.02 | 0.90 | −0.73 |
| SVM | 0.75 | 0.03 | 0.03 | 0.87 | 1.73 | 0.78 | 0.04 | 0.03 | 0.88 | 0.76 | |
| RF | 0.98 | 0.01 | 0.01 | 0.99 | 0.00 | 0.84 | 0.03 | 0.02 | 0.91 | −2.26 | |
| The NDVI of Different Vegetation Types | Input Factors | |||||||
|---|---|---|---|---|---|---|---|---|
| t0 | p0 | t1 | p1 | t2 | p2 | t3 | p3 | |
| Needleleaf Forest | 0.32 | 0.09 | 0.61 | 0.44 | 0.76 | 0.65 | 0.72 | 0.67 |
| Broadleaf Forest | 0.02 | 0.34 | 0.34 | 0.11 | 0.63 | 0.42 | 0.75 | 0.58 |
| Scrub | 0.71 | 0.65 | 0.86 | 0.80 | 0.81 | 0.70 | 0.57 | 0.44 |
| Steppe | 0.84 | 0.81 | 0.89 | 0.84 | 0.73 | 0.53 | 0.39 | 0.11 |
| Meadow | 0.85 | 0.84 | 0.88 | 0.85 | 0.72 | 0.52 | 0.37 | 0.09 |
| Alpine Vegetation | 0.80 | 0.77 | 0.89 | 0.85 | 0.77 | 0.63 | 0.47 | 0.28 |
| Cultivated Vegetation | 0.73 | 0.66 | 0.85 | 0.81 | 0.77 | 0.70 | 0.51 | 0.42 |
Publisher’s Note: MDPI stays neutral with regard to jurisdictional claims in published maps and institutional affiliations. |
© 2022 by the authors. Licensee MDPI, Basel, Switzerland. This article is an open access article distributed under the terms and conditions of the Creative Commons Attribution (CC BY) license (https://creativecommons.org/licenses/by/4.0/).
Share and Cite
Cui, L.; Pang, B.; Zhao, G.; Ban, C.; Ren, M.; Peng, D.; Zuo, D.; Zhu, Z. Assessing the Sensitivity of Vegetation Cover to Climate Change in the Yarlung Zangbo River Basin Using Machine Learning Algorithms. Remote Sens. 2022, 14, 1556. https://doi.org/10.3390/rs14071556
Cui L, Pang B, Zhao G, Ban C, Ren M, Peng D, Zuo D, Zhu Z. Assessing the Sensitivity of Vegetation Cover to Climate Change in the Yarlung Zangbo River Basin Using Machine Learning Algorithms. Remote Sensing. 2022; 14(7):1556. https://doi.org/10.3390/rs14071556
Chicago/Turabian StyleCui, Lizhuang, Bo Pang, Gang Zhao, Chunguang Ban, Meifang Ren, Dingzhi Peng, Depeng Zuo, and Zhongfan Zhu. 2022. "Assessing the Sensitivity of Vegetation Cover to Climate Change in the Yarlung Zangbo River Basin Using Machine Learning Algorithms" Remote Sensing 14, no. 7: 1556. https://doi.org/10.3390/rs14071556
APA StyleCui, L., Pang, B., Zhao, G., Ban, C., Ren, M., Peng, D., Zuo, D., & Zhu, Z. (2022). Assessing the Sensitivity of Vegetation Cover to Climate Change in the Yarlung Zangbo River Basin Using Machine Learning Algorithms. Remote Sensing, 14(7), 1556. https://doi.org/10.3390/rs14071556