
Grid-Based Essential Urban Land Use Classification: A Data and Model Driven Mapping Framework in Xiamen City


 , ,
, , 
Abstract
1. Introduction
2. Study Area and Datasets
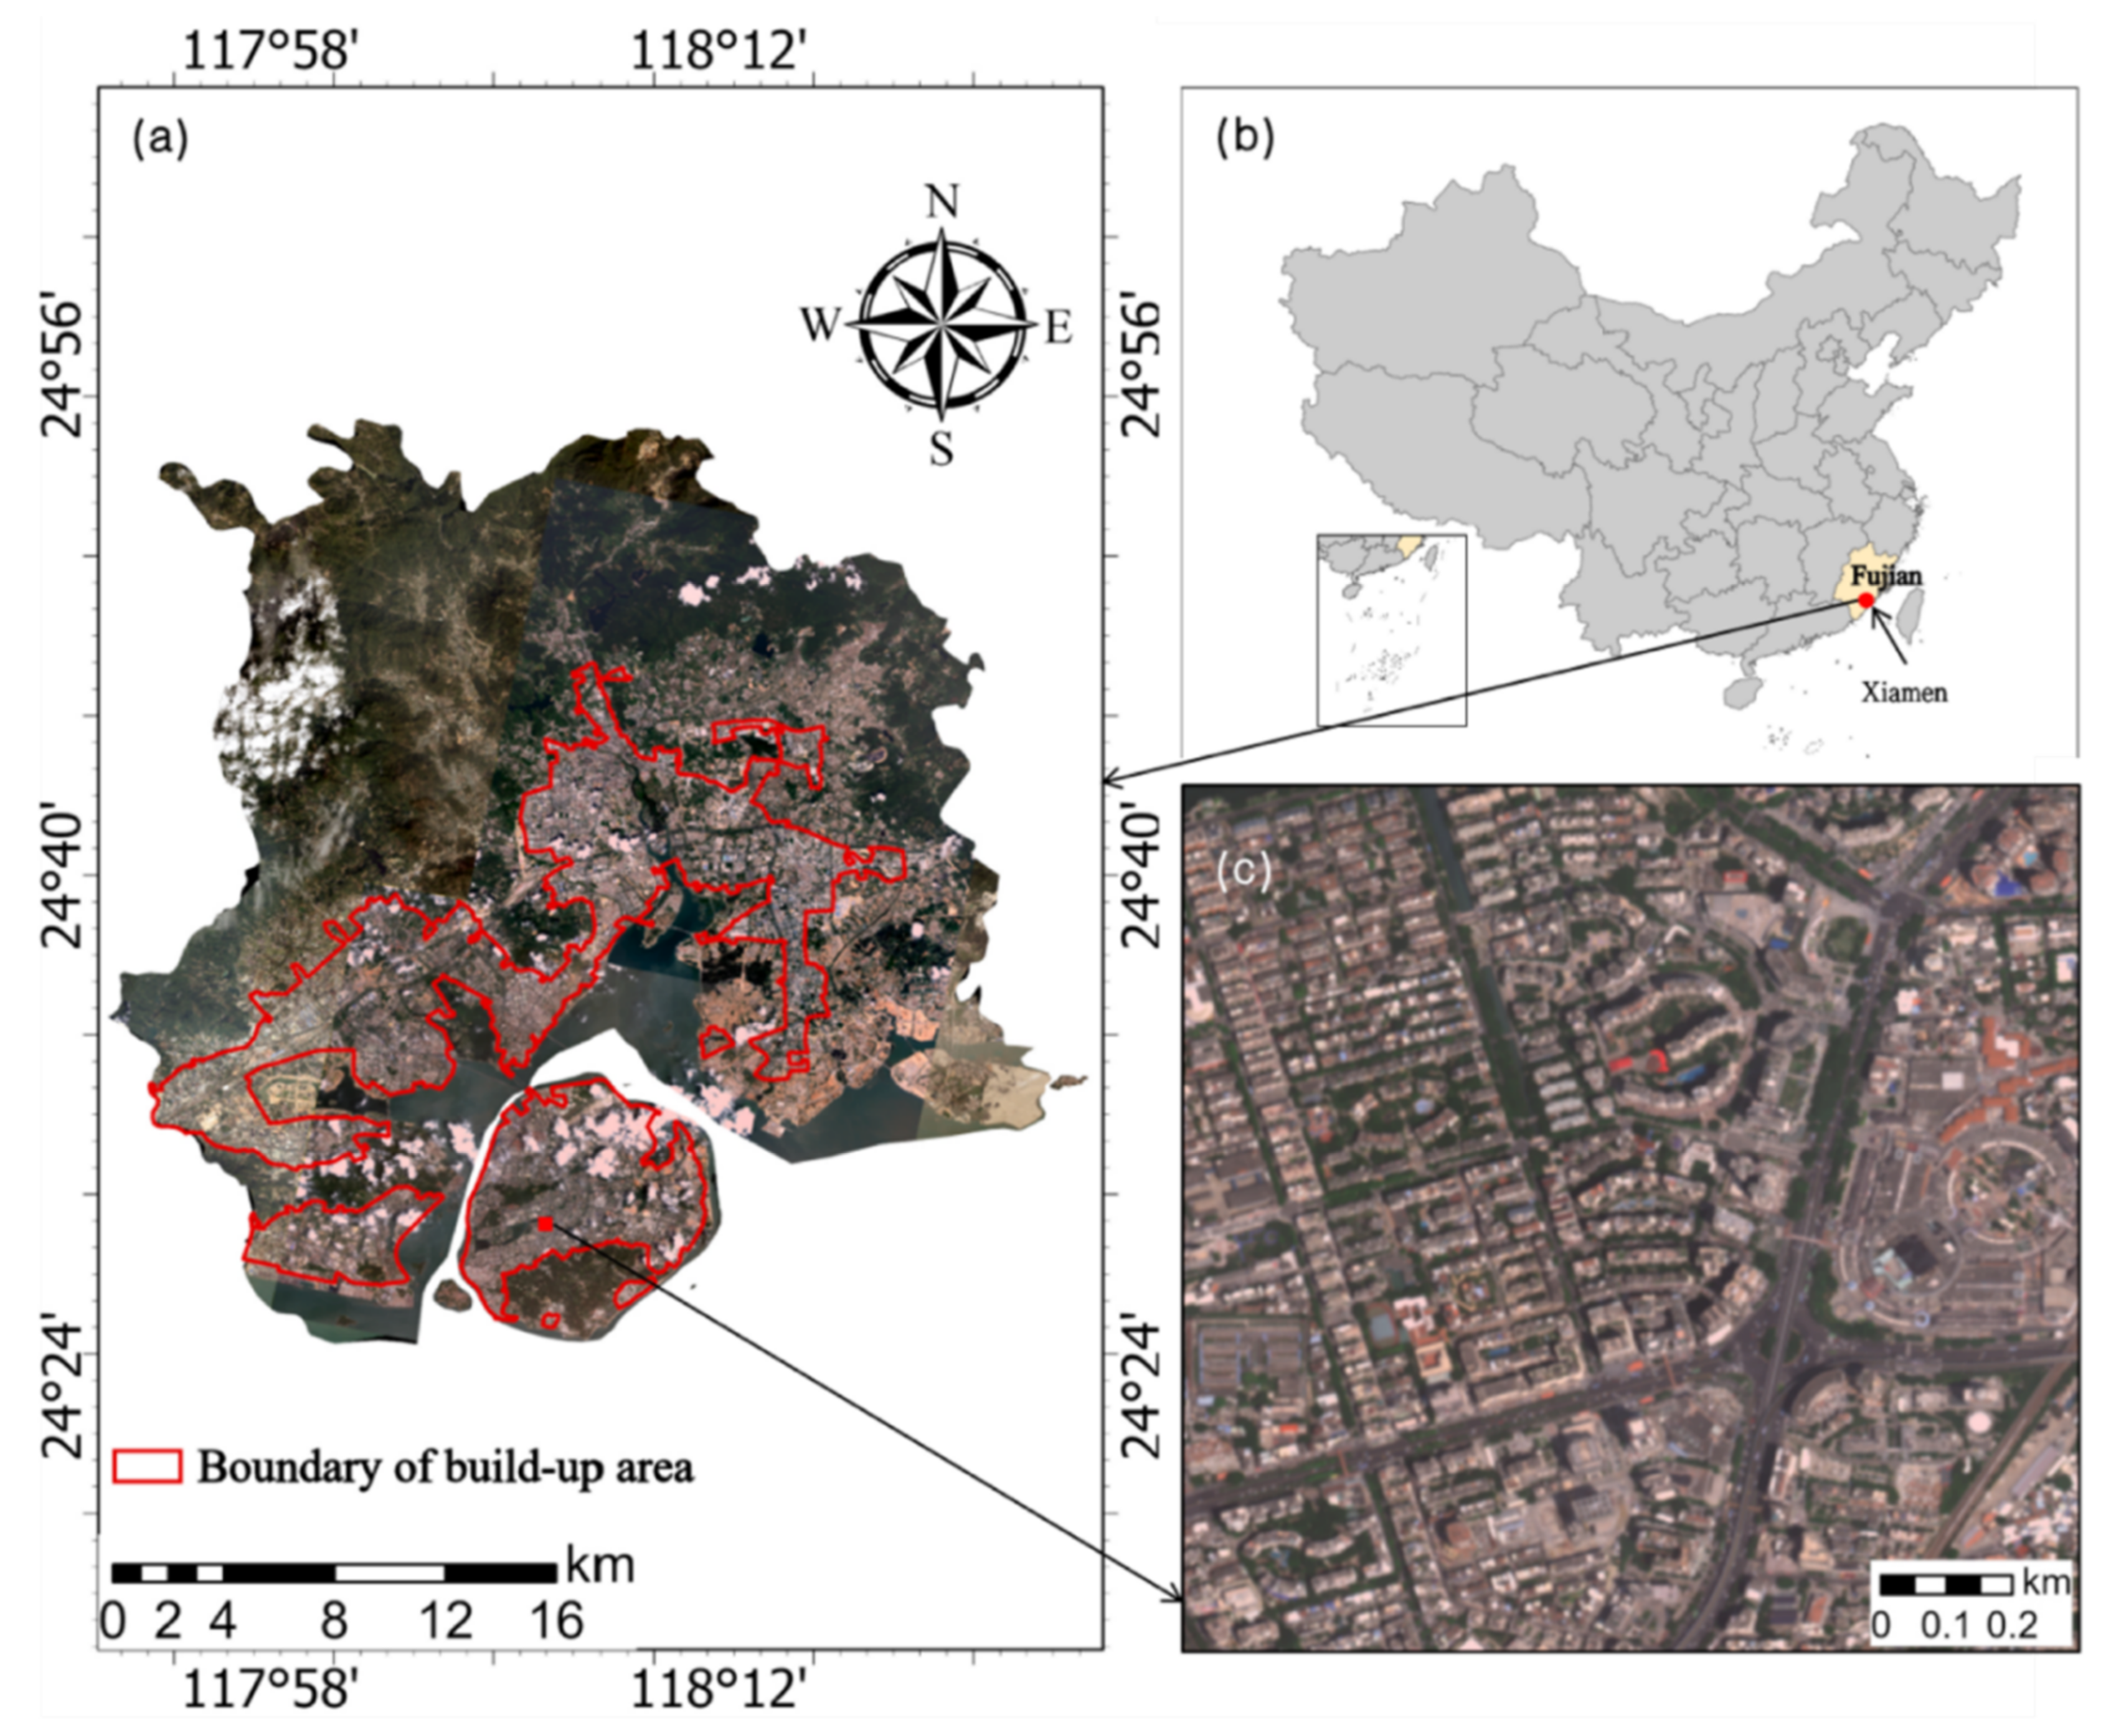
2.1. Study Area
2.2. Datasets
2.2.1. Satellite Spectral and Textural Data
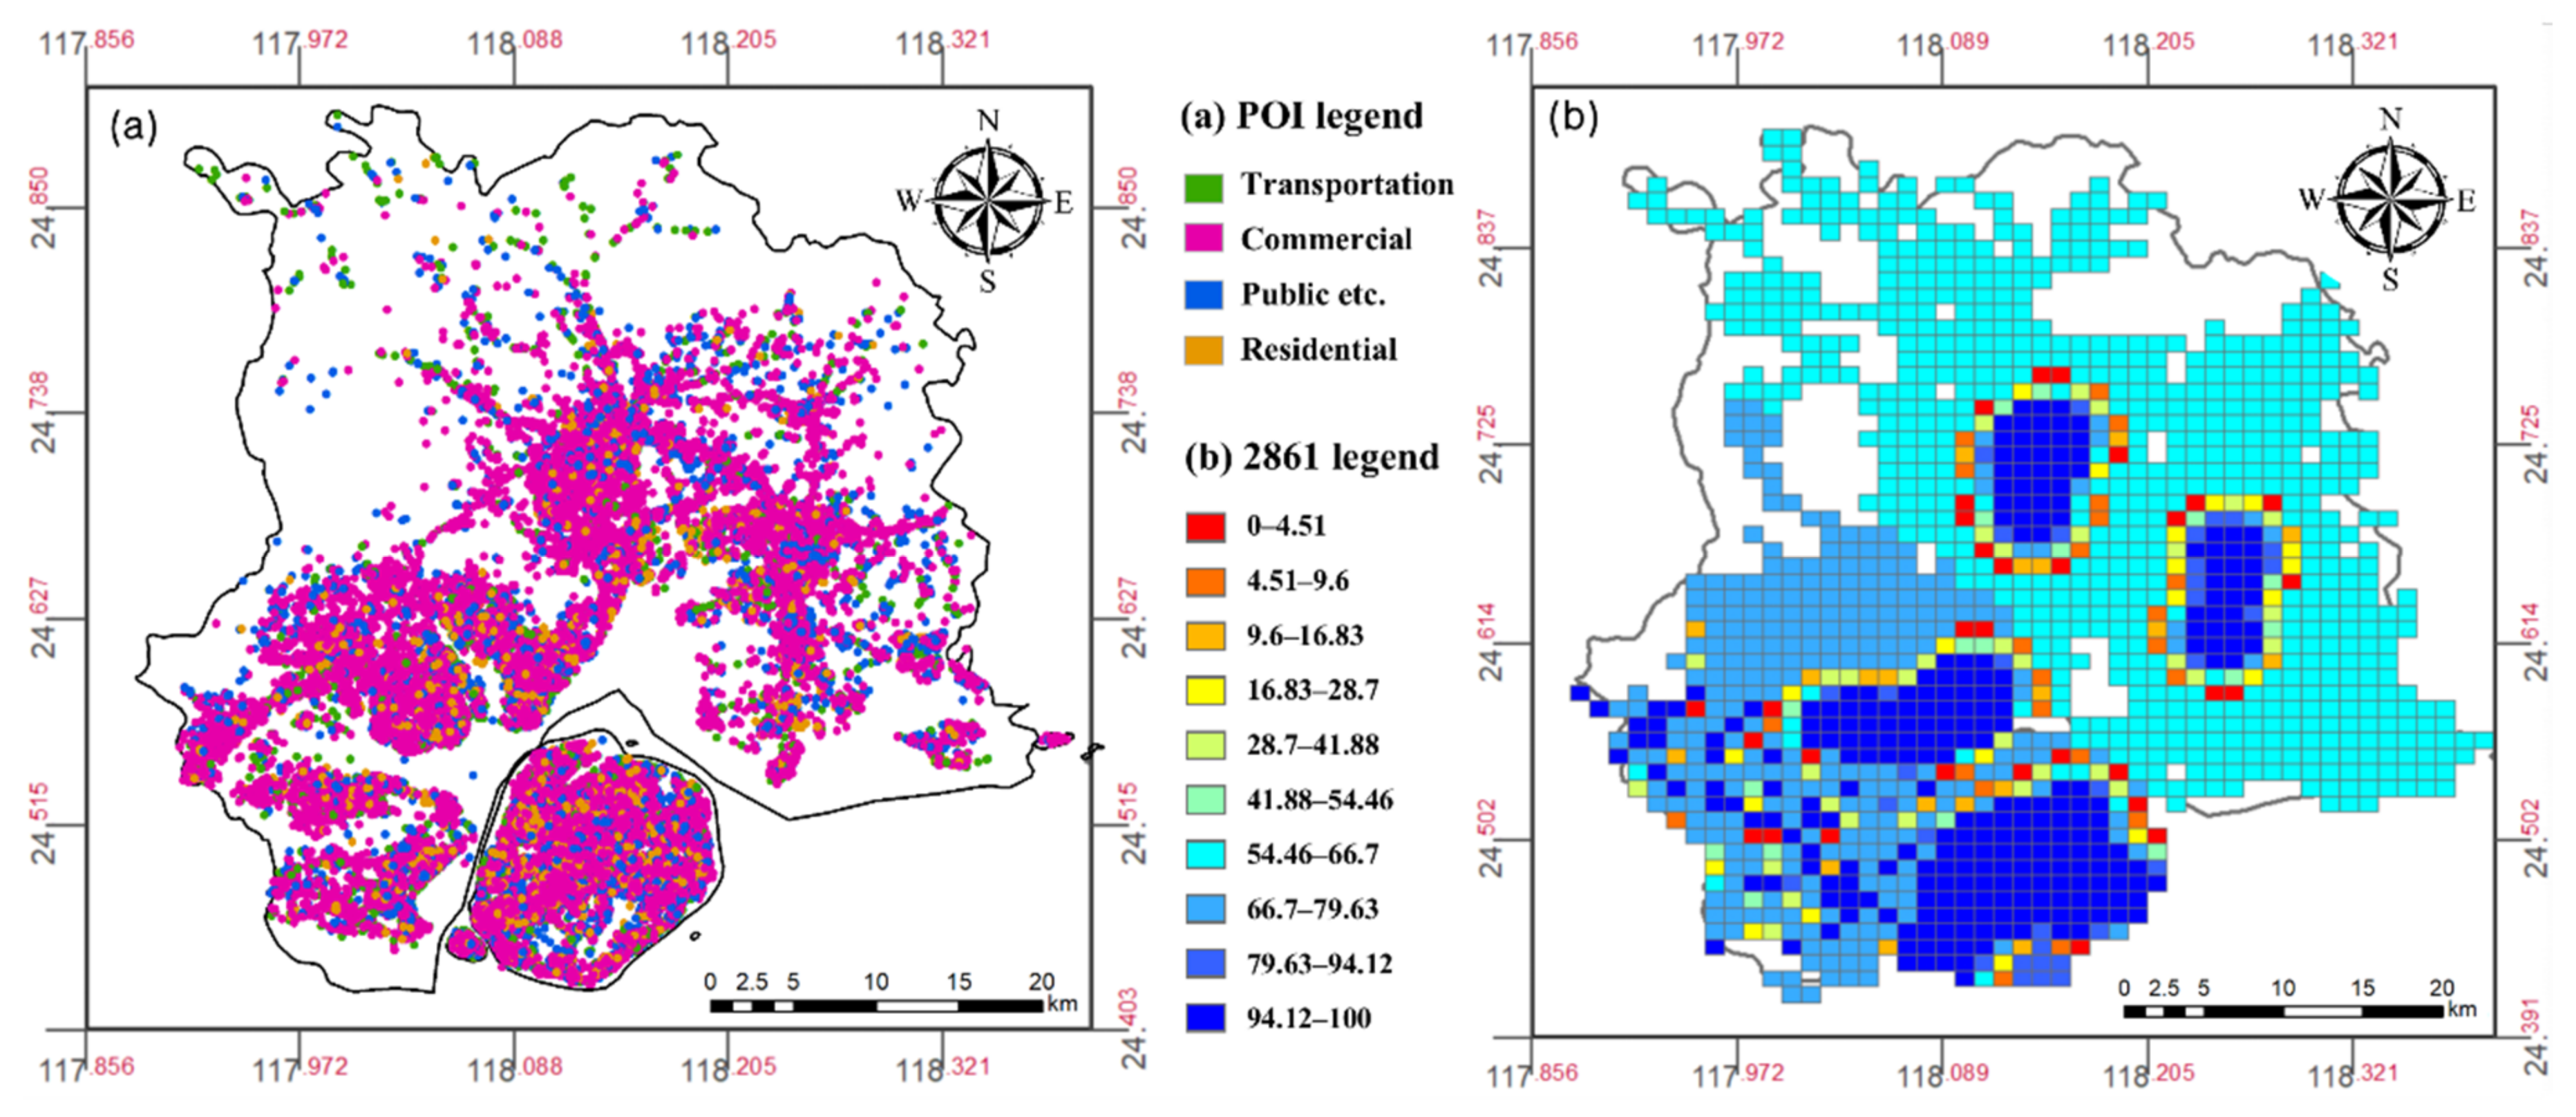
2.2.2. Social Big Data
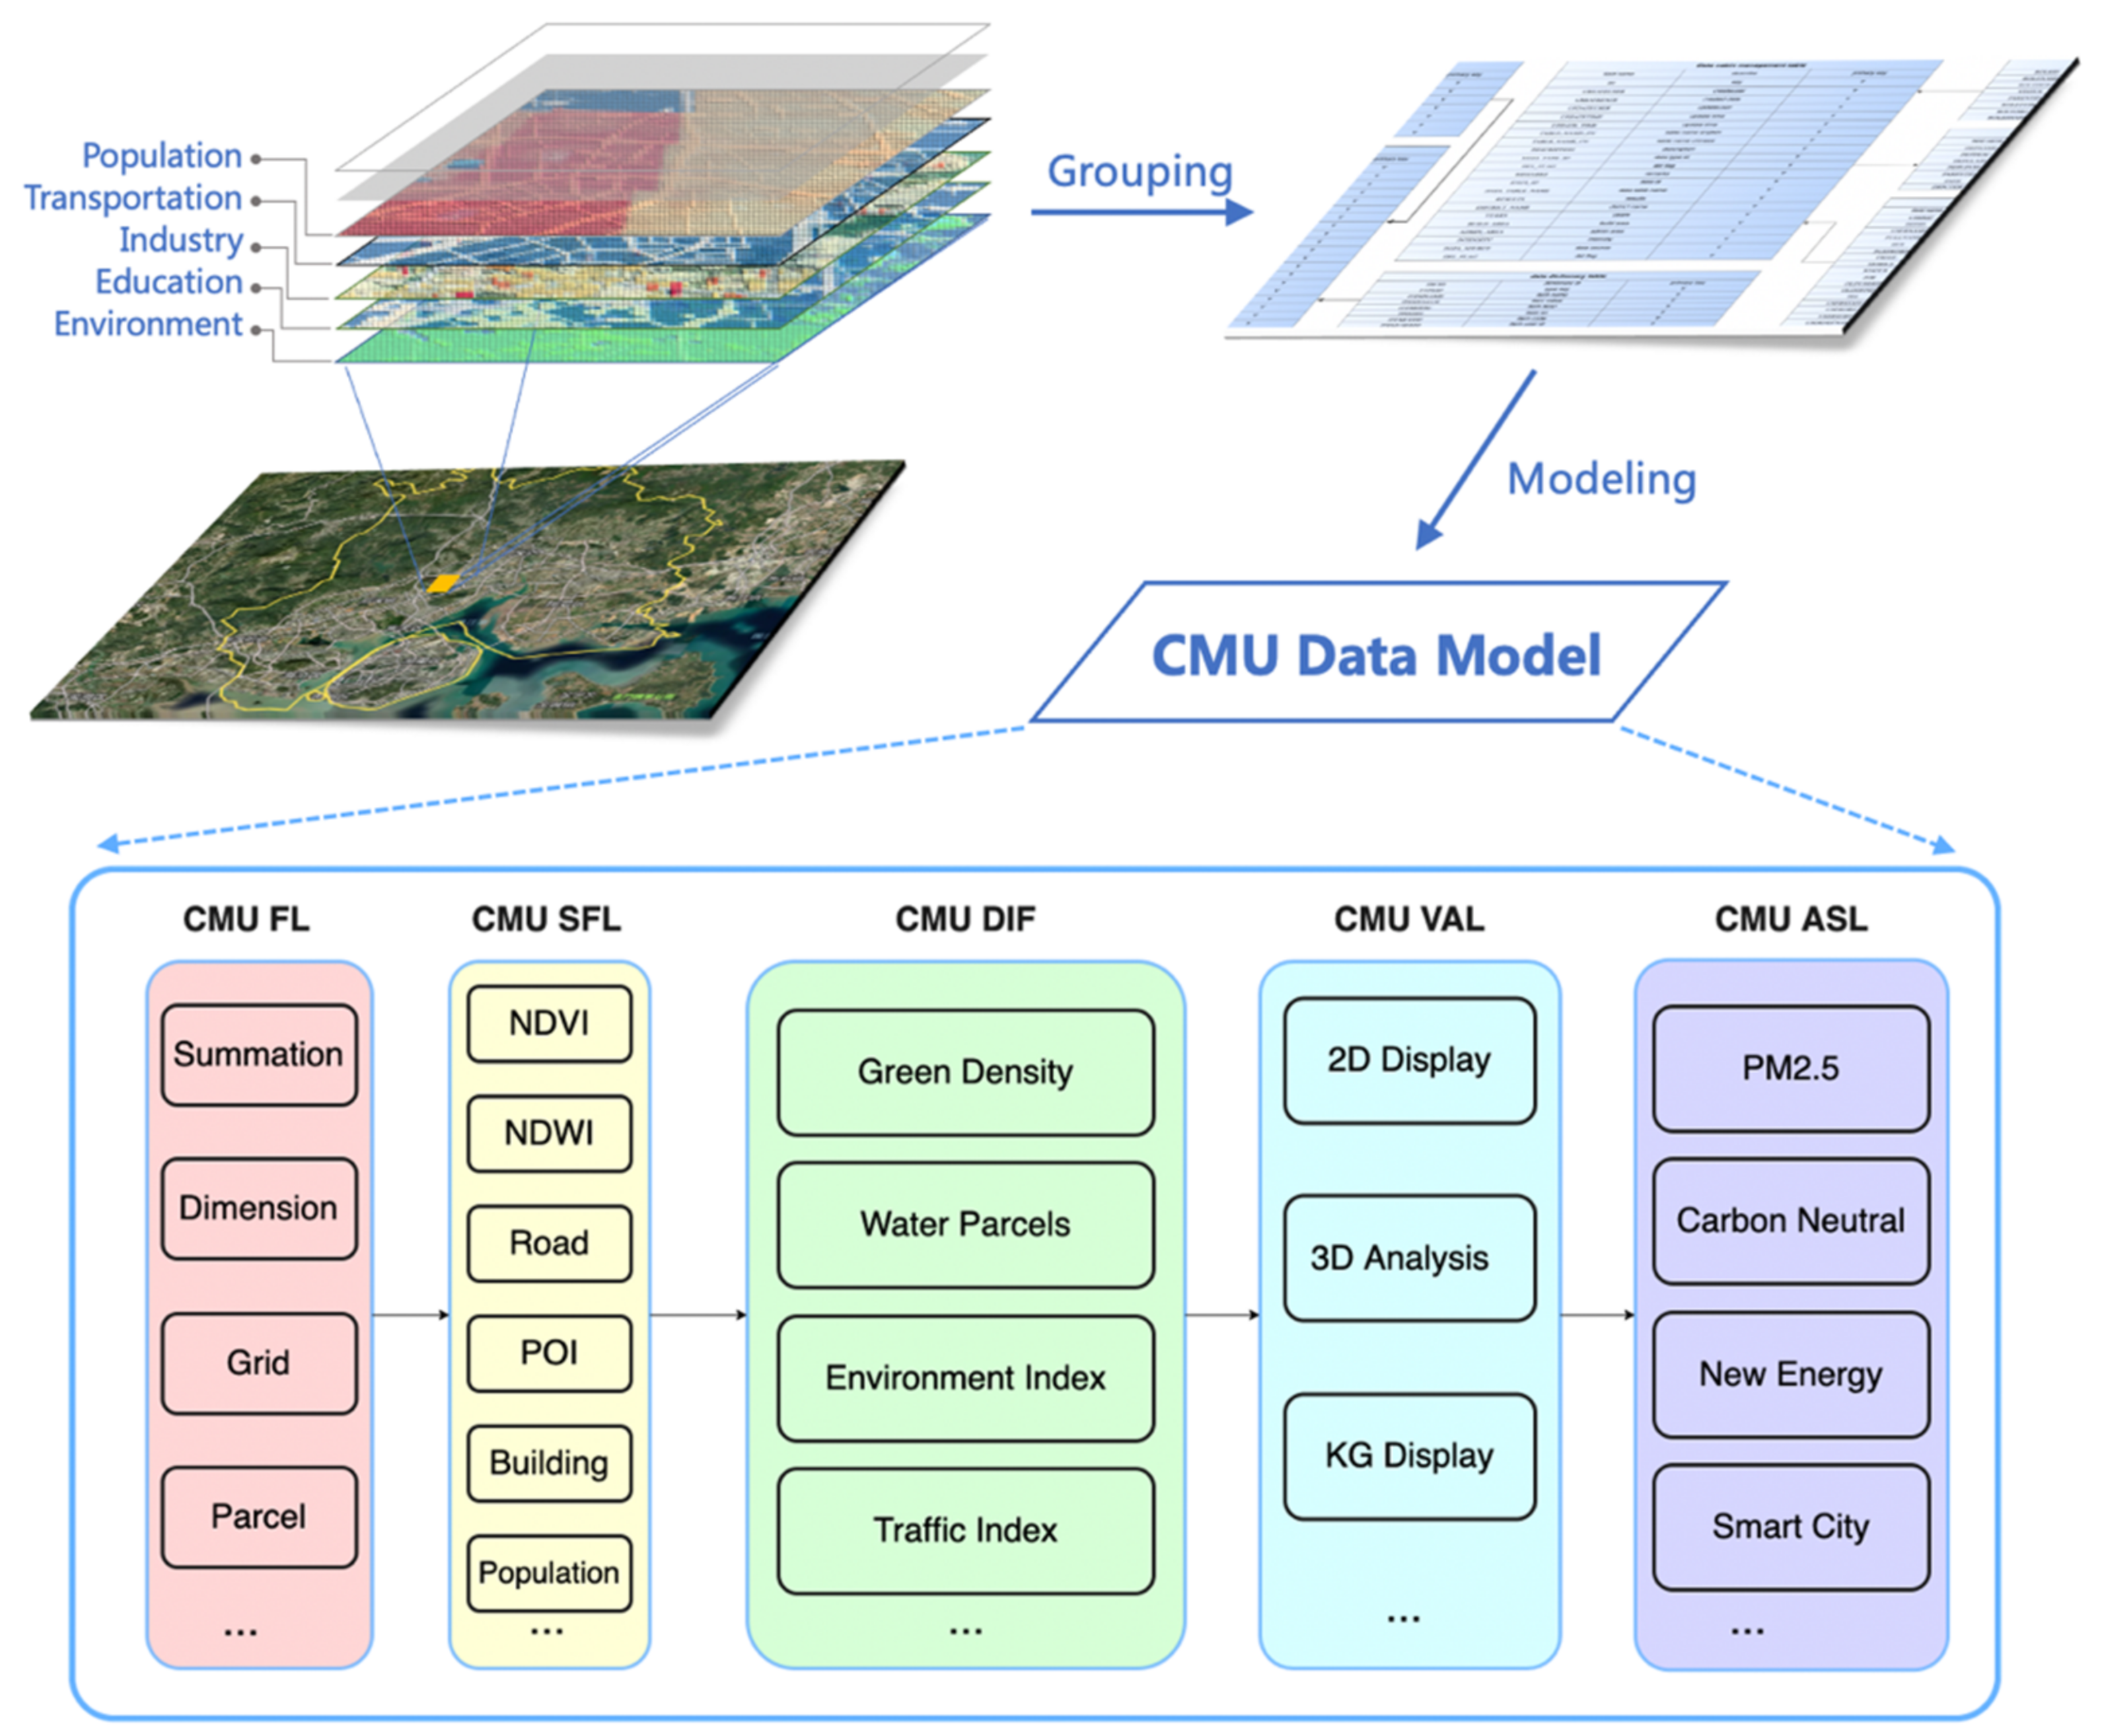
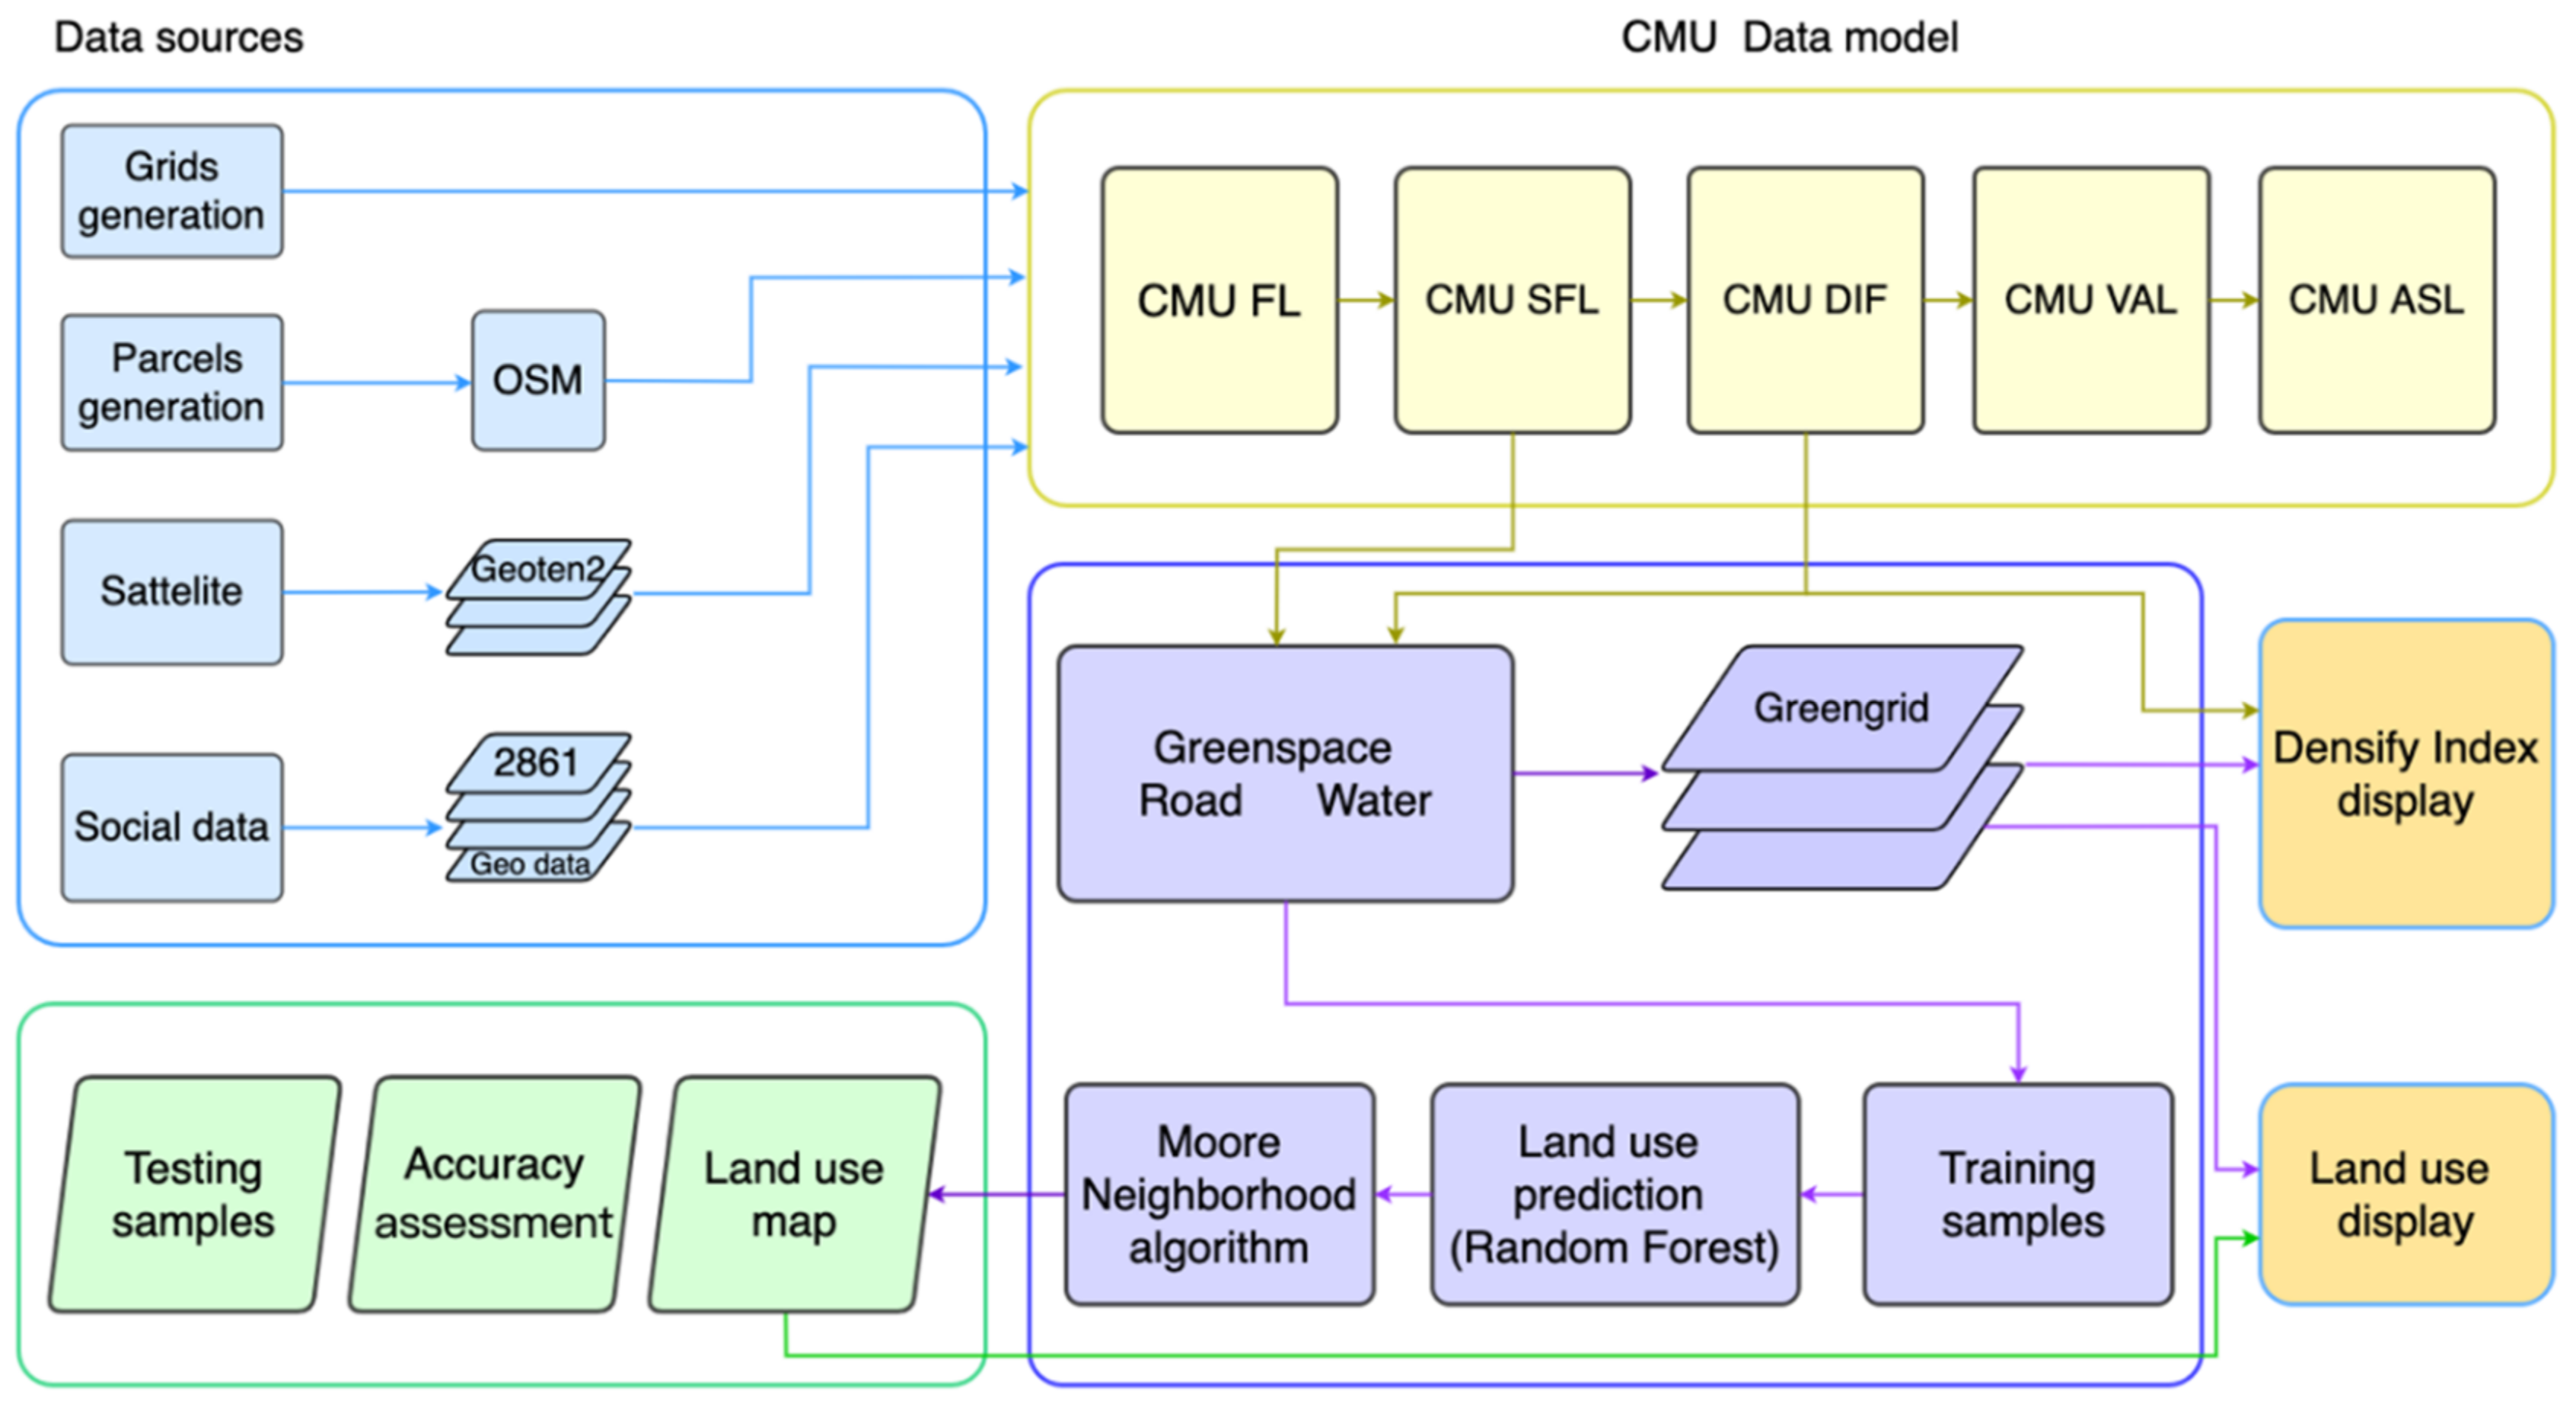
3. CMU Framework
3.1. CMU Foundation Layer
3.2. CMU Summation Feature Layer
3.3. CMU Density Index Layer
3.4. CMU Visualization Analysis Layer
3.5. CMU Application Solution Layer
4. CMU-Based Xiamen Land Use Study
4.1. Proposed Method
4.2. Data Preparation
- (1)
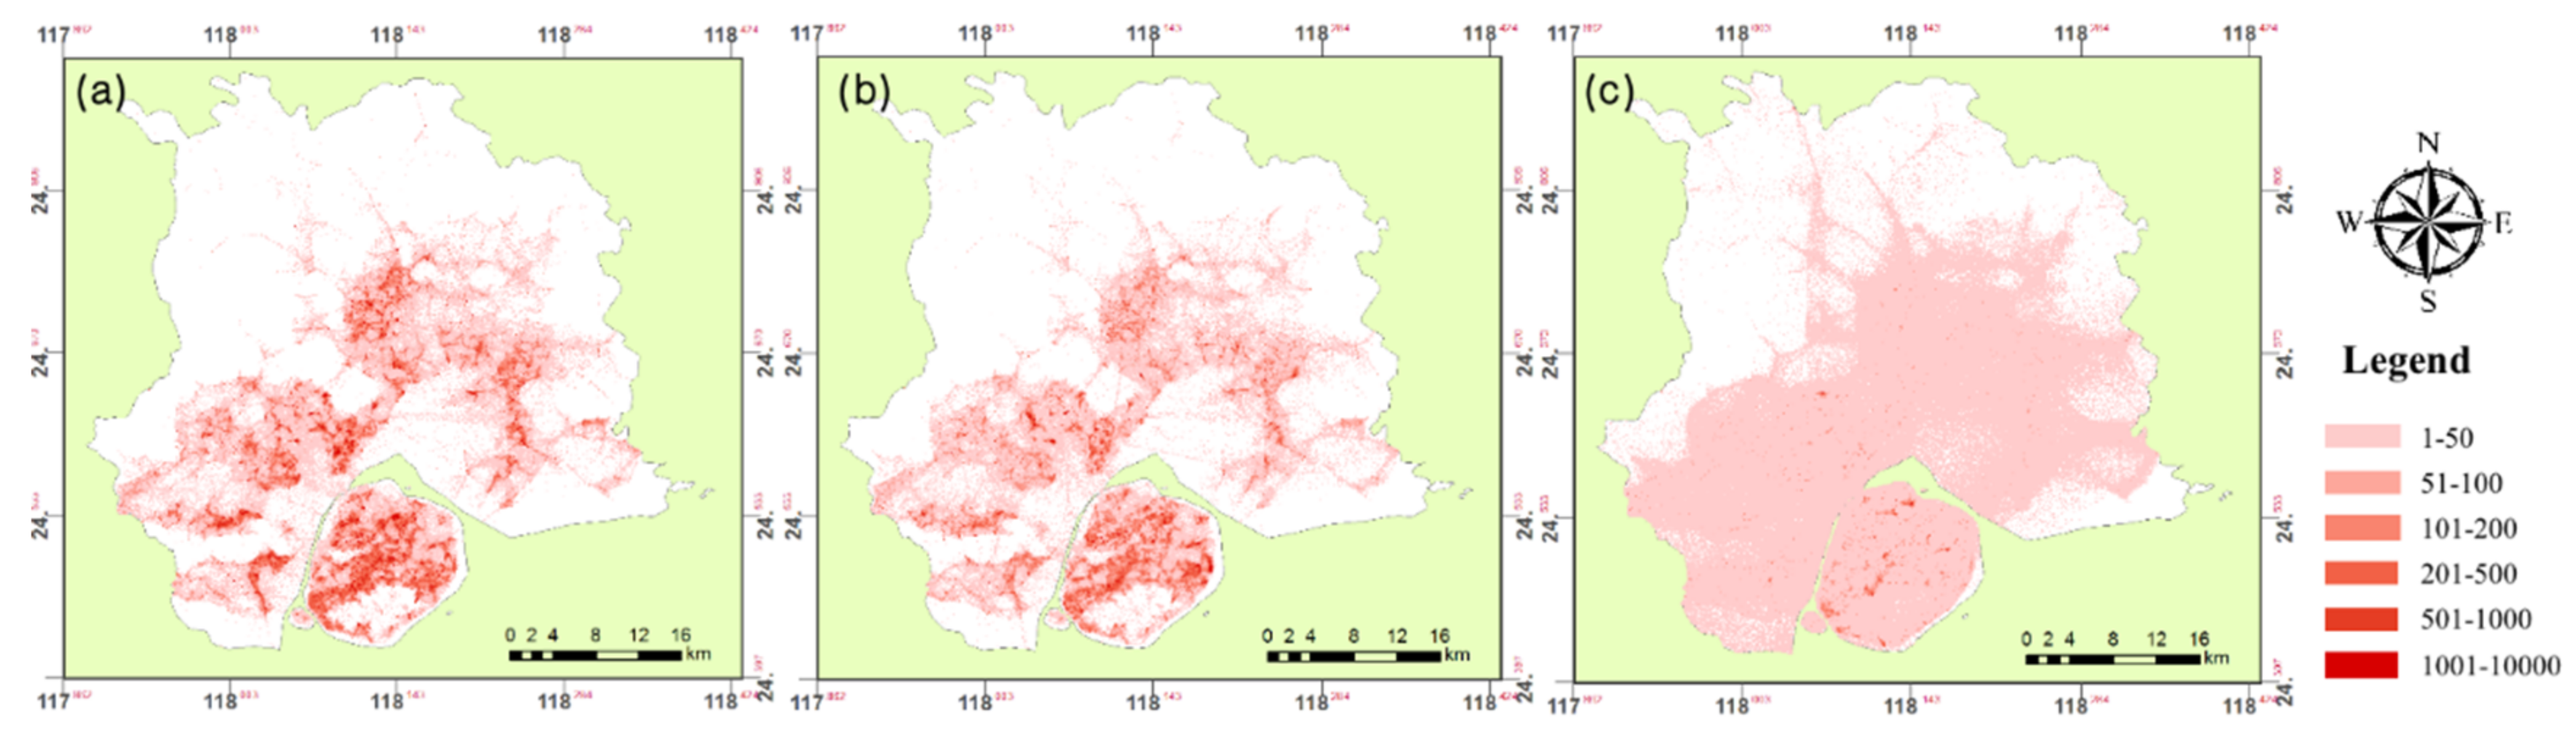
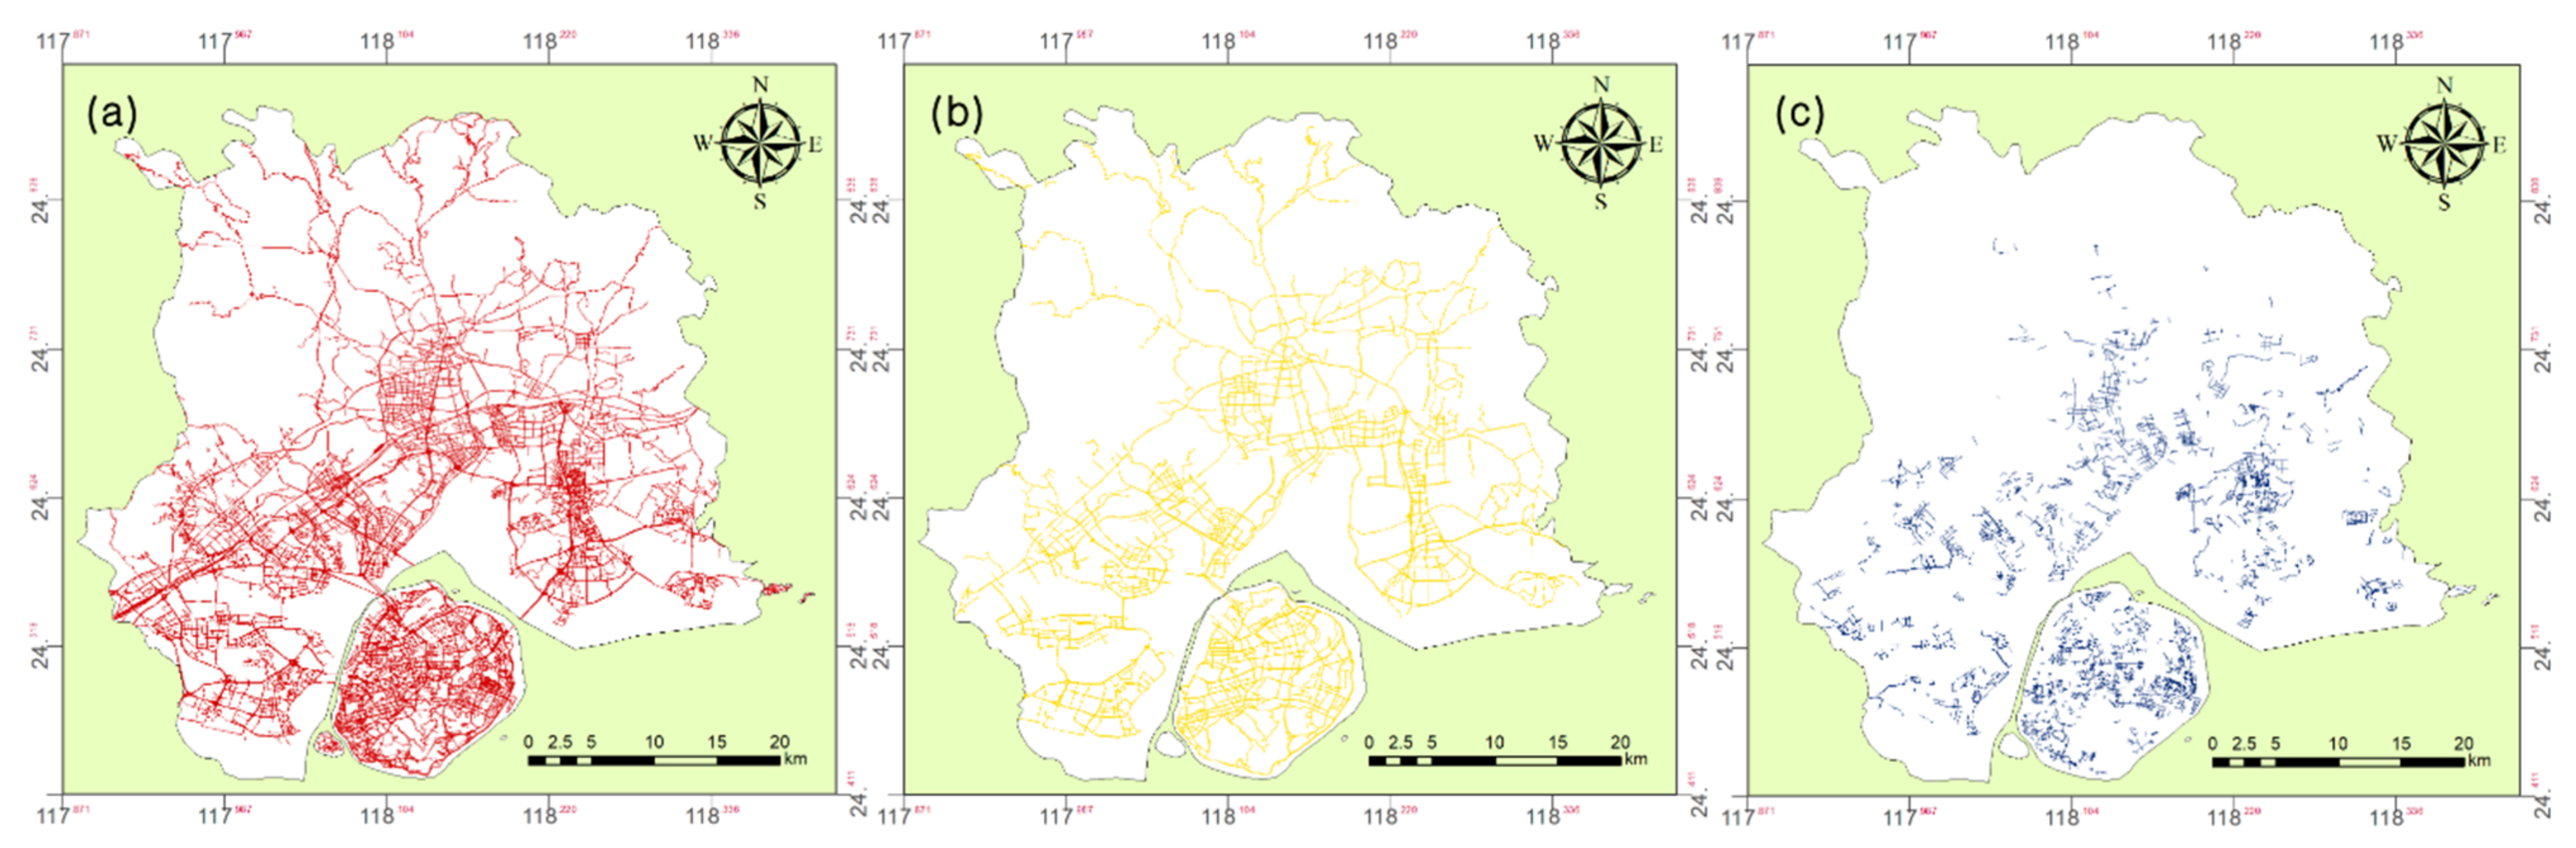
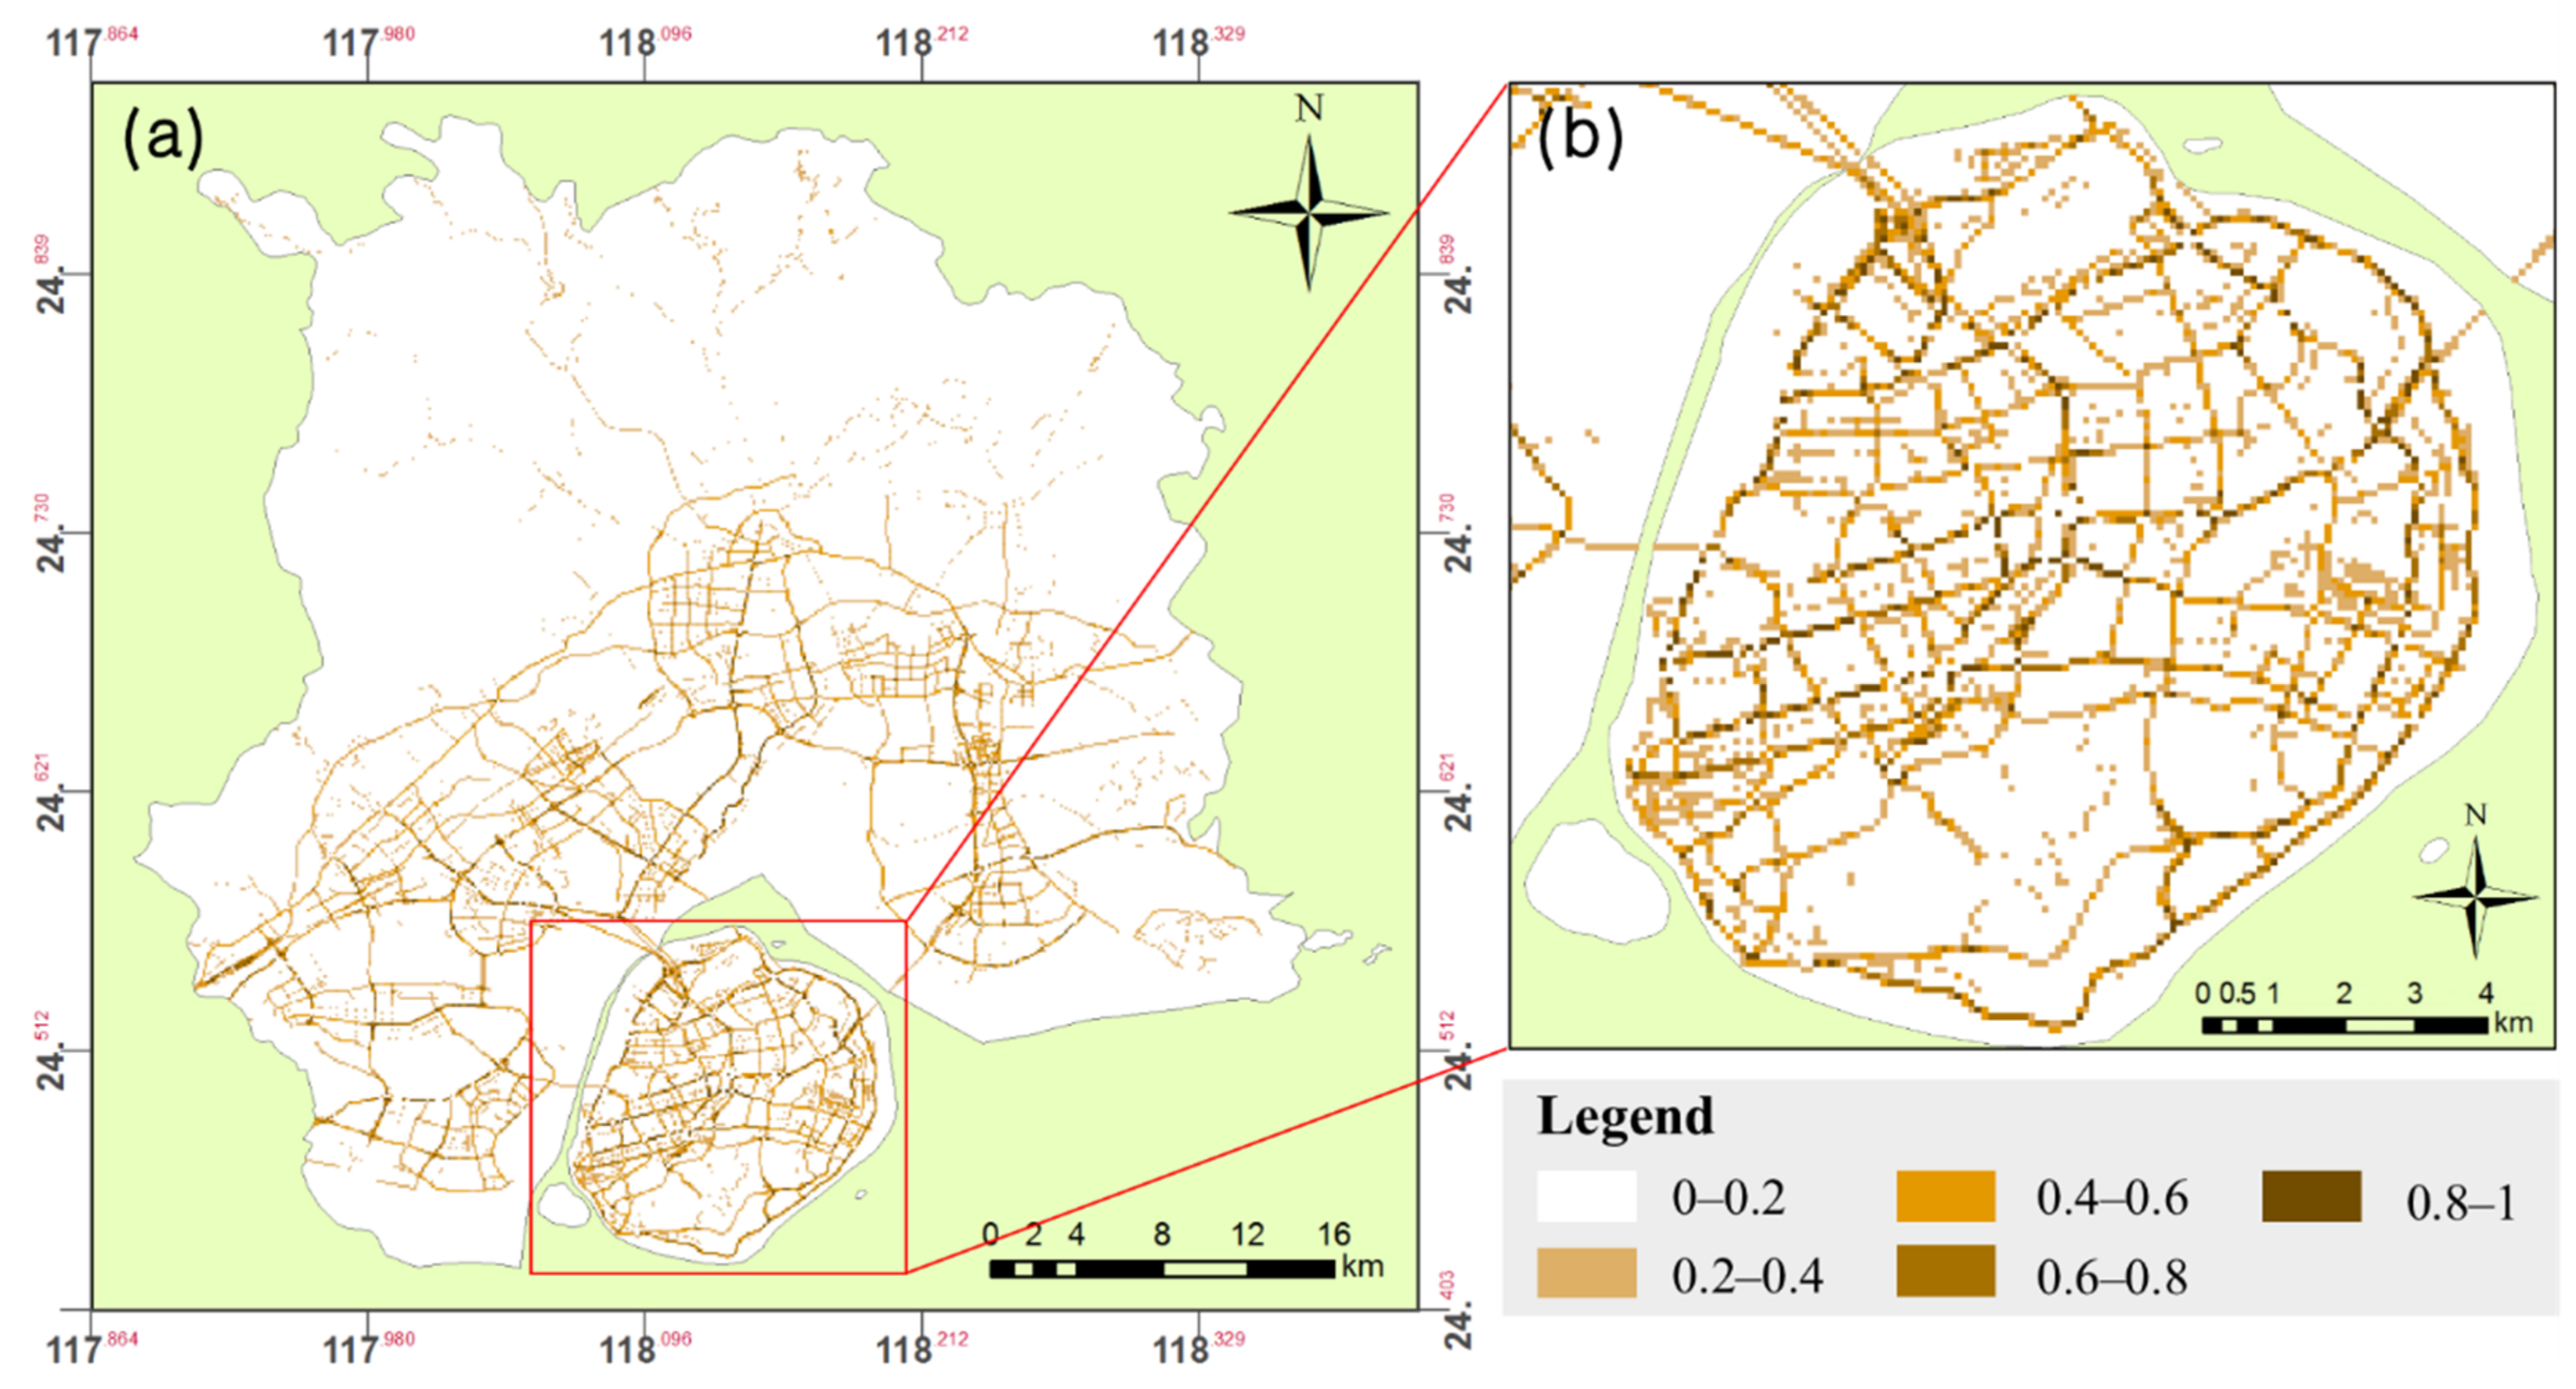
- For road density function: OSM road data were used to calculate the area of roads. Road width value was specified for each road according to its type, road areal vector data were obtained by using the buffer tool in ArcGIS. After drawing the buffer regions of all types of roads, areal vector data of roads in Xiamen were generated. The road density of each grid was calculated as the area of roads divided by the area of the grid (Figure 10).
- (2)
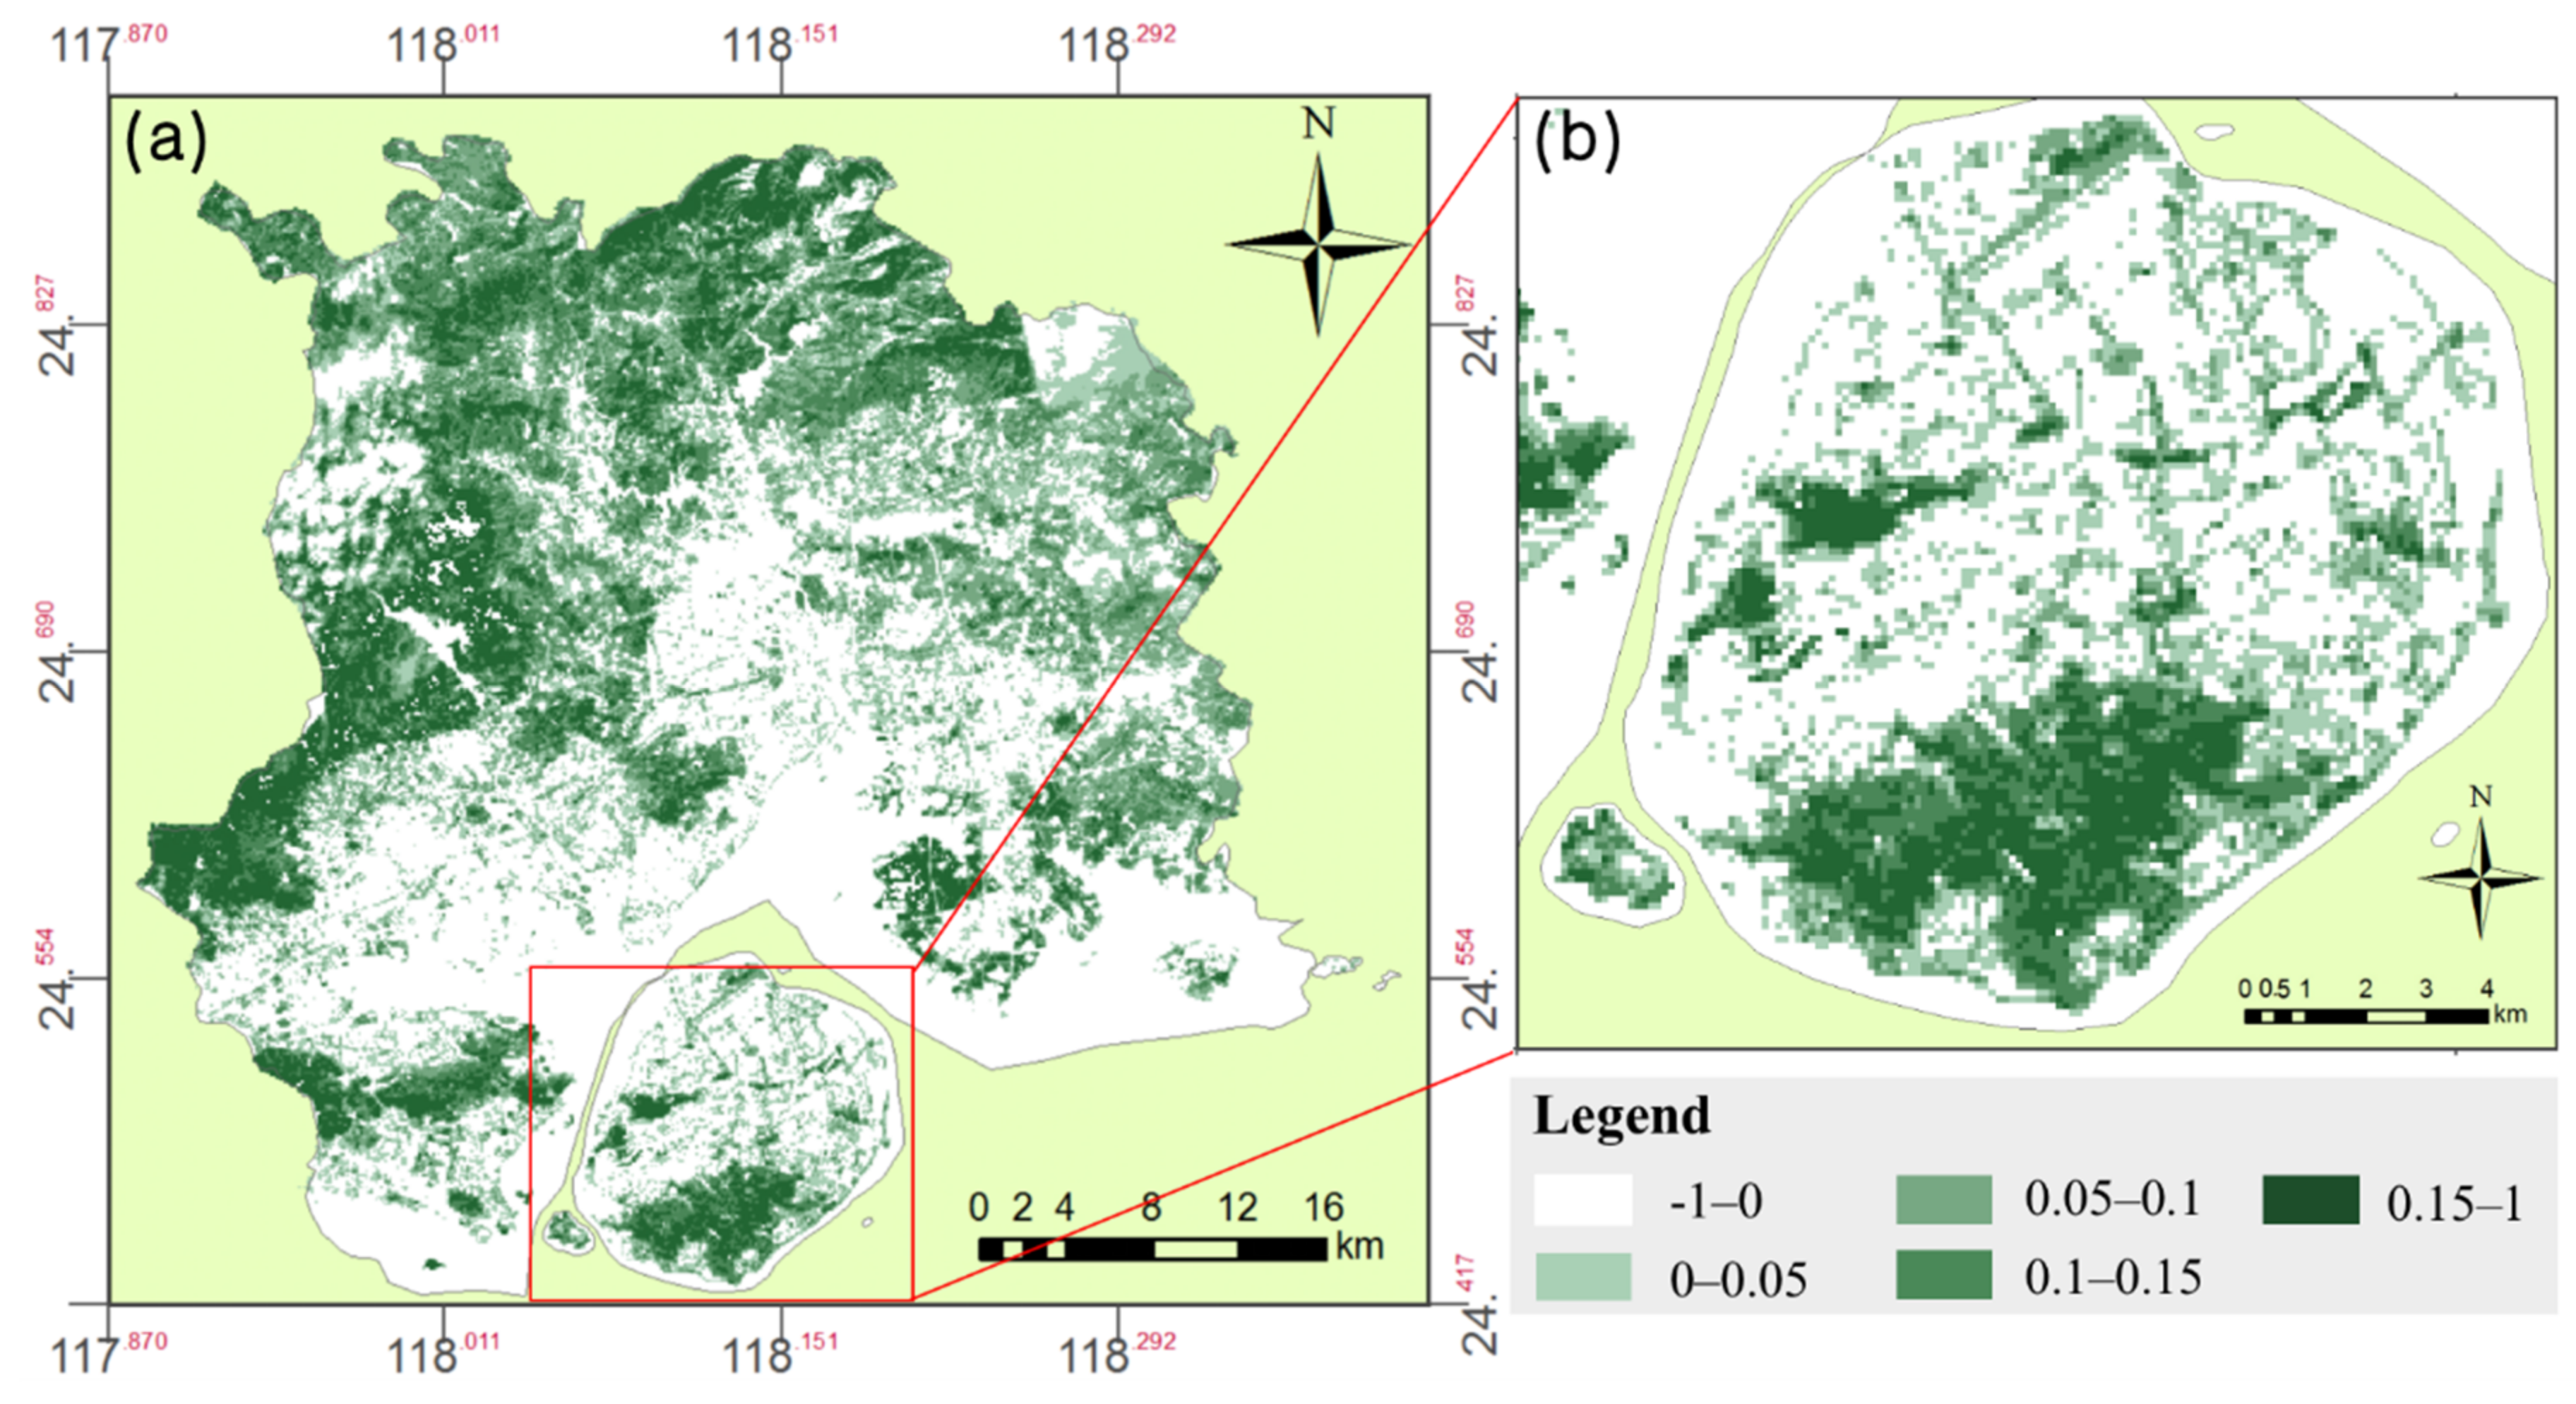
- For Green Density Function: We used Gaofen7 data to construct the density function. In Gaofen7 satellite data, there are four bands which are RED, GREEN, BLUE, and NIR, we used these bands and grid vector data to calculate NDVI and the fractional green coverage. Specifically, the green density of each grid was calculated as the greenspace area divided by the grid’s area (Figure 11).
- (3)
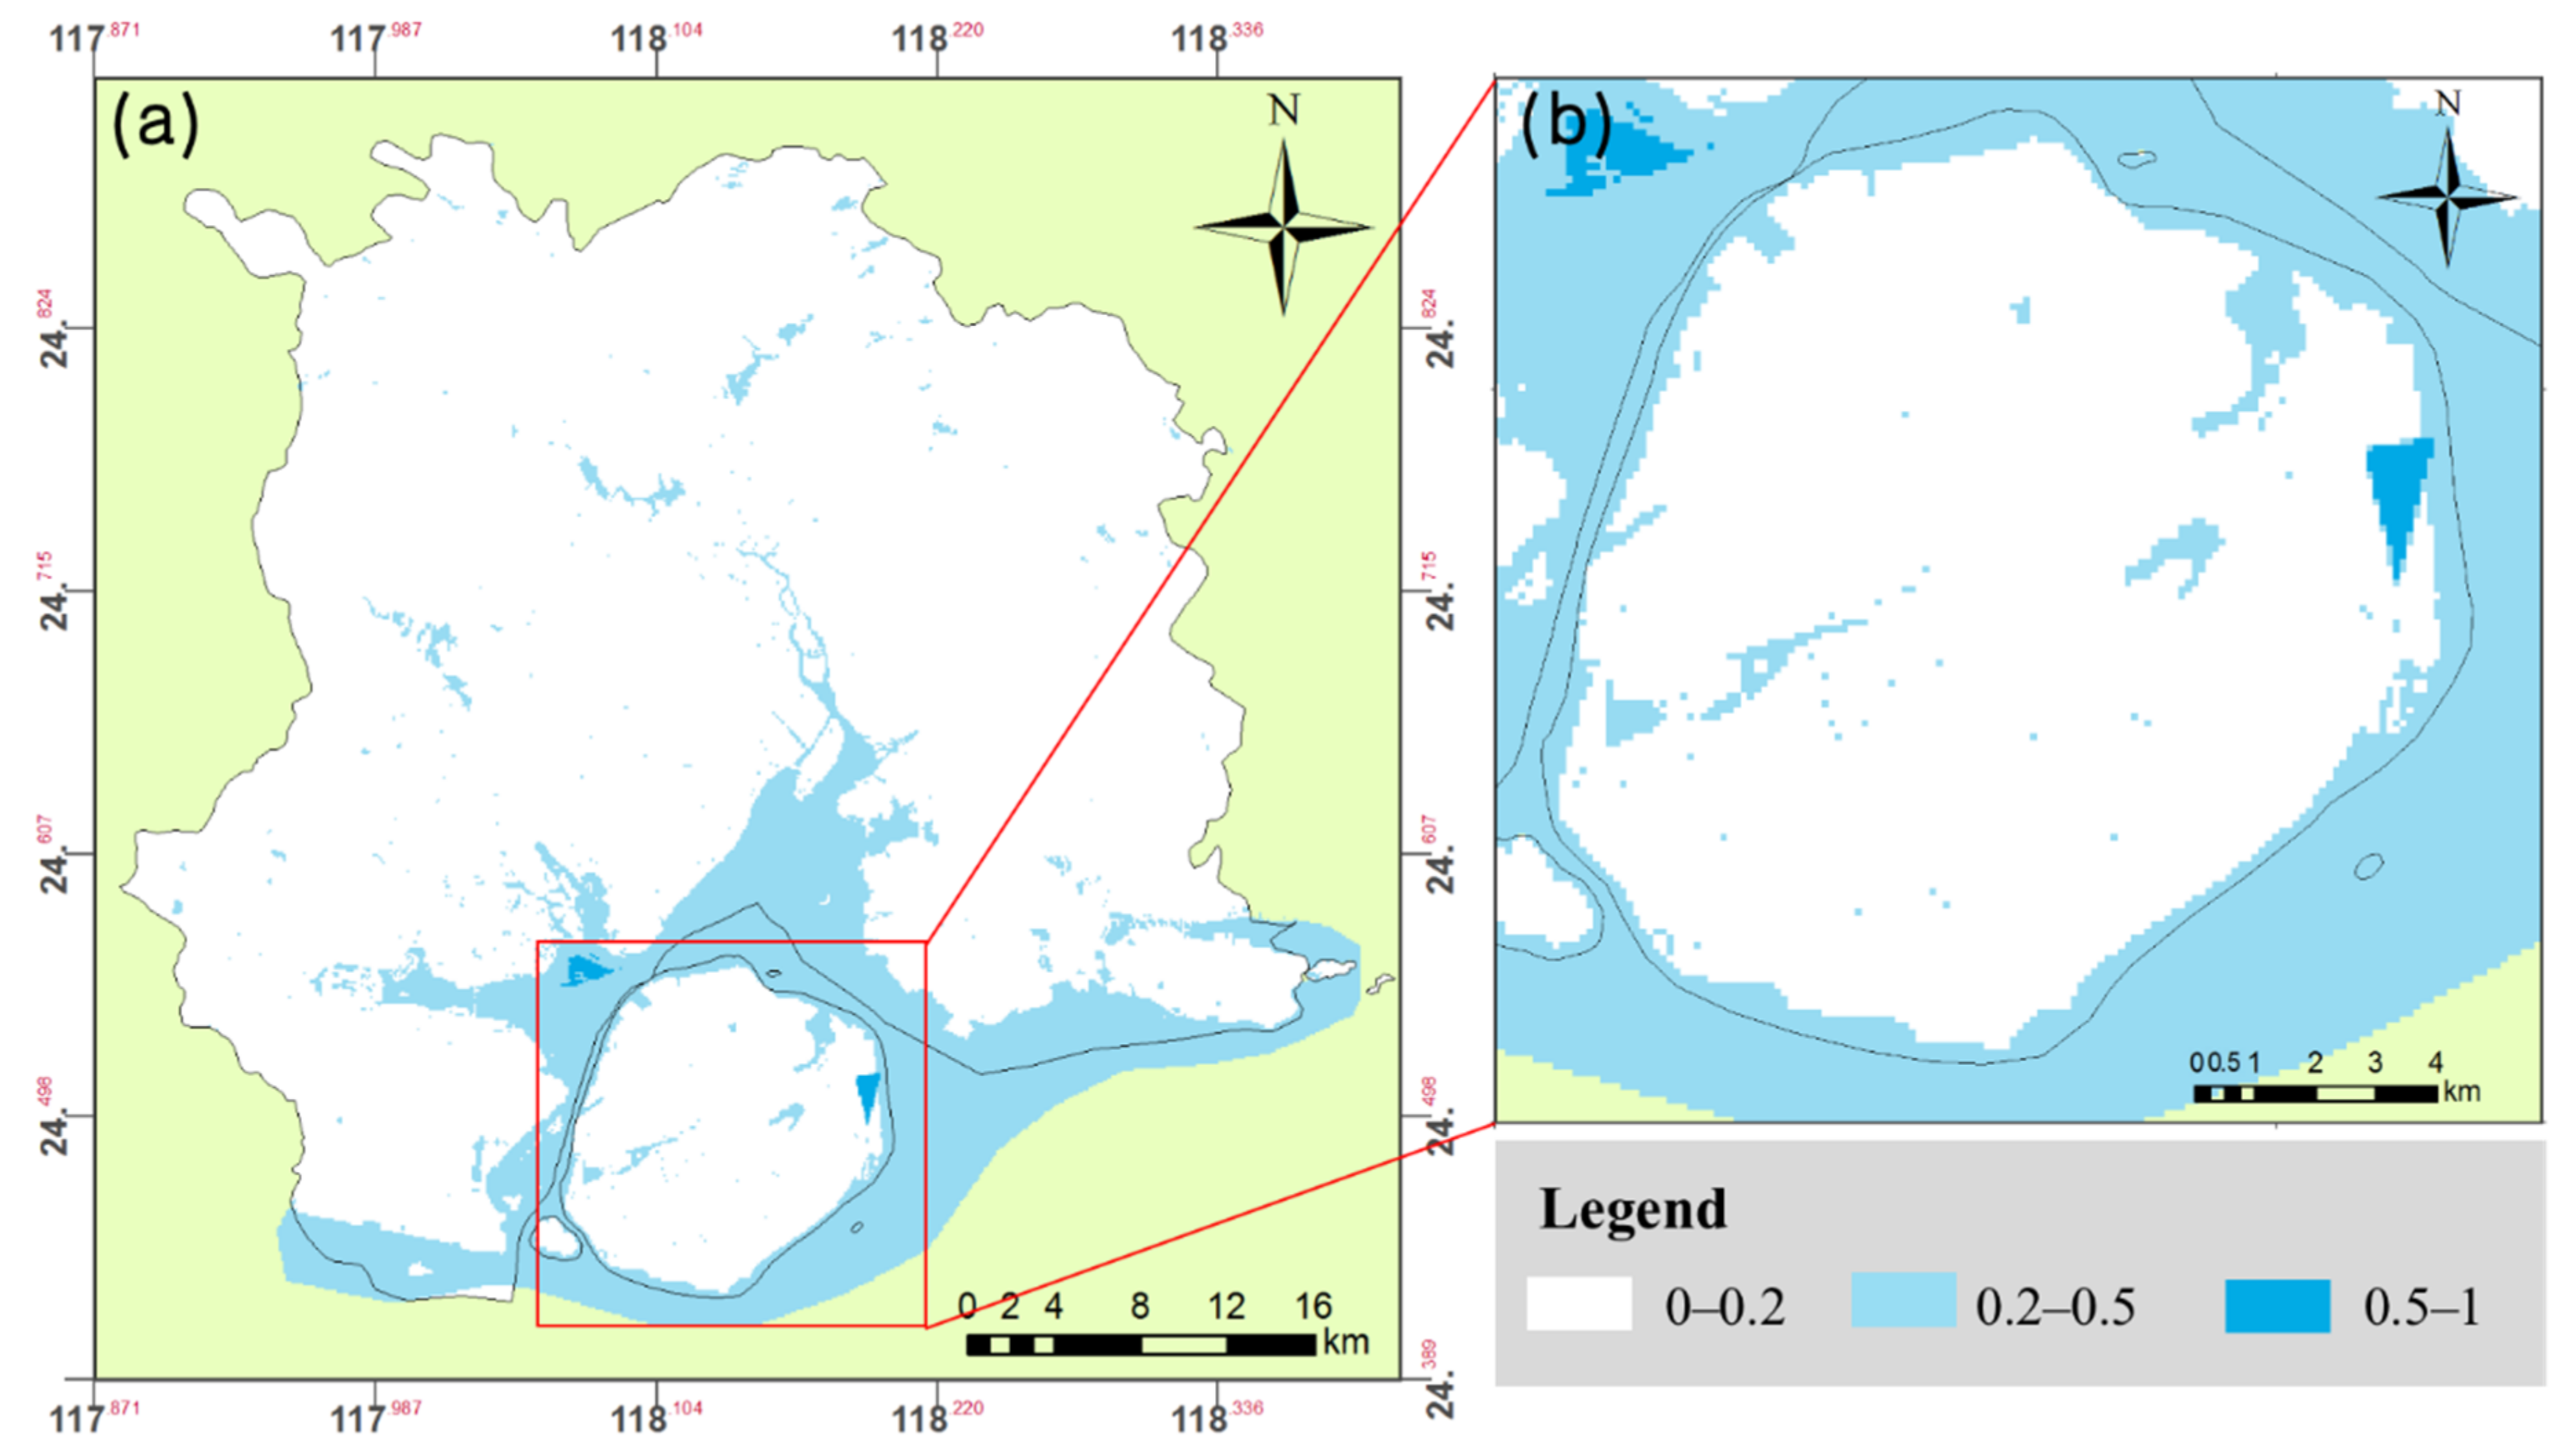
- For Water Density Function: Like the NDVI mentioned above, the NDWI was calculated as follows: the water density of each grid was calculated as the water area divided by the grid’s area (Figure 12).
4.3. Random Forest (RF) for Urban Land Use Classification
4.4. Using Moore Neighborhood to Improve Land Use Prediction
5. Results and Analysis
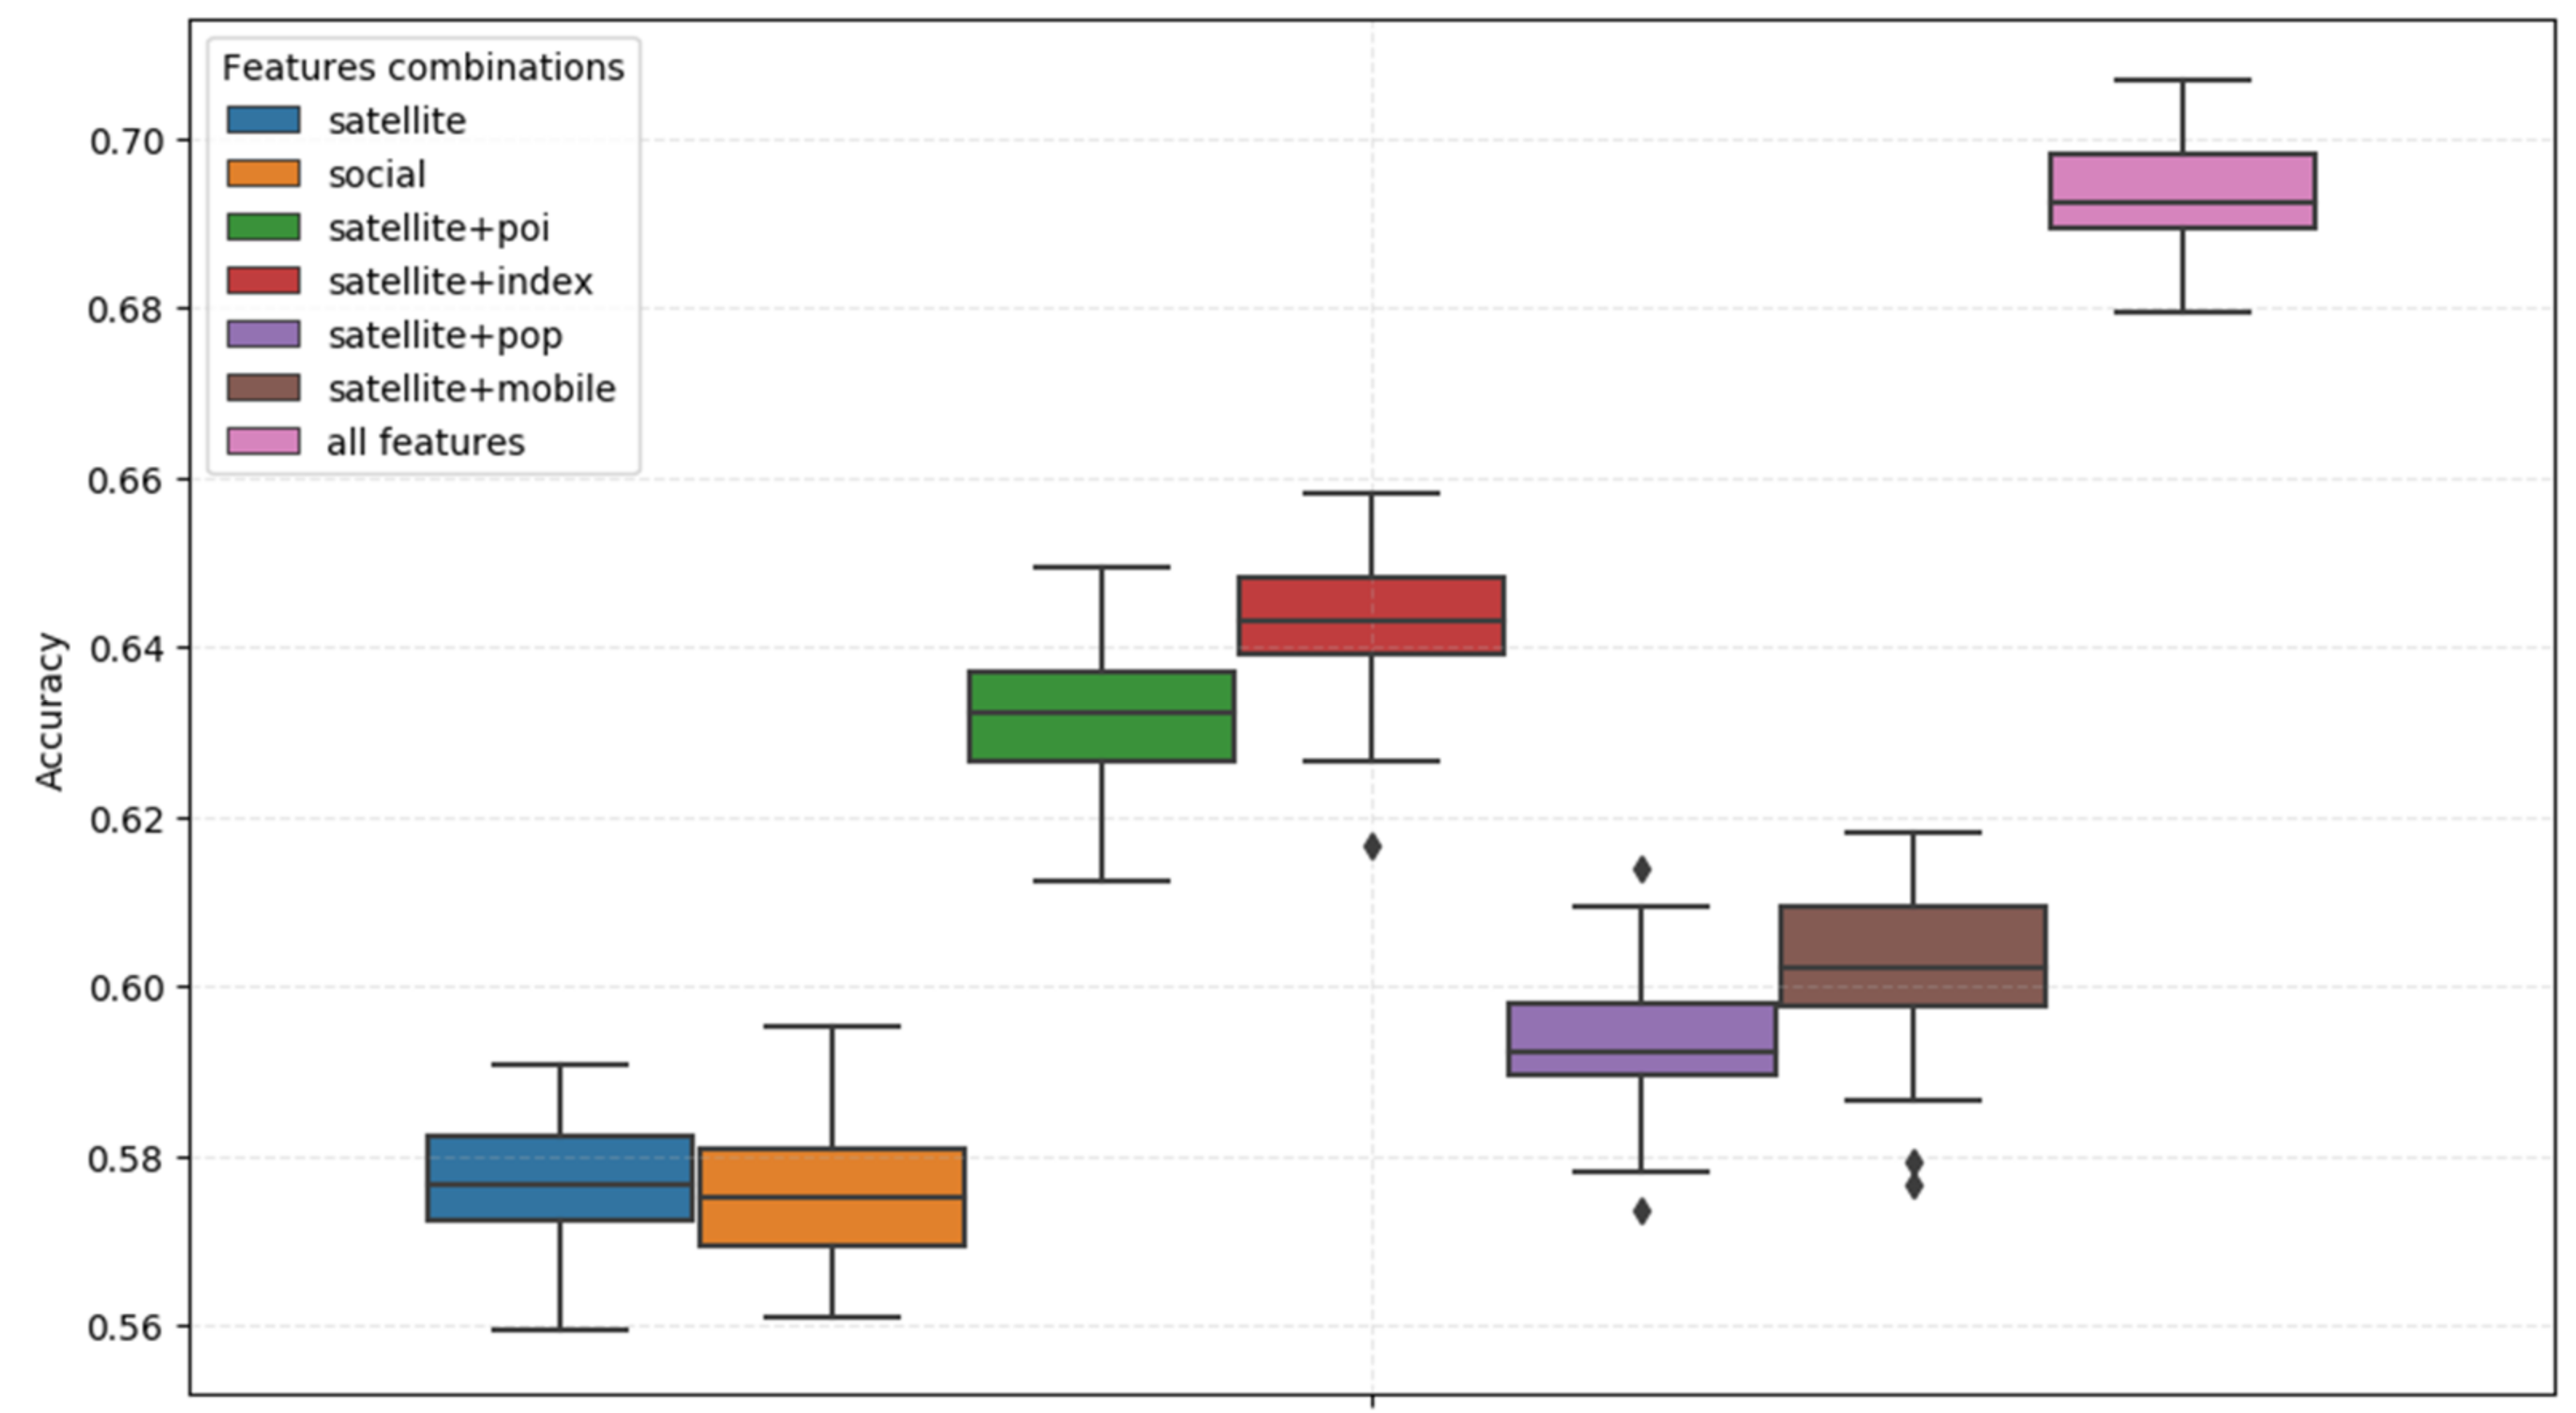
5.1. Grid Experiments and Performance
5.2. Parcel Experiments and Performance
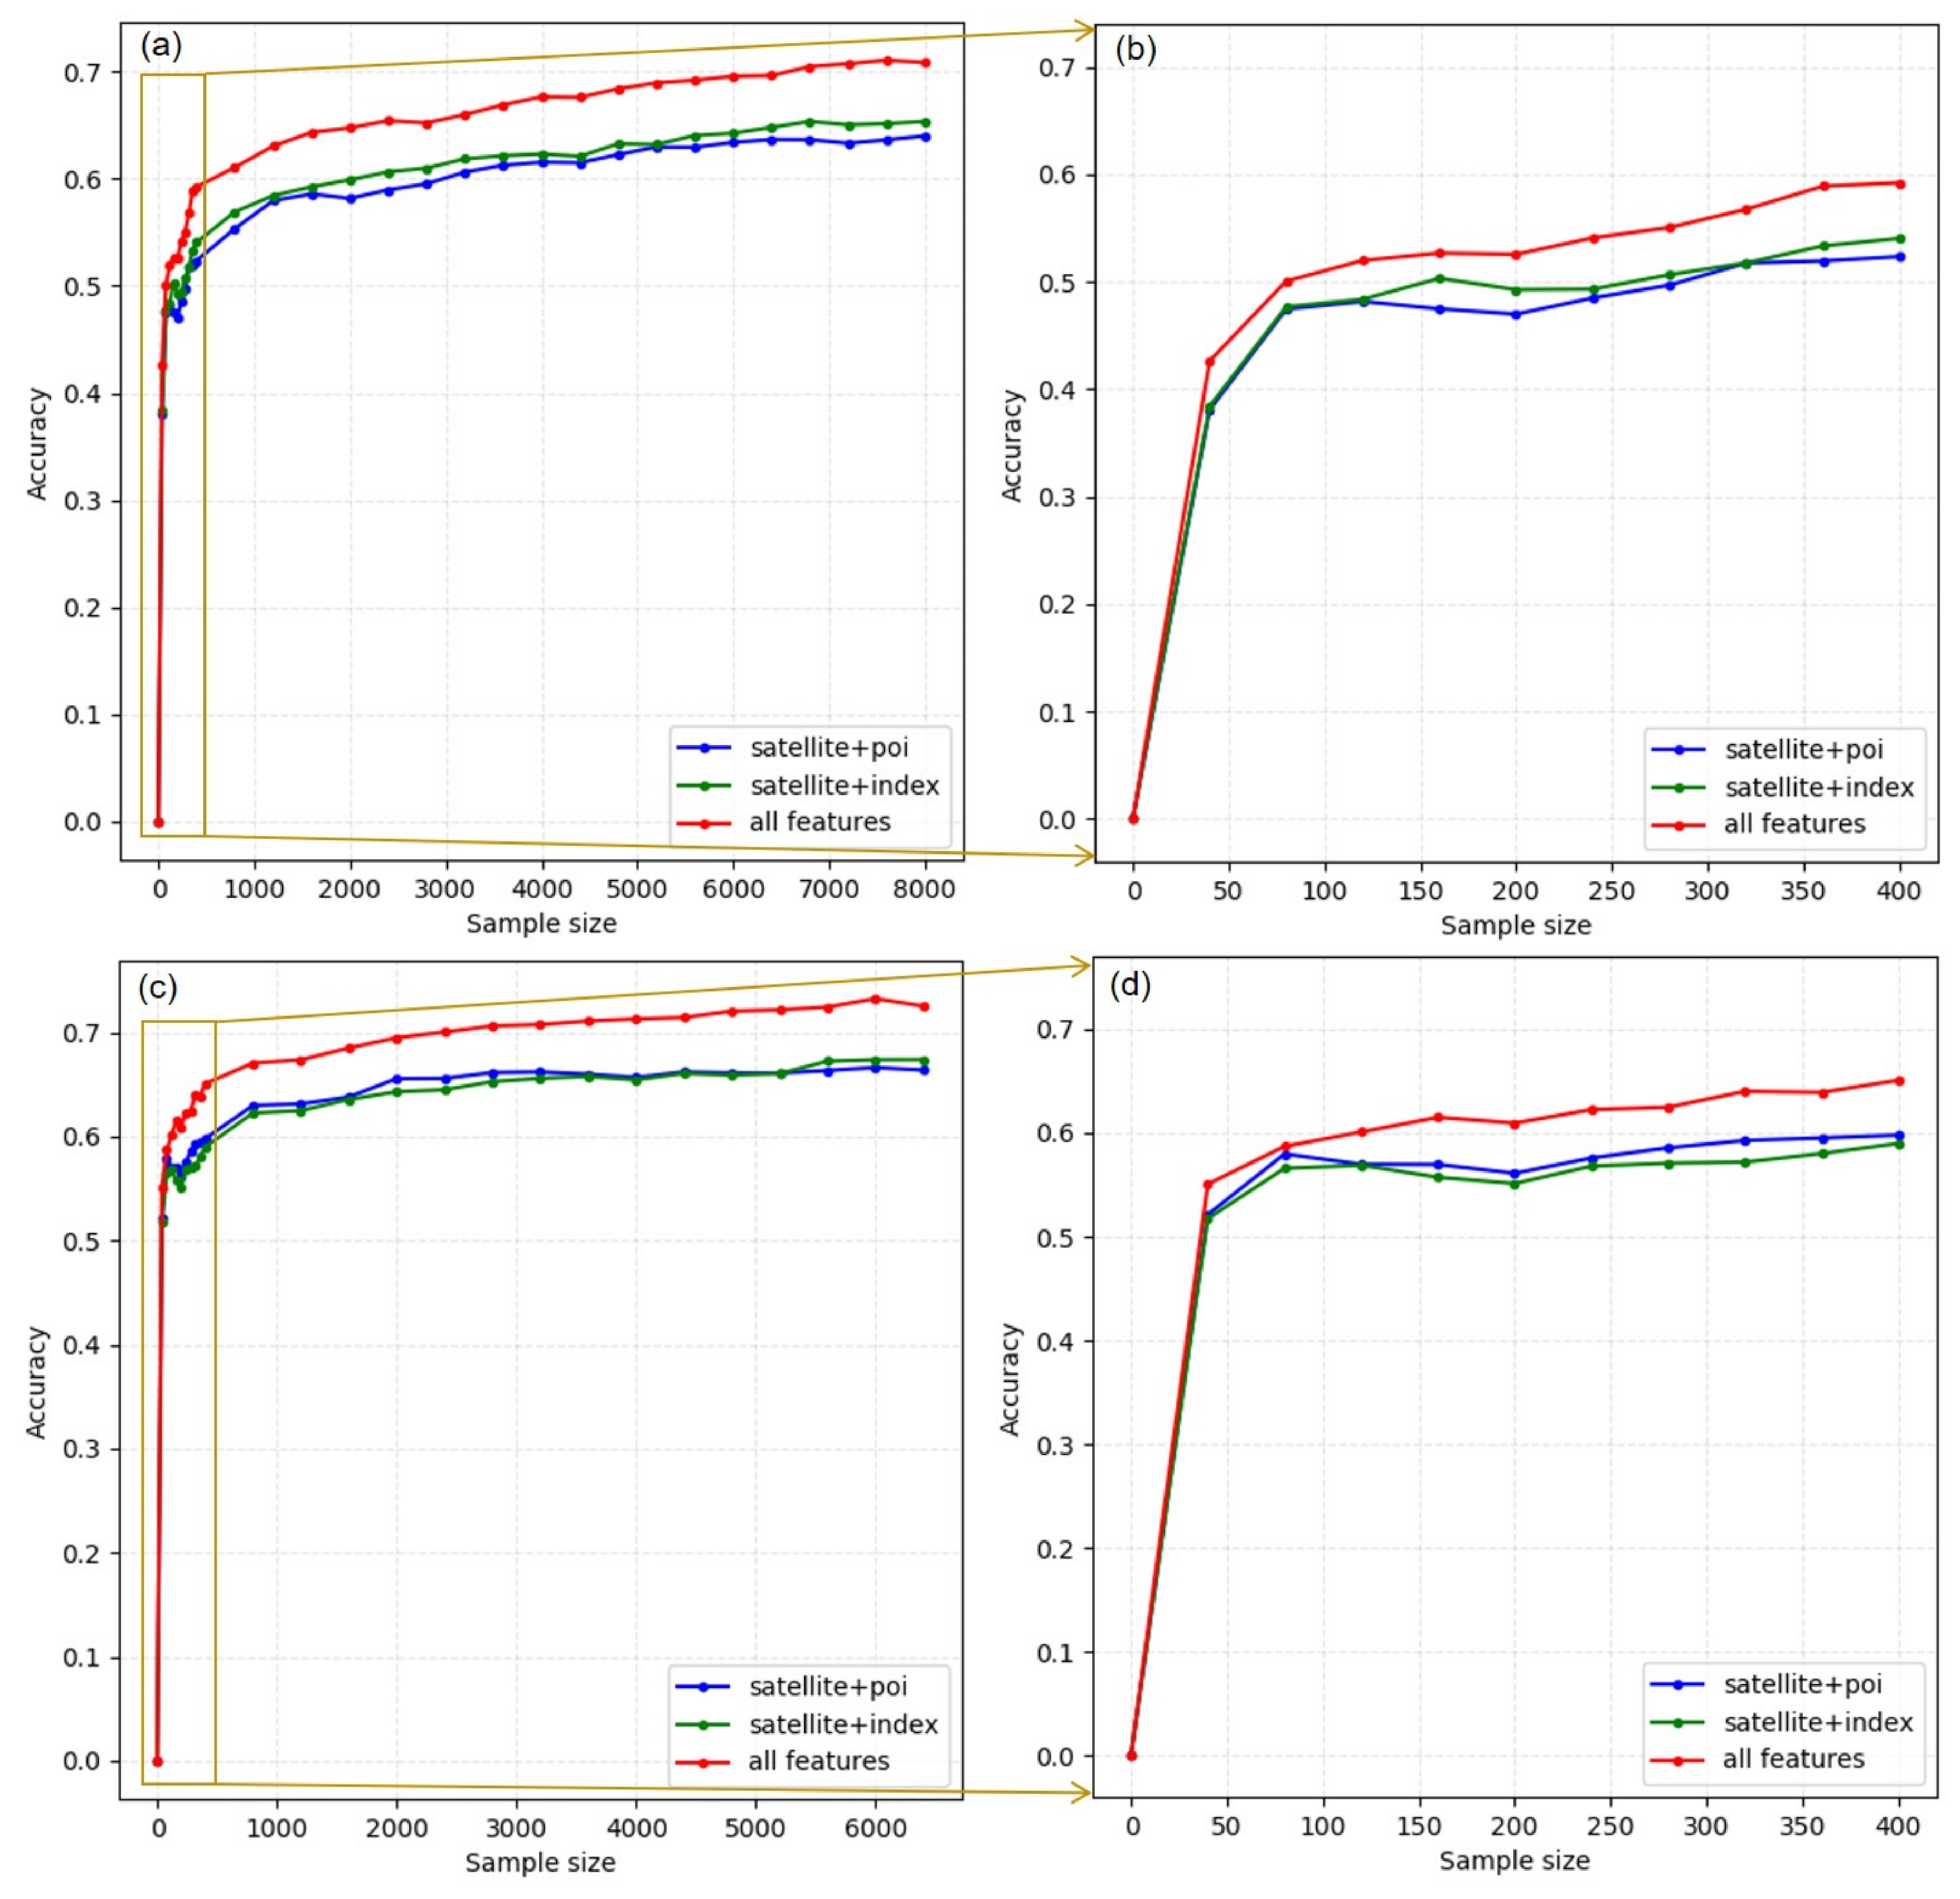
5.3. Sensitivity of Training Sample Size
5.4. Grid and Parcel Exchange Experiments
6. Discussion
6.1. CMU Data Model and Data Granularity
6.2. Grid and Parcel Exchange Analysis
6.3. Sensibility Analysis of Training Sample Size
6.4. Limitations and Future Research
7. Conclusions
Author Contributions
Funding
Acknowledgments
Conflicts of Interest
References
- The World Bank. Available online: https://www.worldbank.org/en/topic/urbandevelopment/overview (accessed on 16 July 2020).
- United Nations. World Urbanization Prospects: The 2014 Revision; United Nations: New York, NY, USA, 2015. [Google Scholar]
- Angel, S.; Parent, J.; Civco, D.L.; Blei, A.; Potere, D. The dimensions of global urban expansion: Estimates and projections for all countries, 2000–2050. Prog. Plan. 2011, 75, 53–107. [Google Scholar] [CrossRef]
- Gong, P.; Liang, S.; Carlton, E.J.; Jiang, Q.; Wu, J.; Wang, L.; Remais, J.V. Urbanisation and health in China. Lancet 2012, 379, 843–852. [Google Scholar] [CrossRef] [PubMed]
- Clinton, N.; Gong, P. MODIS detected surface urban heat islands and sinks: Global locations and controls. Remote Sens. Environ. 2013, 134, 294–304. [Google Scholar] [CrossRef]
- Yang, J.; Gong, P.; Fu, R.; Zhang, M.; Chen, J.; Liang, S.; Xu, B.; Shi, J.; Dickinson, R. The role of satellite remote sensing in climate change studies. Nat. Clim. Change 2013, 3, 875–883. [Google Scholar] [CrossRef]
- Shahab, S.; Hartmann, T.; Jonkman, A. Strategies of municipal land policies: Housing development in Germany, Belgium, and Netherlands. Eur. Plan. Stud. 2020, 29, 1132–1150. [Google Scholar] [CrossRef]
- Zhou, Y.; Li, X.; Asrar, G.R.; Smith, S.J.; Imhoff, M. A global record of annual urban dynamics (1992–2013) from nighttime lights. Remote Sens. Environ. 2018, 219, 206–220. [Google Scholar] [CrossRef]
- Wang, L.; Li, C.; Ying, Q.; Cheng, X.; Wang, X.; Li, X.; Hu, L.; Liang, L.; Yu, L.; Huang, H.; et al. China’s urban expansion from 1990 to 2010 determined with satellite remote sensing. Chin. Sci. Bull. 2012, 57, 2802–2812. [Google Scholar] [CrossRef]
- Gong, P. Remote sensing of environmental change over China: A review. Chin. Sci. Bull. 2012, 57, 2793–2801. [Google Scholar] [CrossRef]
- Chen, B.; Tu, Y.; Song, Y.; Theobald, D.M.; Zhang, T.; Ren, Z.; Li, X.; Yang, J.; Wang, J.; Wang, X.; et al. Mapping essential urban land use categories with open big data: Results for five metropolitan areas in the United States of America. ISPRS J. Photogramm. Remote Sens. 2021, 178, 203–218. [Google Scholar] [CrossRef]
- Chen, B.; Xu, B.; Gong, P. Mapping essential urban land use categories (EULUC) using geospatial big data: Progress, challenges, and opportunities. Big Earth Data 2021, 5, 410–441. [Google Scholar] [CrossRef]
- Li, X.; Zhou, Y. Urban mapping using DMSP/OLS stable nighttime light: A review. Int. J. Remote Sens. 2017, 38, 6030–6046. [Google Scholar] [CrossRef]
- Huang, H.; Chen, Y.; Clinton, N.; Wang, J.; Wang, X.; Liu, C.; Gong, P.; Yang, J.; Bai, Y.; Zheng, Y.; et al. Mapping major land cover dynamics in Beijing using all Landsat images in Google Earth Engine. Remote Sens. Environ. 2017, 202, 166–176. [Google Scholar] [CrossRef]
- Hartmann, T.; Jehling, M. From diversity to justice—Unraveling pluralistic rationalities in urban design. Cities 2019, 91, 58–63. [Google Scholar] [CrossRef]
- Rayner, J.; Howlett, M. Introduction: Understanding integrated policy strategies and their evolution. Policy Soc. 2009, 28, 99–109. [Google Scholar] [CrossRef]
- Yu, L.; Shi, Y.; Gong, P. Land cover mapping and data availability in critical terrestrial ecoregions: A global perspective with Landsat thematic mapper and enhanced thematic mapper plus data. Biol. Conserv. 2015, 190, 34–42. [Google Scholar] [CrossRef]
- Gong, P.; Zhang, W.; Yu, L.; Li, C. A new research paradigm for global land cover mapping. Ann. GIS 2016, 22, 87–102. [Google Scholar] [CrossRef]
- Yu, L.; Wang, J.; Gong, P. Improving 30 m global land-cover map FROM-GLC with time series MODIS and auxiliary data sets: A segmentation-based approach. Int. J. Remote Sens. 2013, 34, 5851–5867. [Google Scholar] [CrossRef]
- Gong, P.; Wang, J.; Yu, L.; Zhao, Y.; Zhao, Y.; Liang, L.; Niu, Z.; Huang, X.; Fu, H.; Liu, S.; et al. Finer resolution observation and monitoring of global land cover: First mapping results with Landsat TM and ETM+ data. Int. J. Remote Sens. 2012, 34, 2607–2654. [Google Scholar] [CrossRef]
- Chen, B.; Huang, B.; Xu, B. Multi-source remotely sensed data fusion for improving land cover classification. ISPRS J. Photogramm. Remote Sens. 2017, 124, 27–39. [Google Scholar] [CrossRef]
- Gong, P.; Marceau, D.J.; Howarth, P.J. A comparison of spatial feature extraction algorithms for land-use classification with SPOT HRV data. Remote Sens. Environ. 1992, 40, 137–151. [Google Scholar] [CrossRef]
- Zhang, X.; Chen, G.; Wang, W.; Wang, Q.; Dai, F. Object-based land-cover supervised classification for very-high-resolution UAV images using stacked denoising autoencoders. IEEE J. Sel. Top. Appl. Earth Obs. Remote Sens. 2017, 10, 3373–3385. [Google Scholar] [CrossRef]
- Li, X.; Gong, P.; Liang, L. A 30-year (1984–2013) record of annual urban dynamics of Beijing City derived from Landsat data. Remote Sens. Environ. 2015, 166, 78–90. [Google Scholar] [CrossRef]
- Li, X.; Gong, P. Urban growth models: Progress and perspective. Sci. Bull. 2016, 61, 1637–1650. [Google Scholar] [CrossRef]
- Chen, B.; Song, Y.; Huang, B.; Xu, B. A novel method to extract urban human settlements by integrating remote sensing and mobile phone locations. Sci. Remote Sens. 2020, 1, 100003. [Google Scholar] [CrossRef]
- Liu, Y.; Wang, F.; Xiao, Y.; Gao, S. Urban land uses and traffic ‘source-sink areas’: Evidence from GPS-enabled taxi data in Shanghai. Landsc. Urban Plan. 2012, 106, 73–87. [Google Scholar] [CrossRef]
- Jia, Y.; Ge, Y.; Ling, F.; Guo, X.; Wang, J.; Wang, L.; Chen, Y.; Li, X. Urban Land Use Mapping by Combining Remote Sensing Imagery and Mobile Phone Positioning Data. Remote Sens. 2018, 10, 446. [Google Scholar] [CrossRef]
- Hu, T.; Yang, J.; Li, X.; Gong, P. Mapping urban land use by using landsat images and open social data. Remote Sens. 2016, 8, 151. [Google Scholar] [CrossRef]
- Zhong, Y.; Su, Y.; Wu, S.; Zheng, Z.; Zhao, J.; Ma, A. Open-source data-driven urban land-use mapping integrating point-line-polygon semantic objects: A case study of Chinese cities. Remote Sens. Environ. 2020, 247, 111838. [Google Scholar] [CrossRef]
- Gong, P.; Chen, B.; Li, X.; Liu, H.; Wang, J.; Bai, Y.; Chen, J.; Chen, X.; Fang, L.; Feng, S.; et al. Mapping essential urban land use categories in China (EULUC-China): Preliminary results for 2018. Sci. Bull. 2020, 65, 182–187. [Google Scholar] [CrossRef]
- Tu, Y.; Chen, B.; Zhang, T.; Xu, B. Regional Mapping of Essential Urban Land Use Categories in China: A Segmentation-Based Approach. Remote Sens. 2020, 12, 1058. [Google Scholar] [CrossRef]
- Sun, J.; Wang, H.; Song, Z.; Lu, J.; Meng, P.; Qin, S. Mapping Essential Urban Land Use Categories in Nanjing by Integrating Multisource Big Data. Remote Sens. 2020, 12, 2386. [Google Scholar] [CrossRef]
- Zong, L.; He, S.; Lian, J.; Bie, Q.; Wang, X.; Dong, J.; Xie, Y. Detailed Mapping of Urban Land Use Based on Multi-Source Data: A Case Study of Lanzhou. Remote Sens. 2020, 12, 1987. [Google Scholar] [CrossRef]
- Su, M.; Guo, R.; Chen, B.; Hong, W.; Wang, J.; Feng, Y.; Xu, B. Sampling Strategy for Detailed Urban Land Use Classification: A Systematic Analysis in Shenzhen. Remote Sens. 2020, 12, 1497. [Google Scholar] [CrossRef]
- Mao, W.; Lu, D.; Hou, L.; Liu, X.; Yue, W. Comparison of Machine-Learning Methods for Urban Land-Use Mapping in Hangzhou City, China. Remote Sens. 2020, 12, 2817. [Google Scholar] [CrossRef]
- Zhao, Y.; Gong, P.; Yu, L.; Hu, L.; Li, X.; Li, C.; Zhang, H.; Zheng, Y.; Wang, J.; Zhao, Y.; et al. Towards a common validation sample set for global land-cover mapping. Int. J. Remote Sens. 2014, 35, 4795–4814. [Google Scholar] [CrossRef]
- Li, C.; Gong, P.; Wang, J.; Zhu, Z.; Biging, G.S.; Yuan, C.; Hu, T.; Zhang, H.; Wang, Q.; Li, X.; et al. The first all-season sample set for mapping global land cover with Landsat-8 data. Sci. Bull. 2017, 62, 508–515. [Google Scholar] [CrossRef]
- Rao, D.S.; Prasad, A.V.V.; Nair, T. Application of Texture Characteristics for Urban Feature Extraction from Optical Satellite Images. Int. J. Image Graph. Signal Process. 2014, 7, 16–24. [Google Scholar] [CrossRef]
- Open Spatial Demographic Data and Research. Available online: https://www.worldpop.org/ (accessed on 10 January 2021).
- Goodchild, M.F. Citizens as sensors: The world of volunteered geography. GeoJournal 2007, 69, 211–221. [Google Scholar] [CrossRef]
- Haklay, M. How Good is Volunteered Geographical Information? A Comparative Study of OpenStreetMap and Ordnance Survey Datasets. Environ. Plan. B Plan. Des. 2010, 37, 682–703. [Google Scholar] [CrossRef]
- Liu, X.; Long, Y. Automated identification and characterization of parcels with OpenStreetMap and points of interest. Environ. Plan. B Plan. Des. 2015, 43, 341–360. [Google Scholar] [CrossRef]
- Li, X.; Gong, P. An “exclusion-inclusion” framework for extracting human settlements in rapidly developing regions of China from Landsat images. Remote Sens. Environ. 2016, 186, 286–296. [Google Scholar] [CrossRef]
- Li, X.; Liu, X.; Gong, P. Integrating ensemble-urban cellular automata model with an uncertainty map to improve the performance of a single model. Int. J. Geogr. Inf. Sci. 2015, 29, 762–785. [Google Scholar] [CrossRef]
- Chen, J.; Gong, P.; He, C.; Luo, W.; Tamura, M.; Shi, P. Assessment of the Urban Development Plan of Beijing by Using a CA-Based Urban Growth Model. Photogramm. Eng. Remote Sens. 2002, 68, 1063–1072. [Google Scholar]
- Jolliffe, I.T.; Cadima, J. Principal component analysis: A review and recent developments. Philos. Trans. A Math. Phys. Eng. Sci. 2016, 374, 20150202. [Google Scholar] [CrossRef] [PubMed]
- Uddin, M.P.; Mamun, M.A.; Hossain, M.A. PCA-based Feature Reduction for Hyperspectral Remote Sensing Image Classification. IETE Tech. Rev. 2020, 38, 377–396. [Google Scholar] [CrossRef]
- Pan, S.J.; Yang, Q. A Survey on Transfer Learning. IEEE Trans. Knowl. Data Eng. 2010, 22, 1345–1359. [Google Scholar] [CrossRef]
- Gong, P.; Liu, H.; Zhang, M.; Li, C.; Wang, J.; Huang, H.; Clinton, N.; Ji, L.; Li, W.; Bai, Y.; et al. Stable classification with limited sample: Transferring a 30-m resolution sample set collected in 2015 to mapping 10-m resolution global land cover in 2017. Sci. Bull. 2019, 64, 370–373. [Google Scholar] [CrossRef]
- Shach-Pinsly, D.; Bindreiter, S.; Porat, I.; Sussman, S.; Forster, J.; Rinnerthaler, M. Multiparametric Analysis of Urban Environmental Quality for Estimating Neighborhood Renewal Alternatives. Urban Plan. 2021, 6, 172–188. [Google Scholar] [CrossRef]
- Graymore, M.L.M.; Sipe, N.G.; Rickson, R.E. Sustaining Human Carrying Capacity: A tool for regional sustainability assessment. Ecol. Econ. 2010, 69, 459–468. [Google Scholar] [CrossRef]
- Cortes, C.; Vapnik, V. Support-vector networks. Mach. Learn. 1995, 20, 273–297. [Google Scholar] [CrossRef]
- Bao, H.; Ming, D.; Guo, Y.; Zhang, K.; Zhou, K.; Du, S. DFCNN-Based Semantic Recognition of Urban Functional Zones by Integrating Remote Sensing Data and POI Data. Remote Sens. 2020, 12, 1088. [Google Scholar] [CrossRef]
- Li, X.; Yeh, A.G. Modelling sustainable urban development by the integration of constrained cellular automata and GIS. Int. J. Geogr. Inf. Sci. 2000, 14, 131–152. [Google Scholar] [CrossRef]
- Liu, X.; Li, X.; Shi, X.; Wu, S.; Liu, T. Simulating complex urban development using kernel-based non-linear cellular automata. Ecol. Model. 2008, 211, 169–181. [Google Scholar] [CrossRef]
- Li, X.; Gong, P.; Yu, L.; Hu, T. A segment derived patch-based logistic cellular automata for urban growth modeling with heuristic rules. Comput. Environ. Urban Syst. 2017, 65, 140–149. [Google Scholar]


| Level I | Level II | Descriptions |
|---|---|---|
| 01 Residential | 0101 Lower building | Houses and lower apartment. |
| 0102 High rise building | Higher level buildings. | |
| 02 Commercial | 0201 Business office | Buildings where people work, including office buildings, and commercial office places for finance, media etc. |
| 0202 Commercial service | Houses and buildings for commercial retails, restaurants, and entertainments. | |
| 03 Industrial | 0301 Industrial | Land and buildings used for manufacturing, warehouse, mining, etc. |
| 04 Public Management & Service | 0401Administrative, Education, Medical and Sport | Lands used for administrative, education, medical and sport related. |
| 05 Road (grid only) | 0501 Road first class 0502 Road second class 0503 Road third class | Paved roads including freeways Major and minor city-roads. |
| 06 Greenspace | 0601 Greenspace | Woodland, grassland, farmland and other greenspace. |
| 07 Water | 0701 Water | Lakes, rivers and other surfaces of water. |
| Data Sources | Features | Count |
|---|---|---|
| Satellite Spectral | ndviMEAN, ndviSTD, ndviVAR, ndwiMEAN, ndwiSTD, ndwiVAR, b1MEAN, b1STD, b1VAR, b2MEAN, b2STD, b2VAR, b3MEAN, b3STD, b3VAR, b4MEAN, b4STD, b4VAR | 18 |
| Satellite Texture (grid only) | mean, variance, homogeneity, contrast, dissimilarity, entropy, second moment and correlation calculated by the Grey Level Concurrence Matrix (GLCM) of each spectral band | 32 |
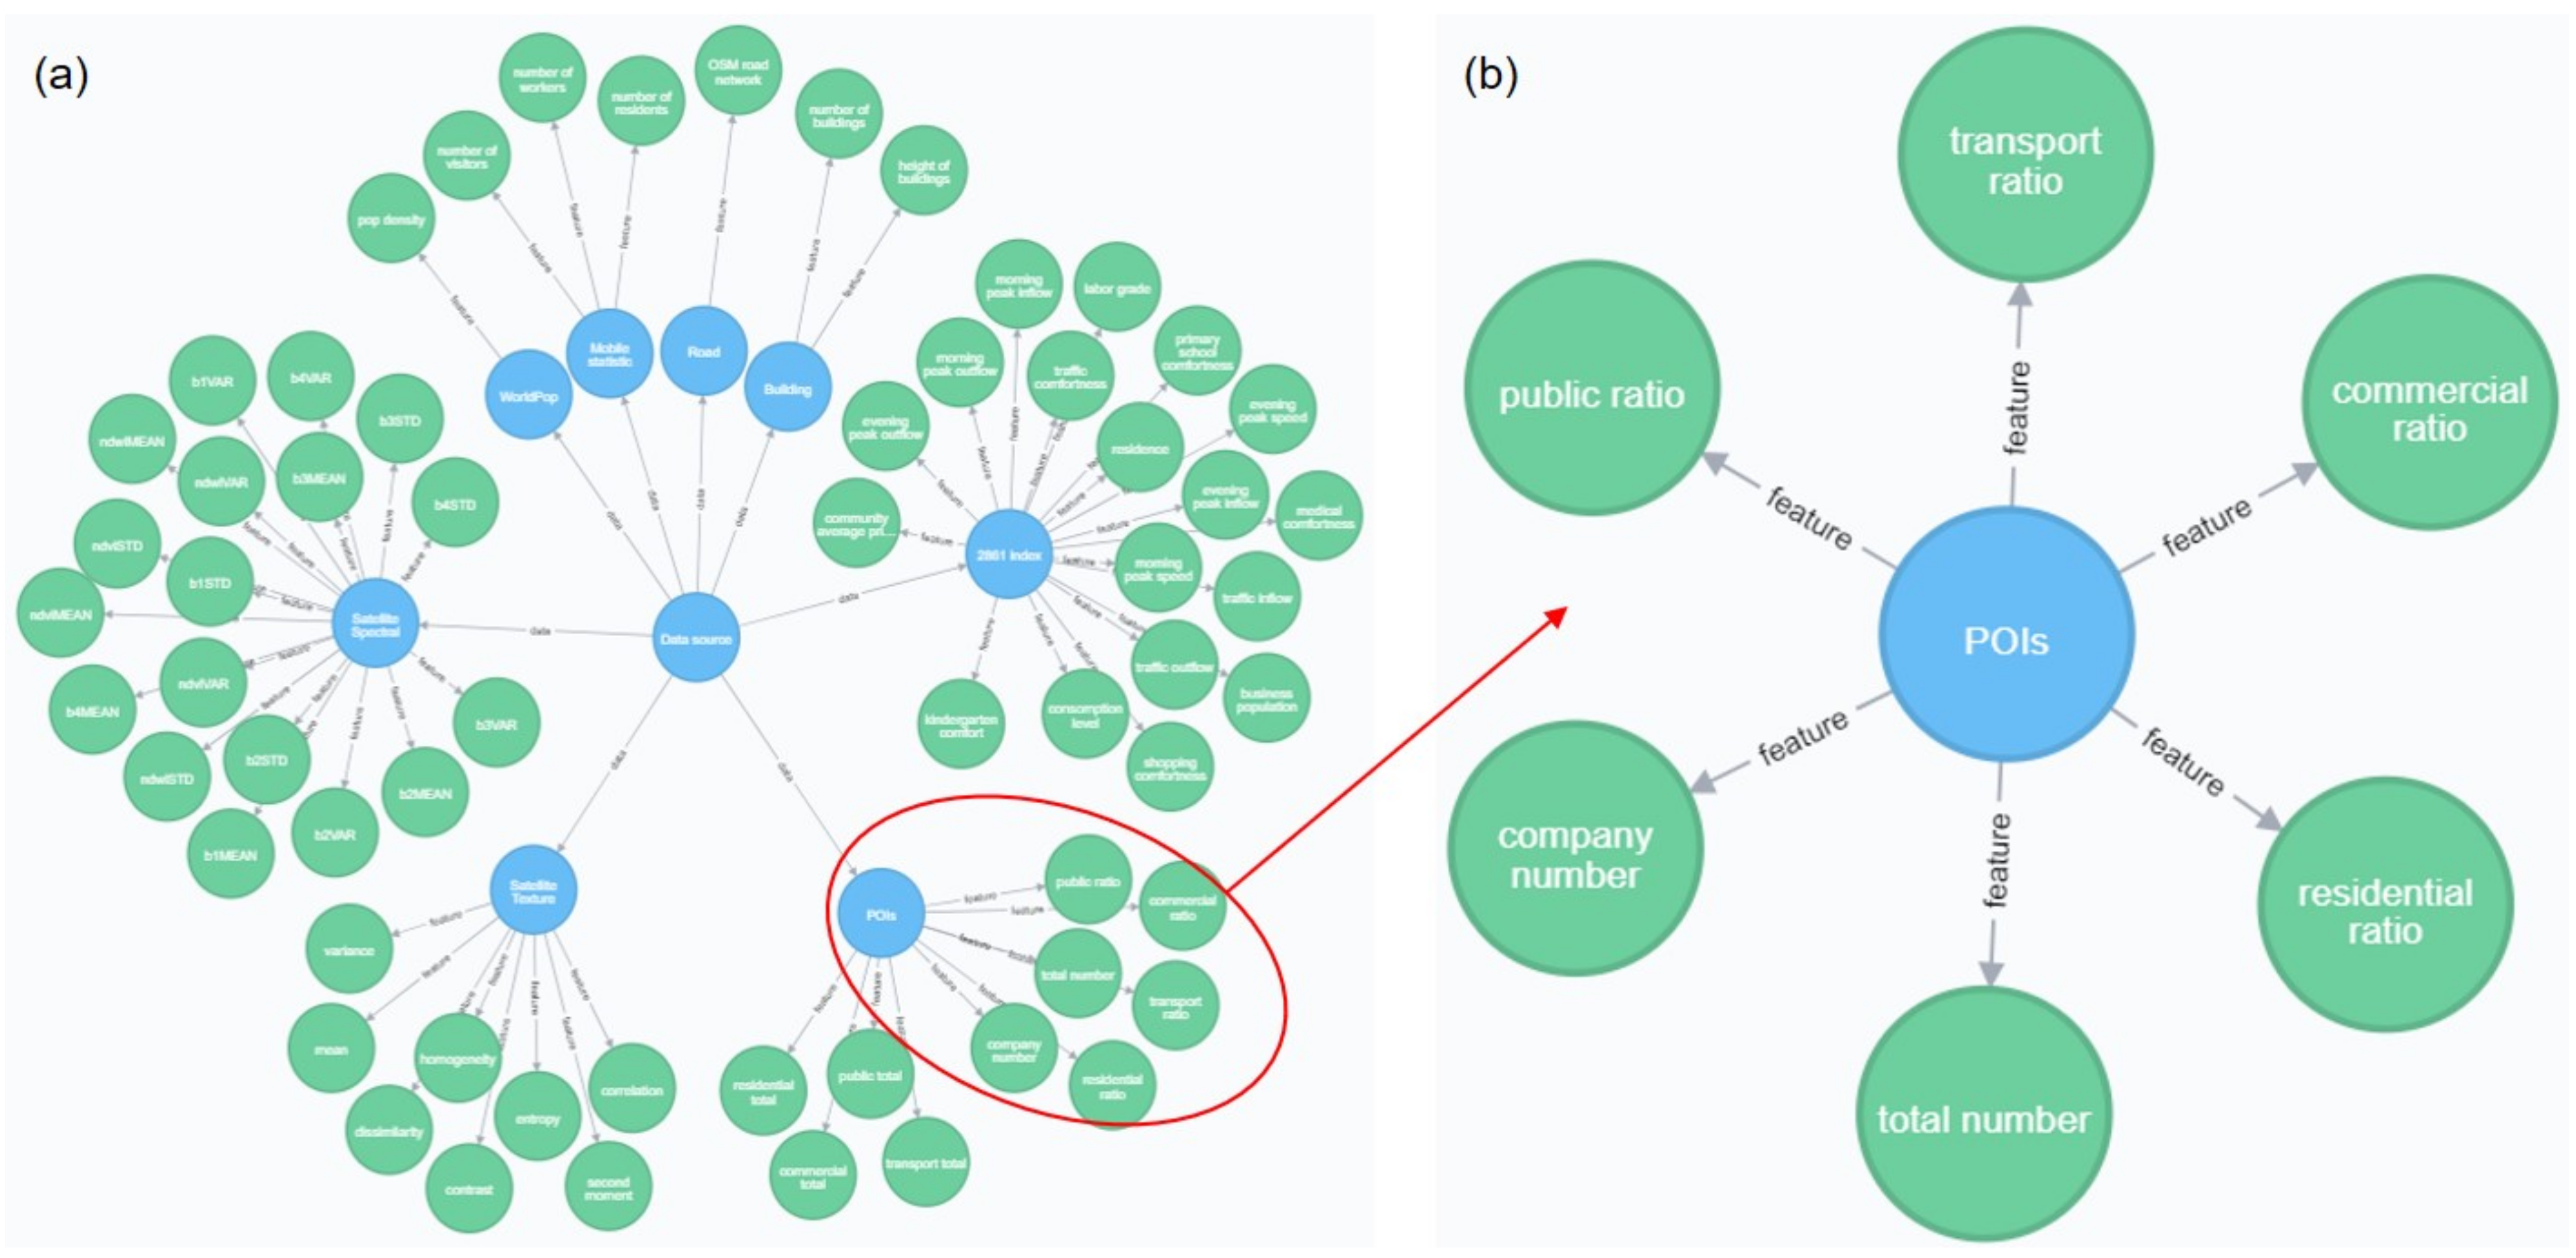
| POIs | residential ratio, residential total, commercial ratio, commercial total, transportation ratio, transportation total, public ratio, public total, total number, company number | 10 |
| 2861 index | traffic outflow, traffic inflow, traffic comfort, medical comfort, residence, labor grade, business population, evening peak outflow, evening peak inflow, evening peak speed, morning peak outflow, morning peak inflow, morning peak speed, kindergarten comfort, primary school comfort, consumption level, shopping comfort, community average price | 18 |
| WorldPop | pop density | 1 |
| Building | height | 1 |
| Mobile statistic | work pop, resident pop, visit pop | 3 |
| Residential | Public | Commercial | Industrial | UA | PA | |
|---|---|---|---|---|---|---|
| Residential | 204 | 25 | 14 | 22 | 87.55% | 76.98% |
| Public | 12 | 75 | 4 | 9 | 68.81% | 75.00% |
| Commercial | 7 | 5 | 38 | 6 | 67.86% | 67.86% |
| Industrial | 10 | 4 | 0 | 165 | 81.68% | 92.18% |
| OA = 80.33%, Kappa coefficient = 0.7146 | ||||||
| Residential | Public | Commercial | Industrial | UA | PA | |
|---|---|---|---|---|---|---|
| Residential | 207 | 21 | 11 | 26 | 87.71% | 78.11% |
| Public | 15 | 74 | 2 | 9 | 71.15% | 74.00% |
| Commercial | 7 | 5 | 38 | 6 | 74.51% | 67.86% |
| Industrial | 7 | 4 | 0 | 168 | 80.38% | 93.85% |
| OA = 81.17%, Kappa coefficient = 0.7253 | ||||||
| Low Resident | High Resident | Business | Commercial | Industrial | Adm. etc. | UA | PA | |
|---|---|---|---|---|---|---|---|---|
| Low Resident | 130 | 0 | 1 | 16 | 24 | 3 | 84.42% | 74.71% |
| High Resident | 0 | 60 | 0 | 2 | 0 | 1 | 74.07% | 95.24% |
| Business | 1 | 9 | 7 | 1 | 1 | 0 | 77.78% | 36.84% |
| Commercial | 7 | 6 | 1 | 18 | 6 | 0 | 39.13% | 47.37% |
| Industrial | 6 | 0 | 0 | 1 | 157 | 4 | 80.51% | 93.45% |
| Adm.etc. | 10 | 6 | 0 | 8 | 7 | 23 | 74.19% | 42.59% |
| OA = 76.55%, Kappa coefficient = 0.6847 | ||||||||
| Features Combinations | RF | Moore Neighborhood | Accuracy Improved |
|---|---|---|---|
| Satellite | 65.50% | 67.33% | 1.83% |
| Satellite + mobile | 71.67% | 72.83% | 1.16% |
| All features | 80.33% | 81.17% | 0.84% |
| Residential | Public | Commercial | Industrial | UA | PA | |
|---|---|---|---|---|---|---|
| Residential | 197 | 24 | 11 | 21 | 84.19% | 77.87% |
| Public | 18 | 55 | 8 | 8 | 63.95% | 61.80% |
| Commercial | 12 | 6 | 35 | 12 | 58.33% | 53.85% |
| Industrial | 7 | 1 | 6 | 64 | 60.95% | 82.05% |
| OA = 72.37%, Kappa coefficient = 0.5841 | ||||||
| Residential | Business | Commercial | Industrial | Adm. etc. | UA | PA | |
|---|---|---|---|---|---|---|---|
| Residential | 188 | 7 | 11 | 28 | 19 | 85.07% | 74.31% |
| Business | 7 | 13 | 2 | 5 | 3 | 48.15% | 43.33% |
| Commercial | 4 | 2 | 17 | 7 | 4 | 50.00% | 50.00% |
| Industrial | 13 | 3 | 2 | 59 | 2 | 56.19% | 74.68% |
| Adm. etc. | 9 | 2 | 2 | 6 | 30 | 51.72% | 61.22% |
| OA = 68.99%, Kappa coefficient = 0.5240 | |||||||
| Category | Training Size | Testing Size |
|---|---|---|
| Public | 2723 | 303 |
| Residential | 2273 | 253 |
| Industrial | 707 | 78 |
| Commercial | 581 | 65 |
| Residential | Public | Commercial | Industrial | UA | PA | |
|---|---|---|---|---|---|---|
| Residential | 225 | 7 | 6 | 28 | 71.66% | 84.59% |
| Public | 27 | 53 | 4 | 14 | 74.65% | 54.08% |
| Commercial | 31 | 3 | 10 | 11 | 47.62% | 18.18% |
| Industrial | 31 | 8 | 1 | 138 | 72.25% | 77.53% |
| OA = 71.36%, Kappa coefficient = 0.6121 | ||||||
| Residential | Public | Commercial | Industrial | UA | PA | |
|---|---|---|---|---|---|---|
| Residential | 224 | 13 | 1 | 20 | 72.44% | 87.96% |
| Public | 30 | 55 | 0 | 16 | 79.73% | 59.00% |
| Commercial | 38 | 3 | 6 | 8 | 87.50% | 12.96% |
| Industrial | 31 | 3 | 1 | 151 | 78.46% | 85.00% |
| OA = 71.69%, Kappa coefficient = 0.6825 | ||||||
Publisher’s Note: MDPI stays neutral with regard to jurisdictional claims in published maps and institutional affiliations. |
© 2022 by the authors. Licensee MDPI, Basel, Switzerland. This article is an open access article distributed under the terms and conditions of the Creative Commons Attribution (CC BY) license (https://creativecommons.org/licenses/by/4.0/).
Share and Cite
Wang, X.; Chen, B.; Li, X.; Zhang, Y.; Ling, X.; Wang, J.; Li, W.; Wen, W.; Gong, P. Grid-Based Essential Urban Land Use Classification: A Data and Model Driven Mapping Framework in Xiamen City. Remote Sens. 2022, 14, 6143. https://doi.org/10.3390/rs14236143
Wang X, Chen B, Li X, Zhang Y, Ling X, Wang J, Li W, Wen W, Gong P. Grid-Based Essential Urban Land Use Classification: A Data and Model Driven Mapping Framework in Xiamen City. Remote Sensing. 2022; 14(23):6143. https://doi.org/10.3390/rs14236143
Chicago/Turabian StyleWang, Xi, Bin Chen, Xuecao Li, Yuxin Zhang, Xianyao Ling, Jie Wang, Weimin Li, Wu Wen, and Peng Gong. 2022. "Grid-Based Essential Urban Land Use Classification: A Data and Model Driven Mapping Framework in Xiamen City" Remote Sensing 14, no. 23: 6143. https://doi.org/10.3390/rs14236143
APA StyleWang, X., Chen, B., Li, X., Zhang, Y., Ling, X., Wang, J., Li, W., Wen, W., & Gong, P. (2022). Grid-Based Essential Urban Land Use Classification: A Data and Model Driven Mapping Framework in Xiamen City. Remote Sensing, 14(23), 6143. https://doi.org/10.3390/rs14236143