Article

Shallow and Deep Electric Structures in the Tolhuaca Geothermal System (S. Chile) Investigated by Magnetotellurics

1
Institute for Nuclear Waste Disposal, Karlsruhe Institute of Technology, Hermann-von-Helmholtz-Platz 1, 76344 Eggenstein-Leopoldshafen, Germany
2
Institute of Applied Geosciences, Karlsruhe Institute of Technology, Adenauerring 20B, 76131 Karlsruhe, Germany
3
Departamento de Geofísica, Facultad de Ciencias Físicas y Matemáticas, Universidad de Chile, Blanco Encalada 2002, Santiago 8370415, Chile
4
Andean Geothermal Center of Excellence (CEGA, ANID-FONDAP), Pl. Ercilla 803, Santiago 8370448, Chile
5
Millennium Institute on Volcanic Risk Research—Ckelar Volcanoes, Avenida Angamos 0610, Antofagasta 1270709, Chile
6
Fachrichtung Geophysik, Freie Universität Berlin, Malteserstr. 74-100, 12249 Berlin, Germany
7
Bundesanstalt für Geowissenschaften und Rohstoffe, Wilhelmstr. 25-30, 13593 Berlin, Germany
8
Geothermie Neubrandenburg GmbH, Seestr. 7A, 17033 Neubrandenburg, Germany
9
Departamento de Geología, Facultad de Ciencias Físicas y Matemáticas, Universidad de Chile, Blanco Encalada 2002, Santiago 8370415, Chile
10
Institute of Applied Geosciences, Technical University Darmstadt, Schnittspahnstraße 9, 64287 Darmstadt, Germany
*
Author to whom correspondence should be addressed.
Remote Sens. 2022, 14(23), 6144; https://doi.org/10.3390/rs14236144
Submission received: 2 November 2022 / Revised: 24 November 2022 / Accepted: 26 November 2022 / Published: 3 December 2022

Abstract

:
The geoelectric properties of the geothermal system associated with the Tolhuaca volcano were investigated by three-dimensional (3D) inversion of magnetotelluric (MT) data. This study presents the first resistivity model of the Tolhuaca volcano derived from 3D MT inversion to have a better understanding of its magmatic and hydrothermal system. We selected data from 54 MT stations for 3D inversion. We performed a series of 3D MT inversion tests by changing the type of data to be inverted, as well as the starting model to obtain a model in agreement with the geology. The final 3D MT model presents a conductive body (<20 Ωm) located 2 km below the summit of Tolhuaca volcano, inferred as a shallow magmatic storage compartment. We also distinguish a ~300 m thick layer of high conductivity (<10 Ωm) corresponding to argillic hydrothermal alteration. The MT model includes two resistive bodies (~200 Ωm) in the upper crust below the laterally displaced argillic alteration layer to the west beneath the extinct Tolhuaca, which would correspond to a shallow reservoir (~1000 m from the surface) and a deep reservoir (>1800 m from the surface) that had so far not been identified by previous resistivity models. The result of this study provides new insights into the complexity of the Tolhuaca geothermal system.

1. Introduction

The Andean volcanic arc is characterized by numerous hot springs, solfataras, and geysers associated with abundant volcanic activity. Comprising more than 200 potentially active volcanoes and at least 12 giant caldera/ignimbrite systems [1], it is a region with a vast potential for geothermal development.
In Chile, the Andean volcanism as a result of the subduction of the Nazca and Antarctic oceanic plates beneath South America [1,2,3] occurs in three segments separated by gaps or segments described as Central (CVZ; 14–28°S), Southern (SVZ; 33–46°S), and Austral (AVZ; 49–55°S) Volcanic Zones (Figure 1a). As a result, a wide range of volcano-tectonic configurations, crustal thicknesses, and ascent pathways create different activity, products, and morphology within volcanic zones [4] and even between nearby volcanoes [5,6].
More than 300 potential geothermal areas have been indicated throughout the Chilean Andes [8,9], associated with Quaternary volcanism. The main high-enthalpy geothermal systems occur in CVZ (e.g., Apacheta, El Tatio) and SVZ (e.g., Tinguiririca, Mariposa, Tolhuaca) [8]. In areas where Quaternary volcanism is absent, Pampean Flat-slab Segment and Patagonia Volcanic Gap, there are fewer hot springs or are less pronounced and their temperatures are usually lower [9].
According to variations in the petrology and geochemistry of its products, the Quaternary volcanism of the SVZ has been divided into four segments [1,10] (Figure 1a). The Tolhuaca volcano is located in the South-Central Volcanic Zone (SCVZ: 37–42°S), which is characterized by, among others things, a reduced thickness of the continental crust, compared with areas further north, and a younger age of the subducted oceanic crust. The nature and origin of hydrothermal systems are strongly dependent on structurally controlled heat transfer mechanisms that define contrasting magmatic-tectonic-hydrothermal domains [11].
Both Lonquimay and Tolhuaca volcanoes are aligned with a WNW trend [7,12], and located in the arc-oblique long-lived fault system domains that promote the development of magma reservoirs in the crust [7,11]. Both Pleistocene–Holocene volcanoes are built over Miocene volcano-sedimentary rocks [13], which have high intrinsic porosity and permeability and thus enhance the development of hydrothermal reservoirs [4,11].
Tolhuaca volcano is a glacially scoured stratovolcano [14,15]. At the summit, there are several NW-trending aligned craters, indicating migration of the volcanic activity from SE towards the NW [7,13,15], several hydrothermal manifestations, and an active geothermal system.
The Tolhuaca Geothermal System (TGS) has been investigated over the past decades by geological (e.g., [7,12,13,14,16]), geochemical (e.g., [17,18,19]), and geophysical (e.g., [20,21]) studies, including magnetotellurics (MT). Classical MT and in particular the high-frequency variant of MT, audiomagnetotellurics (AMT), is frequently used to investigate magmatic reservoirs and deep geothermal resources to characterize the electrical resistivity of the structures of these systems with good resolution from a few tens of meters to several kilometers [22,23,24].
Previous MT studies at areas surrounding TGS reveal upper crustal resistive structures at depths >10 km and conductive anomalies beneath active Lonquimay volcano. A conductive anomaly continues in the lower crust with an eastward dip and may be connected to the upper mantle [25,26], while the first electrical resistivity models at TGS detect a clay hydrothermal alteration layer, at 400 m depth [20,21], and a resistivity image along the western flank of Tolhuaca volcano [20].
Additional data from TGS were obtained from well logging [14]. A flow test of one of the deep wells identified a two-level reservoir with steam and steam-heated waters at shallow depth, and a deep fluid reservoir below [21]. The well temperature reaches 150–200 °C at 500 m depth. Deep drilling revealed a fluid-dominated deposit at 300 °C from 1100 to 2500 m depth [14,21].
The objective of this work is to gain a comprehensive understanding of the geoelectric properties of the geothermal system associated with the Tolhuaca volcano in its western sector. For this purpose, MT datasets, including the full impedance tensor and vertical magnetic transfer function, obtained at Tolhuaca in recent decades have been reevaluated and interpreted by 3D MT inversion.

2. Geological Setting

The main tectonic features in the research area are the Liquiñe-Ofqui Fault System (LOFS) and the Andean Transverse Faults (ATF) (Figure 1b) [27,28,29], forming a widely distributed structural system in the SVZ [2,30,31]. Additionally, the major eruptive centers located in the research area are the Tolhuaca volcano and the Lonquimay Volcanic Complex volcanoes (Figure 2).
The LOFS is a 1200 km-long intra-arc strike-slip fault system, defined by a series of major NNE-striking, right-lateral, strike-slip faults associated with NE-striking normal-dextral faults that splay off NNE- striking faults [4,28,33,34]. In the domain of research area, LOFS comes into play in its eastern section with its spatial arrangement forming duplex and horsetail geometries (Figure 1b) [4,28,32]. In turn, four independent monogenic volcanoes (Caracol, Laguna verde, La Holandesa, and Lolco) were built on a branch of LOFS (Figure 2) [7,32].
The ATF is formed by a series of NW-striking faults inherited from pre-Andean geological processes (Figure 2) (e.g., [29,35]). In the Central and Southern Andes, the faults that comprise the ATF are spatially and genetically associated with the occurrence of Quaternary volcanism [4,11,27,33,36]. Likewise, ATF partially controls the past and present-day fluid flow and volcanic activity [33,37]. The Tolhuaca volcano is located at the intersection of the LOFS and one fault of the ATF (Figure 1b), thus providing a potential long-lived pathway for the ascent of deeply stored fluids [17,29].
Several Cretaceous to Lower Pleistocene stratified sequences, together with Miocene plutonic rocks and Miocene-Pliocene hypabyssal intrusives [7,13] form the basement of both the Tolhuaca volcano and the Lonquimay Volcanic Complex. The N-NE Liquiñe-Ofqui Fault System is the first-order structure that crosses between Tolhuaca and Lonquimay volcanoes. The second-order alignments are the NE-SW, trending the four independent monogenetic volcanoes, and the NW-SE, trending the two major volcanoes (Figure 2).
Tolhuaca volcano (2806 m a.s.l) is a middle Pleistocene stratovolcano, with a NW fissural structure and numerous volcanoclastic rocks at its base [7,13]. It is an elliptical feature with a major axis of 20 km (northwest–southeast) and a minor axis of 13 km [13,15] (Figure 2). Its summit rises above the mid-level of the basement of Oligo-Miocene volcanic sedimentary rocks and Miocene granitic rocks of the Patagonian batholith [7,15]. Two upper craters represent the last eruptive phases of the volcano; a 2 km long fissure and a pyroclastic cone are linked to a lava flow. All are oriented to the N-NW and enhanced by glacial action. At the SE termination of the summit of Tolhuaca, glaciers can still be observed, with a total area of ca. 5 km2 [7].
Basaltic and basaltic-andesitic lavas and pyroclastic flows intercalated with andesite and dacite lava flows dominate the eruptive products [13,14,21]. The main stratovolcano was formed about 280 and 30 ka ago, through four morphostructural units, with lava flows and dike, basaltic to dacitic in composition [14,15]. However, the Tolhuaca volcano has no record historical eruptions [7,15]. The most recent units developed between about 30 ka and the Holocene, with basaltic to silicic andesitic lava flows.
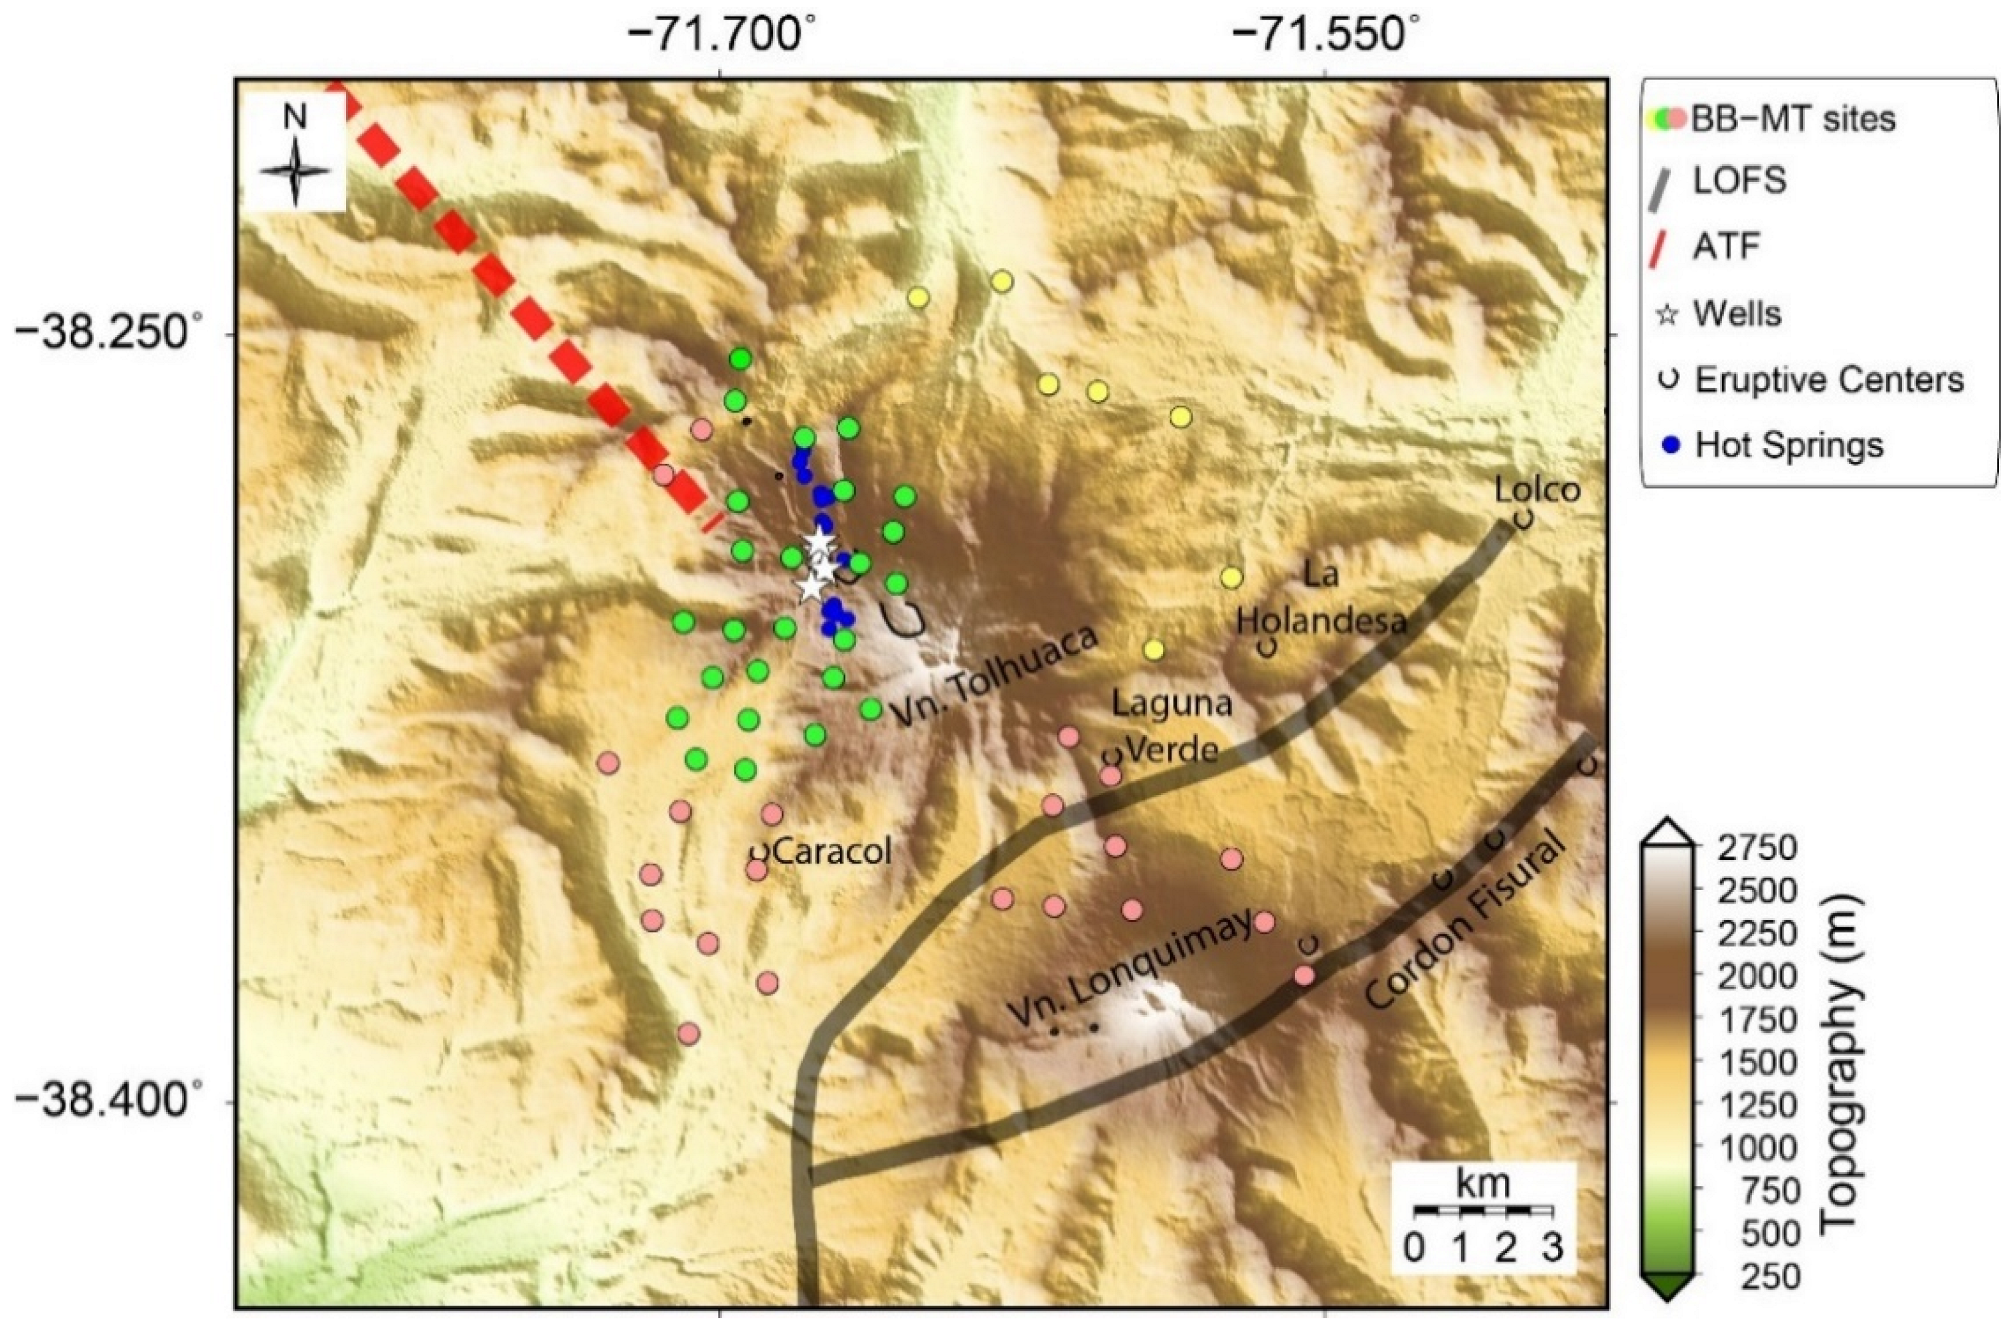
On the NW flank of Tolhuaca volcano, the TGS has developed with reservoir temperatures estimated at 220–300 °C [14,20,21], characterized by several surface hydrothermal manifestations (Figure 2). Fumaroles, solfataras, and hot springs are located in the NW fissure [20,38], suggesting the existence of a NW striking fault that promotes hydrothermal and magmatic ascent [17]. The geothermal field is spatially associated with both the LOFS and the ATF [4,17,29] (Figure 2).
Two slim holes (Tol-1 and Tol-2) and two larger diameter wells (Tol-3 and Tol-4) (Figure 2) up to 2117 m vertical depth suggest the presence of a geothermal reservoir at approximately 1.5 km below surface [14]. Liquid saturated conditions were determined with temperatures of up to 300 °C and a strong meteoric water component [21]. The reservoir appears to be covered by a steam-heated aquifer at shallow depths reaching up to 160 °C [20,21]. The well Tol-1 was continuously cored to 1073 m depth. Drilling paused for a flow test demonstration of the shallow 150 °C to 160 °C steam reservoir between 120 m and 320 m depth [20].
Lonquimay volcano (2865 m a.s.l.), located 8 km southeast of Tolhuaca volcano (Figure 2), is a symmetrical cone whose basal stage on basaltic to basaltic andesite rocks started within the Upper Pleistocene [39]. The main cone formed from the upper Pleistocene to the early Holocene, with accumulations of basaltic to intermediate andesite. Younger units are Holocene, with basaltic to andesitic lavas that flowed onto the northern, western, and southern flanks of the cone. From Holocene to present, volcanic activity has been concentrated in the Eastern Cordon Fisural [7,40] (Figure 2). Historical volcanic activities of Lonquimay have been recorded in 1853, 1887–1890 and 1988–1990; the latter formed the Navidad (“Christmas”) crater and an andesitic lava flow extending ~10 km to the north [32] (Figure 2).

3. Magnetotellurics: Data, Processing, and Results

Magnetotellurics (MT) is an electromagnetic method that records the fluctuations of electric and magnetic fields at the Earth’s surface to obtain information on the resistivity distribution at depth. Since the penetration depth of electromagnetic fields into the Earth covers a large depth range, MT is used in crustal and even mantle studies to image the resistivity distribution. Depth of penetration decreases as the EM signal frequency increases.
In volcanic environments, MT is used to image conduits or magmatic reservoirs [41,42,43,44], hydrothermal fluids [45,46], and clay layers [47]. In the southern volcanic zone, MT studies have characterized magmatic systems [25,26,48,49], geothermal reservoirs [20,21], fluid pathways [50,51], and mid-crustal conductors [52,53].

3.1. Data Acquisition

The new MT data, which complement earlier datasets, were acquired during two field campaigns. In 2019, between November and December, we deployed 25 broadband magnetotelluric (BB-MT) stations mainly in the area between Tolhuaca and Lonquimay volcanoes. In March 2020, we added four additional BB-MT stations at the northern flank of Lonquimay. Combining the new MT data with previous datasets, we used a total of 54 BB-MT stations (Figure 2) to investigate the underground resistivity at crustal depths along the Lonquimay-Tolhuaca Volcanic Complex. A period band of 10−3 to 512 s was chosen for data acquisition.
Measurements were carried out using four BB-MT stations each equipped with a Metronix ADU-07e data logger. Magnetic fields were obtained using three MSF-07e coil magnetometers, buried into the ground for thermal and mechanical stability, and oriented in N, E, and vertical directions. Electric fields were obtained by voltage difference taken over a dipole extension of 90 m, using four EFP-06 electrodes (Metronix Inc.) oriented in N-S, E-W direction. The time series of the horizontal components of the electric (Eh) and magnetic (Bh) fields, as well as the vertical component of the magnetic field (Bz) were recorded over 48 h. To be able to apply remote reference processing [54], two stations were always operated simultaneously.

3.2. Processing and Inversion

The processing of the broadband EM time series was performed with a robust code based on [54,55] that includes filtering of nearby artificial EM sources that may invalidate the plane-wave assumption of the MT fields. In addition, the remote referencing technique is applied which leads to a significant improvement of the transfer function quality in the so-called dead band from about 1 to 10 s where the natural source signals are generally weak. From this robust processing, the complex impedance tensor (Z), defined by the relationship Eh = ZBh between the horizontal electric field and magnetic induction, Eh and Bh, respectively, is estimated. In addition, robust processing also estimates the geomagnetic transfer function T (“tipper”), defined as Bz = TB [56].
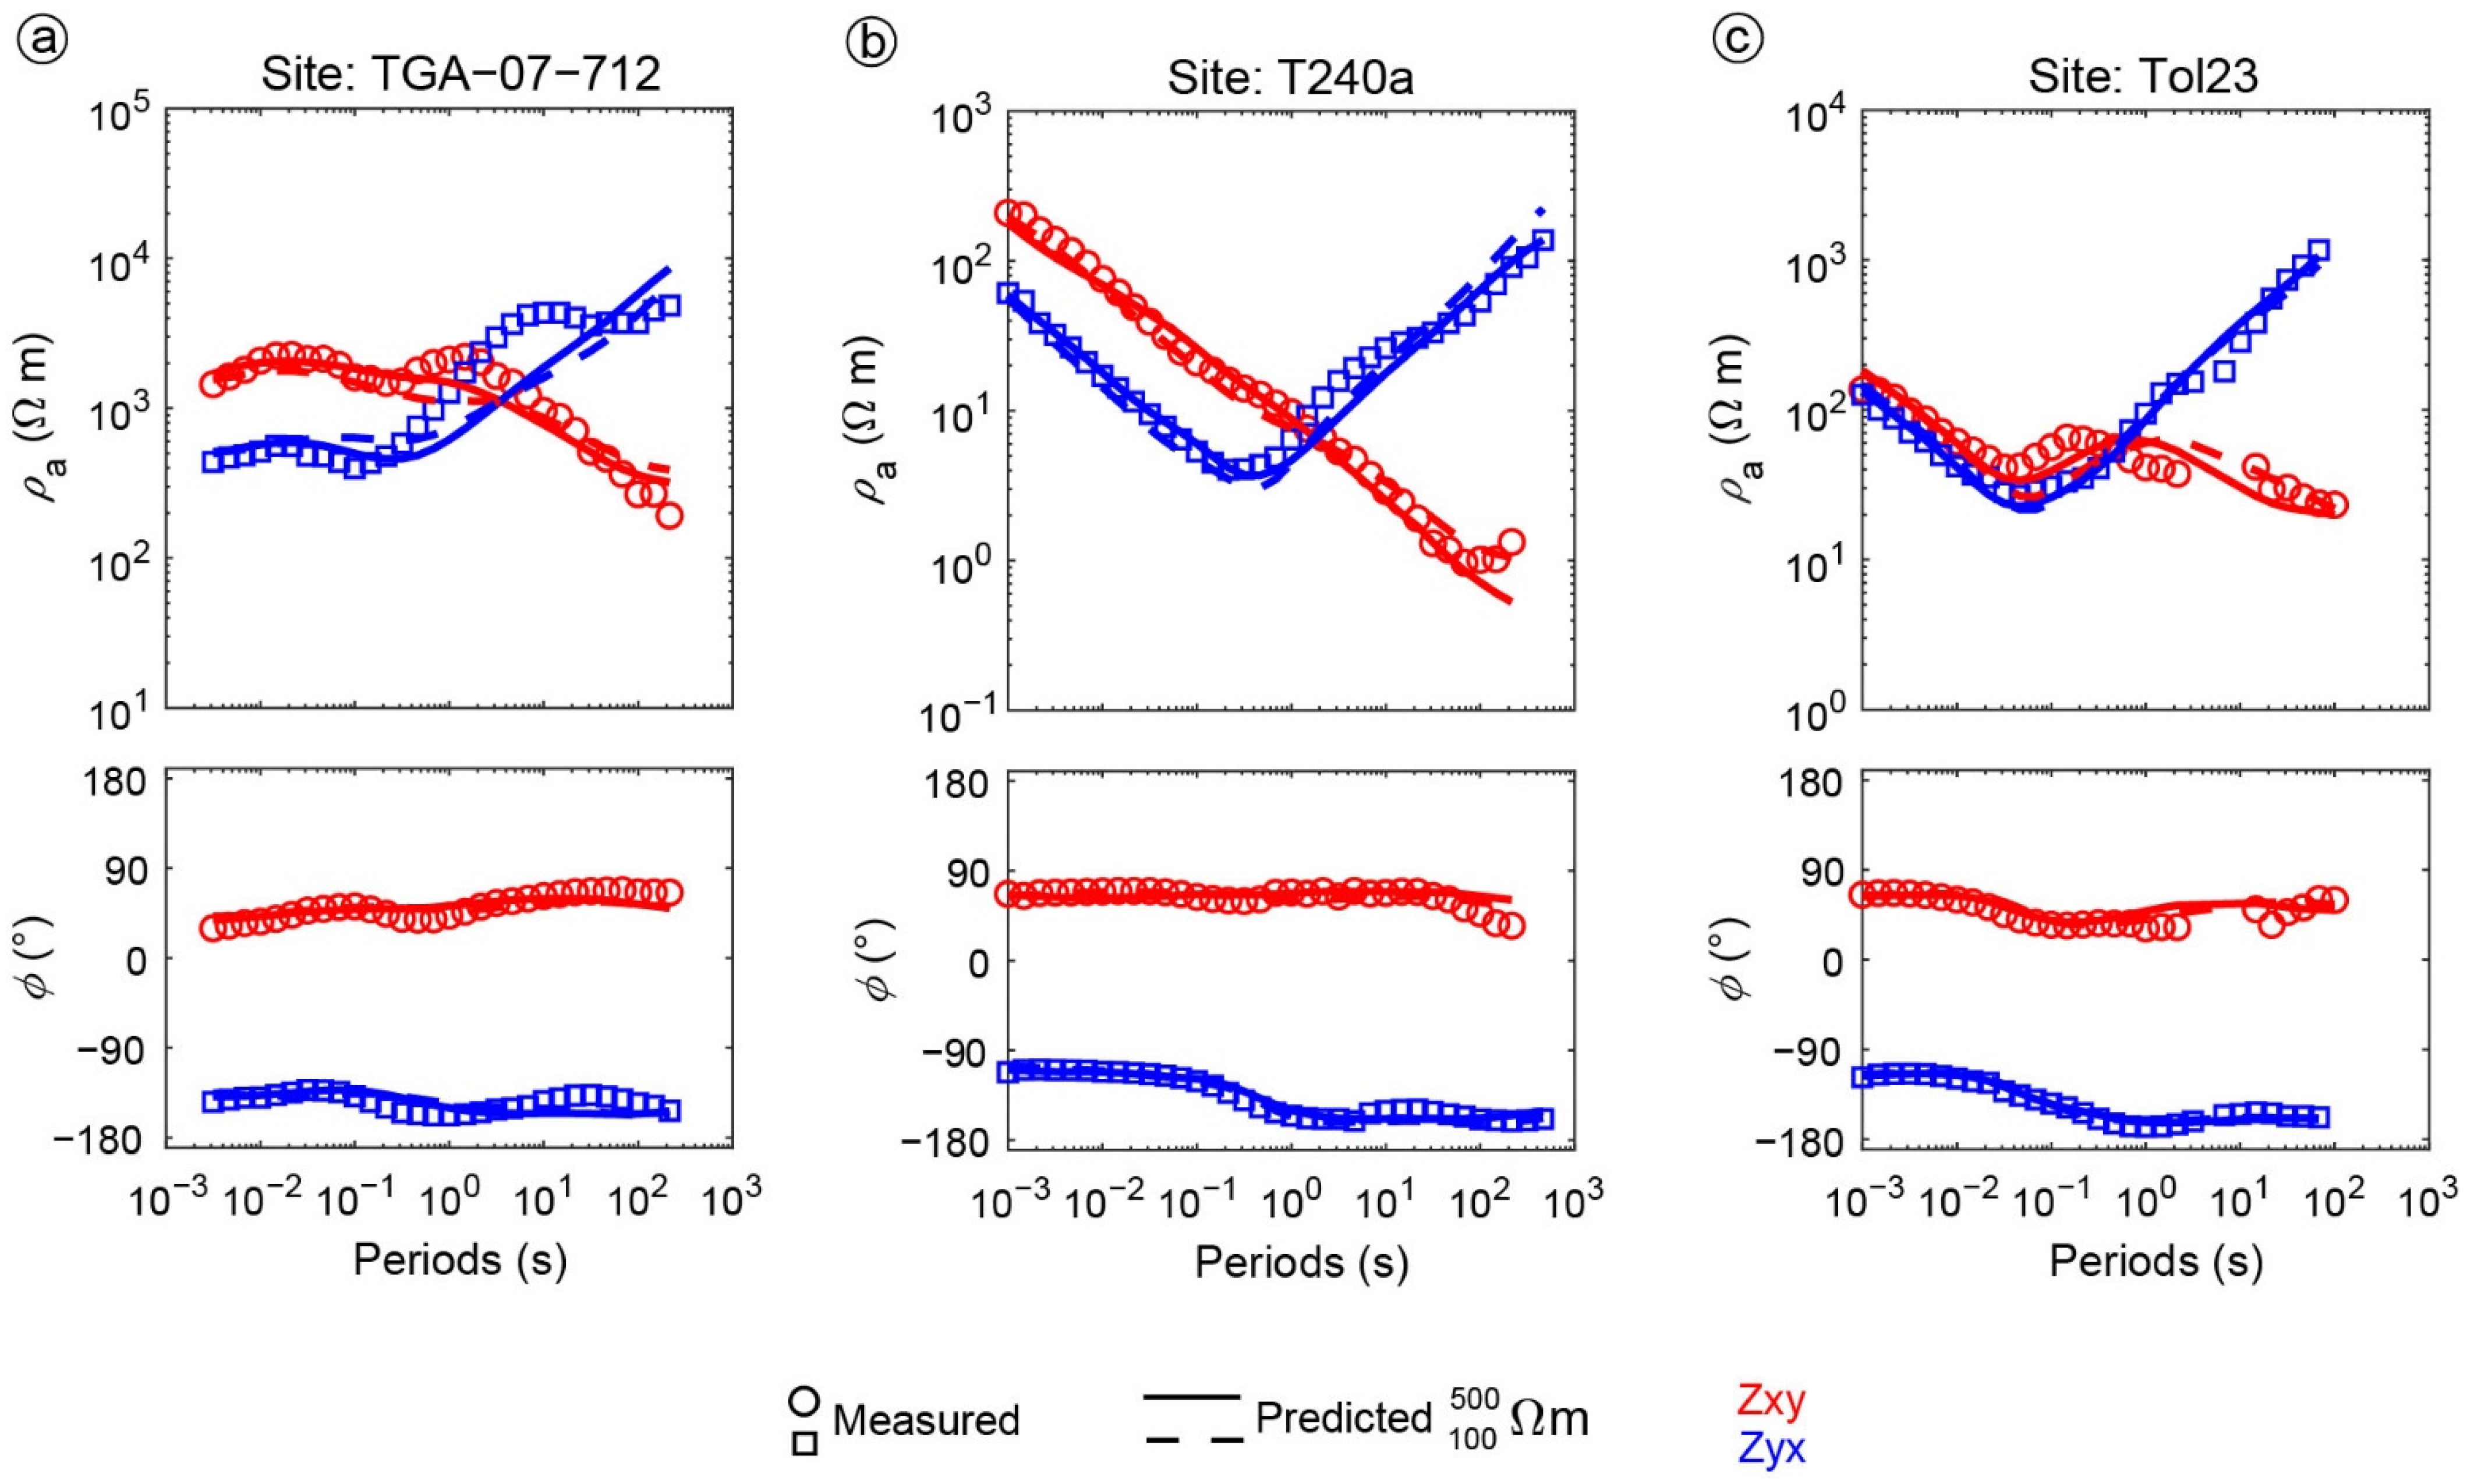
Apparent resistivity and phase curves corresponding to the impedance tensor elements Zxy and Zyx for the reference sites TGA-712a, T248a, and Tol23, located northeast, west, and southeast of Tolhuaca volcano, are shown in Figure 3. Here, the large split of apparent resistivity curves indicates a conductive anomaly at depth.
Our goal is to provide a 3D resistivity model of Tolhuaca volcano to understand better its magmatic and hydrothermal system by correlating it with geological and well logging information. To achieve this goal, we applied an inversion process, in which the observed impedance data were fitted by least squares method to the calculated data.
Three-dimensional inversion of impedance tensor and geomagnetic transfer function data was performed using the “Modular System for Inversion of Electromagnetic Geophysical Data, ModEM” developed by [57]. The main advantage of ModEM is the fast convergence that finally allows the joint inversion of the impedance tensor together with the tipper transfer function. The inversion settings, 3D mesh, and results were prepared and analyzed using the 3D-Grid Academic software (Melbeq, pers. comm.).
A regular grid extending over 100 (N-S, positive northward) × 90 (E-W, positive eastward) cells with a uniform size of 250 m × 250 m was used in the model core. To avoid boundary effects, 18 padding cells with an increasing factor of 1.3 were added to this model core. Topography was included of the study area discretized from SRTM-3 using an initial cell size of 50 m and included 1750 m of topographic relief throughout the region with a maximum elevation of 2865 m a.s.l. and a minimum elevation of 865 m a.s.l. The vertical cells continue with an increasing factor of 1.2; thus, 77 layers conform the vertical direction. In total, the grid extends 130 km × 100 km in the horizontal directions and to about 300 km depth, in accordance with the conditions and depth of the electromagnetic skin effect.
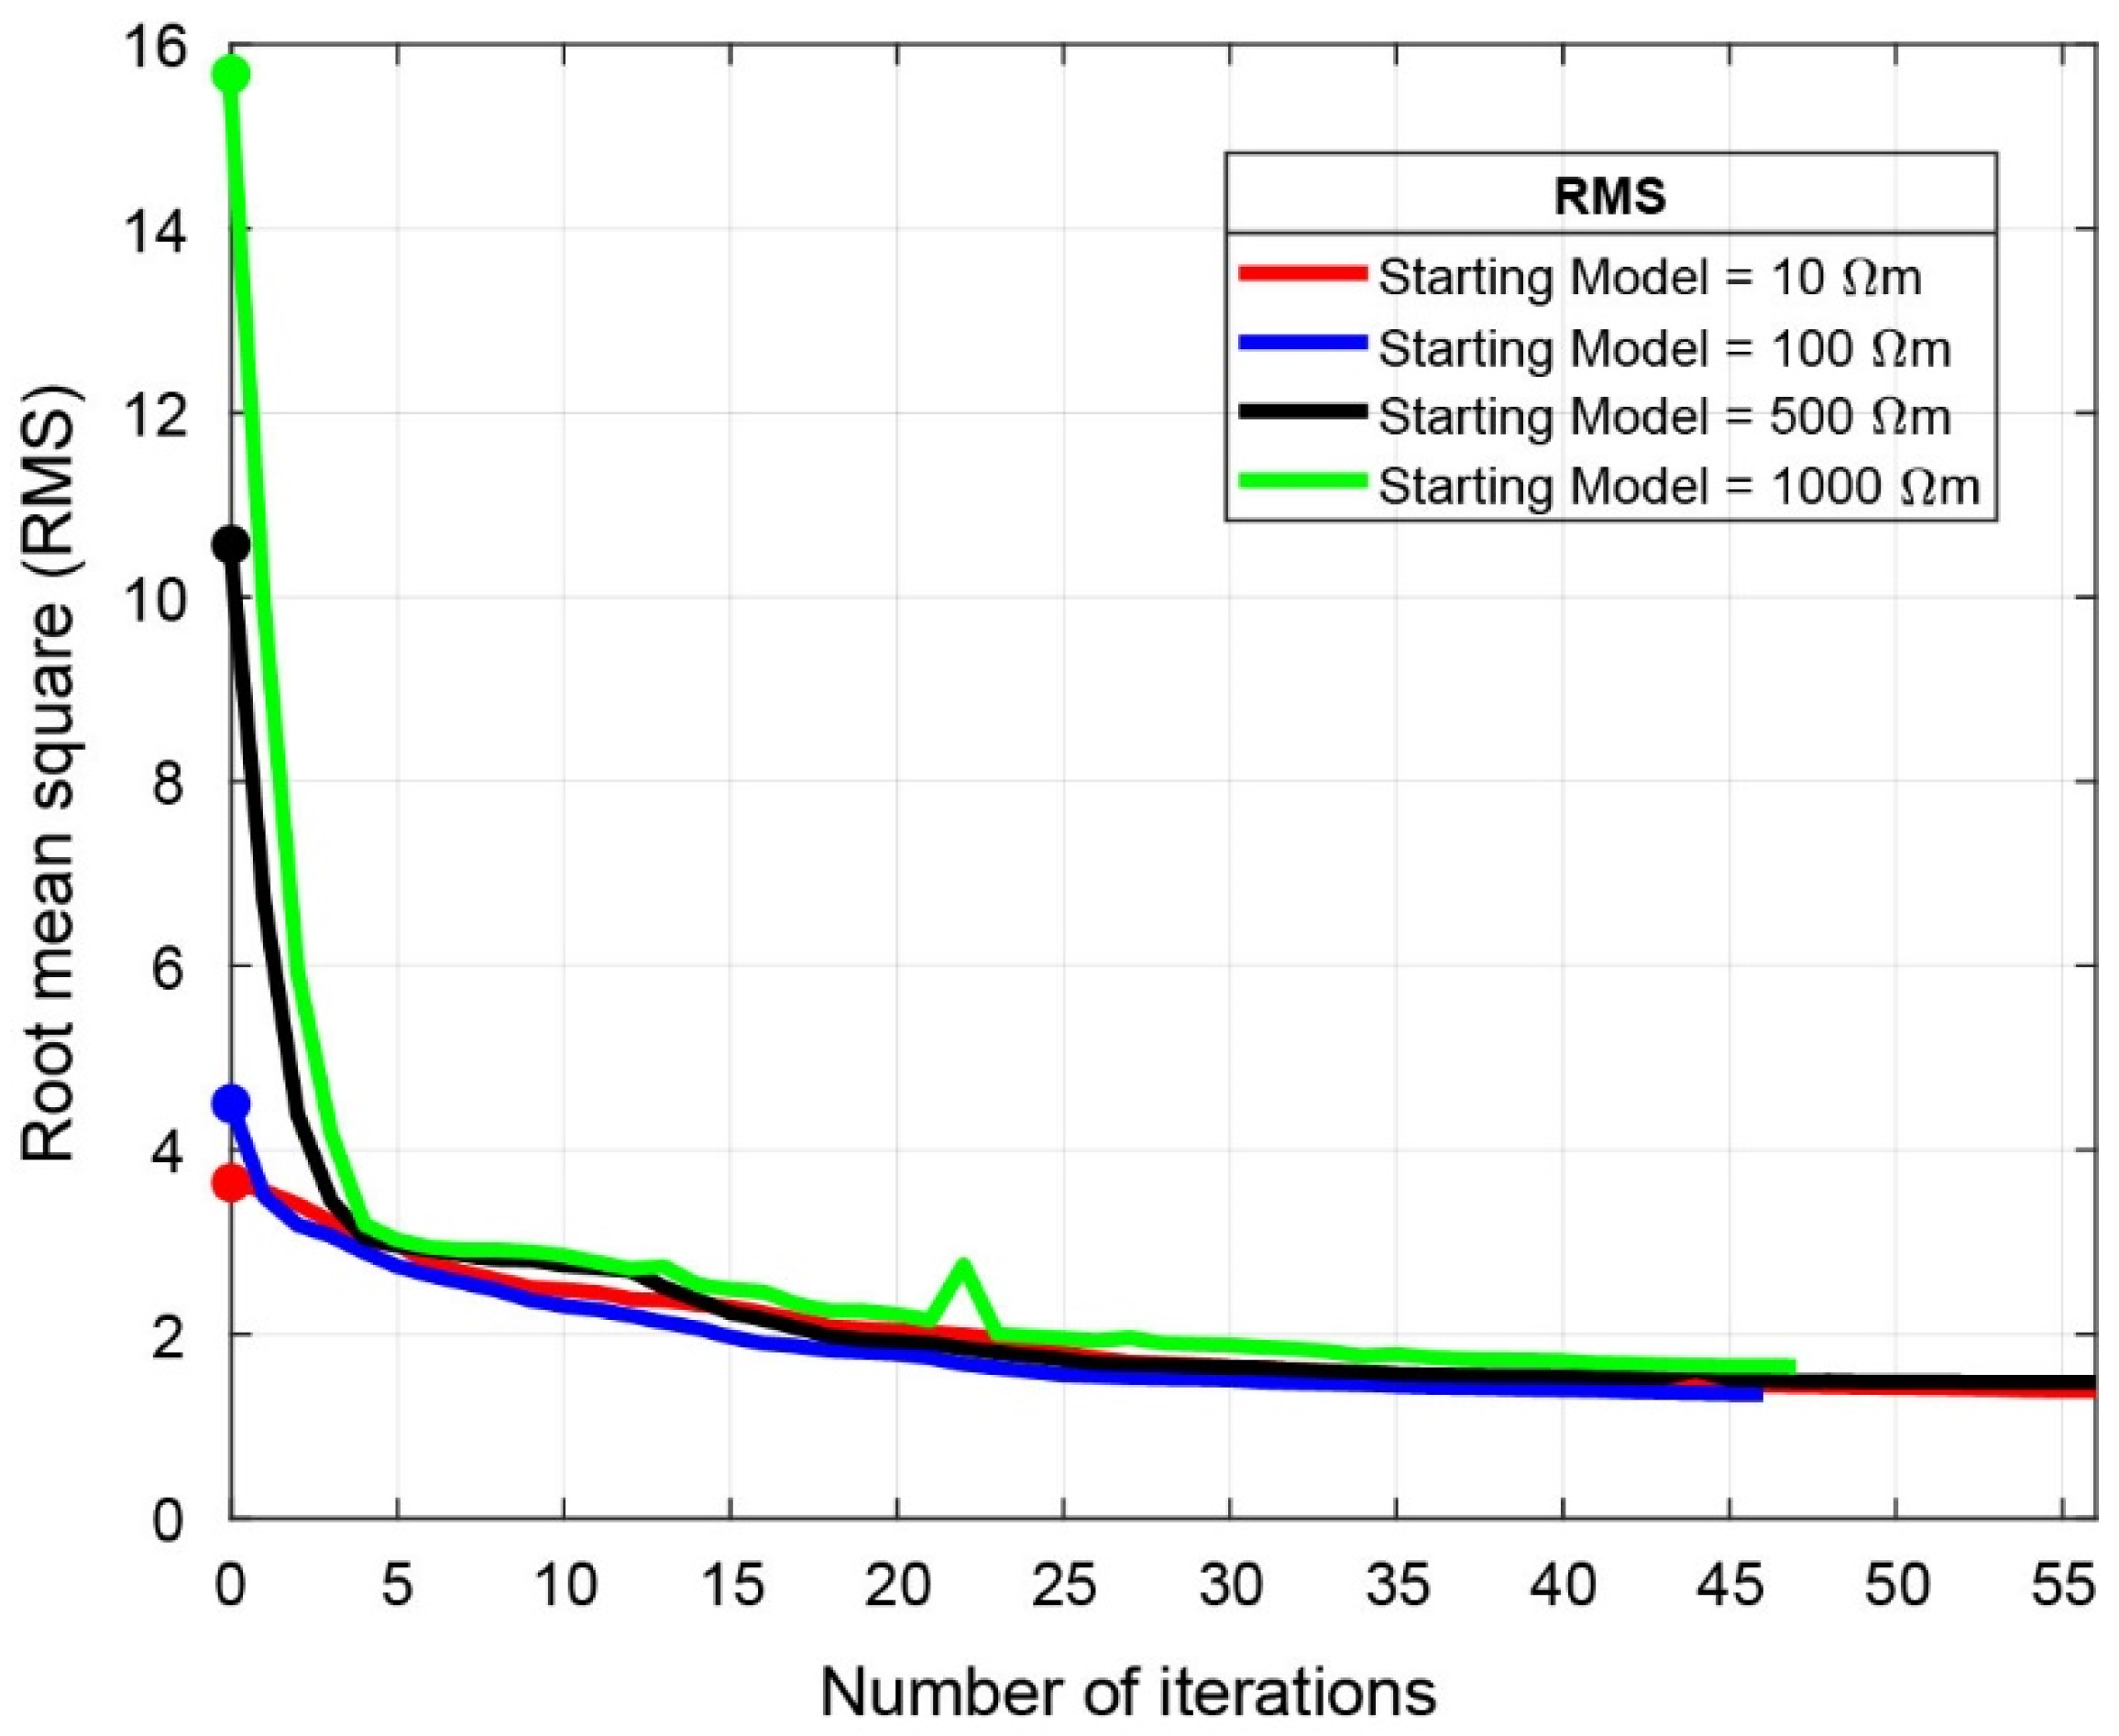
A set of different starting models were tested for the inversion. They all used a homogeneous half-space with varying initial resistivity values of 10, 100, 500, and 1000 Ωm. The tests were conducted to find the best fit to the data and the highest agreement of the MT models with the known information of the complex geology of the surrounding area of Tolhuaca volcano. We found that the shape and location of the anomalies obtained were independent of the initial resistivity values. Please refer to the Supplementary Material for a comprehensive explanation of the different inversion tests and their settings.
Figure 4 shows that the lowest Root Mean Square Error (RMS) of 1.35 was reached in the inversion test using an initial homogeneous half-space of 100 Ωm. However, the 500 Ωm resistivity value produced the second lowest RMS of 1.48 and since it was consistent with information from exploration wells it was chosen as the starting model. In general, the 500 Ωm initial model provides less extreme resistivity values that are more geologically realistic while the initial 100 Ωm starting model resulted in unrealistically large conductive anomalies with resistivity values below 1 Ωm. Therefore, all future models used the initial model with a 500 Ωm homogeneous half-space.
Inversion tests, including joint inversion of Z and T, and non-diagonal and diagonal components of Z were performed. Finally, in the inversion, we included all Z components, as well as the T components to improve sensitivity at depth and to investigate lateral constraints. After assessing the quality of our data for the inversion, we disposed a subset of data to be used efficiently in the 3D inversion program. Consequently, we selected 25 of 29 sites from 2019–2020, 21 of 74 sites from 2014, and 10 of 18 sites from 2007, at which transfer functions were calculated for 42 logarithmically distributed periods between 0.000146 s and 1000 s, with 6 periods per decade.
We set an error floor as a portion of the absolute value of the impedance components (|Zij|) instead of the mean of the non-diagonal components (|Zxy·Zxy|1/2), because the mean value might have underestimated one component of the impedance tensor relative to the others [58,59]. For the Zxx and Zyy components, the error limit was set to a minimum value of 15% and for the Zxy and Zyx components to 8% (error floor). However, if the data error of some data was higher tnah this error limit, the original data error was adopted for these data. Higher values for the components Zxx and Zyy weight the on-diagonal components lower, since the data quality is lower here. For the real and imaginary parts of geomagnetic transfer functions the error floor was set to 5%.

3.3. The Three-Dimensional Resistivity Model

The preferred 3D model provides high resolution of electrical structures up to 20 km depth. In the study area, there is a strong lateral change in electrical resistivity. On the western flank of Tolhuaca volcano, a resistive body (>1000 Ωm) with an extension of approximately 5 km in the WE direction extends towards 12 km depth.
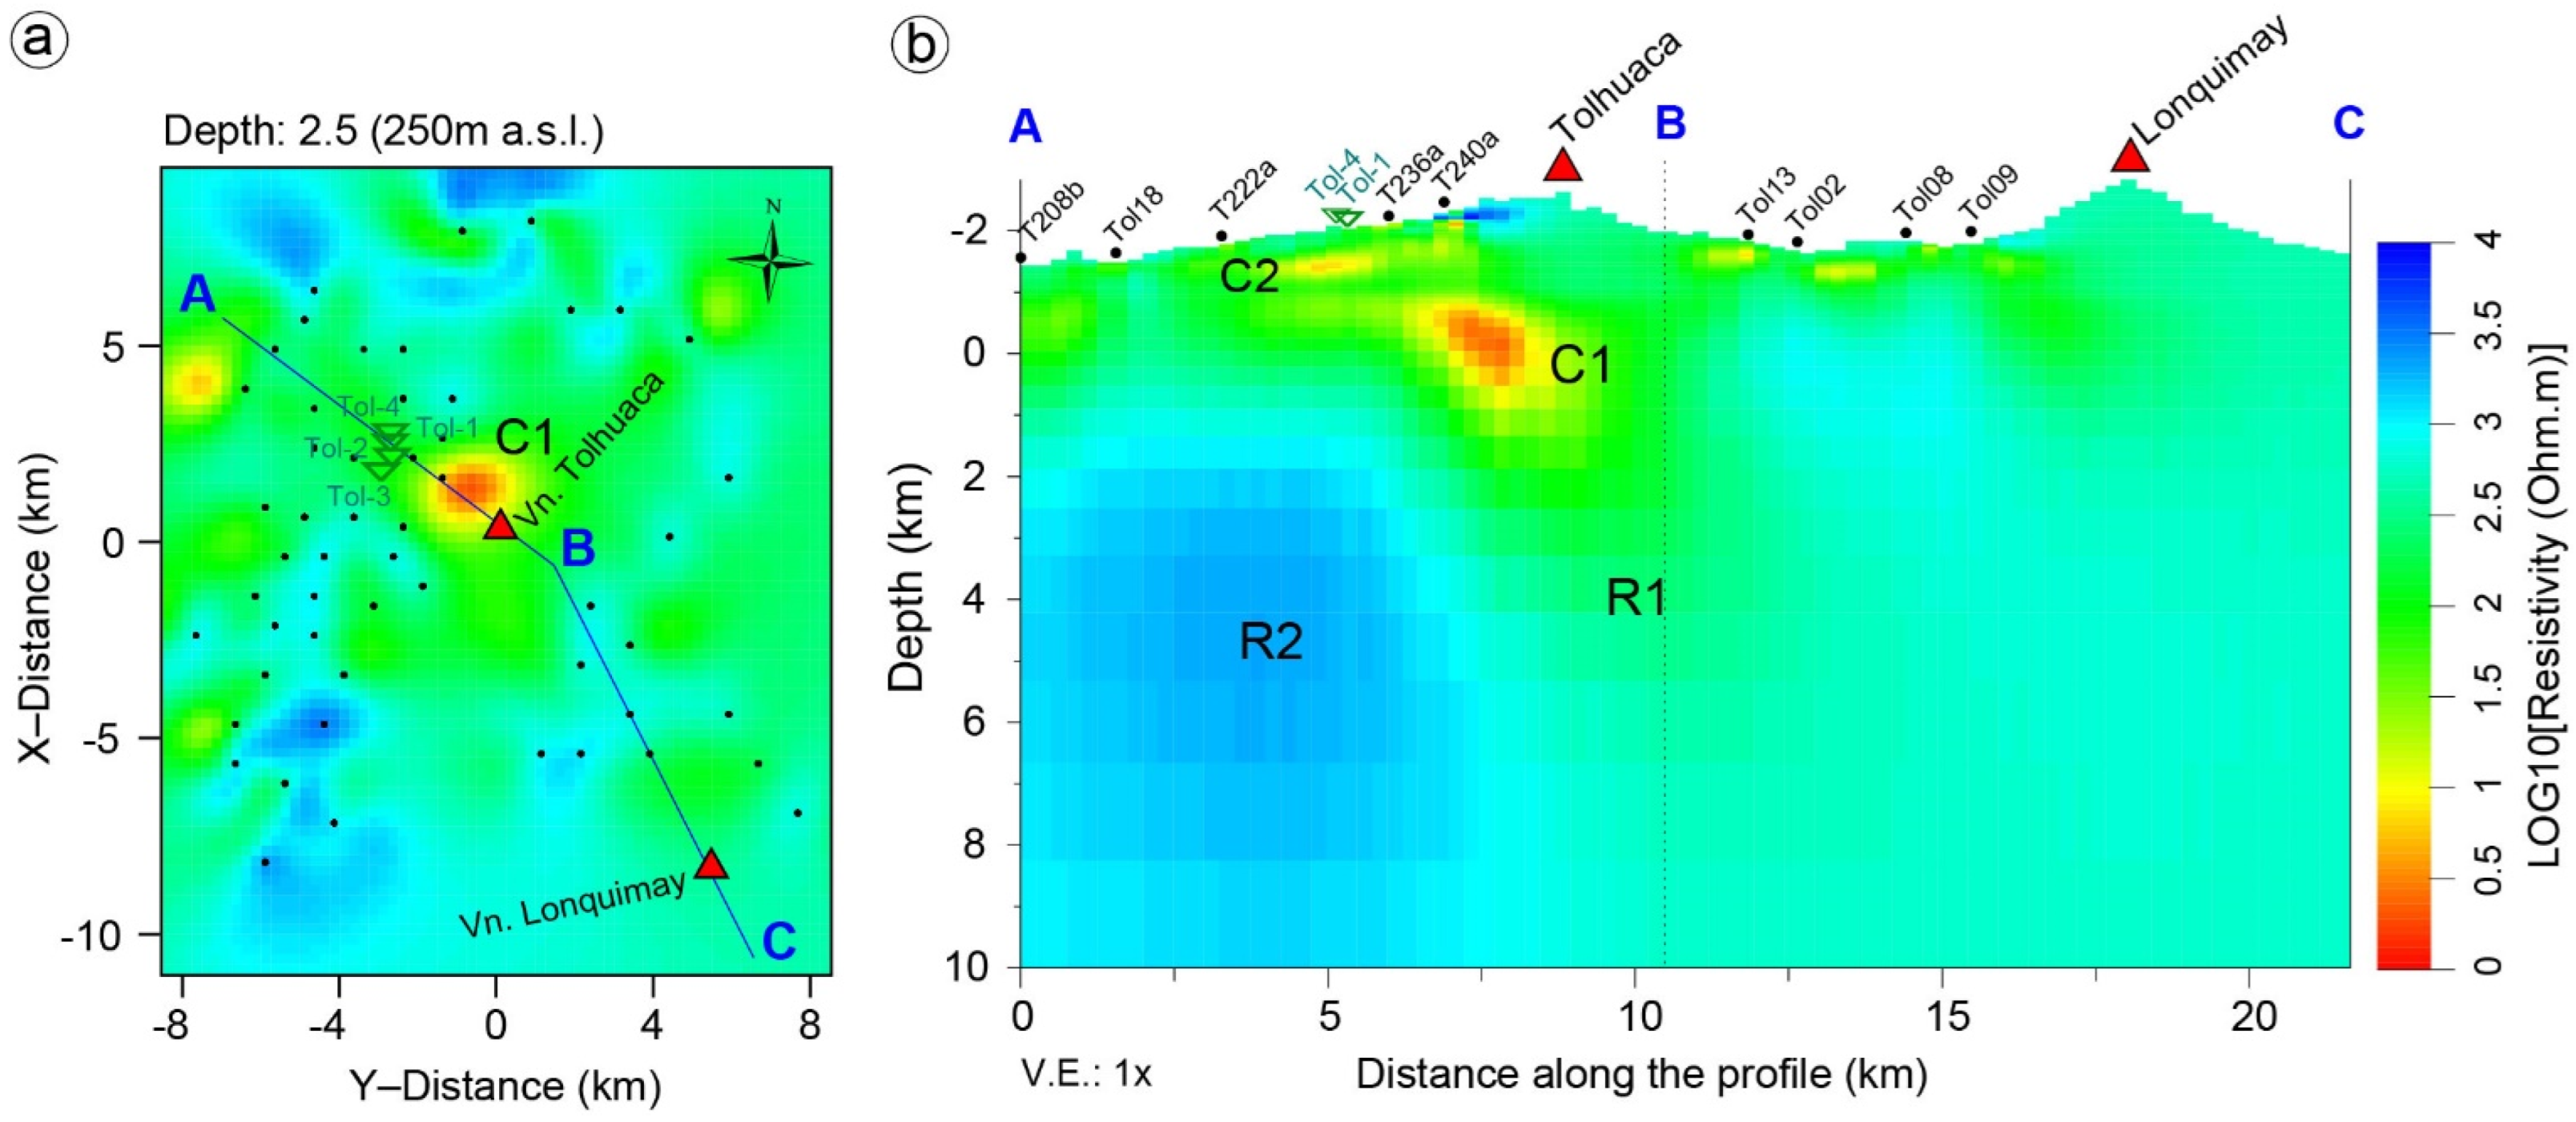
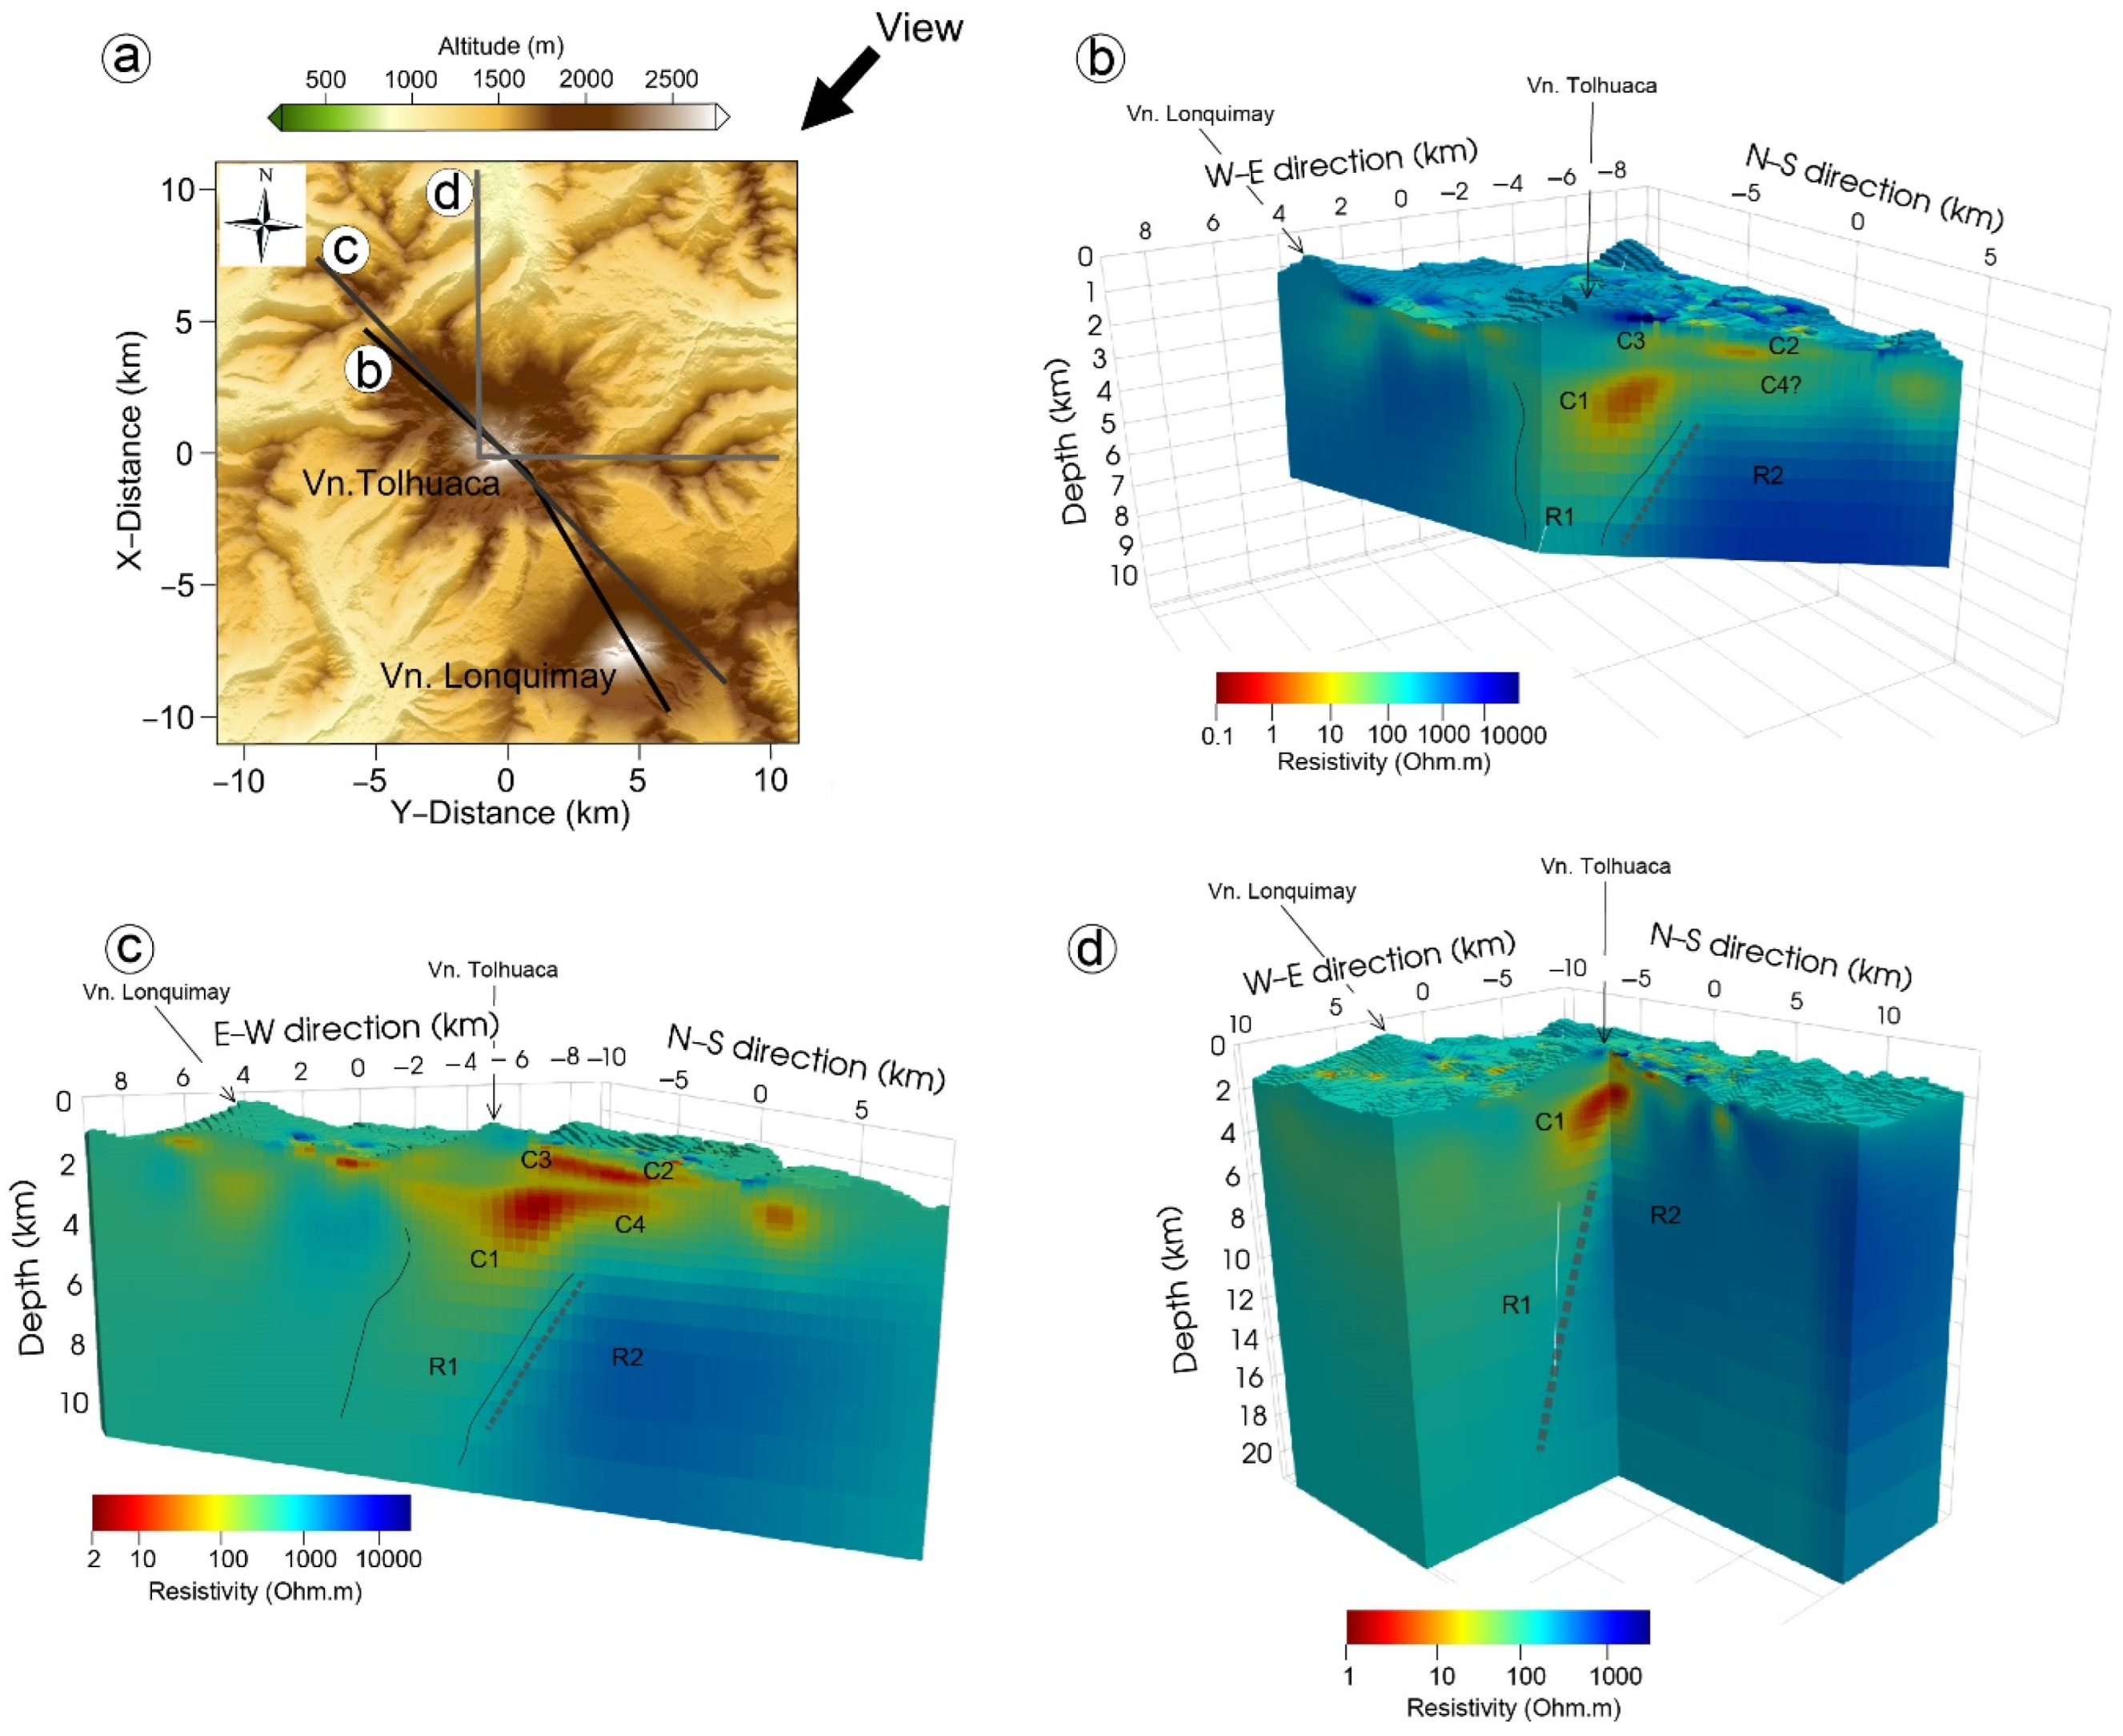
The model shows a prominent subvertical conductive structure C1 with a resistivity of 5–30 Ωm beneath the old crater of the Tolhuaca volcano at a depth of 2 km (Figure 5). C1 seems to be connected to a deeper zone, an elongated intermediate-resistive structure of 200–400 Ωm, labeled R1 in Figure 5, dipping southeast and extending to a depth of about 6 km.
Since the low resistivity anomaly, C1, is such a conspicuous feature in the 3D resistivity model, persisting in all models, several sensitivity tests were carried out to determine the feasibility of C1. For the sensitivity tests, the low resistivity structure was replaced with different resistivity values (see supplementary material) and the resulting data misfit was up to 35% larger when compared to the model including the low resistivity structure. This indicates the importance of a conductive anomaly to explain the measured MT data.
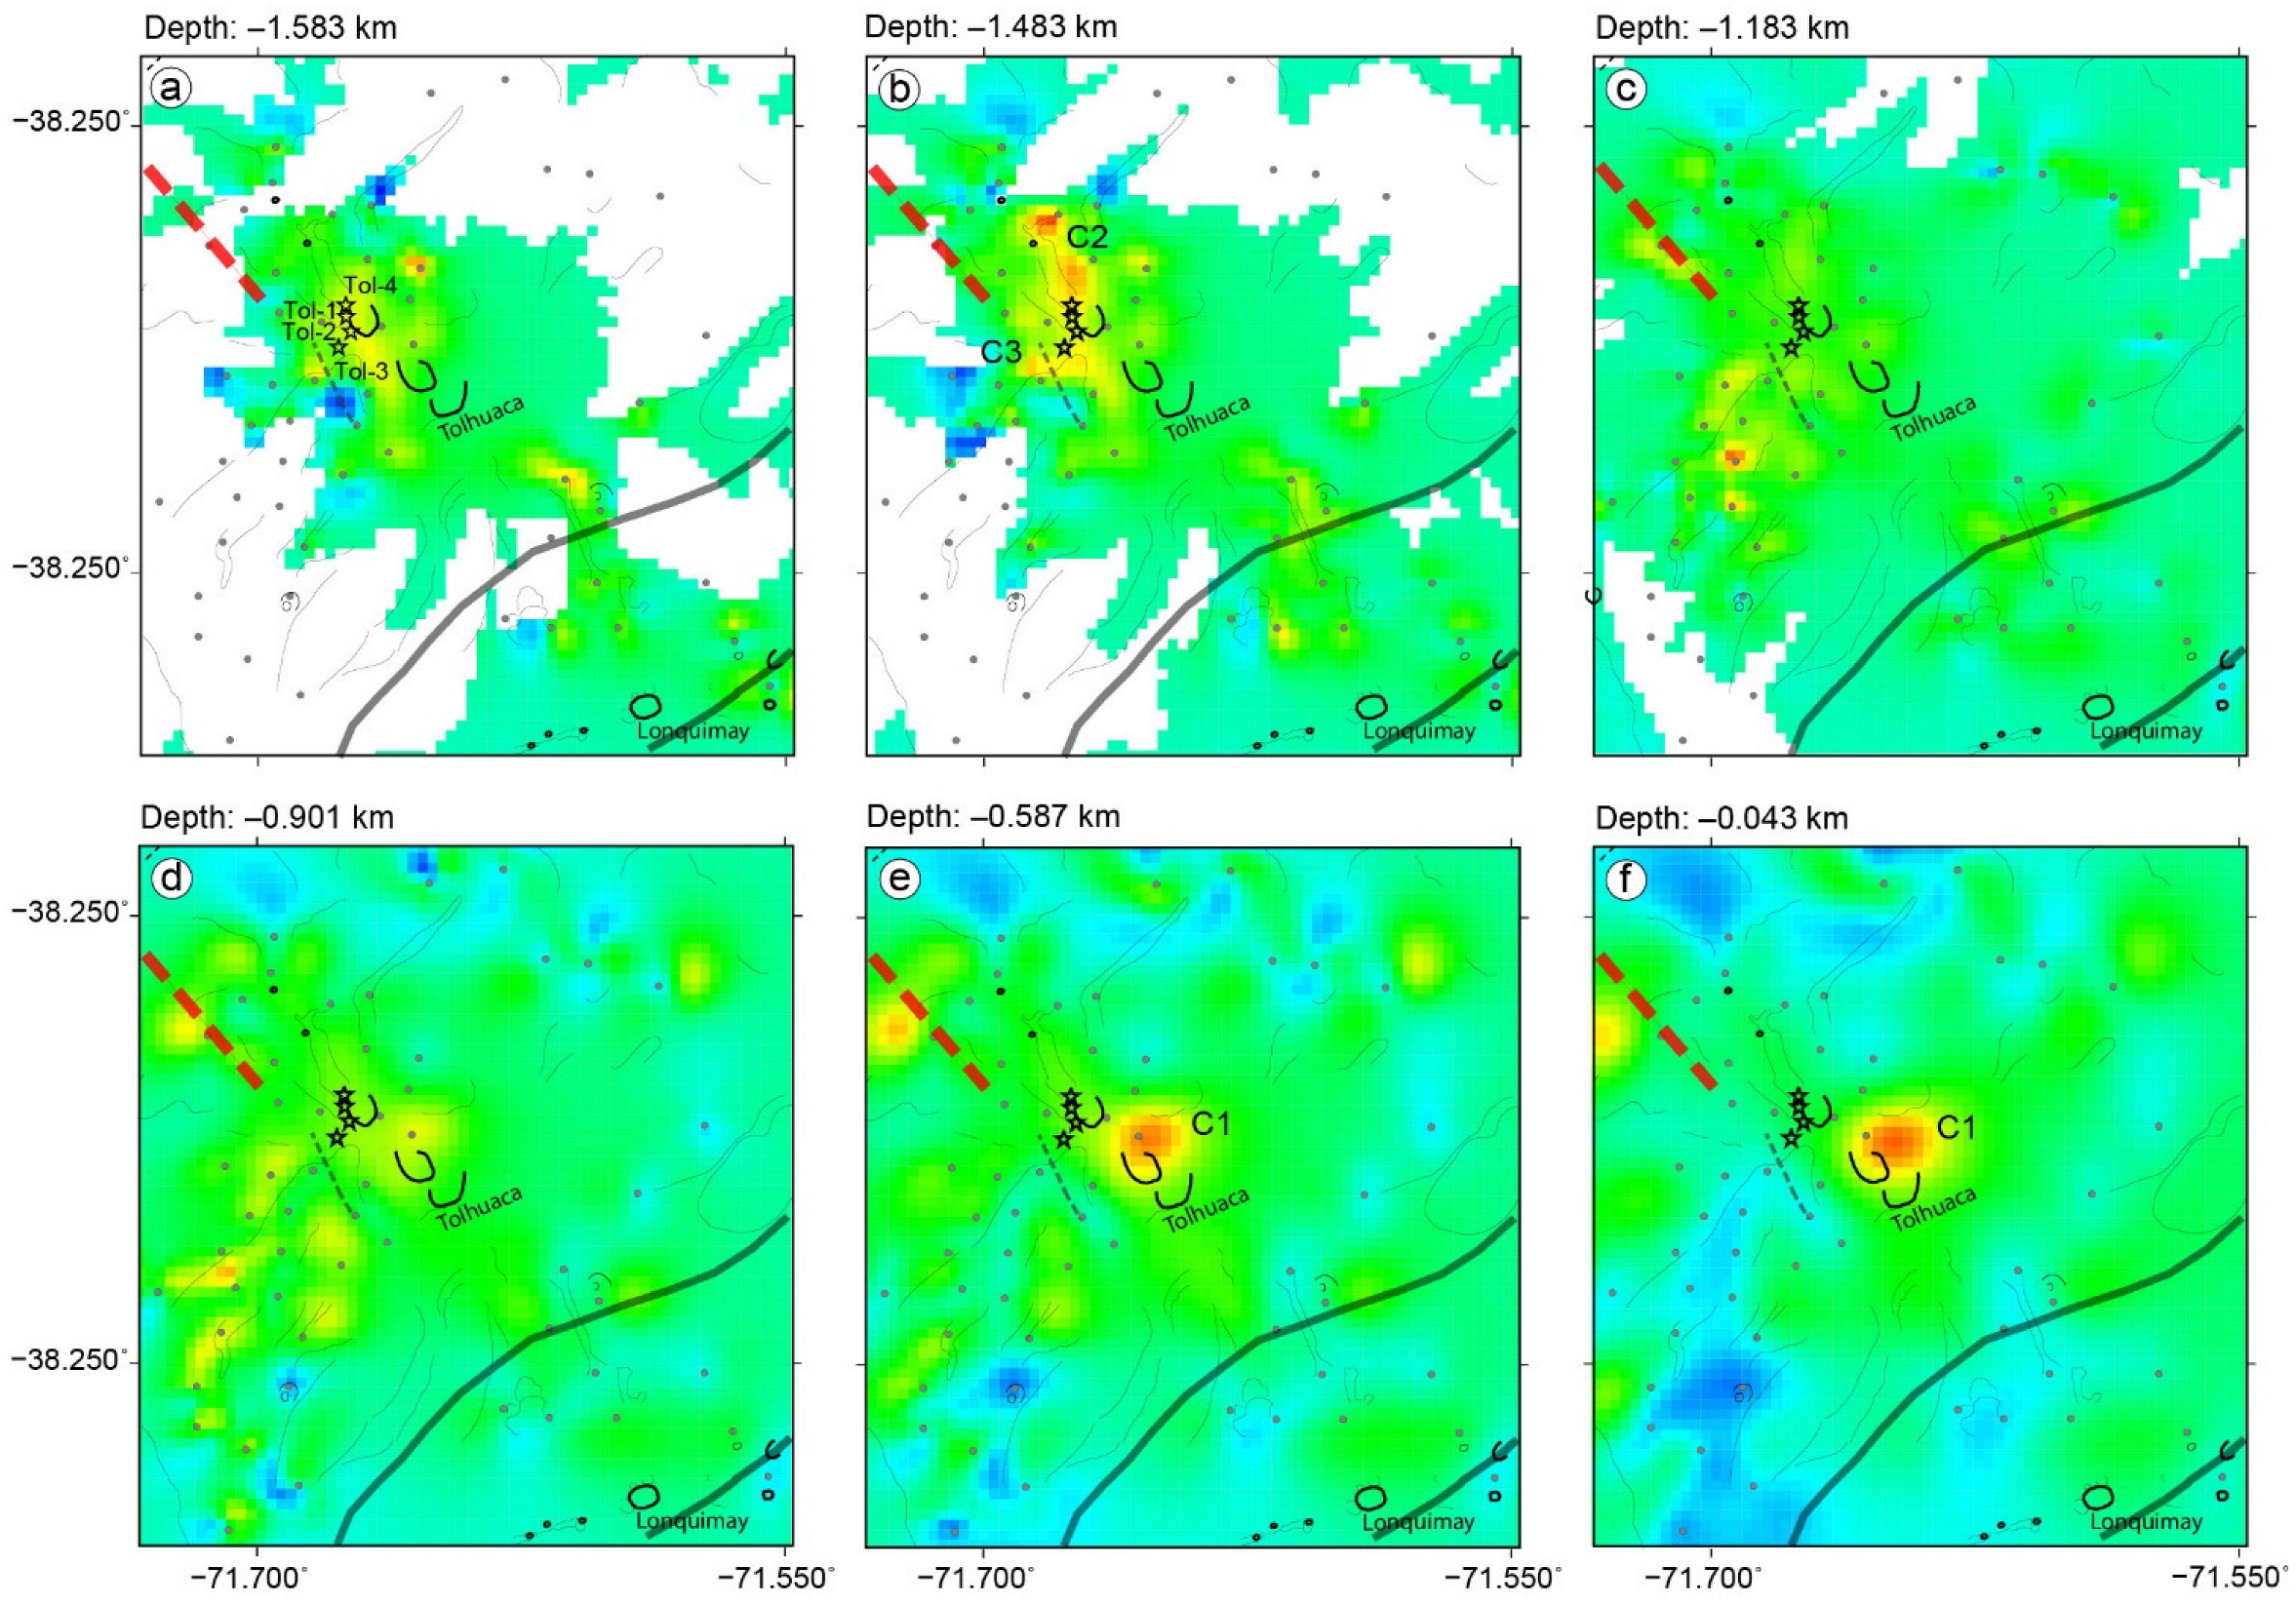
The model along the Tolhuaca volcanic edifice shows a layer composed of several conductive anomalies (<40 Ωm) spatially distributed near the surface (Figure 5 and Figure 6). Within this conductive layer, a rather highly conductive anomaly (~20 Ωm) is observed in the vicinity of the geothermal wells (star in Figure 6a,b). An extensive conductive anomaly, C2, below the exploration wells is imaged, extending approximately 2 km in N-S direction and 1.2 km in E-S direction, with a thickness of 200 m (Figure 6b). On the northwest flank of Tolhuaca volcano, a narrow conductive anomaly, C3, is visualized, extending approximately 0.5 km in N-S direction and 2 km in E-W direction, with a thickness of 200 m (Figure 6b). Southeast of Tolhuaca volcano, a conductive anomaly with similar characteristics to the one mentioned above is also revealed (Figure 6c,d).
In between Tolhuaca and Lonquimay volcanoes, specifically in the southeast flank of Tolhuaca, a conductive anomaly of ~20 Ωm with a thickness of 500 m was also identified (Figure 6a); however, the lateral extent is not well resolved due to limited coverage with MT stations.
In the eastern part of the study area, the subsurface is characterized by a homogeneous intermediate to low electrical resistivity (Figure 6). Note, however, that coverage with MT sites is low east of Tolhuaca and that the model is therefore poorly constraint in this area. The absence of low resistivity structures beneath active Lonquimay volcano in our model (structures, which could be associated with a possible shallow magmatic source) might therefore be due to an insufficient coverage with MT stations (Figure 6e,f).

4. Discussion

4.1. Shallow Crustal Melt Zone

The 3D inversion of MT data in Tolhuaca volcano shows a high conductivity anomaly, C1, at shallow crustal levels at 2 km below the surface. This well-defined anomaly underlies beneath the former eruptive crater on the NW flank of Tolhuaca volcano (Figure 5 and Figure 7). The elongated intermediate resistivity R1, below C1 (Figure 5), would probably represent a sub-vertically dipping basaltic-andesitic dike-like structure (roughly NW-SE oriented), which acted as a feeding zone for the magmatic system of Tolhuaca volcano and also serves as a path for high temperature geothermal fluids. The extent of this structure at depth and to the east cannot be delimited by this study. However, the geometry of R1 (Figure 7) would provide evidence for the existence of a fault dipping to the east that extends throughout the crust, forming weak zones that channel the ascent of fluids. Furthermore, the higher resistivity towards the western part, R2 (Figure 5), suggests that the eastern deep-reaching fault acts as a lateral barrier between the more heterogeneous crust, as has been observed in previous studies in the SVZ (e.g., [26,49,51]).
The enhanced conductive of C1 (between 5 and 25 Ωm) may be explained by high content of brines or a low melt fraction. Dacitic lava is dated to 50 ka [15], meanwhile the youngest basaltic lava flow/volcanic event is dated to be less than 6 ka [21]. Therefore, the presence of partially crystallized melt could be probable. From a magma residence and crystallization point of view, 50 ka is sufficient time to completely cool small and shallow magma chambers. However, in our case, we assessed a volume >35 km3 for C1, small-medium magma chamber size, and the occurrence of residual melt (mush) is a possibility.
We estimated the time scale of magmatic cooling using the model of [60,61]. In a 35 km3 magma chamber, basalt magmas (density of 2600 kg/m3, specific heat capacity of 1500 J/kg per K and the latent heat of crystallization of 4 × 10⁵ J/kg [62]), an initial temperature of about 1100 °C should reach 75% crystallization after ∼12,000 years. On the other hand, deep drilling revealed a fluid-dominated deposits at about 300 °C and to a minimum depth of 1100 m. Thus, a temperature of about 800 °C is possibly expected at 3 km of depth and this temperature is high enough to maintain a partial amount of melt.
Upper-crustal magma chambers spend the vast majority of their lifetimes at relatively cold (less than 750 °C) conditions, i.e., “cold storage” [63], or tens to hundreds of thousands of years of storage under dominantly hotter conditions, i.e., ‘warm storage’ [64]. If the “cold storage” model is applicable, detection of melt beneath volcanoes is likely a sign of imminent eruption [63]. However, some arc volcanic centers have been active for tens of thousands of years and show evidence for the continual presence of melt, which suggest that arc magmas are generally stored warm. Thus, the presence of intracrustal melt represents the normal state of magma storage underneath dormant volcanoes [64].
We estimated different melt portion values as a function of the different dominant lavas of Tolhuaca volcano (Figure 8). As a result of the limited geochemical and petrological data of lavas and eruptive products of Tolhuaca, the bulk resistivity for different melt fractions was computed assuming diverse basaltic-andesitic, andesitic and dacitic melt compositions, using the models of [65,66] at a depth of 3 km (Figure 8a). Figure 8a shows resistivity values for basaltic-andesitic, andesitic and dacitic lavas varying water content, as a weight percentage (H2O wt%). Pink bands represent values that are compatible with MT. The orange area represents electrical resistivity estimations for magmas of Tolhuaca.
The melt resistivity was estimated and combined with the matrix rock resistivity by the two-phase mixing model [67] for various degrees of melt interconnection (from interconnected melts, cementation factor m = 1.0 to isolated melts, m = 2.0), giving the fraction of melt needed to explain the observed resistivity of the melt and rock matrix.
Assuming a resistivity range of 5–25 Ωm in the anomalies, a minimum melt fraction of 5% (Figure 8b) is required in the case of a highly interconnected melt (m = 1.3) to account for the resistivity values (Figure 7). A maximum melting fraction of 30% is required if the melt is not well connected (m = 2.0) (Figure 8a). Depending on the temperature (900–1200 °C), a melt fraction range of 3% to 11% would also be possible. If higher values of pure melt resistivity are used, e.g., due to lower water content, a higher melting fraction is required. Therefore, basaltic-andesite residual melt (Figure 8) would explain the low resistivity value of the anomaly located just below the NW flank of the volcano.
The Tolhuaca magmatic system appears to be at a more mature and in a crystalline stage. Therefore, C1 would correspond to the long-term residence of a subsurface magmatic intrusion associated with ATF structural control [4,17,29,68], which would serve as a heat source for the Tolhuaca geothermal system. Numerical simulations of heat and fluid flow [17] would suggest the existence of a heat source of the Tolhuaca geothermal system associated with a magma body intruding at a depth of ~3 km below the summit of Tolhuaca volcano [17]. If this were the case, anomaly C1 would correspond a shallow magmatic body triggering an increase in fluid enthalpy and a decrease in fluid pressures as a result of a transition of the hydrostatic pressure gradient to a fluid-saturated (boiling) environment at a shallow reservoir [17].
There is evidence that there are transient shallow reservoirs with partial melts beneath active volcanoes in the upper crustal layers of the SVZ, or there are also temporal interruptions in magma rise [69,70]. Magmatic compartments controlled by major fault systems appear as medium-low resistivity anomalies [48,49]. Therefore, the prevailing tectonic configuration in the area, the interaction between LOFS and ATF, would promote the development of a long-lived shallow reservoir [17,29].
In the case of the active Lonquimay volcano, our model does not show a strongly conductive anomaly in the crust that can be associated with a melt zone and a near-surface magmatic reservoir. The explanation for this may lie in that the expected subsurface magmatic reservoir is displaced towards to the southeast of the main volcanic edifice as have been described in other volcanoes of SVZ [26,32,71]. Therefore, the shallow reservoir fails to be revealed by our model.
Additionally, in our model there would be no evidence of a link between shallow magmatic system of the Lonquimay volcano with the conductive feature, C1 (Figure 6 and Figure 7). The local stress regime of the upper crust seems to play a direct role in the spatial distribution of the volcanic centers. Thus, the eastward flexure of the LOFS appears to play an important role as a barrier. As a result, Lonquimay and Tolhuaca volcanoes having apparently independent systems [71].

4.2. Near Surface Conductive Anomalies

In this study, we also provide a more detailed electrical resistivity model that images the hydrothermal alteration units in the Tolhuaca geothermal system. The 3D model shows a zone of conductive anomalies (<40 Ωm), spatially distributed near the surface (Figure 5a,c). Within this zone, two conductive layers, C2 and C3, of high conductive anomalies <20 Ωm are identified at different depths, on the northwest flank of Tolhuaca volcano.
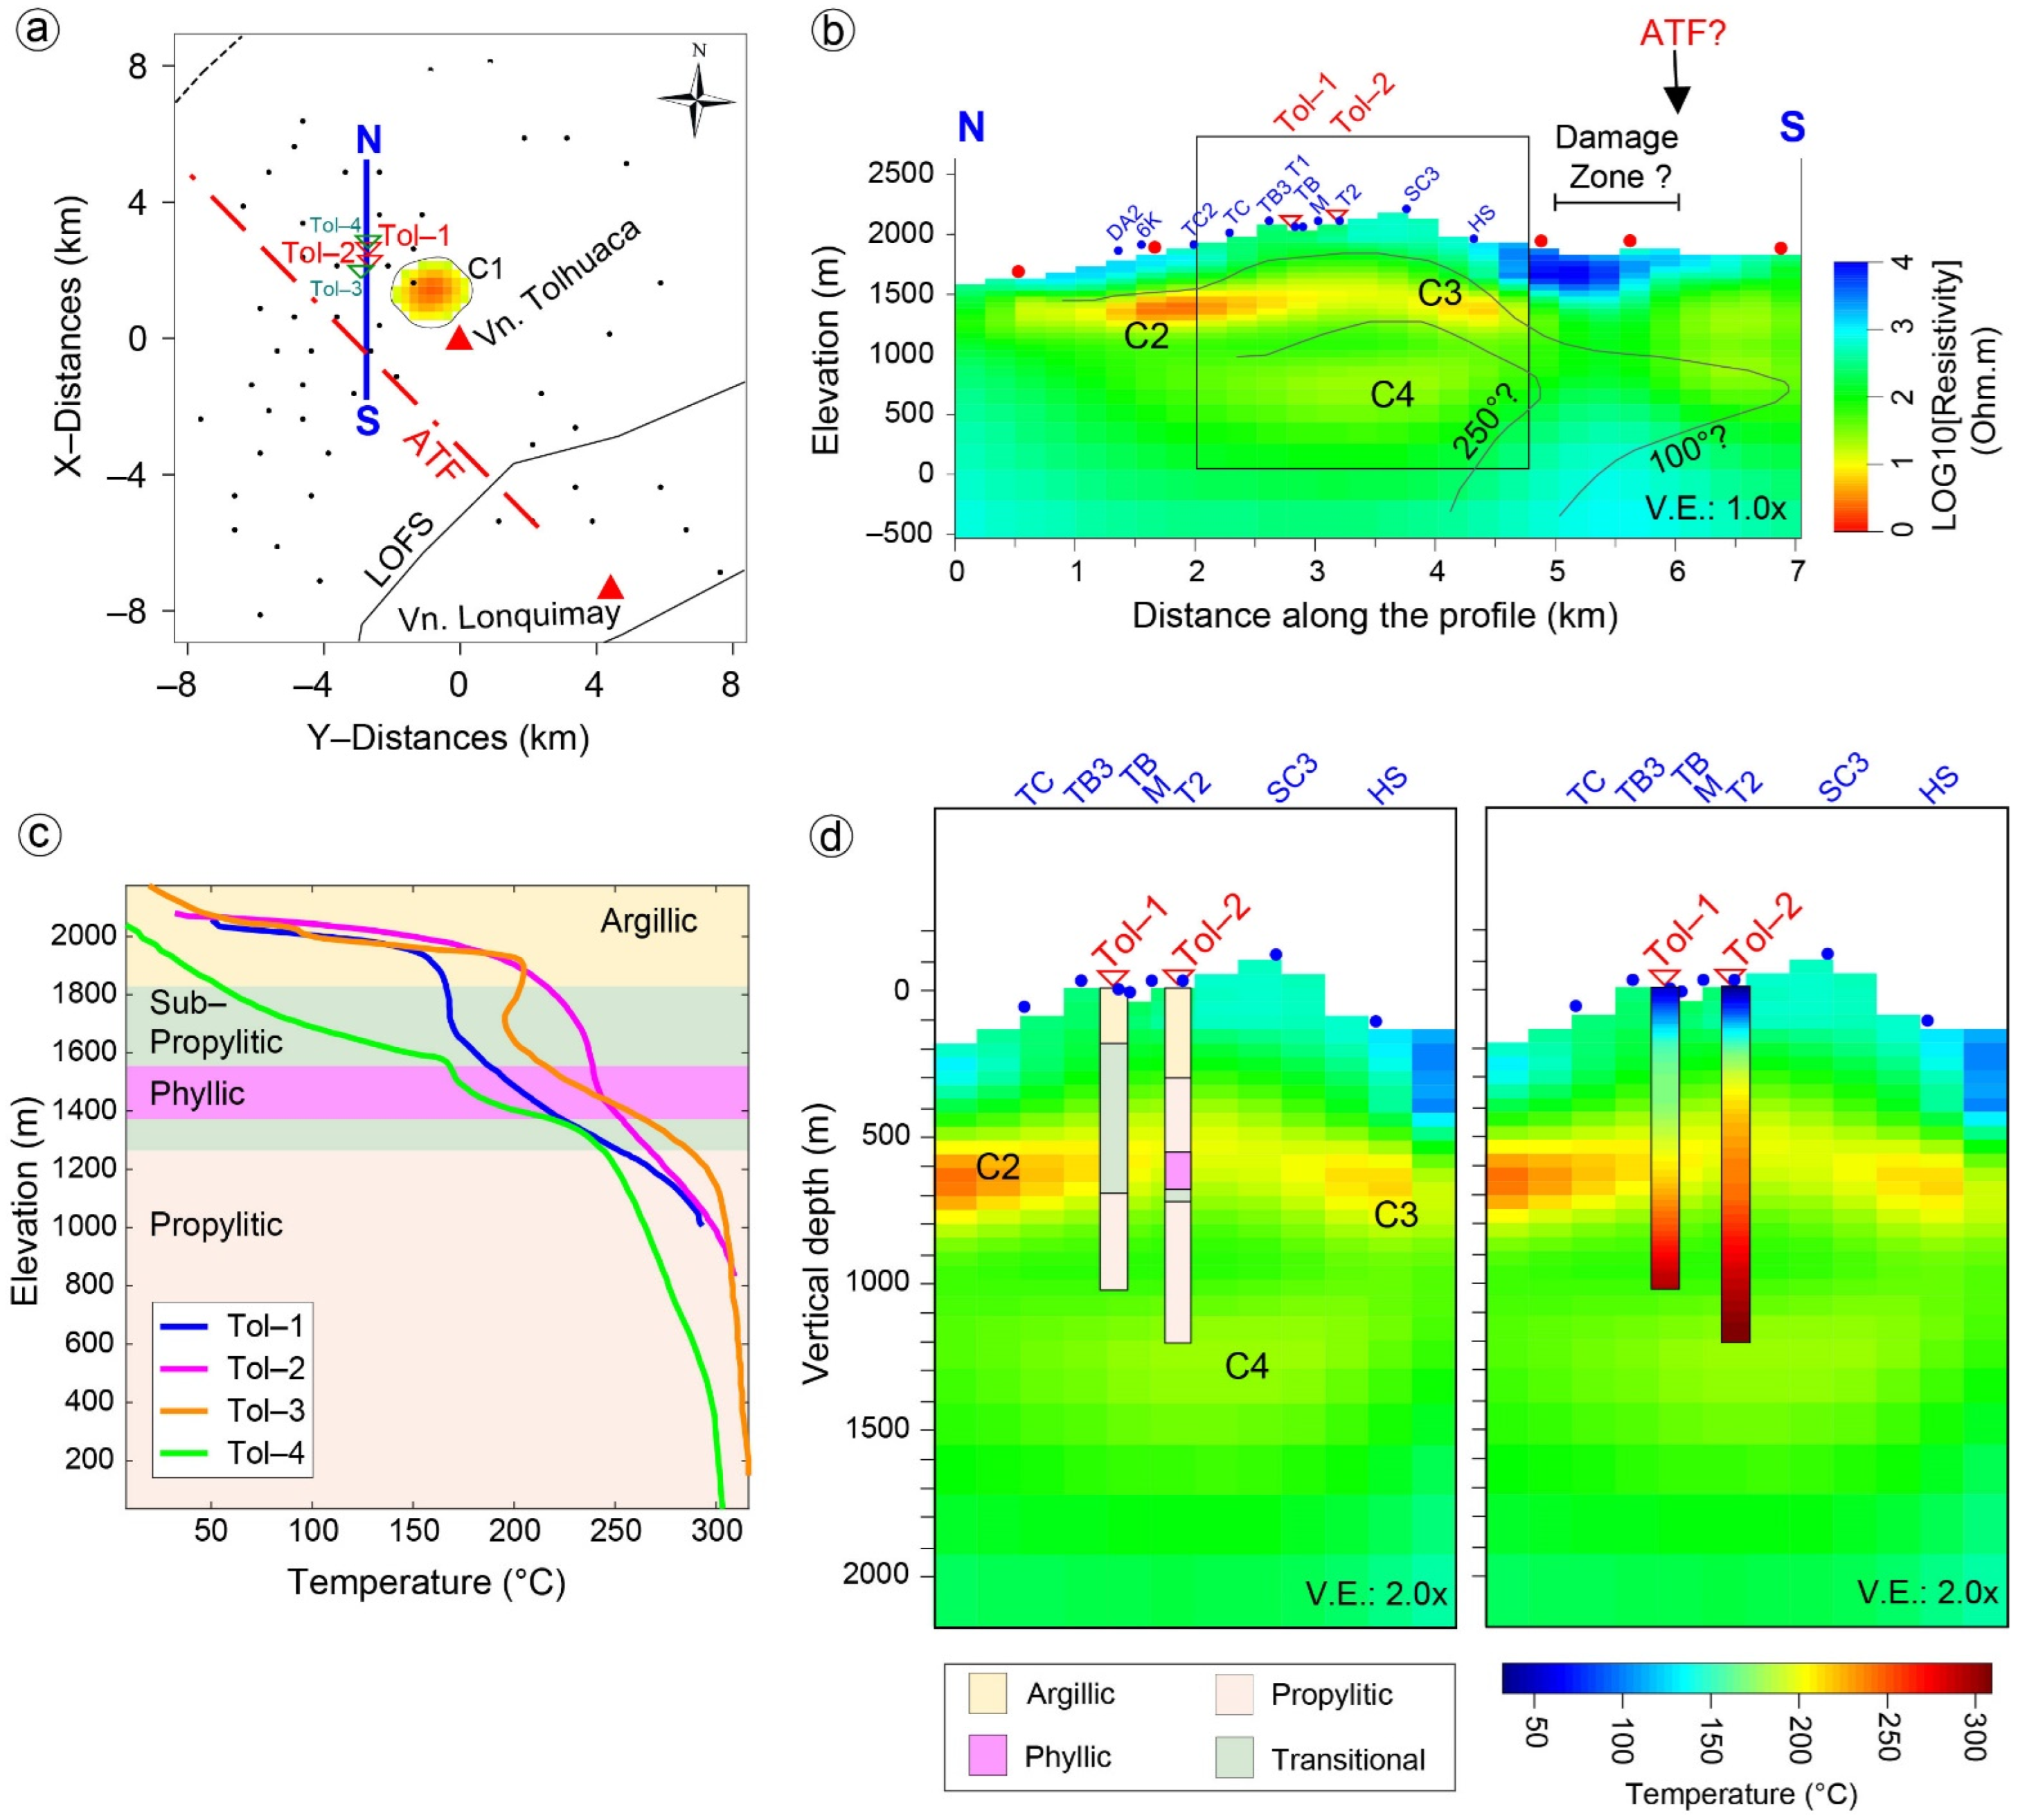
At a depth of 1500 m about sea level (a.s.l.) is the uppermost layer, C2, with a thickness of ~300 m (Figure 9b,d). It extends approximately 3 km in the NW direction, following the trend of hot springs and the lineaments of the ancient eruptive centers of Tolhuaca volcano (Figure 2). Two maximum conductive anomalies (<10 Ωm) are distinguished in north and south ends (Figure 9b). This layer leads to an impermeable clay-cap of the Tolhuaca geothermal system [21]. Argillic material mapped at the surface and in the wells [14,17] confirms that argillic alteration would be the primary cause of the high conductive layer [20,21]. However, correlating our MT resistivity model with alteration mapped in the wells (Figure 9), we observed a vertical offset of ~300 m between the high conductive layer and the argillic alteration, which could be related to the discretization of the mesh design in the model. Refining the cell size in the model, e.g., using a cell thickness of 25 m from the surface to the base of the clay cap could be a solution to the offset.
A new feature that has not yet been imaged in previous MT studies is the electrical conductor C4, which is located approximately between 750 and 350 m a.s.l (Figure 9b). C4 is a lower layer of ~400 m thick and extending 1500 m in the N-S direction (Figure 9b,d), centered under a C1. This layer is slightly more resistive than the upper layer (C2 and C3) and appears to be linked to the high conductive anomaly (C1) located to the east beneath Tolhuaca volcano (Figure 7c). In addition, this layer lies between two horizontal zones, R3 and R4 (Figure 10), of intermediate low resistivity (~200 Ωm) (Figure 9d), that might correspond to the reservoir zones. Therefore, it appears to be driving the development of two different reservoirs (shallow (R3) and deep reservoir (R4) (Figure 10)), which could differ in temperature, geochemistry of the fluid, and residence time.

4.3. Implications from Hydrothermal Alteration

According to the theoretical conceptual model used to explain electrical resistivity patterns observed at most high-temperature geothermal reservoirs [20,72,73], our MT resistivity model is correlated with mineral alteration zoning (Figure 9c). Likewise, temperature logs from Tol-1, Tol-2, Tol-3, and Tol-4 (Figure 9c) were used to assess the performance of the MT resistivity imaging. Thus, Figure 9 shows a detailed NS slice of the upper 3 km transecting the Tolhuaca geothermal system at the location of the slim hole wells Tol-1 and Tol-2.
Smectite, illite, and chlorite are especially known for being the main mineral phase of clay-caps in volcanic geothermal systems. Smectite and chlorite are observed at all wells from shallow depths and up to the surface [14,17]. For detailed alteration data of wells, please refer to [14,21]. In the wells Tol-1 and Tol-2, smectite was found from the surface up to 160 m depth before an absence of alterations is observed (Figure 9c). In Tol-1 and Tol-2 the presence of the alteration minerals Illite, chlorite, and smectite was observed between 300 and 400 m depth [14,17]. A minor presence of alteration minerals was found at Tol-1 until a depth of 600 m. In the depth ranges of 500–600 m and up to 1000 m a strong presence of alteration minerals of varying thickness was observed in all wells. Underneath this alteration zone, the mineral profiles are not as strong and clear as before. Starting at 800–900 m in Tol-1 and Tol-2 and 1100–1300 m in Tol-3 and Tol-4 first occurrence of epidote is documented, representing a high temperature (170 °C) hydrothermal alteration mineral. Indication of smectite, illite, chlorite, and epidote mineralization at depths from 1600 m to 2300 m suggest another alteration zone.
The uppermost high-conductivity anomalies C2 and C3 correlate with argillic hydrothermal alteration zone, smectite, and mixed smectite-illite zones [17] (Figure 10), and with the geometry of the associated temperature isotherm (Figure 9b). In Figure 5, C2 and C3 are separated by a less conductive zone that we interpret as an upflow zone. This is clearly visible in Figure 10. Therefore, anomalies C2 and C3 would form the clay-cap of the geothermal system associated with Tolhuaca volcano (Figure 5c). It could also be related to the relatively high-temperature mineralization, which would explain the argillic alteration of the Tol-1 and Tol-2 wells close to the surface. Nearby well temperatures suggest that the upflow is currently steam-dominated down to 600 m depth. The reservoir zones are covered by steam-heated water, which may explain why our model detects the upflow zone as a more resistive anomaly compared to the argillic alteration zone.
Above C2, the 3D inversion model shows a zone of high resistivity, which would correspond to unaltered rocks (Figure 10), while below and adjacent to the argillic zone (Figure 10), the high resistivity zone is correlated with illite to chlorite/smectite clays that could have formed from sub-propylitic alteration [17] or denominated as transitional alteration zone [14]. This zone could correspond to the shallower reservoir of the geothermal system (Figure 10).
At a deeper level below the sub-propylitic zone, an increase in conductivity (~30 Ωm) is observed, C4, which is correlated to the phyllic alteration zone described in well Tol-2. Our inversion model indicates that this anomaly could be connected to the east with the highly conductive anomaly below Tolhuaca volcano (C1). This zone could have been generated through circulation of high-temperature volcanic fluids within a permeable rock which could have developed the deep reservoir below the phyllic zone. Higher altered andesite rocks may contain necessary permeability for fluid flow along faults and would also provide sufficient fluid storage to constitute a depth not previously documented in a geothermal reservoir [74].

5. Conclusions

We used broadband MT data from sites deployed in the surrounding area of Tolhuaca volcano to reveal a detailed 3D inversion model of electrical resistivity and additional evidence for the geothermal system.
To establish the best fit to the data, we used a 500 Ωm homogeneous starting model, which provides a model with electrical resistivity values in agreement with the geology and consistent with well data and geochemistry. Thus, we provided a comprehensive 3D inversion model of electrical resistivity compared to previous work.
The electrical resistivity model shows a shallow conductive anomaly (<20 Ωm resistivity), ~2 km below the NW flank of Tolhuaca volcano, connected with a sub-vertical anomaly of intermediate resistivity (~500 Ωm). We interpreted the shallow conductor as a magmatic storage compartment, which would be in a mature and partly crystalline phase. This magmatic compartment would have been fed from deep crustal zones by a sub-vertical dipping basaltic-andesitic dike-like structure, which would act as a preferential pathway for the ascent of hydrothermal fluids.
The high-resolution resistivity images contribute to the understanding of the geothermal system associated with Tolhuaca volcano. We distinguished a ~300 m thick layer of high conductivity (<10 Ωm) corresponding to argillic hydrothermal alteration. The MT model includes two resistive bodies (~200 Ωm) in the upper crust below the argillic alteration layer laterally offset to the west beneath the extinct Tolhuaca caldera, which would correspond to a shallow reservoir R3 (~1000 m from the surface) and a deep reservoir R4 (>1800 m from the surface) that had so far not been identified by resistivity models.
Evidence for rapid heating events is provided by [21], who found borehole temperatures at Tol-4 and Tol-3 to be nearly 100 °C higher than those inferred from fluid inclusions trapped in hydrothermally altered rocks in the same wells. These results would confirm that the Tolhuaca magmatic and hydrothermal systems are connected and that magmatic volatiles are transported to the surface through faults and fracture pathways.
Consequently, our resistivity model provides evidence of structural control of the ATF faults, as a promoter of the long residence of magma reservoirs in the crust, which would serve as hosts for the development of heat sources for geothermal systems. Since we found no indications of a deep conductor in the study area, such as those observed in other high enthalpy geothermal systems, we conclude that the shallow magmatic deposit, which is cooling but still hot, is the heat source of the geothermal system. It is not located below the geothermal field but laterally offset.
On the other hand, we provide the first electrical resistivity image that may constitute a test of the hypothesis of the existence of independent magmatic systems between the major volcanic edifices Tolhuaca and Lonquimay. The magmatic systems are possibly separated by the tectonic activity associated with the bending of the branches of the Liquiñe-Ofqui Fault System.
Future work should expand the investigated area, ideally with MT station coverage east of Tolhuaca volcano and south-southeast of Lonquimay volcano, which may significantly improve the 3D inversion result, and image a likely shallow magma reservoir beneath Lonquimay. In addition, joint inversion or integration of multiple geophysical datasets (e.g., gravity, seismicity) would also be beneficial for a further study of the volcanic chain.

Supplementary Materials

The following supporting information can be downloaded at: https://www.mdpi.com/article/10.3390/rs14236144/s1, Table S1: The inversion test settings performed on the MT data set of Tolhuaca. Inversions A, B, C, D, and E inverted, respectively, full Z and T and same error settings for different initial resistivity (half-space). Inversions A, E, and F inverted different impedance and error settings for 500 Ωm half-space; Table S2: Sensitivity test performed on the MT data set of Tolhuaca; Figure S1: Sensitivity test of conductor C1. (a) Resistivity block (100 Ωm; resistivity of surrounding cells) is inserted instead of C1 anomaly. (b,c) Two examples of apparent resistivity and phase curves of the non-diagonal components of the MT inversion model. Red represents the Zxy component, and blue the Zyx component. The thin line represents the predicted data for the preferred model shown in Figure 5. The thick dash line represents the sensitivity test.

Author Contributions

Conceptualization, M.P.; methodology, M.P.; software, M.P. and D.D.; validation, M.P. and D.D.; formal analysis, M.P., D.D., H.B., G.K. and I.B.; investigation, M.P. and D.D.; data curation, M.P. and D.D.; writing—original draft, M.P.; writing—review and editing, D.D., H.B., G.K., I.B., V.G. and D.M.; visualization, M.P.; supervision, E.S.; funding acquisition, V.G. All authors have read and agreed to the published version of the manuscript.

Funding

This research was funded by BMBF Client II (Federal Ministry of Education and Research, FKZ: 033R190B). The magnetotelluric data were acquired in the frame of the BrineMine project. We acknowledge support by the KIT-Publication Fund of the Karlsruhe Institute of Technology.

Data Availability Statement

Not applicable.

Acknowledgments

The study is part of a collaborative research project between Karlsruhe Institute of Technology (KIT) and the Andean Geothermal Center of Excellence (CEGA), ANID-Fondap projects 15200001 and ACE210005. The authors acknowledge support by the state of Baden-Württemberg through bwHPC. This research was partially supported by the supercomputing infrastructure of the NLHPC (ECM-02). We acknowledge Transmark Chile SpA for sharing the data used in the 3D inversion. The authors thank Jaime Muro for authorizing access to Tolhuaca Volcano and CONAF for authorizing access to Tolhuaca National Park and Nalcas National Reserve. Two anonymous reviewers provided very helpful comments that improved the manuscript. Maximiliano Pavez was funded by the National Agency for Research and Development (ANID)/Scholarship Program/Doctorado Becas Chile-DAAD/2015-62150016.

Conflicts of Interest

The authors declare no conflict of interest.

References

  1. Stern, C.R. Active Andean Volcanism: Its Geologic and Tectonic Setting. Rev. Geológica Chile 2004, 31, 161–206. [Google Scholar] [CrossRef]
  2. Muñoz, J.; Stern, C.R. The Quaternary Volcanic Belt of the Southern Continental Margin of South America: Transverse Structural and Petrochemical Variations across the Segment between 38°S and 39°S. J. S. Am. Earth Sci. 1988, 1, 147–161. [Google Scholar] [CrossRef]
  3. Cembrano, J.; Lavenu, A.; Yañez, G.; Riquelme, R.; García, M.; González, G.; Hérail, G. Neotectonics. Geol. Chile 2007, 9, 231–261. [Google Scholar]
  4. Cembrano, J.; Lara, L. The Link between Volcanism and Tectonics in the Southern Volcanic Zone of the Chilean Andes: A Review. Tectonophysics 2009, 471, 96–113. [Google Scholar] [CrossRef]
  5. Folguera, A.; Rojas Vera, E.; Vélez, L.; Tobal, J.; Orts, D.; Agusto, M.; Caselli, A.; Ramos, V.A. A Review of the Geology, Structural Controls, and Tectonic Setting of Copahue Volcano, Southern Volcanic Zone, Andes, Argentina. In Copahue Volcano; Springer: Berlin/Heidelberg, Germany, 2016; pp. 3–22. [Google Scholar]
  6. Lara, L.E.; Moreno, H.; Naranjo, J.A.; Matthews, S.; Pérez de Arce, C. Magmatic Evolution of the Puyehue-Cordón Caulle Volcanic Complex (40° S), Southern Andean Volcanic Zone: From Shield to Unusual Rhyolitic Fissure Volcanism. J. Volcanol. Geotherm. Res. 2006, 157, 343–366. [Google Scholar] [CrossRef]
  7. Suárez, M.; Emparán, C. Hoja Curacautín 71, Regiones de La Araucanía y Del Bío Bío: Escala 1: 250,000; Servicio Nacional de Geología y Minería: Santiago, Chile, 1997. [Google Scholar]
  8. Aravena, D.; Muñoz, M.; Morata, D.; Lahsen, A.; Parada, M.Á.; Dobson, P. Assessment of High Enthalpy Geothermal Resources and Promising Areas of Chile. Geothermics 2016, 59, 1–13. [Google Scholar] [CrossRef] [Green Version]
  9. Lahsen, A.; Muñoz, N.; Parada, M.A. Geothermal Development in Chile. Proc. World Geotherm. Congr. 2010, 25, 25–29. [Google Scholar]
  10. López-Escobar, L.; Cembrano, J.; Moreno, H. Geochemistry and Tectonics of the Chilean Southern Andes Basaltic Quaternary Volcanism (37–46°S). Andean Geol. 1995, 22, 219–234. [Google Scholar] [CrossRef]
  11. Sánchez, P.; Pérez-Flores, P.; Arancibia, G.; Cembrano, J.; Reich, M. Crustal Deformation Effects on the Chemical Evolution of Geothermal Systems: The Intra-Arc Liquiñe-Ofqui Fault System, Southern Andes. Int. Geol. Rev. 2013, 55, 1384–1400. [Google Scholar] [CrossRef]
  12. Pérez-Flores, P.; Veloso, E.; Cembrano, J.; Sánchez-Alfaro, P.; Lizama, M.; Arancibia, G. Fracture Network, Fluid Pathways and Paleostress at the Tolhuaca Geothermal Field. J. Struct. Geol. 2017, 96, 134–148. [Google Scholar] [CrossRef]
  13. Moreno, H.; Naranjo, J.; Polanco, E. Geología Del Complejo Volcánico Lonquimay-Tolhuaca. Regiones de La Araucanía y Del Biobío. In Carta Geológica de Chile, Serie Geología Básica; Servicio Nacional de Geología y Minería: Santiago, Chile, 2012. [Google Scholar]
  14. Lohmar, S.; Stimac, J.; Colvin, A.; González, A.; Iriarte, S.; Melosh, G.; Wilmarth, M. Tolhuaca Volcano (Southern Chile, 38.3°S): New Learnings from Surface Mapping and Geothermal Exploration Wells. In Proceedings of the 12° Congreso Geológico Chileno, Antofagasta, Chile, 5–9 August 2012; pp. 443–445. [Google Scholar]
  15. Thiele, R.; Lahsen, A.; Moreno, H.; Varela, J.; Vergara, M.; Munizaga, F. Estudio Geológico Regional a Escala 1:100.000 de La Hoya Superior y Curso Medio Del Río Biobío; ENDESA-Departamento de Geología y Geofísica, Universidad de Chile: Santiago, Chile, 1987; informe inédito. [Google Scholar]
  16. Sánchez-Alfaro, P.; Reich, M.; Arancibia, G.; Pérez-flores, P.; Driesner, T. Evolution of the Tolhuaca Geothermal System: Insights from Mineralogy, Structural Data and Numerical Simulations. XIV Congr. Geológico Chil. 2012, III, 500–502. [Google Scholar]
  17. Sanchez-Alfaro, P.; Reich, M.; Arancibia, G.; Pérez-Flores, P.; Cembrano, J.; Driesner, T.; Lizama, M.; Rowland, J.; Morata, D.; Heinrich, C.A.; et al. Physical, Chemical and Mineralogical Evolution of the Tolhuaca Geothermal System, Southern Andes, Chile: Insights into the Interplay between Hydrothermal Alteration and Brittle Deformation. J. Volcanol. Geotherm. Res. 2016, 324, 88–104. [Google Scholar] [CrossRef]
  18. Collignon, M.; Cardellini, C.; Duprat-Oualid, S.; Hammer, Ø.; Chiodini, G.; Vandemeulebrouck, J.; Gonzalez-Vidal, D.; Espinoza, A.; Tassara, A.; Ruch, J. Carbon Dioxide Diffuse Emission at the Tolhuaca Hydrothermal System (Chile) Controlled by Tectonics and Topography. J. Volcanol. Geotherm. Res. 2021, 417, 107316. [Google Scholar] [CrossRef]
  19. Pérez-Moreno, R.; Reich, M.; Daniele, L.; Morata, D.; Held, S.; Kleinsasser, J. Stable Isotope and Anthropogenic Tracer Signature of Waters in an Andean Geothermal System. Appl. Geochem. 2021, 128, 104953. [Google Scholar] [CrossRef]
  20. Melosh, G.; Cumming, W.; Benoit, D.; Wilmarth, M.; Colvin, A.; Winick, J.; Soto-Neira, E.; Sussman, D.; Urzúa-Monsalve, L.; Powell, T.; et al. Exploration Results and Resource Conceptual Model of the Tolhuaca Geothermal Field, Chile. In Proceedings of the World Geothermal Congress, Bali, Indonesia, 25–29 April 2010. [Google Scholar]
  21. Melosh, G.; Moore, J.; Stacey, R. Natural Reservoir Evolution in the Tolhuaca Geothermal Field, Southern Chile. In Proceedings of the Thirty-Sixth Workshop on Geothermal Reservoir Engineering, Stanford, CA, USA, 30 January–1 February 2012. [Google Scholar]
  22. Bertrand, E.A.; Caldwell, T.G.; Hill, G.J.; Wallin, E.L.; Bennie, S.L.; Cozens, N.; Onacha, S.A.; Ryan, G.A.; Walter, C.; Zaino, A.; et al. Magnetotelluric Imaging of Upper-Crustal Convection Plumes beneath the Taupo Volcanic Zone, New Zealand. Geophys. Res. Lett. 2012, 39, 1–6. [Google Scholar] [CrossRef] [Green Version]
  23. Spichak, V.; Manzella, A. Electromagnetic Sounding of Geothermal Zones. J. Appl. Geophys. 2009, 68, 459–478. [Google Scholar] [CrossRef]
  24. Muñoz, G. Exploring for Geothermal Resources with Electromagnetic Methods. Surv. Geophys. 2014, 35, 101–122. [Google Scholar] [CrossRef]
  25. Brasse, H.; Soyer, W. A Magnetotelluric Study in the Southern Chilean Andes. Geophys. Res. Lett. 2001, 28, 3757–3760. [Google Scholar] [CrossRef]
  26. Kapinos, G.; Montahaei, M.; Meqbel, N.; Brasse, H. Three-Dimensional Electrical Resistivity Image of the South-Central Chilean Subduction Zone. Tectonophysics 2016, 666, 76–89. [Google Scholar] [CrossRef]
  27. Lavenu, A.; Cembrano, J. Compressional- and Transpressional-Stress Pattern for Pliocene and Quaternary Brittle Deformation in Fore Arc and Intra-Arc Zones (Andes of Central and Southern Chile). J. Struct. Geol. 1999, 21, 1669–1691. [Google Scholar] [CrossRef]
  28. Rosenau, M.; Melnick, D.; Echtler, H. Kinematic Constraints on Intra-Arc Shear and Strain Partitioning in the Southern Andes between 38°S and 42°S Latitude. Tectonics 2006, 25, 1–16. [Google Scholar] [CrossRef]
  29. Pérez-Flores, P.; Cembrano, J.; Sánchez-Alfaro, P.; Veloso, E.; Arancibia, G.; Roquer, T. Tectonics, Magmatism and Paleo-Fluid Distribution in a Strike-Slip Setting: Insights from the Northern Termination of the Liquiñe-Ofqui Fault System, Chile. Tectonophysics 2016, 680, 192–210. [Google Scholar] [CrossRef]
  30. Hervé, F.; Thiele, R. Estado de Conocimiento de Las Megafallas En Chile y Su Significado Tectónico. Comun. Univ. Chile 1987, 38, 67–91. [Google Scholar]
  31. Cembrano, J.; Hervé, F.; Lavenu, A. The Liquiñe Ofqui Fault Zone: A Long-Lived Intra-Arc Fault System in Southern Chile. Tectonophysics 1996, 259, 55–66. [Google Scholar] [CrossRef]
  32. Moreno, H.; Gardeweg, M.C. La Erupción Reciente En El Complejo Volcánico Lonquimay (Diciembre 1988), Andes Del Sur. Andean Geol. 1989, 16, 93–117. [Google Scholar]
  33. Lara, L.E.; Lavenu, A.; Cembrano, J.; Rodríguez, C. Structural Controls of Volcanism in Transversal Chains: Resheared Faults and Neotectonics in the Cordón Caulle-Puyehue Area (40.5°S), Southern Andes. J. Volcanol. Geotherm. Res. 2006, 158, 70–86. [Google Scholar] [CrossRef]
  34. Melnick, D.; Rosenau, M.; Folguera, A.; Echtler, H. Neogene Tectonic Evolution of the Neuquén Andes Western Flank (37–39°S). Spec. Pap. Geol. Soc. Am. 2006, 407, 73–95. [Google Scholar] [CrossRef]
  35. Radic, J.P. Las Cuencas Cenozoicas y Su Control En El Volcanismo de Los Complejos Nevados de Chillán y Copahue-Callaqui (Andes Del Sur, 36–39°S). Andean Geol. 2010, 37, 220–246. [Google Scholar] [CrossRef] [Green Version]
  36. Lara, L.E.; Folguera, A. The Pliocene to Quaternary Narrowing of the Southern Andean Volcanic Arc between 37° and 41°s Latitude. Spec. Pap. Geol. Soc. Am. 2006, 407, 299–315. [Google Scholar] [CrossRef]
  37. Lara, L.E. Villarrica-Lanín Chain: Tectonic Constraints for Volcanism in a Transversal Alignment. Villarrica Volcano (39.5°S). South. Andes Chile 2004, 13–16. [Google Scholar]
  38. Hauser, A. Catastro y Caracterización de Las Fuentes Minerales y Termales de Chile; Servicio Nacional de Geología y Minería: Santiago, Chile, 1997. [Google Scholar]
  39. Polanco, E.; Moreno, H.; Naranjo, J.A.; Pérez de Arce, C. Nuevas Edades Ar/Ar Del Complejo Lonquimay-Tolhuaca y Su Contribución a La Comprensión de Su Evolución Geológica. Jorn. Geológicas 2014, 12, 139–142. [Google Scholar]
  40. Lara, L.E.; Bertin, D.; Vergara, C. El Complejo Volcánico Lonquimay: Arquitectura y Control Estructural de La Evolución Magmática. Congr. Geológico Chil. 2012, 13, 522–524. [Google Scholar]
  41. Hill, G.J.; Bibby, H.M.; Ogawa, Y.; Wallin, E.L.; Bennie, S.L.; Caldwell, T.G.; Keys, H.; Bertrand, E.A.; Heise, W. Structure of the Tongariro Volcanic System: Insights from Magnetotelluric Imaging. Earth Planet. Sci. Lett. 2015, 432, 115–125. [Google Scholar] [CrossRef]
  42. Comeau, M.J.; Unsworth, M.J.; Ticona, F.; Sunagua, M. Magnetotelluric Images of Magma Distribution beneath Volcán Uturuncu, Bolivia: Implications for Magma Dynamics. Geology 2015, 43, 243–246. [Google Scholar] [CrossRef]
  43. Aizawa, K.; Koyama, T.; Hase, H.; Uyeshima, M.; Kanda, W.; Utsugi, M.; Ogawa, Y. Three-Dimensional Resistivity Structure and Magma Plumbing System of the Kirishima Volcanoes as Inferred from Broadband Magnetotelluric Data. J. Geophys. Res. Solid Earth 2014, 119, 198–215. [Google Scholar] [CrossRef]
  44. Di Giuseppe, M.G.; Troiano, A.; Carlino, S. Magnetotelluric Imaging of the Resurgent Caldera on the Island of Ischia (Southern Italy): Inferences for Its Structure and Activity. Bull. Volcanol. 2017, 79, 85. [Google Scholar] [CrossRef]
  45. Peacock, J.R.; Mangan, M.T.; McPhee, D.; Wannamaker, P.E. Three-Dimensional Electrical Resistivity Model of the Hydrothermal System in Long Valley Caldera, California, from Magnetotellurics. Geophys. Res. Lett. 2016, 43, 7953–7962. [Google Scholar] [CrossRef]
  46. Heise, W.; Caldwell, T.G.; Bibby, H.M.; Bannister, S.C. Three-Dimensional Modelling of Magnetotelluric Data from the Rotokawa Geothermal Field, Taupo Volcanic Zone, New Zealand. Geophys. J. Int. 2008, 173, 740–750. [Google Scholar] [CrossRef] [Green Version]
  47. Newman, G.A.; Gasperikova, E.; Hoversten, G.M.; Wannamaker, P.E. Three-Dimensional Magnetotelluric Characterization of the Coso Geothermal Field. Geothermics 2008, 37, 369–399. [Google Scholar] [CrossRef]
  48. Cordell, D.; Unsworth, M.J.; Díaz, D. Imaging the Laguna Del Maule Volcanic Field, Central Chile Using Magnetotellurics: Evidence for Crustal Melt Regions Laterally-Offset from Surface Vents and Lava Flows. Earth Planet. Sci. Lett. 2018, 488, 168–180. [Google Scholar] [CrossRef]
  49. Díaz, D.; Zuñiga, F.; Castruccio, A. The Interaction between Active Crustal Faults and Volcanism: A Case Study of the Liquiñe-Ofqui Fault Zone and Osorno Volcano, Southern Andes, Using Magnetotellurics. J. Volcanol. Geotherm. Res. 2020, 393, 106806. [Google Scholar] [CrossRef]
  50. Cordell, D.; Unsworth, M.J.; Diaz, D.; Reyes-Wagner, V.; Currie, C.A.; Hicks, S.P. Fluid and Melt Pathways in the Central Chilean Subduction Zone Near the 2010 Maule Earthquake (35–36°S) as Inferred From Magnetotelluric Data. Geochem. Geophys. Geosyst. 2019, 20, 1818–1835. [Google Scholar] [CrossRef] [Green Version]
  51. Pavez, M.; Schill, E.; Held, S.; Díaz, D.; Kohl, T. Visualizing Preferential Magmatic and Geothermal Fluid Pathways via Electric Conductivity at Villarrica Volcano, S-Chile. J. Volcanol. Geotherm. Res. 2020, 400, 106913. [Google Scholar] [CrossRef]
  52. Held, S.; Schill, E.; Pavez, M.; Díaz, D.; Muñoz, G.; Morata, D.; Kohl, T. Resistivity Distribution from Mid-Crustal Conductor to near-Surface across the 1200 km Long Liquiñe-Ofqui Fault System, Southern Chile. Geophys. J. Int. 2016, 207, 1387–1400. [Google Scholar] [CrossRef] [Green Version]
  53. Reyes-Wagner, V.; Díaz, D.; Cordell, D.; Unsworth, M. Regional Electrical Structure of the Andean Subduction Zone in Central Chile (35°–36°S) Using Magnetotellurics Studies on Electromagnetic Induction in the Earth: Recent Advances Weerachai Siripunvaraporn; Paul A Bedrosian; Yuguo Li; Prasanta Patro; Klaus. Earth Planets Space 2017, 69, 142. [Google Scholar] [CrossRef] [Green Version]
  54. Egbert, G.D.; Booker, J.R. Robust Estimation of Geomagnetic Transfer Functions. Geophys. J. R. Astron. Soc. 1986, 87, 173–194. [Google Scholar] [CrossRef] [Green Version]
  55. Egbert, G.D. Robust Multiple-Station Magnetotelluric Data Processing. Geophys. J. Int. 1997, 130, 475–496. [Google Scholar] [CrossRef] [Green Version]
  56. Wiese, H. Geomagnetische Tiefentellurik Teil II: Die Streichrichtung Der Untergrundstrukturen Des Elektrischen Widerstandes, Erschlossen Aus Geomagnetischen Variationen. Geofis. Pura Appl. 1962, 52, 83–103. [Google Scholar] [CrossRef]
  57. Kelbert, A.; Meqbel, N.; Egbert, G.D.; Tandon, K. ModEM: A Modular System for Inversion of Electromagnetic Geophysical Data. Comput. Geosci. 2014, 66, 40–53. [Google Scholar] [CrossRef]
  58. Tietze, K.; Ritter, O. Three-Dimensional Magnetotelluric Inversion in Practice-the Electrical Conductivity Structure of the San Andreas Fault in Central California. Geophys. J. Int. 2013, 195, 130–147. [Google Scholar] [CrossRef] [Green Version]
  59. Pace, F.; Martí, A.; Queralt, P.; Santilano, A.; Manzella, A.; Ledo, J.; Godio, A. Three-Dimensional Magnetotelluric Characterization of the Travale Geothermal Field (Italy). Remote Sens. 2022, 14, 542. [Google Scholar] [CrossRef]
  60. Bonafede, M.; Dragoni, M.; Boschi, E. Heat Diffusion and Size Reduction of a Spherical Magma Chamber. Bull. Volcanol. 1984, 47, 343–347. [Google Scholar] [CrossRef]
  61. Hawkesworth, C.J.; Blake, S.; Evans, P.; Hughes, R.; Macdonald, R.; Thomas, L.E.; Turner, S.P.; Zellmer, G. Time Scales of Crystal Fractionation in Magma Chambers-Integrating Physical, Isotopic and Geochemical Perspectives. J. Petrol. 2000, 41, 991–1006. [Google Scholar] [CrossRef]
  62. Spera, F.J. Physical Properties of Magma. In Encyclopedia on Volcanoes; Sigurdsson, H., Ed.; Academic Press: New York, NY, USA, 2000; pp. 171–190. [Google Scholar]
  63. Cooper, K.M.; Kent, A.J.R. Rapid Remobilization of Magmatic Crystals Kept in Cold Storage. Nature 2014, 506, 480–483. [Google Scholar] [CrossRef]
  64. Barboni, M.; Boehnke, P.; Schmitt, A.K.; Mark Harrison, T.; Shane, P.; Bouvier, A.S.; Baumgartner, L. Warm Storage for Arc Magmas. Proc. Natl. Acad. Sci. USA 2016, 113, 13959–13964. [Google Scholar] [CrossRef] [Green Version]
  65. Guo, X.; Zhang, L.; Behrens, H.; Ni, H. Probing the Status of Felsic Magma Reservoirs: Constraints from the P-T-H2O Dependences of Electrical Conductivity of Rhyolitic Melt. Earth Planet. Sci. Lett. 2016, 433, 54–62. [Google Scholar] [CrossRef]
  66. Guo, X.; Li, B.; Ni, H.; Mao, Z. Electrical Conductivity of Hydrous Andesitic Melts Pertinent to Subduction Zones. J. Geophys. Res. Solid Earth 2017, 122, 1777–1788. [Google Scholar] [CrossRef] [Green Version]
  67. Glover, P.W.J.; Hole, M.J.; Pous, J. A Modified Archie’s Law for Two Conducting Phases. Earth Planet. Sci. Lett. 2000, 180, 369–383. [Google Scholar] [CrossRef]
  68. Piquer, J.; Yáñez, G.; Rivera, O.; Cooke, D.R. Long-Lived Crustal Damage Zones Associated with Fault Intersections in the High Andes of Central Chile. Andean Geol. 2019, 46, 223–239. [Google Scholar] [CrossRef]
  69. Morgado, E.; Parada, M.A.; Morgan, D.J.; Gutiérrez, F.; Castruccio, A.; Contreras, C. Transient Shallow Reservoirs beneath Small Eruptive Centres: Constraints from Mg-Fe Interdiffusion in Olivine. J. Volcanol. Geotherm. Res. 2017, 347, 327–336. [Google Scholar] [CrossRef] [Green Version]
  70. Morgado, E.; Parada, M.A.; Contreras, C.; Castruccio, A.; Gutiérrez, F.; McGee, L.E. Contrasting Records from Mantle to Surface of Holocene Lavas of Two Nearby Arc Volcanic Complexes: Caburgua-Huelemolle Small Eruptive Centers and Villarrica Volcano, Southern Chile. J. Volcanol. Geotherm. Res. 2015, 306, 1–16. [Google Scholar] [CrossRef]
  71. Barrientos, S.E.; Acevedo-Aránguiz, P.S. Seismological Aspects of the 1988–1989 Lonquimay (Chile) Volcanic Eruption. J. Volcanol. Geotherm. Res. 1992, 53, 73–87. [Google Scholar] [CrossRef]
  72. Anderson, E.; Crosby, D.; Ussher, G.; Zealand, N. Bulls-Eye!—Simple Resistivity Imaging To Reliably Locate the Geothermal Reservoir. In Proceedings of the World Geothermal Congress, Kyushu-Tohoku, Japan, 28 May–10 June 2000; pp. 909–914. [Google Scholar]
  73. Ussher, G.; Harvey, C.; Johnstone, R.; Anderson, E.; Zealand, N. Understanding the Resistivities Observed in Geothermal Systems. In Proceedings of the World Geothermal Congress, Kyushu-Tohoku, Japan, 28 May–10 June 2000; pp. 1915–1920. [Google Scholar]
  74. Pérez-Flores, P.; Wang, G.; Mitchell, T.M.; Meredith, P.G.; Nara, Y.; Sarkar, V.; Cembrano, J. The Effect of Offset on Fracture Permeability of Rocks from the Southern Andes Volcanic Zone, Chile. J. Struct. Geol. 2017, 104, 142–158. [Google Scholar] [CrossRef]
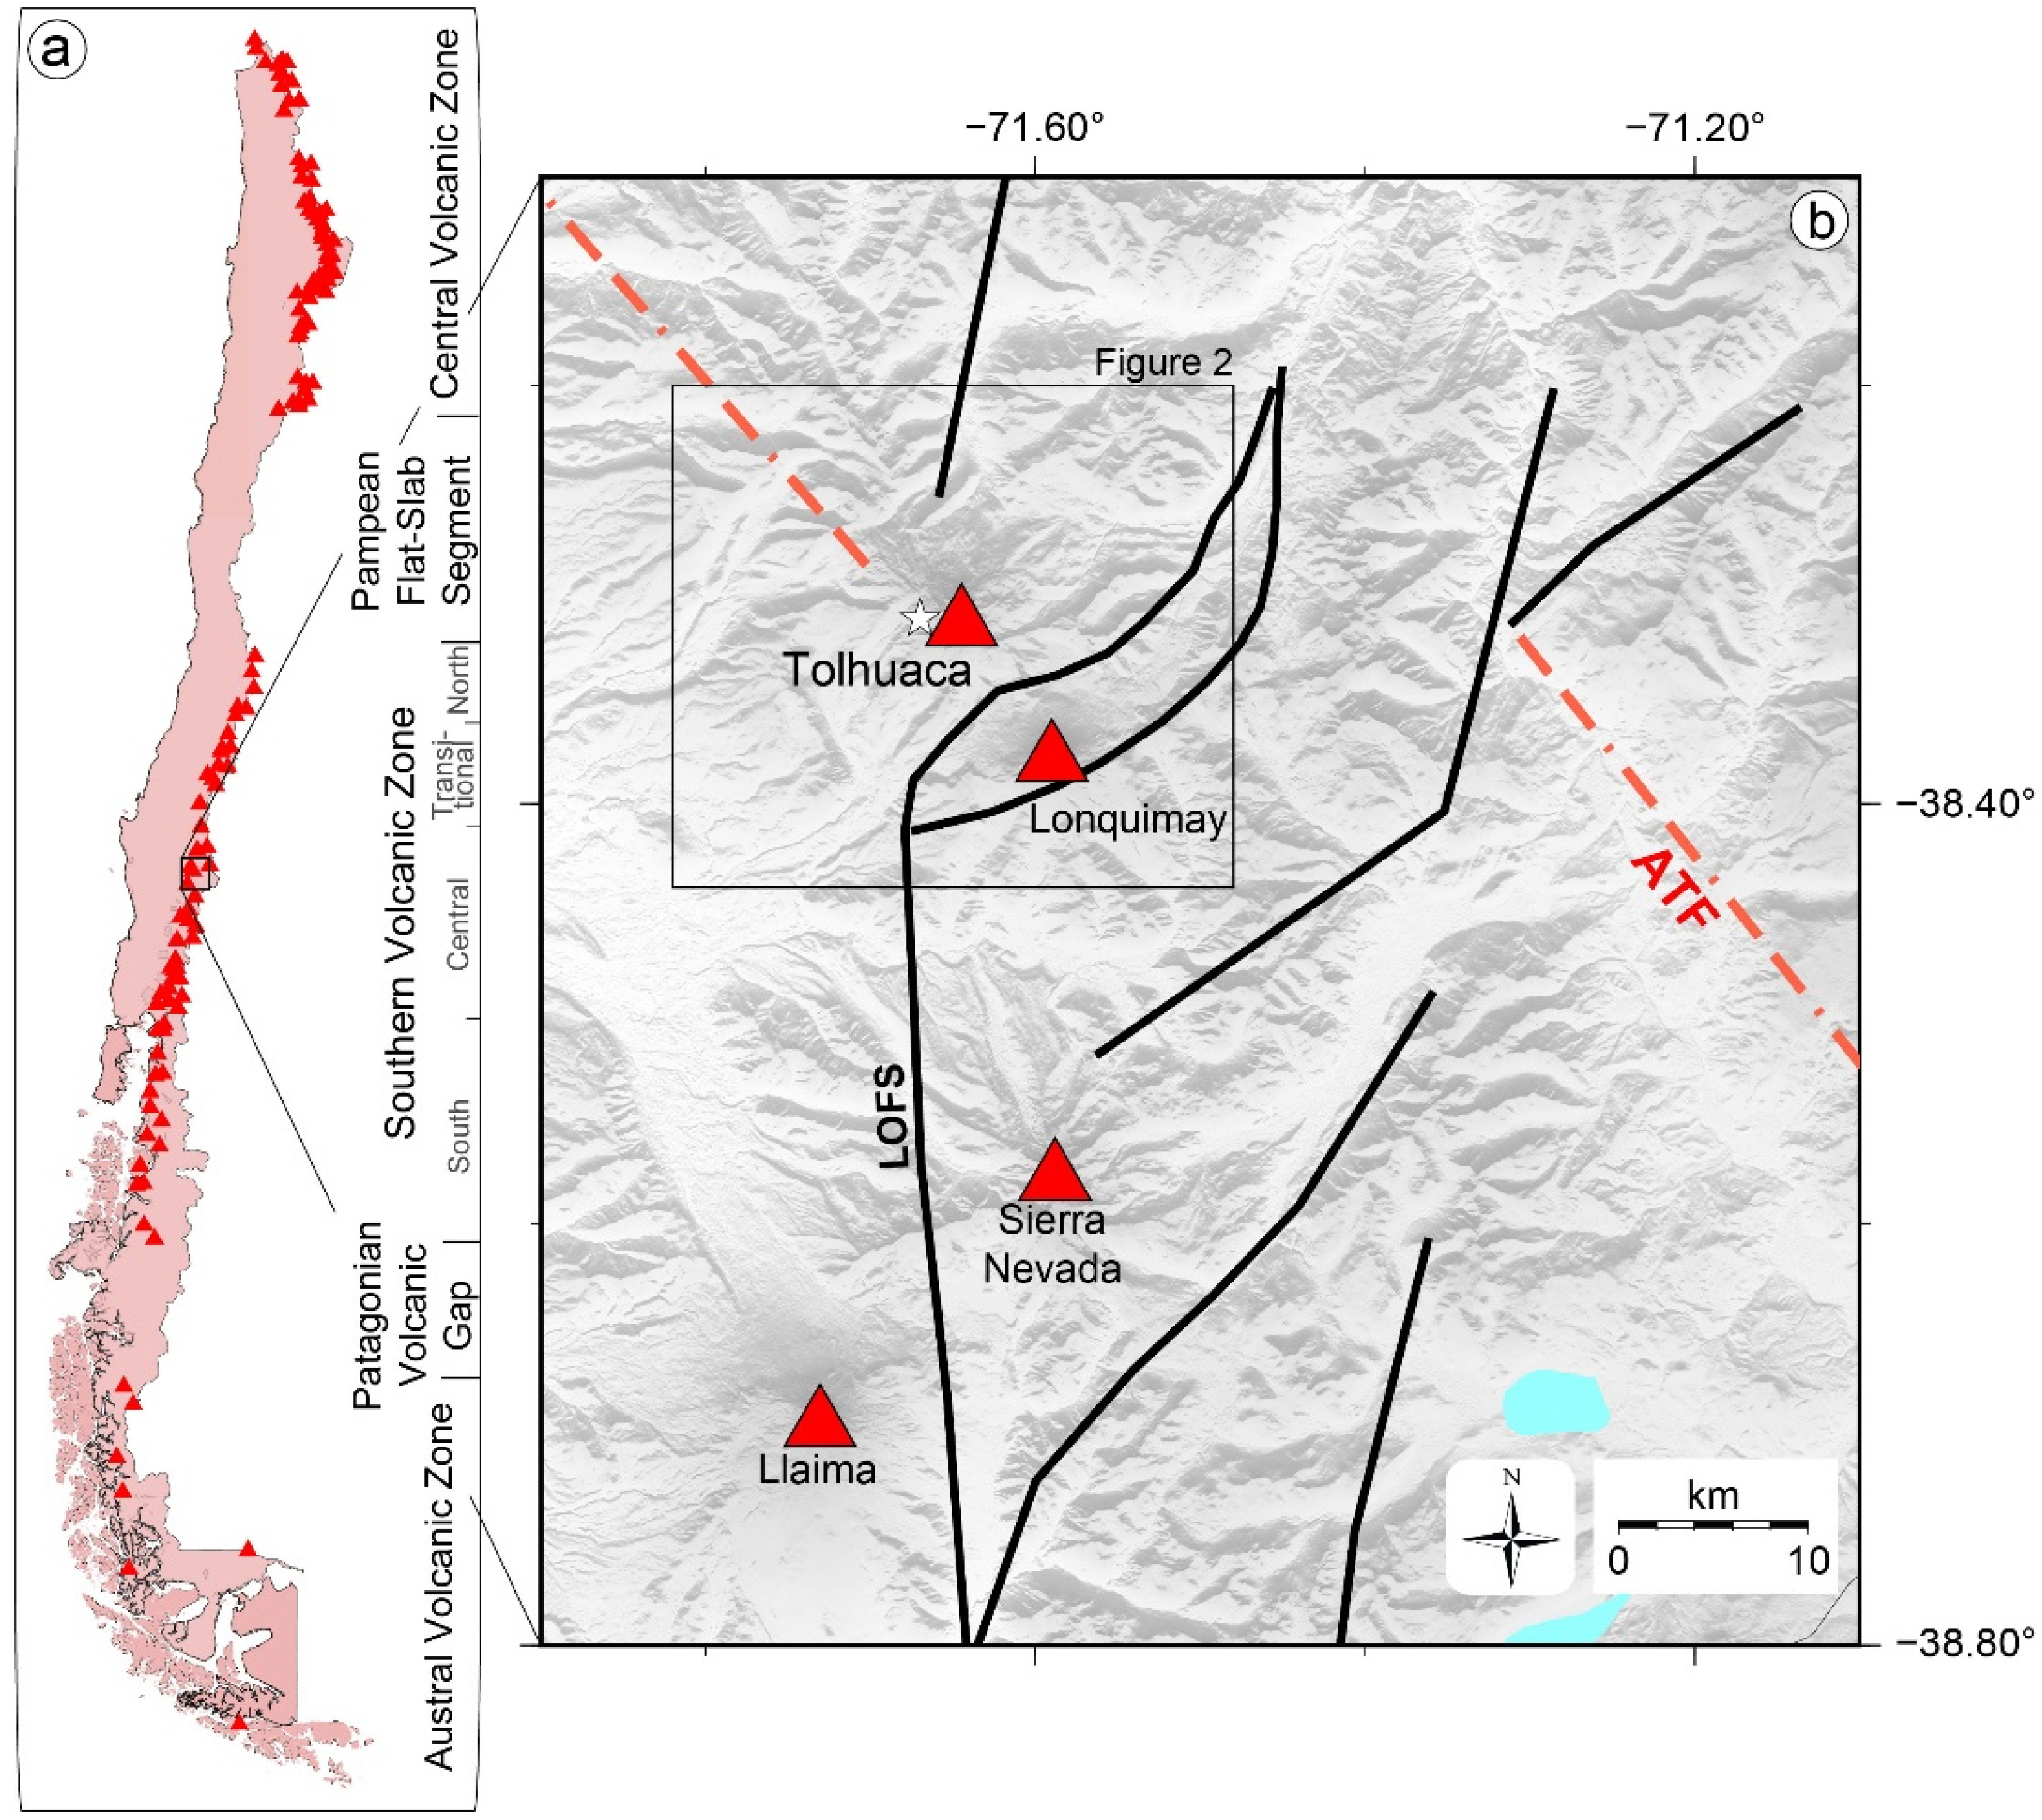
Figure 1. (a) Schematic map of the volcanic setting along the Chilean Andes showing the three main volcanic zones. All types of volcanic edifies are represented by red triangles (https://portalgeominbeta.sernageomin.cl (accessed on 25 November 2022)). (b) Simplified map of the major structural systems of the Liquiñe-Ofqui Fault system (LOFS) and the Andean Transversal Fault (ATF). Red triangles represent Holocene stratovolcanoes. Llaima and Lonquimay are counted among the most active volcanoes in Chile, while Tolhuaca is dormant and Sierra Nevada is extinct [7]. The white star indicates the location of the Tolhuaca Geothermal System.
Remotesensing 14 06144 g001
Figure 2. Topographic map of the study area. The highest elevations correspond to the summits of Tolhuaca and Lonquimay volcanoes. Caracol, La Holandesa, Laguna Verde, and Lolco pyroclastic cones aligned WNW-ESE are located between the two major summits [32]. Yellow, green, and pink circles show locations of the 2007, 2014, and 2019–2020 magnetotelluric sites used for this study. White stars indicate wells. Black lines outline the eruptive centers. Blue circles indicate hot springs. Elevation data were obtained from the SRTM1 Global relief model (www.ngdc.noaa.gov/mgg/global/global.html, accessed on 25 November 2022).
Remotesensing 14 06144 g002
Figure 3. Three examples of apparent resistivity and phase curves of the non-diagonal components of the MT data (Measured) and responses of inversion model (Predicted). Red represents the Zxy component, blue the Zyx component. The thick line represents the predicted data for the preferred 500 Ωm initial model. Dashed lines represent the predicted data for the initial 100 Ωm model. (a) Example of data measured in 2007. (b) Example of data measured in 2014. (c) Example of data measured in 2019 and 2020.
Remotesensing 14 06144 g003
Figure 4. Number of iterations versus root mean square misfit convergence curves for the MT inversion with the a priori inversion and the fixed inversion. The black lines represent the preferred starting model. The dots denote the initial RMS. The inversion with starting model of 10 Ωm began with the lowest RMS whereas the 1000 Ωm starting model began with a high RMS misfit. However, all starting models converged to similar misfit.
Remotesensing 14 06144 g004
Figure 5. The preferred MT resistivity model shown by vertical slice along profile ABC. (a) Horizontal plan views at 2.5 km (250 m a.s.l.) depth. (b) AB northwest diagonal cut along the NW flank of Tolhuaca volcano, passing through the well exploration site. BC N-NW diagonal cut connecting Tolhuaca and Lonquimay volcanoes. Dashed black lines in the vertical sections show the intersection of the profiles. The black dots and green inverted triangles on the vertical and horizontal sections are the locations of MT sites and exploration wells, respectively.
Remotesensing 14 06144 g005
Figure 6. Plan view of the 3D model obtained from inversion presented for six different depths showing the relationship between conductive anomalies spatially distributed near the surface and geothermal surface manifestations and volcanic lineaments shown in Figure 2. Gray dots represent MT sites. Stars represent wells.
Remotesensing 14 06144 g006
Figure 7. (a) Topographic map including three vertical slices of the preferred 3D MT model. High altitudes correspond to the summit of volcanoes. (b) Multi-segment cross-section through the wells and major volcanoes are shown in Figure 5. (c) NW-SE cross-section magmatic and hydrothermal fluid pathways. (d) Three-dimensional 3D resistivity image derived from N-S and E-W orthogonal profiles in order to the inferred position and extension of the crustal long-term magmatic storage denoted by C1.
Remotesensing 14 06144 g007
Figure 8. (a) Variation of electrical conductivity with water content for different melt compositions, using the models of [65,66]. (b) Bulk electrical resistivity of a two-phase system depending on the melt fraction for basalt-andesite melt with a resistivity of 3 Ωm, for different degrees of melt interconnection: Highly interconnected (m = 1.0) and moderately well interconnected (m = 1.5) to isolated (m = 2.0).
Remotesensing 14 06144 g008
Figure 9. (a) Location of the N-S profile shown in (b). ATF: Andean Transverse Fault; LOFS: Liquiñe-Ofqui Fault System; Tol-1, Tol-2: slim wells; Tol-3, Tol-4: deep wells. Black dots represent MT stations. (b) N-S vertical section with a vertical exaggeration of 1×. Section running parallel to wells and the thermal manifestation and located to the west of the high conductive anomaly. The figure also includes an interpretation of the well temperature (modified after [21]). Blue dots represent hot springs. (c) Temperature vs. elevation profiles for the Tol-1 (blue line), Tol-2 (magenta line), Tol-3 (orange line), and Tol-4 (green line) wells (modified after [17]). Four structural-mineralogical zones are shown as a reference (modified after [14,17]). (d) Zoom of the central part of the N-S section shown in (b). The figure includes hydrothermal alteration units from Tol-1 and Tol-2 wells [14], the ~300 m thick uppermost high conductive anomaly, and the lower low-intermediate conductive anomalies. Note that the scale refers to the vertical extension of the wells.
Remotesensing 14 06144 g009
Figure 10. Detailed NS-slice through the central part of Tolhuaca geothermal system shown in Figure 9d, where the slim wells Tol-1 and Tol-2 are located. Blue circles indicate hot springs. Top left, NS-slice compared with hydrothermal alteration units from wells and correlated with conductivity anomalies. Bottom left, NS-slice compared with temperature logs and from hydrothermal alterations correlation. Middle right, schematic NS-slice interpretation showing conductive and intermediate resistivity anomalies related to the geothermal reservoir features. Note that the scale refers to the vertical extension of the wells.
Remotesensing 14 06144 g010
Publisher’s Note: MDPI stays neutral with regard to jurisdictional claims in published maps and institutional affiliations.