Article

Sentinel-2 Detection of Floating Marine Litter Targets with Partial Spectral Unmixing and Spectral Comparison with Other Floating Materials (Plastic Litter Project 2021)

by
Dimitris Papageorgiou
1,*,
Konstantinos Topouzelis
1,
Giuseppe Suaria
2,
Stefano Aliani
2 and
Paolo Corradi
3
1
Department of Marine Sciences, University of the Aegean, University Hill, 81100 Mytilene, Greece
2
Institute of Marine Sciences (ISMAR) National Research Council (CNR), Forte Santa Teresa, Pozzuolo di Lerici, 19032 La Spezia, Italy
3
European Space Research and Technology Centre (ESTEC), European Space Agency, 2200 AG Noordwijk, The Netherlands
*
Author to whom correspondence should be addressed.
Remote Sens. 2022, 14(23), 5997; https://doi.org/10.3390/rs14235997
Submission received: 23 September 2022 / Revised: 18 November 2022 / Accepted: 22 November 2022 / Published: 26 November 2022
(This article belongs to the Special Issue Remote Sensing for Mapping and Monitoring Anthropogenic Debris)

Abstract

:
Large-area, artificial floating marine litter (FML) targets were deployed during a controlled field experiment and data acquisition campaign: the Plastic Litter Project 2021. A set of 22 Sentinel-2 images, along with UAS data and ancillary measurements were acquired. Spectral analysis of the FML and natural debris (wooden planks) targets was performed, along with spectral comparison and separability analysis between FML and other floating materials such as marine mucilage and pollen. The effects of biofouling and submersion on the spectral signal of FML were also investigated under realistic field conditions. Detection of FML is performed through a partial unmixing methodology. Floating substances such as pollen exhibit similar spectral characteristics to FML, and are difficult to differentiate. Biofouling is shown to affect the magnitude and shape of the FML signal mainly in the RGB bands, with less significant effect on the infrared part of the spectrum. Submersion affects the FML signal throughout the range of the Sentinel-2 satellite, with the most significant effect in the NIR part of the spectrum. Sentinel-2 detection of FML can be successfully performed through a partial unmixing methodology for FML concentrations with abundance fractions of 20%, under reasonable conditions.

1. Introduction

Between 19 and 23 million tons of plastic waste are deposited in aquatic environments every year, and if emissions are not curbed, this figure is estimated to reach up to 53 million tons by 2030 [1]. Macroplastics (i.e., plastic items bigger than 2 cm), can persist for decades in the marine environment and their accumulation in a wide range of habitats has been widely reported since the 1990s. The long-term environmental impacts of this contaminant are still basically unknown [2], however, due to its ubiquitous distribution, plastic pollution is now acknowledged as a planetary threat and a global ecological crisis, which poses significant risks to biodiversity, economy and human health [3,4].
Worldwide governments, NGOs and private businesses are rolling out multiple prevention and mitigation strategies, however, monitoring the efficacy of these measures is still hampered by the lack of harmonized and large-scale monitoring tools [5]. Field measurements are too scattered in space and time, and no data are available for most of the ocean surface. There is wide geographical variability in litter abundance, which increases the difficulty of analysing its spatio-temporal trends [6].
Floating macroplastics have been traditionally monitored using vessel-based or aerial-based surveys, with inherent uncertainty in the data obtained because of the different protocols adopted [7] and meteo-marine conditions. This variability also depends on meteorological conditions or the presence of relevant ocean dynamics, such as frontal areas, coastal currents or surface convergence zones enhancing offshore accumulation or dispersion of plastic items [8]. To refine our understanding of the global plastic budget, and to support more effective management strategies, sustained observations over larger spatial scales are urgently required.
Within this framework, satellite observations have the potential to significantly contribute to the global monitoring of floating litter [9]. A number of studies have focused on the satellite remote sensing of floating marine litter and debris: non-exhaustive examples include performing controlled lab experiments [10,11,12,13,14,15,16,17], controlled field experiments [18,19,20,21], examining the spectral characteristics of FML and other floating materials [22,23,24,25,26], proposing spectral or AI-based FML detection approaches or supplementary methodologies [27,28,29,30,31,32,33,34,35,36], or generally assessing the feasibility of satellite remote sensing of FML [37,38]. A more inclusive and concise critical review of state of the art approaches can be found in a recent publication [39].
In this study we present the spectral analysis results performed on data acquired through a field acquisition campaign (Plastic Litter Project 2021—PLP2021) using artificial floating targets. Spectral comparison between the acquired data and other floating features is performed, along with FML detection using a partial unmixing methodology. Results show significant spectral similarity between FML and other floating materials, and the possibility of identification of FML pixels with an abundance fraction of as low as 20% using partial unmixing.

2. Materials and Methods

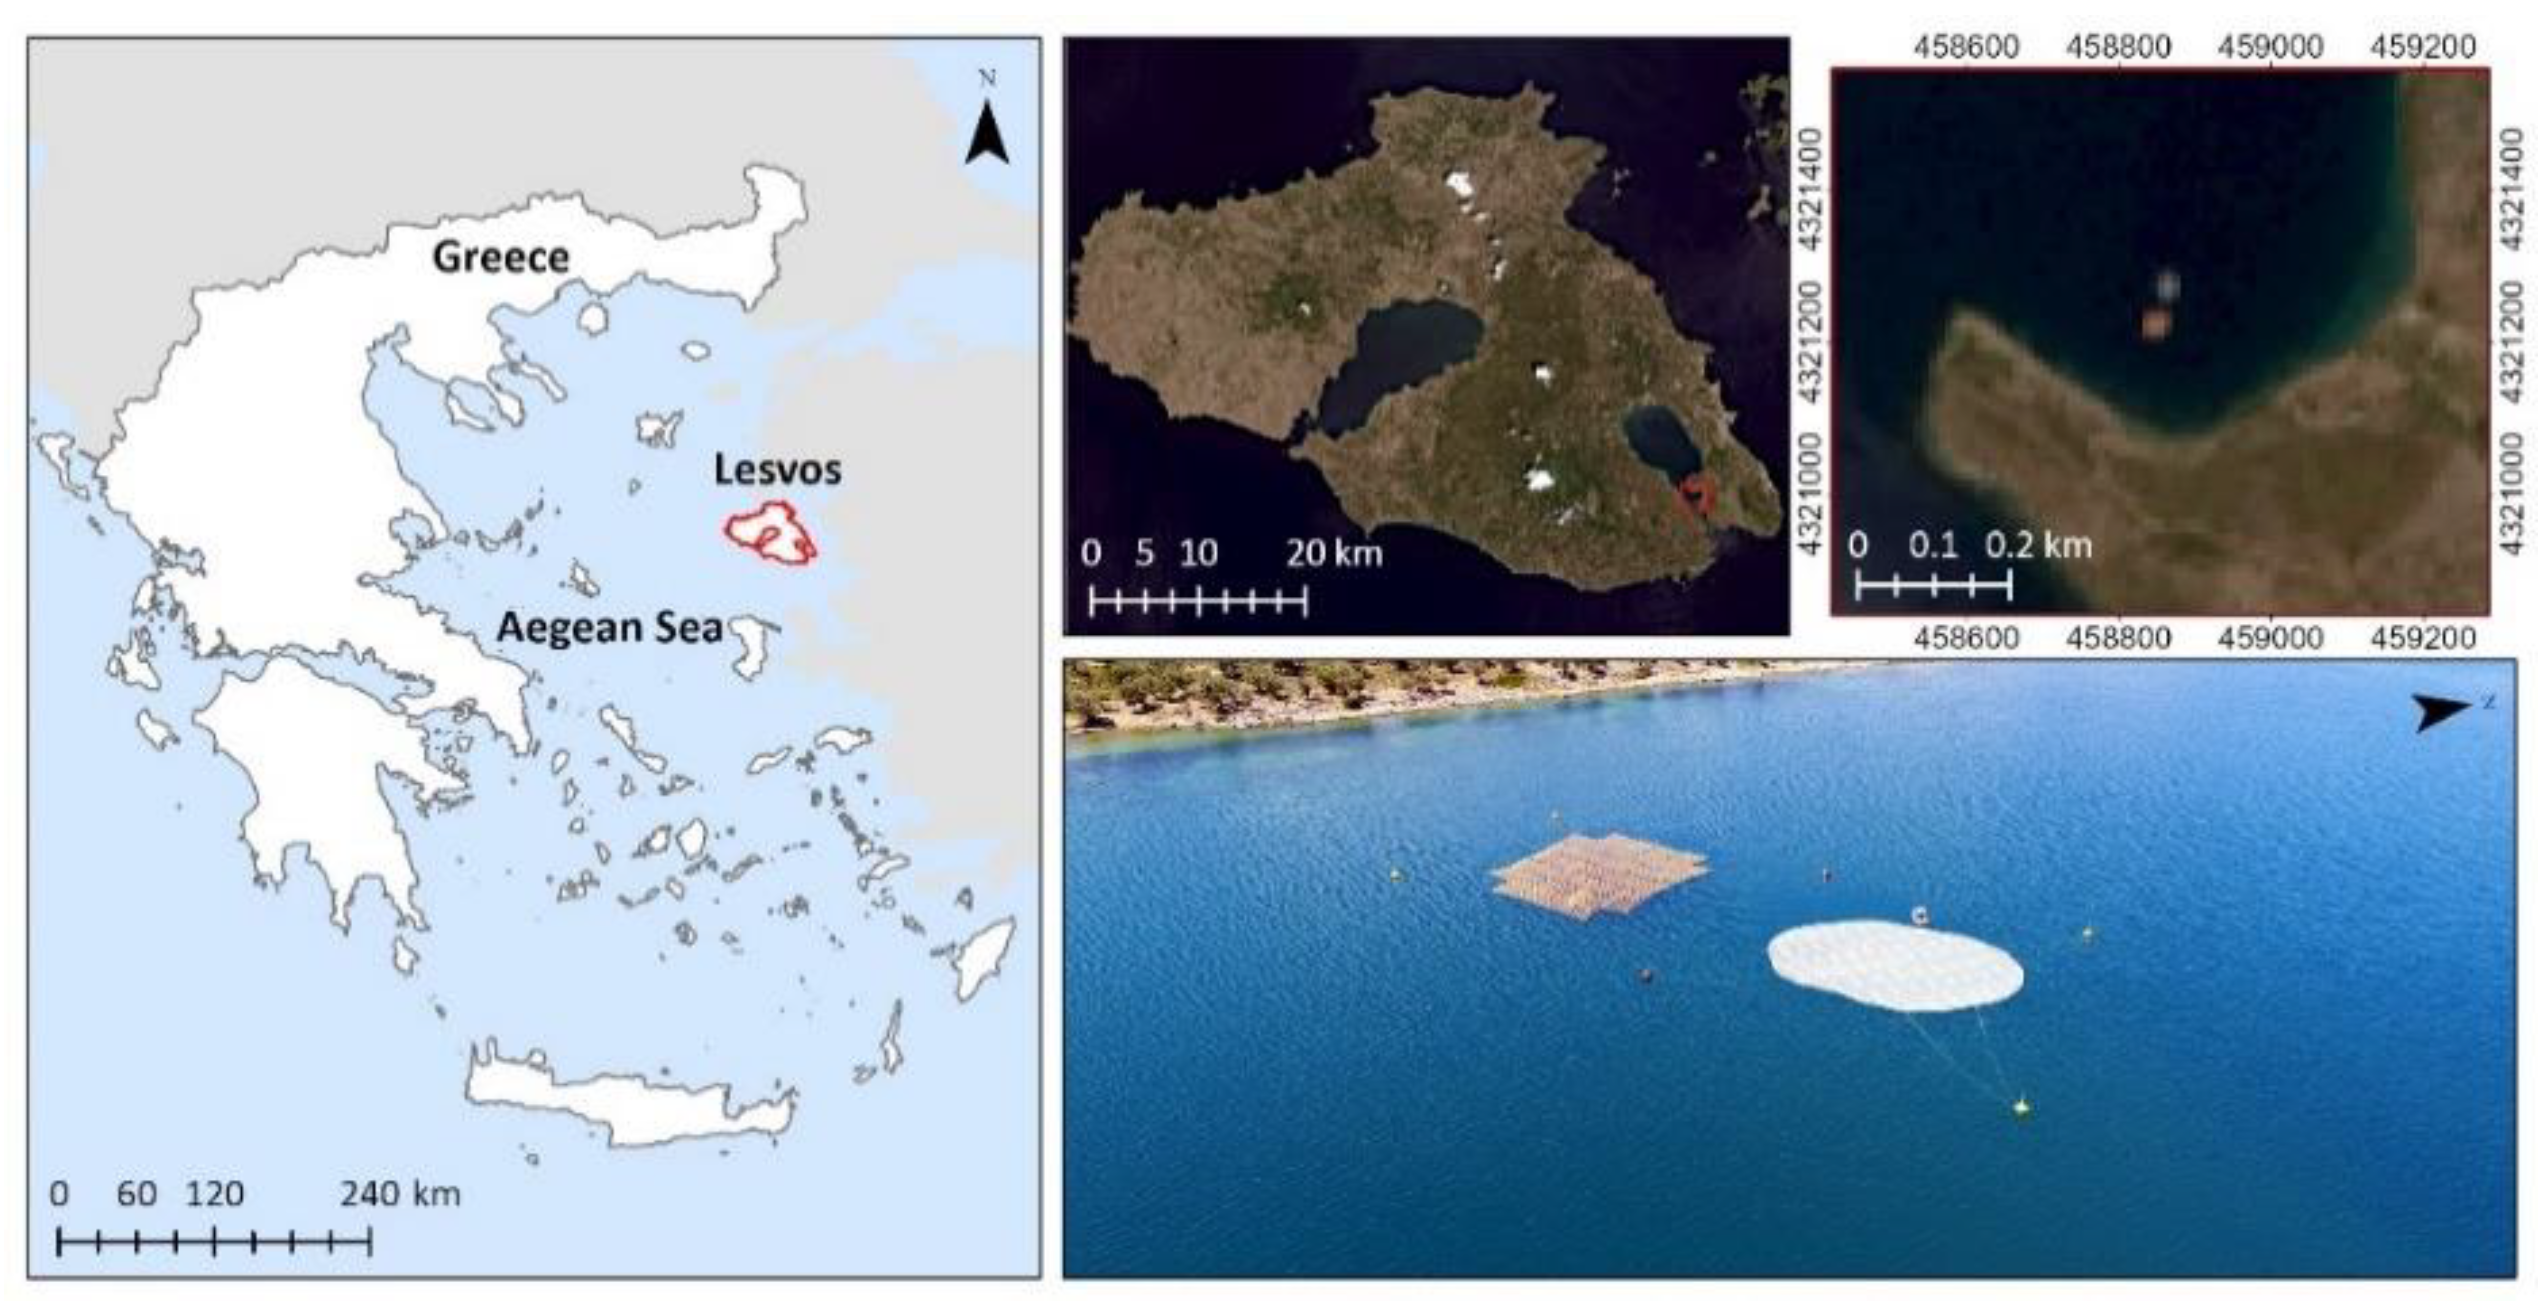
2.1. Overview of the Plastic Litter Project 2020–2021

The PLPs are controlled field experiment and data acquisition campaigns using artificial floating marine litter and natural debris targets. The projects have been running since 2018 with the main goal of understanding the spectral characteristics of FML and other surface floating materials, producing in situ validated satellite and UAS imagery that can act as calibration and validation data, and assess the possibility of remote detection and classification of FML.
The PLP2021 was divided into two main phases. The first phase of the project was dedicated to the selection of a characteristic reference material to be used in the FML targets and to the design of the targets, as well as all the licensing and approvals needed for the long-term acquisition campaign, while the second phase of the project was the actual acquisition campaign with construction and deployment of the newly developed, circular, long-term deployment targets and the subsequent analysis of the obtained dataset.
The main project objectives were:
  • To develop long-term deployment targets for extended acquisition campaigns that would not require re-deployment for each satellite overpass.
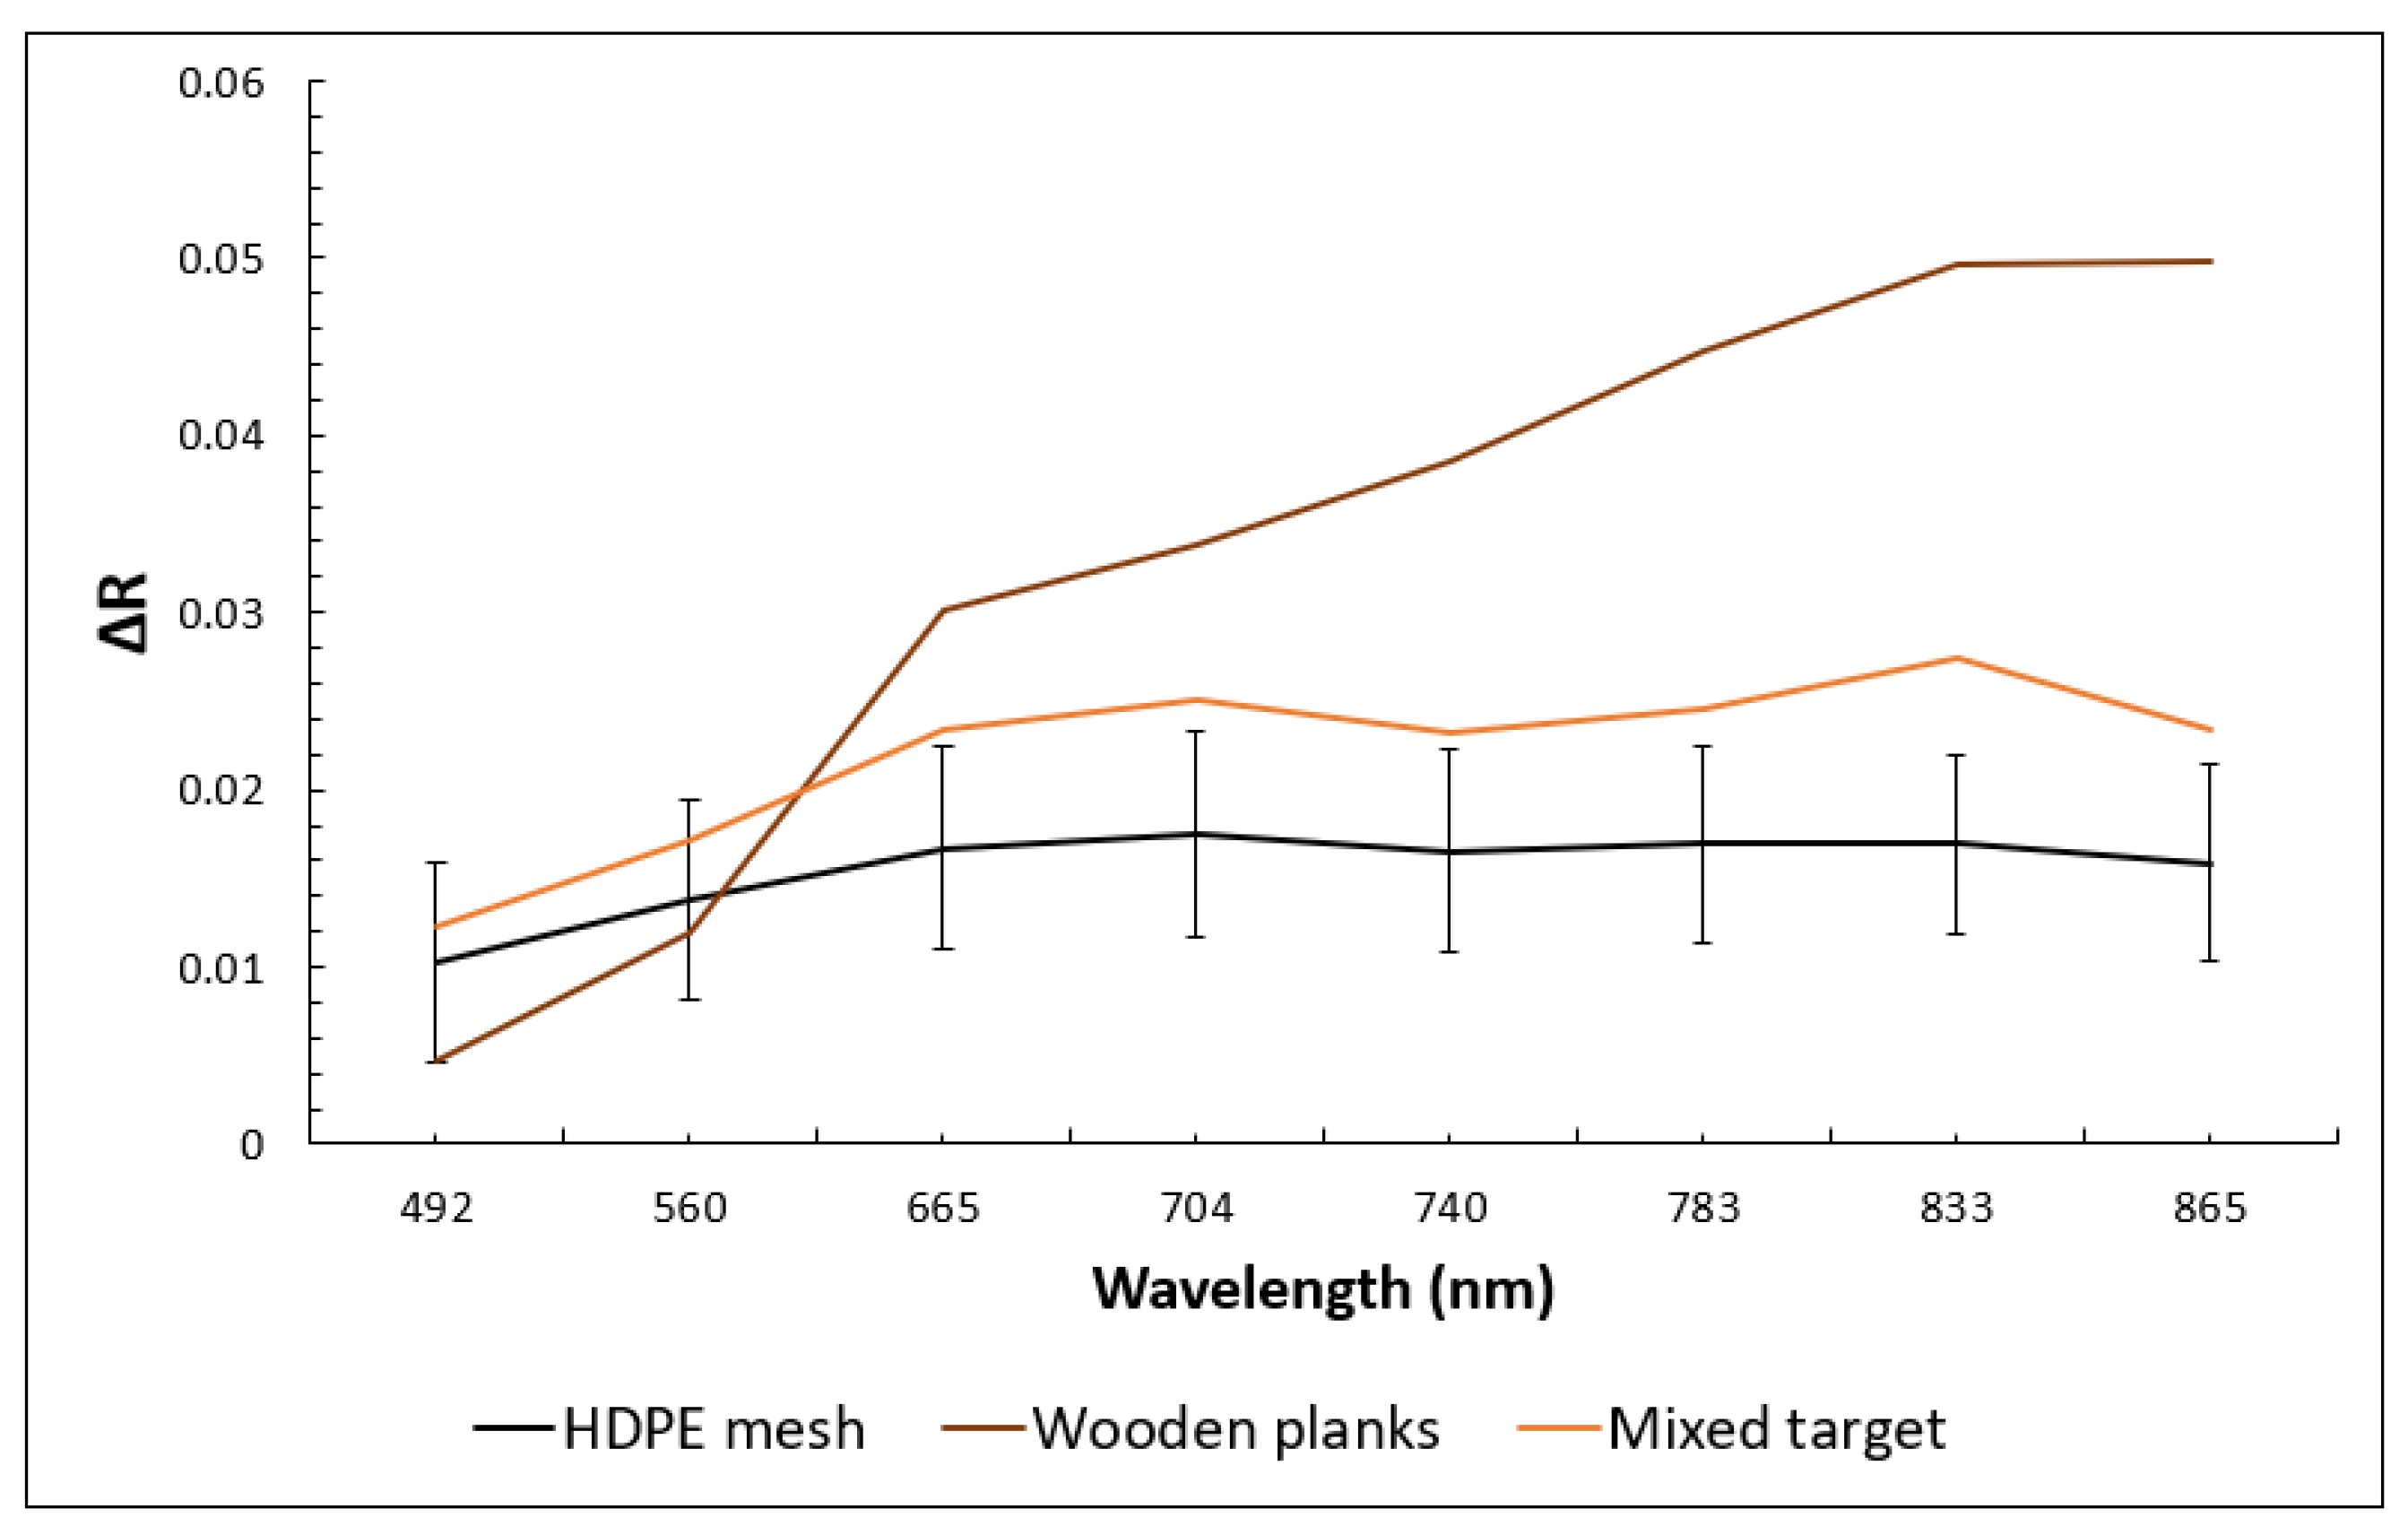
  • To acquire the spectral response of a 10 m × 10 m Sentinel-2 pixel that is fully covered by the target materials, including the FML reference target material, a wooden target material approximating natural floating debris aggregations and a mixed target configuration.
  • To run a long-term data acquisition campaign during the summer–autumn period of 2021 and acquire a range of data including Sentinel-2 and high-resolution UAS data.
  • To assess the effects that environmental factors such as biofouling and submersion depth have on the spectral response of FML.
  • To assess the capability of remote detection of floating marine litter with partial unmixing methodologies using the Sentinel-2 satellite.

2.2. Experimental Set-Up–Acquisition Campaign

The PLP2021 acquisition campaign took place during the months of June to early October 2021 in the Gulf of Gera in the Island of Mytilene in Greece (Figure 1). An anchoring system designating a 50 m × 100 m deployment area, consisting of 6 large-volume anchoring buoys attached to concrete blocks set on the seafloor, was put in place. The anchoring system adhered to all local regulations regarding maritime security, sea surface occupation and environmental protection. The large-area targets were tethered to the buoys and remained inside the deployment area throughout the 4-month acquisition period. The targets’ size was designed so that a 10 m × 10 m Sentinel-2 pixel would be fully covered by the target materials, regardless of the targets’ position in the Sentinel-2 image.
Two types of targets were deployed for PLP2021, with a third target configuration resulting from the combination of the two target types:
(a)
HDPE mesh target representative of floating marine litter—the target is comprised of a single 28 m diameter ring, constructed using four 22 m long sections of 63 mm diameter HDPE irrigation piping, connected using compression fittings. The HDPE mesh is composed of a series of 1.2 m wide HDPE mesh sheets stitched together and attached to the target ring using 5 mm thin nylon rope. The HDPE mesh was selected as a target material to be representative of FML aggregations, after consideration between a series of materials, since it fulfilled a set of requirements; namely: spectral signature representative of FML, ability to construct large area targets, durability for long-term deployment, availability, and cost. The white HDPE mesh colour was chosen based on the fact that white and transparent are the most common colours of plastic marine litter [10]. The mesh has a density of 0.955 gr/cm3, it is produced through extrusion and is coloured using an HDPE-based, food-safe paint at a 0.8% w/w ratio.
(b)
Wooden planks target representative of natural floating woody debris—the wooden target was constructed using 342 wooden planks, each 4 m long and 22 cm wide. The planks were tethered together in groups of 9 planks, 38 groups in total, connected in a rectangular grid pattern, creating a formation that encloses a theoretical 28 m diameter circle, to achieve the same pixel area coverage as the HDPE mesh target.
(c)
Mixed target configuration representative of mixed natural and plastic floating debris—the mixed target configuration was produced by combining both targets into a single set-up. The wooden planks target was positioned underneath the HDPE mesh target, effectively taking up the space of the HDPE mesh holes.

2.3. Overview of Acquired Data

During the PLP2021 acquisition campaign spanning from the 11 June 2021 to the 4 October 2021, we acquired a large amount of satellite, UAV and in situ ancillary data of the 3 artificial FML targets. The acquisition campaign was centred around the Sentinel-2 acquisition plan, with additional data acquisition including: very-high-resolution RGB images using a DJI Phantom 4 RTK drone, hyperspectral data in the range of 400–1000 nm using a Bayspec OCI-F Hyperspectral Imager (about 3 cm spatial resolution and 240 bands) on board a UCD S-1000 hexacopter, in situ hyperspectral measurements in the range of 400–900 nm using an Oceanview spectrometer and ancillary data including wind speed and direction, light intensity and water turbidity using a Secchi disk.
A total of 22 cloud-free Sentinel-2 images of the deployment area were acquired during the PLP2021 data acquisition campaign. The large amount of acquired data allows for a comprehensive spectral analysis of the HDPE mesh, wooden and mixed target signatures. Additionally, the long-term deployment of the targets presents the ability to assess the effects of biofouling and submersion on the spectral response of floating marine debris.
All acquired Sentinel-2 data are available in the Zenodo repository “Plastic Litter Project 2021 dataset” (doi 10.5281/ZENODO.7085112, accessed on 22 September 2022) [40].
One of our main goals was the assessment of the effects that a set of parameters have on the spectral response of FML. An effort was made to assess the different parameters individually and independently. For this reason, we have categorised the data based on the conditions during acquisition (see Table 1), and have isolated these in order to account only for the parameter under investigation (e.g., to assess the effects of biofouling on the target signatures we do not examine data in which the target was also partially submerged under the water surface).

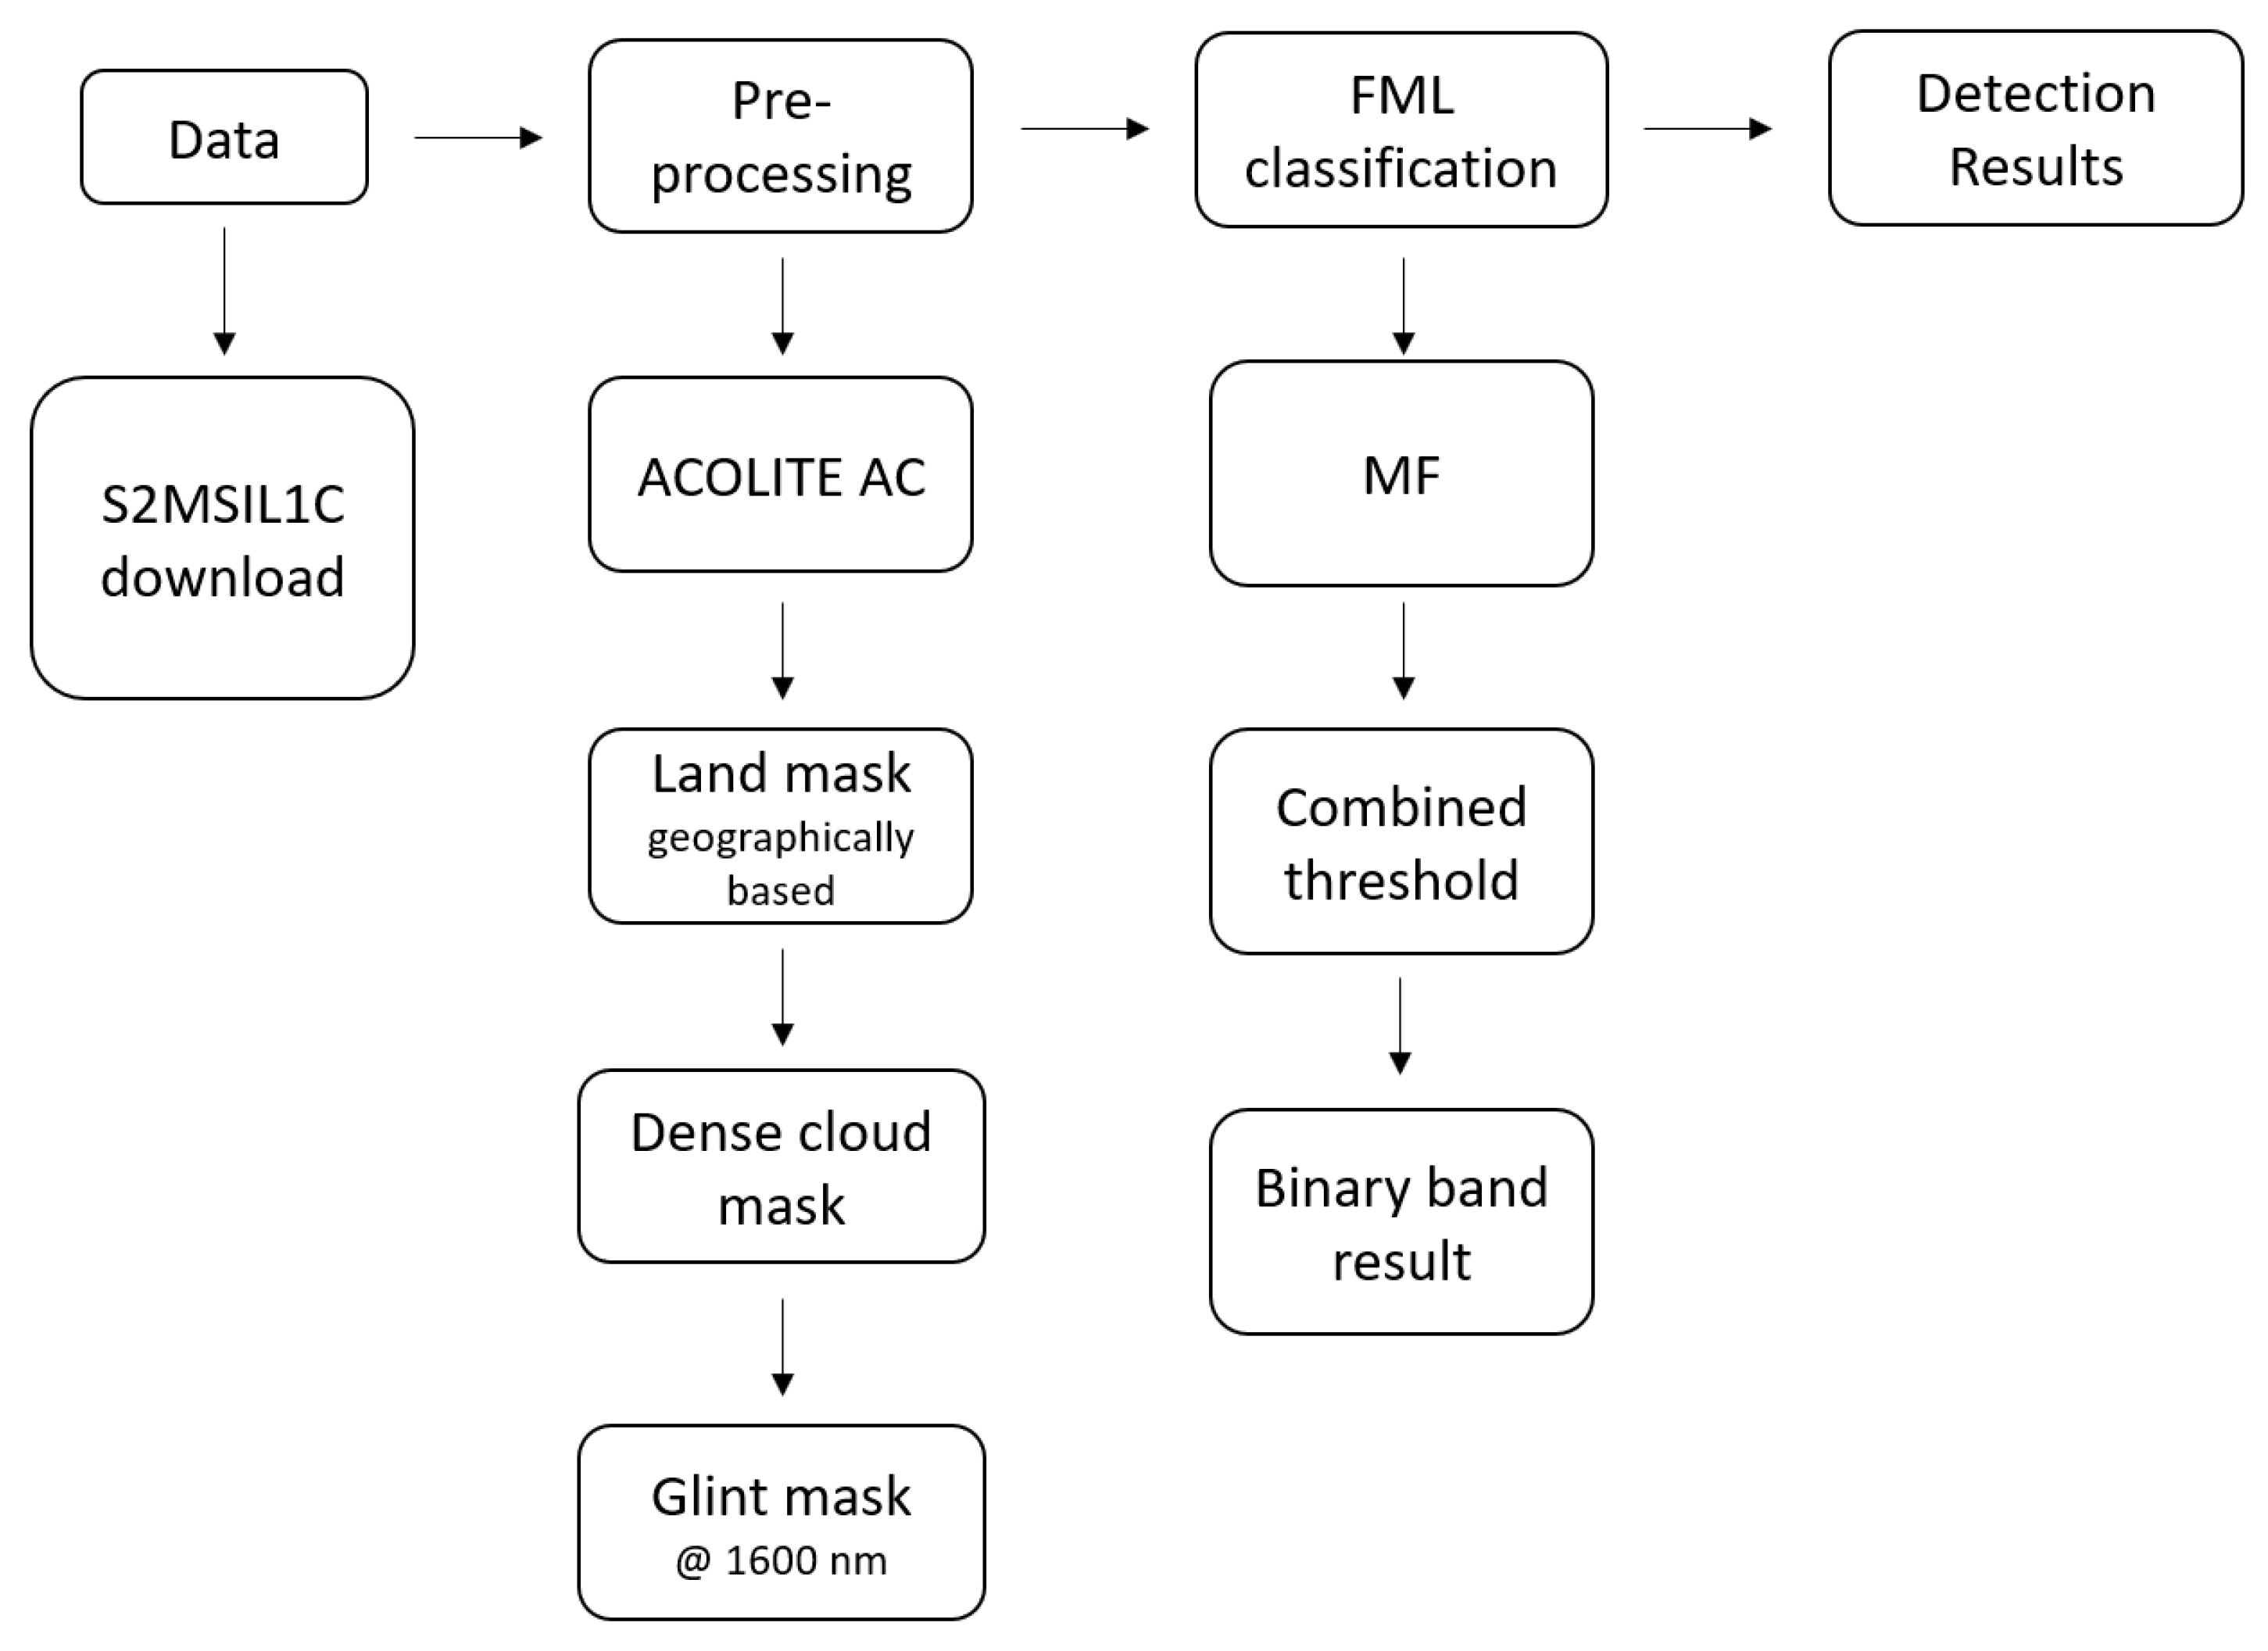
2.4. Sentinel-2 Data Pre-Processing

Sentinel-2 Level-1C and Level-2A data are downloaded after each acquisition from the Copernicus Open Access Hub. All Sentinel-2 L1C images are atmospherically corrected with the ACOLITE (v. 20210802) atmospheric correction processor for aquatic scenes, using the dark spectrum fitting (DSF) approach [41]. The DSF works by using two main assumptions to estimate the atmospheric path reflectance: (i) the atmosphere is homogeneous over a certain extent; and (ii) the scene contains pixels with zero reflectance, in at least one of the sensor bands.
Land pixels are masked through the application of a geography-based land mask of the study area. This ensures that all land surfaces are correctly removed from the scene, along with cloud shadow pixels over land surfaces. The land mask includes near-shore areas of shallow waters (at about 30 m from the coastline) that, due to bottom reflectance, can significantly affect the detection results.
Cloud masking is performed through the ACOLITE processor which uses the SWIR Sentinel-2 band 10 at 1375 nm to detect and mask cirrus clouds, based on a given reflectance threshold (0.005 on default). Additionally, the cloud mask shape files for opaque and cirrus clouds in the Sentinel-2 L1C products are used as well as the L2A SCL thin cirrus mask. Both the ACOLITE SWIR threshold and the Sentinel-2 cloud masks can successfully be used to mask dense clouds, however cloud edges and shadows are not removed from the scene. Hence, a buffer can be applied to remove cloud edges, with cloud shadows over land being removed by the land mask.
Sun glint is a significantly restricting factor in remote sensing applications over water, especially for close-to-nadir viewing satellites such as the Sentinel-2. Additionally, besides the sun glint produced due to the viewing geometry of the sensor and sun angles, aquatic scenes from high resolution satellites such as Sentinel-2 are also subject to wave glint that is produced by the sea surface texture. While wave glint can potentially be corrected for, strong direct glint needs to be excluded from further processing. Pixels affected by strong glint are masked out using a brightness threshold on the 2200 nm SWIR2 Sentinel-2 band. Glint correction is not performed to avoid interference with the FML signal, since most glint correction methodologies make use of the SWIR or NIR bands to estimate the glint signal.

2.5. Spectral Analysis

In recent publications, Hu et al. have shown that when working with data from the Multispectral Instrument (MSI) of the Sentinel-2 satellite, the spectral shapes of floating matters present artificial distortions [25,26,42], specifically in the 20 m red-edge and NIR bands. In a nutshell, due to the MSI’s intrinsic properties (different band resolutions (Table 2), along with band co-registration issues), the generally low abundance fractions of floating matters in mixed pixels resulting in increased contribution of the water endmember and the resampling of the MSI bands, the resultant spectral shapes of floating-matter-containing pixels present unrealistic troughs or peaks at the 20 m band reflectance.
In order to overcome these issues, Hu [42] proposes that the spectral analysis and visualization should be performed on a 5 × 5 pixel mean, along with the subtraction of the neighbouring water background pixels, since the water contribution to the overall mixed pixel spectrum can be significant. Figure 2 below shows the 5 × 5 pixels that are used to extract the spectral signature of the target materials. It can be seen that a significant proportion of the 5 × 5 pixels do not contain a target material fraction. Hence, the resultant spectral profile will correspond better to the correct spectral shape of the given materials, however the magnitude of the spectral response will be lower. Equation (1) below, as presented in [25], is used to calculate ΔR:
ΔR = Rtarget − Rwater
where: Rtarget is the 5 × 5 averaged target reflectance for each band and Rwater is the reflectance of neighbouring water pixels.
Additionally, the dark spectrum fitting DSF algorithm used here for atmospheric correction uses the SWIR bands to perform the aerosol correction. This results in unrealistically lower reflectance values for the target materials in the SWIR region of the spectrum and hence cannot be assumed to produce a representative spectral signature in that domain. For this reason, the spectral plots presented in this paper omit the two SWIR bands of the MSI.
Equation (2) below is used to calculate spectral angles (in degrees) between the different spectral profiles [43]:
Spectral   angle = c o s 1 [ ( Σ x i y i Σ x i 2 Σ y i 2 ) ]
where: x, y are reflectance values of two different spectra for each band.

2.6. Spectral Indices

Spectral indices analysis is performed to assess the spectral separability of the above-mentioned classes using two spectral indices: FDI [27] and NDVI. The indices are computed for the 22 Sentinel-2 images acquired during the PLP2021 acquisition campaign and a series of different images of surface features (marine mucilage off the coast of Lemnos, pollen of the coast of Mytilene, wakes and sea foam).
F D I = R N I R R N I R R N I R = R R E 2 + ( R S W I R 1 R R E 2 ) × ( λ N I R λ R E D ) ( λ S W I R λ R E D ) × 10
N D V I = ( R N I R R R E D ) ( R N I R + R R E D )

2.7. Reversed Spectral Unmixing

Through the large area of the deployed targets, we have achieved a full coverage of a single 10 m × 10 m Sentinel-2 pixel. However, the target material structure is such that does not fully cover the area of the target (due to the holes in the HDPE mesh), and this results in a partial contribution of the water leaving reflectance to the overall target response. By calculating the coverage of the mesh and performing a reversed spectral unmixing calculation (Equation (5)) [19] we can produce a signature that is in theory representative of solely the HDPE material and that can be used as a more suitable endmember for detection by partial unmixing.
RTarget = χ RHDPE + (1 − χ) RWater => RHDPE = [RTarget − (1 − χ) RWater]/χ
where: RTarget is the central pixel fully covered by the target material, RHDPE is the theoretical HDPE spectral signature and RWater is the water reflectance leaving from the surrounding pixels.

2.8. Partial Unmixing

Figure 3 below presents the processing workflow for the classification of pixels containing FML. FML detection is performed by the matched filtering algorithm. Matched filtering (MF) is a process commonly used in a variety of applications in order to detect the presence of a known signal or signature, in a mixed signal of unknown components and/or noise [44]. MF can be used to calculate the abundance of a known endmember by performing a partial unmixing, without the need to define all the endmembers present in a pixel. In our case, only the plastic target signatures (the pure signature from the large surface target and the calculated signature from reverse spectral unmixing) will be the endmember in question. Similar to linear spectral unmixing, MF uses a linear model for sub-pixel analysis, but removes the requirement to determine all the endmembers by maximising the response of a known endmember and suppressing the signal of the unknown background. The main result of the MF processing is a greyscale raster that contains the values of the abundance fraction of the endmember in question for each image pixel. A simple band math calculation can be subsequently performed in order to exclude all pixels with abundance fraction values below a given threshold. Thus, the final result is a binary classification band containing all pixels above the set MF threshold.
Any number of available bands can be used on the basis of their significance for the specific application. Here, we use two different band combinations: one using the four 10 m Sentinel-2 RGB and NIR bands at 492, 560, 665 and 833 nm, one using also the 20 m red-edge and NIR bands at 704, 740, 783, 865 nm. The two different band combinations are examined in order to assess their suitability to detect the maximum possible number of pixels and also to discriminate between FML and other floating matters (such as the wooden target) and minimise the number of false positives.

3. Results

3.1. Spectral Analysis

Spectral analysis is centred around the Sentinel-2 data. Figure 4 below shows the mean spectral profiles of the HDPE, wooden planks and mixed targets, after the 5 × 5 pixel averaging and the water background subtraction. The HDPE spectral plot shows a reflectance increase from the blue to the red wavelength and a generally flat profile from the red to NIR wavelengths. This is consistent with lab-measured profiles presented in relevant literature [12] and very similar to the hyperspectral data of the HDPE mesh (Figure A1). An issue that arises with the 5 × 5 pixel averaging and the water background subtraction is the significant reduction in terms of the magnitude of the spectral profiles of the examined floating matters, when the coverage area is significantly smaller than the 5 × 5 pixel averaging area, as is the case here (Figure 2). Although the shape of the spectral profile is relevant, the magnitude shown here is not representative of the materials, if these were to cover the whole of the 5 × 5 pixel area. The standard deviation between the different acquisition dates is generally very similar for the different bands, showing a generally stable spectral profile in terms of spectral shape.
The wooden planks target plot exhibits spectral features representative of woody debris, with a general increase from the blue to the NIR wavelengths, while the mixed target presents an intermediate profile more closely resembling the HDPE target spectral profile.
Surface floating features such as floating vegetation and natural debris can have spectral features very similar to those of floating marine litter [24,25,26,27]. Hence, spectral comparison with these types of floating features is important in order to investigate the spectral separability of those features against FML. Here, we compare two floating features most relevant to the Mediterranean and surrounding seas with FML: floating aggregations of marine mucilage (sea snot) from the 2021 outbreak originating in the Sea of Marmara, and pollen surface concentrations around the island of Lesvos in April of 2022.
The HDPE mesh target has similar spectral features (Figure 5) to marine mucilage (sea snot) (2021 outbreak mainly originating in the Sea of Marmara), however the spectral angle between the mean HDPE signature and sea snot signatures indicates that FML and sea snot can be distinguished using spectral classification methodologies. However, the spectral signature of sea-snot-containing pixels presented here exhibits a slightly different spectral shape from what is shown in [26]. This could be due to the fact that the sea snot examined here has been floating for an extended period of time, travelling from the Sea of Marmara to reach the southern and eastern coasts of the Island of Lemnos (see Figure 5). Hence, it is possible that its spectral characteristics have been altered, specifically with regard to the presence of photosynthetically active constituents, or a different sea snot composition and floating matters in the sea-snot-containing pixels altogether. Additionally, the different spectral response shown here can potentially be attributed to the different atmospheric correction approach adopted (aerosol correction vs. Raleigh correction). It is worth noting that the “brighter” sea snot pixels examined here are mostly dominated by the spectral shape of the floating matter and subtraction of the neighbouring water pixels’ contribution does not significantly affect the resultant spectral shape.
Pollen, on the other hand, presents a spectral shape much more similar to the HDPE target than that of sea snot. With a spectral angle of less than 5 degrees between pollen and the HDPE target, indicating a significant similarity, the two floating matters are shown to be very difficult to discriminate using spectral classification methodologies. Similar to the bright sea snot pixels, in the case of the higher magnitude pollen pixels, which are from a very bright area of the pollen-containing windrow, it is very likely that the abundance fraction of pollen is quite high, and as such the pollen reflectance spectrum dominates the pixels’ response. Hence, the subtraction of the surrounding water pixels does not significantly affect the resulting spectral shape. In the case of the pollen pixels from inside the Gulf of Gera however, the resultant spectral shape is altered mostly in the RGB range when subtracting the neighbouring water pixels spectrum.
Although pollen and sea snot can potentially present significant implications for the detection of FML, both these floating matters occur during specific time and are regionally dependent events. Pollen accumulations occur mostly during the spring months and very close to shore, while sea snot events have a distinct spatial distribution and are also temporally dependent. Hence, such occurrences can more easily be taken into account in terms of FML detection.

3.1.1. Reversed Spectral Unmixing

Through dimensional measurements and object-based image analysis, we calculated that the HDPE mesh coverage amounted to about 30%. This means that in a fully covered 10 m × 10 m pixel, 30% or 30 m2 of the pixel would be fully covered by the HDPE material. Therefore, in our case, for the HDPE target central pixel, the abundance fraction of HDPE is χ = 0.3 in the reversed spectral unmixing Equation (5). The reversed spectral unmixing is thus performed using the central pixel reflectance values without any water background subtraction.
In theory, we would expect that the calculation would yield the same signature for all acquisitions, however this is not the case, as can be seen from Figure 6. The figure shows only the 10 m bands of Sentinel-2, since these are the only bands where there is a full coverage of the pixel by the HDPE mesh. The difference in the produced spectral signatures can be due to slightly different conditions during the different acquisition days. Sun glint can significantly affect the water leaving reflectance which theoretically amounts for 70% of the overall fractional coverage, but can have a different effect on the target pixel than the surrounding water pixels and can affect certain bands more than others. Biofouling accumulations and UV degradation can alter the HDPE mesh signature, and even though we are restricting to the first acquisitions during which biofouling contamination is very low, it is still possible that the HDPE mesh signature changes slightly even throughout the first weeks of the experiment.
Three different profiles are used as endmembers in the subsequent partial unmixing detection: the produced Rhdpe signature from the 20210701 acquisition, along with the mean profile from the central HDPE target pixel and the reflectance mean ΔR HDPE profile adjusted to 833 nm. These profiles are chosen based on their similarity to the HDPE spectral shape.

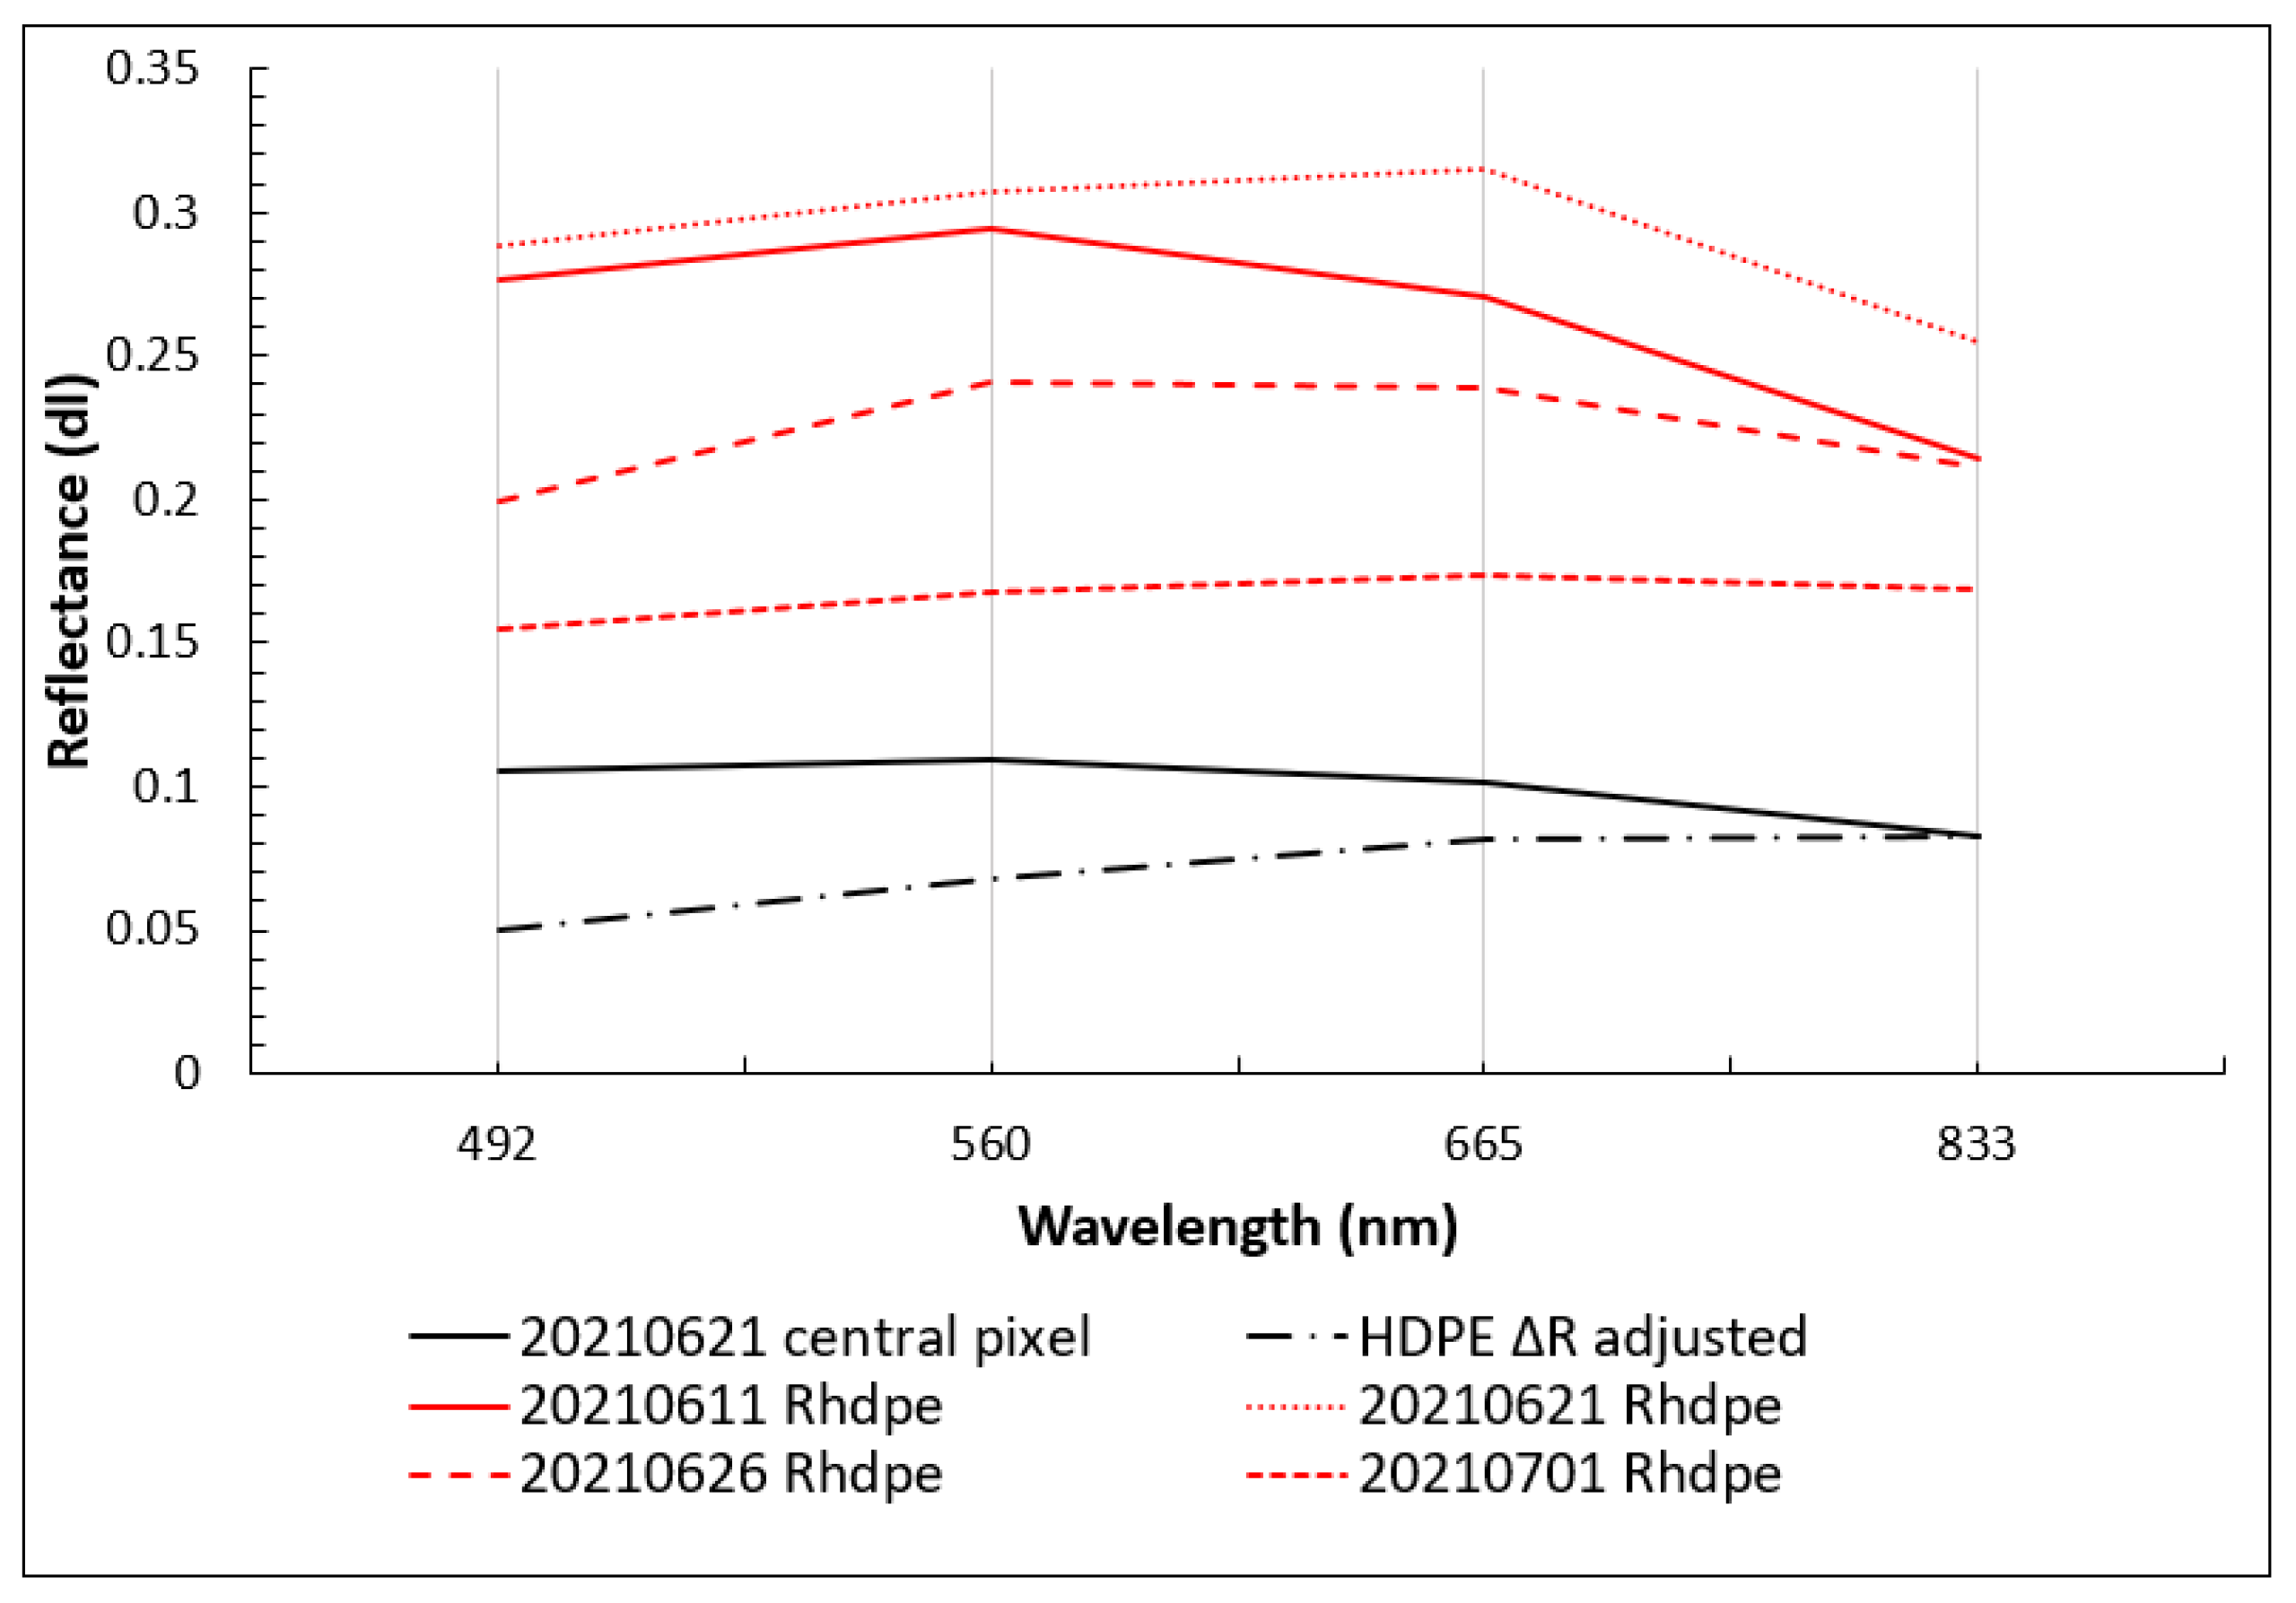
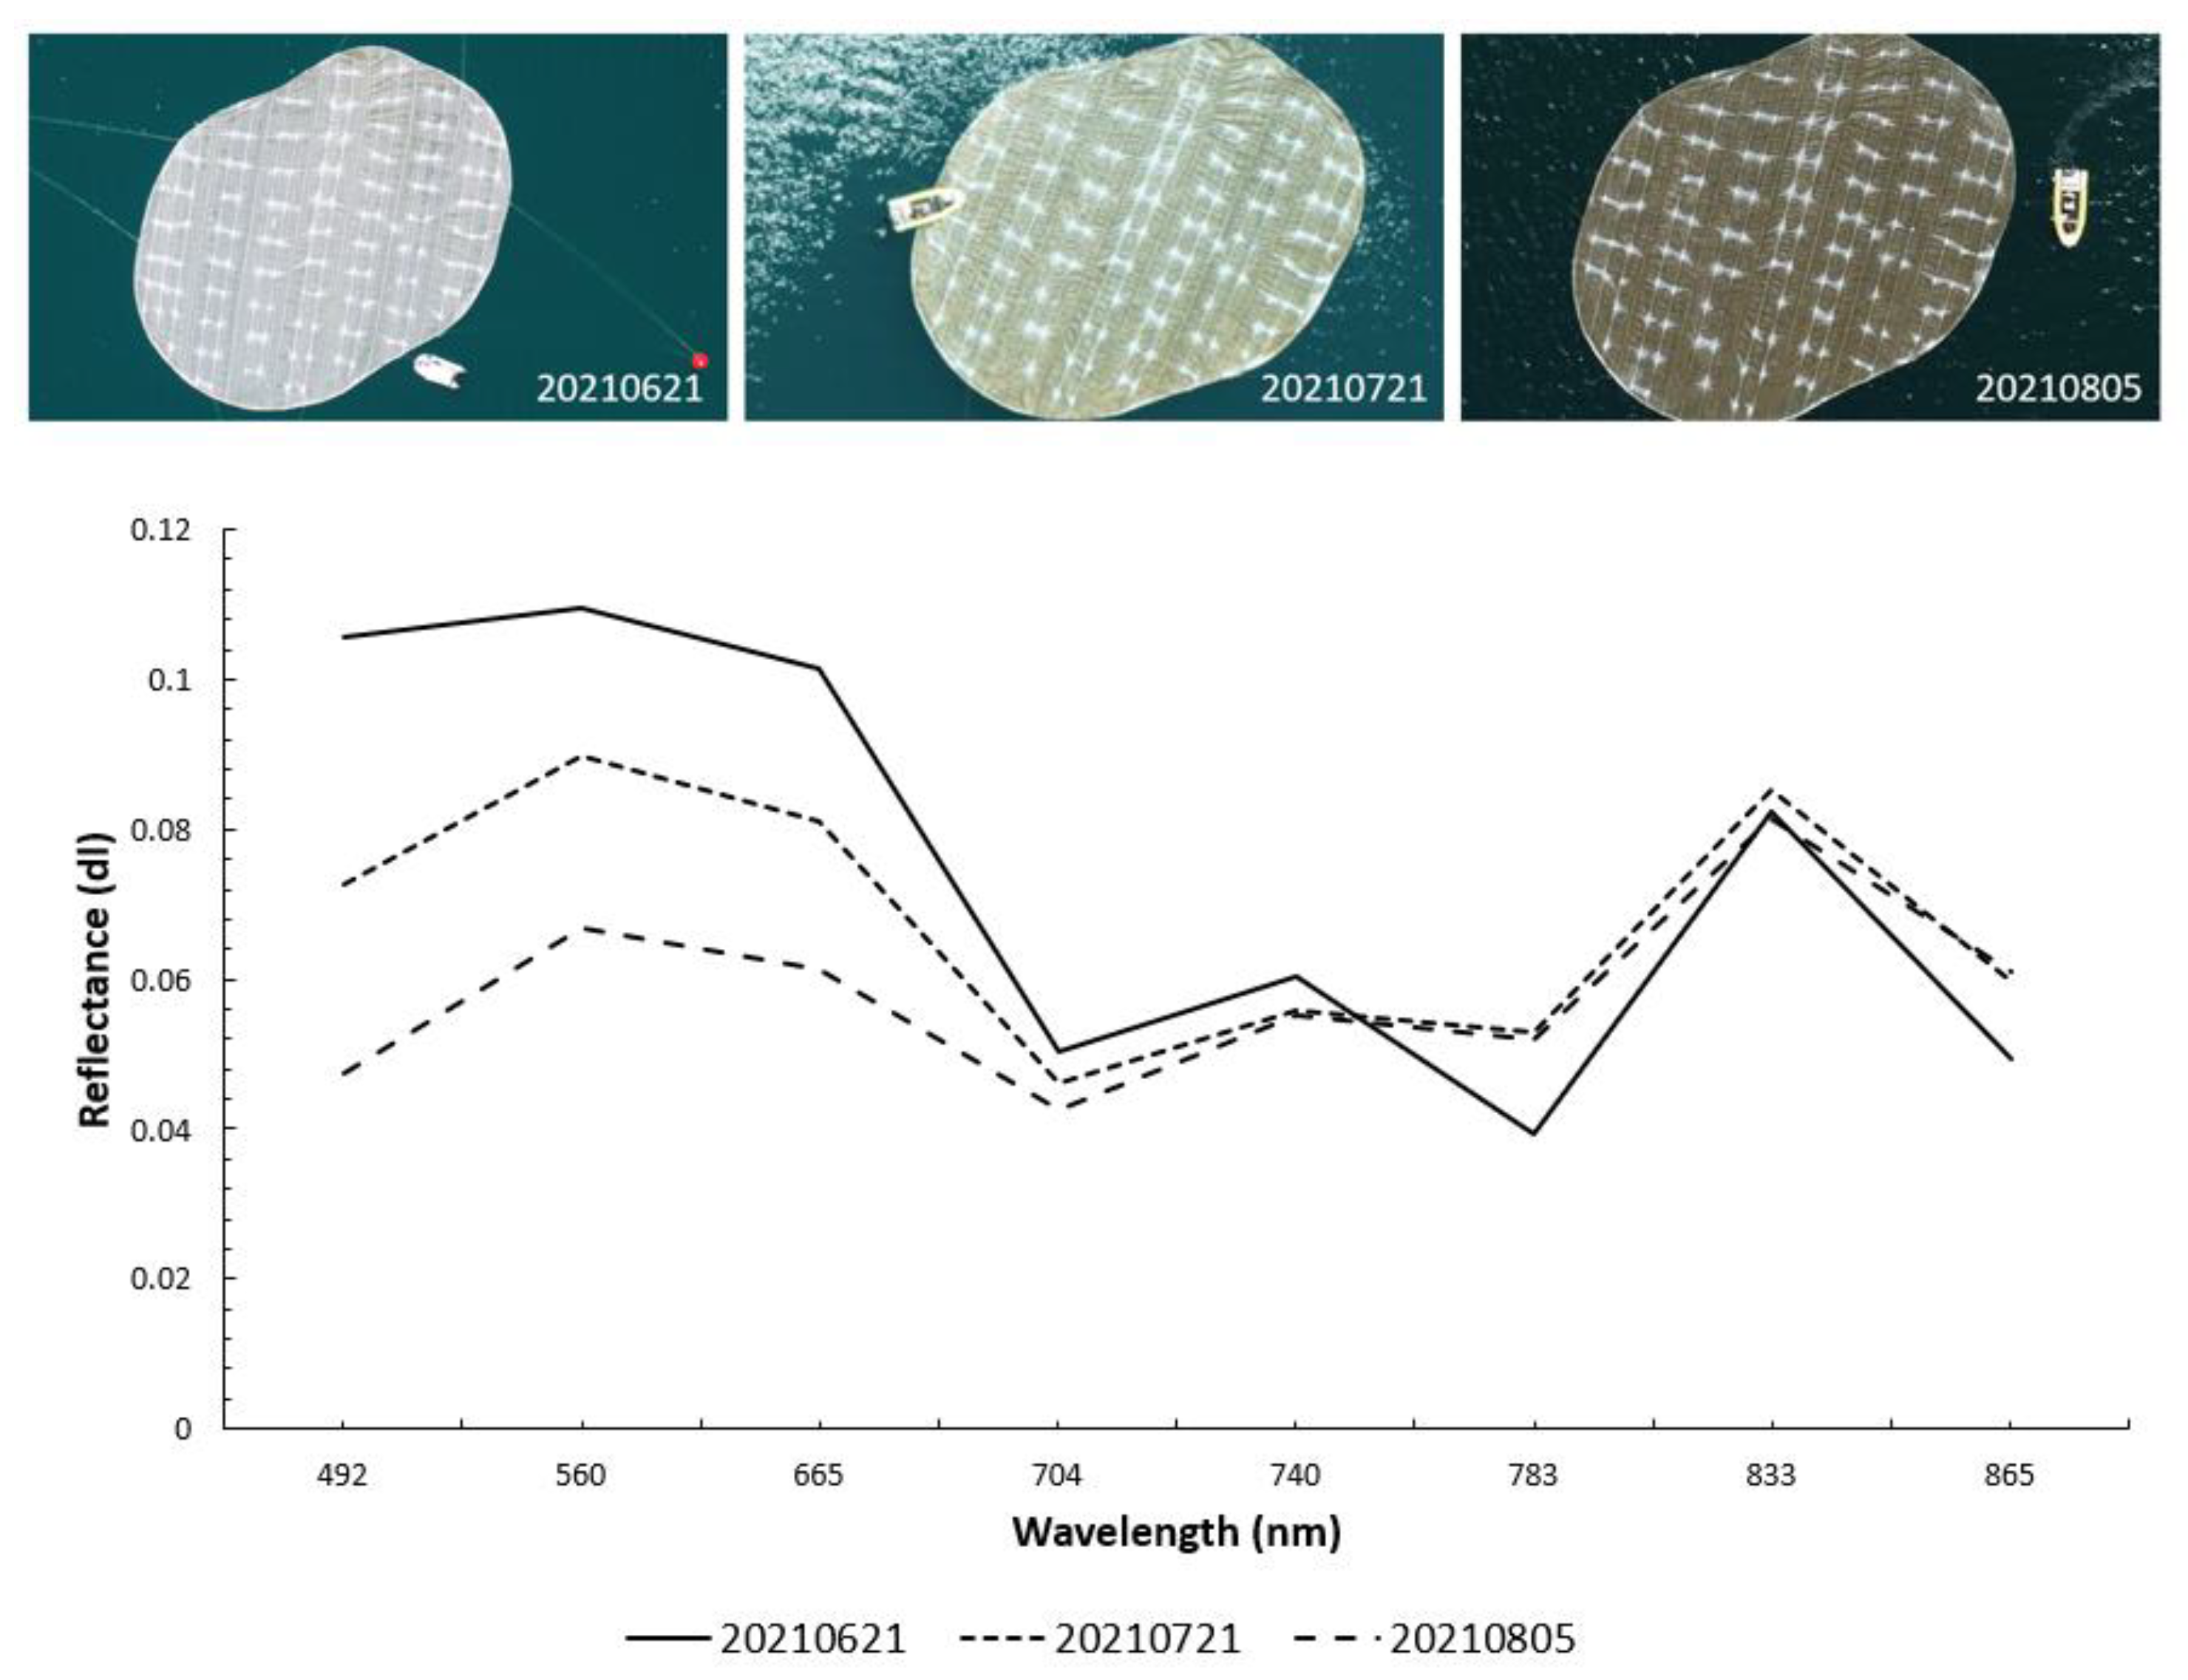
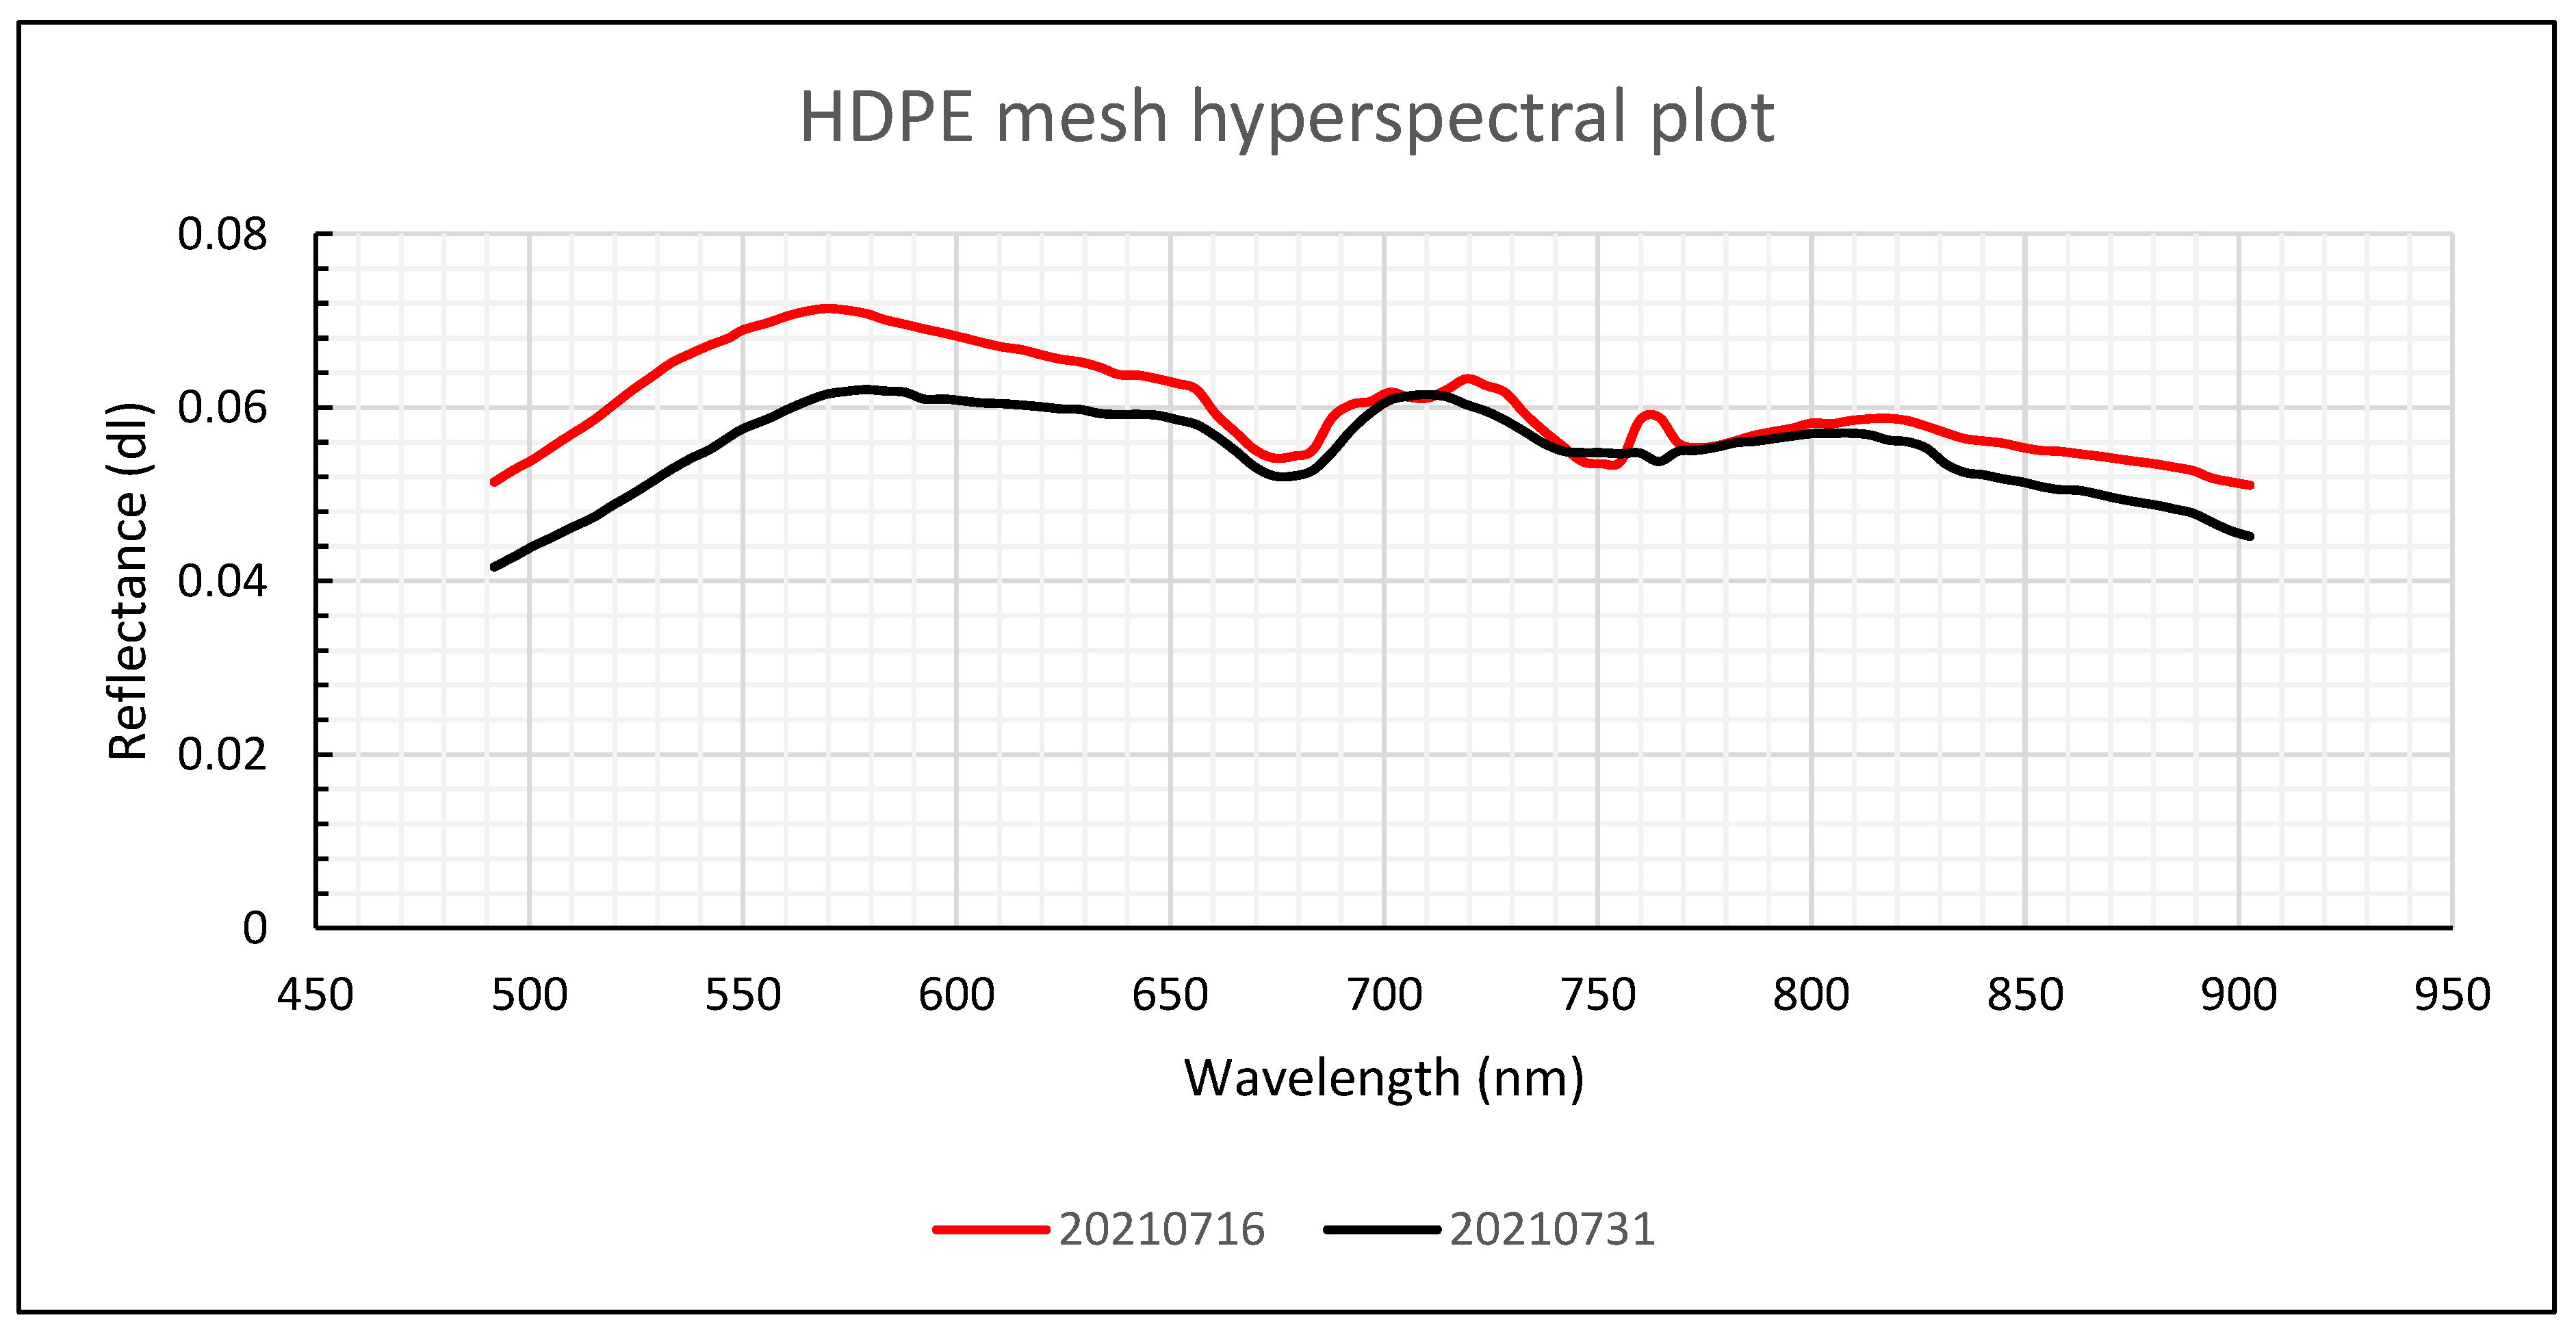
3.1.2. Biofouling Effects on HDPE Mesh Spectrum

Biofouling accumulations on the surface of floating materials are very common, especially in cases of prolonged stay in productive waters. These organic bioaccumulations that usually contain photosynthetically active substances, can affect the spectral response of the materials that they are growing on. Through the long-term deployment of the FML targets in the highly productive waters of the Gulf of Gera, we were able to acquire data for the targets with various degrees of biofouling, ranging from no biofouling accumulations up to highly biofouled. This allowed us to assess the effect that biofouling accumulations can have on the spectral response of FML that have remained on the water surface for extended periods.
Figure 7 shows the spectral plots from three acquisitions affected by different amounts of biofouling accumulations: 20210621—practically no biofouling, 20210721—moderate biofouling, and 20210805—dense biofouling. These acquisitions were chosen in an effort to isolate the biofouling parameter and not take into account the effects that other parameters may have on the spectral response of the HDPE mesh. On all three days, conditions were very similar, with low to no wind, similar turbidity, no significant submersion of the HDPE target material and similar sun glint conditions in the study area. The central pixels with no subtraction of the water background are examined here, since the abundance fraction of the mesh is such that it dominates the pixel response, hence water leaving reflectance does not significantly affect the overall pixel reflectance spectrum in the 10 m bands and we can restrict to the 10 m × 10 m pixel that is solely covered by the target material. We should note that the 20 m red-edge and NIR bands shown in the graph are distorted, and hence the resulting plot is not representative of the HDPE material. As such, for the reasons described in Section 2.5, we cannot come to any conclusion regarding the effect of biofouling on any of the 20 m bands and it should not be assumed that biofouling has no effect on the 20 m bands.
From the UAV images, it becomes evident that the increasing biofouling accumulations significantly alter the colour of the HDPE mesh from a bright white to a greenish brown. Hence, we would expect that there would be a similar change to the spectral response of the HDPE mesh target in the Sentinel-2 images, especially in the RGB range. From the three spectral plots representing different degrees of biofouling accumulations, we can see that the spectral shape of the plots is changed mostly in the RGB part of the spectrum, although retaining the upwards slope from the blue to green wavelengths and a downwards slope from the green to red. The main difference between the three different plots in the shape of the curve in the RGB bands is concentrated on a lower blue reflectance. With increasing biofouling accumulations, we see a similar curve but a diminished RGB signal of up to 50% from no biofouling to high biofouling accumulations. This corresponds partially with the absorption features of chlorophyll [45], which is consistent with the fact that the biofouling is mostly composed of green turf algae. On the other hand, we see practically no difference in the spectral response of the HDPE mesh in the 10 m NIR band between the different stages of biofouling accumulation, which is also consistent with chlorophyll absorbance features, since chlorophyll does not absorb above the 750 nm range. Resulting spectral angles between the three plots stand at 10° between no biofouling and medium biofouling accumulations, and at 18° for no biofouling and high biofouling accumulations (four-band combination—RGB and NIR).
These findings are also supported by the UAS hyperspectral data gathered on two dates with different levels of biofouling accumulation (Figure A1). The plot from the 20210716 acquisition corresponds to medium-density biofouling accumulations, while the plot from 20210731 corresponds to high-density biofouling accumulations. As with the Sentinel-2 data, we can see that with increasing biofouling accumulations, we find a signal decay in the visible part of the spectrum, but not so much in the NIR, although there is a slight reflectance reduction especially after the 850 nm range.
The HDPE mesh is generally resistant to UV radiation, compared to other plastics. However, prolonged stay under the sun in combination with the salt presence in sea water and the wave action can have weathering effects. This weathering results in surface degradation that alters the material’s spectral response. It is not clear whether the HDPE mesh was degraded enough during the 4-month acquisition campaign, but it is possible that the continuously diminishing spectral response of the HDPE mesh could be partially attributed to weathering.
The above observations are somewhat consistent with chlorophyll absorption features, although we are seeing a reduction in the green wavelength that theoretically should not occur. Additionally, although chlorophyll does not absorb in the NIR, we would expect a differentiation in NIR reflectance solely due to the fact that most of the plastic material is covered by a different substance. Nevertheless, the resulting spectral angles between the non-biofouled and biofouled target pixels show that the change in the spectral shape of FML due to biofouling could affect the detection capabilities of biofouled FML with spectral classification methodologies.

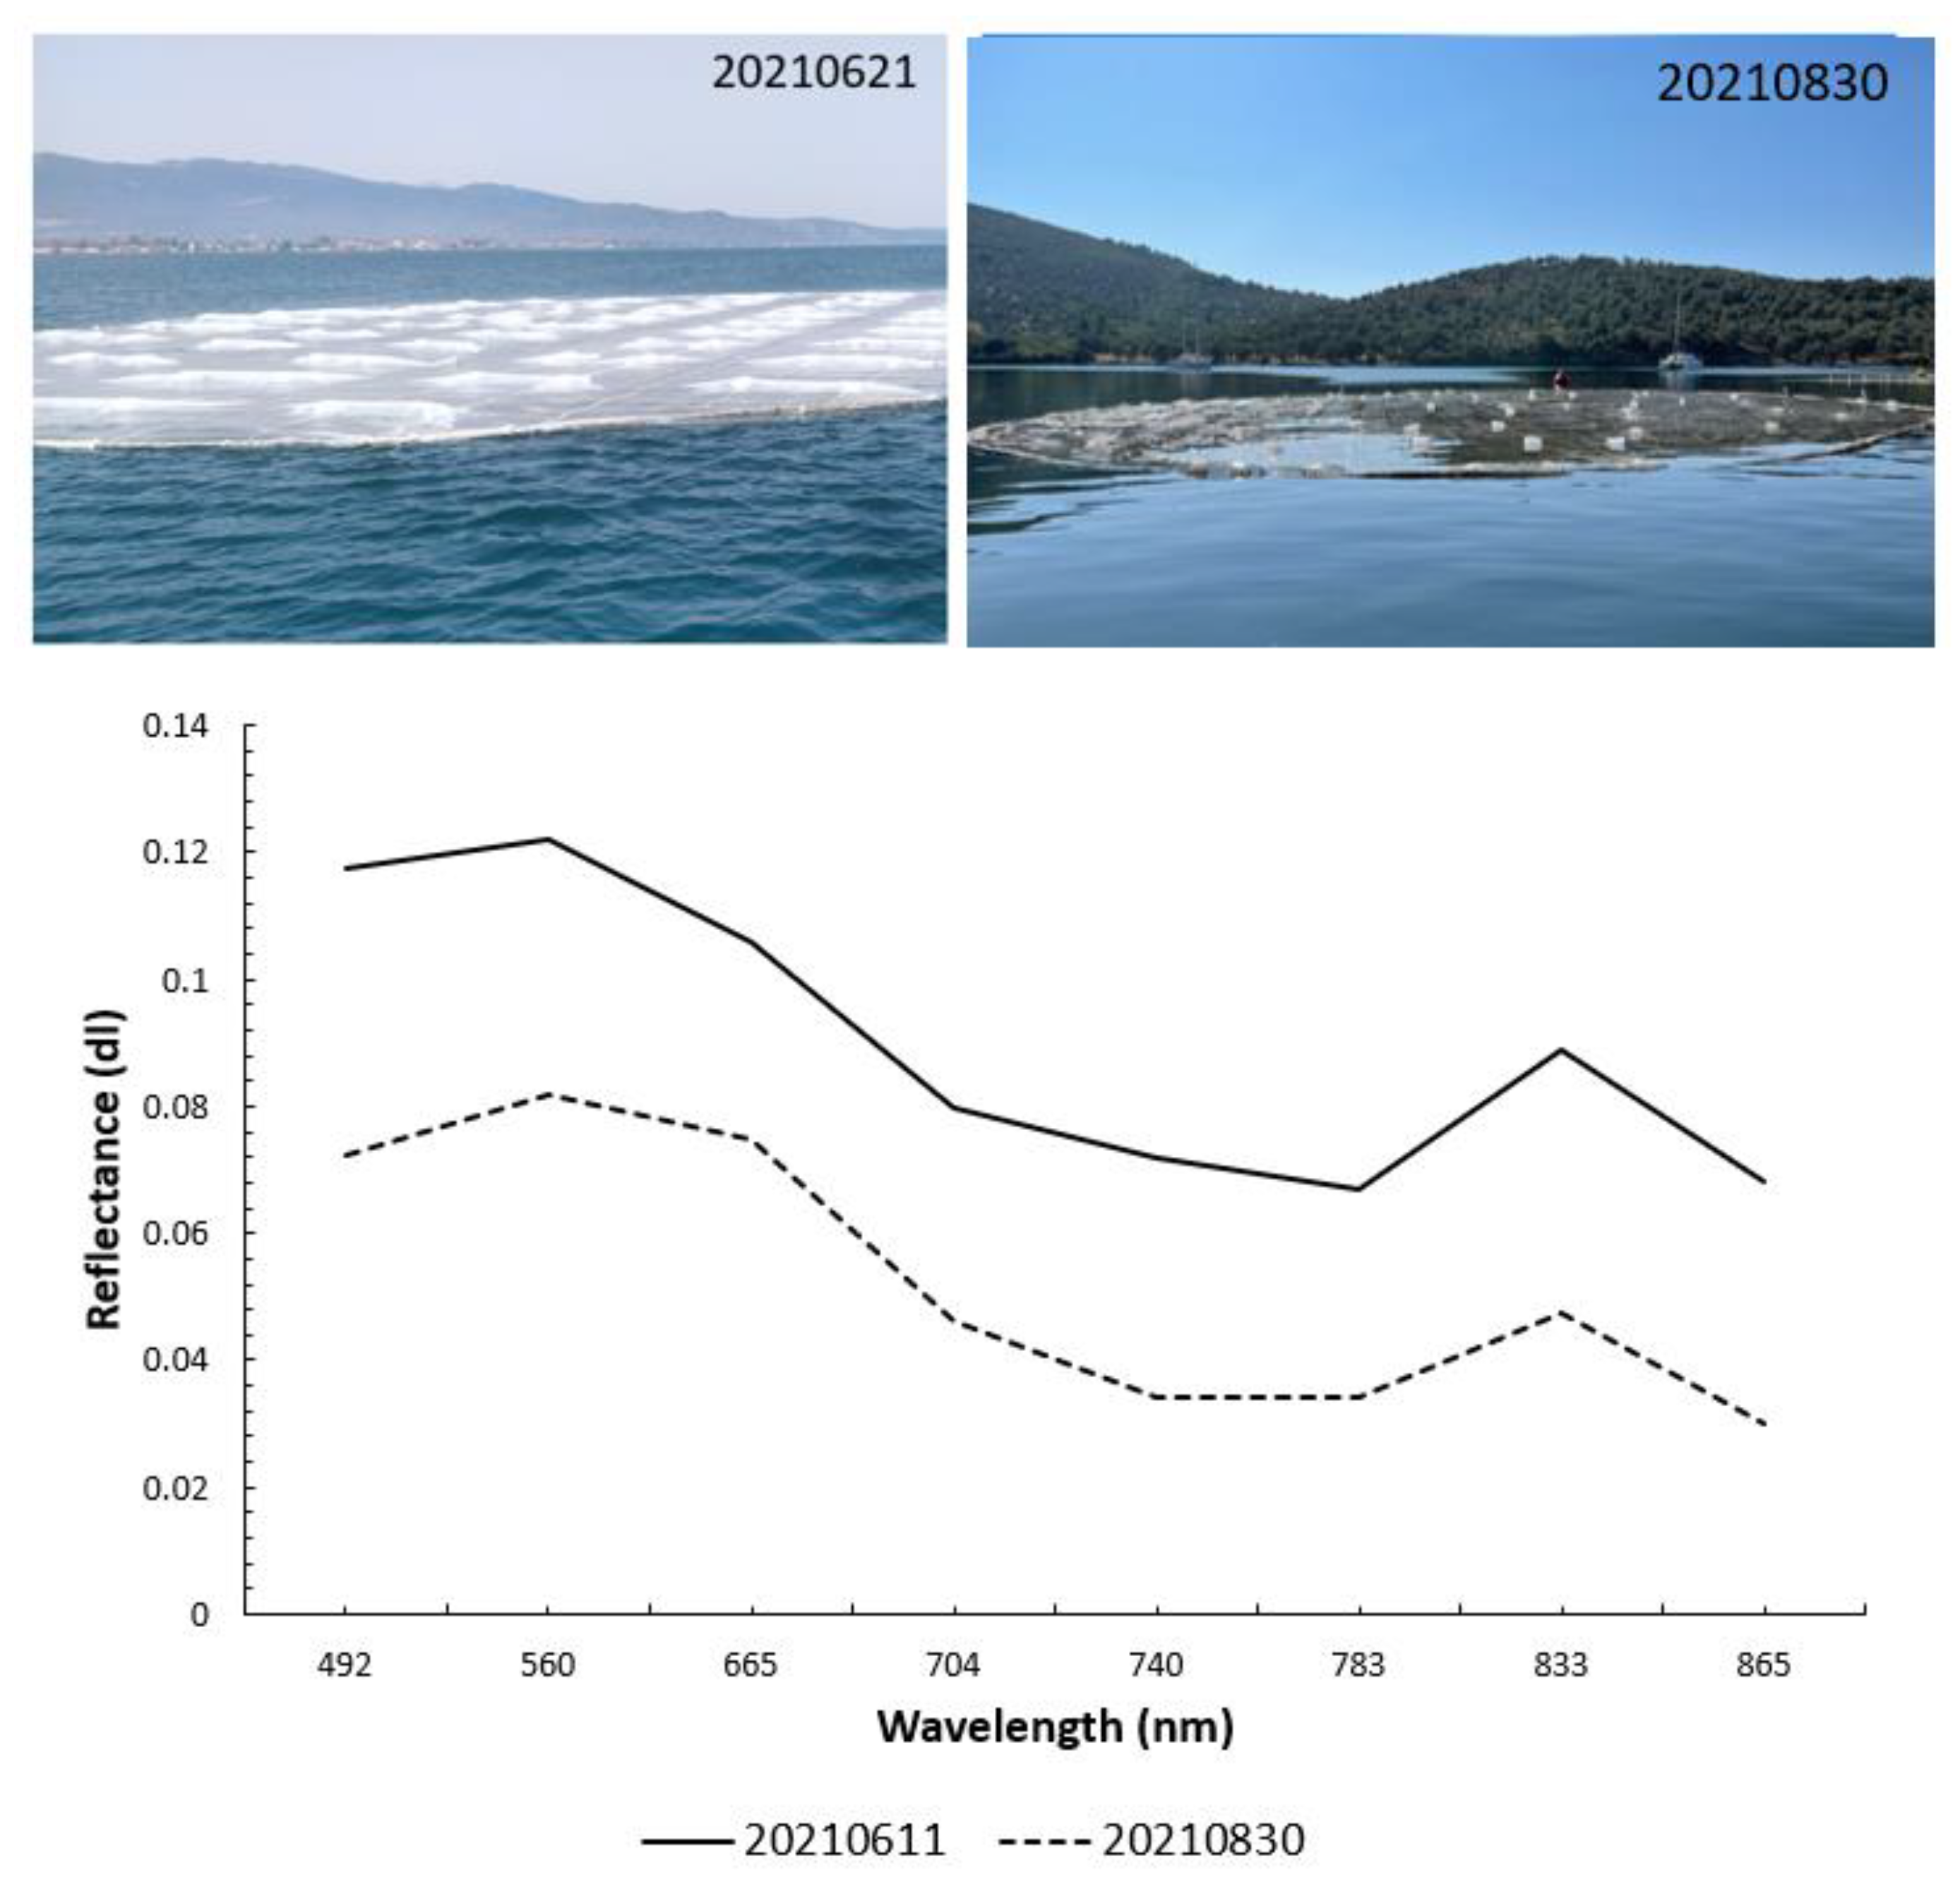
3.1.3. Submersion Effects on HDPE Mesh Spectrum

In general, wet surfaces are known to have lower reflectance values when compared to the same dry surfaces. Additionally, water absorption features especially in the NIR and SWIR parts of the spectrum, mean that submersion under a layer of water can have significant effects on the spectral response of the submerged material. The diminished signal of submerged surfaces can have a significant effect on FML detection. Hence, it is useful to examine the effect of submersion in FML reflectance under realistic and near-real conditions. During the PLP2021 acquisition campaign we have acquired images with the HDPE target at different positions in the water column; floating partially above water, to fully submerged under a variable depth of up to 50+ cm. However, due to other factors also affecting the spectral response of the targets, it is difficult to isolate the degree of submersion as the only variable. Figure 8 shows the spectral response of the HDPE target for two acquisitions on which the main environmental variable and governing factor was the depth of submersion. The mesh on the 20210830 acquisition was cleaned previously from biofouling accumulations, although a small amount of biofouling is still present on the HDPE mesh. UV degradation could have also occurred during the prolonged stay of the targets in the water. Both these factors can have affected the spectral response of the HDPE mesh; however, we believe that these effects are much less influential compared to the effects of submersion.
As shown in Figure 8, partial submersion under a water column of about 10–20 cm results in a reflectance reduction in the HDPE mesh of about 30% for the RGB bands and about 40% for the NIR band, characteristic of water’s absorption features. The 20 m red-edge and NIR bands also show a relative reduction in reflectance, however for the same reasons as above, no conclusions can be drawn for the lower resolution bands, since the abundance fraction of HDPE is not sufficient to dominate the signal.
The effects of submersion significantly impact the signal intensity of the HDPE mesh response, but the signal shape remains relatively unchanged, at least in regard to the 10 m RGB and NIR bands. These findings are generally comparative to those from studies conducted in laboratory conditions showing a similar signal decay resulting from submersion [12,15,16,17]. This overall reduction can influence the overall FML signal and capability of detection.

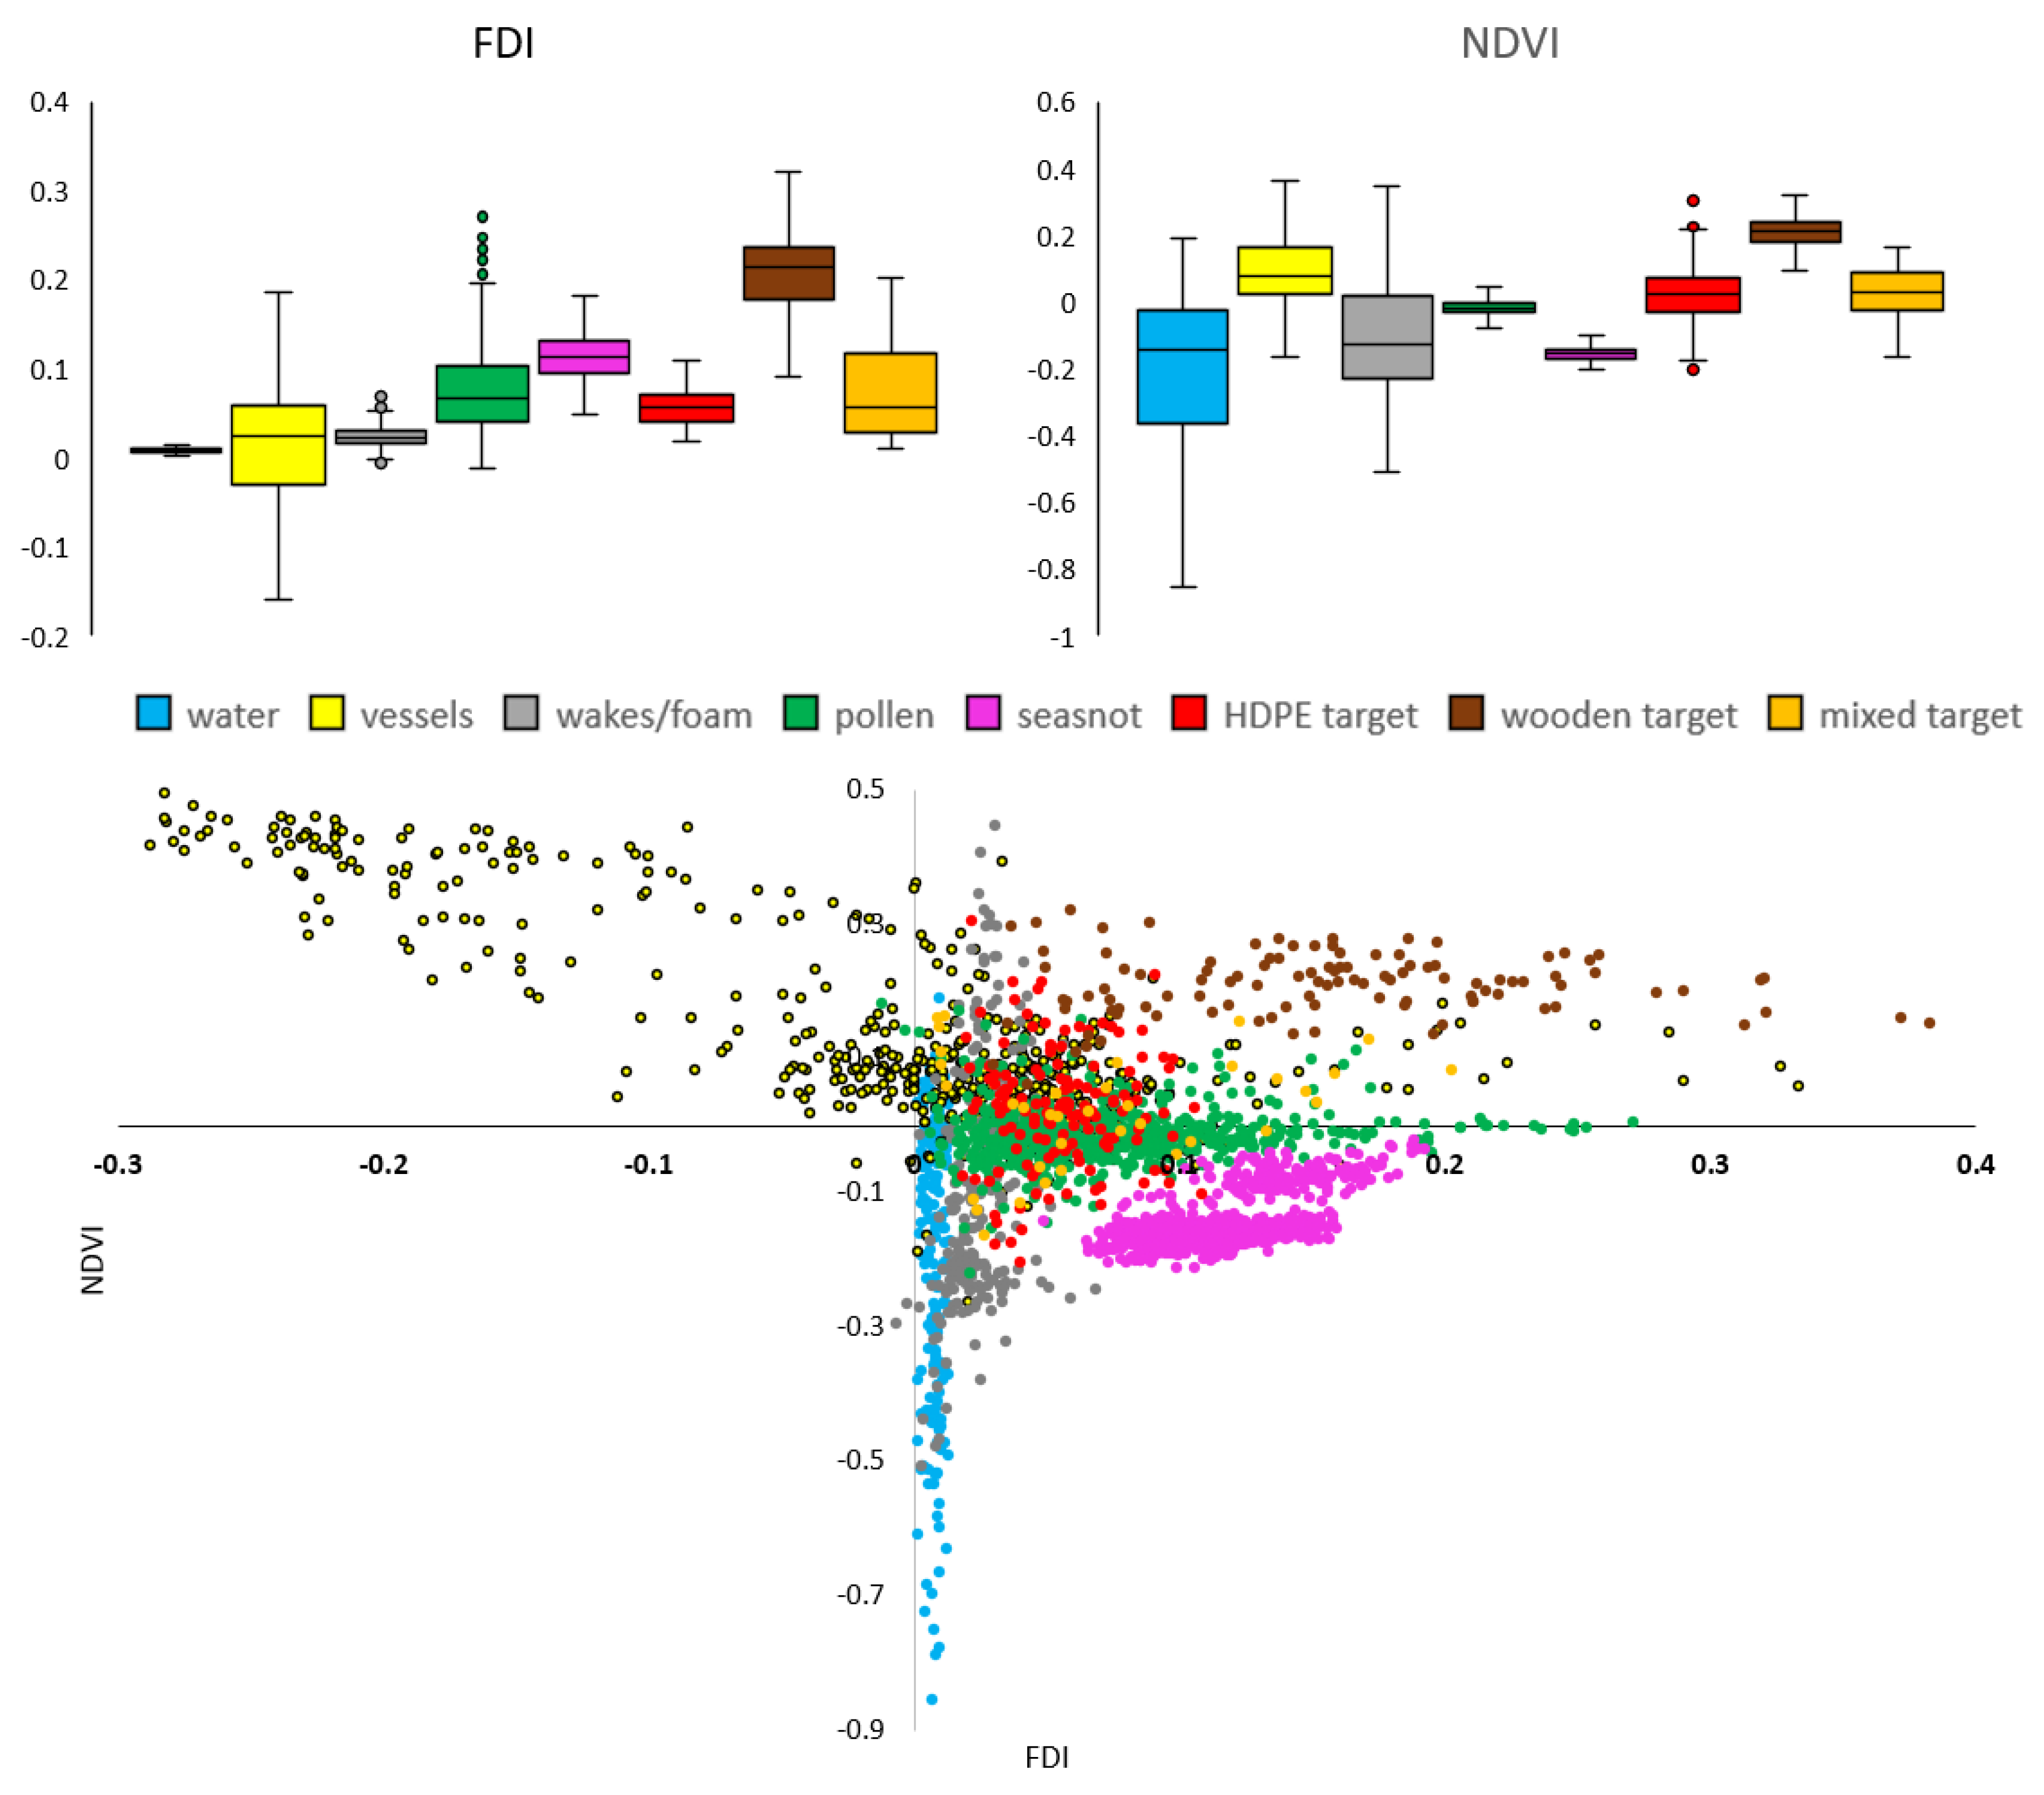
3.1.4. Spectral Indices

Spectral indices analysis is performed to assess the spectral separability of the above-mentioned classes using two spectral indices: FDI [27] and NDVI. The two indices are computed for the 22 Sentinel-2 images acquired during the PLP2021 acquisition campaign and a series of different images of surface features as presented above (e.g., marine mucilage off the coast of Lemnos, pollen off the coast of Mytilene). The spectral indices for the three PLP2021 targets (HDPE, wooden planks and mixed) are calculated for all pixels containing a target abundance fraction.
From the scatterplots, we can see that most floating materials can be successfully distinguished from water using the FDI. However, using the FDI alone is not sufficient for distinguishing between floating materials, since there is considerable overlap between the FDI values of the different classes. This is also evident from the boxplots showing the same overlap (Figure 9). The combination of FDI and NDVI can work for the differentiation of FML from specific classes such as woody floating materials, however the rest of the classes cannot be successfully distinguished in all cases using the two indices combined. Vessels can be successfully distinguished in some cases, but it is white-decked vessels that resemble FML the most, and hence cannot be successfully distinguished. Wakes and foam are also very hard to differentiate using the two specific indices. Sea snot can in many cases be successfully distinguished since it shows higher FDI values than FML, but the case of pollen is much harder. Looking at a combined FML class (HDPE and mixed target pixels), the difficulty in distinguishing the FML class from pollen and other surface materials using FDI and NDVI combined becomes apparent.

3.2. Detection of FML with Partial Unmixing

Figure 10 shows the detection results after the binary threshold has been applied on the matched filtering results from four different acquisitions on 20210621, 20210805, 20210830 and 20210904. These acquisitions were chosen to represent four different cases: target floating with no biofouling accumulations, target floating with dense biofouling growth, target partially submerged and mixed target configuration. The results shown are those obtained using the unmixed signature as an FML endmember, in a four-band combination: RGB and NIR. The mean central pixel and background subtracted HDPE signature yielded similar results, but the unmixed signature corresponds to better thresholding.
In the 20210621 image containing both the HDPE mesh and wooden planks target, six out of the nine HDPE target pixels are effectively detected, although the pixels that are not detected have abundance fractions that are less than 20% (this is an approximation based on the mesh’s coverage and effective target area). It is possible to increase the number of detected pixels, however the applied thresholds (0.3 binary threshold) are set so that the number of false positives is greatly reduced.
The detection implications due to the different spectral shape resulting from the biofouling accumulations becomes evident in the 20210805 detection results, where only a single FML target pixel is detected from the partial unmixing methodology. This was expected since the relatively large spectral angle between the non-biofouled and biofouled HDPE indicated lower spectral similarities between the two.
The partially submerged target in 20210830 can also be effectively detected, without false detection of the wooden planks target. Sailing boats anchored near the deployment area are partially classified as FML-containing pixels.
The mixed material target configuration in 20210904 can be detected using the HDPE signature. This shows that the partial unmixing methodology can be applied using the HDPE/FML signature acquired through PLP2021 for the detection of mixed floating debris aggregations.
Generally, after applying a buffer to the dense cloud mask and having eliminated commission errors due to shallow waters through the extended land mask, the vast majority of the remaining false positives are vessels and wakes/foam. Although vessels are generally falsely classified, the colour of the ship’s deck seems to be a defining factor, since most large cargo ships with red decks were not classified as FML, while smaller white-decked vessels are falsely classified as FML-containing pixels.
In order to assess the effectiveness of the detection methodology under natural scenarios, the algorithm was applied on verified FML aggregations. Figure 11 shows the detection methodology applied on validated FML concentrations off the coast of La Gonave Island in Haiti, taken from the MARIDA dataset [23]. To the best of our knowledge, these floating accumulations mostly consist of plastic floating debris. The applied methodology can effectively be used to detect a large number of pixels from the FML windrow with a small number of omission errors (Figure 11).
As shown in Section 3.1, a variety of floating matters have spectral characteristics very similar to those of FML. Figure 11 above shows the partial unmixing results when applying the detection workflow on known accumulations of sea snot. Results show that the methodology can successfully discriminate sea snot pixels from FML aggregations. However, an approaching vessel and its near wake are classified as FML. Increasing the applied threshold can effectively discard these surface features, but that would also result in much lower accuracy in terms of FML pixel detection, with many more omission errors.
Pollen, on the other hand (Figure 11), is harder to eliminate by using the same thresholds that apply to FML detection under different band combinations. Even though most of the pollen pixels are not falsely detected as FML, the denser pollen accumulations cannot be successfully discriminated. This is in conjunction with the spectral similarities between FML and pollen established earlier and show that pollen accumulations can be a significantly confining factor in terms of FML pixel classification.

4. Conclusions

This paper presents the acquired data and analysis results from the Plastic Litter Project 2021, a data acquisition campaign using artificial floating marine litter and debris targets. A series of main findings can be summarised from the analysis and processing that was performed:
  • Biofouling seems to affect the spectral response of FML concentrations mainly in terms of signal intensity and shape in the RGB part of the spectrum. The NIR bands do not show any significant effect of biofouling in these parts of the spectrum. The shape of the HDPE spectral response is affected by biofouling accumulations to a significant degree. These findings correspond with the absorption features of chlorophyll, although we do not see a stable reflectance on the green part of the spectrum. Further study is required in order to better understand and quantify the effects of biofouling, as well as the characteristics of the specific organisms involved.
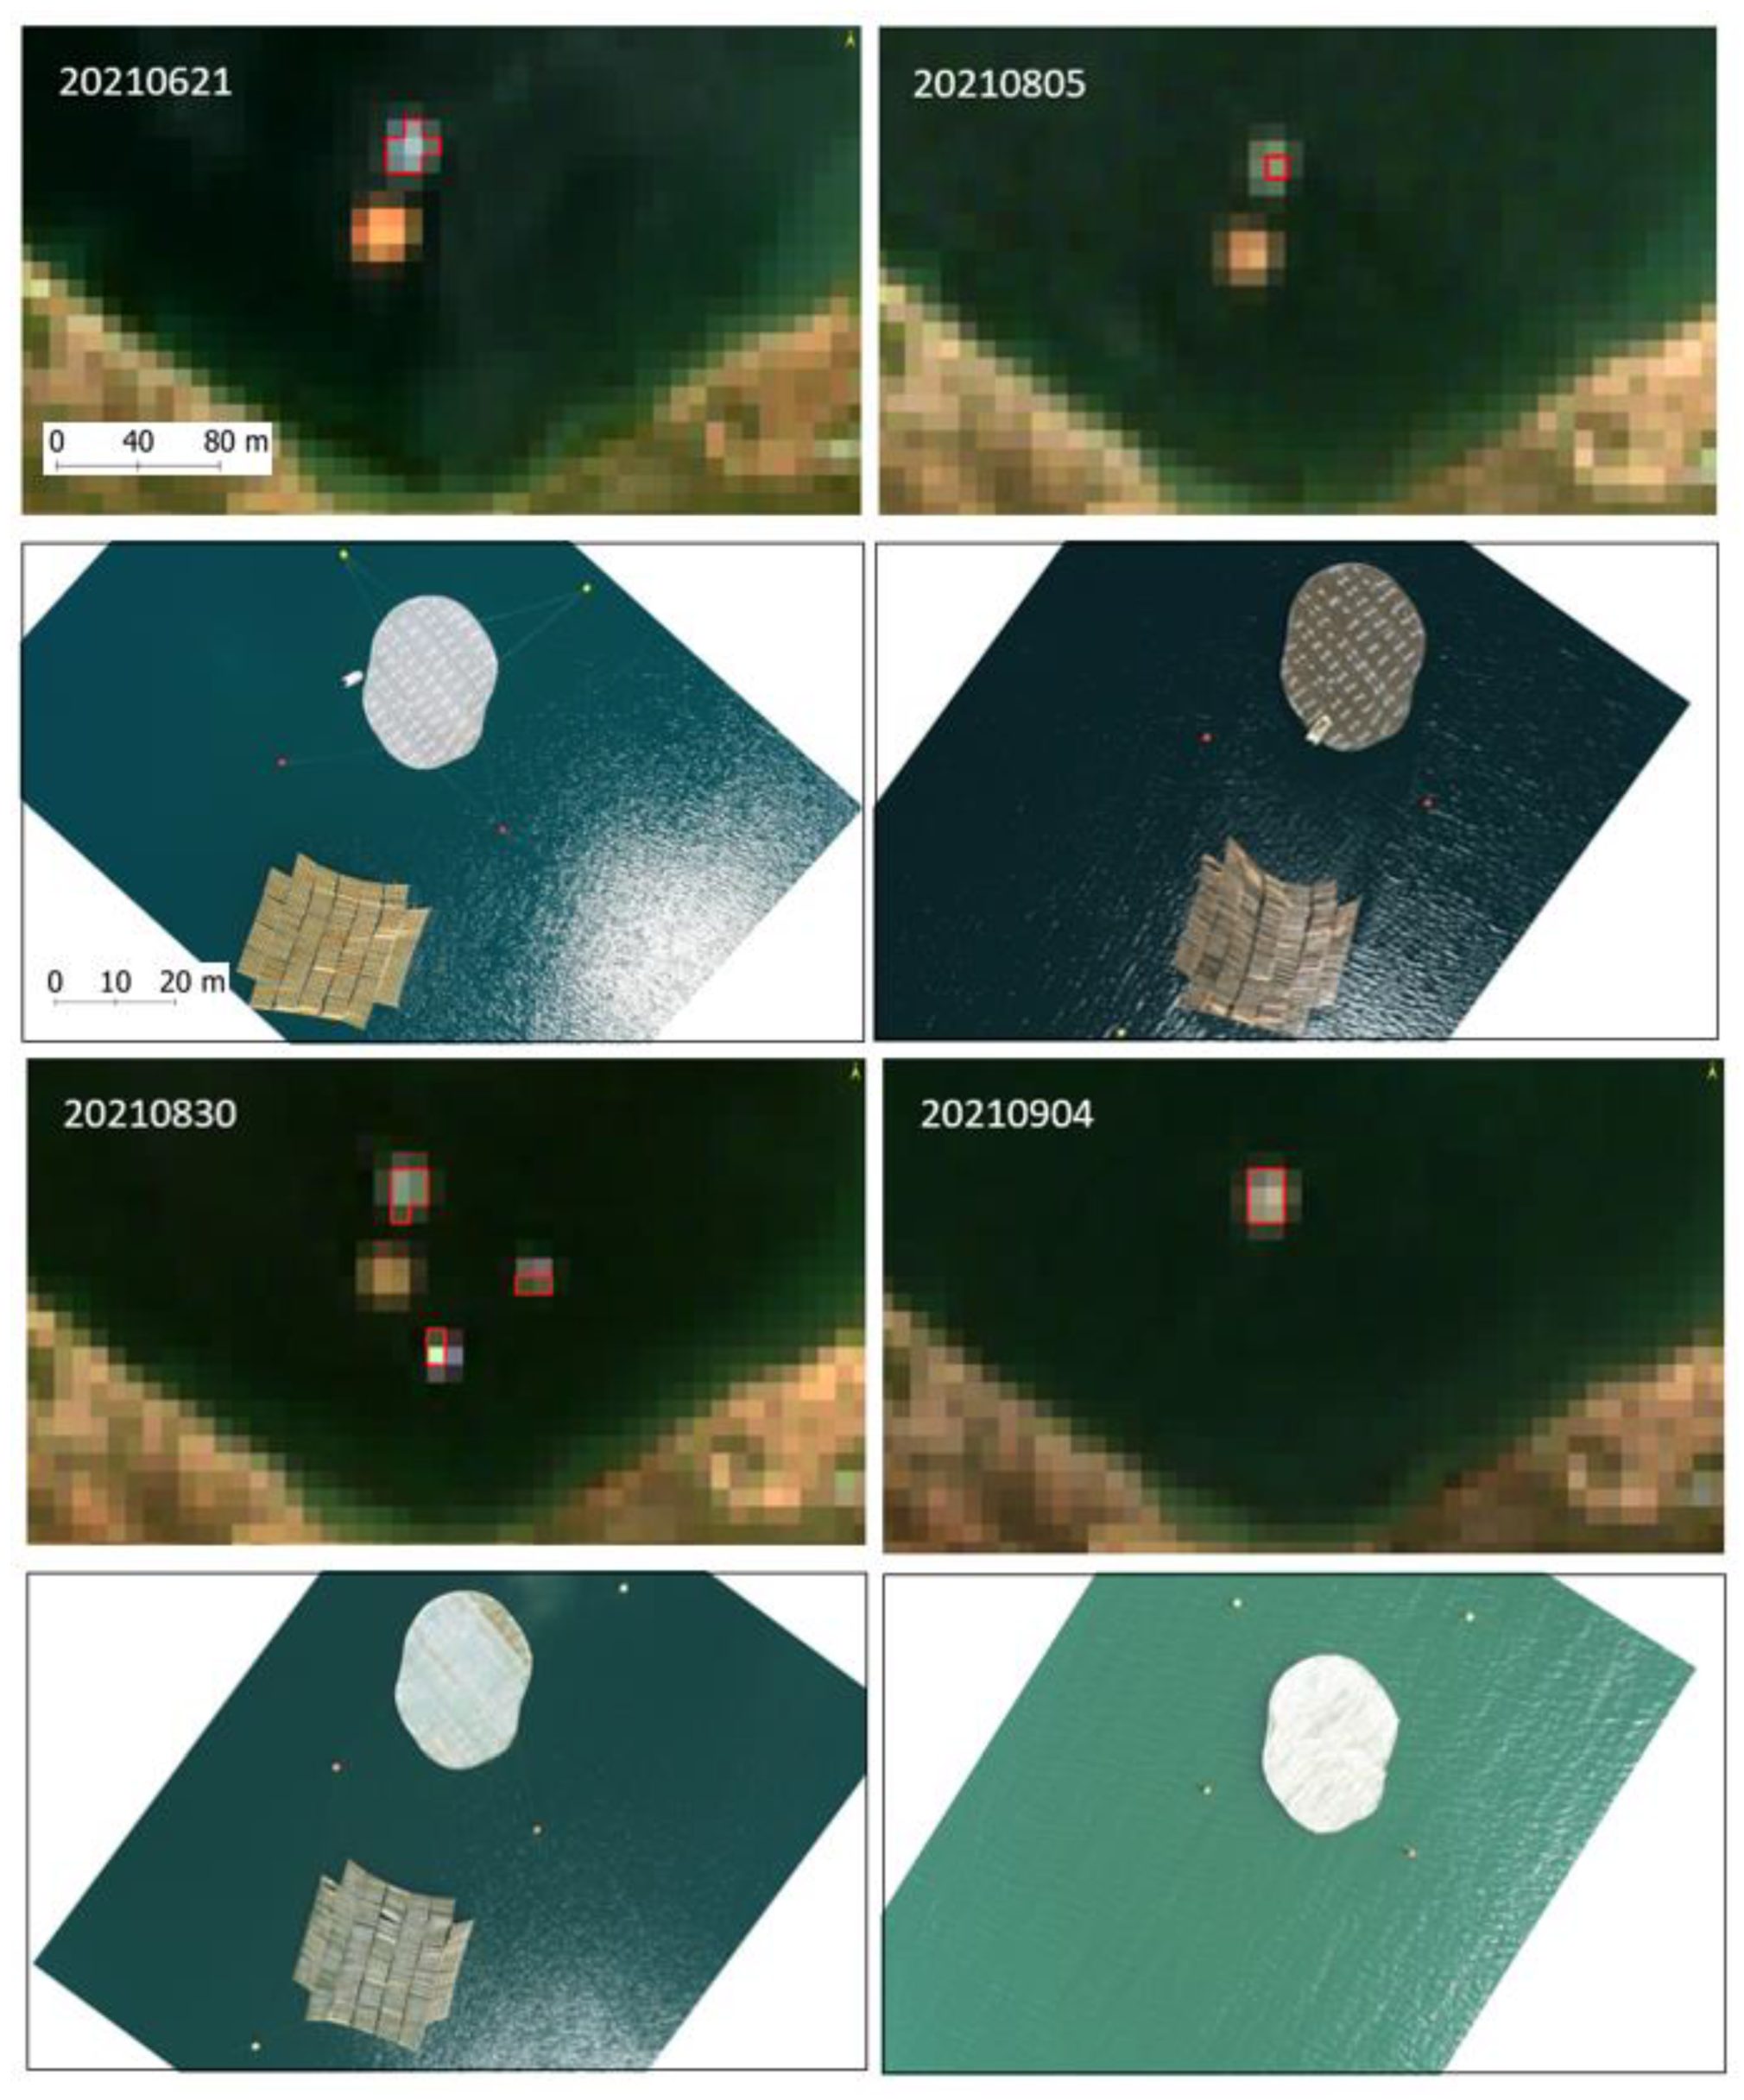
  • Submersion depth significantly affects the reflectance of the HDPE mesh target. A submersion of the target in the scale of 20 to 30 cm below the water surface results in 30–40% of signal decay throughout the visible range of the MSI’s sensor, with greater impact on NIR bands. Such signal decrease could have implications for the detection of FML, since FML accumulations are very often partially or fully submerged under the water surface, in some cases to depths much greater than 30 cm. However, using the partial unmixing methodology, it was possible to detect partially submerged target pixels.
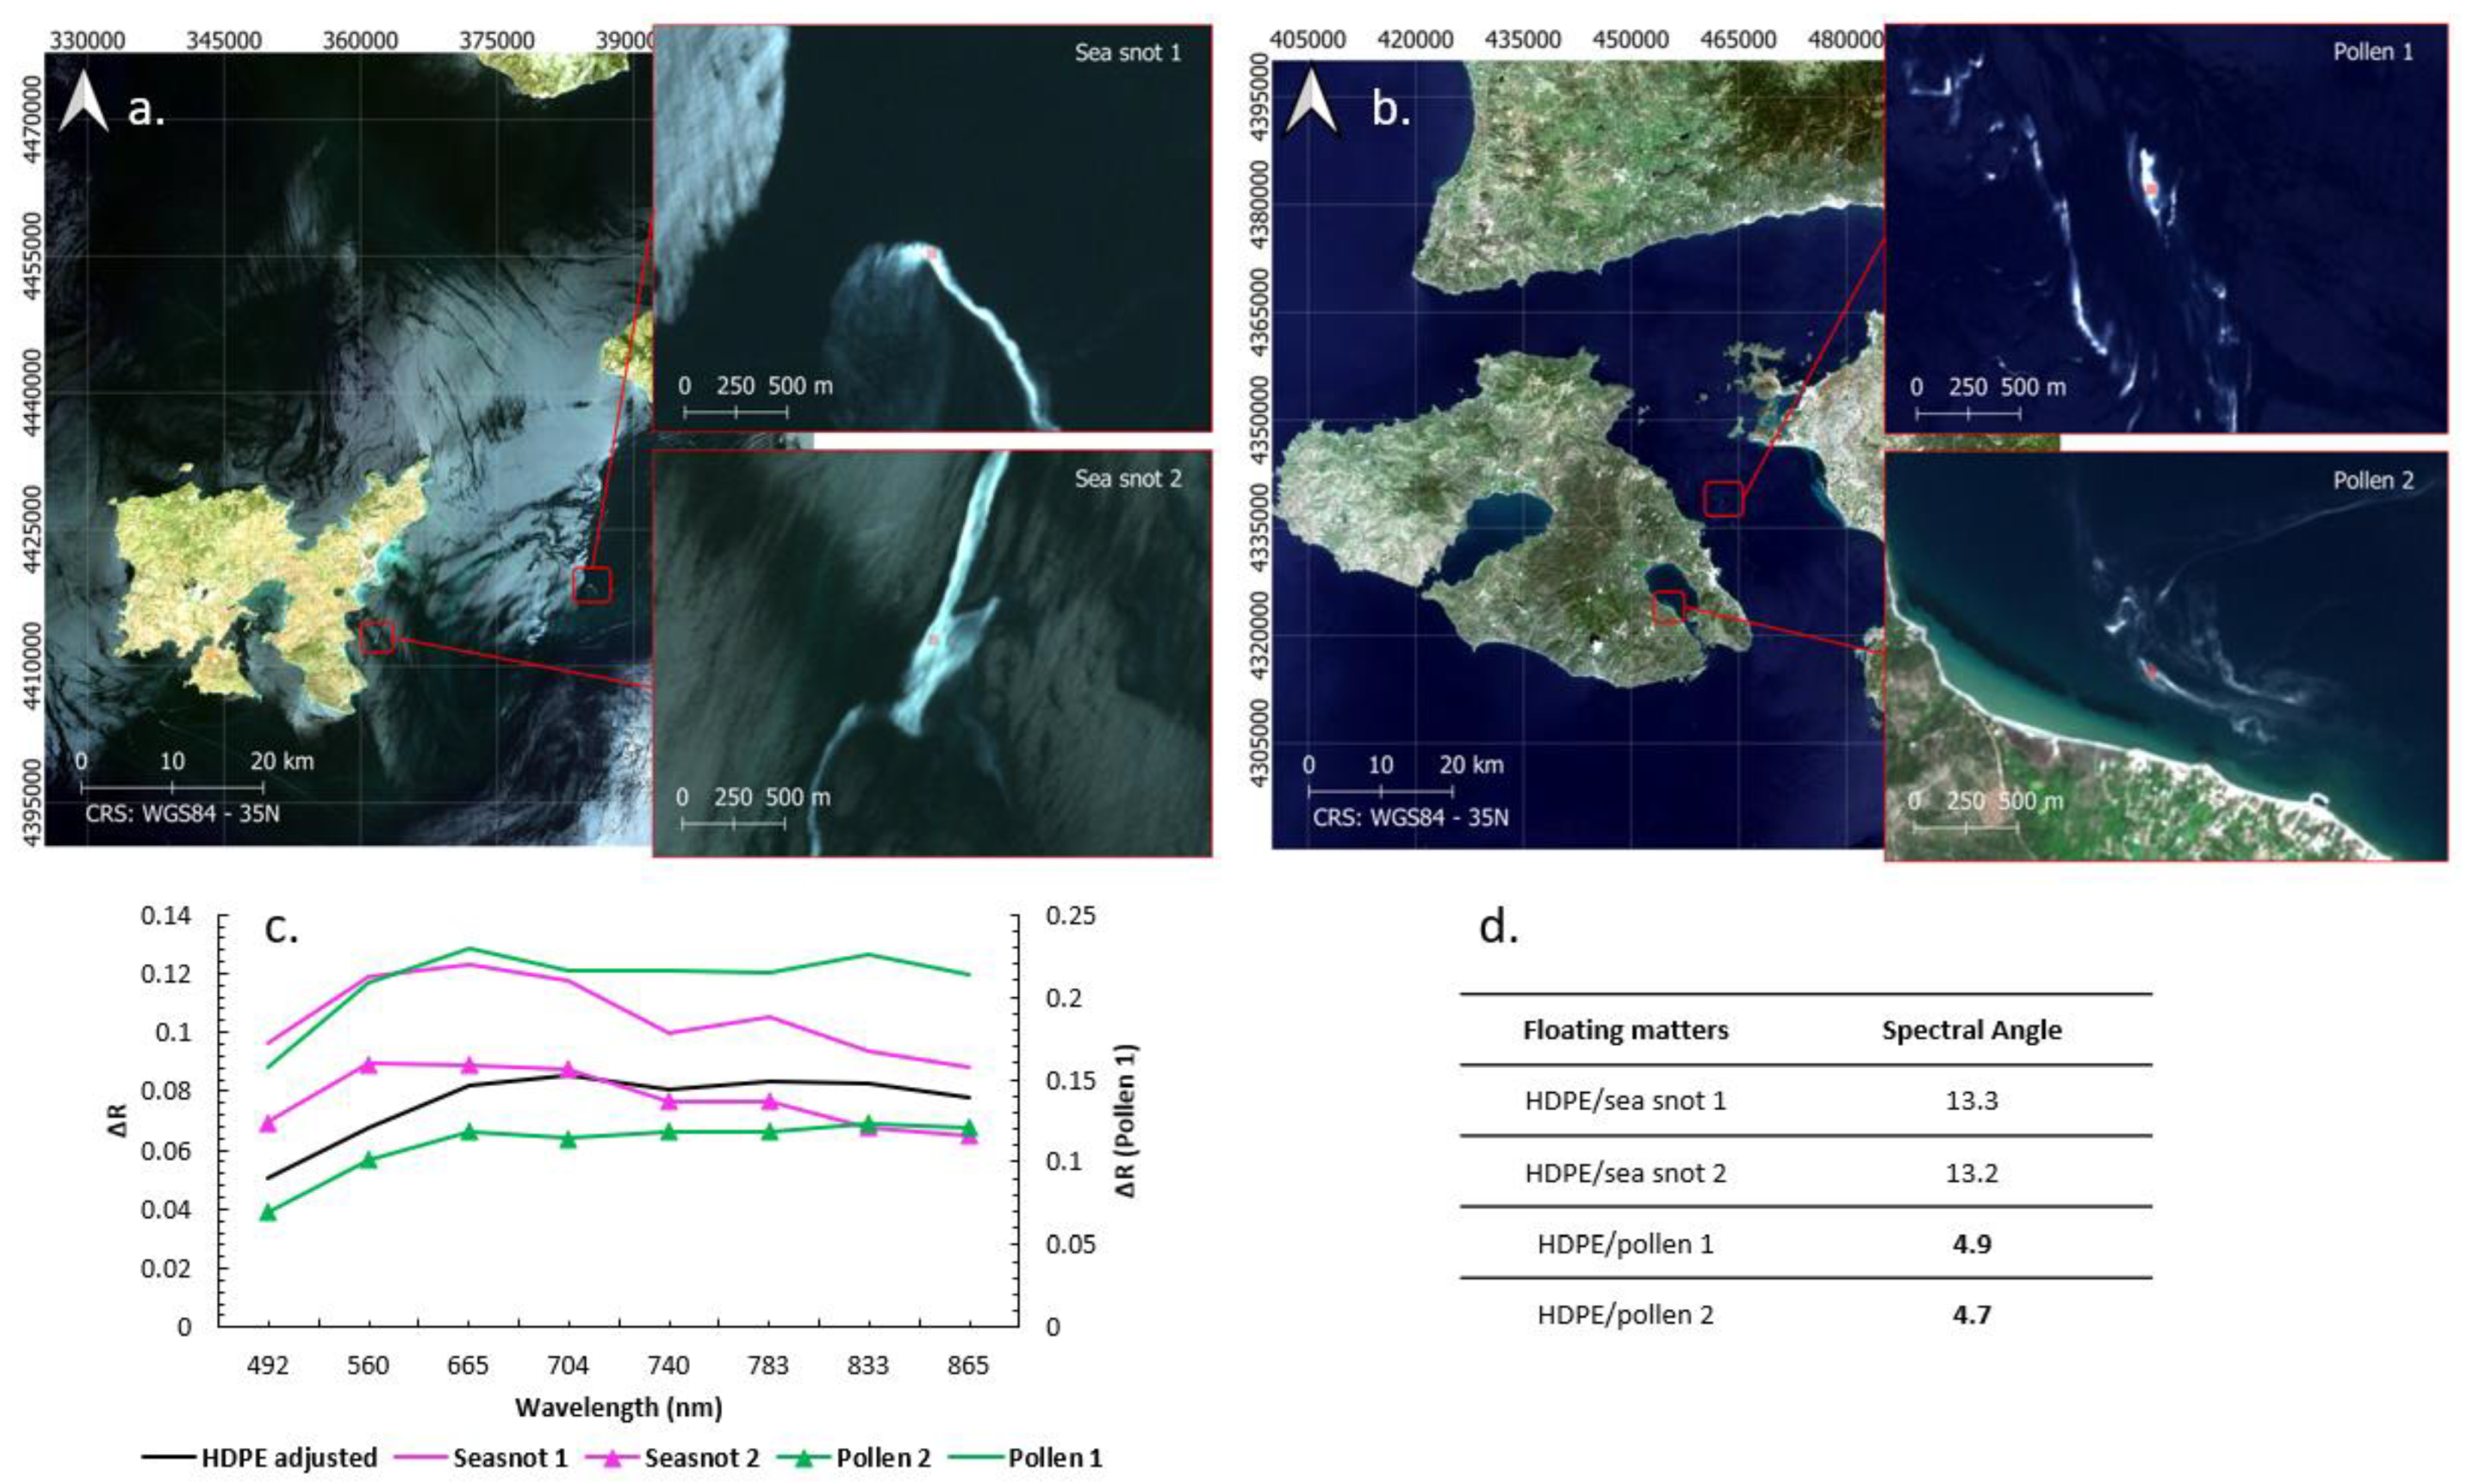
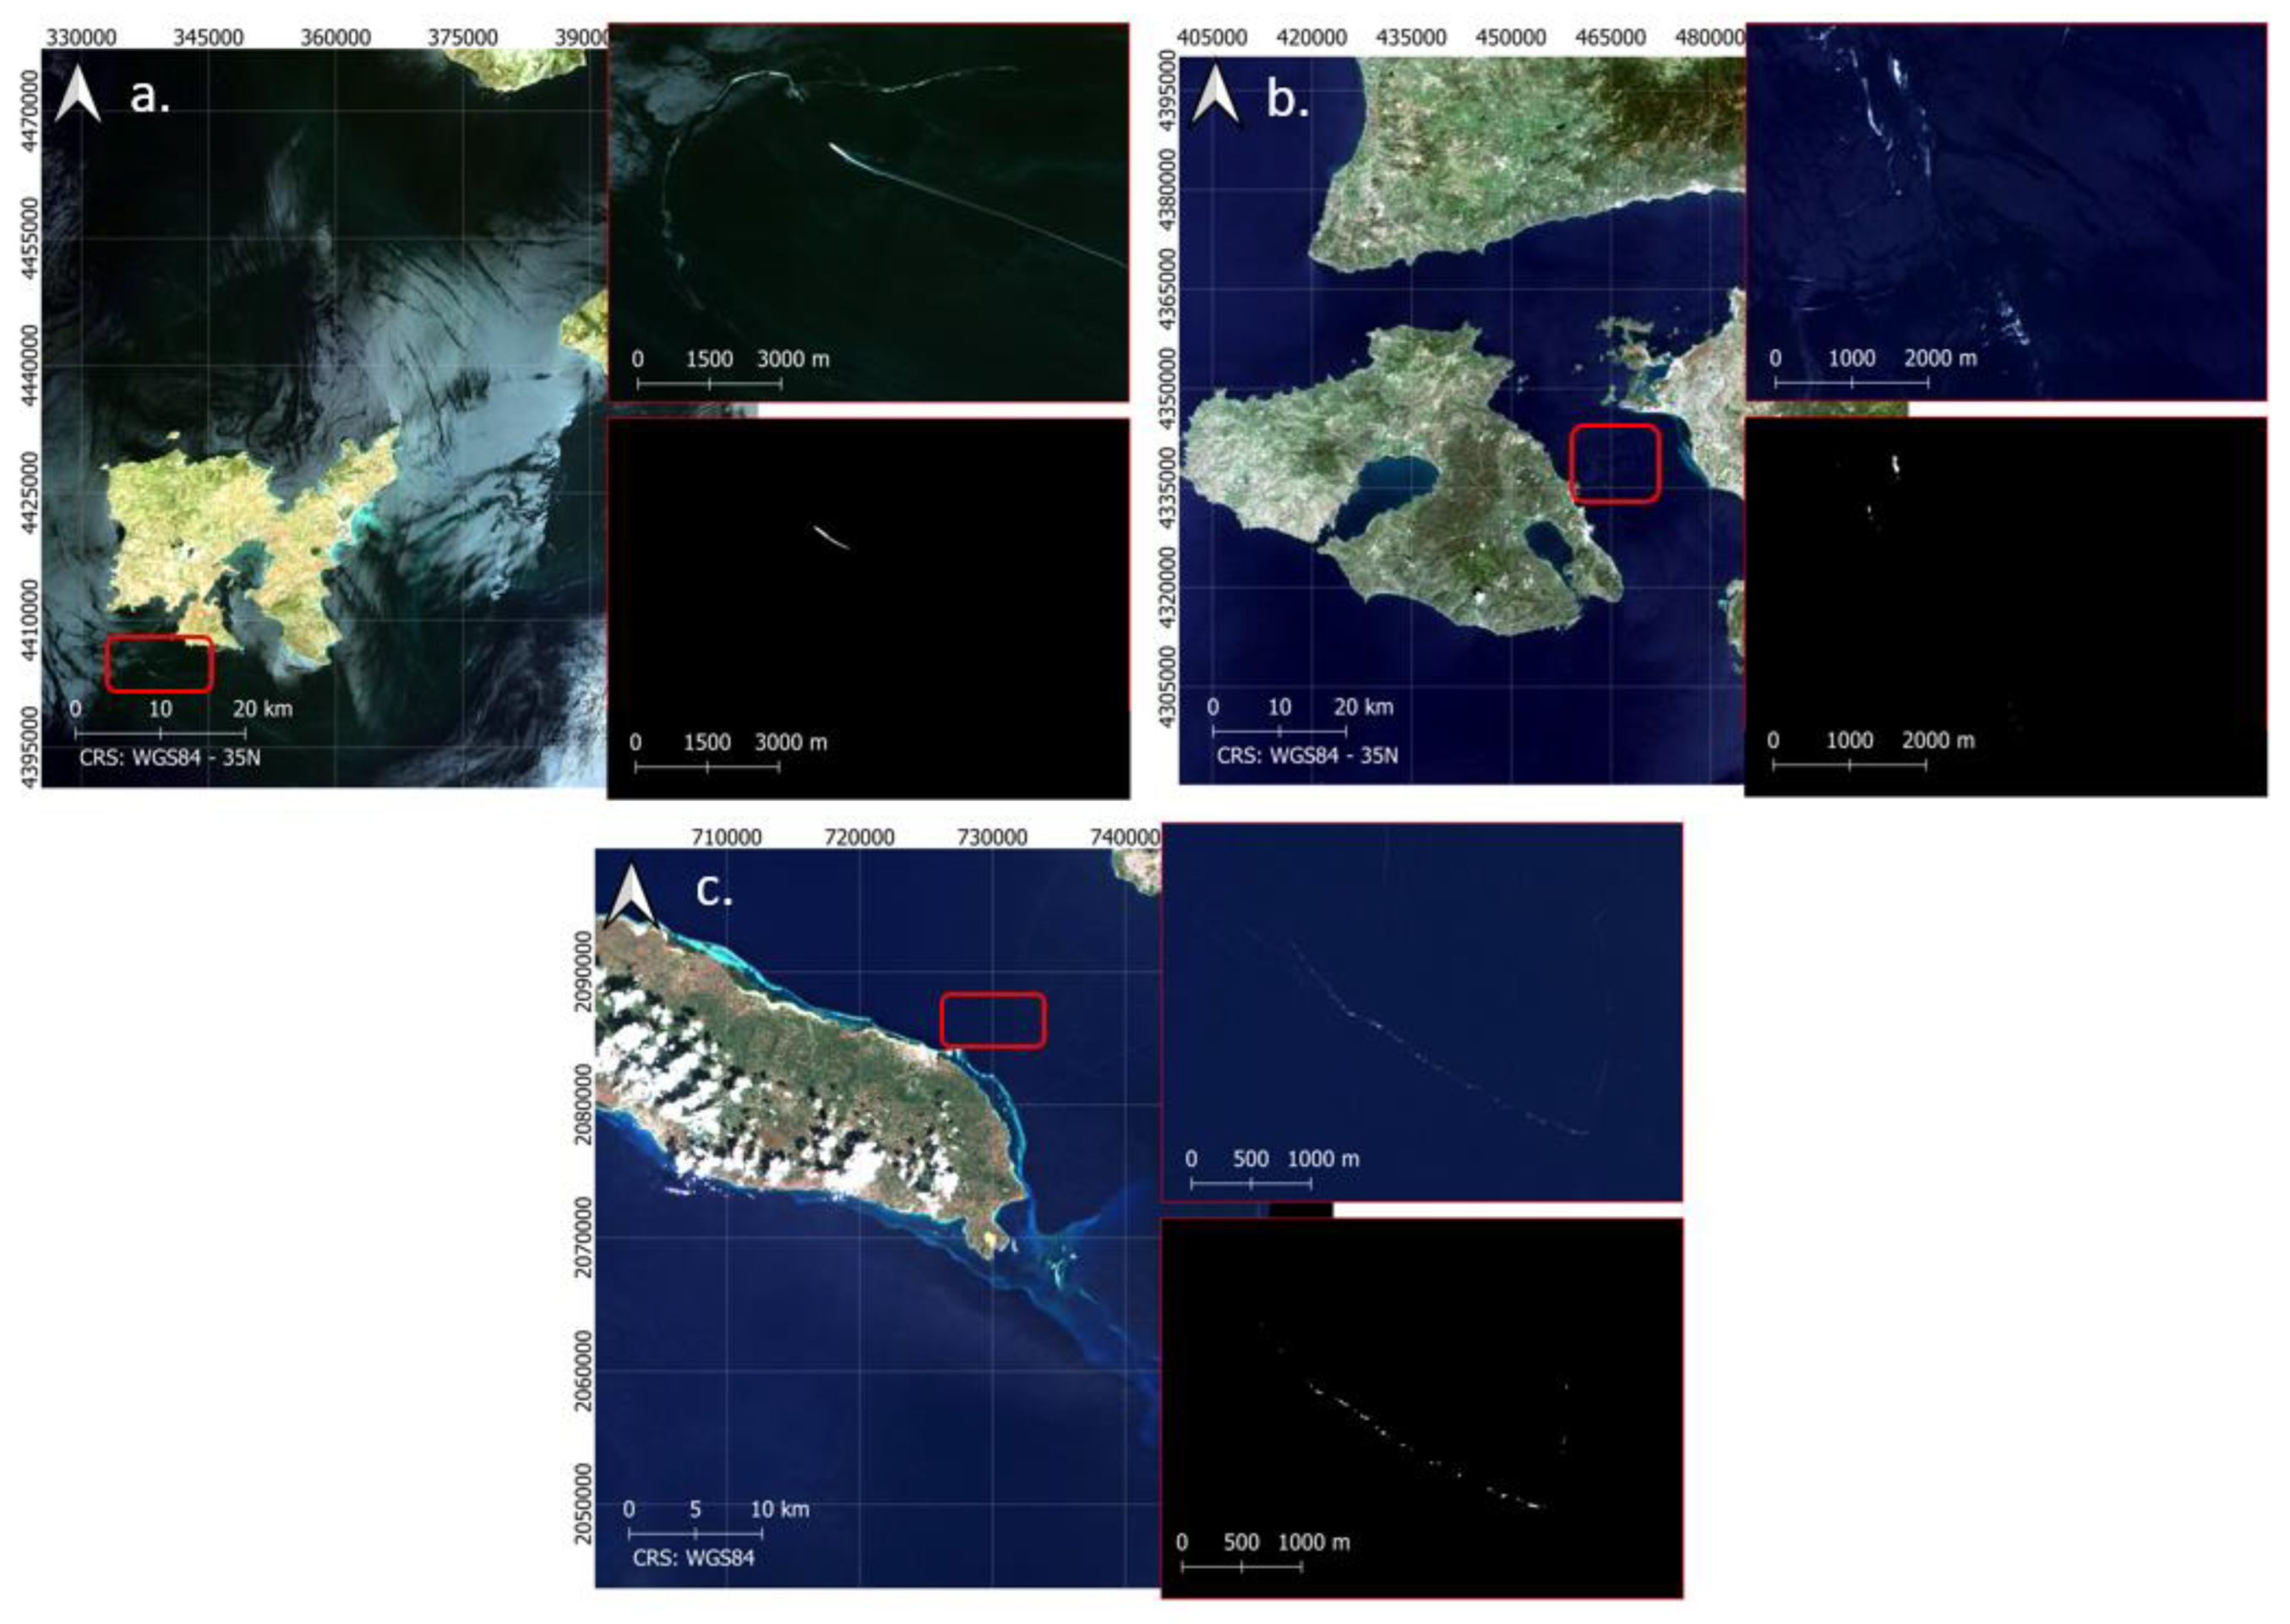
  • Floating materials such as pollen and sea snot, as well as wakes, foam and vessels have spectral features comparable to those of FML, with spectral angles between the different spectra that show significant similarities. Pollen is specifically hard to discriminate and presents an important constraining factor when it comes to FML pixel classification.
  • FML detection using partial unmixing methodologies with ACOLITE atmospherically corrected Sentinel-2 data is generally possible under reasonable conditions, with a minimum estimated abundance fraction of lower than 20% being detectable.
  • Other floating features such as pollen, vessels and vessel wakes are hard to discriminate from FML using the proposed algorithm since they have very similar spectral characteristics to those of FML.
In order to better understand the effects that the above-described parameters have on the spectral response of FML, further study is needed into the effects of biofouling and UV degradation that might occur during prolonged stay of plastic marine litter in the marine environment. Precise identification of the biofouling organisms can help to identify the biological characteristics of these organisms and better understand their effect on the spectral response of FML. Although the biofouling organisms are specific to the area in which they are found, spectral samples before and after target deployment can allow the assessment of UV degradation effects. Besides biofouling and submersion, one of the initial goals of the PLP2021 was the assessment of the influence of turbidity and wind speed on the overall signal of FML. Due to an inability to isolate these parameters in different acquisition dates, it was not possible to effectively assess their effects. Simultaneous acquisitions in turbid and open water conditions under comparable atmospheric conditions could allow for the assessment of the effects of turbidity on the spectral response of FML. Additionally, acquisitions under different wind conditions but limiting other parameters’ influence can allow the assessment of wind speed on the signal of FML. However, since white water has a bright signal similar to FML, high winds would most likely result in water pixels exhibiting spectral characteristics similar to those of FML, simultaneously dampening the FML signal due to the submersion caused by water movement. Finally, the large number of in situ validated FML target-containing pixels presents an opportunity for machine learning and artificial intelligence approaches to be applied.
Besides multispectral instruments, hyperspectral missions such as PRISMA and ENMAP can provide significant insights into the spectral characteristics and detection capabilities of FML. It is also clear that the current freely available satellite imagery significantly limits our capability to discriminate FML in terms of spatial and spectral resolution. More advanced orbiting sensors tailored on FML spectral characteristics (in particular in the NIR-SWIR region) and with higher spatial resolution could dramatically improve detection capability for FML in the environment.

Author Contributions

Conceptualization, D.P. and K.T.; methodology, D.P. and K.T.; formal analysis, D.P.; investigation, D.P. and K.T.; data curation, D.P. and K.T.; writing—original draft preparation, D.P., G.S.; writing—review and editing, D.P., K.T., S.A. and P.C.; visualization, D.P.; supervision, K.T.; project administration, K.T. and D.P.; funding acquisition, K.T. All authors have read and agreed to the published version of the manuscript.

Funding

This research is part of the “Plastic Litter Project (PLP): Detection and monitoring of artificial plastic targets with satellite imagery and UAV”, funded by the Discovery Element of the European Space Agency’s Basic Activities (ESA Contract No. 4000131040/20/NL/GLC).

Data Availability Statement

All data presented here can be accessed under a Creative Commons Attribution 4.0 International license, in the Zenodo repository “Plastic Litter Project 2021 dataset” (doi 10.5281/zenodo.7085112).

Acknowledgments

The authors would like to thank the MRSG members Alexandros Karagaitanakis, Argyris Moustakas, Apostolos Papakonstantinou, Michaela Doukari, Andromachi Chatziantoniou and Spyros Spondylidis for their valuable help during all the stages of the acquisition campaign, Giannis Arambalis for his expertise and deployment of the anchoring system and deployment and removal of the targets. Last but not least, the authors would like to extend their gratitude to the 2nd and 3rd year students at the School of Marine Sciences of the University of the Aegean, for their invaluable help with target construction and disassembly, without whom the PLP2021 would not be possible.

Conflicts of Interest

The authors declare no conflict of interest.

Appendix A

Figure A1. Hyperspectral plot of HDPE mesh target material with different levels of biofouling contamination.
Remotesensing 14 05997 g0a1

References

  1. Borrelle, S.B.; Ringma, J.; Law, K.L.; Monnahan, C.C.; Lebreton, L.; McGivern, A.; Murphy, E.; Jambeck, J.; Leonard, G.H.; Hilleary, M.A.; et al. Predicted growth in plastic waste exceeds efforts to mitigate plastic pollution. Science 2020, 369, 1515–1518. [Google Scholar] [CrossRef] [PubMed]
  2. Worm, B.; Lotze, H.K.; Jubinville, I.; Wilcox, C.; Jambeck, J. Plastic as a Persistent Marine Pollutant. Annu. Rev. Environ. Resour. 2017, 42, 1–26. [Google Scholar] [CrossRef]
  3. Villarrubia-Gómez, P.; Cornell, S.E.; Fabres, J. Marine plastic pollution as a planetary boundary threat–The drifting piece in the sustainability puzzle. Mar. Policy 2018, 96, 213–220. [Google Scholar] [CrossRef]
  4. MacLeod, M.; Arp, H.P.H.; Tekman, M.B.; Jahnke, A. The global threat from plastic pollution. Science 2021, 373, 61–65. [Google Scholar] [CrossRef] [PubMed]
  5. Bank, M.S.; Swarzenski, P.W.; Duarte, C.M.; Rillig, M.C.; Koelmans, A.A.; Metian, M.; Wright, S.; Provencher, J.F.; Sanden, M.; Jordaan, A.; et al. Global Plastic Pollution Observation System to Aid Policy. Environ. Sci. Technol. 2021, 55, 7770–7775. [Google Scholar] [CrossRef] [PubMed]
  6. Ryan, P.G.; Moore, C.J.; Van Franeker, J.A.; Moloney, C. Monitoring the abundance of plastic debris in the marine environment. Philos. Trans. R. Soc. B Biol. Sci. 2009, 364, 1999–2012. [Google Scholar] [CrossRef] [Green Version]
  7. Ryan, P.G.; Pichegru, L.; Perold, V.; Moloney, C.L. Monitoring marine plastics–will we know if we are making a difference? South Afr. J. Sci. 2020, 116, 58–66. [Google Scholar] [CrossRef]
  8. Suaria, G.; Berta, M.; Griffa, A.; Molcard, A.; Özgökmen, T.M.; Zambianchi, E.; Aliani, S. Dynamics of Transport, Accumulation, and Export of Plastics at Oceanic Fronts. In The Handbook of Environmental Chemistry; Springer: Cham, Switzerland, 2021; pp. 1–51. [Google Scholar] [CrossRef]
  9. Maximenko, N.; Corradi, P.; Law, K.L.; Van Sebille, E.; Garaba, S.P.; Lampitt, R.S.; Galgani, F.; Martinez-Vicente, V.; Goddijn-Murphy, L.; Veiga, J.M.; et al. Toward the Integrated Marine Debris Observing System. Front. Mar. Sci. 2019, 6, 447. [Google Scholar] [CrossRef] [Green Version]
  10. Garaba, S.P.; Aitken, J.; Slat, B.; Dierssen, H.M.; Lebreton, L.; Zielinski, O.; Reisser, J. Sensing Ocean Plastics with an Airborne Hyperspectral Shortwave Infrared Imager. Environ. Sci. Technol. 2018, 52, 11699–11707. [Google Scholar] [CrossRef]
  11. Garaba, S.P.; Dierssen, H.M. Hyperspectral ultraviolet to shortwave infrared characteristics of marine-harvested, washed-ashore and virgin plastics. Earth Syst. Sci. Data 2020, 12, 77–86. [Google Scholar] [CrossRef] [Green Version]
  12. Garaba, S.P.; Dierssen, H.M. An airborne remote sensing case study of synthetic hydrocarbon detection using short wave infrared absorption features identified from marine-harvested macro- and microplastics. Remote. Sens. Environ. 2018, 205, 224–235. [Google Scholar] [CrossRef]
  13. Tasseron, P.; van Emmerik, T.; Peller, J.; Schreyers, L.; Biermann, L. Advancing Floating Macroplastic Detection from Space Using Experimental Hyperspectral Imagery. Remote. Sens. 2021, 13, 2335. [Google Scholar] [CrossRef]
  14. Goddijn-Murphy, L.; Dufaur, J. Proof of concept for a model of light reflectance of plastics floating on natural waters. Mar. Pollut. Bull. 2018, 135, 1145–1157. [Google Scholar] [CrossRef]
  15. Garaba, S.P.; Harmel, T. Top-of-atmosphere hyper and multispectral signatures of submerged plastic litter with changing water clarity and depth. Opt. Express 2022, 30, 16553. [Google Scholar] [CrossRef]
  16. Moshtaghi, M.; Knaeps, E.; Sterckx, S.; Garaba, S.; Meire, D. Spectral reflectance of marine macroplastics in the VNIR and SWIR measured in a controlled environment. Sci. Rep. 2021, 11, 1–12. [Google Scholar] [CrossRef]
  17. Knaeps, E.; Sterckx, S.; Strackx, G.; Mijnendonckx, J.; Moshtaghi, M.; Garaba, S.P.; Meire, D. Hyperspectral-reflectance dataset of dry, wet and submerged marine litter. Earth Syst. Sci. Data 2021, 13, 713–730. [Google Scholar] [CrossRef]
  18. Topouzelis, K.; Papakonstantinou, A.; Garaba, S.P. Detection of floating plastics from satellite and unmanned aerial systems (Plastic Litter Project 2018). Int. J. Appl. Earth Obs. Geoinf. ITC J. 2019, 79, 175–183. [Google Scholar] [CrossRef]
  19. Topouzelis, K.; Papageorgiou, D.; Karagaitanakis, A.; Papakonstantinou, A.; Ballesteros, M.A. Remote Sensing of Sea Surface Artificial Floating Plastic Targets with Sentinel-2 and Unmanned Aerial Systems (Plastic Litter Project 2019). Remote. Sens. 2020, 12, 2013. [Google Scholar] [CrossRef]
  20. Kremezi, M.; Kristollari, V.; Karathanassi, V.; Topouzelis, K.; Kolokoussis, P.; Taggio, N.; Aiello, A.; Ceriola, G.; Barbone, E.; Corradi, P. Pansharpening PRISMA Data for Marine Plastic Litter Detection Using Plastic Indexes. IEEE Access 2021, 9, 61955–61971. [Google Scholar] [CrossRef]
  21. Themistocleous, K.; Papoutsa, C.; Michaelides, S.; Hadjimitsis, D. Investigating Detection of Floating Plastic Litter from Space Using Sentinel-2 Imagery. Remote Sens. 2020, 12, 2648. [Google Scholar] [CrossRef]
  22. Kikaki, A.; Karantzalos, K.; Power, C.A.; Raitsos, D.E. Remotely Sensing the Source and Transport of Marine Plastic Debris in Bay Islands of Honduras (Caribbean Sea). Remote Sens. 2020, 12, 1727. [Google Scholar] [CrossRef]
  23. Kikaki, K.; Kakogeorgiou, I.; Mikeli, P.; Raitsos, D.E.; Karantzalos, K. MARIDA: A benchmark for Marine Debris detection from Sentinel-2 remote sensing data. PLoS ONE 2022, 17, e0262247. [Google Scholar] [CrossRef] [PubMed]
  24. Mikeli, P.; Kikaki, K.; Kakogeorgiou, I.; Karantzalos, K. How challenging is the discrimination of floating materials on the sea surface using high resolution multispectral satellite data? Int. Arch. Photogramm. Remote Sens. Spat. Inf. Sci. 2022, 43, 151–157. [Google Scholar] [CrossRef]
  25. Hu, C. Remote detection of marine debris using satellite observations in the visible and near infrared spectral range: Challenges and potentials. Remote. Sens. Environ. 2021, 259, 112414. [Google Scholar] [CrossRef]
  26. Hu, C.; Qi, L.; Xie, Y.; Zhang, S.; Barnes, B.B. Spectral characteristics of sea snot reflectance observed from satellites: Implications for remote sensing of marine debris. Remote Sens. Environ. 2021, 269, 112842. [Google Scholar] [CrossRef]
  27. Biermann, L.; Clewley, D.; Martinez-Vicente, V.; Topouzelis, K. Finding Plastic Patches in Coastal Waters Using Optical Satellite Data. Nat. Commun. 2020; accepted. [Google Scholar]
  28. Sannigrahi, S.; Basu, B.; Basu, A.S.; Pilla, F. Development of automated marine floating plastic detection system using Sentinel-2 imagery and machine learning models. Mar. Pollut. Bull. 2022, 178, 113527. [Google Scholar] [CrossRef]
  29. Basu, B.; Sannigrahi, S.; Basu, A.S.; Pilla, F. Development of Novel Classification Algorithms for Detection of Floating Plastic Debris in Coastal Water Bodies Using Multispectral Sentinel-2 Remote Sensing Imagery. Remote Sens. 2021, 13, 1598. [Google Scholar] [CrossRef]
  30. Ciappa, A.C. Marine plastic litter detection offshore Hawai’i by Sentinel-Mar. Pollut. Bull. 2021, 168, 112457. [Google Scholar] [CrossRef]
  31. Ciappa, A.C. Marine Litter Detection by Sentinel-2: A Case Study in North Adriatic (Summer 2020). Remote Sens. 2022, 14, 2409. [Google Scholar] [CrossRef]
  32. Kremezi, M.; Kristollari, V.; Karathanassi, V.; Topouzelis, K.; Kolokoussis, P.; Taggio, N.; Aiello, A.; Ceriola, G.; Barbone, E.; Corradi, P. Increasing the Sentinel-2 potential for marine plastic litter monitoring through image fusion techniques. Mar. Pollut. Bull. 2022, 182, 113974. [Google Scholar] [CrossRef]
  33. Mifdal, J.; Longépé, N.; Rußwurm, M. Towards detecting floating objects on a global scale with learned spatial features using sentinel 2. ISPRS Ann. Photogramm. Remote Sens. Spat. Inf. Sci. 2021, 5, 285–293. [Google Scholar] [CrossRef]
  34. Goddijn-Murphy, L.; Peters, S.; van Sebille, E.; James, N.A.; Gibb, S. Concept for a hyperspectral remote sensing algorithm for floating marine macro plastics. Mar. Pollut. Bull. 2018, 126, 255–262. [Google Scholar] [CrossRef] [Green Version]
  35. Goddijn-Murphy, L.; Williamson, B. On Thermal Infrared Remote Sensing of Plastic Pollution in Natural Waters. Remote Sens. 2019, 11, 2159. [Google Scholar] [CrossRef] [Green Version]
  36. Goddijn-Murphy, L.; Williamson, B.J.; McIlvenny, J.; Corradi, P. Using a UAV Thermal Infrared Camera for Monitoring Floating Marine Plastic Litter. Remote Sens. 2022, 14, 3179. [Google Scholar] [CrossRef]
  37. Biermann, L.; Vincente, V.M.; Sailley, S.; Mata, A.; Steele, C. Towards a Method for Detecting Macroplastics by Satellite: Examining Sentinel-2 Earth Observation Data for Floating Debris in the Coastal Zone. Geophys. Res. Abstr. 2019, 21, 2019–17469. [Google Scholar]
  38. Martínez-Vicente, V.; Clark, J.R.; Corradi, P.; Aliani, S.; Arias, M.; Bochow, M.; Bonnery, G.; Cole, M.; Cózar, A.; Donnelly, R.; et al. Measuring Marine Plastic Debris from Space: Initial Assessment of Observation Requirements. Remote Sens. Environ. 2019, 11, 2443. [Google Scholar] [CrossRef] [Green Version]
  39. Topouzelis, K.; Papageorgiou, D.; Suaria, G.; Aliani, S. Floating marine litter detection algorithms and techniques using optical remote sensing data: A review. Mar. Pollut. Bull. 2021, 170, 112675. [Google Scholar] [CrossRef]
  40. Papageorgiou, D.; Topouzelis, K. Plastic Litter Project 2021 Dataset [Data set]. Zenodo. 2022. Available online: https://zenodo.org/record/7085112 (accessed on 22 September 2022).
  41. Vanhellemont, Q. Adaptation of the dark spectrum fitting atmospheric correction for aquatic applications of the Landsat and Sentinel-2 archives. Remote. Sens. Environ. 2019, 225, 175–192. [Google Scholar] [CrossRef]
  42. Hu, C. Remote detection of marine debris using Sentinel-2 imagery: A cautious note on spectral interpretations. Mar. Pollut. Bull. 2022, 183, 114082. [Google Scholar] [CrossRef]
  43. Kruse, F.A.; Lefkoff, A.B.; Boardman, J.W.; Heidebrecht, K.B.; Shapiro, A.T.; Barloon, P.J.; Goetz, A.F.H. The spectral image processing system (SIPS)—interactive visualization and analysis of imaging spectrometer data. Remote Sens. Environ. 1993, 44, 145–163. [Google Scholar] [CrossRef]
  44. Harsanyi, J.C.; Chang, C.-I. Hyperspectral image classification and dimensionality reduction: An orthogonal subspace projection approach. IEEE Trans. Geosci. Remote Sens. 1994, 32, 779–785. [Google Scholar] [CrossRef] [Green Version]
  45. Guidi, L.; Tattini, M.; Landi, M. How Does Chloroplast Protect Chlorophyll Against Excessive Light. In Chlorophyll; Intech: London, UK, 2017. [Google Scholar] [CrossRef]
Figure 1. Location map showing the study area in the Island of Lesvos. Top right: Sentinel-2 subscene of the deployment area showing the HDPE (top) and wooden targets. Bottom UAS image of the deployment area showing HDPE and wooden targets.
Remotesensing 14 05997 g001
Figure 2. Sentinel-2 cut-out of the PLP2021 deployment area showing the HDPE and wooden planks targets with the corresponding 5 × 5 pixel averages used for spectral analysis.
Remotesensing 14 05997 g002
Figure 3. Processing workflow for FML detection through partial unmixing.
Remotesensing 14 05997 g003
Figure 4. Sentinel-2 spectral plots of the three different target materials; bottom plot omitting the two SWIR bands, error bars standard deviation of HDPE mesh target central pixel reflectance values.
Remotesensing 14 05997 g004
Figure 5. (a) Location map of the sea snot accumulations off the east coast of Lemnos Island on 20210624. The red squares indicate the location of the 5 × 5 pixel averages. (b) Location map of the pollen accumulations in the vicinity of the Island of Lesvos in 20220427. The red squares indicate the location of the 5 × 5 pixel averages. (c) Spectral comparison plots for sea snot, pollen, and the HDPE target in the 490–865 nm range. The HDPE profile magnitude has been adjusted to the average 833 nm reflectance of the central HDPE target pixel, essentially retaining the same spectral shape but increasing the magnitude. (d) Spectral angles between HDPE-sea-snot and HDPE-pollen. The spectral angle has been computed for an eight-band combination (492, 560, 665, 704, 740, 780, 833, 865 nm).
Remotesensing 14 05997 g005
Figure 6. Four-band (RGB and NIR) spectral plots for 20210621 central pixel, 20210621 central pixel with water subtraction and unmixed signatures for the four first acquisitions.
Remotesensing 14 05997 g006
Figure 7. Spectral plot showing biofouling effects on HDPE mesh spectrum. Top: UAV images of the HDPE target showing the increase in biofouling accumulations. Bottom: HDPE mesh target central pixel plots for three dates. The 20210621 acquisition has no biofouling accumulations; 20210721 has moderate biofouling accumulations; 20210805 has dense biofouling accumulations. Note that no pixel averaging or background subtraction has been performed, and hence the 20 m bands are distorted and not representative of the HDPE material.
Remotesensing 14 05997 g007
Figure 8. (Top) Field images showing the target on the two different acquisitions; 20210611 floating on water surface, 20210830 partially submerged under a water column of about 20 to 30 cm. (Bottom) Spectral plot of central pixel of HDPE mesh target floating on surface vs. partially submerged, no pixel averaging or background subtraction has been performed.
Remotesensing 14 05997 g008
Figure 9. FDI and NDVI box and scatter plots for the different classes.
Remotesensing 14 05997 g009
Figure 10. Partial unmixing detection results for: 20210621: floating HDPE target, 20210830: partially submerged HDPE target—the two additional targets are an anchored monohull and a catamaran sailing boat, 20210805: highly biofouled HDPE target, 20210904: mixed target.
Remotesensing 14 05997 g010
Figure 11. Partial unmixing results showing larger study area, close-up of the surface accumulations and the detected pixels after the applied partial unmixing: (a) sea snot accumulations off Lemnos Island, (b) pollen off Lesvos Island and (c) reported marine debris accumulations off La Gonave Island in Haiti [23].
Remotesensing 14 05997 g011
Table 1. State of target and environmental conditions for each acquisition.
AcquisitionState *BiofoulingWindSecchi Depth
20210611floatingnolow-
20210621floatingnono8 m
20210626floatingnono-
20210701floatingnolow8.5 m
20210706floatinglowno8 m
20210711floatingmidhigh6.8 m
20210716floatingmidno8 m
20210721floatingmid/highlow8 m
20210726floatingmid/highhigh6.8 m
20210731floatinghighno8 m
20210805floatinghighno8 m
20210810floatinghighlow8 m
20210815submergedhigh--
20210820submergedhighmid-
20210825part subhighno-
20210830part sublowlow-
20210904mix floatinglowmid-
20210909mix part submidmid-
20210914mix mostly submidhigh5 m
20210919mix mostly submidmid7 m
20210924mostly submid/high- -
20211004mostly subhighhigh-
* State: floating: on top of surface with parts above, part sub: mostly on surface with parts below at 0.1–0.5 m depth, mostly submerged: below the surface at depths up to 1 m max, submerged: majority of target at depths greater than 1 m. Biofouling: no, low, mid, high (relative). Wind: no: <3 m/s, low: 3–5 m/s, mid: 5–8 m/s, high: >8 m/s.
Table 2. Sentinel-2 MSI spectral bands characteristics.
BandCentral Wavelength (nm)Bandwidth (nm)Resolution (m)
B24926510
B35603510
B46653010
B57041520
B67401520
B77832020
B883311510
B8a8652020
B1116109020
B12219018020
Publisher’s Note: MDPI stays neutral with regard to jurisdictional claims in published maps and institutional affiliations.

