Review

Review of Ground Penetrating Radar Applications for Water Dynamics Studies in Unsaturated Zone

1
College of Geo-Exploration Science and Technology, Jilin University, Changchun 130026, China
2
ITES UMR-7063, EOST, University of Strasbourg, F-67000 Strasbourg, France
3
Science and Technology on Near-Surface Detection Laboratory, Wuxi 214035, China
*
Author to whom correspondence should be addressed.
Remote Sens. 2022, 14(23), 5993; https://doi.org/10.3390/rs14235993
Submission received: 30 September 2022 / Revised: 21 November 2022 / Accepted: 22 November 2022 / Published: 26 November 2022
(This article belongs to the Special Issue Review of Application Areas of GPR)

Abstract

:
For water dynamics investigation in unsaturated (vadose) zones, ground penetrating radar is a popular hydro-geophysical method because it is non-invasive for soil, has high resolution and the results have a direct link with water content. Soil water content and soil hydraulic properties are two key factors for describing the water dynamics in vadose zones. There has been tremendous progress in soil water content and soil hydraulic properties estimation with ground penetrating radar. The purpose of this paper is to provide an overview of the application of ground penetrating radar for soil water dynamics studies. This paper first summarizes various methods for the determination of soil water content. including traditional methods in the surveys of surface ground penetrating radar, borehole ground penetrating radar, and off-ground ground penetrating radar, as well as relatively new methods, such as full waveform inversion, the average envelope amplitude method, and the frequency shift method. This paper further provides a review for estimating soil hydraulic properties with GPR according to the types of ground penetrating radar data. We hope that this review can provide a reference for the application of ground penetrating radar in soil water dynamics studies in the future.

1. Introduction

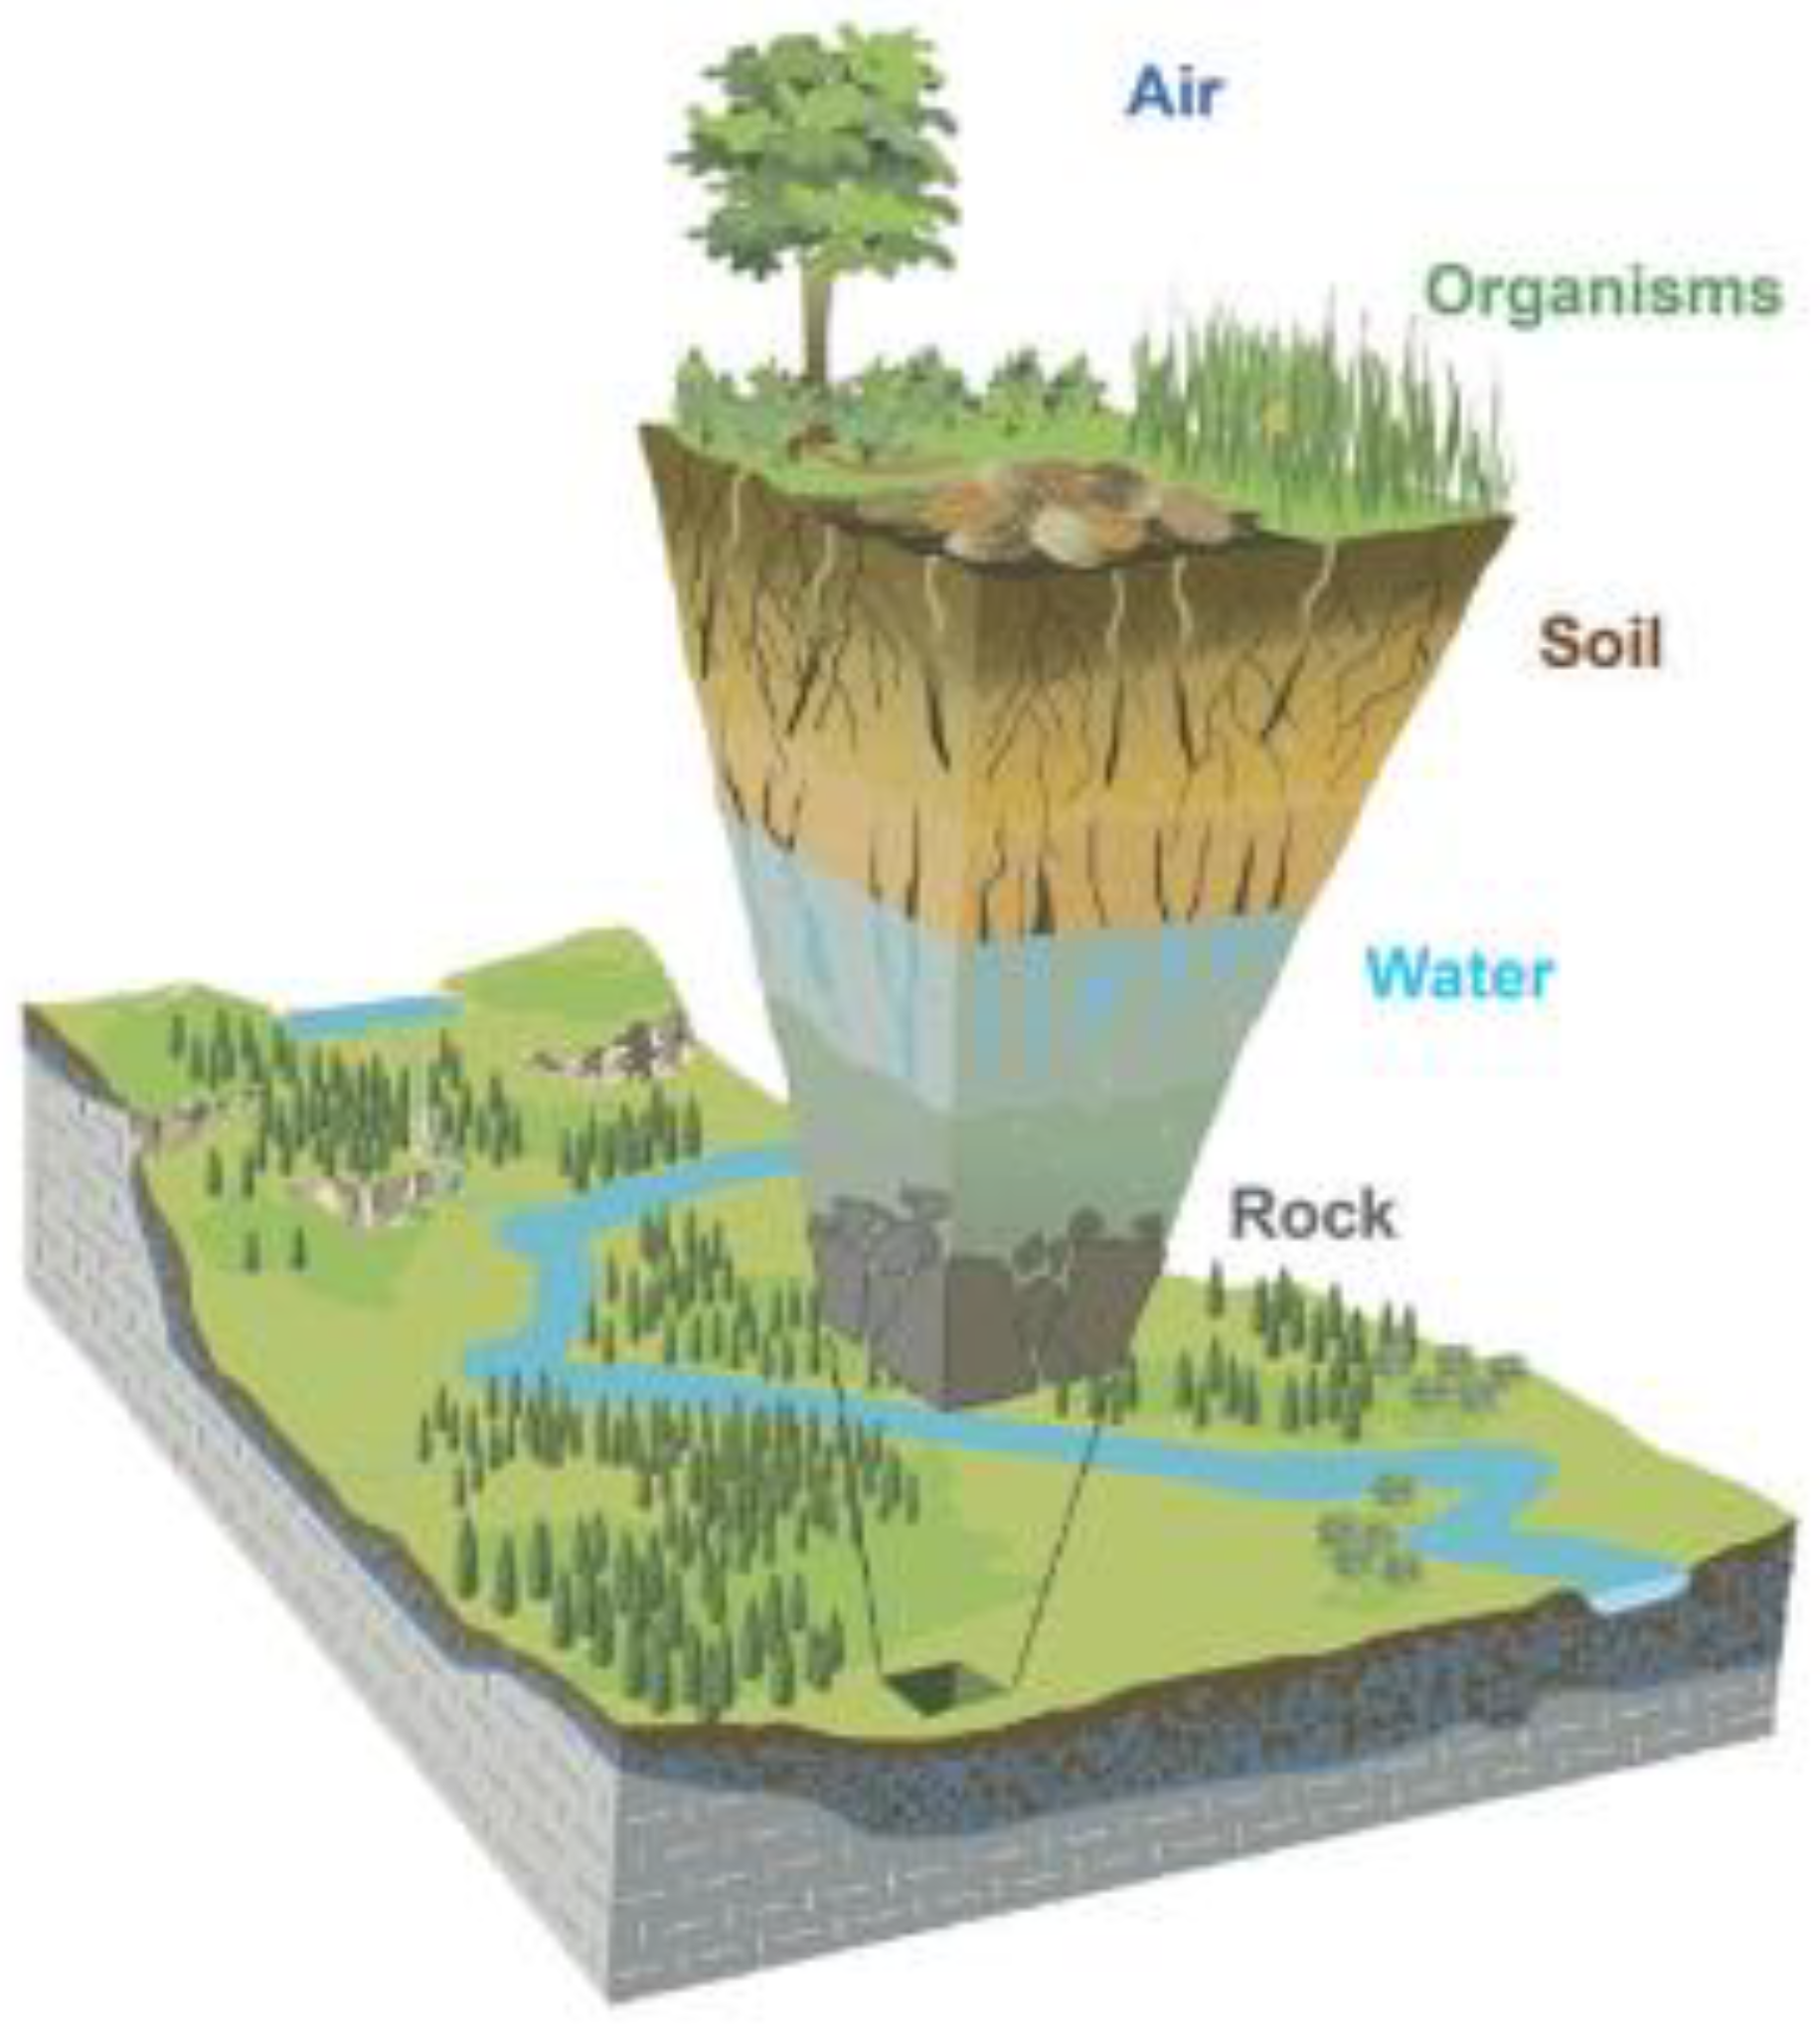
The critical zone (CZ), the near-surface layer of the Earth, is from the top of vegetation canopies to the topmost zones of ground water (Figure 1) [1,2,3,4,5]. It includes vegetation, soil, rock, and water and provides the essential elements for supporting life. Thus, the characterization of the CZ requires information from both the aboveground and underground, such as geophysical, geochemical, and hydrologic information [3]. As an important part of the CZ, the unsaturated zone, also referred to as the vadose zone, is a zone for surface water conversion to ground water [6]. In many different areas such as hydrogeology, hydrology, agriculture, and soil science, it is necessary to evaluate and describe water dynamics in the unsaturated zone. Soil water content (SWC) and soil hydraulic properties (SHP) are two key factors for characterizing water dynamics in the vadose zone. The SHP, represented by soil water retention and hydraulic conductivity, can be expressed by several mathematical expressions and can dictate water flow in the vadose zone [7]. Therefore, it is crucial to estimate SWC and SHP. However, the determination of SWC and SHP is still challenging. In hydrology, the estimation of SWC and SHP is commonly based on point-scale sensors such as time domain reflectometry (TDR) and neutron probes [8,9]. Although point-scale sensors can accurately determine the SHP, they have distinct disadvantages including a limited range of measurement, relatively small sensing volume and being invasive.
In recent decades, geophysical methods have come to play an efficient role and show great potential for the characterization of the subsurface. Some geophysical methods such as electromagnetic induction (EMI) [10,11], electrical resistivity tomography (ERT) [12,13,14,15] and ground penetrating radar (GPR) [16,17,18,19,20] have been widely applied to estimating SWC and SHP because they are less invasive for the ground surface than point-sensors such as TDR. Of these methods, GPR is one of the more promising for estimating SWC and SHP because the velocity of GPR waves is high sensitive to the change in SWC [17]. In addition, GPR is a high-resolution geophysical technique and can relate a change in permittivity to SWC directly [21]. In hydrology, the SHP is determined through the change in SWC. For the estimation of SHP with GPR, sequential inversion is widely applied. It firstly inverts SWC through measured GPR data (Appendix A). Then, the SHP is determined from SWC (Figure 2) [18] (Appendix B). Among the reviewed studies, GPR is used for characterizing SWC starting about two decades ago. Several reviews have been provided for SWC determination by GPR [17,22,23]. However, there is no review focusing on SHP estimation by GPR.
In this paper, we first aim to summarize the research results for estimating SWC and review advances for estimating SWC with GPR. Then, a review of estimating the SHP will be further presented. We will present different GPR methods for characterizing near-surface soil water dynamics.

Principle of GPR Method

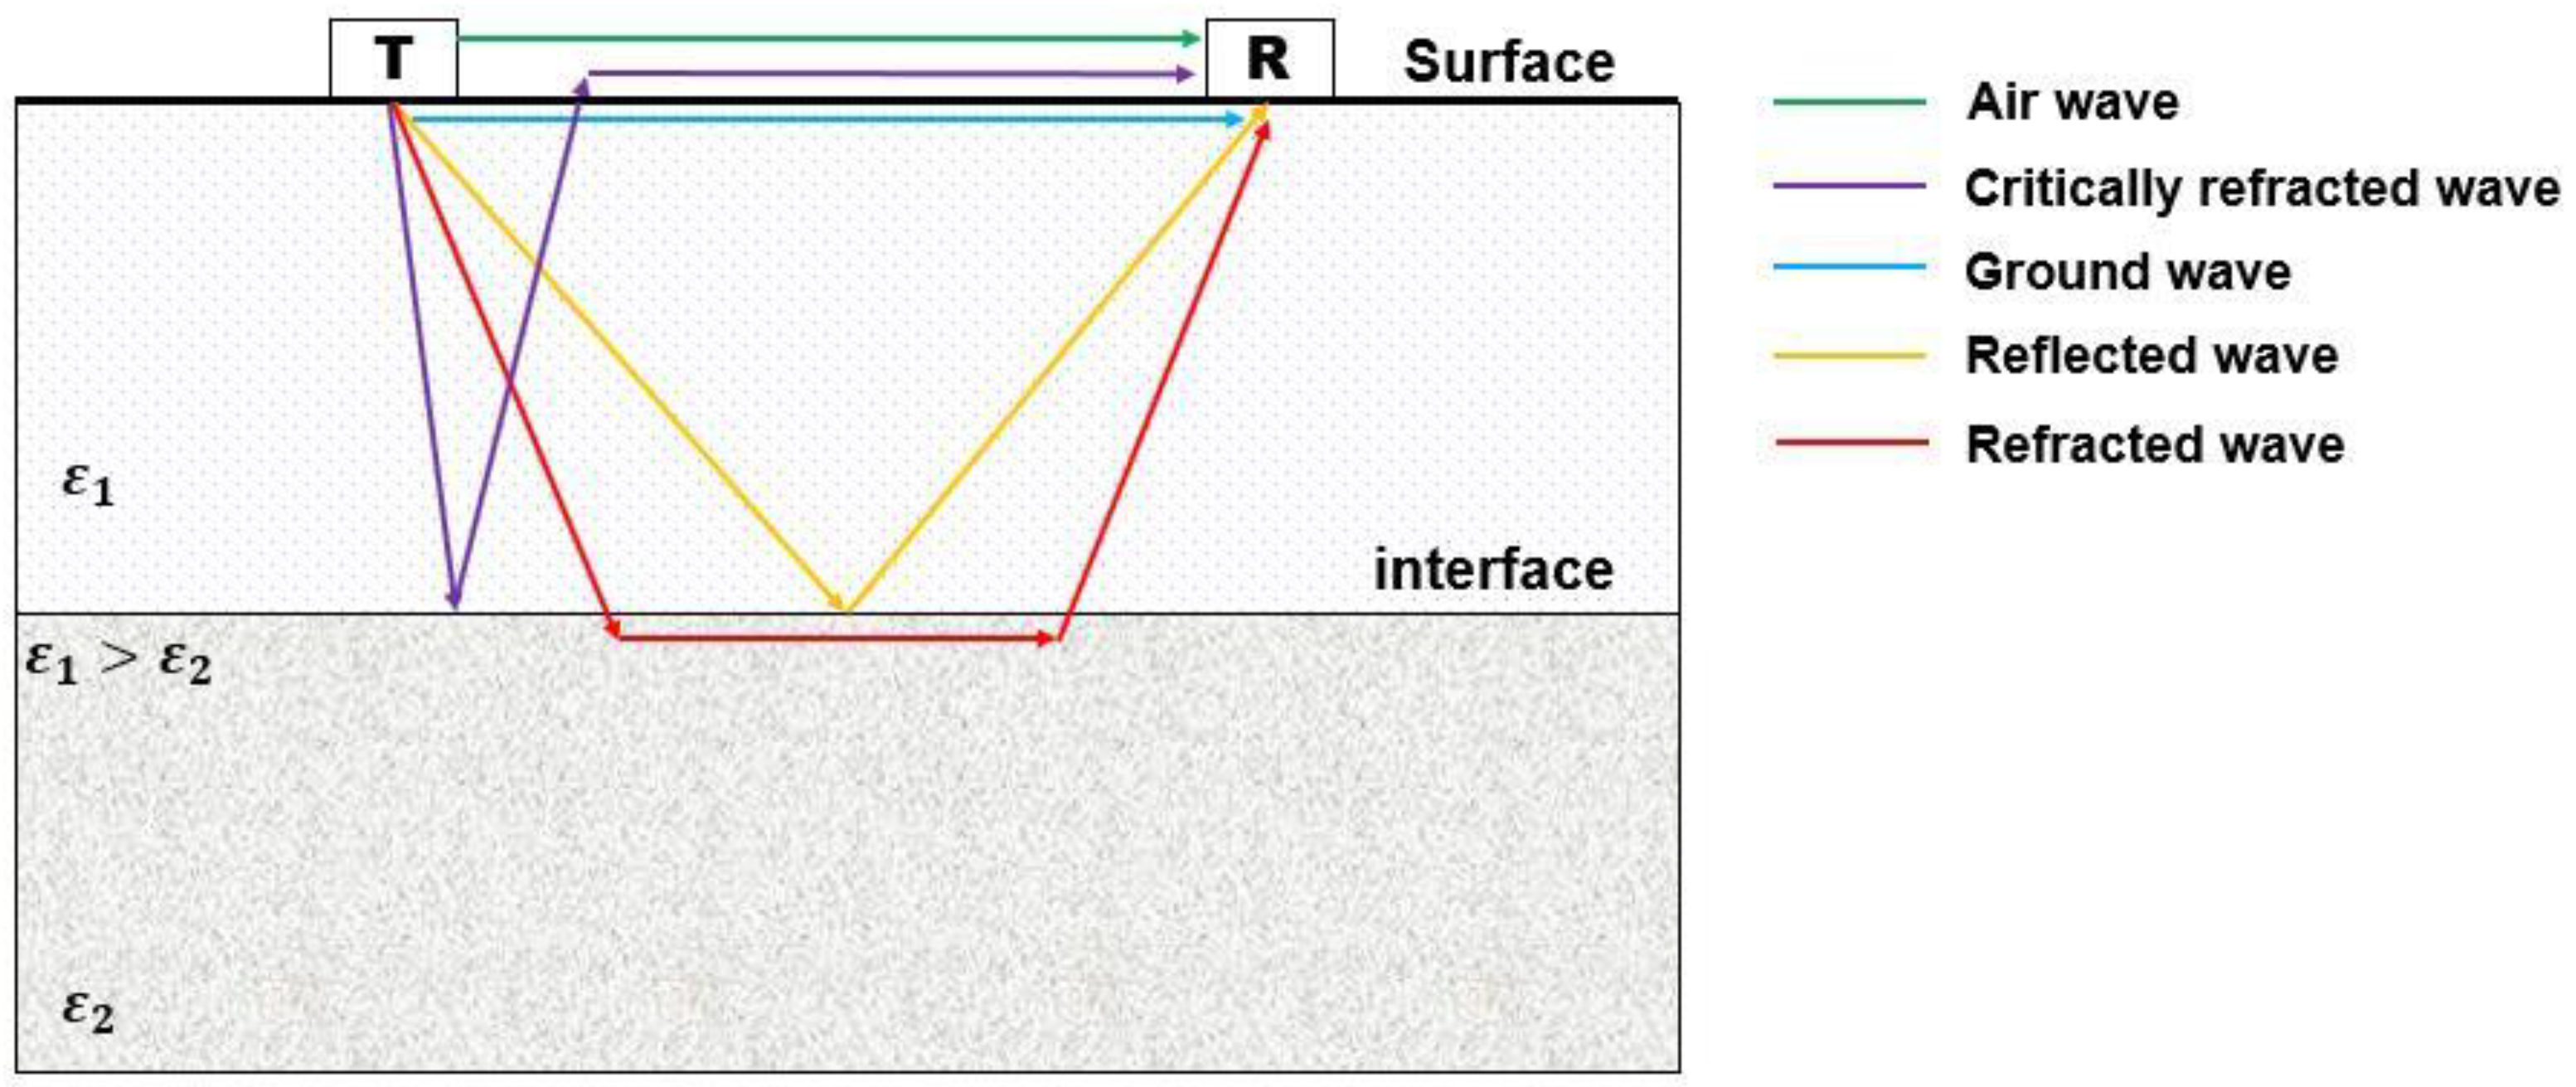
The GPR method is a geophysical technique based on the propagation of high-frequency electromagnetic waves. A GPR device emits electromagnetic waves from a transmitter and receives them using a receiver. GPR can give continuous and detailed images of the subsurface [24,25]. Figure 3 shows the possible propagated paths of electromagnetic waves for surface GPR in two-layer soils.
Resolution and penetration depth are two important factors for GPR detection. The period of the emitted pulse determines the resolution. The period of the pulse is controlled by the frequency bandwidth. For impulse radar systems, the designed bandwidths are about equal to the center frequency, so the resolution increases with increasing center frequency [24]. Conversely, the penetration depth decreases with increasing center frequency of a GPR system. For low-conductivity media like dry sand, and with low-frequency GPR systems operating at 50 or 100 MHz, the penetration depth can reach several tens of meters; whereas the penetration depth can achieve several meters at 250 or 450 MHz, and just several tens of centimeters at 900 MHz.
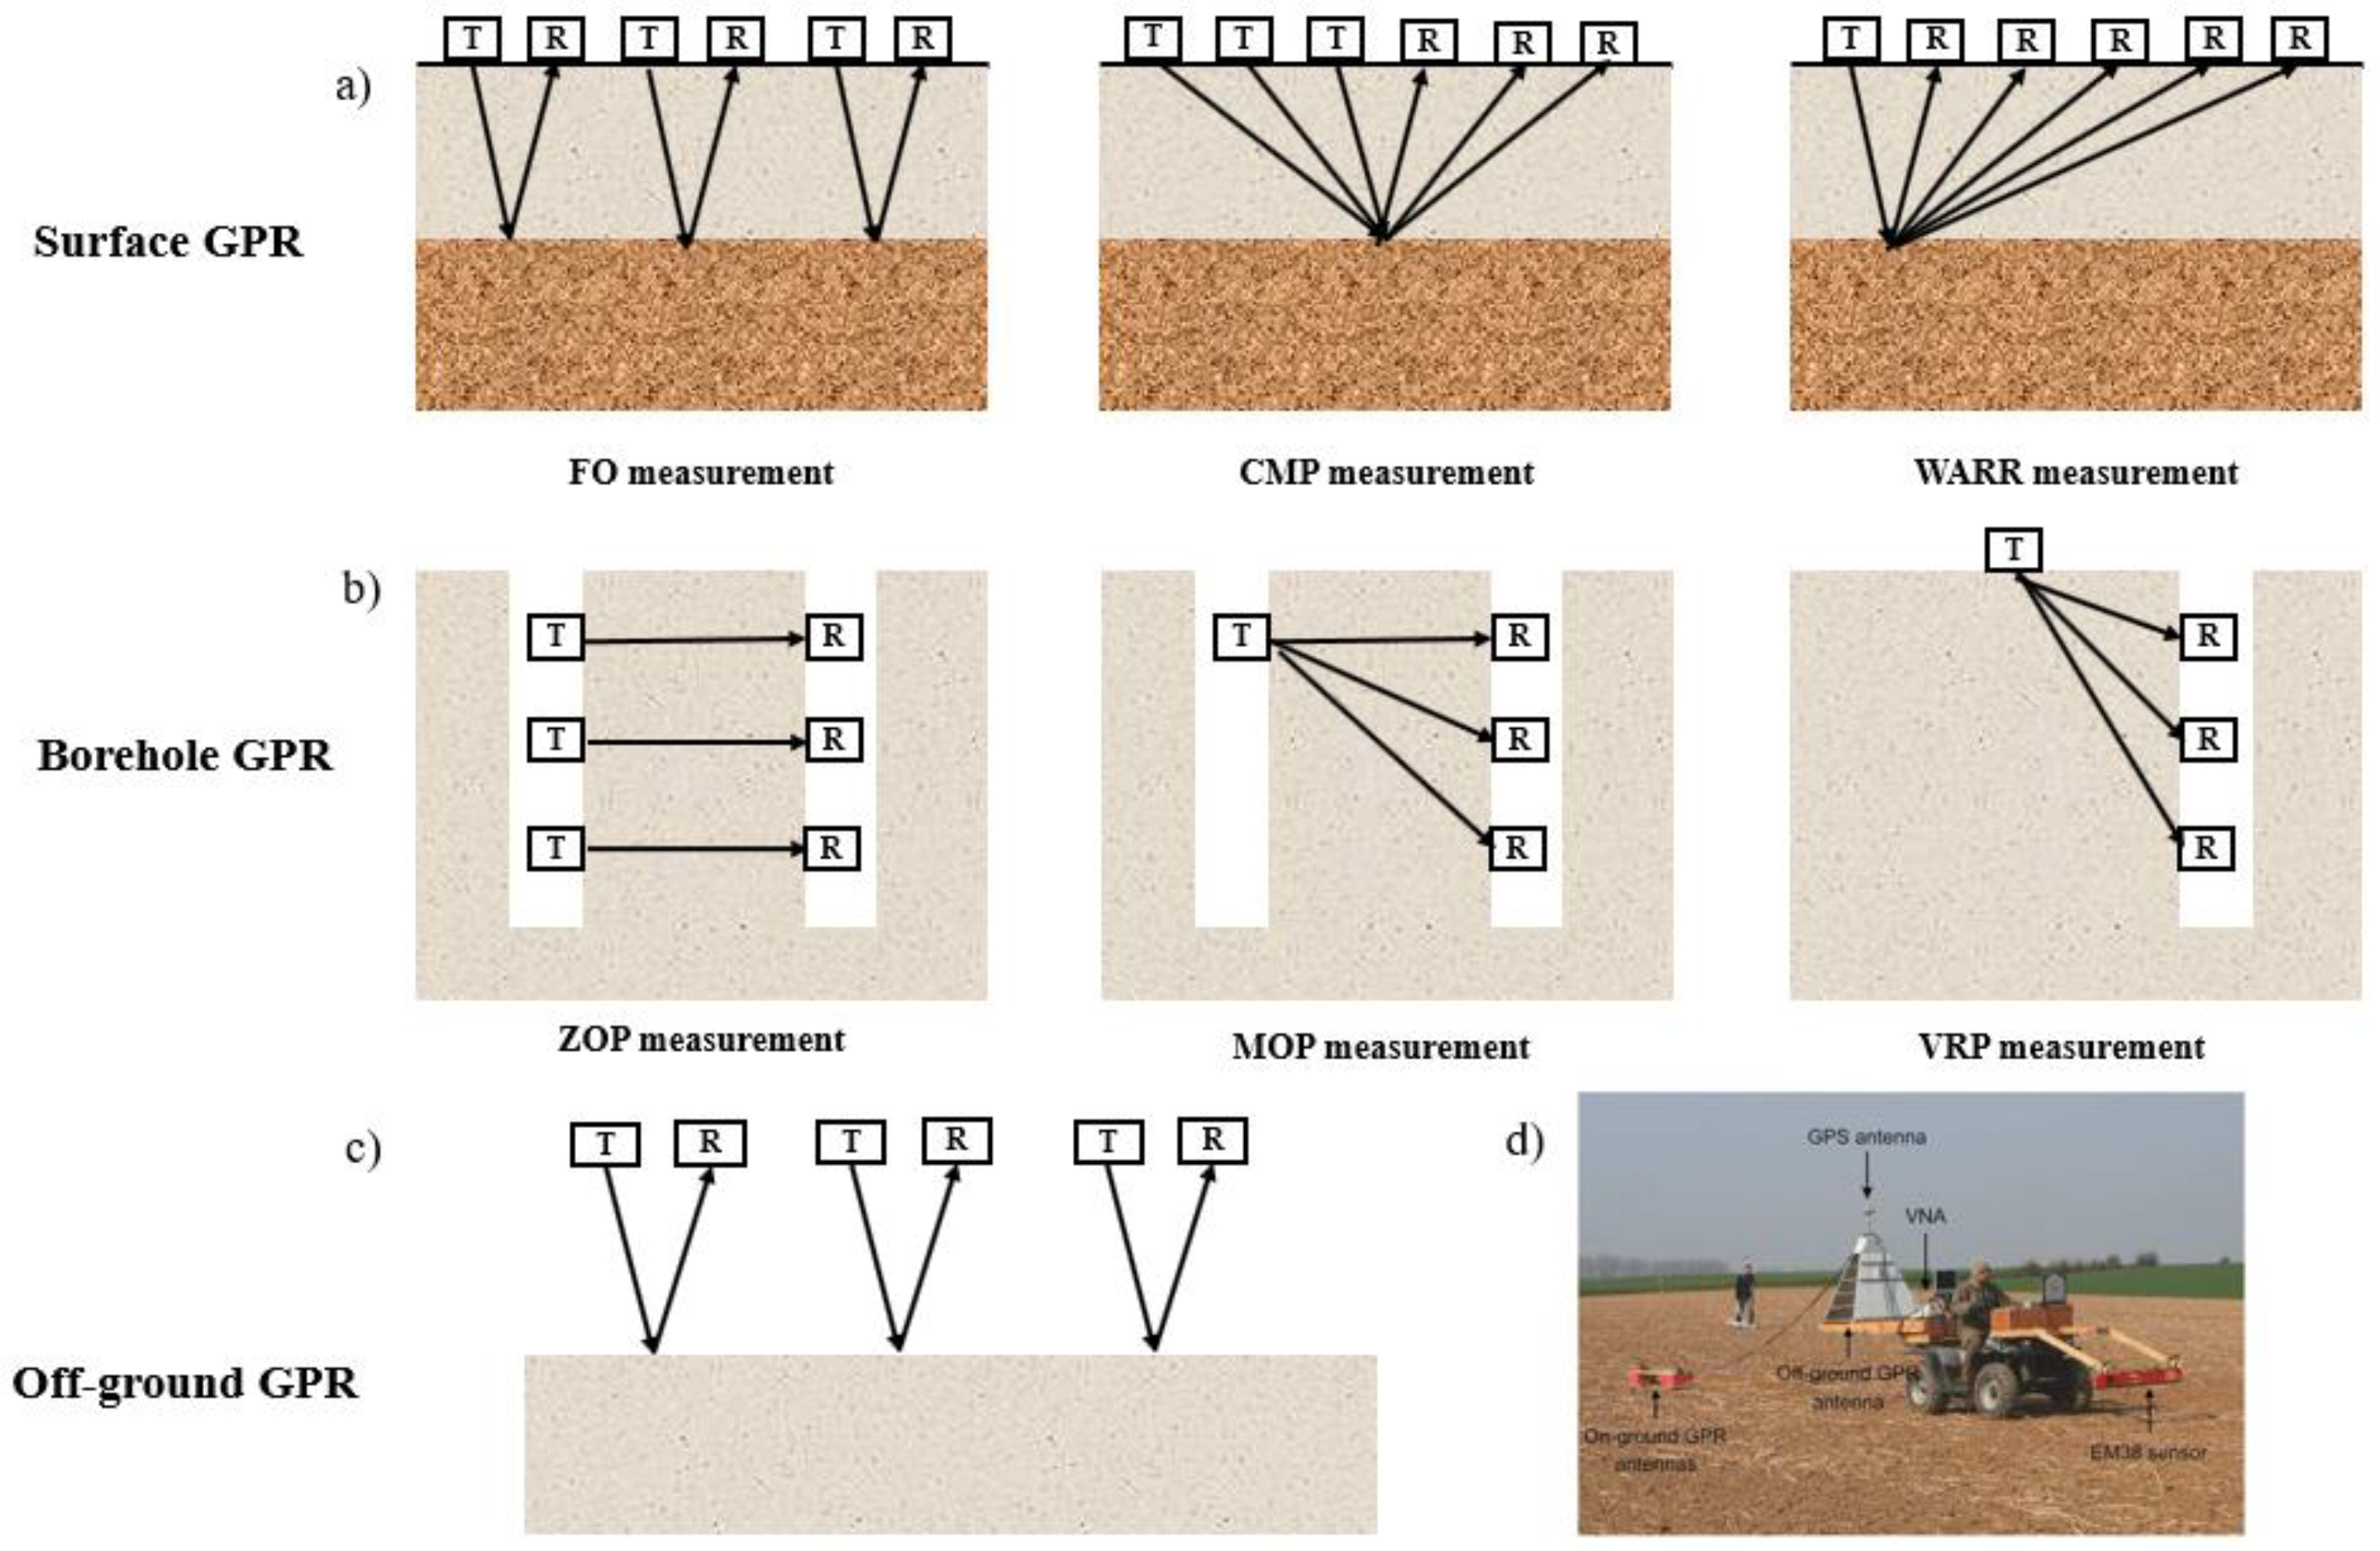
For soil water dynamic measurement, there are three types of GPR antenna systems: surface GPR, borehole GPR and off-ground GPR (Figure 4). Surface GPR, also called ground-coupled GPR, is widely applied. A surface GPR system is in direct contact with the ground surface during data acquisition. The transmitter antenna and receiver antenna are both placed on the surface. The transmitter antenna first emits electromagnetic pulses into the sub-surface and the receiver antenna receives the waves, such as reflected waves, refracted waves, or ground waves. The underground condition can be described by extracting and analyzing the information from these waves. There are three kinds of commonly used observation modes for surface GPR: the common offset profile (COP) or fix-offset (FO) mode, the wide-angle reflection and refraction (WARR) mode, and the common-midpoint (CMP) mode. Borehole GPR antennas are put into a borehole. Compared to surface GPR, borehole GPR can obtain SWC distribution with higher resolution and greater depth. There are also three commonly used modes for borehole GPR: the zero-offset profile (ZOP), the multi-offset profile (MOP), and the vertical radar profile (VRP). In contrast, off-ground GPR is designed to acquire data from some distance above the surface. It is less invasive than surface or borehole GPR. For SWC measurements with off-ground GPR, the GPR antenna is commonly installed on a vehicle or a low-flying air platform.
Figure 5 presents some examples of GPR applications. Figure 5a shows a GPR section acquired in the vicinity of Ulaanbaatar, Mongolia. The GPR was used to image the near-surface deformation along an active fault. A clear thrust structure, with several compressive structures in front of the scarp, can be observed [26]. Figure 5b displays a pre-stack migrated three-dimensional (3D) slice image of a steeply dipping landmine that was buried in homogeneous soil under flat ground conditions. A reconstructed landmine image can be clearly visible [27]. Figure 5c presents a hypothesis of the weathering process of the regolith at the CE-4 lunar probe landing site based on the analysis of data from GPR measurements [28].

2. Techniques for SWC Measurements

For SWC estimation, GPR has been widely applied. Because the electromagnetic signal is sensitive to the change in water content, GPR is a very efficient method for the detection of water content and monitoring of water flow. Table 1 summarizes most of the studies describing the estimation of SWC using various GPR configurations and modes. Most of these studies focus on surface GPR and borehole GPR. In addition, six kinds of measured modes and three kinds of relatively new methods are reviewed.

2.1. Surface GPR for SWC Measurements

2.1.1. Single Offset Surface GPR for SWC Measurements

The single offset mode is the usual survey mode. In single offset measurements, a fixed offset antenna is moved along a survey line. In single offset measurement, SWC can be estimated with reflected waves or ground waves. The earliest approaches were often based on the reflected wave. When there are differences in soil permittivity between soil layers, the EM waves that transmit into the soil will be partly reflected and received by the receivers. In the single offset reflection method, a reflector with known depth is necessary. According to the reflection travel time and the depth of the soil layer, the electromagnetic wave velocity can be calculated and transformed into dielectric permittivity. Finally, SWC is computed from the dielectric permittivity with certain petrophysical relations. There are several kinds of reflectors, such as the groundwater table [44], horizontal and continuous soil reflection interfaces [38], mental reflectors [30,32], and the bottom of a sand box or buried objects [36].
The application of GPR for estimating SWC can be dated back to the 1990s. Vellidis et al. [29] investigated the feasibility of 120 MHz single offset GPR using the reflected wave method for monitoring the soil water movement in the unsaturated zone. There is a link between the GPR reflection bands and the wetting front. The technique has the potential for identifying preferential flow paths at a given field site. However, SWC was not quantified.
In order to further quantify the accuracy of common offset GPR reflection travel time for estimating volume water content under the condition of a naturally heterogeneous environment and variable hydrological conditions, Lunt et al. [39] used reflection travel-time data obtained with 100 MHz common offset GPR to investigate the variability of SWC throughout the growing season under a series of soil saturation conditions. The authors first attempted to quantify the accuracy of common offset GPR reflection travel time for estimating volume water content under the condition of a naturally heterogeneous environment and variable hydrological conditions. The average soil dielectric constant above the reflector was calculated using the GPR reflection two-way travel time and the depth of the reflector at the borehole locations. The results showed that the GPR reflection method has the potential to monitor SWC at a large scale and under variable hydrological conditions.
Lateral variability is challenging for traditional hydrological studies. In order to observe lateral variability, two-dimensional (2D) or 3D data are needed. The GPR is a good tool for obtaining 2D or 3D data quickly and is less costly than hydrological methods such as TDR. Di Prima et al. [53] applied time-lapse GPR to create 3D representations of infiltrated water in combination with automatized single-ring infiltration experiments. The purpose was to identify the incidence and extent of preferential flow. The results of experiments showed that plant roots play an important role in promoting the movement of preferential flow. Birken and Versteeg [31] analyzed parts of 200 MHz and 500 MHz common offset data from a 4D GPR dataset. The massive amount of data can avoid the manual interpretation from a 4D dataset.
Irving et al. [42] pointed out that an appropriate inversion strategy is necessary for describing lateral variability. The author presented a new method for estimating the parameters used for describing the lateral variability in water content based on surface GPR reflection data. Under the background of Bayesian geophysical inverse theory, SWC was determined from GPR data. How to effectively realize Markov chain Monte Carlo (MCMC) sampling was also described. This proposed method can reliably recover the aspect ratio of the heterogeneity. Schmelzbach et al. [45] introduced the seismic reflection impedance inversion scheme to surface GPR and proposed a new reflection amplitude inversion workflow based on surface GPR to improve the resolution of dielectric permittivity and the profile of SWC distribution. Mangel et al. [54] integrated automated GPR data collection and reflection tomography to create a new method for building models of subsurface hydrologic processes and determining transient 2D distributions of SWC.
Zhang et al. [47] combined seasonal time-lapse 400 MHz single offset GPR surveys with high-resolution real-time SWC monitoring to study the effect of seasonal soil water dynamics on the GPR signal, especially at the soil horizon interfaces. Through the combination of time-lapse data, the subsurface flow dynamics and flow paths can be described.
Klenk et al. [44] analyzed a series of imbibition, drainage, and infiltration experiments based on surface GPR measurements. This study evaluated the feasibility of mapping the dynamic shape of the capillary fringe reflection and the relative accuracy of monitoring soil water dynamics over the whole vertical depth.
In addition to travel-time data, other features of the electromagnetic wave also contain useful information for SWC detection with GPR, such as amplitude and phase information. Yu et al. [48] developed a method to extract the instantaneous phase parameters of a GPR reflection signal by using the Hilbert Transform for characterizing SWC. Through lab experiments, the approximately linear link between instantaneous phase difference and medium moisture content change was demonstrated.
When the air wave and the ground wave can be separated through appropriate antenna separation, the ground waves method can be used for single offset measurements. van Overmeeren et al. [57] applied a fixed separation high-frequency antenna (200 MHz) with the direct ground wave and refracted wave methods. The two methods constitute an attractive complementary combination for underground consecutive shallow zones. By comparing the results between a capacitance probe and GPR, they showed that GPR can provide information about the SWC of the vadose zone and determine the temporal and spatial variations. The lateral variations of SWC can also be observed due to the high lateral resolution of GPR images. This offers the prospect of mapping the soil water flow preferential paths.
Galagedara et al. [59] investigated the GPR direct ground wave sampling depth and used the FO method of GPR (200 MHz antenna) to estimate the temporal SWC change during uniform irrigation and drainage.
Single offset measurements are easy and fast and can be used for large-scale investigations. However, for both the reflected wave method and the ground wave method, reflectors are needed in order to obtain the velocity of the electromagnetic waves for single offset measurement [22].

2.1.2. Multi-Offset Surface GPR for SWC Measurements

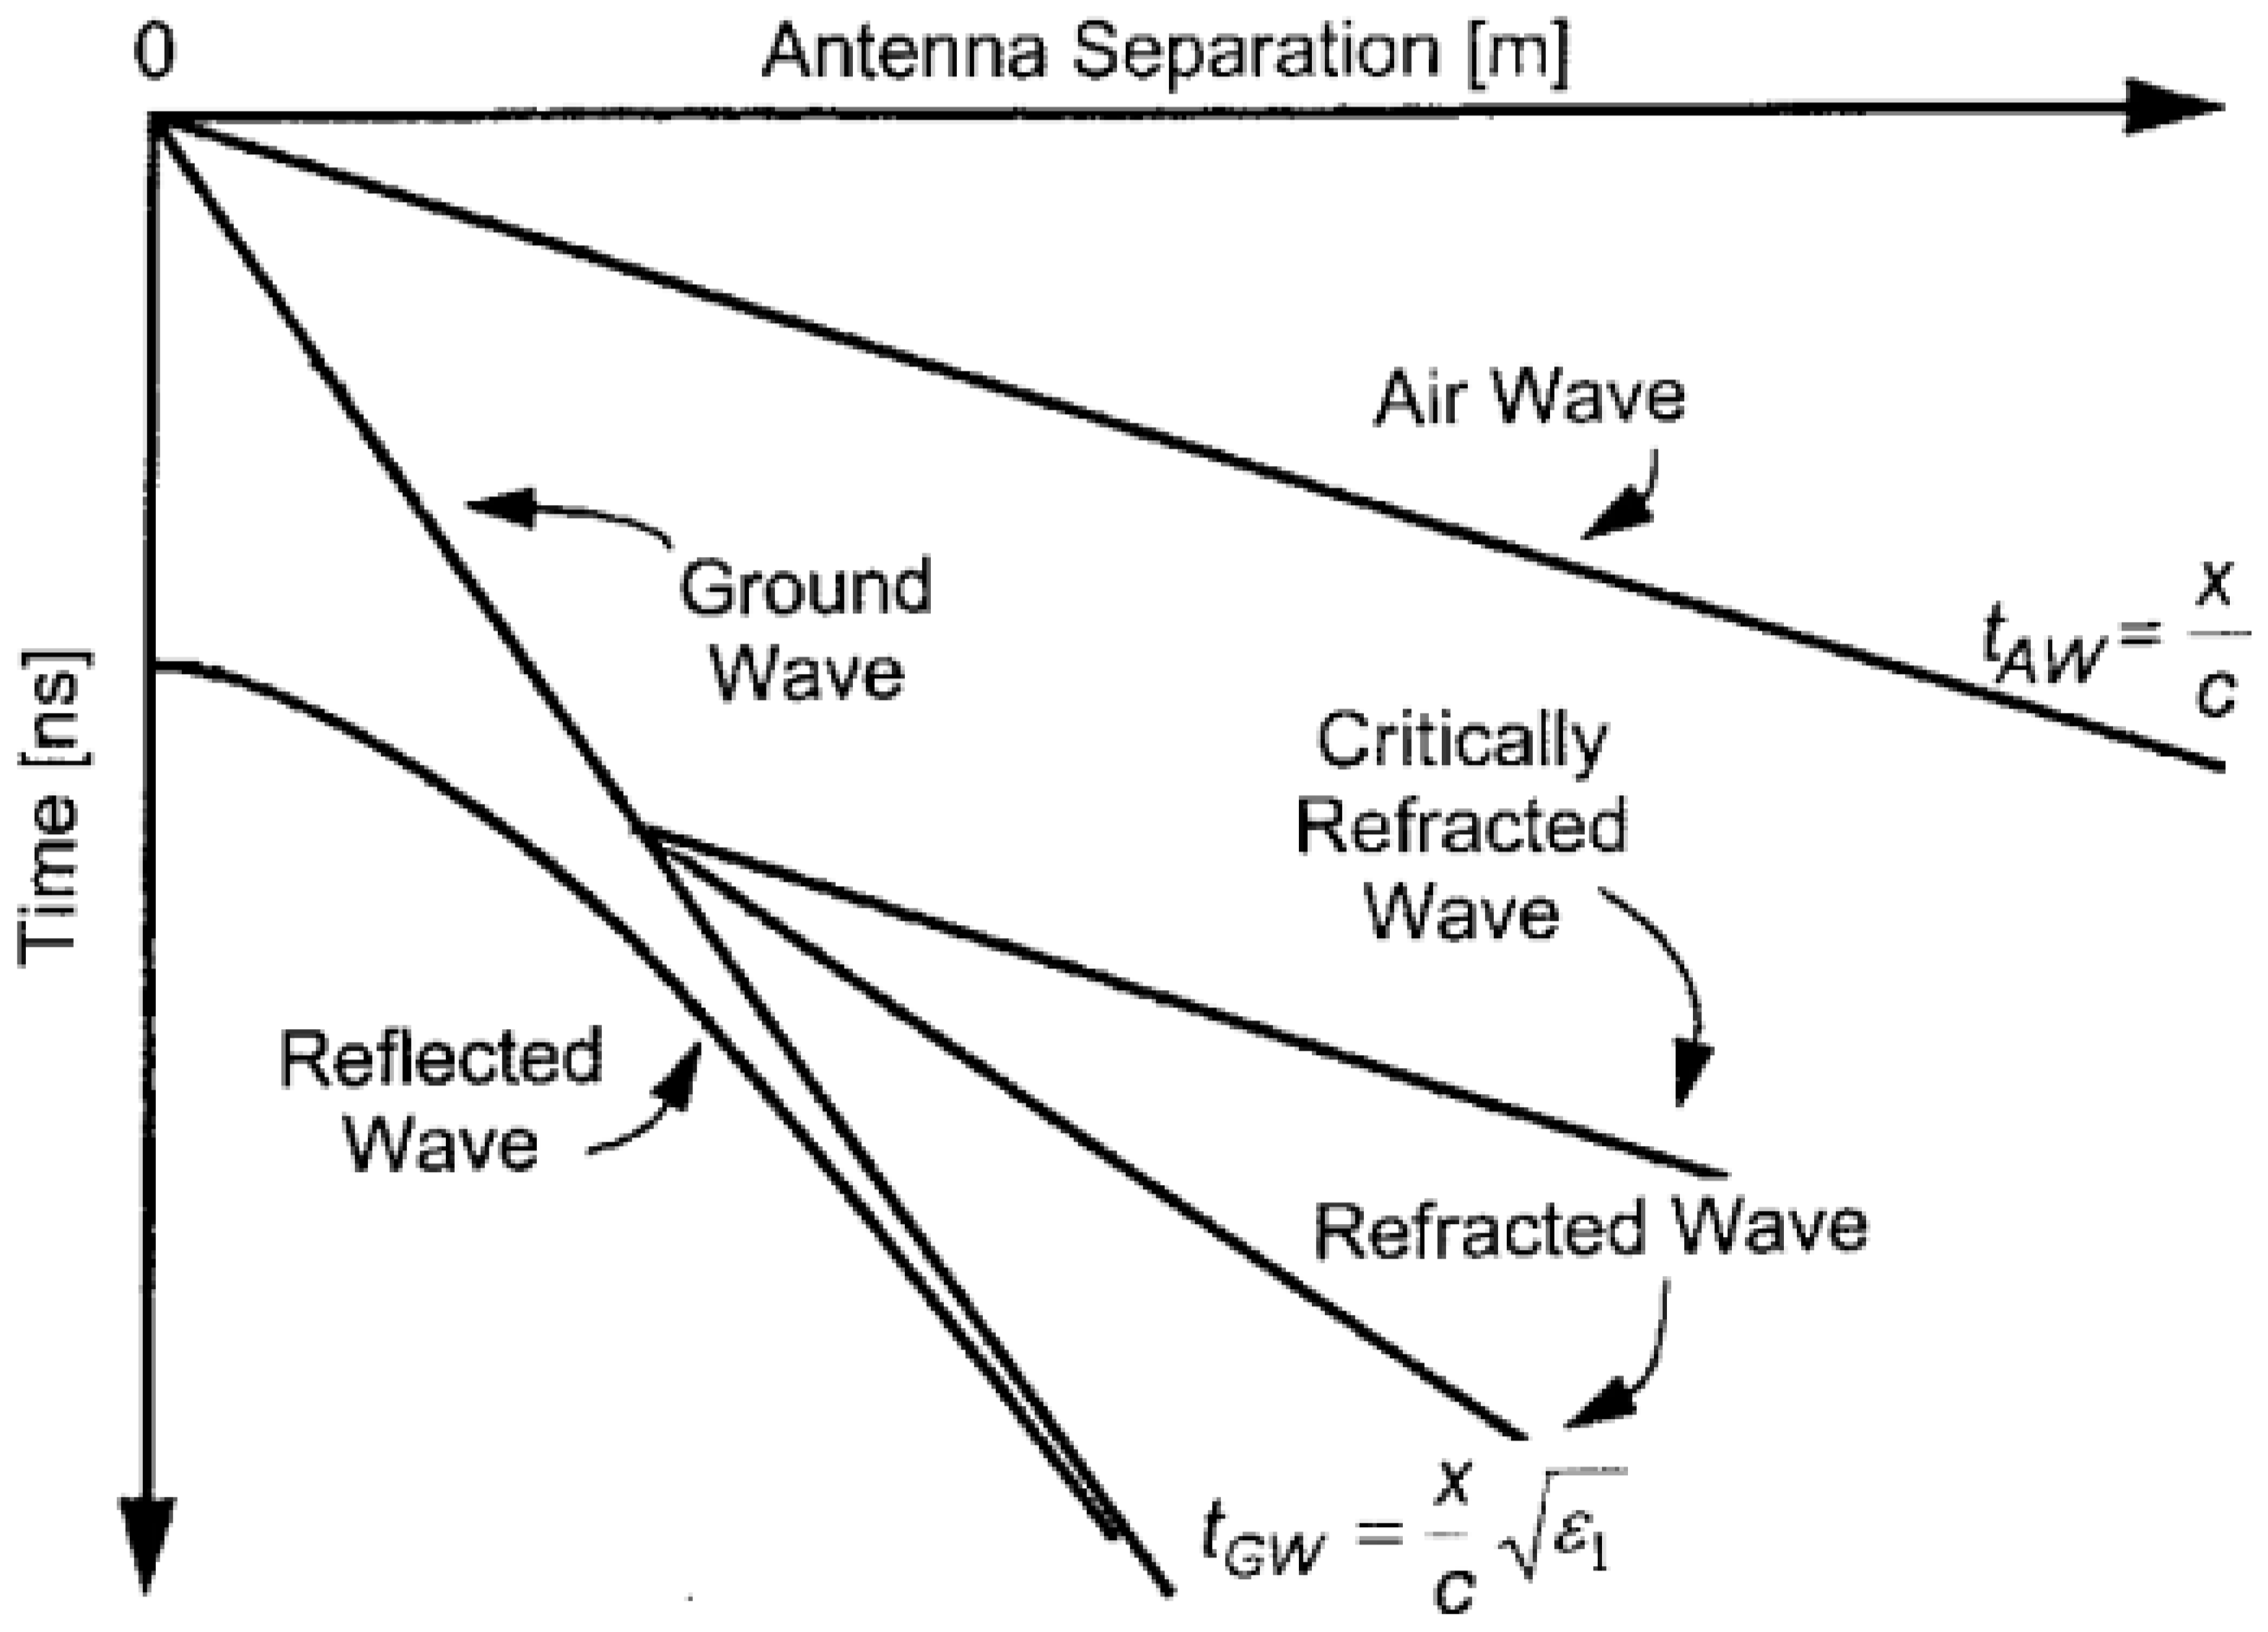
Multi-offset (MO) measurements are an alternative to single-offset measurements for estimating SWC from reflected GPR data. CMP and WARR are two common multi-offset-measurement approaches for GPR data acquisition. CMP measurement is realized by increasing the distance between the transmitter and receiver antennas step by step based on a common midpoint. For WARR measurements, the transmitter antenna is kept at a fixed position, and the data are acquired by increasing the distance between the transmitter antenna and receiver antenna by moving the receiver antenna step by step. Figure 6 shows a schematic figure of a multi-offset GPR measurement. If there are consistent reflected waves in the multi-offset GPR profile, SWC can be determined by fitting hyperbola to the reflected waves (Appendix C). In addition, for MO measurements, in order to avoid subjectively estimating SWC and to improve the efficiency of analysis, combining velocity analysis approaches and (semi-) automated methods has been proposed for calculating the average velocities to the depth of the reflector. Through the Dix equation (Appendix D), the average velocities can be transformed to the interval velocities of each layer [22,74,80].
Greaves et al. [25] calculated interval velocities from the normal moveout velocities derived in CMP velocity analysis with multi-offset GPR. The velocity information can be applied to estimate subsurface water content. The method was able to improve the radar profile and also allowed the interpretation of subsurface SWC variations. Mangel et al. [82] conducted a lab-scale short-duration infiltration experiment in a sand tank to investigate if NMO analysis of the WARR survey can be applied to continuously monitor water content, follow infiltration fronts, and describe soil structure. The study demonstrated that the transient multi-offset reflection has the potential to improve the description of the unsaturated zone.
Garambois et al. [74] proposed to integrate different geophysical methods like GPR, seismic, and electric methods for mapping near-surface porous formations.
When there is a thin, low-velocity layer or a series of sandwiched low-velocity layers between the air above, and a fast, low-porosity bedrock below, a guided wave will be generated. In this condition, simple velocity analysis of multi-offset surface GPR is not suitable. Strobbia and Cassiani [75] extend the analysis to multilayer waveguide systems due to a series of rainfall and evapotranspiration events. Through the limitation of total soil thickness, the velocity and thickness of the wettest layer can be inverted.
In the aspect of detected dimension, Bradford [76] used GPR from 25-fold common-source point acquisitions with 50 MHz antennas and reflection tomography in the post-migration domain for determining the velocity of the GPR wave and then estimated the 2D and 3D distribution of subsurface water. The approach is efficient for identifying the lateral variations in the GPR velocity structure and better understanding the heterogeneity of SWC at the interface between the unsaturated and saturated zones. Allroggen et al. [84] collected 4D GPR data in a dye tracer experiment. A CMP acquisition was performed near the infiltration area to estimate the velocity of electromagnetic waves. The results showed a change in travel time in the measured GPR data. According to the distinct horizons, such changes can be transformed into a change in SWC. The results demonstrated that 4D GPR imaging has the potential to noninvasively monitor the infiltration process and changes in SWC.
Buchner et al. [79] proposed a new inversion strategy by using surface common-offset GPR with different offset separations. Unlike the traditional method, which only used travel-time information, this inversion method constructed a cost function by using travel-time and amplitude information. By employing a synthetic dataset and real data, the geometry obtained by this proposed method agrees with the result gained from ground-truth data to within 5 cm. In addition, the difference in water content volume is less than 2% between the method’s result and ground-truth data.
Because the traditional measurement of multi-offset data is time-consuming and involves a high measurement effort, attention was focused on improving the efficiency of GPR data collection. Buchner et al. [78] introduced a multi-channel GPR method and investigated the applicability and accuracy for recovering the geometry of layers and estimating SWC with sufficient accuracy. Iwasaki et al. [85] applied array GPR to collect data in first common-offset and then multi-offset mode. Array GPR can collect multi-offset data in a short time in the field and can be used to monitor infiltration processes in the field. Kaufmann et al. [86] developed a new processing method for a novel simultaneous multi-offset multichannel (SiMoc) GPR system. The SiMoc GPR is a powerful tool for avoiding time-consuming data acquisition and quickly imaging spatially highly resolved permittivity. Saito et al. [88] applied a time-lapse GPR antenna array for monitoring the wetting front during a field infiltration experiment by calculating the speed of the electromagnetic wave at given elapsed times. The antenna array can accelerate the speed of collecting data and estimating SWC.
The ground wave method is widely used for multi-offset measurements. Through the linear relationship between the travel times of the ground wave and the separation of antennas, the ground wave can be easily identified in a multi-offset GPR profile. In the single offset ground wave method, the speeds of the electromagnetic waves in the soil are computed according to the travel time of the ground wave and the antenna separation [57,60,73]. In multi-offset measurements, the speed of the ground wave is directly related to the slope of the ground wave, therefore, the ground wave method can be applied to determine SWC.
Huisman et al. [73] identified the ground wave from a WARR measurement to evaluate the accuracy of using GPR and TDR to map volumetric SWC. They also considered a fixed antenna separation acquisition for mapping large area SWC. The results demonstrated that GPR is a promising technique for measuring SWC. However, the ground wave method was not suitable for high-conductivity soils, which result in a strongly attenuated ground wave. To further examine the ability of GPR to map SWC, Huisman et al. [89] carried out an irrigation experiment and applied a fixed antenna separation acquisition to collect data. They also compared the types of spatial SWC structures obtained by GPR and TDR.
Hubbard et al. [90] applied spatially dense, high-resolution GPR ground wave data to map SWC at a naturally heterogeneous agricultural site located at a California vineyard. Common offset and borehole data were also collected at the same time. The results show that multiple-frequency GPR is a potential tool for improving precision vineyard management and increasing the savings in water.
Grote et al. [60] applied GPR ground wave techniques at a California vineyard to estimate SWC in the uppermost 10 cm of a three-acre site. They performed several measurements over 1 year. The spaced GPR travel times were collected using 900 and 450 MHz antennas for estimating SWC. The results indicated that GPR ground waves were non-invasive and spatially dense and can estimate shallow SWC in large areas and a rapid manner.
Galagedara et al. [93] studied the effective sampling depth of the GPR direct ground wave method using GPRMAX2D modeling. They simulated a CMP survey to calculate the direct ground wave velocity. The results show that ground wave sampling depth changed with the antenna frequency and the change in SWC at the upper layer. There was a very strong linear relationship between the wavelength and the sampling depth of the GPR direct ground wave. Galagedara et al. [59] applied a 450 MHz GPR system at a sandy loam soil site. A field study was carried out for optimizing the measurements of WARR and FO modes in the aspect of ground wave velocity measurements. The effective ground wave sampling depth under the conditions of irrigation and drainage was also determined. A comparison of SWC from WARR and FO showed that a 1.5–2.0 m antenna separation distance was needed for achieving similar results with WARR.
Grote et al. [91] applied ground wave data collected with 450 and 900 MHz antennas four times to explore the change in SWC with sampling depth, season, vegetation, and soil texture. The results could be applied to effectively describe the variation in water content for precision agriculture applications.
Although the direct ground wave method has been applied in many studies, these studies were limited to controlled irrigation, minimal natural variations, or minor changes in soil texture. Steelman et al. [95] used direct ground wave measurements with 225, 450, and 900 MHz GPR for monitoring a complete annual cycle of SWC in CMP mode. This method is also suitable for a range of natural soil conditions and may provide a characterization of soil moisture dynamics for seasonal soil conditions because of its non-invasive nature and larger sampling volume.
In order to deal with the limited temporal sampling and low resolution, Steelman et al. [81] combined a high-frequency (900 MHz) reflection profile and CMP to quantitatively monitor soil water distribution and dynamics and performed a 26-month field study. The reflection profile provided high-resolution information on travel time, which can be used to monitor the soil water variations between the reflection interfaces. CMP, with the direct ground wave method, was applied to determine the EM velocity and the soil–water interval. These allowed the author to characterize the shallow soil water dynamics on various time scales such as the seasonal scale and transient scale.
Cao et al. [96] focused on subsoil moisture estimation and investigated 3D SWC variation down to a depth of 1 m and the influence of rainfall on the spatial dynamics of SWC. In order to improve the accuracy, the petrophysical empirical relationships of different depths were quantified.

2.2. Borehole GPR for SWC Measurements

2.2.1. ZOP Borehole GPR for SWC Measurements

In ZOP measurements, the transmitter and receiver are moved simultaneously step by step between two boreholes, and the midpoints of these two antennas are kept at the same depth. In earlier studies, the distance between the two boreholes was known. The arrival time of the direct wave was used for calculating the velocity and soil permittivity. By using a petrophysical relationship, the SWC profile between the two boreholes can be determined. ZOP is a high spatial resolution and large sampling volume method for measuring the transient processes in the vadose zone.
Binley et al. [102] conducted 100 MHz cross-hole GPR surveys in ZOP mode for collecting data over a period of two years. Through the first arrival and the distance between boreholes, the velocity could be determined. Then, the water content could be estimated through the petrophysical relationships derived from core scale measurements. The results from single borehole resistivity and cross-hole GPR were also compared. Similar patterns of water content were observed throughout the unsaturated thickness.
Galagedara et al. [103] applied 200 MHz borehole GPR to investigate the variation in SWC before and during infiltration and drainage experiments. ZOP mode was used and the velocity was estimated by picking the first arrival at about 1.0 m below the ground surface. This study also identified potential preferential flow zones and compared them with results from TDR.
One of the problems with the ZOP mode is that it depends on the determination of electromagnetic wave velocity that follows a direct path from the transmitter to the receiver. If the critically refracted energy which transmits along the ground surface with the speed of electromagnetic waves in air arrives before the direct waves through the subsurface, the critically refracted energy may be mistakenly considered as the direct waves and the water content will be underestimated. Rucker and Ferré [105] proposed an analysis to estimate the water content above the depth of refraction termination by applying the slope of travel time and depth. The proposed method was tested in an infiltration experiment with 100 MHz borehole GPR. The results showed that this method is a good alternative to standard borehole GPR analysis. In the same year, Ferré et al. [108] investigated if a high-resolution SWC profile can be obtained when the vertical sampling interval is less than the length of the antenna. The results demonstrated that the resolution depends on the measurement sampling interval. Through a pumping experiment, the borehole GPR measured value migrated downward constantly by comparing the maximum depth of drainage during pumping and recovery with the measured water table depth. This may be due to the capillary fringe effects, refraction above the capillary fringe, and the referencing of borehole GPR to the middle of the antenna. Further study will be needed for determining these factors. Rucker and Ferré [106] further built standards for identifying first-arriving critically refracted waves from travel-time profiles. This correction method greatly improved the estimation of water content profiles in layered systems. However, this method is limited due to the existence of thin, high-water-content layers. To avoid the time-consuming task of hand-fitting the slopes, Rucker and Ferré [107] developed a technique for reconstructing the velocity by global search optimization of simulated annealing. The Monte Carlo method was also used to estimate the stochastic parameter for quantifying the uncertainty of water content because of travel-time measurement errors. The thin layers can also be identified effectively.
Integrating geophysical measurements into inverse methods is a promising method for solving the problems of ill-posedness and non-uniqueness when the SHP is inverted at the unsaturated zone. Kowalsky et al. [109] estimated flow parameter distributions in the unsaturated zone by combining hydrological and borehole GPR measurements during a transient flow experiment. The distribution of log permeability and additional flow parameters can be determined in a maximum a posteriori (MAP) inversion framework with the pilot point method. The obtained parameter distributions can be applied for hydrological modeling and the obtained posterior parameter probability density functions (pdfs) can be used for quantifying the uncertainty in parameters.
In order to further investigate how the change in small-scale soil influences the growth of plants and how SWC changes in several seasons for various soil and plant types. Klotzsche et al. [114] combined multiple horizontal GPR surveys at various depths for mapping the spatial and temporal variability of SWC under cropped plots. The time-lapse GPR data was collected between 2014 and 2017 and covered four growing seasons.

2.2.2. MOP Borehole GPR for SWC Measurements

In MOP mode, the transmitter firstly is fixed at a certain depth in one of the two boreholes. In another borehole, the receiver is moved step by step. For the next acquisition, the transmitter is moved to the next position. The receiver is then once again moved repeatedly step by step just as in the previous measurement. Applying the first arrival times of direct waves from all multi-offset measurements and petrophysical relationships, the SWC 2D tomography image between the boreholes can be constructed through travel-time tomography analysis [99,100,115,117]. In order to obtain the 2D tomogram, discretization between the boreholes is firstly conducted in rectangular cells of constant velocity and the velocity of each cell is calculated by minimizing the difference between measured arrival times and calculated arrival times from ray-paths that pass through these cells. However, the disadvantage of tomograms is that they need much longer times for obtaining the required results. Therefore, the MOP mode is more suitable for steady-state conditions of SWC.
Hubbard et al. [115] applied time-lapse tomographic radar to estimate permeable pathways and monitor water distribution. The “dielectric difference” cross-sections from time-lapse processed data can enhance subtle geophysical attribute variations because of dynamic processes such as steam flooding, infiltration, and hydraulic fracturing.
In order to better monitor the temporal variability of water content, researchers started to focus on the combination of different methods. Binley et al. [100] used MOG and ZOP—two kinds of cross-hole GPR measurements—to assess the temporal variability of water content at a specific field site. The first arrivals were picked manually in both measurement modes. They monitored the change in the response when a water tracer was injected and continued monitoring over a period of 18 months. Looms et al. [110] integrated cross-hole electrical resistivity tomography and GPR to estimate temporal and spatial changes in water content. The ZOP mode and MOP mode were used for acquiring the GPR data. Through monitoring tracer infiltration, the combination of the two methods provided a new way of monitoring the process of infiltration. However, the uncertainty in the inversion procedure remained a problem that had to be avoided.

2.2.3. VRP Borehole GPR for SWC Measurements

Unlike cross-hole measurements (ZOP and MOP), VRP measurements require only one borehole for the descending movement of the receiver. The transmitter is put on the ground surface at different fixed distances from the receiver [17]. VRP mode has reduced depth of investigation and decreased accuracy compared with ZOP and MOP, however, it has a better depth of investigation than surface and off-ground GPR. In addition, unlike ZOP and MOP, VRP requires only one borehole; thus, it is less invasive and cheaper than ZOP and MOP. VRP also has the ability to investigate the near-surface. This solves the problem that borehole GPR with investigating the near surface because of the interference of direct, reflected, and critically refracted waves. To avoid the interference of direct waves between the transmitter and receiver for the critically refracted waves, a suitable distance from the transmitter to the borehole is necessary.
Knoll and Clement [97] demonstrated that VRP is an accurate, high-resolution, and cost-effective method for determining volumetric moisture content. Dafflon et al. [120] developed a robust procedure for realizing inversion with 31 intersecting cross-hole GPR datasets. The purpose was to build a realistic radar velocity model that can be applied in subsequent hydrological investigations. The proposed method is robust, flexible, and able to deal with a lot of datasets of different quality through the combination of different travel-time correction parameters. The model can also provide help for identifying the contacts between major stratigraphic units, confirming variability differences between units and describing subunits that show anomalies in both the dielectric permittivity and electrical conductivity.
Borehole GPR is an important specific-site investigation method for obtaining SWC images with high resolution and great depth. However, there are still several points and drawbacks that should be paid attention to for this method. Firstly, the effect of the critically refracted wave should be considered. When there is a low-velocity zone, the receiver may first receive the refracted wave, which will affect the accuracy of SWC measurements. Secondly, unlike surface or off-ground GPR, borehole GPR is invasive and the measuring scale is limited. The length of the antenna, the separation distance between boreholes, and the frequency of the antenna have an influence on spatial resolution. In addition, the sampling volume of borehole GPR is also influenced by soil heterogeneity. Finally, most of the borehole GPR methods are based on ray-based methods, which just apply a small part of the data information. This will have an effect on the resolution. In recent years, with the wide application of full waveform inversion (FWI) in GPR, using borehole GPR with FWI is one of the most promising methods for measuring and monitoring SWC.

2.3. Off-Ground GPR for SWC Measurements

Off-ground GPR is another method for determining SWC. It is less invasive than surface or borehole GPR. For SWC measurements with off-ground GPR, the commonly used method is surface reflections. The soil permittivity can be calculated through the reflection coefficient, and, then, according to the petrophysical relationship, SWC can be computed (Appendix D). Chanzy et al. [123] considered the airborne mode and combined it with the ground mode for evaluating the GPR capability for determining SWC. The data were obtained with 200 MHz GPR. They demonstrated that the off-ground method has potential in the estimating of SWC, however, their measured reflection coefficients were lower than expected values.
Redman et al. [124] used 500 MHz off-ground GPR for acquiring surface reflectivity data. They found that the water content measured from GPR surface reflectivity data was different from the water content determined by TDR due to surface scattering, lateral variations, or other spatial variabilities in water content. They further investigated the influence of a horizontally stratified water content distribution on the water content estimated using the surface reflectivity method [125].
Serbin and Or [126] applied a suspended horn antenna GPR for mapping continual diurnal measurement of surface SWC dynamics. Through a comparison with gravimetric and TDR methods, the surface reflection method was considered the most suitable for estimating surface SWC dynamics.
Lambot et al. [128] applied a promising method to invert the SWC profile under the condition of continuous variation. In this inversion method, the off-ground GPR system included an ultrawideband (UWB) stepped-frequency continuous-wave (SFCW) radar with a monostatic transverse electromagnetic (TEM) horn antenna. Through the global multilevel coordinate search (GMCS) optimization algorithm with local the Nelder–Mead simplex algorithm (NMS), the inversion was carried out iteratively. The results of synthetic experiments demonstrated the well-posedness of the inversion for identifying an SWC profile under specific conditions. Jadoon et al. [131] applied this method to estimate soil surface water content over a bare agricultural field. Zero-offset, off-ground GPR with a low-frequency 0.2–2.0 GHz monostatic horn antenna was applied. Through inverse modeling and a comparison with TDR, the method was shown to have the potential to measure and monitor surface SWC at the field scale. Jonard et al. [135] combined the full-waveform GPR model of Lambot et al. [140] with a roughness model for estimating surface SWC by inversion of the signal. This is the first time that roughness was considered for off-ground GPR measurements.
If the presence of thin soil layers is not properly considered, it will affect the estimation of SWC. Minet et al. [132] considered the presence of thin soil layers and applied the full-waveform inversion of off-ground GPR data to analyze the influence of the shallow thin layers for the determination of SWC. The proposed GPR method has the potential to map the SWC of nondispersive soils with low electrical conductivity at the field scale.
Tran et al. [137] proposed to integrate different mixing models of the effective complex permittivity into the full wave inversion of off-ground GPR for determining SWC. SWC can be estimated directly from the inversion of GPR signals without considering the dielectric permittivity. The proposed method opens a newly developed avenue for mapping SWC by GPR.
Moghadas et al. [139] carried out laboratory experiments with two off-ground ultrawideband stepped-frequency continuous-wave radars. The frequency ranges were 3.0–5.0 GHz and 0.8–5.0 GHz. Based on the experiments, the accuracy of the off-ground GPR was investigated for monitoring SWC during extended evaporation phases. Full-waveform GPR forward modeling was performed for determining the best petrophysical relationship and combined with full-waveform GPR inversion to estimate SWC during evaporation.
Mangel et al. [83] introduced an automated bistatic GPR data-collection system. This system can realize the fast acquisition of COP and CMP profiles and can monitor dynamic hydrologic processes with high spatiotemporal resolution.
Off-ground GPR is rapid and simple for collecting GPR data, so it is a suitable method for monitoring and mapping field-scale SWC with high-resolution. It is also less harmful to the soil ecosystem due to its non-contact with the surface during measurement [63]. However, there are still some drawbacks to this method. The first drawback is that the depth is limited for obtaining information from deep soil horizons. Another drawback is that the off-ground GPR is highly sensitive to soil surface roughness and vegetation.

2.4. Other Advanced Methods for SWC Measurements

With the development of technology, some new methods were proposed to improve SWC detection of GPR based on traditional measured modes. These methods include full waveform inversion (FWI), average envelope amplitude (AEA), and frequency shift methods. They have their advantages and limitations as supplements to traditional measurement methods.

2.4.1. Full Waveform Inversion (FWI)

FWI is a newly emerging technique for SWC investigation with GPR. Most traditional GPR methods only use parts of the measured data such as first arrival or first cycle amplitude. However, the advantage of FWI is that this method applies the information of the entire waveform to describe the subsurface with a higher resolution [141,142,143]. With the improvements in computing power, FWI is gradually being widely used. FWI was first applied for seismic inversion and is regarded as a facilitating tool for proving high-resolution characterization of the subsurface [144]. The procedure for FWI is to give an initial model and conduct forward modeling to obtain a simulated radar signal. Then, in order to obtain the final distribution of permittivity, the initial model is updated by minimizing the difference between the simulated signal and the observed signal based on certain algorithms. Finally, according to the permittivity, SWC can be estimated.
The application of FWI for determining SWC with GPR can be traced back to 2004. Lambot et al. [140] proposed the inversion method to invert the full waveform of the radar signal in the frequency domain with off-ground GPR. The observed and modeled GPR data were represented by Green’s function of the full-wave GPR. The objective function was constructed based on Green’s function of the GPR. Lambot et al. [129] applied this method to estimate surface SWC. Compared to the common surface reflection method, full-wave inversion showed advantages and was able to improve the accuracy of SWC profiles. Weihermüller et al. [94] further applied this method at the field scale together with a ground wave method. The ground wave was measured using 450 MHz bistatic impulse GPR and off-ground GPR was also applied at the same time. However, the results showed that neither method provided enough information for the change in SWC at the field scale. The ground wave method presented serious deviation because of the high silt and clay content, while the off-ground method proved to be highly sensitive to the dry surface layer.
The above studies focus on the so-called far-field condition. In this condition, the electromagnetic wave can be approximated to a planar field. However, the approximation does not hold when the antenna aperture dimension is smaller than the distance between the antennas. Lambot and André [145] further proposed a new near-field radar modeling technique for studying wave propagation in planar layered media. The Debye model was used to describe the frequency-dependent electrical properties and a full-wave inversion was applied to calculate the thicknesses of the layers. Tran et al. [138] applied this method to evaluate the space-time variability of SWC at the field scale with a hillslope. SWC from GPR and frequency domain reflectometry (FDR) showed good agreement. Then, the SWC from the two methods were merged into a data fusion framework and the spatial and temporal variability of SWC were investigated. The results demonstrated that this method has the potential to evaluate SWC at the hillslope scale with a high resolution. Unlike the method that builds the objective function with the Green’s function of the GPR, Zhang et al. [55,56] inverted the change in SWC by comparing the total GPR waveform during a series of infiltration, imbibition, and drainage experiments.
Although FWI shows the potential for providing high-resolution images and calculating multiple parameters simultaneously, its complexity and time consumption are still limitations. In particular, the Jacobi or Hessian matrix is calculated during the inversion. There have been some studies of FWI for determining SWC in static conditions, but there are very few studies for monitoring SWC by using FWI. FWI still has more room for development for determining and monitoring SWC, and even inverting the SHP.

2.4.2. Average Envelope Amplitude (AEA) Method

In the measurement of surface GPR with common-offset antennas, it is difficult to separate the air and ground waves [60,63]. AEA analysis of the early-time signal is an efficient method for avoiding this problem. Because the early-time part of a GPR signal which includes the air and ground wave wavelets will change with the soil electrical parameters such as dielectric permittivity and conductivity, the waveforms exhibit different variations in terms of shape, amplitude, and time-stretching. Corresponding to lower soil permittivity values, the waveforms show higher amplitudes and shorter wavelengths (Figure 7).
Pettinelli et al. [65] proposed the AEA of ETS. Ferrara et al. [67] assessed the capacity of the early-time amplitude method under a natural field environment where surface roughness, lithology, vegetation, lateral heterogeneities, and water content dynamics are uncontrolled. In a comparison with the CMP ground wave method for estimating SWC, the early-time method yielded consistent results and accurately predicted shallow SWC. In clay-rich soils, traditional methods such as the ground wave method and reflection-based GPR mostly are unsuccessful. Algeo et al. [68] demonstrated the applicability of early-time amplitude analysis of GPR for monitoring SWC in clay-rich soils.
The AEA method is a suitable alternative method for determining SWC by GPR to the traditional FO mode. The AEA method can also obtain the spatial distribution of SWC at a large scale. However, a relationship between AEA and soil permittivity should be built before realizing this method. In addition, the GPR configuration, background noise, and media heterogeneity also affect the early-time signal. Hence, further improvements need to be made, especially for operations in the field.

2.4.3. Frequency Shift Method

The frequency shift method directly estimates SWC from the frequency spectrum of the signal in the frequency domain. It is a convenient method. Using the fast Fourier transform (FFT) alone, SWC can be determined by finding the peak of the frequency spectrum. The empirical relationship between SWC and the peak of the frequency spectrum can be expressed as follows [23,69]:
θ = ( A f p e a k ) B
where A and B are the regression coefficients and f p e a k is the peak frequency.
Based on Rayleigh scattering theory, Benedetto [69] proposed the frequency shift method and confirmed the effectiveness of this method with ground-coupled GPR in later studies [70]. The results showed that the peak of the frequency spectrum GPR signal tends to shift to lower values when SWC increases. Benedetto et al. [71] applied this method to an agricultural field.
The frequency shift method shows potential for mapping SWC and monitoring soil water dynamics over a large area. It doesn’t estimate the dielectric permittivity and doesn’t need any calibration. This method can directly determine the water content by frequency analysis. However, this technique is relatively new compared with other methods. Additional investigations in the field are needed to improve this technique.

2.5. Experiments of SWC Detection with GPR

In this part, we report the results of some experiments conducted to show the capability of GPR in detecting SWC.

2.5.1. GPR Data from a Sand Box Experiment

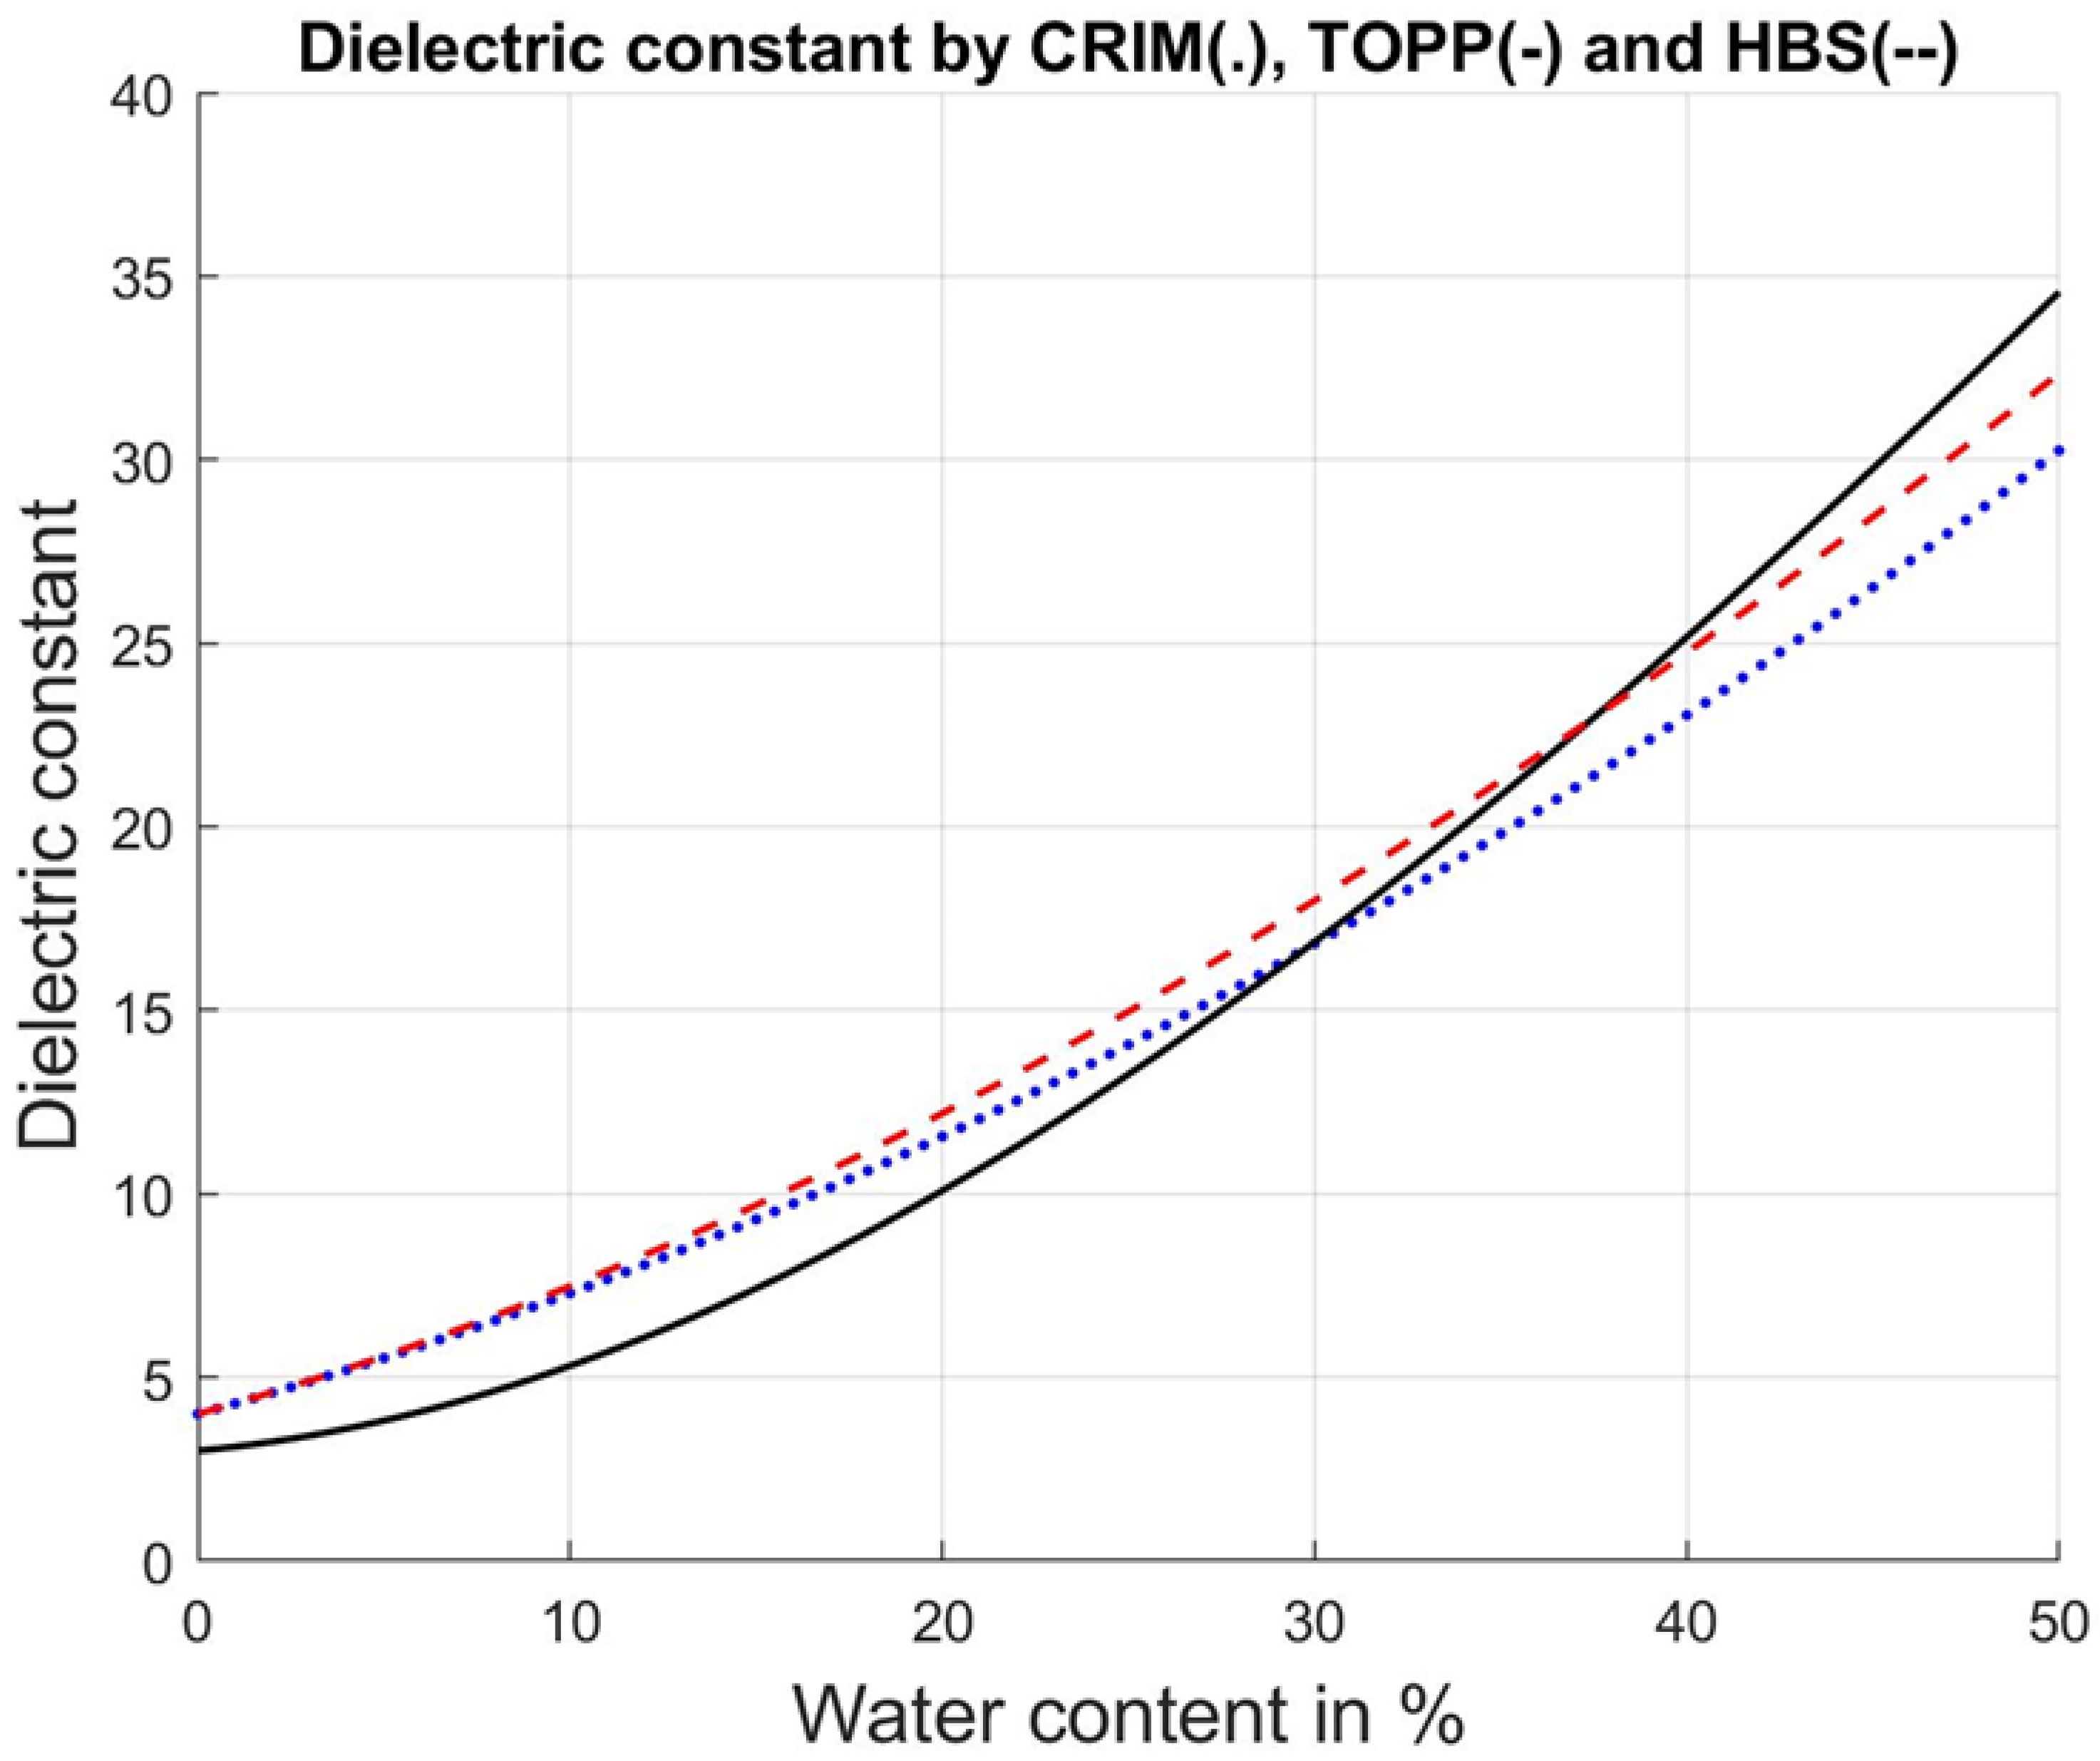
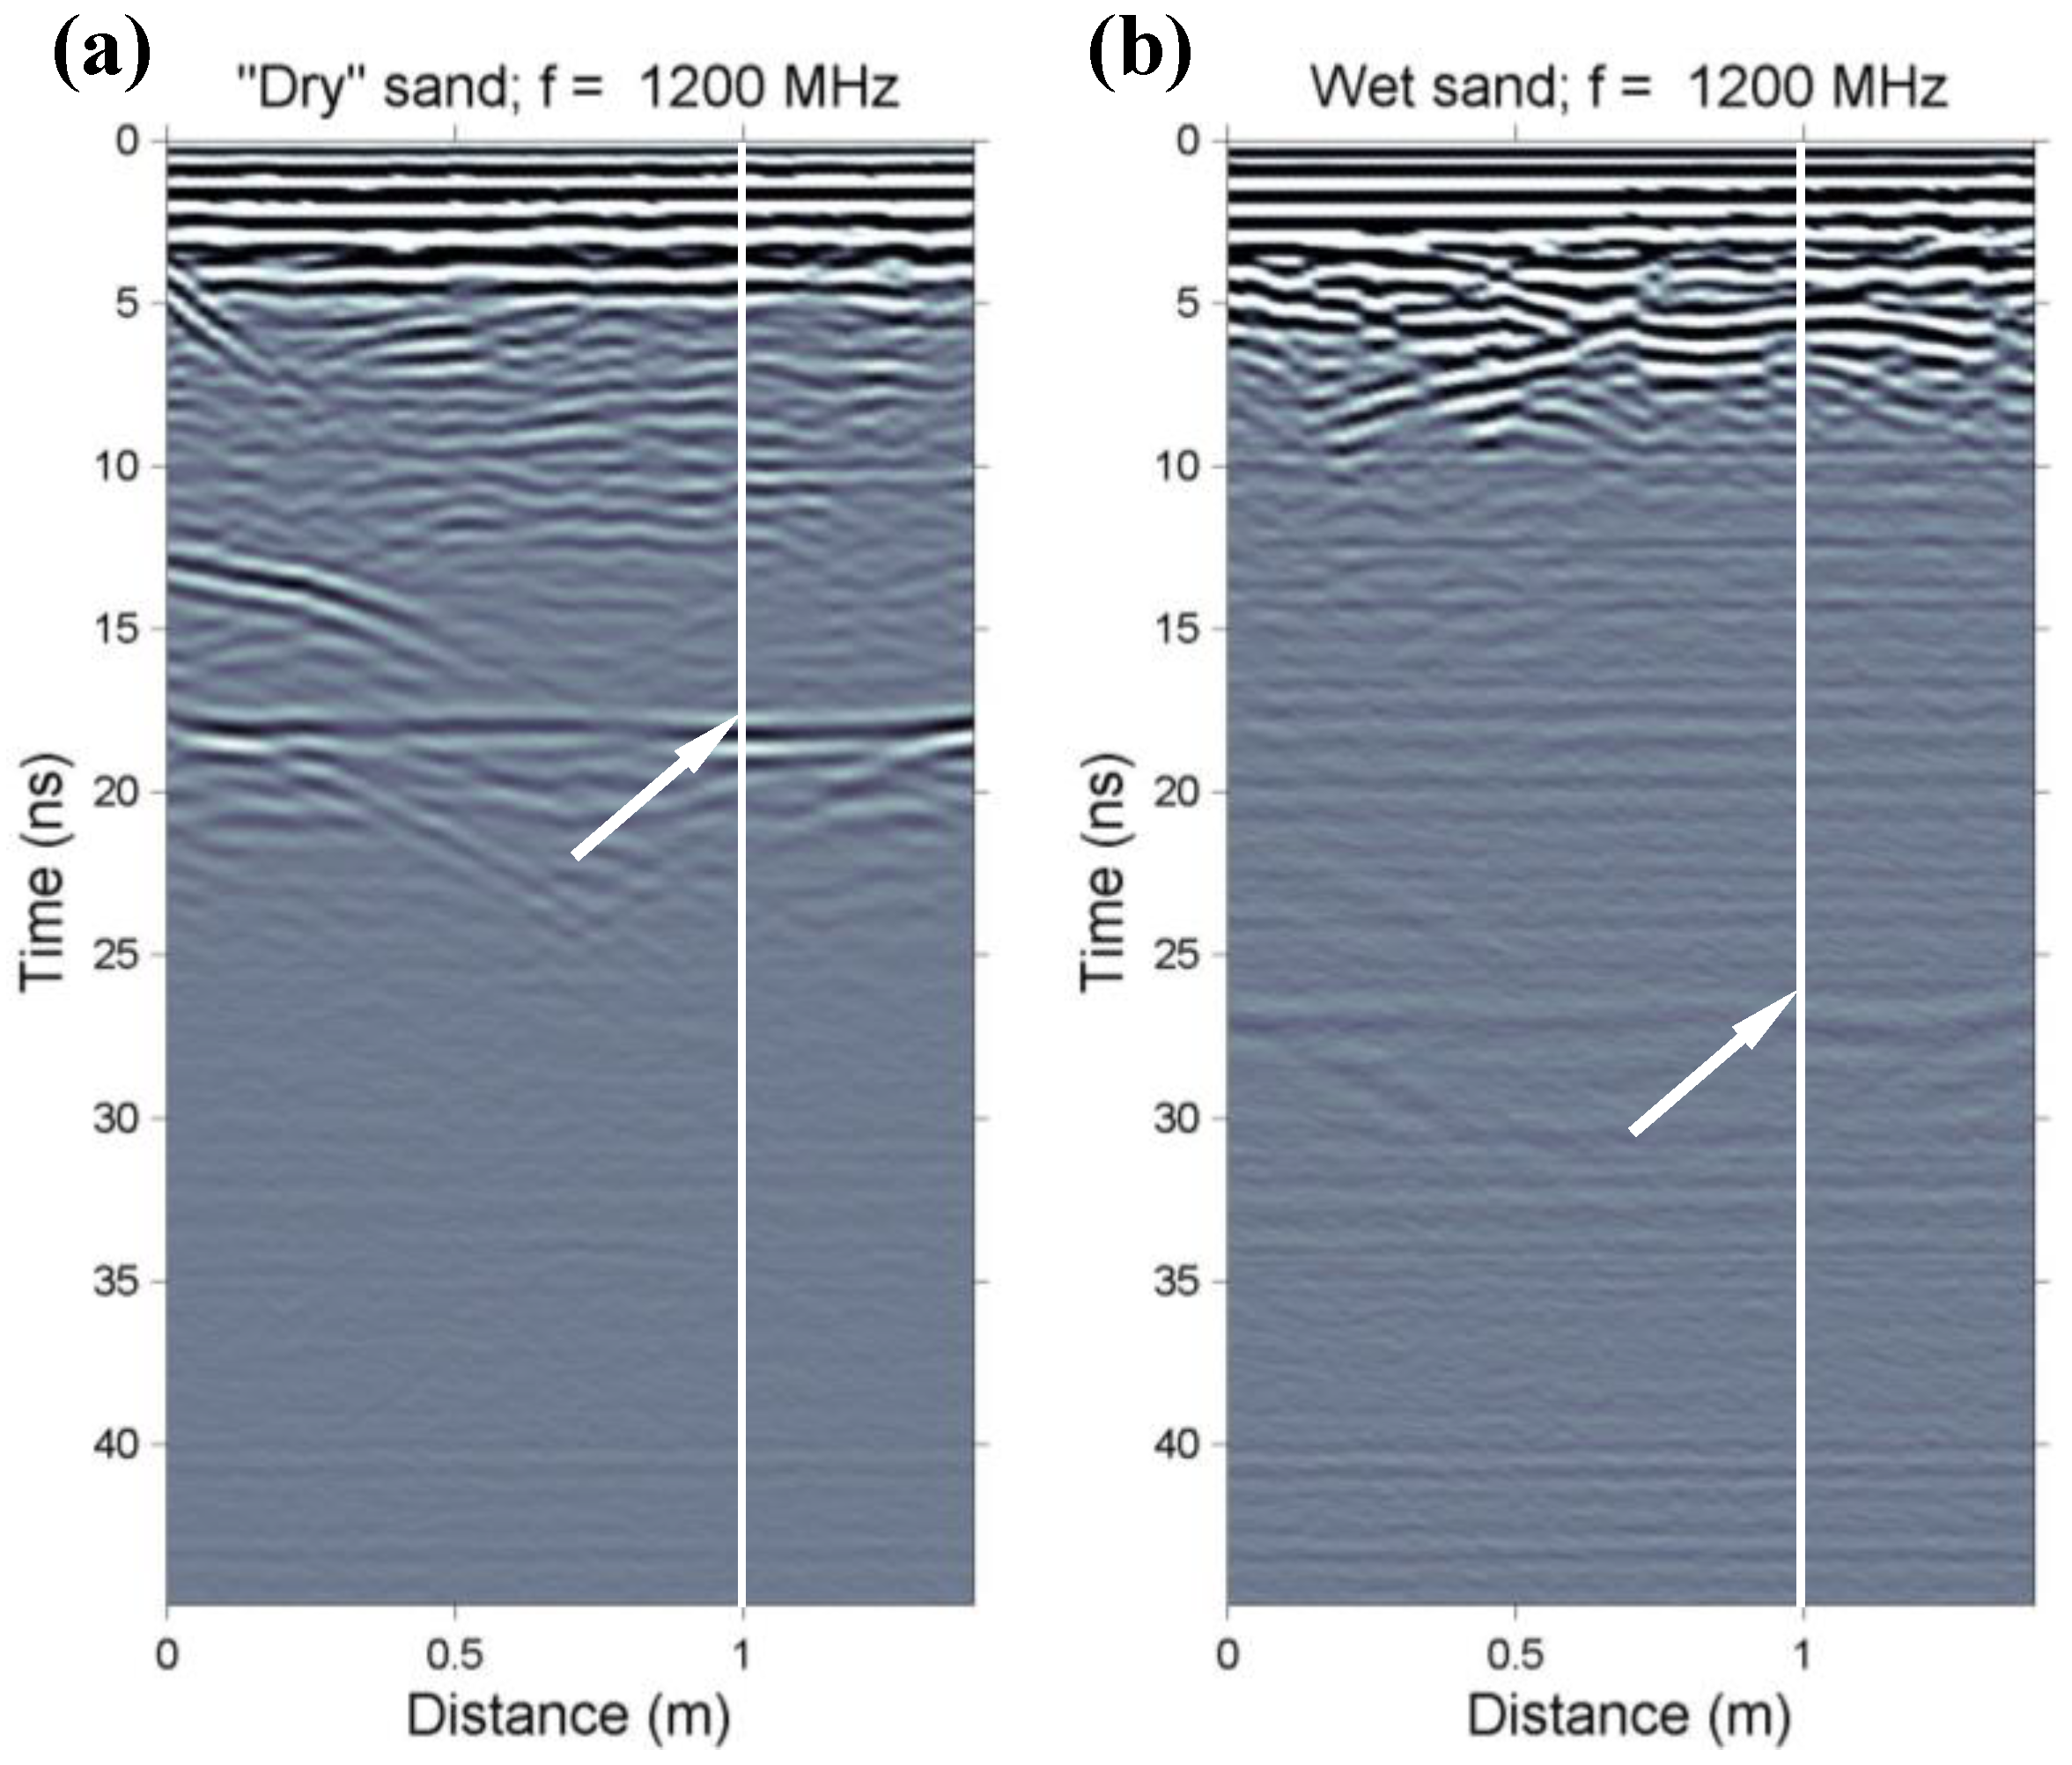
Figure 8 shows two common-offset GPR profiles obtained at the same location with a 1200 MHz antenna in a sandbox experiment. The box is made of resin and its height and diameter are 1 m and 2 m, respectively. The setup of the experiment and the GPR measurements follow the approaches of Loeffler and Bano [36] and Bano et al. [147]. In the case of Figure 8a, the sand is “dry”, while in Figure 8b the sand is wet (the water level is 48 cm below the surface of the sand). The white arrows in Figure 8 indicate the reflection coming from the bottom of the box at 1 m depth. From these figures, we can estimate the two-way travel time of the reflection coming from the bottom (see vertical white lines), which are found to be 17.25 ns and 26.5 ns, respectively, for Figure 8a and 8b. Then from the simple relation t = 2z/V (t is the time, V the velocity, and z = 1 m), we find that the velocities are 0.1159 m/ns and 0.0775 m/ns for each case, respectively. Finally, from the relationship V = c/sqrt(κ) with c = 0.3 m/ns (the velocity of the free space), we can estimate the dielectric constants of dry and humid sand. We find the values of κdry = 6.7 and κwet = 15.8. From the TOPP equation (Appendix A), we, therefore, estimate the water content θ to be 11.9% and 28.8%, respectively, for dry and humid sand.
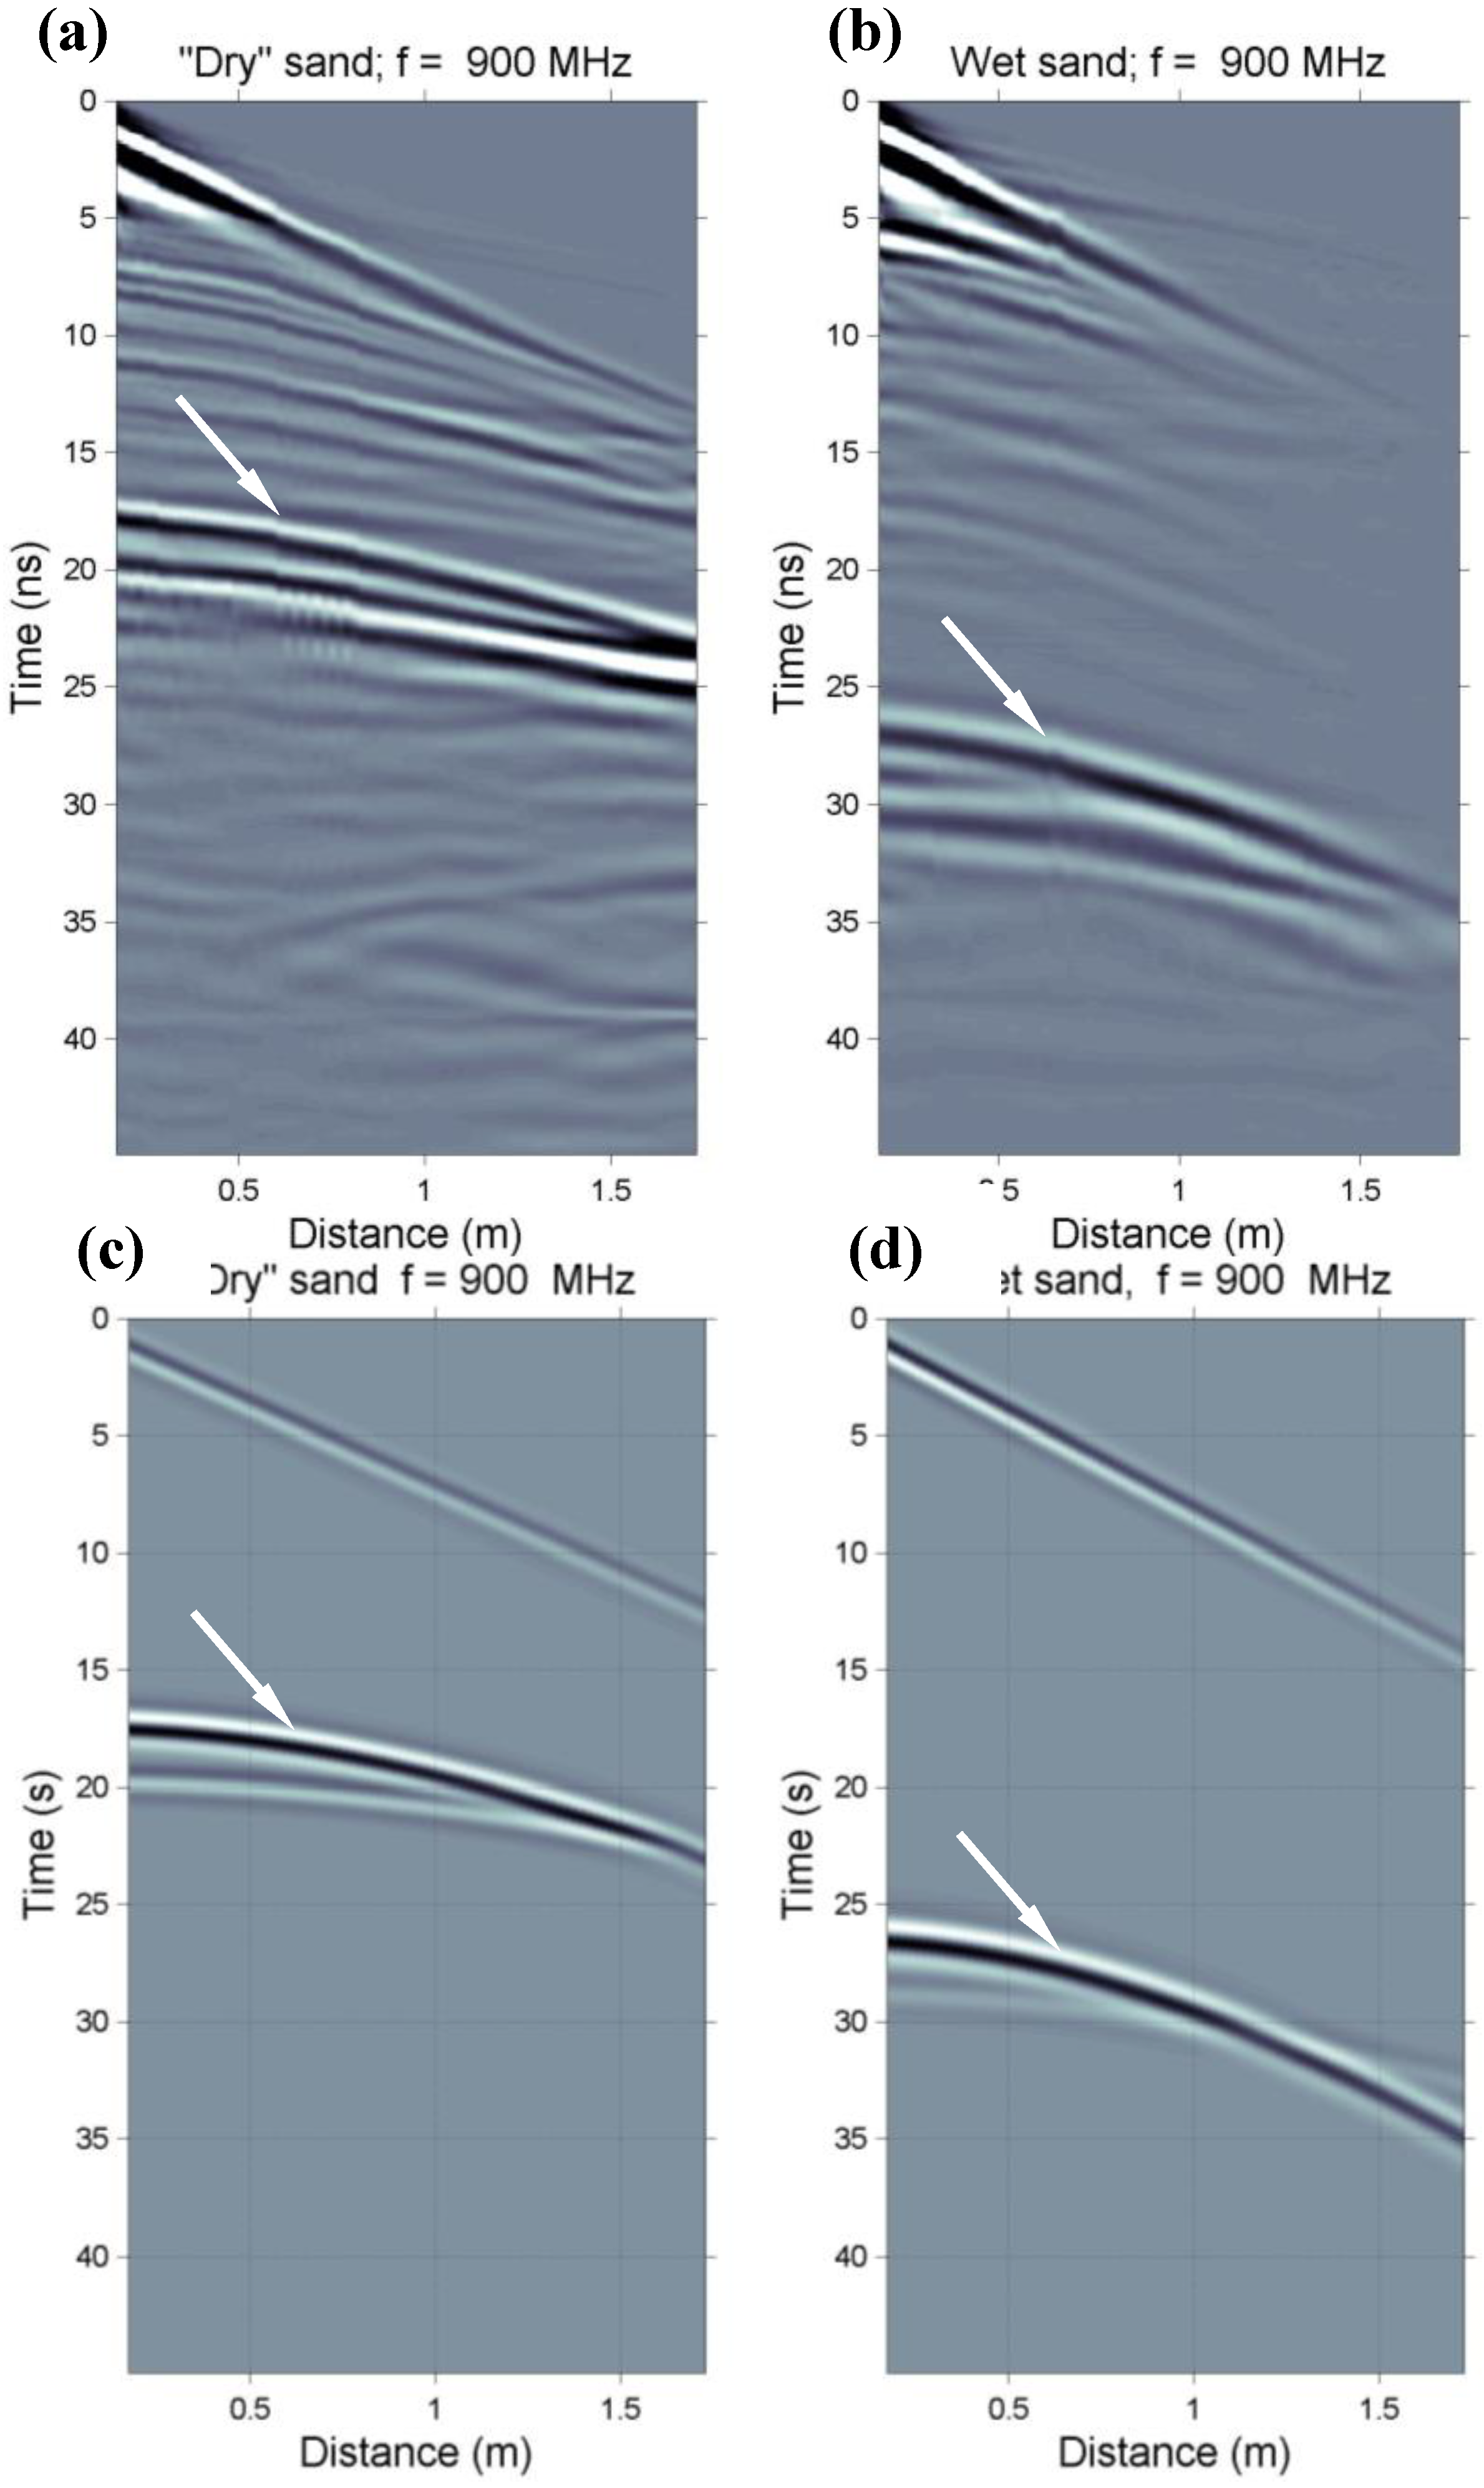
In Figure 9, we show two CMPs obtained with a 900 MHz antenna in the case of “dry” sand (Figure 9a) and wet sand with a water level 48 cm below the surface of the sand (Figure 9b). The CMPs are positioned in the middle of the common-offset profiles shown in Figure 8. Figure 9c,d present modeling performed in the frequency domain. Using 2D ray tracing, we calculate the two-way travel time for each arrival considering an initial distance (offset) between the antennas of 0.17 m. Afterward, for each calculated travel time, we propagate in the frequency domain the radar source (which is a rotated 4th-order Ricker with a dominant frequency of 900 MHz) and add the results. Finally, we apply an inverse Fourier transform (FT) to find the synthetic radar trace in the time domain [148,149]. It should be noted here that the sandbox is placed on two wooden pallets; this makes a gap of 35 cm between the bottom of the sandbox and the actual concrete floor. Therefore, in our modeling, we considered a 35 cm thick layer filled with air (c = 0.3 m/ns) at the bottom of the sandbox. In Figure 9c the modeling is performed by taking V = 0.14 m/ns (κ = 4.6) for the direct soil arrival and V = 0.116 m/ns (κ = 6.7) for the reflection from the bottom, while for the modeling of Figure 9d we considered V = 0.1195 m/ns (κ = 6.3) for the direct soil arrival and V = 0.076 m/ns (κ = 15.5) for the reflected event. From these values of dielectric constants and using the TOPP equation (Appendix A), we find the water content values to be 7% at the surface of the “dry” sand and an average of 11.9% for the whole sandbox; while, in the case of wet sand (Figure 9b,d), we find values of 11% and an average of 28.3%, respectively on the surface and for the whole sandbox. These results are in good agreement with the results given by Loeffler and Bano [36].

2.5.2. GPR Measurements on Moist Soils

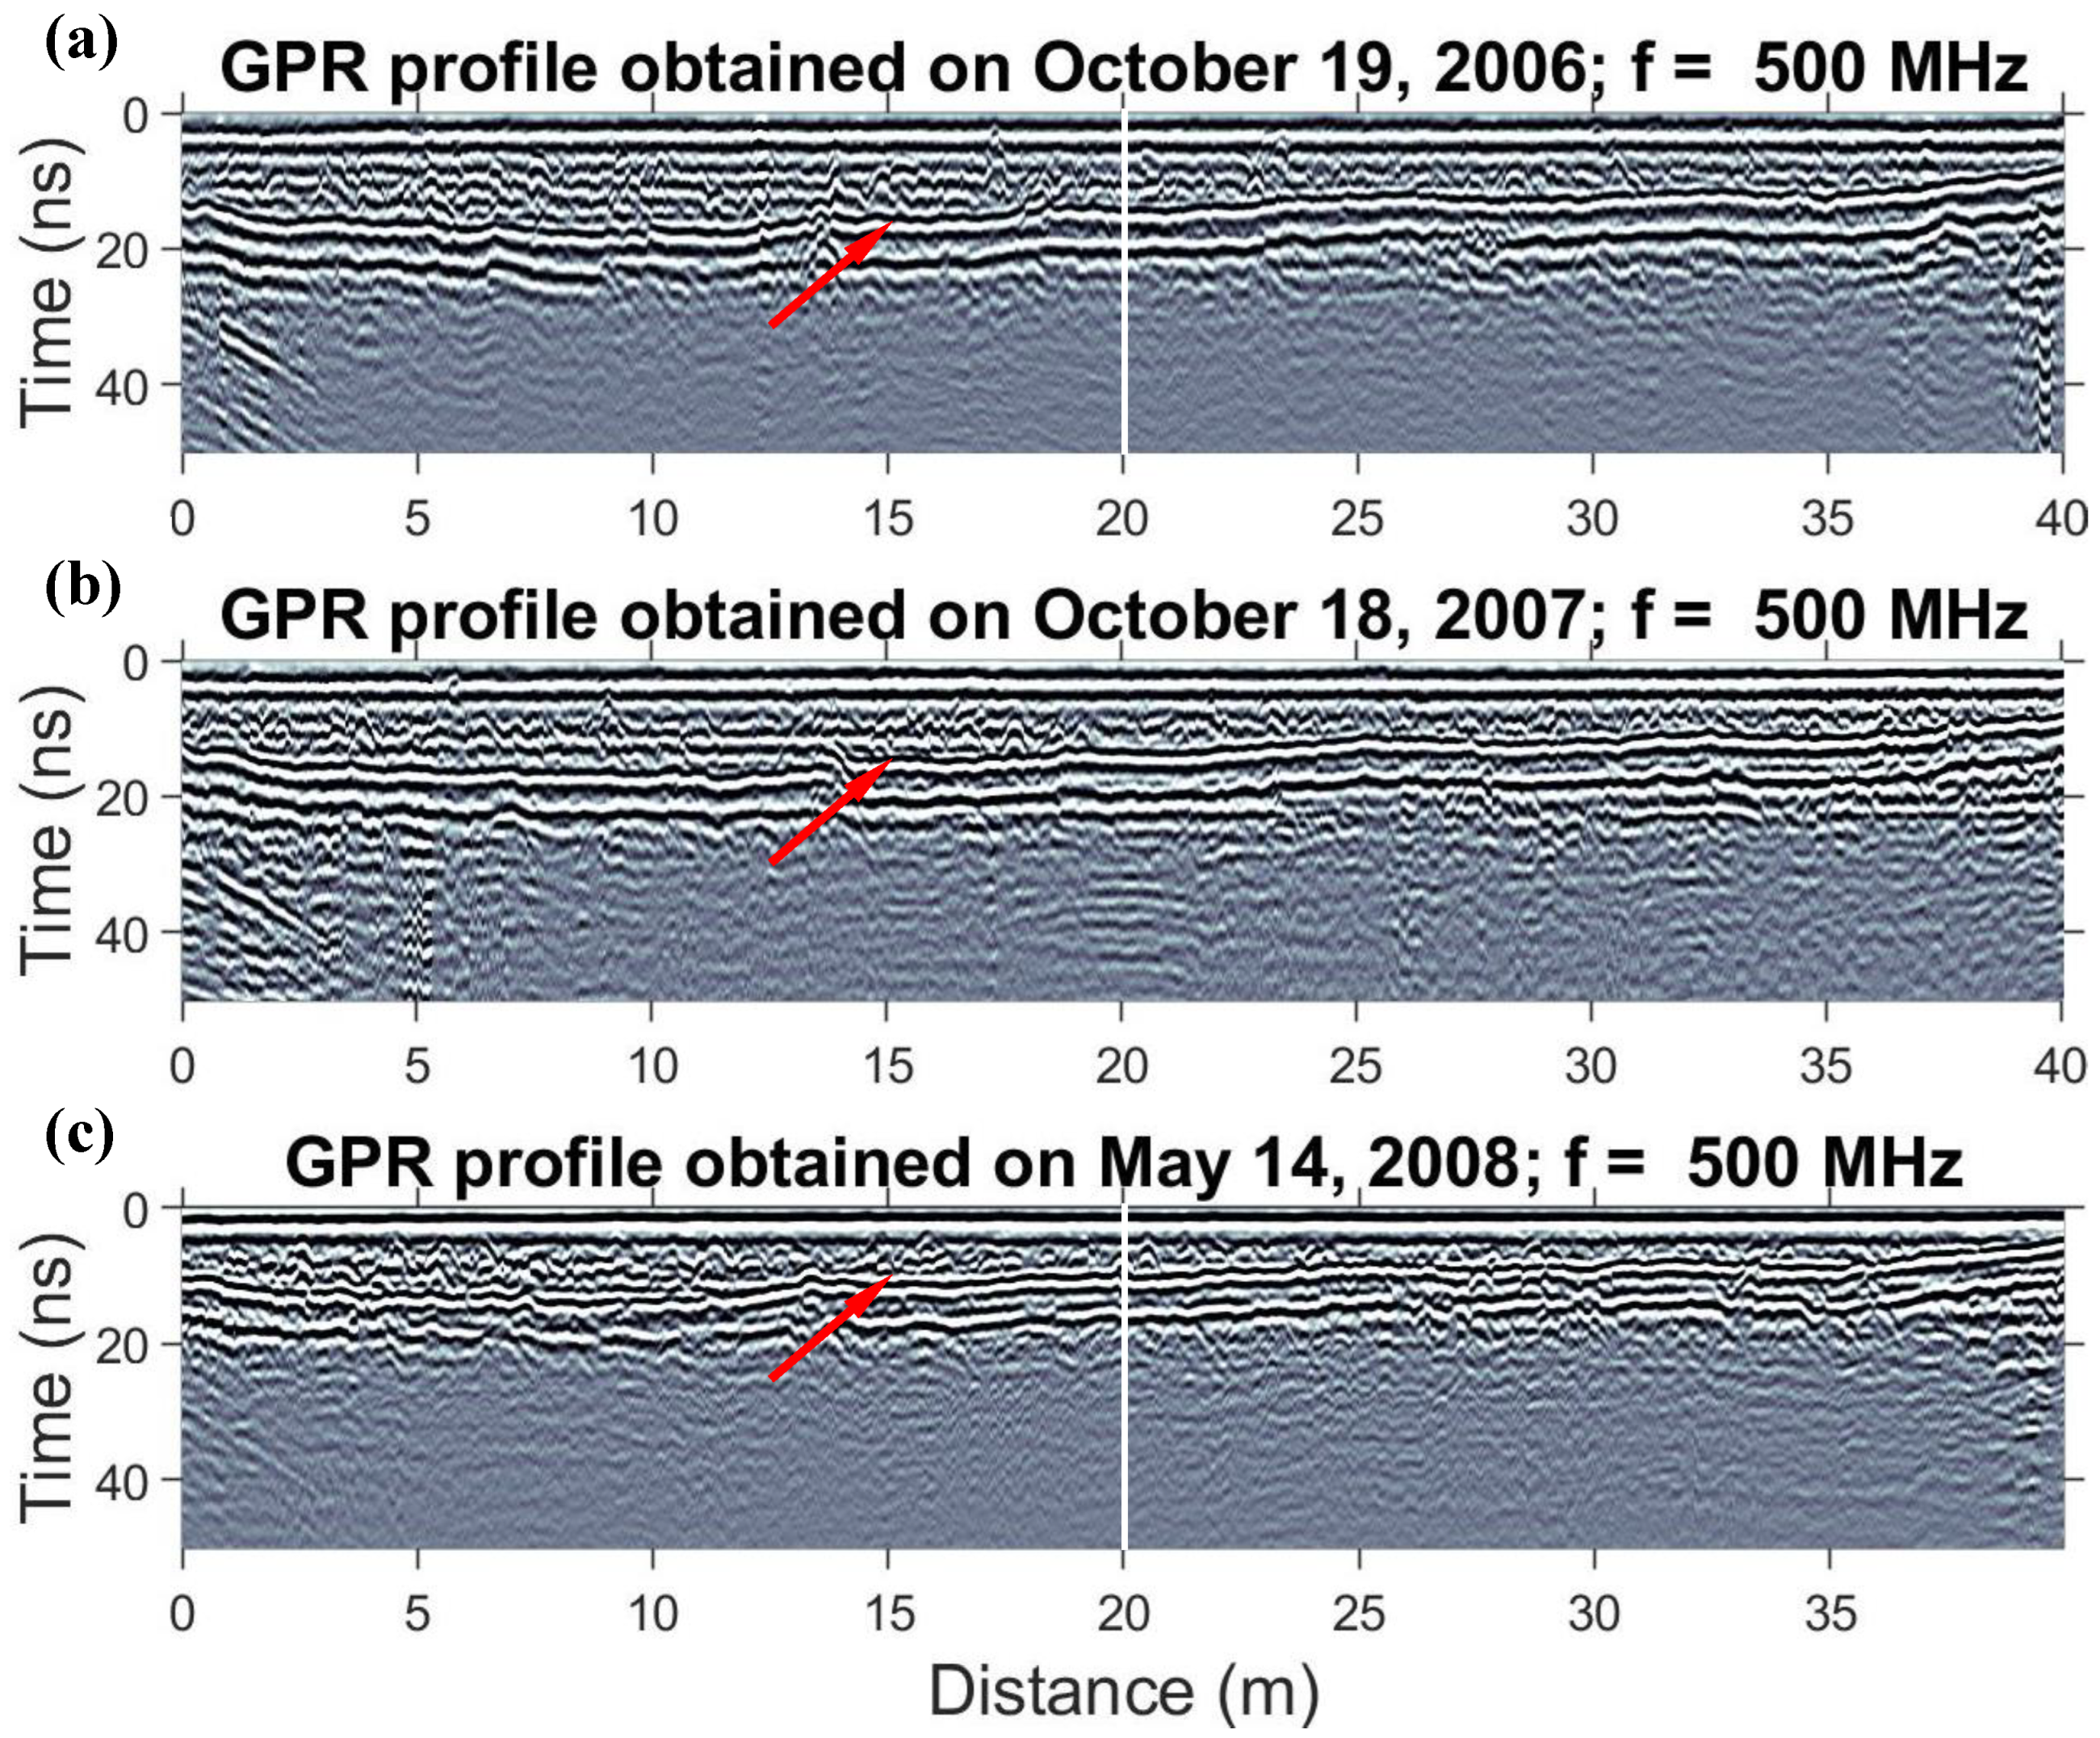
Figure 10 shows three common-offset GPR profiles measured at the same location with a 500 MHz antenna in October 2006 (Figure 10a), October 2007 (Figure 10b), and May 2008 (Figure 10c). The red arrow in each plot indicates the reflection coming from a 25 cm thick concrete slab. The concrete slab is covered with soil, the thickness of which varies from 20 to 60 cm. GPR measurements were made in Strasbourg with EOST (Ecole et Observatoire des Sciences de la Terre) students just behind the EOST building. From Figure 10, it can be seen that the reflection occurs almost simultaneously in the case of Figure 10a,b whereas it occurs earlier in the case of Figure 10c. This is because, in the case of Figure 10a,b the ground is wetter than in the case of Figure 10c. When we estimate the two-way travel time from Figure 10a and 10c (see vertical white lines at 20 m horizontal distance), we find 13.5 ns and 9 ns, respectively, for Figure 10a and 10c. Knowing the thickness of the soil is 0.5 m at this location (at 20 m horizontal distance) we find velocities of 0.074 m/ns and 0.11 m/ns for each case. From these velocities values, we estimate the dielectric constants of 16.4 and 7.4, respectively for Figure 10a,c. Finally, using the TOPP equation (Appendix A), we find water content values of 29.74% and 13.47%.

2.5.3. GPR Measurements during an Infiltration Experiment on an Unsaturated Sandy Soil

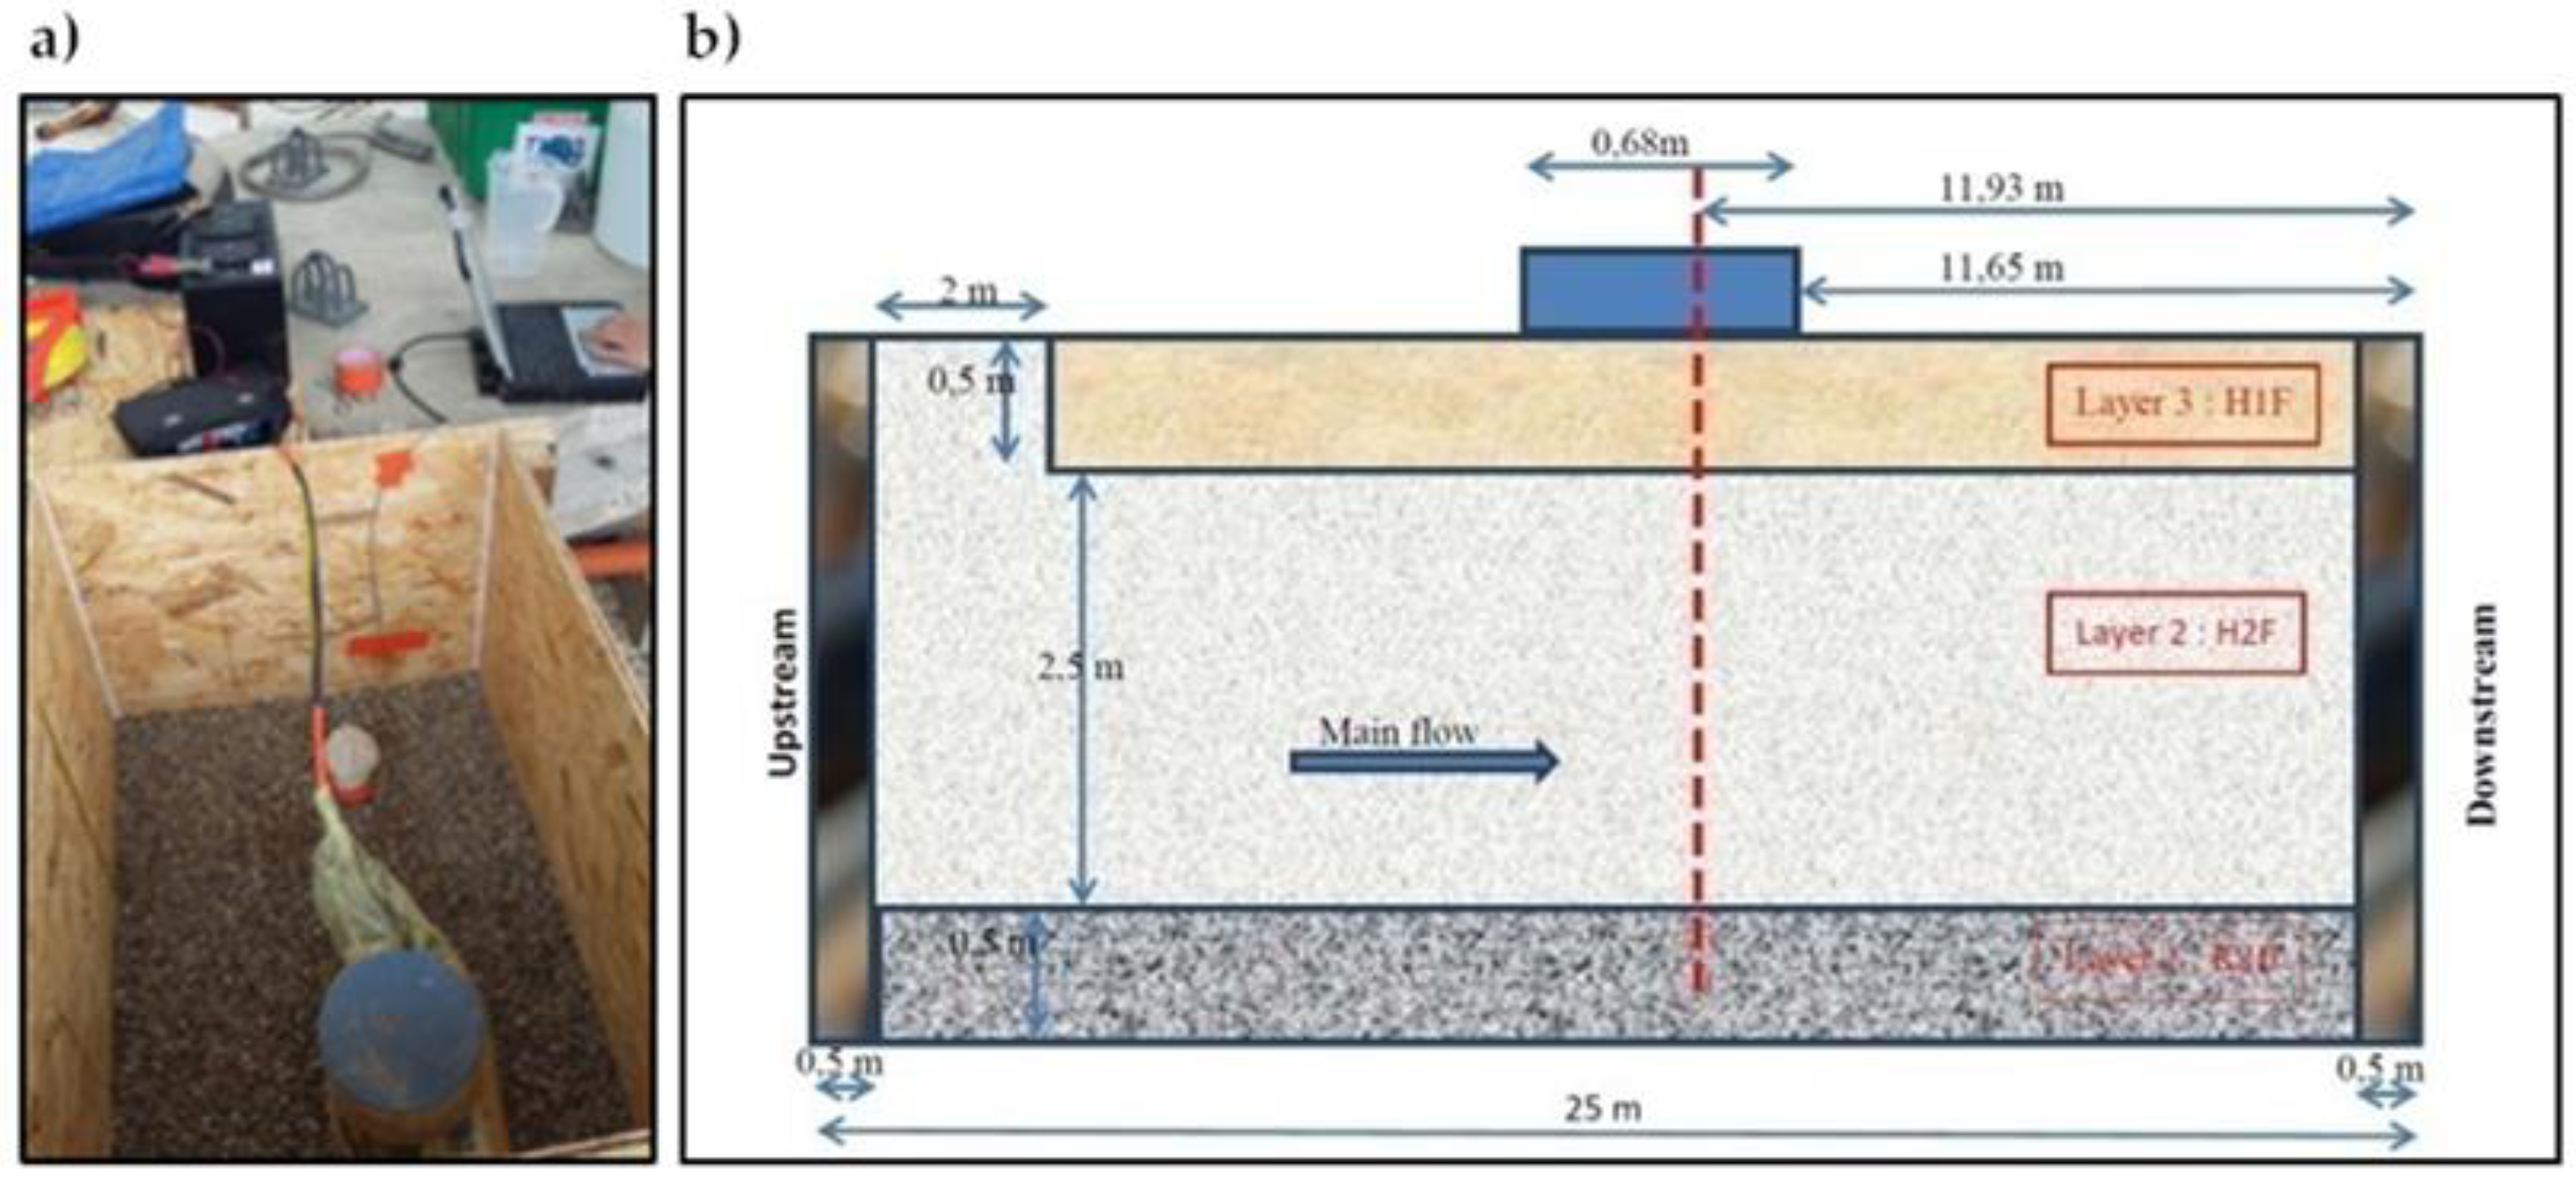
An infiltration experiment was carried out at a sandy experimental site. The experiment shows that GPR is an efficient method for monitoring the water flow and estimating SWC. An 800 MHz MALA RAMAC GPR system was used. The GPR was wrapped in a plastic bag and set up inside a wooden box (Figure 11a). The experimental site includes three sandy layers (Figure 11b). The porosity of each layer is 43%, 40%, and 38%, respectively, and the thickness of each layer is 0.5 m, 2.0 m, and 0.5 m, respectively. The blue rectangular stands for the experimental area and the red dashed line represents the position of the GPR.
The experiment has two stages. The first stage is a constant head infiltration experiment. A 15 cm water level was maintained above the soil surface in the box during 4680 s. In the second stage, the water flowed down freely. After 4970 s, there is no water above the soil surface. Only the DC filter and the static shift with 29 samples were applied to data processing.

The Evolution of the Water Front

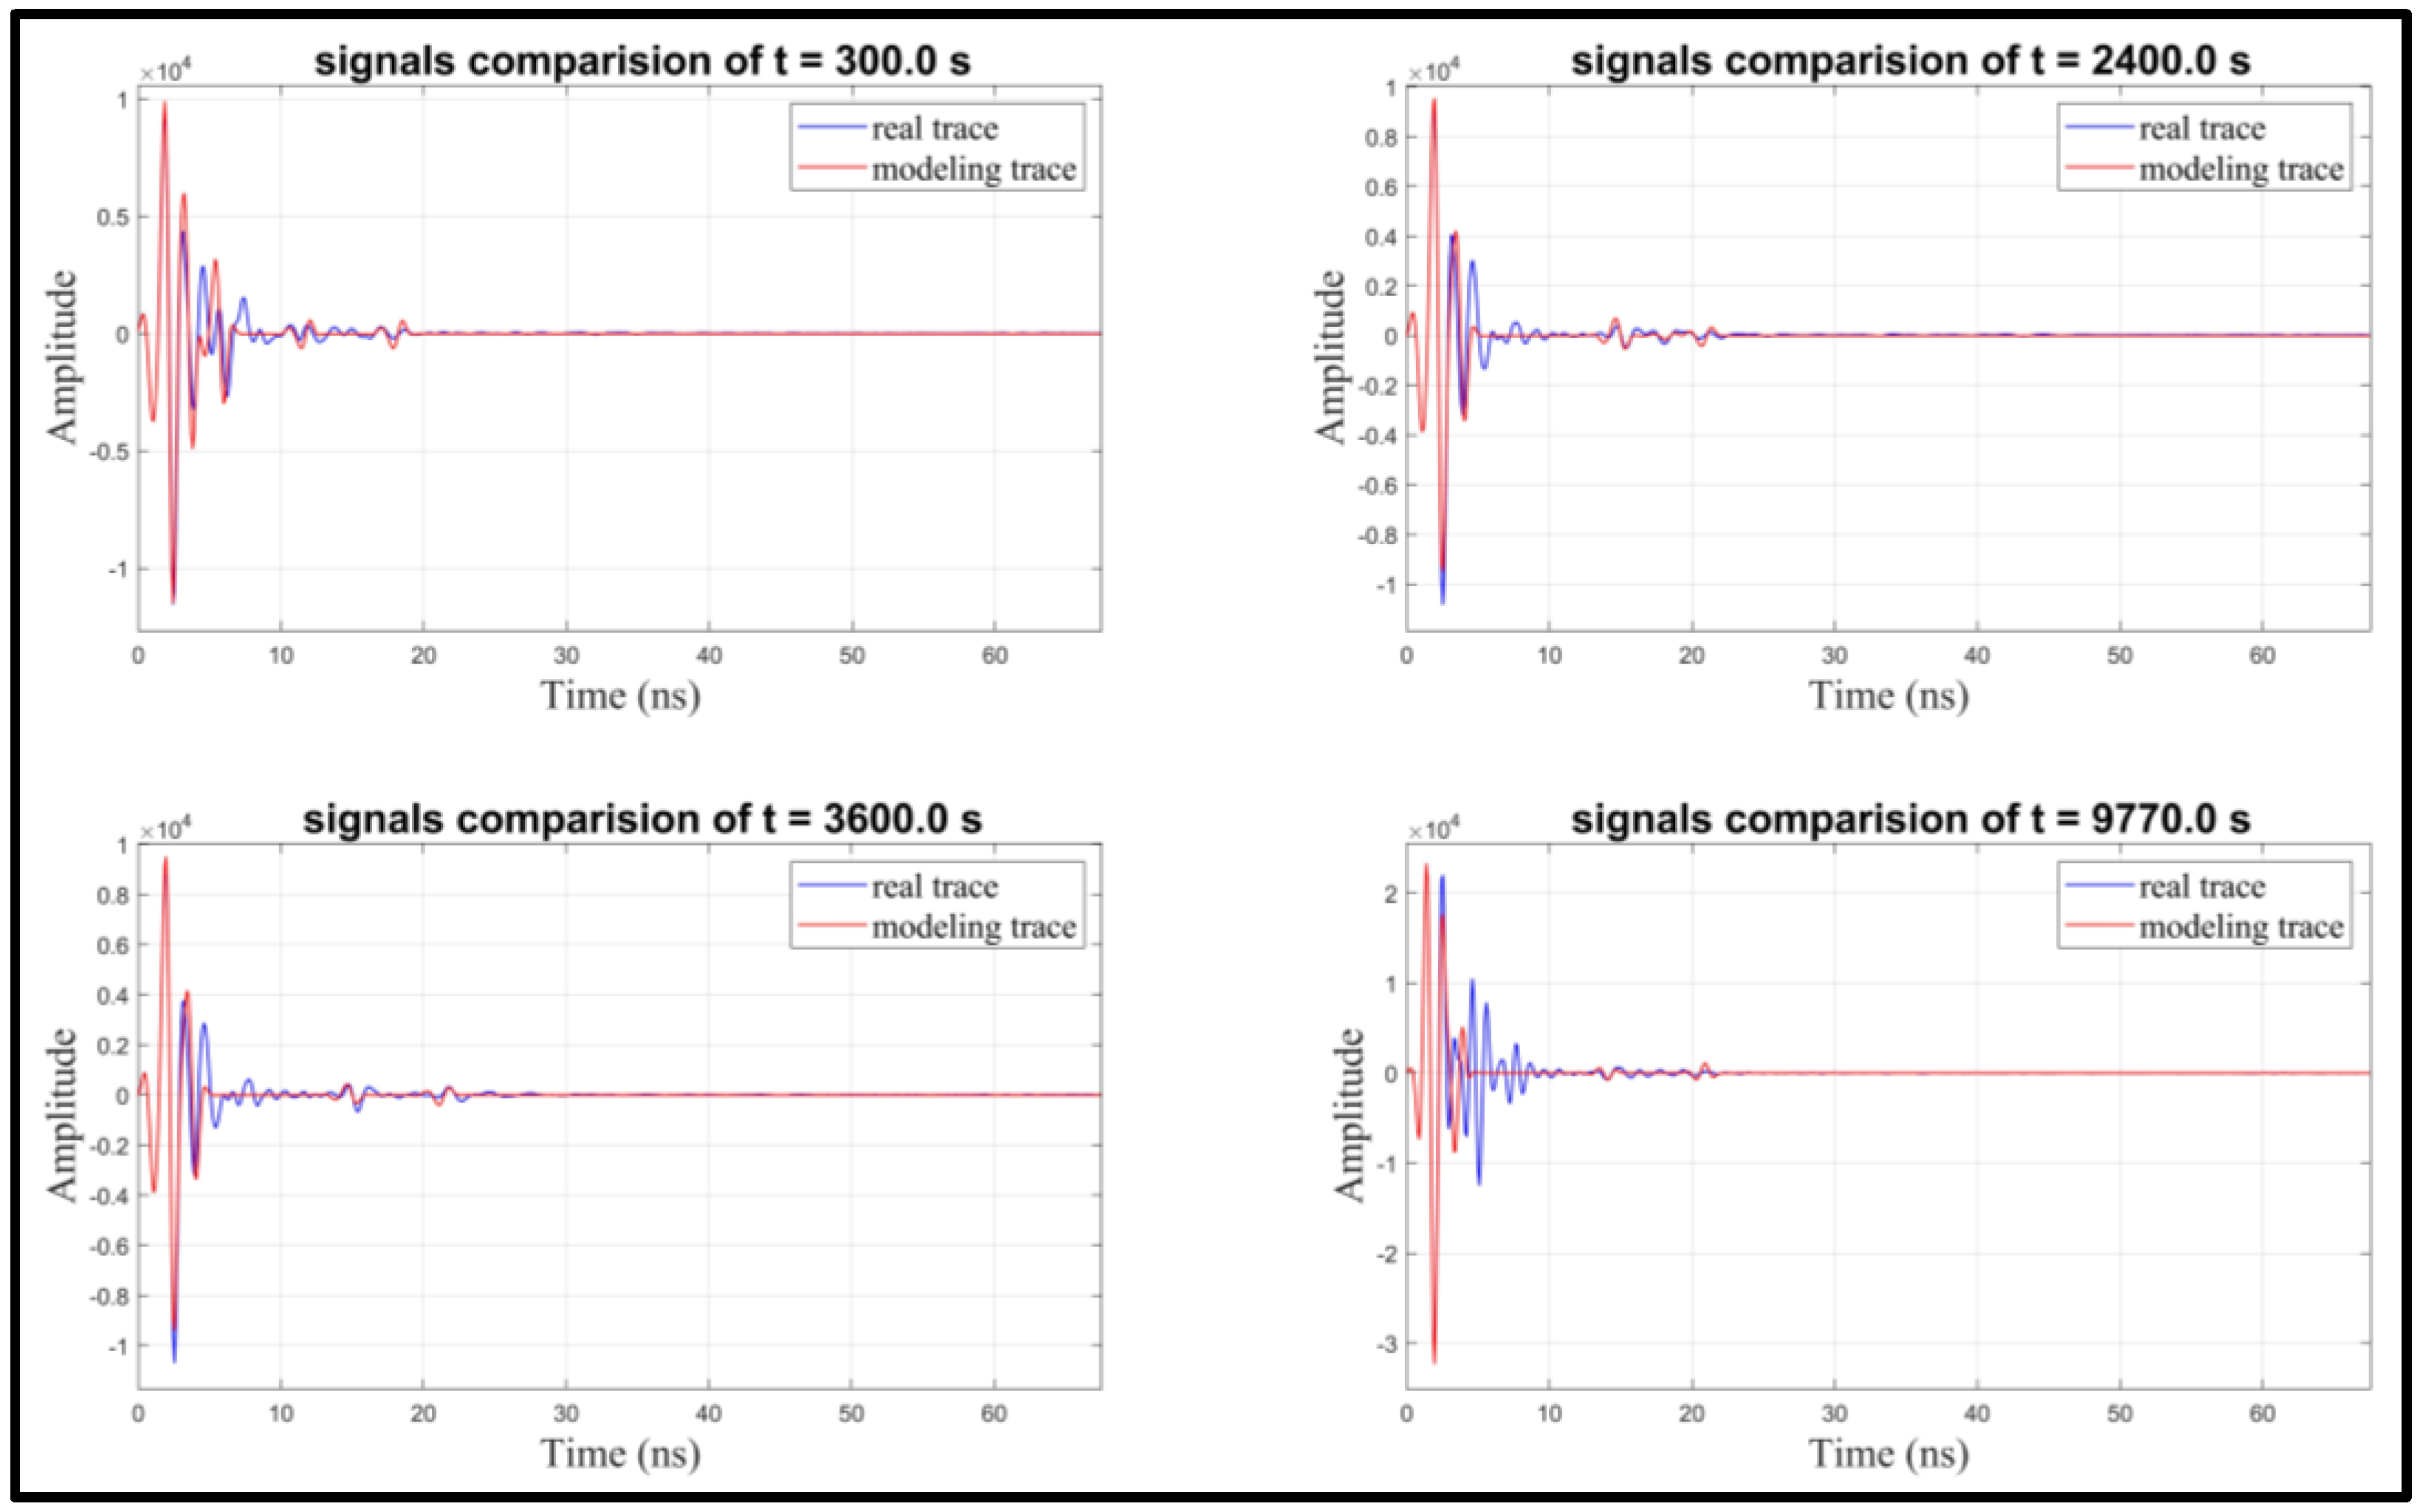
Figure 12 shows the processed profile. The reflections from the boundary between two layers (0.5 m) and from the water table (around 0.85 m) can be identified. And the travel times of the two reflections increase with increasing injected time because the water content is increasing inside the sand (the velocity of the GPR waves is decreasing). At around 1387 s, the water front reaches the boundary of two layers, which is marked with an orange arrow. Then the water front arrives at the level of the water table at around 3694 s (see white arrow). From around 4970 s, the travel times of the two reflections are decreasing. Because we stopped injecting water into the sandbox and there is no water above the soil surface, the water flowed down freely and the water content is decreasing inside the sand (the velocity of the GPR waves is increasing). In order to show the evolution more clearly, six real traces were picked up at different injection times from the profile (Figure 13). The number 1, 2, and 3 represent the water front, the boundary between two layers, and the water table, respectively. From these six traces, the movement of the water front can be identified by following reflection number 1. At 300 s, reflection 1 is before reflections 2, and 3; at 2400 s, reflection 1 is between reflections 2 and 3; at around 3933 s, reflections 1 and 3 coincide.

The Estimation of SWC by GPR

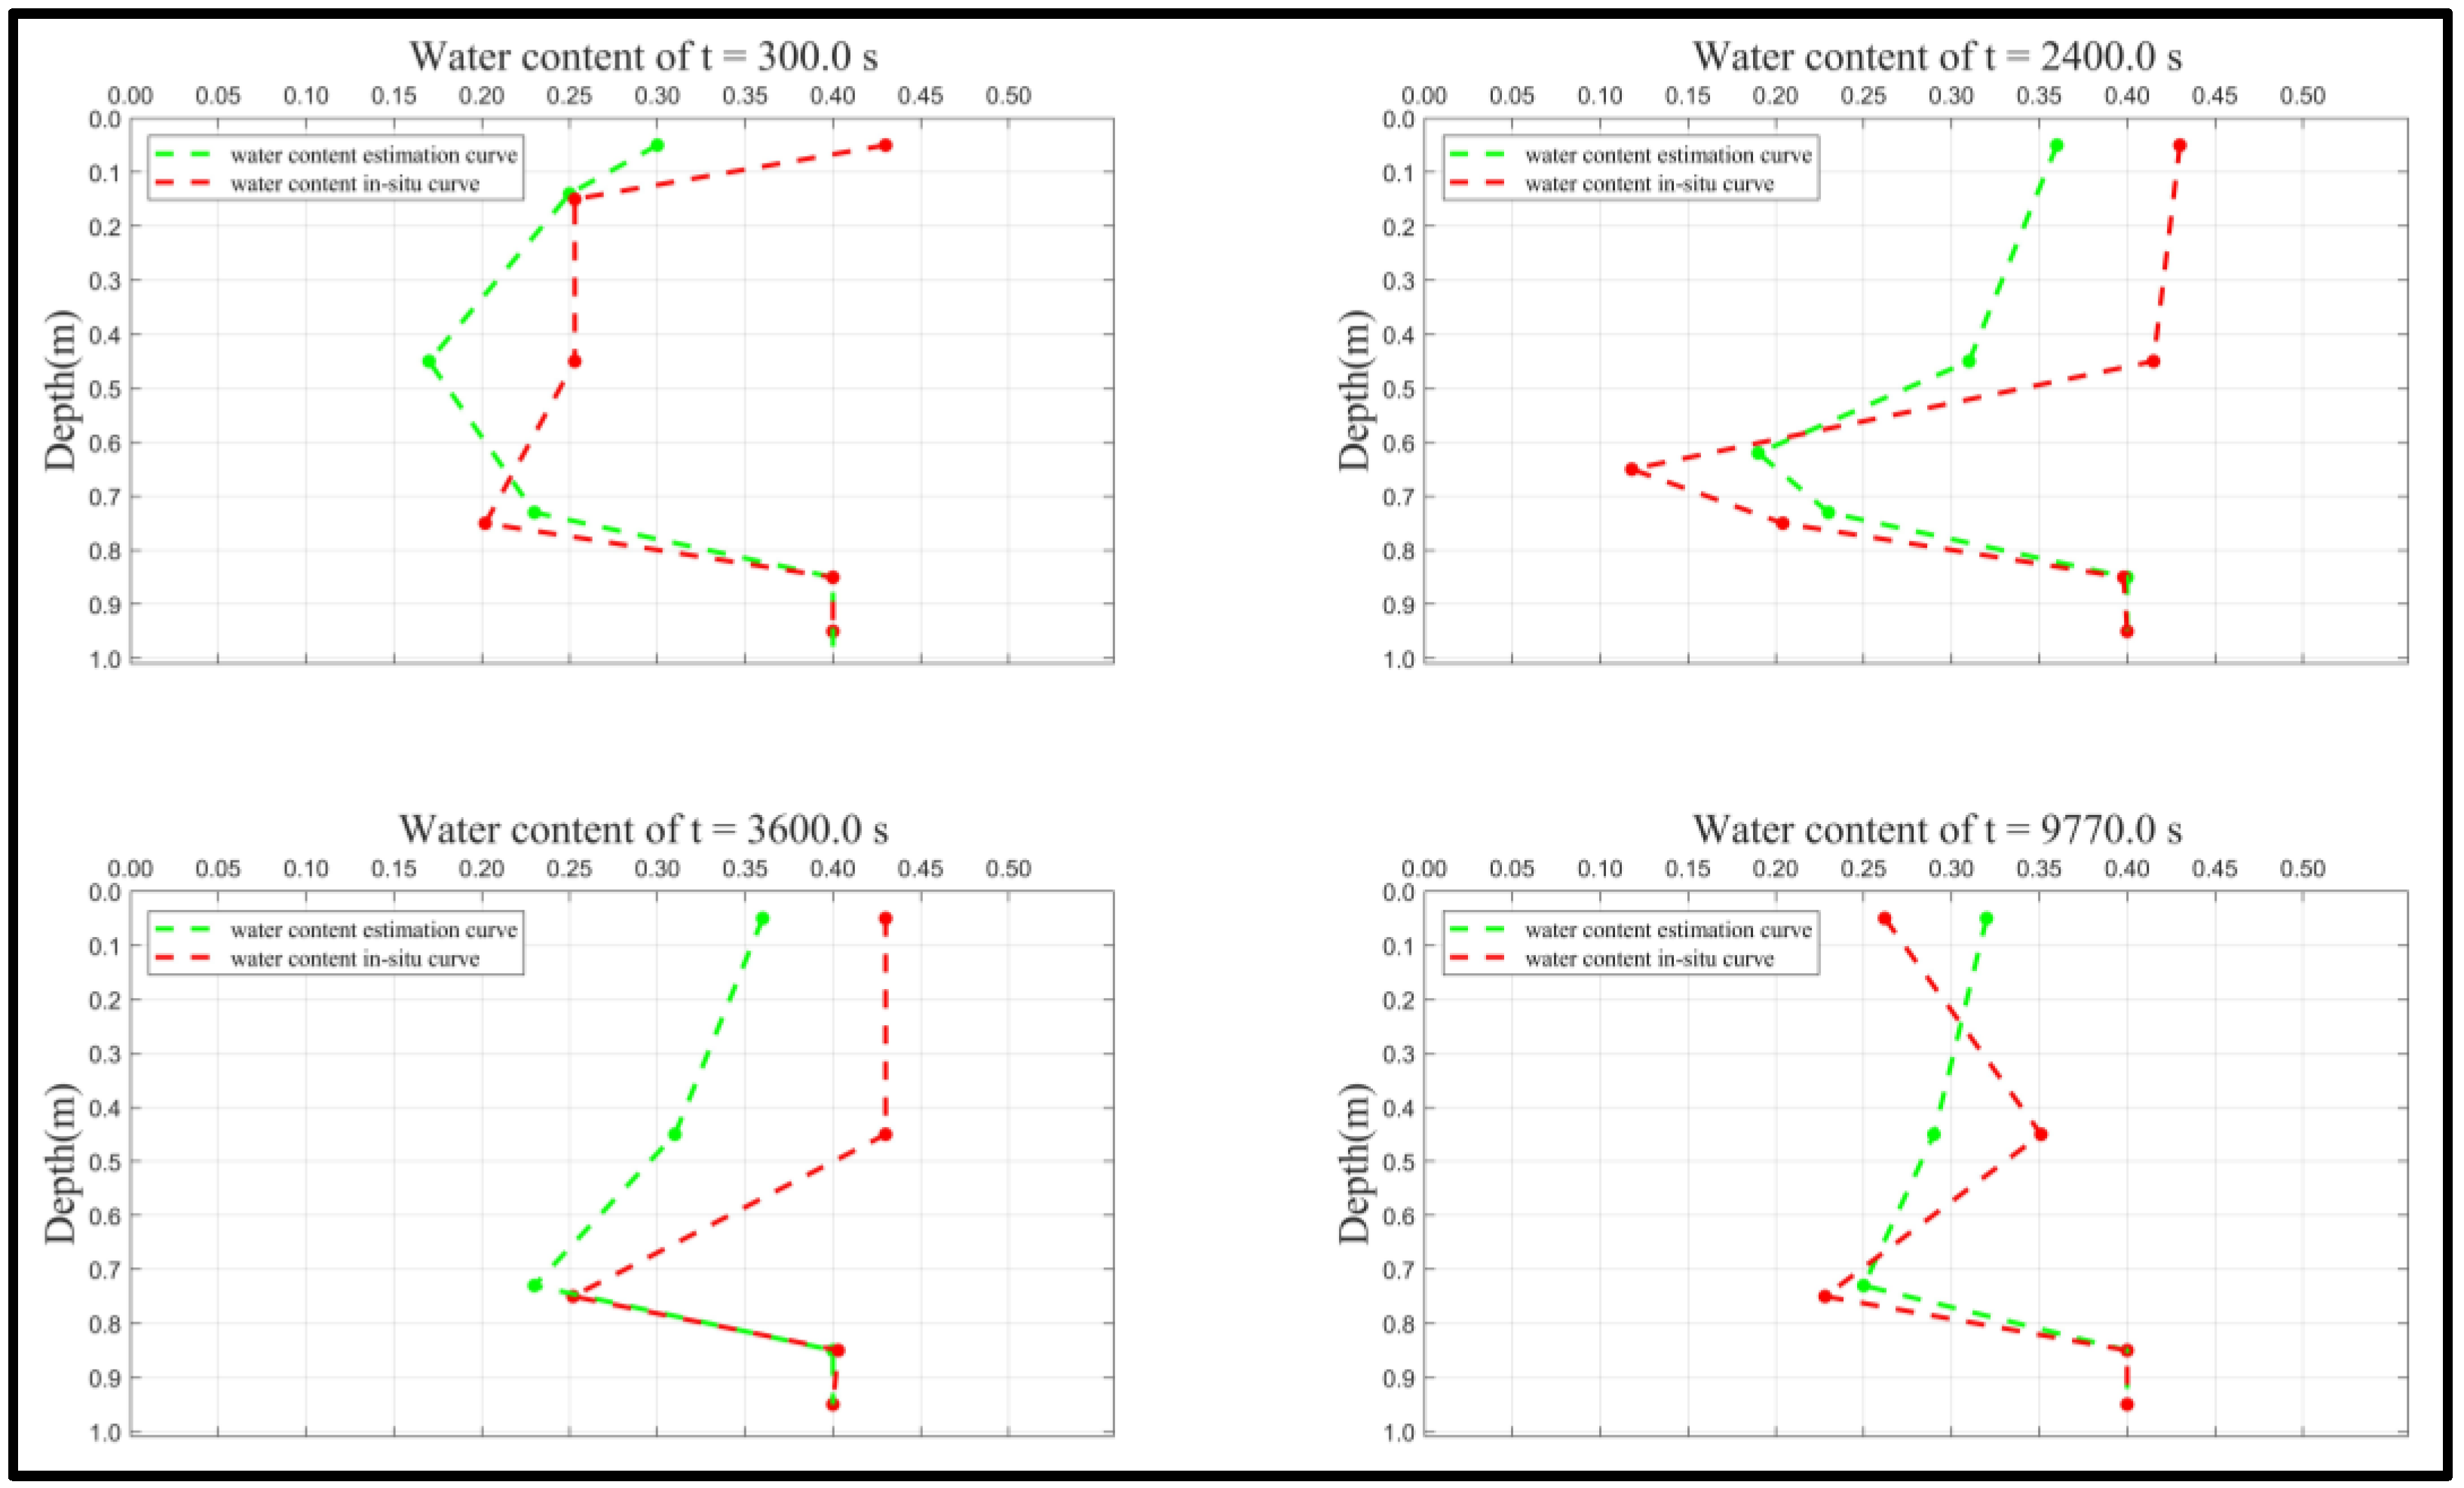
SWC was estimated by comparing a modeled GPR trace with a real GPR trace picked up from the real GPR profile. Firstly, an initial model was created and the GPR trace was obtained by forward modeling. Then, the initial model was updated by fitting the real GPR trace with the modeling GPR trace. Figure 14 shows a comparison of the fit between the forward modeling GPR traces and the real GPR traces picked up at four different injection times. Figure 15 presents the final water content. The red dotted lines are the water content measured by Sentek sensors. And the green dotted lines stand for the estimated water content. The estimated water content is similar to the measured water content, and the two also have a similar trend. The change in the water content with injection time during the infiltration experiment can be seen. The forth panel in Figure 15 (at 9770 s) is at the end of the experiment. An equilibrium state is nearly achieved and the trend in the water content is similar to that before injection (at 300 s).

3. Techniques for SHP Estimation

SHP is one of the key factors for studying the water dynamics in the vadose zone. Accurately estimating SHP in the vadose zone is essential in a wide range of applications, including the modeling of water flow and contaminant transport [150,151], and managing water and soil resources [152]. Estimating SWC with GPR and inverting SHP from SWC data are all mature technologies in their respective fields. Benefiting from interdisciplinary research, more and more researchers are focused on determining SHP with GPR. However, compared to the use of GPR for estimating SWC, estimating SHP with GPR is a relatively new technique. Although the estimation of SHP by GPR was first performed in 2001 [100], at present, there is no review of approaches for determining SHP by GPR. Firstly, we will review the estimation of SHP based on GPR travel-time data.

3.1. Estimating Hydraulic Properties Based on Travel Time

Up to now, most researchers have applied GPR travel-time data to estimate SHP.
Chen et al. [153] developed a normal linear regression model and estimated hydraulic conductivity based on a Bayesian framework with GPR tomographic velocity, attenuation, and seismic tomographic velocity at the South Oyster site. They used a 200 MHz borehole GPR to collect tomographic GPR data and also acquired seismic tomographic data. Through GPR tomographic analysis, the developed method with geophysical tomographic data has the potential to improve the estimation of hydraulic conductivity. However, when every conditional pdfs is multimodal and asymmetrical, this proposed method is limited.
Binley et al. [101] first combined cross-borehole GPR with ERT to monitor soil water dynamics and estimate hydraulic conductivity. This study demonstrated the potential of borehole GPR for estimating hydraulic properties. Cassiani and Binley [154] analyzed the advantages and disadvantages of zero-offset borehole GPR for estimating and monitoring moisture content in the deep vadose zone under the conditions of layered formations and quasi-steady state infiltration. The unsaturated flow parameter was identified through the stochastic Monte Carlo method by analyzing the vertical travel time.
In order to solve the problems of ill-posedness and non-uniqueness, Kowalsky et al. [109] proposed a coupled inverse technique under the framework of maximum a posteriori (MAP) for estimating the distributions of flow parameters and predicting flow phenomena. Through the combination of different data types, such as transient hydrological and GPR travel-time data acquired under the ZOP mode, in the proposed framework, the distribution of flow parameters and flow phenomena could be well estimated and predicted. Rossi et al. [155] combined ERT and GPR for mapping a controlled infiltration experiment. To estimate the soil hydraulic conductivity, a data assimilation technique based on sequential importance resampling (SIR) was applied. The results showed that coupled data assimilation gives a more reliable parameter estimation than an uncoupled hydro-geophysical method. Cui et al. [6] applied the ensemble smoother with multiple data assimilation (ES-MDA) algorithm for inverting SHP by using GPR data. Synthetic experiments were designed to assess the performance of the proposed method. In order to acquire the travel time, the STA/LTA method was used. The errors of parameter calculation and the prediction of moisture decrease with increasing assimilation time. The results showed that the ES-MDA method can help to accurately evaluate SHP and provide better characterization for the distribution of SWC.
The subsurface structure and heterogeneity affect the subsurface flow and contaminant transport. Although GPR can provide high-resolution images, the relationship between the images and parameters affecting flow and transport is not clear. In addition, hydrological data include property information on flow and transport, but the spatial coverage and resolution are not sufficient. Considering the disadvantages of these two methods, Kowalsky et al. [156] estimated field-scale SHP and petrophysical function by joint inversion of time-lapse multiple-offset borehole GPR travel-time information and hydrological data. Compared to predictions performed by neutron probe alone, the prediction of SWC could be improved by including GPR data during inversion. The research considered the flexibility of GPR measurement configurations and improved the resolution of soil hydraulic parameters estimation. The research also provided a means of capturing the properties and system state of heterogeneous soil, which are important for estimating and monitoring subsurface flow and contaminant transport. In order to reduce the uncertainty of estimating hydraulic parameters, Looms et al. [157] proposed a framework for integrating multiple geophysical data such as travel time from GPR and electrical transfer resistances from electrical resistivity tomography, during a 20-day period. Based on an integrated data fusion method, the uncertainty of hydraulic parameters estimation can be reduced by integrating different geophysical data.
Linde et al. [158] developed a method for inverting trace test data based on zonation information from 2D GPR tomograms and simultaneously obtaining a 2D estimation of hydraulic conductivity as well as the petrophysical relationships between hydraulic conductivity and radar velocity. For the inversion, a geophysical data inversion was performed. Then, the velocity zones were defined in the tomogram. Finally, the hydraulic conductivity was determined according to an estimated petrophysical relationship.
Moysey [159] carried out a variable-rate infiltration experiment in a sandbox to verify the distinctive patterns generated by transient GPR data acquired during imbibition and drainage events. An efficient approach analogous to coherency analysis applied in multi-offset measurements was also proposed for efficiently analyzing transient GPR data and identifying most parameters of the Mualem–van Genuchten soil model. Saintenoy and Hopmans [160] studied the sensitivity of the GPR signal reflected by a transition with a van Genuchten type to the hydraulic properties. They found that the amplitude of the reflected signal had a power-type link with the slope of the soil retention curve.
Scholer et al. [161] investigated the effect of various types of prior knowledge linking with the subsurface VGM parameters for the stochastic inversion of ZOP cross-hole GPR travel-time data. The data were collected in the unsaturated zone under steady-state conditions. Applying a Bayesian Markov chain Monte Carlo (MCMC) inversion approach and combining the prior information with available data, the vadose zone hydraulic properties and their corresponding uncertainties could be estimated stochastically and effectively. Scholer et al. [162] further estimated the VGM parameters of a layered medium by time-lapse ZOP cross-hole GPR travel-time data under the condition that the infiltration cannot be assumed to be steady-state. A Bayesian MCMC stochastic inversion was applied to the time-lapse cross-hole GPR travel-time data, which was collected by Looms et al. [157].
Busch et al. [163] performed time-lapse monitoring of soil dynamics based on the surface common-offset and CMP GPR data and proposed a coupled inversion framework to estimate the hydraulic properties of a layered subsurface. The framework combines conventional ray-based analysis of time-lapse surface GPR data with a hydrological forward model and was applied to synthetic and measured GPR data. In order to describe the water flow under wet and dry conditions, the capillary and film flow were considered in the uppermost subsurface layer. The results demonstrated that SHP can be estimated accurately based on GPR data in the proposed coupled inversion framework.
In early research into determining SHP with GPR, most studies focused on borehole GPR. Bradford et al. [164] measured the reflections from the transition zone during a drainage pumping test in a fluvial area with a 200 MHz antenna. The antenna was placed in a non-metallic wheeled cart and elevated around 5 cm above the surface. By minimizing the difference between observed and simulated travel times and amplitudes, the hydraulic material properties could be determined. The results showed that GPR reflections from the transition zone are highly sensitive to the dynamic processes during drawdown. This observation suggests that GPR may be a good technique for describing local hydraulic parameters from drawdown dynamics.
Léger et al. [165] applied an 800 MHz surface GPR antenna for monitoring a Porchet infiltrometer experiment and estimated hydrodynamic parameters by comparing the experimental and modeled two-way travel (TWT) times. The transmitter of the GPR was set 38 cm away from the injection hole and the receiver was kept at 52 cm. The modeling results showed good agreement with the experiment and were highly sensitive to M–vG parameters. Léger et al. [7] applied a 1.6 GHz shielded antenna, which was kept immobile at the surface during a series of infiltration experiments. The Mualem–van Genuchten model was used to fit retention curve data. The shuffled complex evolution (SCE-UA) algorithm was applied to invert the SHP. Léger et al. [166] further extend this research and method to a 2D study by monitoring Porchet infiltrations.
Jaumann and Roth [19] developed methods to estimate hydraulic material properties based on previously published work for simultaneously estimating the effective water content and investigating subsurface architecture with surface ground multi-offset GPR data at the ASSESS site [77,79]. In order to ensure large hydraulic dynamics, the test site was forced with a fluctuating groundwater table. A 400 MHz center frequency stationary on-ground bistatic antenna was employed to collect time-lapse GPR data. By using the reflections from the transition zone and material interfaces, the position of the layers and their hydraulic material properties could be determined with the developed heuristic semiautomatic approach. The approach can pick the signal travel time and amplitude of relevant reflections in the radargram and associate the corresponding events automatically. Compared to results from TDR, the resulting parameters were mostly consistent. Although some drawbacks need to be overcome, such as (1) the computational effort for solving Richards’ and Maxwell’s equations, (2) the limited number of events, and (3) the hyperparameters for the GPR evaluation algorithm, the results still showed that the developed method accurately estimates the hydraulic material properties and imaged the layered subsurface structures.
The movement of water and solutes is controlled by the retention and permeability properties. Léger et al. [167] employed surface GPR to study the retention during imbibition and drainage cycles. Coupling hydrodynamic and electromagnetic modeling to simulate radargrams and calculating the SHP of sandy soil based on the GPR travel time. The total procedure is similar to that of Léger et al. [7]. The results showed that the retention curve from classical lab experiments does not fit the results from the drainage–imbibition experiment. This may be because static parameters cannot be applied to describe the dynamic processes.
Yu et al. [18] performed both sequential and coupled inversion to obtain SHP from time-lapse horizontal borehole GPR data based on an infiltration experiment. The experiment included five infiltration events that were performed at a rain-sheltered plot during a four-day period with a 200 MHz borehole antenna. The ZOP method was applied to acquire the GPR data at six depths (0.1, 0.2, 0.4, 0.6, 0.8, and 1.2 m). Based on the travel times of the direct wave, which were picked automatically from the GPR data, the two inversions were carried out to obtain SHP for one-layer and two-layer soil profiles. The results showed that coupled inversion provided more accurate field-scale estimation for soil hydraulic parameters than sequential inversion.

3.2. Estimating Hydraulic Properties Based on FWI

In the aspect of estimating SWC, FWI demonstrates its own advantages. FWI is applied to the whole GPR waveform data, which contain more information than travel-time data. Therefore, FWI can provide more accurate results than inversion based on travel-time data alone.
Lambot et al. [168] proposed a new integrated inversion method for estimating shallow surface hydraulic properties from time-lapse off-ground GPR data in a non-invasive way at the field scale. They created the objective function from Green’s functions of full-wave GPR to represent time-lapse GPR data. The results showed that time-lapse GPR measurements may contain enough information under the constraint of fluid flow modeling. Jadoon et al. [169] extended this research to three different soil textures under different constant and variable flux rates. Through numerical experiments, they investigated the well-posedness, uniqueness, and stability of the inversion problem for determining three main soil hydraulic parameters. This kind of analysis is very important for solving the inversion problem with robustness during the optimization procedure. It is also necessary to define the range of applications for this method. In field conditions, the number of layers is unknown and an ill-posed inverse problem will occur because soil moisture profiles vary piecewise continuously with depth.
Lambot et al. [170] combined hydrogeophysical inversion of time-lapse, proximal GPR data to remotely estimate the SHP of unsaturated laboratory sand soil during an infiltration experiment. A standard, handheld vector network analyzer (VNA) was employed to build the off-ground radar system. Integrating full-waveform electromagnetic and one-dimensional vertical hydrodynamic inversion, the parameter n of the Mualem–van Genuchten model was well determined. However, there were some errors in the estimation of parameter α . This was attributed to the fact that the radar data has low sensitivity to the infiltration front. Jadoon et al. [171] extended this method to the field scale and applied it over a bare agricultural field. From the time-lapse GPR data, the significant effects of water dynamics were observed, especially for precipitation and evaporation events. Other methods were combined to invert the SHP accurately. Jonard et al. [172] employed a radiometer and off-ground GPR to retrieve the water retention curve in sandy soil when the water table was located at different depths and was at hydrostatic equilibrium. The GPR data were collected using a 0.8–2.6 GHz ultrawideband stepped-frequency continuous-wave radar with a vector network analyzer (VNA). GPR data were modeled using full-wave layered medium Green’s functions. Under a Bayesian framework with the DREAM algorithm, the hydraulic parameters were quantified. In this study, the passive and active microwave sensing methods were first attempted to remotely identify the main SHP. The inversion results demonstrated that the radar and radiometer data include more information than TDR and have good accuracy. In addition, the GPR-based estimation had a much lower uncertainty than the other methods. However, there are still some improvements that can be made, such as focusing on the transient conditions and considering the impact of organic soil layers, soil surface roughness, and vegetation for estimating SHP.
Most of the above methods did not consider the errors from input, output, and model structure. In order to incorporate observations into a mathematic model, Tran et al. [173] developed a data assimilation scheme for determining SWC and SHP. The scheme contains soil water dynamics modeling, full-wave electromagnetic wave propagation modeling, a petrophysical relationship related to the state variable to the GPR data, and the maximum likelihood ensemble assimilation algorithm. Through the numerical experiments, the proposed scheme was validated and the results demonstrated that the accuracy of the hydrodynamic model prediction was improved significantly.
In addition to off-ground GPR measurements for inverting the SHP, some methods based on surface GPR and borehole GPR have also been developed. Dagenbach et al. [174] performed an imbibition and drainage experiment at the ASSESS site. A 400 MHz on-ground shielded GPR with a bi-static antenna was set at a fixed location to record traces over time. The results showed that the reflection from the transition zone is sensitive to the hydraulic material parameterization model. Yu et al. [175] carried out a synthetic study to demonstrate the efficiency of a proposed workflow. The workflow is for estimating SHP from time-lapse horizontal borehole GPR data with coupled GPR full-waveform inversion (CFWI). Compared to the results from the first arrival time of zero-offset profile borehole measurements, the proposed workflow showed higher accuracy.
To date, GPR has shown its ability for estimating SHP. However, there is still a lot of room for development. For example, FWI can provide high-resolution results. However, FWI is time-consuming and demands more computation power. Second, compared to sequential inversion of FWI, coupled inversion of FWI can decrease the errors generated during forward modeling of the hydrodynamics and GPR. Therefore, how to realize coupled inversion more efficiently is important, such as how to build the framework of coupled inversion. Finally, with the development of deep learning methods, deep learning will be a more efficient method for realizing coupled inversion and integrating GPR data and hydrological information.

4. Conclusions and Outlook

The GPR method is a practical method for estimating SWC and SHP. In SWC determination, different measured modes have their own advantages and disadvantages. Surface GPR is an earlier method than either borehole or off-ground GPR. Compared with borehole GPR, surface GPR is fast, less invasive, and can be operated on a large scale, especially for determining the lateral variation in SWC. However, borehole GPR can measure deeper than surface GPR. Borehole GPR also can provide higher-resolution SWC profiles. Off-ground GPR is faster than surface GPR because the antenna can be attached to a vehicle or a helicopter. However, off-ground GPR is only suitable for shallow SWC detection because of the limitation of detection depth. The roughness of the ground surface is another problem for off-ground GPR. In order to solve these problems, some new detection modes and methods have been developed. In surface GPR modes, the earliest method is the reflected wave method, and then the ground wave method was proposed for situations when there are no reflectors for calculating the travel time, such as in the shallow soil zone. However, in most situations, the ground wave is hard to identify in single offset mode. Thus, the multi-offset mode was proposed and other new methods such as AEA and the frequency shift method were also put forward to solve this problem. For borehole GPR, ZOP mode is faster than MOP mode; however, for tomography inversion, the MOP mode is always used. In order to decrease the degree of invasion of the soil, the VRP mode was proposed and this method is a compromise between borehole and surface GPR. In SHP estimation, GPR is a very new technique, and most studies are based on sequential inversion with GPR travel-time data and are limited to a single dimension. Now that FWI is being applied to the determination of SHP, the accuracy is being improved.
Based on this overview of studying water dynamics in the vadose zone by GPR, there are several directions that should be considered in the future:
(1) In terms of detection accuracy, FWI has great potential and advantages. In the future, more attention should be paid to how to improve the ability of FWI to measure water dynamics. There are still some problems with traditional FWI detection, such as ill-posedness and non-uniqueness.
(2) Attention needs also to be paid to rapid detection and analysis methods for GPR data collection. For the multi-offset mode of surface GPR, data collection is time-consuming. Therefore, how to realize rapid detection is important if we want to extend the detection scale and dimensionality. Multi-channel equipment has been developed.
(3) In the estimation of SHP, coupled inversion generates lower errors than sequential inversion. However, it requires hydrological modeling and GPR modeling based on two different equations to be carried out. How to integrate hydrological modeling and GPR modeling must be studied. Machine learning methods may provide new opportunities in the field of SWC and SHP estimation.

Author Contributions

Conceptualization, M.Z.; methodology, M.Z.; investigation, M.Z., T.W., H.Z., Y.Z. and Y.A.; writing—original draft preparation, M.Z.; writing—review and editing, X.F., M.B., H.X., W.L. and Z.D.; supervision, X.F. and M.B.; project administration, X.F.; funding acquisition, X.F. All authors have read and agreed to the published version of the manuscript.

Funding

This research was funded by the National Key Research and Development Program of China, grant number 2021YFC1523401, the Technology Development Program of Jilin Province, grant number 20220101148JC, and the Science and Technology on Near-Surface Detection Laboratory, grant number 6142414211606.

Data Availability Statement

Data are available from the authors upon request.

Conflicts of Interest

The authors declare no conflict of interest.

Appendix A

The volumetric water content θ is the ratio of the volume of water ( V w ) present in a sample to the total volume of the sample V t o t a l (θ = V w / V t o t a l ). The water content is linked to water saturation S and porosity φ of the medium by θ = φS. Saturation varies from 0 to 1 and hence water content from 0 to φ. The relative dielectric permittivity (dielectric constant: κ = ε / ε 0 ) for moist soils increases with increasing water content and lies in the range of 6 to 30. This is because the dielectric constant of water ( κ w = 81) is much larger than that of dry soils (between 3 and 5). Many mixing formulas for bulk permittivity of moist soils have been reported in the literature. The commonly applied petrophysical relationship is the TOPP equation [21]:
κ = 3.03 + 9.3 θ + 146 θ 2 76.7 θ 3
The reciprocal relationship, θ as a function of κ, is given by:
θ = 5.3 × 10 2 + 2.92 × 10 2 κ 5.5 × 10 4 κ 2 + 4.3 × 10 6 κ 3
where κ is the relative dielectric permittivity and θ stands for the soil water content. From the measured electromagnetic propagation velocity, the relative dielectric permittivity can be determined.
Another more theoretical relationship between SWC and soil relative permittivity is based on dielectric mixing models [25,176]. In dielectric mixing models, the relative dielectric permittivity of bulk media κ b is related to the volumetric summation of the permittivity of water, soil particles, and air with the Complex Refractive Index Model (CRIM):
κ b = [ θ κ w α + ( 1 n ) κ s α + ( n θ ) a α ] 1 α
where   θ stands for the soil water content; n   ( m 3 m 3 ) denotes the soil porosity; κ w α , κ s α , and κ a α represent the permittivity of water, soil particles, and air, respectively; α accounts for the electrical field orientation with respect to the geometry of the medium, which changes from −1 to 1 as an electrical field changes from perpendicular to the soil layers to parallel to the soil layers. For an isotropic medium, α will be equal to 0.5. At present, most of the published petrophysical relationships are derived using TDR. These equations were obtained in a frequency range of between 500 MHz and 1000 MHz [176].
The Hanai–Bruggeman–Sen (HBS) mixing model also shows the relationship between the relative dielectric permittivity and the water content [177,178]:
θ = ( κ m a t r i x κ c o m p ) ( κ f l u i d / κ c o m p ) C ( κ m a t r i x κ f l u i d )
where θ is the water content; κ m a t r i x * stands for the complex relative dielectric permittivity of the matrix; κ f l u i d * represents the complex relative dielectric permittivity of the fluid; κ c o m p * is the complex relative dielectric permittivity of the composite mixture; and C is a shape factor. The CRIM relation is a semi-empirical formula, while the HBS relation is obtained from a theoretical model. In Figure A1, we plot the dielectric constant as a function of water content (θ) using the three relationships, the black solid line curve represents the TOPP relationship given by Equation (A1).
Figure A1. The dielectric constant increases with increasing water content. CRIM (blue dotted line), TOPP (black solid line), and HBS curves (red dashed line).
Remotesensing 14 05993 g0a1

Appendix B

At present, most studies focus on 1D vertical SWC dynamics flow. In a homogeneous and isotropic rigid porous medium, the water flow is calculated by solving Richards’ equation [18,179]:
θ ( h ) t = z [ K ( θ ) ( h z 1 ) ]
where θ is the volumetric water content ( cm 3 cm 3 ) ; h is the pressure head ( cm ) ; t represents time ( min ) ; z stands for the positive upward spatial coordinate ( cm ) ; K ( θ ) is the hydraulic conductivity ( cm   min 1 ) , which is a function of h ; and θ ( h ) is the water retention function described by the van Genuchten model [180]:
θ ( h ) = { θ r + θ s θ r ( 1 + | α h | n ) m , h < 0 θ s , h > 0 }
where θ r is the residual water content ( cm 3 cm 3 ) ; θ s represents the saturated water content ( cm 3 cm 3 ) ; α is the inverse of the air-entry value ( cm 1 ) ; n is related to the pore-size distribution; and m = 1 1 / n . The unsaturated conductivity is given by:
K ( θ ) = K s S e l [ 1 ( 1 S e 1 / m ) m ] 2
S e = θ θ r θ s θ r
where K s stands for the saturated hydraulic conductivity ( cm   min 1 ) ; S e is the effective saturated; and l is the tortuosity. In general, the value for l is set to 0.5.

Appendix C

The Equation (A9) represents the fitting formula:
v s o i l = 2 d 2 + ( 0.5 a ) 2 t r w , a
where t r w , a is the zero time corrected arrival times of the reflected wave; a represents the different separations of the antennas; d is the solving of depth; and v s o i l stands for the average velocity until the reflected layer [181].

Appendix D

The Dix equation:
v i n t , n = t r w , n v s o i l , n 2 t r w , n 1 v s o i l , n 1 2 t r w , n t r w , n 1
where v i n t , n represents the interval velocities of every layer; t r w , n and t r w , n 1 stand for the two-way travel time to the bottom of layer n and n − 1 respectively; and v s o i l , n and v s o i l , n 1 are the average velocity down to the bottom of layer n and n − 1.

Appendix E

The reflection coefficient is expressed as Equation (A11):
R = κ a i r κ s o i l κ a i r + κ s o i l
where κ s o i l is the soil permittivity and κ a i r is the air permittivity, which is always set to 1. The reflection coefficient is determined by Equation (A12) with the measured amplitude and the amplitude of reflections from a reflector such as a perfect conductor plate larger than the footprint of the radar antenna. The Equation (A12) is expressed as follows:
R = A r A P E C
where A r represents the measured amplitude and A P E C stands for the amplitude of reflections from a perfect conductor plate. Therefore, the soil permittivity can be calculated as follows [124,129]:
κ s o i l = ( 1 + A r A P E C 1 A r A P E C ) 2
The footprint of the radar antenna can be determined approximately through the diameter of the first Fresnel zone (FZD):
F Z D = ( λ 2 4 + 2 h λ ) 0.5
where λ is the wavelength at the center frequency of the radar and h is the height of the antenna.

References

  1. Field, J.P.; Breshears, D.D.; Law, D.J.; Villegas, J.C.; López-Hoffman, L.; Brooks, P.D.; Chorover, J.; Barron-Gafford, G.A.; Gallery, R.E.; Litvak, M.E.; et al. Critical Zone Services: Expanding Context, Constraints, and Currency beyond Ecosystem Services. Vadose Zone J. 2015, 14, vzj2014.2010.0142. [Google Scholar] [CrossRef] [Green Version]
  2. Council, N.R. Basic Research Opportunities in Earth Science; The National Academies Press: Washington, DC, USA, 2001; p. 168. [Google Scholar]
  3. Xu, X.; Liu, W. The global distribution of Earth’s critical zone and its controlling factors. Geophys. Res. Lett. 2017, 44, 3201–3208. [Google Scholar] [CrossRef]
  4. Chorover, J.; Kretzschmar, R.; Garcia-Pichel, F.; Sparks, D.L. Soil Biogeochemical Processes within the Critical Zone. Elements 2007, 3, 321–326. [Google Scholar] [CrossRef]
  5. Ferraro, J.V.; Hoggarth, J.A.; Zori, D.; Binetti, K.M.; Stinchcomb, G. Integrating Human Activities, Archeology, and the Paleo-Critical Zone Paradigm. Front. Earth Sci. 2018, 6, 84. [Google Scholar] [CrossRef] [Green Version]
  6. Cui, F.; Bao, J.; Cao, Z.; Li, L.; Zheng, Q. Soil hydraulic parameters estimation using ground penetrating radar data via ensemble smoother with multiple data assimilation. J. Hydrol. 2020, 583, 124552. [Google Scholar] [CrossRef]
  7. Léger, E.; Saintenoy, A.; Coquet, Y. Hydrodynamic parameters of a sandy soil determined by ground-penetrating radar inside a single ring infiltrometer. Water Resour. Res. 2014, 50, 5459–5474. [Google Scholar] [CrossRef] [Green Version]
  8. Robinson, D.A.; Campbell, C.S.; Hopmans, J.W.; Hornbuckle, B.K.; Jones, S.B.; Knight, R.; Ogden, F.; Selker, J.; Wendroth, O. Soil Moisture Measurement for Ecological and Hydrological Watershed-Scale Observatories: A Review. Vadose Zone J. 2008, 7, 358–389. [Google Scholar] [CrossRef] [Green Version]
  9. Chanasyk, D.S.; Naeth, M.A. Field measurement of soil moisture using neutron probes. Can. J. Soil Sci. 1996, 76, 317–323. [Google Scholar] [CrossRef]
  10. Brosten, T.R.; Day-Lewis, F.D.; Schultz, G.M.; Curtis, G.P.; Lane, J.W. Inversion of multi-frequency electromagnetic induction data for 3D characterization of hydraulic conductivity. J. Appl. Geophys. 2011, 73, 323–335. [Google Scholar] [CrossRef]
  11. Moghadas, D.; Jadoon, K.Z.; McCabe, M.F. Spatiotemporal monitoring of soil water content profiles in an irrigated field using probabilistic inversion of time-lapse EMI data. Adv. Water Resour. 2017, 110, 238–248. [Google Scholar] [CrossRef]
  12. Huisman, J.A.; Rings, J.; Vrugt, J.A.; Sorg, J.; Vereecken, H. Hydraulic properties of a model dike from coupled Bayesian and multi-criteria hydrogeophysical inversion. J. Hydrol. 2010, 380, 62–73. [Google Scholar] [CrossRef]
  13. Manoli, G.; Rossi, M.; Pasetto, D.; Deiana, R.; Ferraris, S.; Cassiani, G.; Putti, M. An iterative particle filter approach for coupled hydro-geophysical inversion of a controlled infiltration experiment. J. Comput. Phys. 2015, 283, 37–51. [Google Scholar] [CrossRef]
  14. Brunet, P.; Clément, R.; Bouvier, C. Monitoring soil water content and deficit using Electrical Resistivity Tomography (ERT)—A case study in the Cevennes area, France. J. Hydrol. 2010, 380, 146–153. [Google Scholar] [CrossRef]
  15. Mboh, C.M.; Huisman, J.A.; Van Gaelen, N.; Rings, J.; Vereecken, H. Coupled hydrogeophysical inversion of electrical resistances and inflow measurements for topsoil hydraulic properties under constant head infiltration. Near Surf. Geophys. 2012, 10, 413–426. [Google Scholar] [CrossRef]
  16. Hubbard, S.S.; Rubin, Y. Hydrogeological parameter estimation using geophysical data: A review of selected techniques. J. Contam. Hydrol. 2000, 45, 3–34. [Google Scholar] [CrossRef]
  17. Klotzsche, A.; Jonard, F.; Looms, M.C.; van der Kruk, J.; Huisman, J.A. Measuring Soil Water Content with Ground Penetrating Radar: A Decade of Progress. Vadose Zone J. 2018, 17, 180052. [Google Scholar] [CrossRef] [Green Version]
  18. Yu, Y.; Weihermüller, L.; Klotzsche, A.; Lärm, L.; Vereecken, H.; Huisman, J.A. Sequential and coupled inversion of horizontal borehole ground penetrating radar data to estimate soil hydraulic properties at the field scale. J. Hydrol. 2021, 596, 126010. [Google Scholar] [CrossRef]
  19. Jaumann, S.; Roth, K. Soil hydraulic material properties and layered architecture from time-lapse GPR. Hydrol. Earth Syst. Sci. 2018, 22, 2551–2573. [Google Scholar] [CrossRef] [Green Version]
  20. Pan, X.; Zhang, J.; Huang, P.; Roth, K. Estimating field-scale soil water dynamics at a heterogeneous site using multi-channel GPR. Hydrol. Earth Syst. Sci. 2012, 16, 4361–4372. [Google Scholar] [CrossRef] [Green Version]
  21. Topp, G.C.; Davis, J.L.; Annan, A.P. Electromagnetic determination of soil water content: Measurements in coaxial transmission lines. Water Resour. Res. 1980, 16, 574–582. [Google Scholar] [CrossRef]
  22. Huisman, J.A.; Hubbard, S.S.; Redman, J.D.; Annan, A.P. Measuring Soil Water Content with Ground Penetrating Radar: A Review. Vadose Zone J. 2003, 2, 476–491. [Google Scholar] [CrossRef]
  23. Liu, X.; Chen, J.; Cui, X.; Liu, Q.; Cao, X.; Chen, X. Measurement of soil water content using ground-penetrating radar: A review of current methods. Int. J. Digit. Earth 2019, 12, 95–118. [Google Scholar] [CrossRef]
  24. Davis, J.L.; Annan, A.P. Ground-penetrating radar for high-resolution mapping of soil and rock stratigraphy1. Geophys. Prospect. 1989, 37, 531–551. [Google Scholar] [CrossRef]
  25. Greaves, R.J.; Lesmes, D.P.; Lee, J.M.; Toksoz, M.N. Velocity variations and water content estimated from multi-offset, ground-penetrating radar. Geophysics 1996, 61, 683–695. [Google Scholar] [CrossRef]
  26. Bano, M.; Tsend-Ayush, N.; Schlupp, A.; Munkhuu, U. Ground-Penetrating Radar Imaging of Near-Surface Deformation along the Songino Active Fault in the Vicinity of Ulaanbaatar, Mongolia. Appl. Sci. 2021, 11, 8242. [Google Scholar] [CrossRef]
  27. Xuan, F.; Motoyuki, S. Pre-stack migration applied to GPR for landmine detection. Inverse Probl. 2004, 20, S99. [Google Scholar] [CrossRef]
  28. Zhou, H.; Feng, X.; Ding, C.; Dong, Z.; Liu, C.; Liang, W. Heterogeneous Weathering Process of Lunar Regolith Revealed by Polarimetric Attributes Analysis of Chang’E-4 Lunar Penetrating Radar Data Acquired During the Yutu-2 Turnings. Geophys. Res. Lett. 2022, 49, e2022GL099207. [Google Scholar] [CrossRef]
  29. Vellidis, G.; Smith, C.M.; Thomas, L.D.; Asmussen, E.L. Detecting wetting front movement in a sandy soil with ground-penetrating radar. Trans. ASAE 1990, 33, 1867–1874. [Google Scholar] [CrossRef]
  30. Hagrey, A.; Müller. GPR study of pore water content and salinity in sand. Geophys. Prospect. 2000, 48, 63–85. [Google Scholar] [CrossRef]
  31. Birken, R.; Versteeg, R. Use of four-dimensional ground penetrating radar and advanced visualization methods to determine subsurface fluid migration. J. Appl. Geophys. 2000, 43, 215–226. [Google Scholar] [CrossRef]
  32. Grote, K.; Hubbard, S.; Rubin, Y. GPR monitoring of volumetric water content in soils applied to highway construction and maintenance. Lead. Edge 2002, 21, 482–504. [Google Scholar] [CrossRef] [Green Version]
  33. Gish, T.J.; Dulaney, W.P.; Kung, K.J.S.; Daughtry, C.S.T.; Doolittle, J.A.; Miller, P.T. Evaluating Use of Ground-Penetrating Radar for Identifying Subsurface Flow Pathways. Soil Sci. Soc. Am. J. 2002, 66, 1620–1629. [Google Scholar] [CrossRef] [Green Version]
  34. Schmalz, B.; Lennartz, B. Analyses of soil water content variations and GPR attribute distributions. J. Hydrol. 2002, 267, 217–226. [Google Scholar] [CrossRef]
  35. Stoffregen, H.; Zenker, T.; Wessolek, G. Accuracy of soil water content measurements using ground penetrating radar: Comparison of ground penetrating radar and lysimeter data. J. Hydrol. 2002, 267, 201–206. [Google Scholar] [CrossRef]
  36. Loeffler, O.; Bano, M. Ground Penetrating Radar Measurements in a Controlled Vadose Zone: Influence of the Water Content. Vadose Zone J. 2004, 3, 1082–1092. [Google Scholar] [CrossRef]
  37. Makkawi, M.H. Integrating GPR and geostatistical techniques to map the spatial extent of a shallow groundwater system. J. Geophys. Eng. 2004, 1, 56–62. [Google Scholar] [CrossRef]
  38. Wollschläger, U.; Roth, K. Estimation of Temporal Changes of Volumetric Soil Water Content from Ground-Penetrating Radar Reflections. Subsurf. Sens. Technol. Appl. 2005, 6, 207–218. [Google Scholar] [CrossRef]
  39. Lunt, I.A.; Hubbard, S.S.; Rubin, Y. Soil moisture content estimation using ground-penetrating radar reflection data. J. Hydrol. 2005, 307, 254–269. [Google Scholar] [CrossRef]
  40. Turesson, A. Water content and porosity estimated from ground-penetrating radar and resistivity. J. Appl. Geophys. 2006, 58, 99–111. [Google Scholar] [CrossRef]
  41. Saintenoy, A.; Schneider, S.; Tucholka, P. Evaluating Ground Penetrating Radar Use for Water Infiltration Monitoring. Vadose Zone J. 2008, 7, 208–214. [Google Scholar] [CrossRef]
  42. Irving, J.; Knight, R.; Holliger, K. Estimation of the lateral correlation structure of subsurface water content from surface-based ground-penetrating radar reflection images. Water Resour. Res. 2009, 45, W12404. [Google Scholar] [CrossRef]
  43. Haarder, E.B.; Looms, M.C.; Jensen, K.H.; Nielsen, L. Visualizing Unsaturated Flow Phenomena Using High-Resolution Reflection Ground Penetrating Radar. Vadose Zone J. 2011, 10, 84–97. [Google Scholar] [CrossRef] [Green Version]
  44. Klenk, P.; Jaumann, S.; Roth, K. Quantitative high-resolution observations of soil water dynamics in a complicated architecture using time-lapse ground-penetrating radar. Hydrol. Earth Syst. Sci. 2015, 19, 1125–1139. [Google Scholar] [CrossRef] [Green Version]
  45. Schmelzbach, C.; Tronicke, J.; Dietrich, P. High-resolution water content estimation from surface-based ground-penetrating radar reflection data by impedance inversion. Water Resour. Res. 2012, 48, W08505. [Google Scholar] [CrossRef]
  46. Guo, L.; Chen, J.; Lin, H. Subsurface lateral preferential flow network revealed by time-lapse ground-penetrating radar in a hillslope. Water Resour. Res. 2014, 50, 9127–9147. [Google Scholar] [CrossRef] [Green Version]
  47. Zhang, J.; Lin, H.; Doolittle, J. Soil layering and preferential flow impacts on seasonal changes of GPR signals in two contrasting soils. Geoderma 2014, 213, 560–569. [Google Scholar] [CrossRef]
  48. Yu, Z.; Dylan, B.; Dryver, H.; Tian, X. Sand moisture assessment using instantaneous phase information in ground penetrating radar data. In Proceedings of the Structural Health Monitoring and Inspection of Advanced Materials, Aerospace, and Civil Infrastructure, San Diego, CA, USA, 8–12 March 2015; p. 943726. [Google Scholar]
  49. Shamir, O.; Goldshleger, N.; Basson, U.; Reshef, M. Mapping Spatial Moisture Content of Unsaturated Agricultural Soils With Ground-Penetrating Radar. Int. Arch. Photogramm. Remote Sens. Spat. Inf. Sci. 2016, XLI-B8, 1279–1285. [Google Scholar] [CrossRef] [Green Version]
  50. Shamir, O.; Goldshleger, N.; Basson, U.; Reshef, M. Laboratory Measurements of Subsurface Spatial Moisture Content by Ground-Penetrating Radar (GPR) Diffraction and Reflection Imaging of Agricultural Soils. Remote Sens. 2018, 10, 1667. [Google Scholar] [CrossRef] [Green Version]
  51. Ercoli, M.; Di Matteo, L.; Pauselli, C.; Mancinelli, P.; Frapiccini, S.; Talegalli, L.; Cannata, A. Integrated GPR and laboratory water content measures of sandy soils: From laboratory to field scale. Constr. Build. Mater. 2018, 159, 734–744. [Google Scholar] [CrossRef]
  52. Nyquist, J.E.; Toran, L.; Pitman, L.; Guo, L.; Lin, H. Testing the Fill-and-Spill Model of Subsurface Lateral Flow Using Ground-Penetrating Radar and Dye Tracing. Vadose Zone J. 2018, 17, 170142. [Google Scholar] [CrossRef]
  53. Di Prima, S.; Winiarski, T.; Angulo-Jaramillo, R.; Stewart, R.D.; Castellini, M.; Abou Najm, M.R.; Ventrella, D.; Pirastru, M.; Giadrossich, F.; Capello, G.; et al. Detecting infiltrated water and preferential flow pathways through time-lapse ground-penetrating radar surveys. Sci. Total Environ. 2020, 726, 138511. [Google Scholar] [CrossRef] [PubMed]
  54. Mangel, A.R.; Moysey, S.M.J.; Bradford, J. Reflection tomography of time-lapse GPR data for studying dynamic unsaturated flow phenomena. Hydrol. Earth Syst. Sci. 2020, 24, 159–167. [Google Scholar] [CrossRef]
  55. Zhang, M.H.; Bano, M.; Feng, X.; Lesparre, N.; Girard, J.F.; Razakarisoa, O.; Belfort, B.; Lehmann, F.; Friedmann, P. Estimating water content of unsaturated sandy soils by GPR during a drainage experiment. IOP Conf. Ser. Earth Environ. Sci. 2021, 660, 012018. [Google Scholar] [CrossRef]
  56. Zhang, M.; Bano, M.; Feng, X. Estimating Water Content of Unsaturated Sandy Soils by Ground-Penetrating Radar During an Infiltration Experiment. In Proceedings of the IOP Conference Series: Earth and Environmental Science, Bordeaux, France, 29 August–2 September 2021; Volume 2021, pp. 1–5. [Google Scholar] [CrossRef]
  57. van Overmeeren, R.A.; Sariowan, S.V.; Gehrels, J.C. Ground penetrating radar for determining volumetric soil water content; results of comparative measurements at two test sites. J. Hydrol. 1997, 197, 316–338. [Google Scholar] [CrossRef]
  58. Huisman, J.A.; Snepvangers, J.J.J.C.; Bouten, W.; Heuvelink, G.B.M. Monitoring Temporal Development of Spatial Soil Water Content Variation: Comparison of Ground Penetrating Radar and Time Domain Reflectometry. Vadose Zone J. 2003, 2, 519–529. [Google Scholar] [CrossRef]
  59. Galagedara, L.W.; Parkin, G.W.; Redman, J.D. Measuring and Modeling of Direct Ground Wave Depth Penetration Under Transient Soil Moisture Conditions. Subsurf. Sens. Technol. Appl. 2005, 6, 193–205. [Google Scholar] [CrossRef]
  60. Grote, K.; Hubbard, S.; Rubin, Y. Field-scale estimation of volumetric water content using ground-penetrating radar ground wave techniques. Water Resour. Res. 2003, 39. [Google Scholar] [CrossRef] [Green Version]
  61. Klenk, P.; Buchner, J.S.; Roth, K.; Wollschläger, U.; Qin, Y.; Zhou, K. On the reliability of current GPR ground wave methods for determining near-surface water contents. In Proceedings of the 2011 6th International Workshop on Advanced Ground Penetrating Radar (IWAGPR), Aachen, Germany, 22–24 June 2011; pp. 1–5. [Google Scholar]
  62. Qin, Y.; Chen, X.; Zhou, K.; Klenk, P.; Roth, K.; Sun, L. Ground-penetrating radar for monitoring the distribution of near-surface soil water content in the Gurbantünggüt Desert. Environ. Earth Sci. 2013, 70, 2883–2893. [Google Scholar] [CrossRef]
  63. Mahmoudzadeh Ardekani, M.R. Off- and on-ground GPR techniques for field-scale soil moisture mapping. Geoderma 2013, 200–201, 55–66. [Google Scholar] [CrossRef]
  64. Thitimakorn, T.; Kummode, S.; Kupongsak, S. Determination of Spatial and Temporal Variations of Volumetric Soil Water Content Using Ground Penetrating Radar: A Case Study in Thailand. Appl. Environ. Res. 2016, 38, 33–46. [Google Scholar] [CrossRef]
  65. Pettinelli, E.; Vannaroni, G.; Di Pasquo, B.; Mattei, E.; Di Matteo, A.; De Santis, A.; Annan, P.A. Correlation between near-surface electromagnetic soil parameters and early-time GPR signals: An experimental study. Geophysics 2007, 72, A25–A28. [Google Scholar] [CrossRef]
  66. Pettinelli, E.; Di Matteo, A.; Beaubien, S.E.; Mattei, E.; Lauro, S.E.; Galli, A.; Vannaroni, G. A controlled experiment to investigate the correlation between early-time signal attributes of ground-coupled radar and soil dielectric properties. J. Appl. Geophys. 2014, 101, 68–76. [Google Scholar] [CrossRef]
  67. Ferrara, C.; Barone, P.M.; Steelman, C.M.; Pettinelli, E.; Endres, A.L. Monitoring Shallow Soil Water Content Under Natural Field Conditions Using the Early-Time GPR Signal Technique. Vadose Zone J. 2013, 12, vzj2012.0202. [Google Scholar] [CrossRef]
  68. Algeo, J.; Van Dam, R.L.; Slater, L. Early-Time GPR: A Method to Monitor Spatial Variations in Soil Water Content during Irrigation in Clay Soils. Vadose Zone J. 2016, 15, vzj2016.2003.0026. [Google Scholar] [CrossRef] [Green Version]
  69. Benedetto, A. Water content evaluation in unsaturated soil using GPR signal analysis in the frequency domain. J. Appl. Geophys. 2010, 71, 26–35. [Google Scholar] [CrossRef]
  70. Benedetto, A.; Benedetto, F. Remote Sensing of Soil Moisture Content by GPR Signal Processing in the Frequency Domain. IEEE Sens. J. 2011, 11, 2432–2441. [Google Scholar] [CrossRef]
  71. Benedetto, A.; Tosti, F.; Ortuani, B.; Giudici, M.; Mele, M. Soil moisture mapping using GPR for pavement applications. In Proceedings of the 2013 7th International Workshop on Advanced Ground Penetrating Radar, Nantes, France, 2–5 July 2013; pp. 1–5. [Google Scholar]
  72. Weiler, K.W.; Steenhuis, T.S.; Boll, J.; Kung, K.J.S. Comparison of Ground Penetrating Radar and Time-Domain Reflectometry as Soil Water Sensors. Soil Sci. Soc. Am. J. 1998, 62, 1237–1239. [Google Scholar] [CrossRef]
  73. Huisman, J.A.; Sperl, C.; Bouten, W.; Verstraten, J.M. Soil water content measurements at different scales: Accuracy of time domain reflectometry and ground-penetrating radar. J. Hydrol. 2001, 245, 48–58. [Google Scholar] [CrossRef]
  74. Garambois, S.; Sénéchal, P.; Perroud, H. On the use of combined geophysical methods to assess water content and water conductivity of near-surface formations. J. Hydrol. 2002, 259, 32–48. [Google Scholar] [CrossRef]
  75. Strobbia, C.; Cassiani, G. Multilayer ground-penetrating radar guided waves in shallow soil layers for estimating soil water content. Geophysics 2007, 72, J17–J29. [Google Scholar] [CrossRef]
  76. Bradford, J.H. Measuring Water Content Heterogeneity Using Multifold GPR with Reflection Tomography. Vadose Zone J. 2008, 7, 184–193. [Google Scholar] [CrossRef]
  77. Gerhards, H.; Wollschläger, U.; Yu, Q.; Schiwek, P.; Pan, X.; Roth, K. Continuous and simultaneous measurement of reflector depth and average soil-water content with multichannel ground-penetrating radar. Geophysics 2008, 73, J15–J23. [Google Scholar] [CrossRef]
  78. Buchner, J.S.; Kühne, A.; Antz, B.; Roth, K.; Wollschläger, U. Observation of volumetric water content and reflector depth with multichannel ground-penetrating radar in an artificial sand volume. In Proceedings of the 2011 6th International Workshop on Advanced Ground Penetrating Radar (IWAGPR), Aachen, Germany, 22–24 June 2011; pp. 1–5. [Google Scholar]
  79. Buchner, J.S.; Wollschläger, U.; Roth, K. Inverting surface GPR data using FDTD simulation and automatic detection of reflections to estimate subsurface water content and geometry. Geophysics 2012, 77, H45–H55. [Google Scholar] [CrossRef]
  80. Steelman, C.M.; Endres, A.L. Assessing vertical soil moisture dynamics using multi-frequency GPR common-midpoint soundings. J. Hydrol. 2012, 436–437, 51–66. [Google Scholar] [CrossRef]
  81. Steelman, C.M.; Endres, A.L.; Jones, J.P. High-resolution ground-penetrating radar monitoring of soil moisture dynamics: Field results, interpretation, and comparison with unsaturated flow model. Water Resour. Res. 2012, 48, W09538. [Google Scholar] [CrossRef]
  82. Mangel, A.R.; Moysey, S.M.J.; Ryan, J.C.; Tarbutton, J.A. Multi-offset ground-penetrating radar imaging of a lab-scale infiltration test. Hydrol. Earth Syst. Sci. 2012, 16, 4009–4022. [Google Scholar] [CrossRef] [Green Version]
  83. Mangel, A.R.; Lytle, B.A.; Moysey, S.M.J. Automated high-resolution GPR data collection for monitoring dynamic hydrologic processes in two and three dimensions. Lead. Edge 2015, 34, 190–196. [Google Scholar] [CrossRef]
  84. Allroggen, N.; van Schaik, N.L.M.B.; Tronicke, J. 4D ground-penetrating radar during a plot scale dye tracer experiment. J. Appl. Geophys. 2015, 118, 139–144. [Google Scholar] [CrossRef]
  85. Iwasaki, T.; Kuroda, S.; Saito, H.; Tobe, Y.; Suzuki, K.; Fujimaki, H.; Inoue, M. Monitoring Infiltration Process Seamlessly Using Array Ground Penetrating Radar. Agric. Environ. Lett. 2016, 1, 160002. [Google Scholar] [CrossRef]
  86. Kaufmann, M.S.; Klotzsche, A.; Vereecken, H.; van der Kruk, J. Simultaneous multichannel multi-offset ground-penetrating radar measurements for soil characterization. Vadose Zone J. 2020, 19, e20017. [Google Scholar] [CrossRef]
  87. Yu, Y.; Klotzsche, A.; Weihermüller, L.; Huisman, J.A.; Vanderborght, J.; Vereecken, H.; van der Kruk, J. Measuring vertical soil water content profiles by combining horizontal borehole and dispersive surface ground penetrating radar data. Near Surf. Geophys. 2020, 18, 275–294. [Google Scholar] [CrossRef] [Green Version]
  88. Saito, H.; Kuroda, S.; Iwasaki, T.; Sala, J.; Fujimaki, H. Estimating infiltration front depth using time-lapse multioffset gathers obtained from ground-penetrating-radar antenna array. Geophysics 2021, 86, WB51–WB59. [Google Scholar] [CrossRef]
  89. Huisman, J.A.; Snepvangers, J.J.J.C.; Bouten, W.; Heuvelink, G.B.M. Mapping spatial variation in surface soil water content: Comparison of ground-penetrating radar and time domain reflectometry. J. Hydrol. 2002, 269, 194–207. [Google Scholar] [CrossRef]
  90. Hubbard, S.; Grote, K.; Rubin, Y. Mapping the volumetric soil water content of a California vineyard using high-frequency GPR ground wave data. Lead. Edge 2002, 21, 552–559. [Google Scholar] [CrossRef]
  91. Grote, K.; Anger, C.; Kelly, B.; Hubbard, S.; Rubin, Y. Characterization of Soil Water Content Variability and Soil Texture using GPR Groundwave Techniques. J. Environ. Eng. Geophys. 2010, 15, 93–110. [Google Scholar] [CrossRef] [Green Version]
  92. Galagedara, L.W.; Parkin, G.W.; Redman, J.D. An analysis of the ground-penetrating radar direct ground wave method for soil water content measurement. Hydrol. Processes 2003, 17, 3615–3628. [Google Scholar] [CrossRef]
  93. Galagedara, L.W.; Redman, J.D.; Parkin, G.W.; Annan, A.P.; Endres, A.L. Numerical Modeling of GPR to Determine the Direct Ground Wave Sampling Depth. Vadose Zone J. 2005, 4, 1096–1106. [Google Scholar] [CrossRef]
  94. Weihermüller, L.; Huisman, J.A.; Lambot, S.; Herbst, M.; Vereecken, H. Mapping the spatial variation of soil water content at the field scale with different ground penetrating radar techniques. J. Hydrol. 2007, 340, 205–216. [Google Scholar] [CrossRef] [Green Version]
  95. Steelman, C.M.; Endres, A.L. An examination of direct ground wave soil moisture monitoring over an annual cycle of soil conditions. Water Resour. Res. 2010, 46, W11533. [Google Scholar] [CrossRef]
  96. Cao, Q.; Song, X.; Wu, H.; Gao, L.; Liu, F.; Yang, S.; Zhang, G. Mapping the response of volumetric soil water content to an intense rainfall event at the field scale using GPR. J. Hydrol. 2020, 583, 124605. [Google Scholar] [CrossRef]
  97. Knoll, M.D.; Clement, W.P. Vertical Radar Profiling to Determine Dielectric Constant, Water Content and Porosity Values at Well Locations. In Symposium on the Application of Geophysics to Engineering and Environmental Problems 1999; Symposium on the Application of Geophysics to Engineering and Environmental Problems Proceedings; Environment and Engineering Geophysical Society: Oakland, CA, USA, 1999; pp. 821–830. [Google Scholar]
  98. Alumbaugh, D.; Paprocki, L.; Brainard, J.; Rautman, C. Monitoring Infiltration within the Vadose Zone Using Cross Borehole Ground Penetrating Radar. In Symposium on the Application of Geophysics to Engineering and Environmental Problems 2000; Symposium on the Application of Geophysics to Engineering and Environmental Problems Proceedings; Environment and Engineering Geophysical Society: Arlington, VA, USA, 2000; pp. 273–281. [Google Scholar]
  99. Parkin, G.; Redman, D.; von Bertoldi, P.; Zhang, Z. Measurement of soil water content below a wastewater trench using ground-penetrating radar. Water Resour. Res. 2000, 36, 2147–2154. [Google Scholar] [CrossRef]
  100. Binley, A.; Winship, P.; Middleton, R.; Pokar, M.; West, J. High-resolution characterization of vadose zone dynamics using cross-borehole radar. Water Resour. Res. 2001, 37, 2639–2652. [Google Scholar] [CrossRef] [Green Version]
  101. Binley, A.; Cassiani, G.; Middleton, R.; Winship, P. Vadose zone flow model parameterisation using cross-borehole radar and resistivity imaging. J. Hydrol. 2002, 267, 147–159. [Google Scholar] [CrossRef]
  102. Binley, A.; Winship, P.; West, L.J.; Pokar, M.; Middleton, R. Seasonal variation of moisture content in unsaturated sandstone inferred from borehole radar and resistivity profiles. J. Hydrol. 2002, 267, 160–172. [Google Scholar] [CrossRef]
  103. Galagedara, L.W.; Gary, W.P.; Redman, J.D.; Endres, A.L. Temporal and spatial variation of soil water content measured by borehole GPR under irrigation and drainage. In Proceedings of the Ninth International Conference on Ground Penetrating Radar, Santa Barbara, CA, USA, 29 April–2 May 2002; pp. 180–185. [Google Scholar]
  104. Galagedara, L.W.; Parkin, G.W.; Redman, J.D.; Endres, A.L. Assessment of Soil Moisture Content Measured by Borehole GPR and TDR Under Transient Irrigation and Drainage. J. Environ. Eng. Geophys. 2003, 8, 77–86. [Google Scholar] [CrossRef]
  105. Rucker, D.F.; Ferré, T.P.A. Near-Surface Water Content Estimation with Borehole Ground Penetrating Radar Using Critically Refracted Waves. Vadose Zone J. 2003, 2, 247–252. [Google Scholar] [CrossRef] [Green Version]
  106. Rucker, D.F.; Ferré, T.P.A. Correcting Water Content Measurement Errors Associated with Critically Refracted First Arrivals on Zero Offset Profiling Borehole Ground Penetrating Radar Profiles. Vadose Zone J. 2004, 3, 278–287. [Google Scholar] [CrossRef]
  107. Rucker, D.F.; Ferré, T.P.A. Automated water content reconstruction of zero-offset borehole ground penetrating radar data using simulated annealing. J. Hydrol. 2005, 309, 1–16. [Google Scholar] [CrossRef]
  108. Ferré, T.P.A.; von Glinski, G.; Ferré, L.A. Monitoring the Maximum Depth of Drainage in Response to Pumping Using Borehole Ground Penetrating Radar. Vadose Zone J. 2003, 2, 511–518. [Google Scholar] [CrossRef]
  109. Kowalsky, M.B.; Finsterle, S.; Rubin, Y. Estimating flow parameter distributions using ground-penetrating radar and hydrological measurements during transient flow in the vadose zone. Adv. Water Resour. 2004, 27, 583–599. [Google Scholar] [CrossRef]
  110. Looms, M.C.; Jensen, K.H.; Binley, A.; Nielsen, L. Monitoring Unsaturated Flow and Transport Using Cross-Borehole Geophysical Methods. Vadose Zone J. 2008, 7, 227–237. [Google Scholar] [CrossRef] [Green Version]
  111. Kuroda, S.; Jang, H.; Kim, H.J. Time-lapse borehole radar monitoring of an infiltration experiment in the vadose zone. J. Appl. Geophys. 2009, 67, 361–366. [Google Scholar] [CrossRef]
  112. Wijewardana, Y.G.N.S.; Galagedara, L.W. Estimation of spatio-temporal variability of soil water content in agricultural fields with ground penetrating radar. J. Hydrol. 2010, 391, 24–33. [Google Scholar] [CrossRef]
  113. Haarder, E.B.; Binley, A.; Looms, M.C.; Doetsch, J.; Nielsen, L.; Jensen, K.H. Comparing Plume Characteristics Inferred from Cross-Borehole Geophysical Data. Vadose Zone J. 2012, 11, vzj2012.0031. [Google Scholar] [CrossRef]
  114. Klotzsche, A.; Lärm, L.; Vanderborght, J.; Cai, G.; Morandage, S.; Zörner, M.; Vereecken, H.; van der Kruk, J. Monitoring Soil Water Content Using Time-Lapse Horizontal Borehole GPR Data at the Field-Plot Scale. Vadose Zone J. 2019, 18, 190044. [Google Scholar] [CrossRef] [Green Version]
  115. Hubbard, S.S.; Peterson, J.E.; Majer, E.L.; Zawislanski, P.T.; Williams, K.H.; Roberts, J.; Wobber, F. Estimation of permeable pathways and water content using tomographic radar data. Lead. Edge 1997, 16, 1623–1630. [Google Scholar] [CrossRef]
  116. Eppstein, M.J.; Dougherty, D.E. Efficient three-dimensional data inversion: Soil characterization and moisture Monitoring from cross-well ground-penetrating radar at a Vermont Test Site. Water Resour. Res. 1998, 34, 1889–1900. [Google Scholar] [CrossRef]
  117. Alumbaugh, D.; Chang, P.Y.; Paprocki, L.; Brainard, J.R.; Glass, R.J.; Rautman, C.A. Estimating moisture contents in the vadose zone using cross-borehole ground penetrating radar: A study of accuracy and repeatability. Water Resour. Res. 2002, 38, 45-1–45-12. [Google Scholar] [CrossRef] [Green Version]
  118. Chang, P.-Y.; Alumbaugh, D.; Brainard, J.; Hall, L. The application of ground penetrating radar attenuation tomography in a vadose zone infiltration experiment. J. Contam. Hydrol. 2004, 71, 67–87. [Google Scholar] [CrossRef]
  119. Deiana, R.; Cassiani, G.; Kemna, A.; Villa, A.; Bruno, V.; Bagliani, A. An experiment of non-invasive characterization of the vadose zone via water injection and cross-hole time-lapse geophysical monitoring. Near Surf. Geophys. 2007, 5, 183–194. [Google Scholar] [CrossRef]
  120. Dafflon, B.; Irving, J.; Barrash, W. Inversion of multiple intersecting high-resolution crosshole GPR profiles for hydrological characterization at the Boise Hydrogeophysical Research Site. J. Appl. Geophys. 2011, 73, 305–314. [Google Scholar] [CrossRef]
  121. Cassiani, G.; Strobbia, C.; Gallotti, L. Vertical Radar Profiles for the Characterization of Deep Vadose Zones. Vadose Zone J. 2004, 3, 1093–1105. [Google Scholar] [CrossRef]
  122. Strobach, E.; Harris, B.D.; Dupuis, J.C.; Kepic, A.W. Time-lapse borehole radar for monitoring rainfall infiltration through podosol horizons in a sandy vadose zone. Water Resour. Res. 2014, 50, 2140–2163. [Google Scholar] [CrossRef] [Green Version]
  123. Chanzy, A.; Tarussov, A.; Bonn, F.; Judge, A. Soil Water Content Determination Using a Digital Ground-Penetrating Radar. Soil Sci. Soc. Am. J. 1996, 60, 1318–1326. [Google Scholar] [CrossRef]
  124. Redman, J.D.; Davis, J.L.; Galagedara, L.W.; Gary, W.P. Field studies of GPR air launched surface reflectivity measurements of soil water content. In Proceedings of the Ninth International Conference on Ground Penetrating Radar, Santa Barbara, CA, USA, 29 April–2 May 2002; pp. 156–161. [Google Scholar]
  125. Redman, D.; Galagedara, L.; Parkin, G. Measuring Soil Water Content with the Ground Penetrating Radar Surface Reflectivity Method: Effects of Spatial Variability. In Proceedings of the 2003 ASAE Annual Meeting, St. Joseph, MI, USA, 27–30 July 2003. [Google Scholar]
  126. Serbin, G.; Or, D. Ground-penetrating radar measurement of soil water content dynamics using a suspended horn antenna. IEEE Trans. Geosci. Remote Sens. 2004, 42, 1695–1705. [Google Scholar] [CrossRef]
  127. Serbin, G.; Or, D. Ground-penetrating radar measurement of crop and surface water content dynamics. Remote Sens. Environ. 2005, 96, 119–134. [Google Scholar] [CrossRef]
  128. Lambot, S.; Rhebergen, J.; van den Bosch, I.; Slob, E.C.; Vanclooster, M. Measuring the Soil Water Content Profile of a Sandy Soil with an Off-Ground Monostatic Ground Penetrating Radar. Vadose Zone J. 2004, 3, 1063–1071. [Google Scholar] [CrossRef]
  129. Lambot, S.; Weihermüller, L.; Huisman, J.A.; Vereecken, H.; Vanclooster, M.; Slob, E.C. Analysis of air-launched ground-penetrating radar techniques to measure the soil surface water content. Water Resour. Res. 2006, 42, W11403. [Google Scholar] [CrossRef] [Green Version]
  130. Lambot, S.; Slob, E.; Chavarro, D.; Lubczynski, M.; Vereecken, H. Measuring soil surface water content in irrigated areas of southern Tunisia using full-waveform inversion of proximal GPR data. Near Surf. Geophys. 2008, 6, 403–410. [Google Scholar] [CrossRef]
  131. Jadoon, K.Z.; Lambot, S.; Scharnagl, B.; van der Kruk, J.; Slob, E.; Vereecken, H. Quantifying field-scale surface soil water content from proximal GPR signal inversion in the time domain. Near Surf. Geophys. 2010, 8, 483–491. [Google Scholar] [CrossRef]
  132. Minet, J.; Lambot, S.; Slob, E.C.; Vanclooster, M. Soil Surface Water Content Estimation by Full-Waveform GPR Signal Inversion in the Presence of Thin Layers. IEEE Trans. Geosci. Remote Sens. 2010, 48, 1138–1150. [Google Scholar] [CrossRef] [Green Version]
  133. Minet, J.; Bogaert, P.; Vanclooster, M.; Lambot, S. Validation of ground penetrating radar full-waveform inversion for field scale soil moisture mapping. J. Hydrol. 2012, 424–425, 112–123. [Google Scholar] [CrossRef] [Green Version]
  134. Jonard, F.; Weihermuller, L.; Jadoon, K.Z.; Schwank, M.; Vereecken, H.; Lambot, S. Mapping Field-Scale Soil Moisture With L-Band Radiometer and Ground-Penetrating Radar Over Bare Soil. IEEE Trans. Geosci. Remote Sens. 2011, 49, 2863–2875. [Google Scholar] [CrossRef]
  135. Jonard, F.; Weihermüller, L.; Vereecken, H.; Lambot, S. Accounting for soil surface roughness in the inversion of ultrawideband off-ground GPR signal for soil moisture retrieval. Geophysics 2012, 77, H1–H7. [Google Scholar] [CrossRef]
  136. Jonard, F.; Mahmoudzadeh, M.; Roisin, C.; Weihermüller, L.; André, F.; Minet, J.; Vereecken, H.; Lambot, S. Characterization of tillage effects on the spatial variation of soil properties using ground-penetrating radar and electromagnetic induction. Geoderma 2013, 207–208, 310–322. [Google Scholar] [CrossRef]
  137. Tran, A.P.; Ardekani, M.R.M.; Lambot, S. Coupling of dielectric mixing models with full-wave ground-penetrating radar signal inversion for sandy-soil-moisture estimation. Geophysics 2012, 77, H33–H44. [Google Scholar] [CrossRef]
  138. Tran, A.P.; Bogaert, P.; Wiaux, F.; Vanclooster, M.; Lambot, S. High-resolution space–time quantification of soil moisture along a hillslope using joint analysis of ground penetrating radar and frequency domain reflectometry data. J. Hydrol. 2015, 523, 252–261. [Google Scholar] [CrossRef]
  139. Moghadas, D.; Jadoon, K.Z.; Vanderborght, J.; Lambot, S.; Vereecken, H. Estimation of the near surface soil water content during evaporation using air-launched ground-penetrating radar. Near Surf. Geophys. 2014, 12, 623–634. [Google Scholar] [CrossRef]
  140. Lambot, S.; Slob, E.C.; Bosch, I.v.d.; Stockbroeckx, B.; Vanclooster, M. Modeling of ground-penetrating Radar for accurate characterization of subsurface electric properties. IEEE Trans. Geosci. Remote Sens. 2004, 42, 2555–2568. [Google Scholar] [CrossRef]
  141. Busch, S.; van der Kruk, J.; Bikowski, J.; Vereecken, H. Quantitative conductivity and permittivity estimation using full-waveform inversion of on-ground GPR data. Geophysics 2012, 77, H79–H91. [Google Scholar] [CrossRef]
  142. Lavoué, F.; Brossier, R.; Métivier, L.; Garambois, S.; Virieux, J. Two-dimensional permittivity and conductivity imaging by full waveform inversion of multioffset GPR data: A frequency-domain quasi-Newton approach. Geophys. J. Int. 2014, 197, 248–268. [Google Scholar] [CrossRef] [Green Version]
  143. Feng, X.; Ren, Q.; Liu, C.; Zhang, X. Joint acoustic full-waveform inversion of crosshole seismic and ground-penetrating radar data in the frequency domain. Geophysics 2017, 82, H41–H56. [Google Scholar] [CrossRef]
  144. Nilot, E.; Feng, X.; Zhang, Y.; Zhang, M.; Dong, Z.; Zhou, H.; Zhang, X. Multiparameter Full-waveform inversion of on-ground GPR using Memoryless quasi-Newton (MLQN) method. In Proceedings of the 2018 17th International Conference on Ground Penetrating Radar (GPR), Rapperswil, Switzerland, 18–21 June 2018; pp. 1–4. [Google Scholar]
  145. Lambot, S.; André, F. Full-Wave Modeling of Near-Field Radar Data for Planar Layered Media Reconstruction. IEEE Trans. Geosci. Remote Sens. 2014, 52, 2295–2303. [Google Scholar] [CrossRef]
  146. Zajícová, K.; Chuman, T. Application of ground penetrating radar methods in soil studies: A review. Geoderma 2019, 343, 116–129. [Google Scholar] [CrossRef]
  147. Bano, M.; Loeffler, O.; Girard, J.-F. Ground penetrating radar imaging and time-domain modelling of the infiltration of diesel fuel in a sandbox experiment. Comptes Rendus Geosci. 2009, 341, 846–858. [Google Scholar] [CrossRef]
  148. Bano, M. Modelling of GPR waves for lossy media obeying a complex power law of frequency for dielectric permittivity. Geophys. Prospect. 2004, 52, 11–26. [Google Scholar] [CrossRef] [Green Version]
  149. Bano, M. Modeling GPR data in the fourier domain: Choice of the radar source. In Proceedings of the 2016 16th International Conference on Ground Penetrating Radar (GPR), Hong Kong, China, 13–16 June 2016; pp. 1–6. [Google Scholar]
  150. Wagner, B.J. Simultaneous parameter estimation and contaminant source characterization for coupled groundwater flow and contaminant transport modelling. J. Hydrol. 1992, 135, 275–303. [Google Scholar] [CrossRef]
  151. Vereecken, H.; Kasteel, R.; Vanderborght, J.; Harter, T. Upscaling Hydraulic Properties and Soil Water Flow Processes in Heterogeneous Soils: A Review. Vadose Zone J. 2007, 6, 1–28. [Google Scholar] [CrossRef]
  152. Hartmann, A.; Goldscheider, N.; Wagener, T.; Lange, J.; Weiler, M. Karst water resources in a changing world: Review of hydrological modeling approaches. Rev. Geophys. 2014, 52, 218–242. [Google Scholar] [CrossRef]
  153. Chen, J.; Hubbard, S.; Rubin, Y. Estimating the hydraulic conductivity at the south oyster site from geophysical tomographic data using Bayesian Techniques based on the normal linear regression model. Water Resour. Res. 2001, 37, 1603–1613. [Google Scholar] [CrossRef]
  154. Cassiani, G.; Binley, A. Modeling unsaturated flow in a layered formation under quasi-steady state conditions using geophysical data constraints. Adv. Water Resour. 2005, 28, 467–477. [Google Scholar] [CrossRef]
  155. Rossi, M.; Manoli, G.; Pasetto, D.; Deiana, R.; Ferraris, S.; Strobbia, C.; Putti, M.; Cassiani, G. Coupled inverse modeling of a controlled irrigation experiment using multiple hydro-geophysical data. Adv. Water Resour. 2015, 82, 150–165. [Google Scholar] [CrossRef]
  156. Kowalsky, M.B.; Finsterle, S.; Peterson, J.; Hubbard, S.; Rubin, Y.; Majer, E.; Ward, A.; Gee, G. Estimation of field-scale soil hydraulic and dielectric parameters through joint inversion of GPR and hydrological data. Water Resour. Res. 2005, 41, W11425. [Google Scholar] [CrossRef] [Green Version]
  157. Looms, M.C.; Binley, A.; Jensen, K.H.; Nielsen, L.; Hansen, T.M. Identifying Unsaturated Hydraulic Parameters Using an Integrated Data Fusion Approach on Cross-Borehole Geophysical Data. Vadose Zone J. 2008, 7, 238–248. [Google Scholar] [CrossRef] [Green Version]
  158. Linde, N.; Finsterle, S.; Hubbard, S. Inversion of tracer test data using tomographic constraints. Water Resour. Res. 2006, 42, W04410. [Google Scholar] [CrossRef] [Green Version]
  159. Moysey, S.M. Hydrologic trajectories in transient ground-penetrating-radar reflection data. Geophysics 2010, 75, WA211–WA219. [Google Scholar] [CrossRef]
  160. Saintenoy, A.; Hopmans, J.W. Ground Penetrating Radar: Water Table Detection Sensitivity to Soil Water Retention Properties. IEEE J. Sel. Top. Appl. Earth Obs. Remote Sens. 2011, 4, 748–753. [Google Scholar] [CrossRef] [Green Version]
  161. Scholer, M.; Irving, J.; Binley, A.; Holliger, K. Estimating vadose zone hydraulic properties using ground penetrating radar: The impact of prior information. Water Resour. Res. 2011, 47, W10512. [Google Scholar] [CrossRef] [Green Version]
  162. Scholer, M.; Irving, J.; Looms, M.C.; Nielsen, L.; Holliger, K. Bayesian Markov-Chain-Monte-Carlo Inversion of Time-Lapse Crosshole GPR Data to Characterize the Vadose Zone at the Arrenaes Site, Denmark. Vadose Zone J. 2012, 11, vzj2011.0153. [Google Scholar] [CrossRef]
  163. Busch, S.; Weihermüller, L.; Huisman, J.A.; Steelman, C.M.; Endres, A.L.; Vereecken, H.; van der Kruk, J. Coupled hydrogeophysical inversion of time-lapse surface GPR data to estimate hydraulic properties of a layered subsurface. Water Resour. Res. 2013, 49, 8480–8494. [Google Scholar] [CrossRef] [Green Version]
  164. Bradford, J.; Thoma, M.; Barrash, W. Estimating hydrologic parameters from water table dynamics using coupled hydrologic and ground-penetrating radar inversion. In Proceedings of the 15th International Conference on Ground Penetrating Radar, Brussels, Belgium, 30 June–4 July 2014; pp. 232–237. [Google Scholar]
  165. Leger, E.; Saintenoy, A.; Coquet, Y. Estimating saturated hydraulic conductivity from ground-based GPR monitoring Porchet infiltration in sandy soil. In Proceedings of the 15th International Conference on Ground Penetrating Radar, Brussels, Belgium, 30 June–4 July 2014; pp. 124–130. [Google Scholar]
  166. Léger, E.; Saintenoy, A.; Tucholka, P.; Coquet, Y. Hydrodynamic Parameters of a Sandy Soil Determined by Ground-Penetrating Radar Monitoring of Porchet Infiltrations. IEEE J. Sel. Top. Appl. Earth Obs. Remote Sens. 2016, 9, 188–200. [Google Scholar] [CrossRef]
  167. Léger, E.; Saintenoy, A.; Coquet, Y.; Tucholka, P.; Zeyen, H. Evaluating hydrodynamic parameters accounting for water retention hysteresis in a large sand column using surface GPR. J. Appl. Geophys. 2020, 182, 104176. [Google Scholar] [CrossRef]
  168. Lambot, S.; Slob, E.C.; Vanclooster, M.; Vereecken, H. Closed loop GPR data inversion for soil hydraulic and electric property determination. Geophys. Res. Lett. 2006, 33, L21405. [Google Scholar] [CrossRef] [Green Version]
  169. Jadoon, K.Z.; Slob, E.; Vanclooster, M.; Vereecken, H.; Lambot, S. Uniqueness and stability analysis of hydrogeophysical inversion for time-lapse ground-penetrating radar estimates of shallow soil hydraulic properties. Water Resour. Res. 2008, 44, W09421. [Google Scholar] [CrossRef] [Green Version]
  170. Lambot, S.; Slob, E.; Rhebergen, J.; Lopera, O.; Jadoon, K.Z.; Vereecken, H. Remote Estimation of the Hydraulic Properties of a Sand Using Full-Waveform Integrated Hydrogeophysical Inversion of Time-Lapse, Off-Ground GPR Data. Vadose Zone J. 2009, 8, 743–754. [Google Scholar] [CrossRef]
  171. Jadoon, K.Z.; Weihermüller, L.; Scharnagl, B.; Kowalsky, M.B.; Bechtold, M.; Hubbard, S.S.; Vereecken, H.; Lambot, S. Estimation of Soil Hydraulic Parameters in the Field by Integrated Hydrogeophysical Inversion of Time-Lapse Ground-Penetrating Radar Data. Vadose Zone J. 2012, 11, vzj2011.0177. [Google Scholar] [CrossRef]
  172. Jonard, F.; Weihermüller, L.; Schwank, M.; Jadoon, K.Z.; Vereecken, H.; Lambot, S. Estimation of Hydraulic Properties of a Sandy Soil Using Ground-Based Active and Passive Microwave Remote Sensing. IEEE Trans. Geosci. Remote Sens. 2015, 53, 3095–3109. [Google Scholar] [CrossRef]
  173. Tran, A.P.; Vanclooster, M.; Zupanski, M.; Lambot, S. Joint estimation of soil moisture profile and hydraulic parameters by ground-penetrating radar data assimilation with maximum likelihood ensemble filter. Water Resour. Res. 2014, 50, 3131–3146. [Google Scholar] [CrossRef]
  174. Dagenbach, A.; Buchner, J.S.; Klenk, P.; Roth, K. Identifying a parameterisation of the soil water retention curve from on-ground GPR measurements. Hydrol. Earth Syst. Sci. 2013, 17, 611–618. [Google Scholar] [CrossRef]
  175. Yu, Y.; Huisman, J.A.; Klotzsche, A.; Vereecken, H.; Weihermüller, L. Coupled full-waveform inversion of horizontal borehole ground penetrating radar data to estimate soil hydraulic parameters: A synthetic study. J. Hydrol. 2022, 610, 127817. [Google Scholar] [CrossRef]
  176. Roth, K.; Schulin, R.; Flühler, H.; Attinger, W. Calibration of time domain reflectometry for water content measurement using a composite dielectric approach. Water Resour. Res. 1990, 26, 2267–2273. [Google Scholar] [CrossRef]
  177. Sen, P.N.; Scala, C.; Cohen, M.H. A self-similar model for sedimentary rocks with application to the dielectric constant of fused glass beads. Geophysics 1981, 46, 781–795. [Google Scholar] [CrossRef]
  178. Johnson, R.H.; Poeter, E.P. Iterative use of the Bruggeman-Hanai-Sen mixing model to determine water saturations in sand. Geophysics 2005, 70, K33–K38. [Google Scholar] [CrossRef]
  179. Lambot, S.; Antoine, M.; van den Bosch, I.; Slob, E.C.; Vanclooster, M. Electromagnetic Inversion of GPR Signals and Subsequent Hydrodynamic Inversion to Estimate Effective Vadose Zone Hydraulic Properties. Vadose Zone J. 2004, 3, 1072–1081. [Google Scholar] [CrossRef]
  180. van Genuchten, M.T. A Closed-form Equation for Predicting the Hydraulic Conductivity of Unsaturated Soils. Soil Sci. Soc. Am. J. 1980, 44, 892–898. [Google Scholar] [CrossRef] [Green Version]
  181. Tillard, S.; Dubois, J.-C. Analysis of GPR data: Wave propagation velocity determination. J. Appl. Geophys. 1995, 33, 77–91. [Google Scholar] [CrossRef]
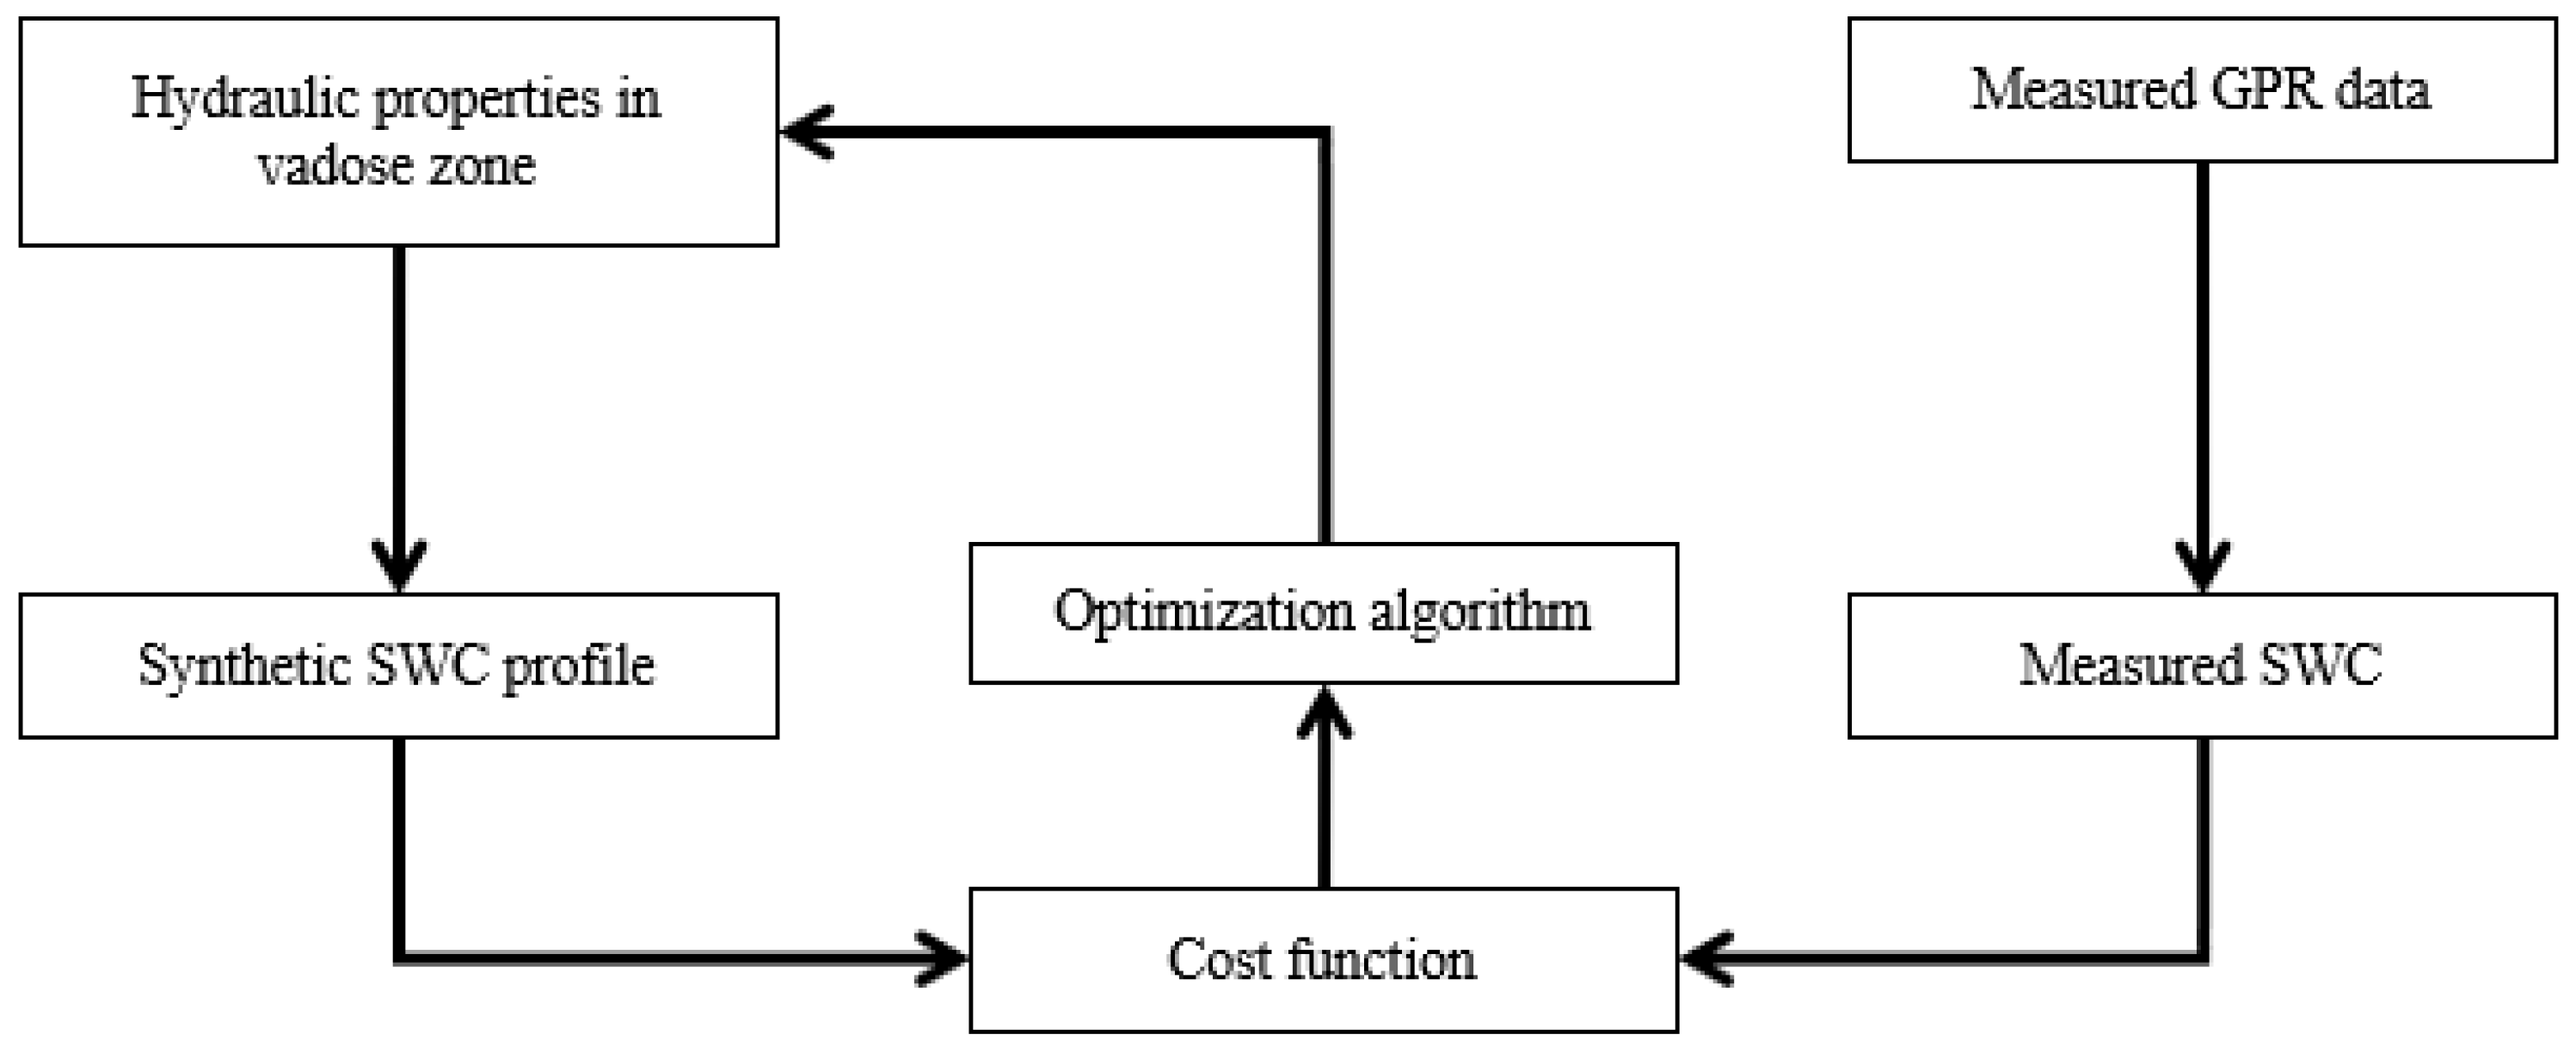
Figure 1. An illustration of the critical zone [4,5].
Remotesensing 14 05993 g001
Figure 2. Flowchart of sequential inversion.
Remotesensing 14 05993 g002
Figure 3. Propagation paths of the different electromagnetic waves in a two-layer medium with different dielectric permittivities.
Remotesensing 14 05993 g003
Figure 4. Different survey modes for GPR. (a) Surface GPR: FO, CMP, and WARR measurements; (b) Borehole GPR: ZOP, MOP, and VRP measurements; (c) Off-ground GPR; (d) a field picture showed the off-ground system mounted on a survey vehicle [17].
Remotesensing 14 05993 g004
Figure 5. (a) A GPR profile acquired with a 205 MHz antenna in the northwestern part of the Songino fault, showing the thrust fault structure indicated by black arrows. The compressive structures are presented as red lines (Author’s own work) [26]; (b) A 3D slice image, showing the reconstructed landmine image based on a migrated CMP multi-offset dataset that was acquired by a stepped-frequency continuous-wave array antenna system (Author’s own work). Adapted with permission from [27]. Copyright 2004, IOP Science; (c) Fine evolution of the regolith at the CE-4 lunar probe landing site was established with the data from the 500 MHz GPR (Author’s own work). Adapted with permission from [28]. Copyright 2022, Wiley.
Remotesensing 14 05993 g005
Figure 6. Schematic wide-angle reflection and refraction (WARR) measurement. Adapted with permission from [22]. Copyright 2003, Wiley.
Remotesensing 14 05993 g006
Figure 7. Influence of soil permittivity on the amplitude of the early−time signal (modified version from [65]). Adapted with permission from [146]. Copyright 2019, Elsevier.
Remotesensing 14 05993 g007
Figure 8. Two common-offset GPR profiles measured at the same location with a 1200 MHz antenna in a sandbox experiment; the sand thickness is 1 m. (a) for “dry” sand and (b) for wet sand with the water level 48 cm below the surface of the sand. The white arrow indicates the reflection coming from the bottom (at 1 m deep) of the sandbox (Author’s own work).
Remotesensing 14 05993 g008
Figure 9. Two CMPs obtained with a 900 MHz antenna positioned in the middle of the common-offset profiles shown in Figure 8. (a) for dry sand and (b) for wet sand with the water table 48 cm below the surface of the sand. White arrows indicate the reflection from the bottom of the sandbox; (c) Modeling with V = 0.14 m/ns (κ = 4.6) for the direct soil arrival and V = 0.116 m/ns (κ = 6.7) for the reflection; (d) Modeling with V = 0.1195 m/ns (κ = 6.3) for the direct soil arrival and V = 0.076 m/ns (κ = 15) for the reflection (Author’s own work).
Remotesensing 14 05993 g009
Figure 10. Three common-offset GPR profiles measured at the same location with a 500 MHz antenna at different periods. (a) October 2006; (b) October 2007; and (c) May 2008. The red arrow indicates the reflection coming from the concrete slab. The vertical white line indicates where the soil thickness is 0.5 m (Author’s own work).
Remotesensing 14 05993 g010
Figure 11. (a) Infiltration experiment with an 800 MHz antenna; (b) Sketch of the experiment site (Author’s own work) [56].
Remotesensing 14 05993 g011
Figure 12. Processed real GPR profile. The orange arrow shows the moment the water front reaches a depth of 0.5 m (1387 s). The white arrow shows the moment the water front reaches the water table (3694 s). The red arrow shows the time (4970 s) when there is no water left inside the wooden box (Author’s own work) [56].
Remotesensing 14 05993 g012
Figure 13. Six traces from the GPR profile. The numbers 1, 2, and 3 stand for the reflections coming from the water front, the boundary between two sandy layers, and the water table, respectively (Author’s own work) [56].
Remotesensing 14 05993 g013
Figure 14. A comparison of the fit between the forward modeling and real GPR traces at four different injection times (Author’s own work) [56].
Remotesensing 14 05993 g014
Figure 15. The estimated and measured water content at four different injection times (Author’s own work) [56].
Remotesensing 14 05993 g015
Table 1. Classification of techniques and corresponding references.
Configurations of Radar SystemMeasured ModesMethodsRelated References
Surface GPRSingle OffsetReflected WaveVellidis et al., 1990 [29]; Al and Müller, 2000 [30]; Birken and Versteeg, 2000 [31]; Grote et al., 2002 [32]; Gish et al., 2002 [33]; Schmalz and Lennartz, 2002 [34]; Stoffregen et al., 2002 [35]; Loeffler and Bano, 2004 [36]; Makkawi, 2004 [37]; Wollschläger and Roth, 2005 [38]; Lunt et al., 2005 [39]; Turesson, 2006 [40]; Saintenoy et al., 2008 [41]; Irving et al., 2009 [42]; Haarder et al., 2011 [43]; Klenk et al., 2015 [44]; Schmelzbach et al., 2012 [45]; Guo et al., 2014 [46]; Zhang et al., 2014 [47]; Yu et al., 2015 [48]; Shamir et al., 2016, 2018 [49,50]; Ercoli et al., 2018 [51]; Nyquist et al., 2018 [52]; Di Prima et al., 2020 [53]; Mangel et al., 2020 [54]; Zhang et al., 2021a, 2021b [55,56]
Ground Wavevan Overmeeren et al., 1997 [57]; Huisman et al., 2003b [58]; Galagedara et al., 2005b [59]; Grote et al., 2003 [60]; Klenk et al., 2011 [61]; Pan et al., 2012a [20]; Qin et al., 2013 [62]; Ardekani, 2013 [63]; Thitimakorn et al., 2016 [64]
AEAPettinelli et al., 2007, 2014 [65,66]; Ferrara et al., 2013 [67]; Algeo et al., 2016 [68]
Frequency ShiftBenedetto, 2010 [69]; Benedetto and Benedetto, 2011 [70]; Benedetto et al., 2013 [71]
Multi-OffsetReflected WaveGreaves et al., 1996 [25]; Weiler et al., 1998 [72]; Huisman et al., 2001 [73]; Garambois et al., 2002 [74]; Turesson, 2006 [40]; Strobbia and Cassiani, 2007 [75]; Bradford, 2008 [76]; Gerhards et al., 2008 [77]; Buchner et al., 2011, 2012 [78,79]; Steelman et al., 2012a, 2012b [80,81]; Mangel et al., 2012, 2015 [82,83]; Allroggen et al., 2015 [84]; Iwasaki et al., 2016 [85]; Kaufmann et al., 2020 [86]; Yu et al., 2020 [87]; Saito et al., 2021 [88]
Ground WaveHuisman et al., 2001, 2002, 2003a, 2003b [22,58,73,89]; Hubbard et al., 2002 [90]; Grote et al., 2003, 2010 [60,91]; Galagedara et al., 2003a, 2005a, 2005b [59,92,93]; Weihermüller et al., 2007 [94]; Steelman et al., 2010, 2012b [81,95]; Thitimakorn et al., 2016 [64]; Cao et al., 2020 [96]
Borehole GPRZero Offset Knoll and Clement, 1999 [97]; Alumbaugh et al., 2000 [98]; Parkin et al., 2000 [99]; Binley et al., 2001, 2002a, 2002b [100,101,102]; Galagedara et al., 2002, 2003b [103,104]; Rucker and Ferré, 2003, 2004, 2005 [105,106,107]; Ferré et al., 2003 [108]; Kowalsky et al., 2004 [109]; Looms et al., 2008a [110]; Kuroda et al., 2009 [111]; Wijewardana and Galagedara, 2010 [112]; Haarder et al., 2012 [113]; Klotzsche et al., 2019 [114]; Yu et al., 2020 [87]
Multi-Offset Hubbard et al., 1997 [115]; Eppstein and Dougherty, 1998 [116]; Parkin et al., 2000 [99]; Binley et al., 2001, 2002a [100,101]; Galagedara et al., 2002, 2003b [103,104]; Alumbaugh et al., 2002 [117]; Chang et al., 2004 [118]; Deiana et al., 2007 [119]; Looms et al., 2008a [110]; Wijewardana and Galagedara, 2010 [112]; Dafflon et al., 2011 [120]; Haarder et al., 2012 [113]
Vertical Radar Knoll and Clement, 1999 [97]; Cassiani et al., 2004 [121]; Dafflon et al., 2011 [120]; Strobach et al., 2014 [122]
Off-ground GPR Surface ReflectionsChanzy et al., 1996 [123]; Redman, 2002 [124,125]; Serbin and Or, 2004, 2005 [126,127]; Lambot et al., 2004a [128,129,130]; Weihermüller et al., 2007 [94]; Jadoon et al., 2010 [131]; Minet et al., 2010, 2012 [132,133]; Jonard et al., 2011, 2012, 2013 [134,135,136]; Tran et al., 2012 [137,138]; Ardekani, 2013 [63]; Moghadas et al., 2014 [139]; Mangel et al., 2015 [83]
Publisher’s Note: MDPI stays neutral with regard to jurisdictional claims in published maps and institutional affiliations.