Article

Evaluating Data Inter-Operability of Multiple UAV–LiDAR Systems for Measuring the 3D Structure of Savanna Woodland

1
Laboratory of Geo-Information Science and Remote Sensing, Wageningen University & Research, Droevendaalsesteeg 3, 6708 PB Wageningen, The Netherlands
2
CAVElab—Computational & Applied Vegetation Ecology, Faculty of Bioscience Engineering, Ghent University, 9000 Ghent, Belgium
3
Environmental Research Institute of the Supervising Scientist, Darwin, NT 0820, Australia
4
Department of Geographical Sciences, University of Maryland, College Park, MD 21201, USA
5
CSIRO Land and Water, PMB 44, Winnellie, Darwin, NT 0822, Australia
*
Author to whom correspondence should be addressed.
Remote Sens. 2022, 14(23), 5992; https://doi.org/10.3390/rs14235992
Submission received: 14 October 2022 / Revised: 12 November 2022 / Accepted: 20 November 2022 / Published: 26 November 2022
(This article belongs to the Special Issue Innovative Belgian Earth Observation Research for the Environment)

Abstract

:
For vegetation monitoring, it is crucial to understand which changes are caused by the measurement setup and which changes are true representations of vegetation dynamics. UAV–LiDAR offers great possibilities to measure vegetation structural parameters; however, UAV–LiDAR sensors are undergoing rapid developments, and the characteristics are expected to keep changing over the years, which will introduce data inter-operability issues. Therefore, it is important to determine whether datasets acquired by different UAV–LiDAR sensors can be interchanged and if changes through time can accurately be derived from UAV–LiDAR time series. With this study, we present insights into the magnitude of differences in derived forest metrics in savanna woodland when three different UAV–LiDAR systems are being used for data acquisition. Our findings show that all three systems can be used to derive plot characteristics such as canopy height, canopy cover, and gap fractions. However, there are clear differences between the metrics derived with different sensors, which are most apparent in the lower parts of the canopy. On an individual tree level, all UAV–LiDAR systems are able to accurately capture the tree height in a savanna woodland system, but significant differences occur when crown parameters are measured with different systems. Less precise systems result in underestimations of crown areas and crown volumes. When comparing UAV–LiDAR data of forest areas through time, it is important to be aware of these differences and ensure that data inter-operability issues do not influence the change analysis. In this paper, we want to stress that it is of utmost importance to realise this and take it into consideration when combining datasets obtained with different sensors.

1. Introduction

Light Detection and Ranging (LiDAR) has been adopted as an important technology for measuring vegetation structure on different scales, and has been operated from aeroplanes [1,2], spaceborne platforms [3,4], and ground-based platforms [5,6,7,8]. Recently, the miniaturisation of LiDAR instruments and the developments in unmanned aerial vehicle (UAV) technology have yielded affordable LiDAR data acquisition over areas of multiple hectares [7,9,10,11,12]. However, there are numerous UAV–LiDAR systems on the market, with variable specifications, which yield LiDAR point clouds of varying quality. To limit the weight and thus increase the flight time, trade-offs are made with regard to the range and precision of the scanners.
For vegetation monitoring, it is crucial to understand which changes may be caused by the different instruments used, and which changes are true representations of vegetation dynamics. Many UAV–LiDAR systems are commercially available nowadays, with large differences in investment costs. All systems promise the “highly accurate” 3D mapping of multiple hectare areas including vegetated areas, which is true compared with airborne LiDAR data, which was the main option for large-scale mapping in the past. However, UAV–LiDAR instruments differ in their capabilities to record multiple returns, their beamwidth, the strength of the emitted laser pulse resulting in differences in the range and accuracy of the scanner [12,13,14,15], and the accuracy of inertial navigation systems (INSs), resulting in differences in geometric accuracy.
Technical differences among sensors result in different point cloud properties, but they do not necessarily affect the derived forest structural parameters. Validating the quality of point cloud data in a non-controlled environment (such as forests) remains a large challenge, because there are many factors which influence the acquisition process. Wind may move the trees, and occlusion determines which areas are (under)sampled and limits the usability of ground reference targets for accuracy assessment. Previous studies have assessed the quality of UAV–LiDAR to spatially characterise forest structure against photogrammetry [15,16], airborne LiDAR (ALS) [16,17] or terrestrial LiDAR (TLS) [12,18], mobile LiDAR (MLS) [19], and field measurements [18,20]. However, the differences in derived forest parameters, resulting from differences in UAV–LiDAR sensor properties, have not been investigated yet. This is crucial to the judgement of whether or not forest structural changes in time-series of UAV–LiDAR data are true changes, or are caused by differences in sensor characteristics. UAV–LiDAR sensors are undergoing rapid developments and their characteristics are expected to keep changing over the years, which will introduce inter-operability issues.
The objective of this study was to investigate the influence of different UAV–LiDAR instruments on point cloud quality and derived forest parameters. By operating three different UAV–LiDAR sensors over the same site within a small time frame (6 days), we can safely assume that the differences in derived forest structure parameters are caused by the systems and not by actual forest structure changes. We aimed to determine which inaccuracies may be expected if the regular monitoring of sites is performed with multiple devices and how changes between acquisitions with different instruments should be interpreted. Can we use time-series data composed of different UAV–LiDAR systems to assess forest structure changes? Additionally, to what extent should we account for data-interoperability issues?
Our study was performed in a savanna woodland ecosystem, which is a highly dynamic biome characterised by an open tree canopy and an understorey mostly comprising grass. The frequent monitoring of vegetation structures is of great value for understanding carbon dynamics, and for assessing how land management decisions about fire frequency and intensity may impact structural diversity [19,21]. Savanna woodlands are a very open forest type, which makes them ideal for the UAV-based mapping of structural changes. Furthermore, they are a relatively open biome with good GNSS signal coverage, which makes them easy to scan and enables comparisons of the performance on an individual tree level.
In this study, we wanted to gain insights into the magnitude of the difference in derived forest metrics when three different UAV–LS systems are used for data acquisition. We investigated spatial plot metrics such as canopy height, canopy cover, and gap fraction, and compared these with ALS data, which have been used for many years for mapping large areas of forest structure. At individual tree level, we focussed on geometrical measures such as tree height, crown area, and tree volume, which we compared with TLS-derived tree metrics. Analyses of TLS data have generally been accepted as a technique to determine the geometrical properties of individual trees [5], and is becoming the standard for accurate plot size measurements. The comparisons between the different UAV–LiDAR sensors and a comparison with ALS and TLS will help determine whether UAV–LiDAR systems are interchangeable over a monitoring period or that the system should be kept the same. We realise that there are many more arguments to decide on one system over the other, such as costs, ease of implementation, durability, etc. However, we will not look into these, but focus instead on the variability in derived metrics between the systems.

2. Materials and Methods

2.1. Study Area

The study site (13°10.740′S 130°47.670′E) was the Litchfield Savanna TERN SuperSite, located in Litchfield National Park, NT (Australia) [22] (Figure 1). The site is a tropical savanna woodland with an average temperature of 32 °C and a maximum tree height of around 25 m. The site is frequently burned by wildfires and has a monsoonal tropical climate, with a wet season from December to March. An eddy–covariance flux tower was established in December 2012, after the ALS data acquisition. Therefore, the flux tower was not present in the ALS data.

2.2. UAV–LiDAR Sensors

UAV–LiDAR point clouds were acquired with three different systems: Riegl VUX-SYS, Nextcore RN50 and Nextcore Gen-1. The Riegl VUX-SYS (http://www.riegl.com/products/unmanned-scanning/ricopter-with-vux-sys/ (accessed on 13 June 2022)) consists of a Riegl VUX1-UAV laser scanner combined with an Applanix APX-20 inertial navigation system (INS) which, including the control box and wiring, weighs approximately 7 kg. It was mounted under a Riegl Ricopter, which led to a combined take-off weight of 24.9 kg. This system is further referred to as VUX-SYS.
The Nextcore® RN50 system (https://www.nextcore.co/ accessed on 13 June 2022) was designed around the Quanergy M8 discrete return LiDAR sensor with an Advanced Navigation Spatial Dual INS, integrated with a DJI Matrice 600 pro UAV. This system is further referred to as QM8.
The Nextcore® Gen-1 system consists of a Velodyne VLP16 scanner, with an Advanced Navigation Spatial Dual INS attached, which was also integrated with the DJI Matrice 600 pro. This system is further referred to as VLP16. Further specifications of the UAV–LiDAR systems are given in Table 1.

2.3. Data Acquisition and Pre-Processing

UAV–LiDAR data were acquired on the 6th (QM8 and VLP16) and 12th (VUX-SYS) of September 2018. With all systems, two flights were conducted. For the VLP16 and QM8, each flight consisted of 20 parallel flight lines, programmed using the DJI GS Pro application. The drone was flown at speeds of 4–5 ms−1 at approximately 40 m above ground level with a line spacing of between 16 and 23 m. The first flight followed a north–south direction, whereas the second flight was performed perpendicular to this, thus resulting in a checkerboard pattern flight plan. VUX-SYS data were collected at an altitude of 55 m above ground level. For the VUX-SYS flight planning, the UGCS-ground station software was used. Again, two flights were performed; however, during Flight 1, the autopilot failed, and the flight was continued manually. This resulted in a pattern of crossing flight lines at an approximate speed of 3 m/s for Flight 1. With Flight 2, a larger area was covered, first following the outlines of a 500 × 500 m area, and next crossing the study area 11 times with a flight speed of 5 m/s. During all flights, there was light to moderate wind (about 2 m/s). The flight specifications are summarised in Table 1.
Local GNSS base station data were collected with an L1/L2 RTK receiver with a datalogger which was placed in an opening close to the take-off location. This system determines its own location by averaging the GNSS locations received; however, no correction relative to a fixed base station was possible due to the remoteness of the study area. The collected base station data were needed for co-registration of the point clouds with post-processed kinematic (PPK) GNSS data. With PPK processing, accurate positioning is not performed in real time; trajectory correction algorithms are applied afterwards. The raw GNSS logs of the base station and the scanning systems were combined during the data processing to determine the accurate positioning track. It is implied that the relative positioning during the flight was very accurate (estimated to be a few centimetres), but the absolute positioning accuracy depended on how accurately the base station estimated its own position (estimated to be 2–5 m).
The co-registration of the scans and different flight lines is one of the most crucial steps for the generation of a point cloud. Due to the limited payload capacity of UAV systems, UAV-based LiDAR systems always face a compromise between quality and weight. This affects the quality of the scanner itself, as well as that of other components of the system such as the INS. Visual inspections showed that the initial alignment was better for the VUX-SYS than for the other systems. After the initial co-registration, there was still a slight offset between the individual flight lines for both the VLP16 and QM8. This could largely be resolved by introducing a second processing step, aligning flight lines using iterative closest point algorithm (ICP) point cloud matching in CloudCompare [23] (Stop criterion: RMSE difference = 1.0 × 10⁻⁵; Overlap = 80%; Random Sampling Limit = 50,000; Rotation = XYZ).
Airborne LiDAR data acquired in 2012 were included in this study for a comparison of the spatial coverage and patterns, and to investigate whether UAV–LiDAR data can be used in combination with or as a follow up of ALS recordings. ALS data are widely available and could serve as a baseline for time-series. For a tree-level comparison, terrestrial laser scanning data of an area of 100 × 100 m around the flux tower were used for benchmarking. These data were collected in the month before the flights (August 2018, so some leaf drop was expected) with RIEGL VZ-400 apparatus, following the procedures as described by Wilkes et al. [24]. Scan locations were laid out in a regular grid of 25 × 25 m, which were registered using retro-reflective targets. At each position, scans were performed in upright and horizontal tilting using the VZ-400 tilt-mount.
For all UAV–LiDAR systems, standard processing pipelines, provided by the system manufacturers (Riegl® and Nextcore®), were used to geo-register the point clouds. Due to the small offset in base station position between the different UAV flights, all UAV–LiDAR datasets were aligned to the ALS data using the ICP algorithm, which minimised the difference between two point clouds and performs a rigid body transformation, thus leaving the internal geometry of the UAV–LiDAR point clouds intact. The ALS and UAV–LiDAR point clouds were then clipped to an area of 200 × 200 m around the flux tower for further analysis. For the individual tree comparison, the UAV–LiDAR data were clipped to the spatial extent of the TLS data, which covered a 100 × 100 m area around the flux tower.

2.4. Analysis

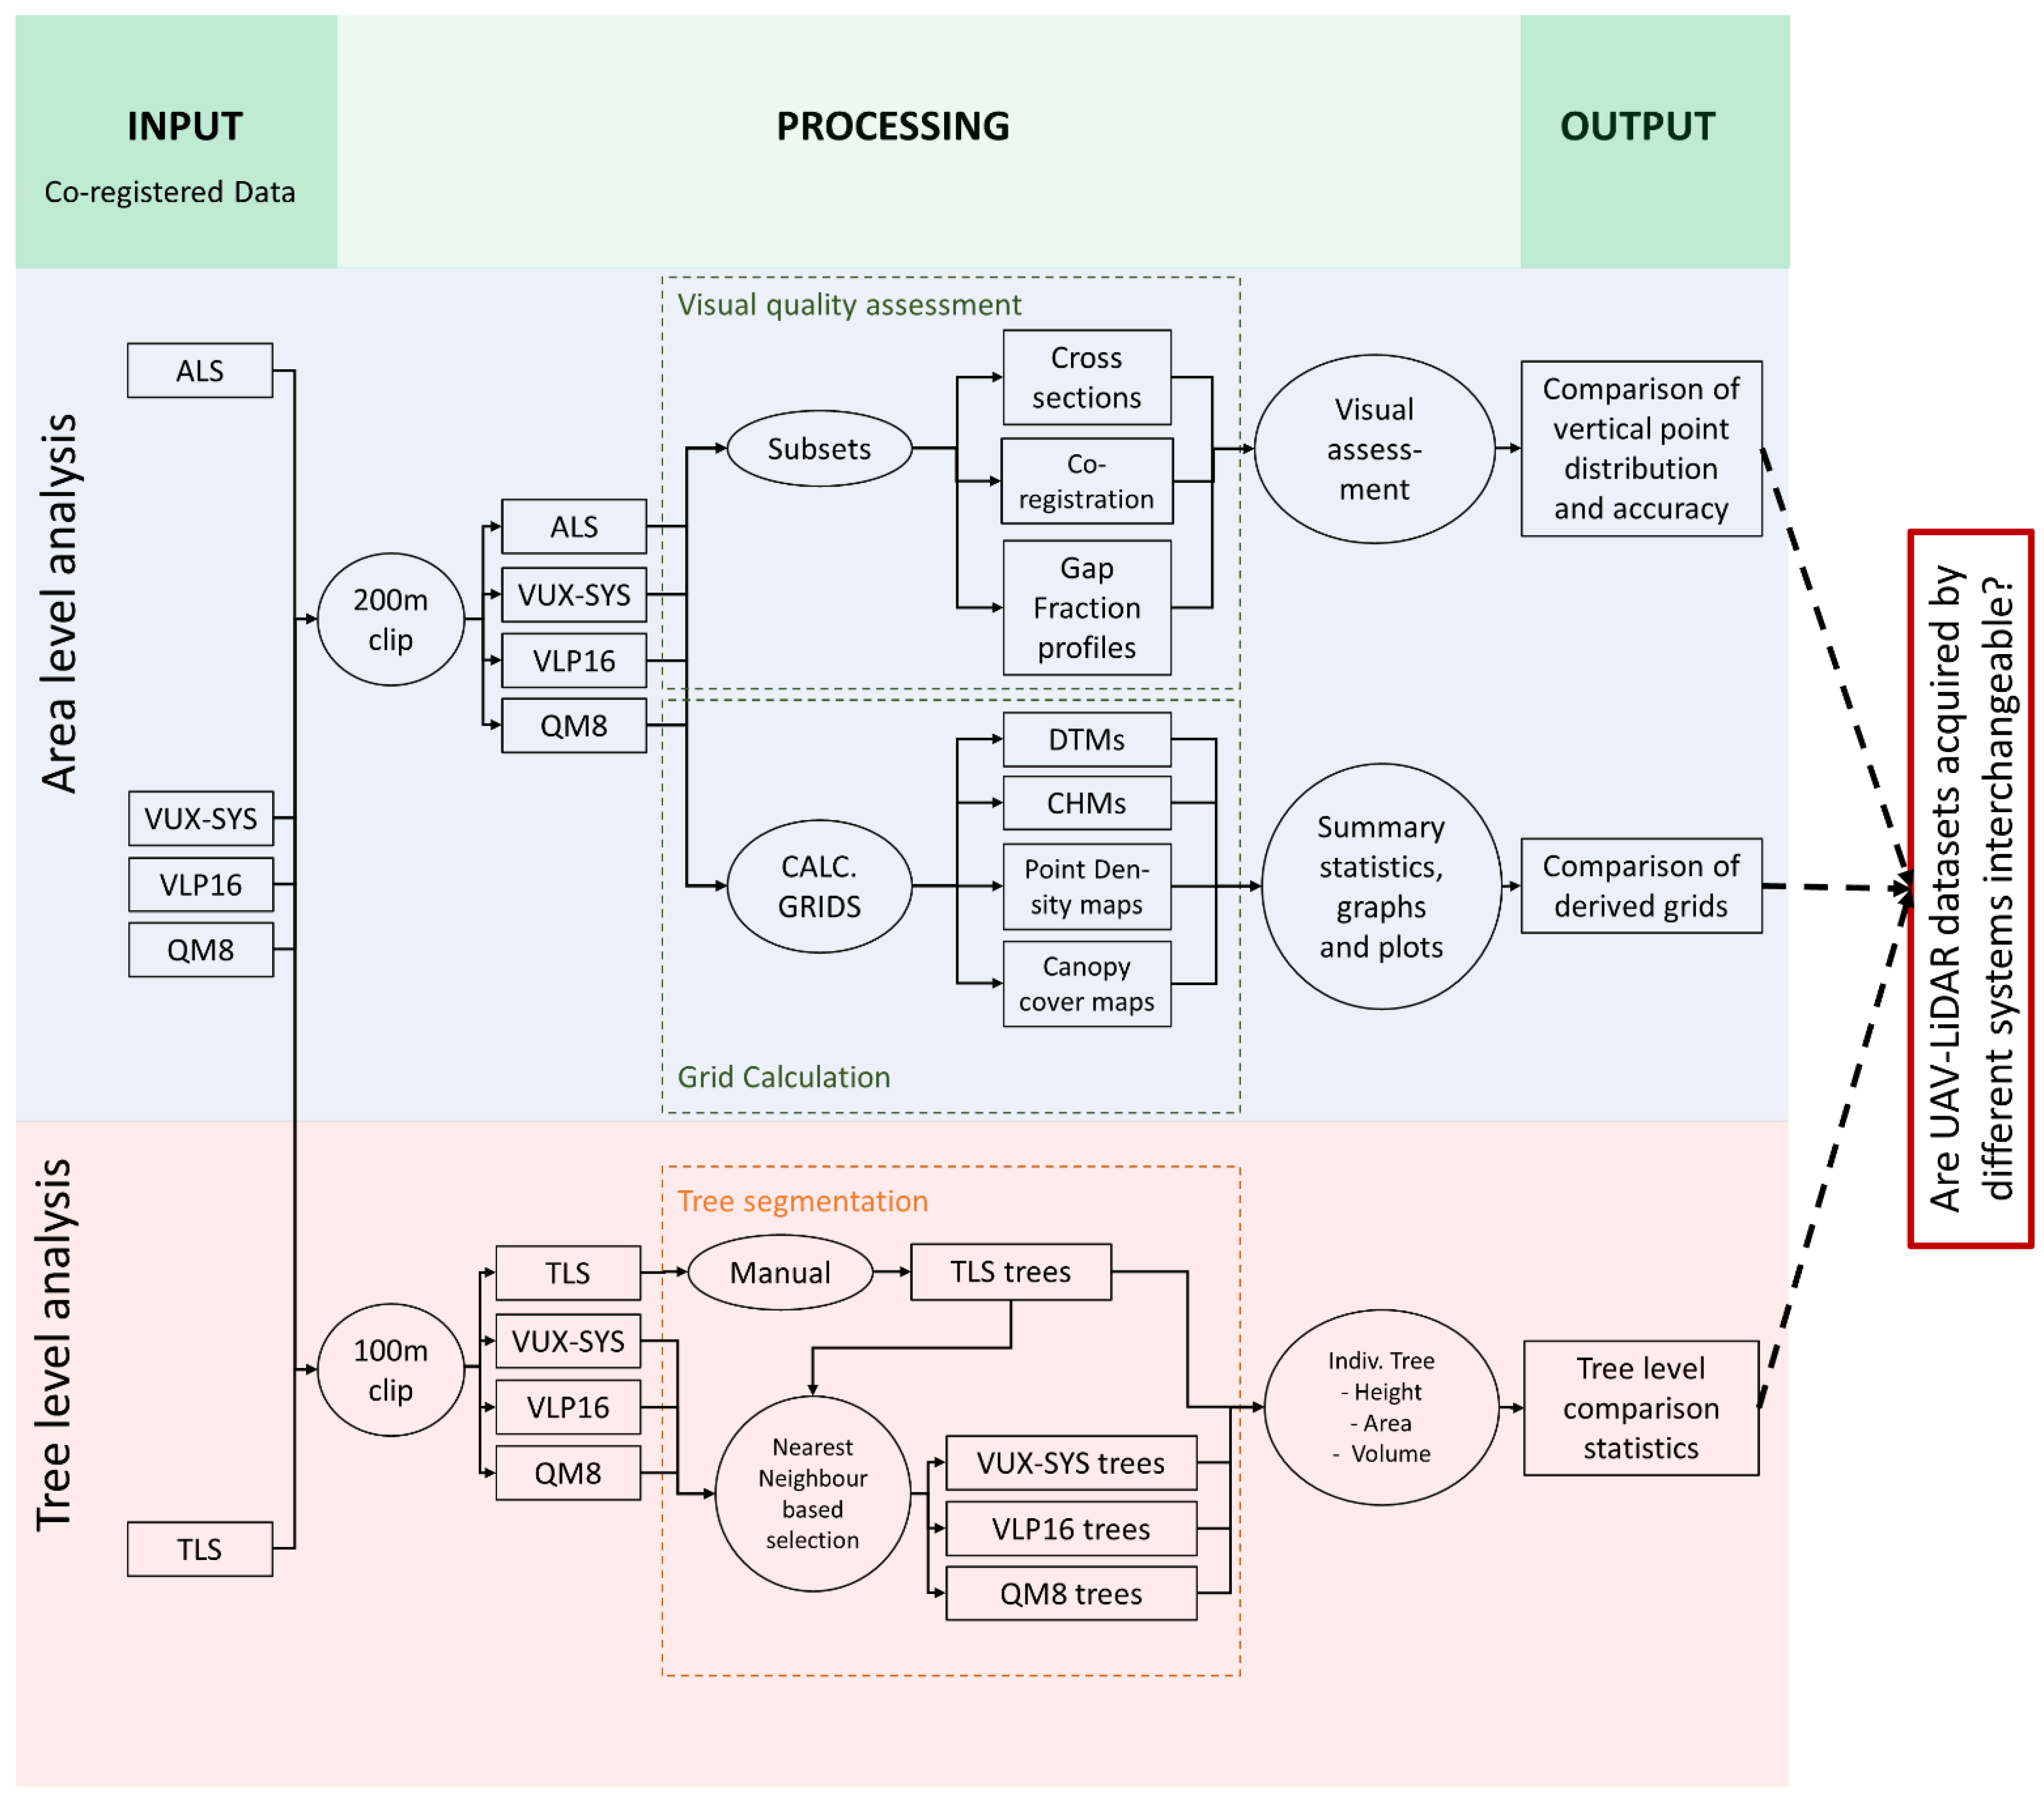
To assess the differences in forest and individual tree parameters between the different systems, a few comparisons were performed, which are outlined in Figure 2. A summary of the used methods is given in Table 2. First, visual and numeric comparisons of the point cloud quality, point density and distribution were performed by creating point density plots, cross sections, and point density profile plots. Next, terrain and canopy metrics were calculated and compared. We hypothesised that all UAV–LiDAR systems yield comparable terrain and canopy metrics, but we expected to see differences along the vertical profile. Finally, individual tree metrics were derived and a comparison between the different UAV–LiDAR sensors and TLS was conducted. We expected the higher-end VUX-SYS to deliver individual tree metrics that were closer to the TLS-derived individual tree metrics than the mid-range VLP16 and QM8 systems. The methodology is further described in the following sections.
For the ALS and UAV–LiDAR point clouds, a number of XY rasters with a 1 m resolution were calculated with the R-package lidR [25]. Although a higher resolution would be achievable with the UAV–LiDAR point clouds, we chose a 1 m resolution to also enable a fair comparison with the ALS data. First, ground points were classified, and the digital terrain model (DTM) and canopy height model (CHM) were calculated. Canopy cover was calculated using “lascanopy” using the Lastools software package [26]. Further processing and analysis was performed in R [27]. The Rpackage lidR was used to calculate canopy gap fraction profiles for three randomly selected locations, with a radius of 20 m. This gap fraction profile function assesses the number of laser points that actually reached the layer z + dz, and those that passed through the layer [z, z + dz], following the method of Bouvier et al. [28]. By definition, the layer 0 will always return 0 because no returns pass through the ground. Canopy profile plots for the three locations and four airborne sensors were created and compared. To quantify the differences between the DTMs, the three UAV–LiDAR-derived DTMs were subtracted from the ALS DTM, which showed potential offsets and spatial differences between the DTMs. DTM differences were plotted, and summary statistics were calculated. For the DEM, CHM, and point density, raster plots of the calculated metrics were created for visual comparison. For the canopy cover raster, plots and boxplots were created for visual comparison, and summary statistics for the 200 × 200 m area were calculated for a numeric comparison.
For a comparison of the individual tree metrics, TLS data were used as a benchmark dataset, with which the UAV–LiDAR data were compared. TLS point clouds and point clouds from the three UAV–LiDAR systems were first co-registered by picking three pairs of common points between the TLS and the corresponding UAV–LiDAR point cloud using the point pairs picking function in CloudCompare [23]. Individual trees were first segmented from the TLS point cloud manually. Next, corresponding individual trees from the UAV–LiDAR point clouds were matched based on a nearest neighbour approach, taking the locations of the trees in the TLS point cloud as base positions. Points from the UAV–LiDAR point clouds which were within a distance of 0.5 m of the TLS tree points were given the same label as the TLS tree. This resulted in a total of 550 matched trees detected in all datasets. Tree height, tree projection area, and tree crown volume were calculated for TLS and UAV–LiDAR individual tree point clouds using the ITSMe R-package (https://github.com/lmterryn/ITSMe (accessed on 25 November 2022)) [29]. Briefly, tree height was defined as difference between the largest and lowest Z-value of an individual tree point cloud. The tree projection area was defined as the area of the concave hull (concavity = 2) computed from the points of the tree point cloud, and tree volume was calculated as the volume of the 3D alpha-shape (alpha = 2) computed from the points of the individual tree point cloud.
The differences between individual tree height, crown area, and tree volume were calculated with the TLS-derived values were used as reference. Scatterplots were created between TLS- and UAV–LiDAR-derived individual tree parameters and summary boxplots and statistics (mean absolute error (MAE) and root-mean-squared error (RMSE)) were calculated. Finally, to determine whether there was a relationship between the size of the tree and the measurement error, the differences between TLS-derived individual tree metrics and UAV–LiDAR metrics (TLSvalues–UAVvalues) were calculated and plotted against the TLS-derived metrics. These comparisons will answer our question if UAV–LiDAR datasets acquired by different systems are interchangeable or not.
Table 2. Overview of calculated metrics and methods used to calculate them.
Variable/MetricMethodFunctionPackage/Software
DTMKNNIDW on ground points (k = 6, p = 2)rasterize_terrainR: lidR
CHMLocal maximum calculationgrid_canopy R: lidR
Point densityPoint counts per grid cellgrid_densityR: lidR
Frequency profilesPoint counts in 0.5 m Z-bins above the terrain R
Canopy coverNumber of first returns above the height cutoff divided by the number of all first returns, output as a percentage.LascanopyLastools
Gap fraction profiles           G a p   F r a c t i o n = N [ 0 ; z ] N t o t a l N [ 0 ; z + d z ]
In which:
N[0;z] being the number of returns below z, Ntotal is the total number of returns, N[0;z+dz] is the number of returns below z + dz
gap_fraction_profileR: lidR [28]
Tree heightTree height = ZmaxZmintree_height_pcR: ITSME [29]
Tree projection AreaConcave Hull fitting (concavity = 2) R: ITSMe [29]
Tree volume3D alpha shape fitting (alpha = 2)alpha_volume_pcR: ITSMe [29]

3. Results

3.1. Point Clouds

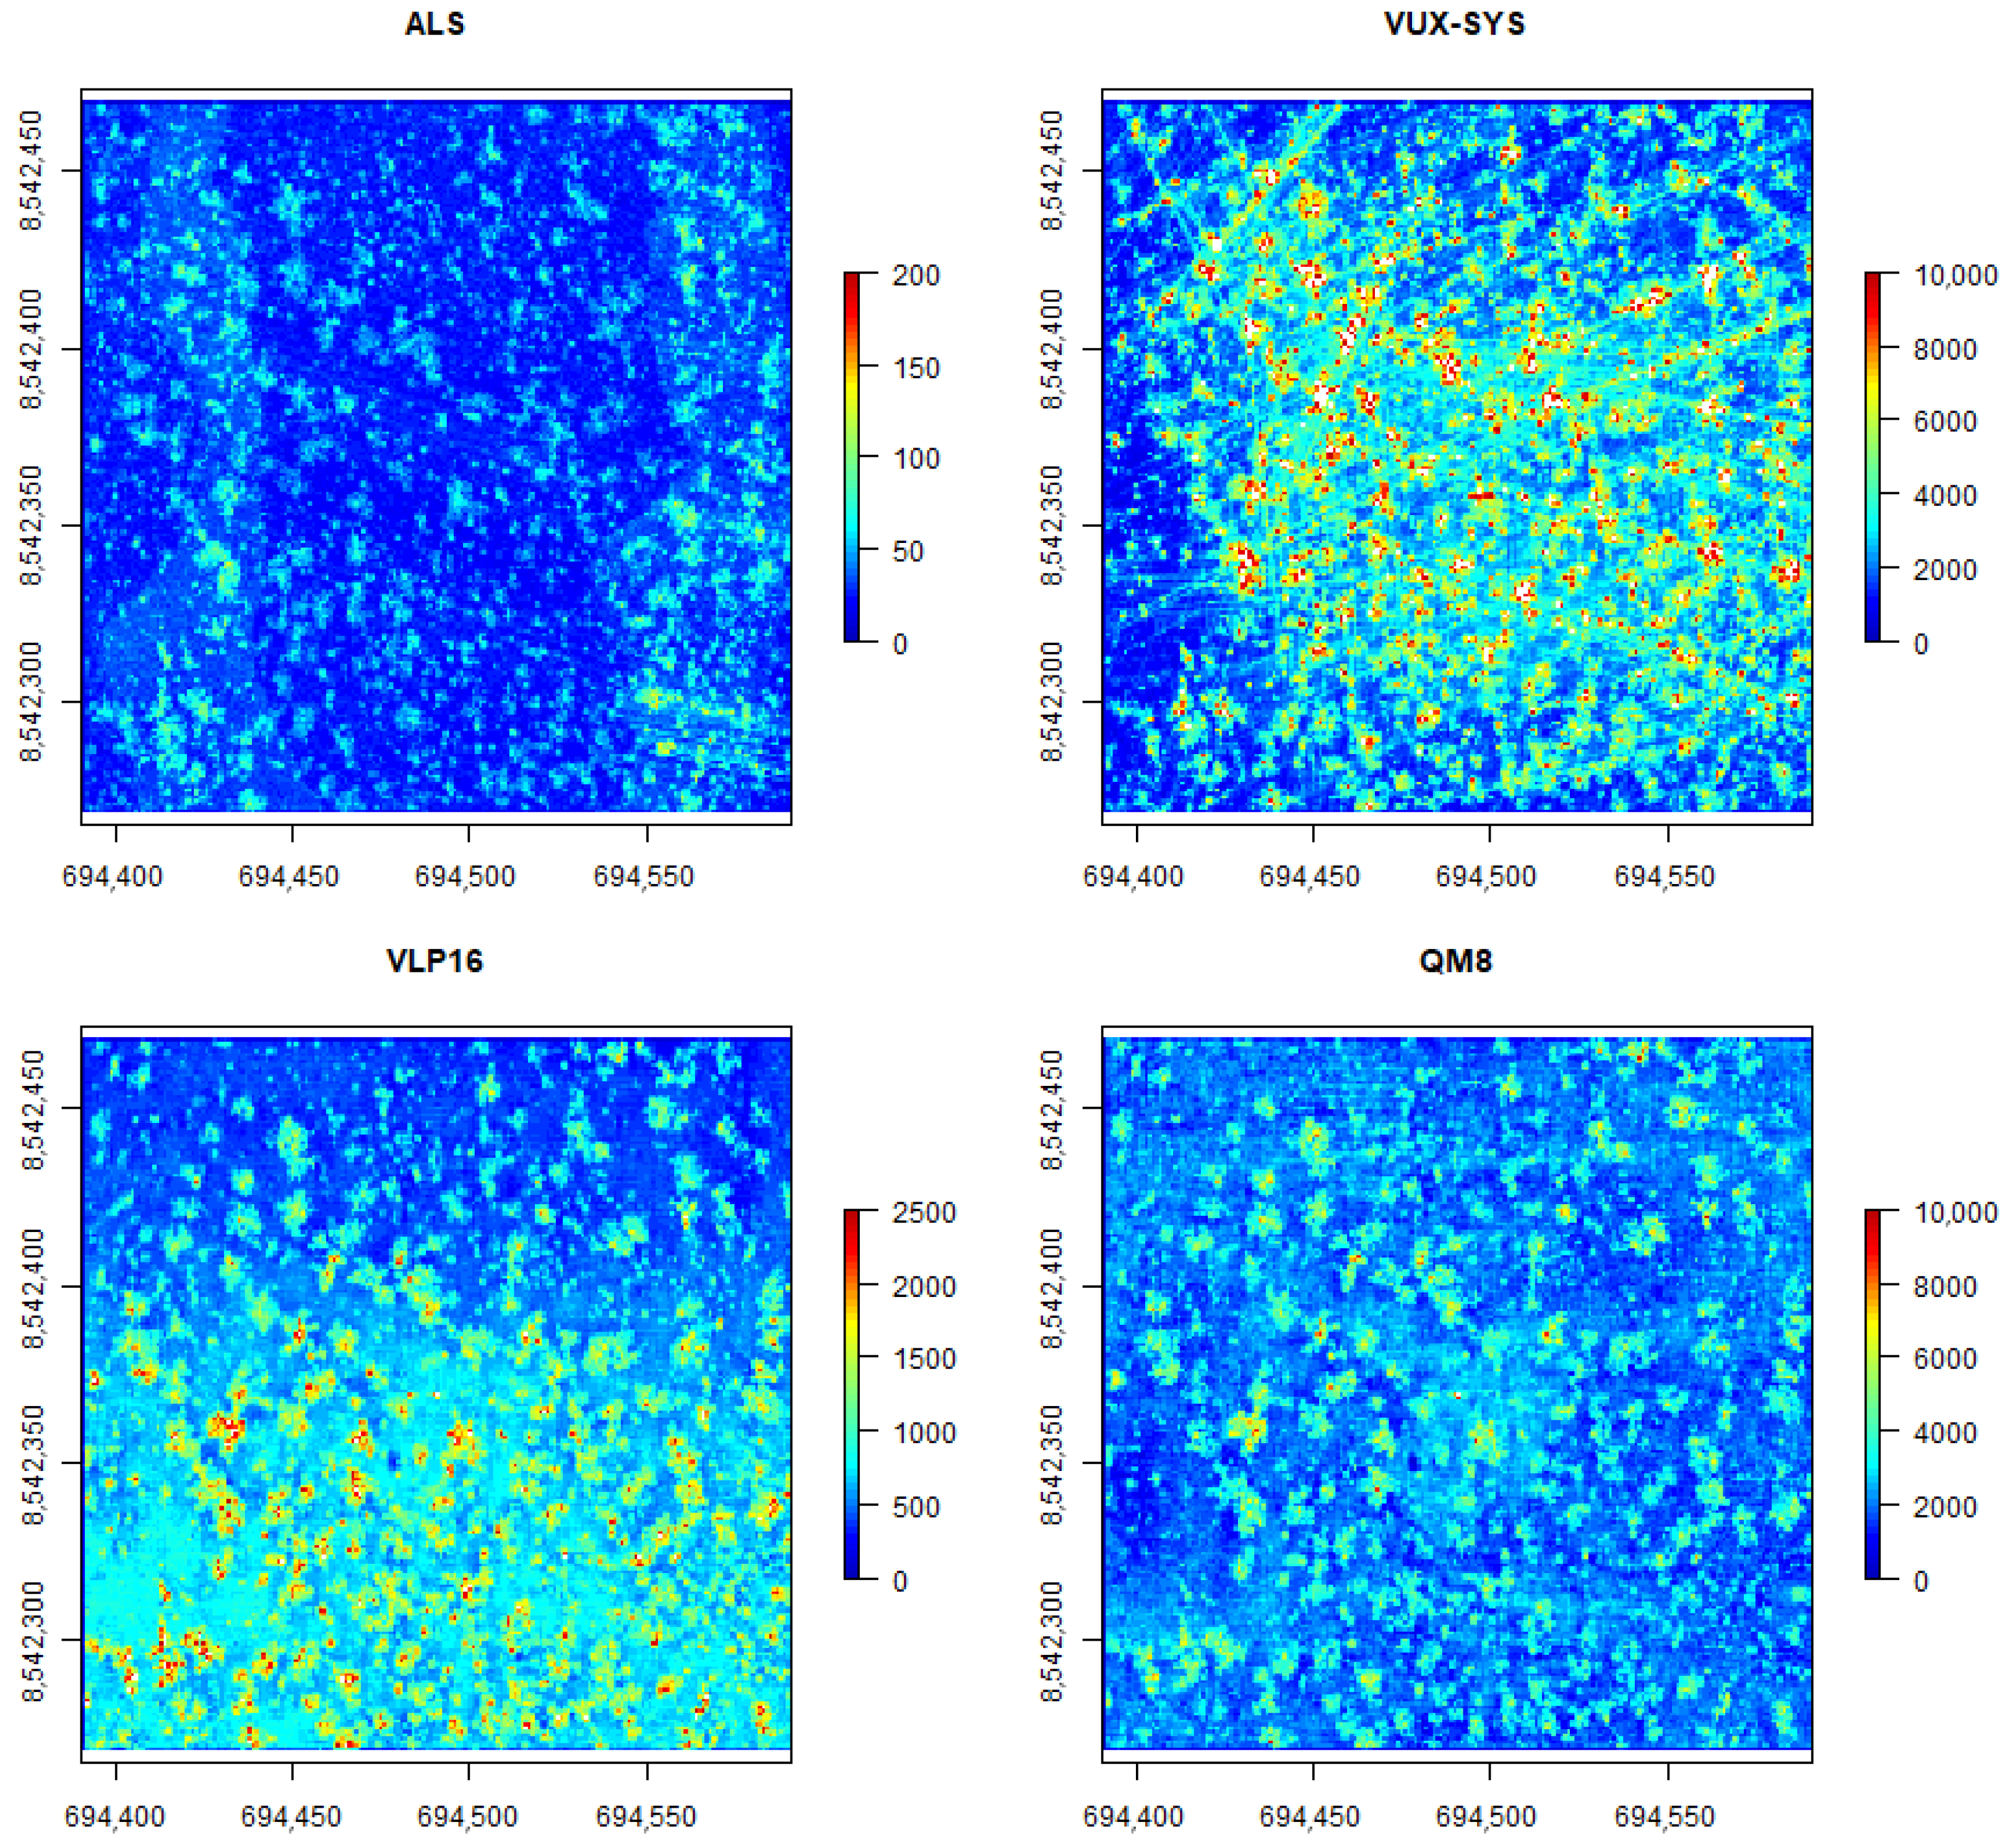
The three UAV–LiDAR systems, as expected delivered much higher point densities than ALS (15–100 times higher). The different UAV–LiDAR sensors delivered point clouds with large variations in point densities and differences in spatial distributions of the points (Figure 3—note the different colour schemes used). Higher point densities were related to the presence of vegetation, which resulted in more points per square metre due to the vertical structure. This can be determined by the peaks in point density near individual trees. Point density was highest for the VUX-SYS, but the failure of the autopilot during the first flight resulted in a manual flight, which led to an uneven point distribution. With a properly functioning autopilot, the point density distribution should be more evenly spread [12]. The point density for the QM8 was slightly lower than for the VUX-SYS, but the spatial variation in point density reflected the presence of vegetation, which resulted in more points per surface area. For the VLP16, the point density was lowest on average.
A visual comparison of the cross-sections in Figure 4 revealed that all systems described the upper canopy and terrain well, but the VUX-SYS captured the understorey (0–5 m above ground) and smaller trees much better. This can be attributed to the larger number of returns captured which helped penetrate the canopy and contribute to measurements of the understorey. Furthermore, the range of the VUX-SYS was much larger than for the other systems. As a result, many additional points were recorded from flight lines which were further away, under more oblique viewing angles, which contributed to the better recording of the understory. The range was especially limited for the VLP16, which prohibited the detection of below-canopy points under oblique angles.
The co-registration of the different flight lines was much better for the VUX-SYS than for the VLP16- and QM8-based systems. This can be seen in Figure 5, where the point cloud of the top of the flux tower is shown, using the GPS time as an attribute to colour the points. For all systems, the point cloud of the tower comprised multiple passes (shown by the different colours), but for the QM8 and VLP16, it showed that the different scanlines did not match perfectly, with offsets of around 30 cm. This is mainly a result of the lower-quality INS used in these systems, compared with the INS of the VUX-SYS. ICP could not resolve the original offsets completely, as shown in Figure 5. The ICP algorithm aims to minimise the difference between point clouds, taking all points in consideration. The large fraction of ground points will have a higher weight in the ICP process than the lower fraction of points higher in or above the canopy, which may lead to suboptimal co-registration in those parts of the point cloud. ICP after removing the ground points would work for the trees, but may result in worse co-registration at ground level. Aligning the flight lines of the QM8 and VLP16 systems using a Bayesian method as described by Jalobeanu et al. [30] would reduce errors associated with misalignment.
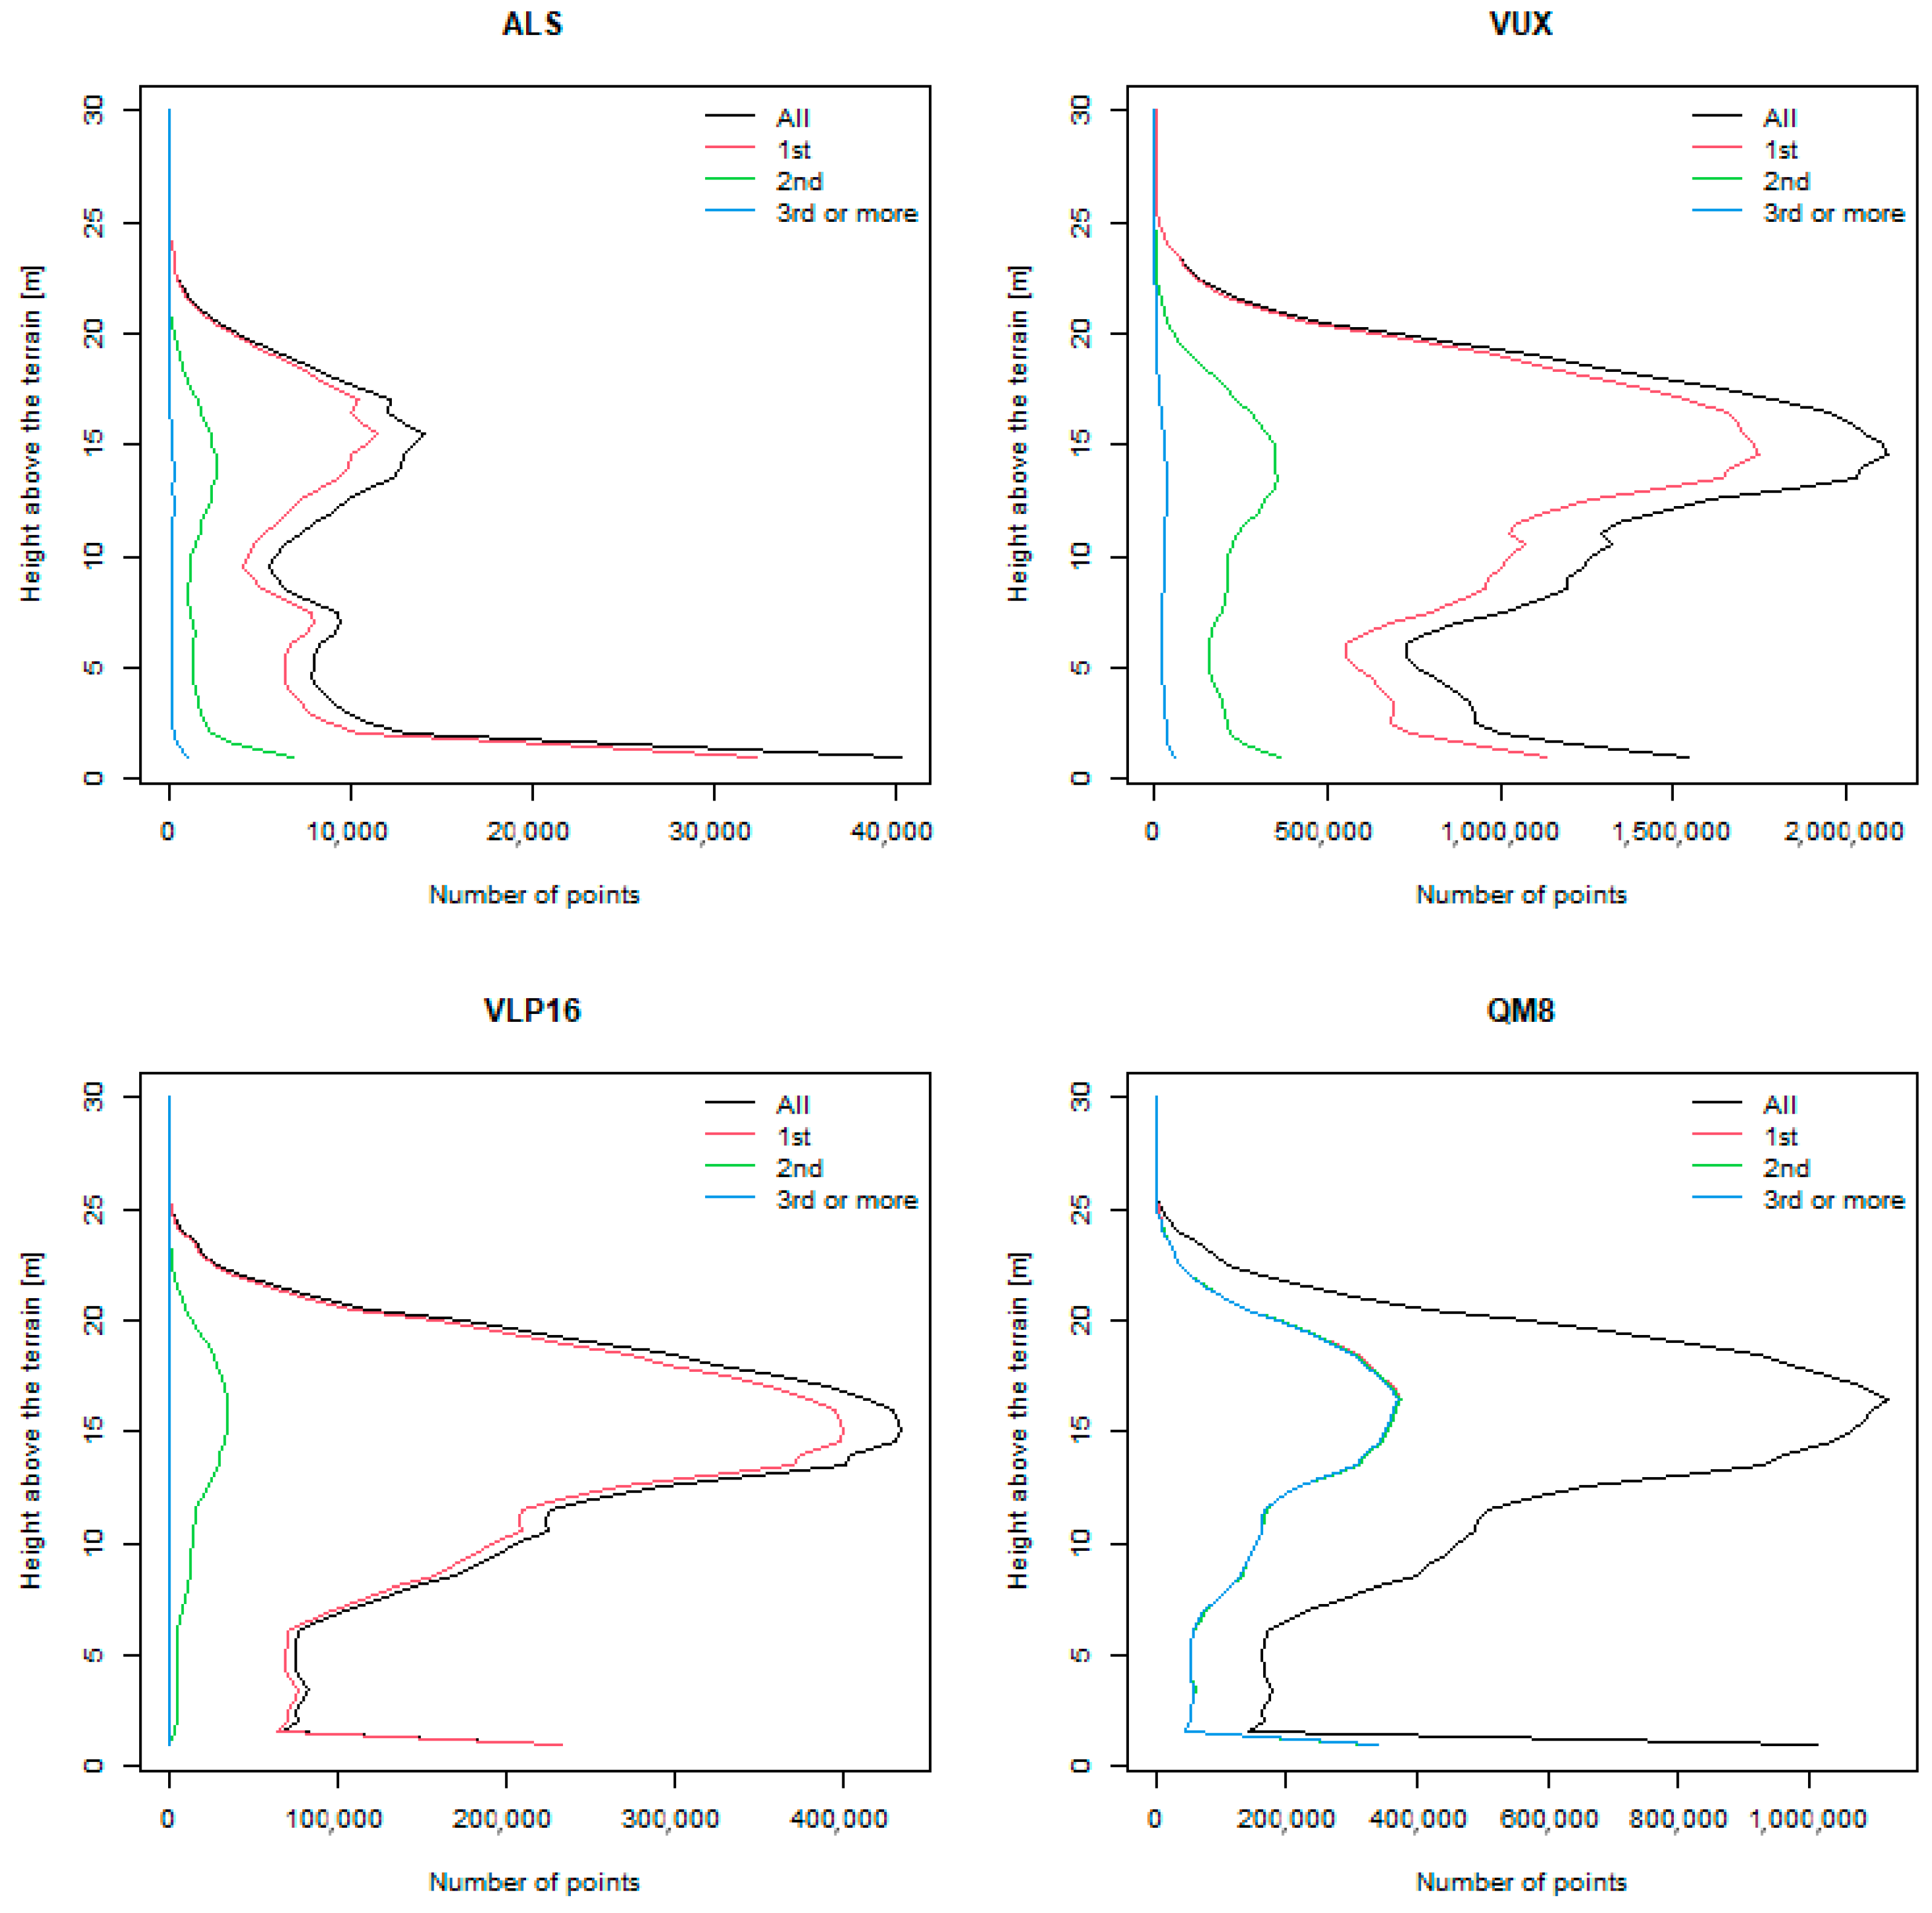
Figure 6 displays the point distribution height profiles, subdivided for the return number. Thus, it can be observed that the VUX-SYS data contained a much larger fraction of points within the 0–10 m above surface range. Additionally, the contribution of mainly second returns is much larger than for the other sensors. ALS data contained a relatively larger fraction of ground points than the other systems, but the understorey was sampled relatively better than with the VLP16 and QM8. For the VLP16, most of the recorded points were first returns, and the recorded second returns were also located around 15 m above the terrain, also in the canopy layer. The data obtained by the QM8 appeared to show an error in the return number attribute, because the fractions of first, second, and third or more returns were practically the same. However, the profile of all returns combined showed a comparable height distribution for the VLP16 and QM8 point clouds. A full explanation of the lack of lower canopy points cannot be deduced from these data; however, it is likely to be a combination of the lower laser power and limited range of the scanners. Another aspect that influences the return distribution are the discretization settings of scanner manufacturers, for which it is difficult to determine any insights for as an end-user. The VLP16 sensor has a much larger beam-divergence than the VUX-SYS, which likely led to stronger attenuation of the beam when it passed the upper canopy, leading to a lower signal returned from the lower parts of the canopy. This lower signal may not pass the discretization thresholds set by the manufacturer, resulting in fewer returns in the lower parts of the canopy.

3.2. Digital Terrain Models

Slight differences in the DTMs were observed (Figure 7). All DTMs accurately showed the general topography of the study area, which was gently sloping toward the northeast. Additional car tracks can be observed in the UAV–LiDAR datasets, which were formed after the ALS data were collected. The QM8 and VLP16 DTMs were overall slightly lower in elevation than the ALS and VUX-SYS. Those differences are within the vertical uncertainty in PPK processing. The difference maps (Figure 8) of the UAV–LiDAR-derived digital terrain models and the ALS DTM show that the UAV–LiDAR-derived DTMs exhibited structurally lower elevations than the ALS DTM (differences were calculated as ALSDTM-UAVDTM), with median offsets of 0.31 m, 0.33 m, and 0.35 m for the VUX-SYS, VLP16, and QM8, respectively. These structural offsets were likely a result of the ICP alignment, where the ALS data were used as a reference to align the UAV–LiDAR data. Performing the ICP alignment on the ground points only may remove this offset. The DTM difference maps did not show clear spatial patterns, except for the entrance road which was established for construction of the flux tower after the acquisition of the ALS data.

3.3. Canopy Metrics

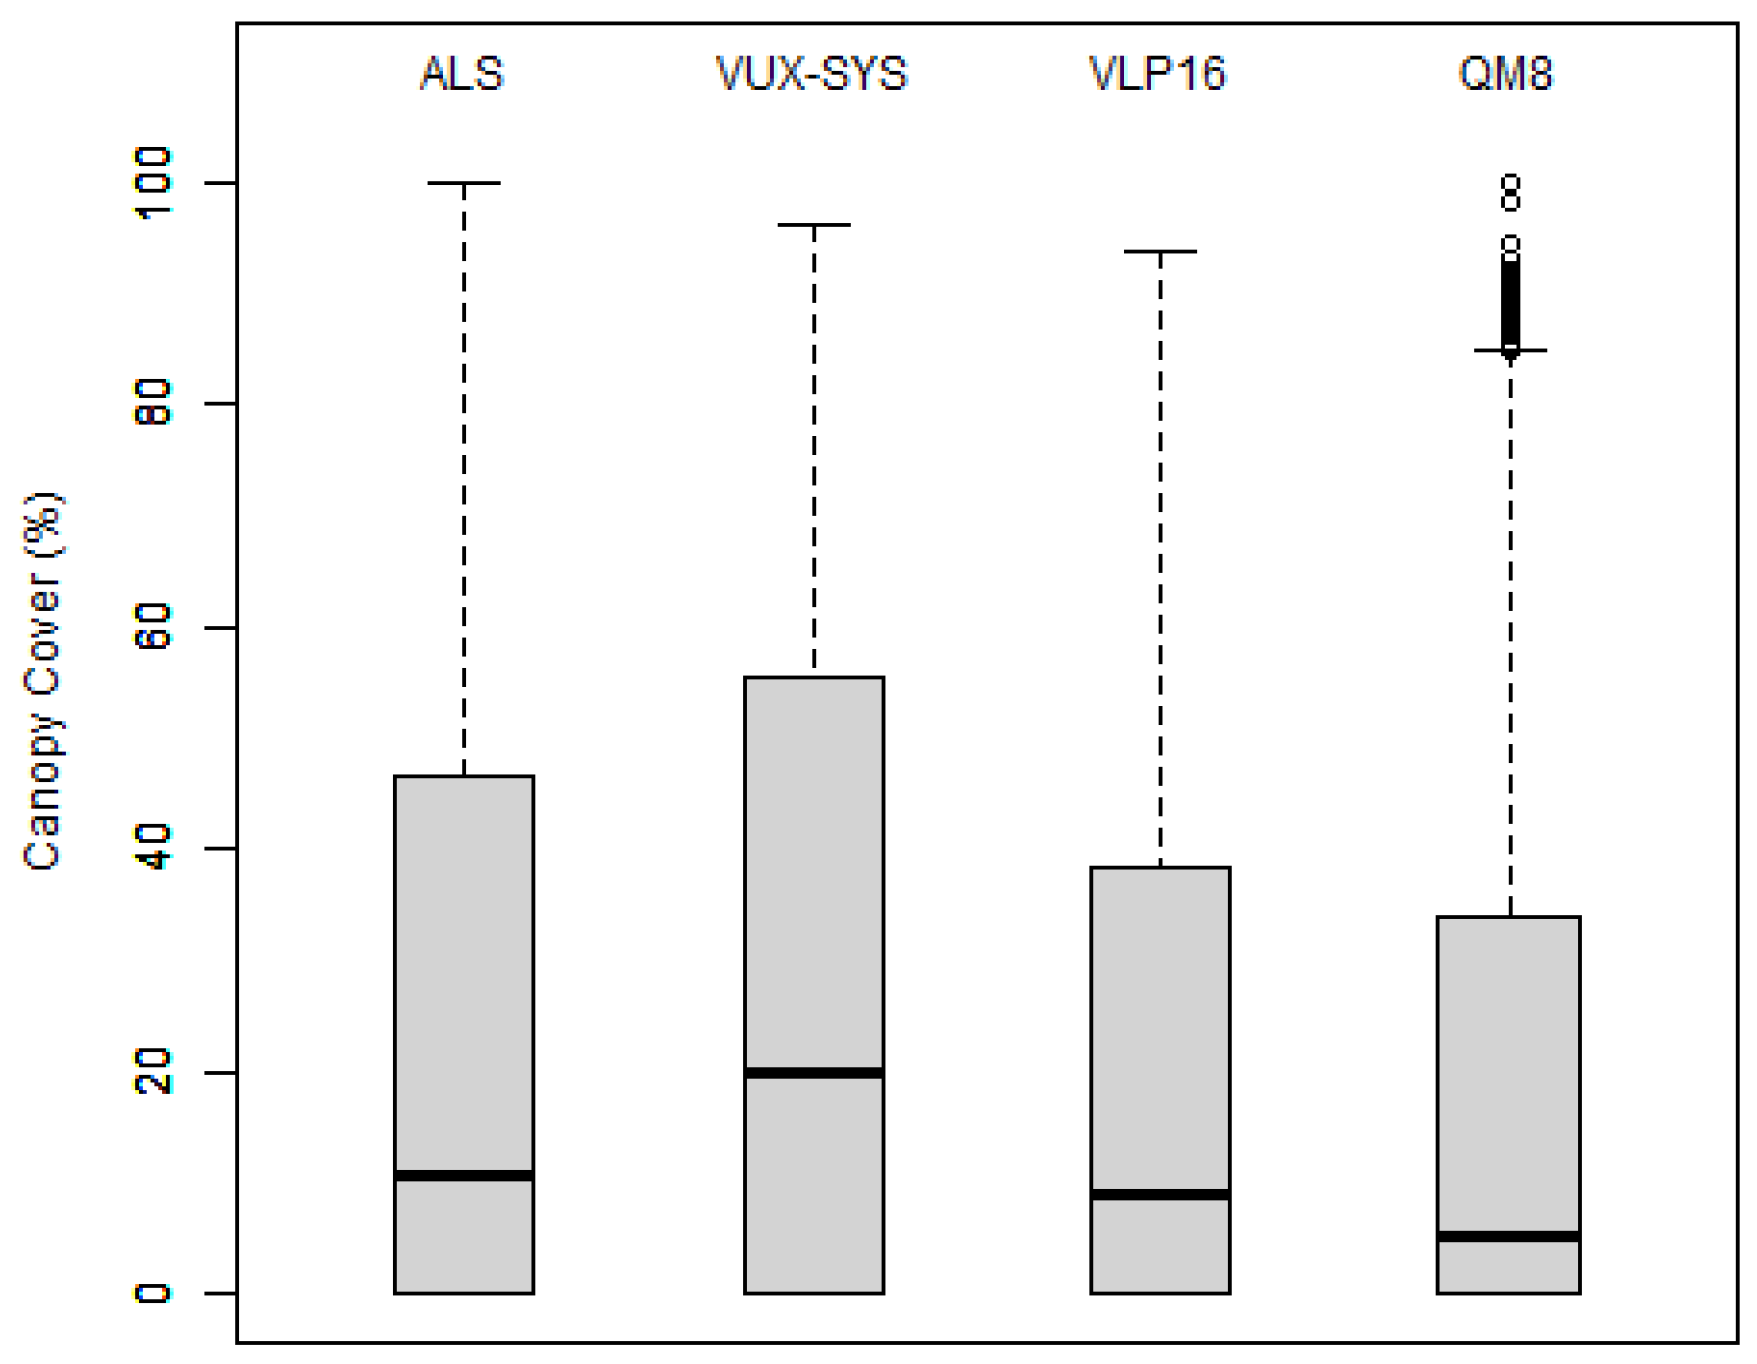
The CHMs of the three UAV–LiDAR sensors showed larger crowns than the CHM derived from the ALS data (Figure 7 Right), which may partially be explained by the 6-year difference between acquisitions. Between the UAV–LiDAR datasets, there were no clear observable differences, indicating that all UAV systems delivered a visually comparable CHM. However, the calculated canopy cover showed clear differences and was, on average, much higher for the VUX-SYS than for the other systems. This led to spatial differences in canopy cover (Figure 9), but was also expressed in differences in average canopy cover for the study area. The boxplots in Figure 10 show that the median canopy cover derived from the VUX-SYS data (median = 19.9%) was twice as high as for the VLP16 (8.8%), and about four times higher than for the QM8 (5.2%). Canopy cover derived from the VLP16 and QM8 point clouds were lower than for the ALS data, whereas the VUX-SYS exhibited higher numbers, which showed that the UAV–LiDAR system characteristics had a much larger influence than the growth during the 6 years in between ALS and UAV–LiDAR data acquisition. We can only speculate which sensor properties led to those differences in canopy cover, but most likely, the beam divergence and return discretization parameters are underlying causes.
Gap fraction profiles, created for three random locations within the study sites with a 20 m radius, showed that there were substantial differences in the description of the vertical vegetation profile (Figure 11). In general, the profiles were comparable for the upper canopy, but the VUX-SYS had a lower gap fraction for the lower parts of the canopy. This implies that the VUX-SYS measured much more structure in the understory, which was also observed in the cross sections and point distribution profiles shown before (Figure 4 and Figure 6).
In Section 2.4, we hypothesised that all systems would give comparable terrain and canopy metrics, but this did not hold for the canopy metrics. The canopy cover derived from the QM8 and VLP16 was much lower than from the VUX-SYS, which was also reflected in the CHM. The expected differences along the vertical profile were clearly observed; especially in the lower parts of canopy, clear differences in the point density and derived gap-fraction are present.

3.4. Individual Tree Parameter Estimation

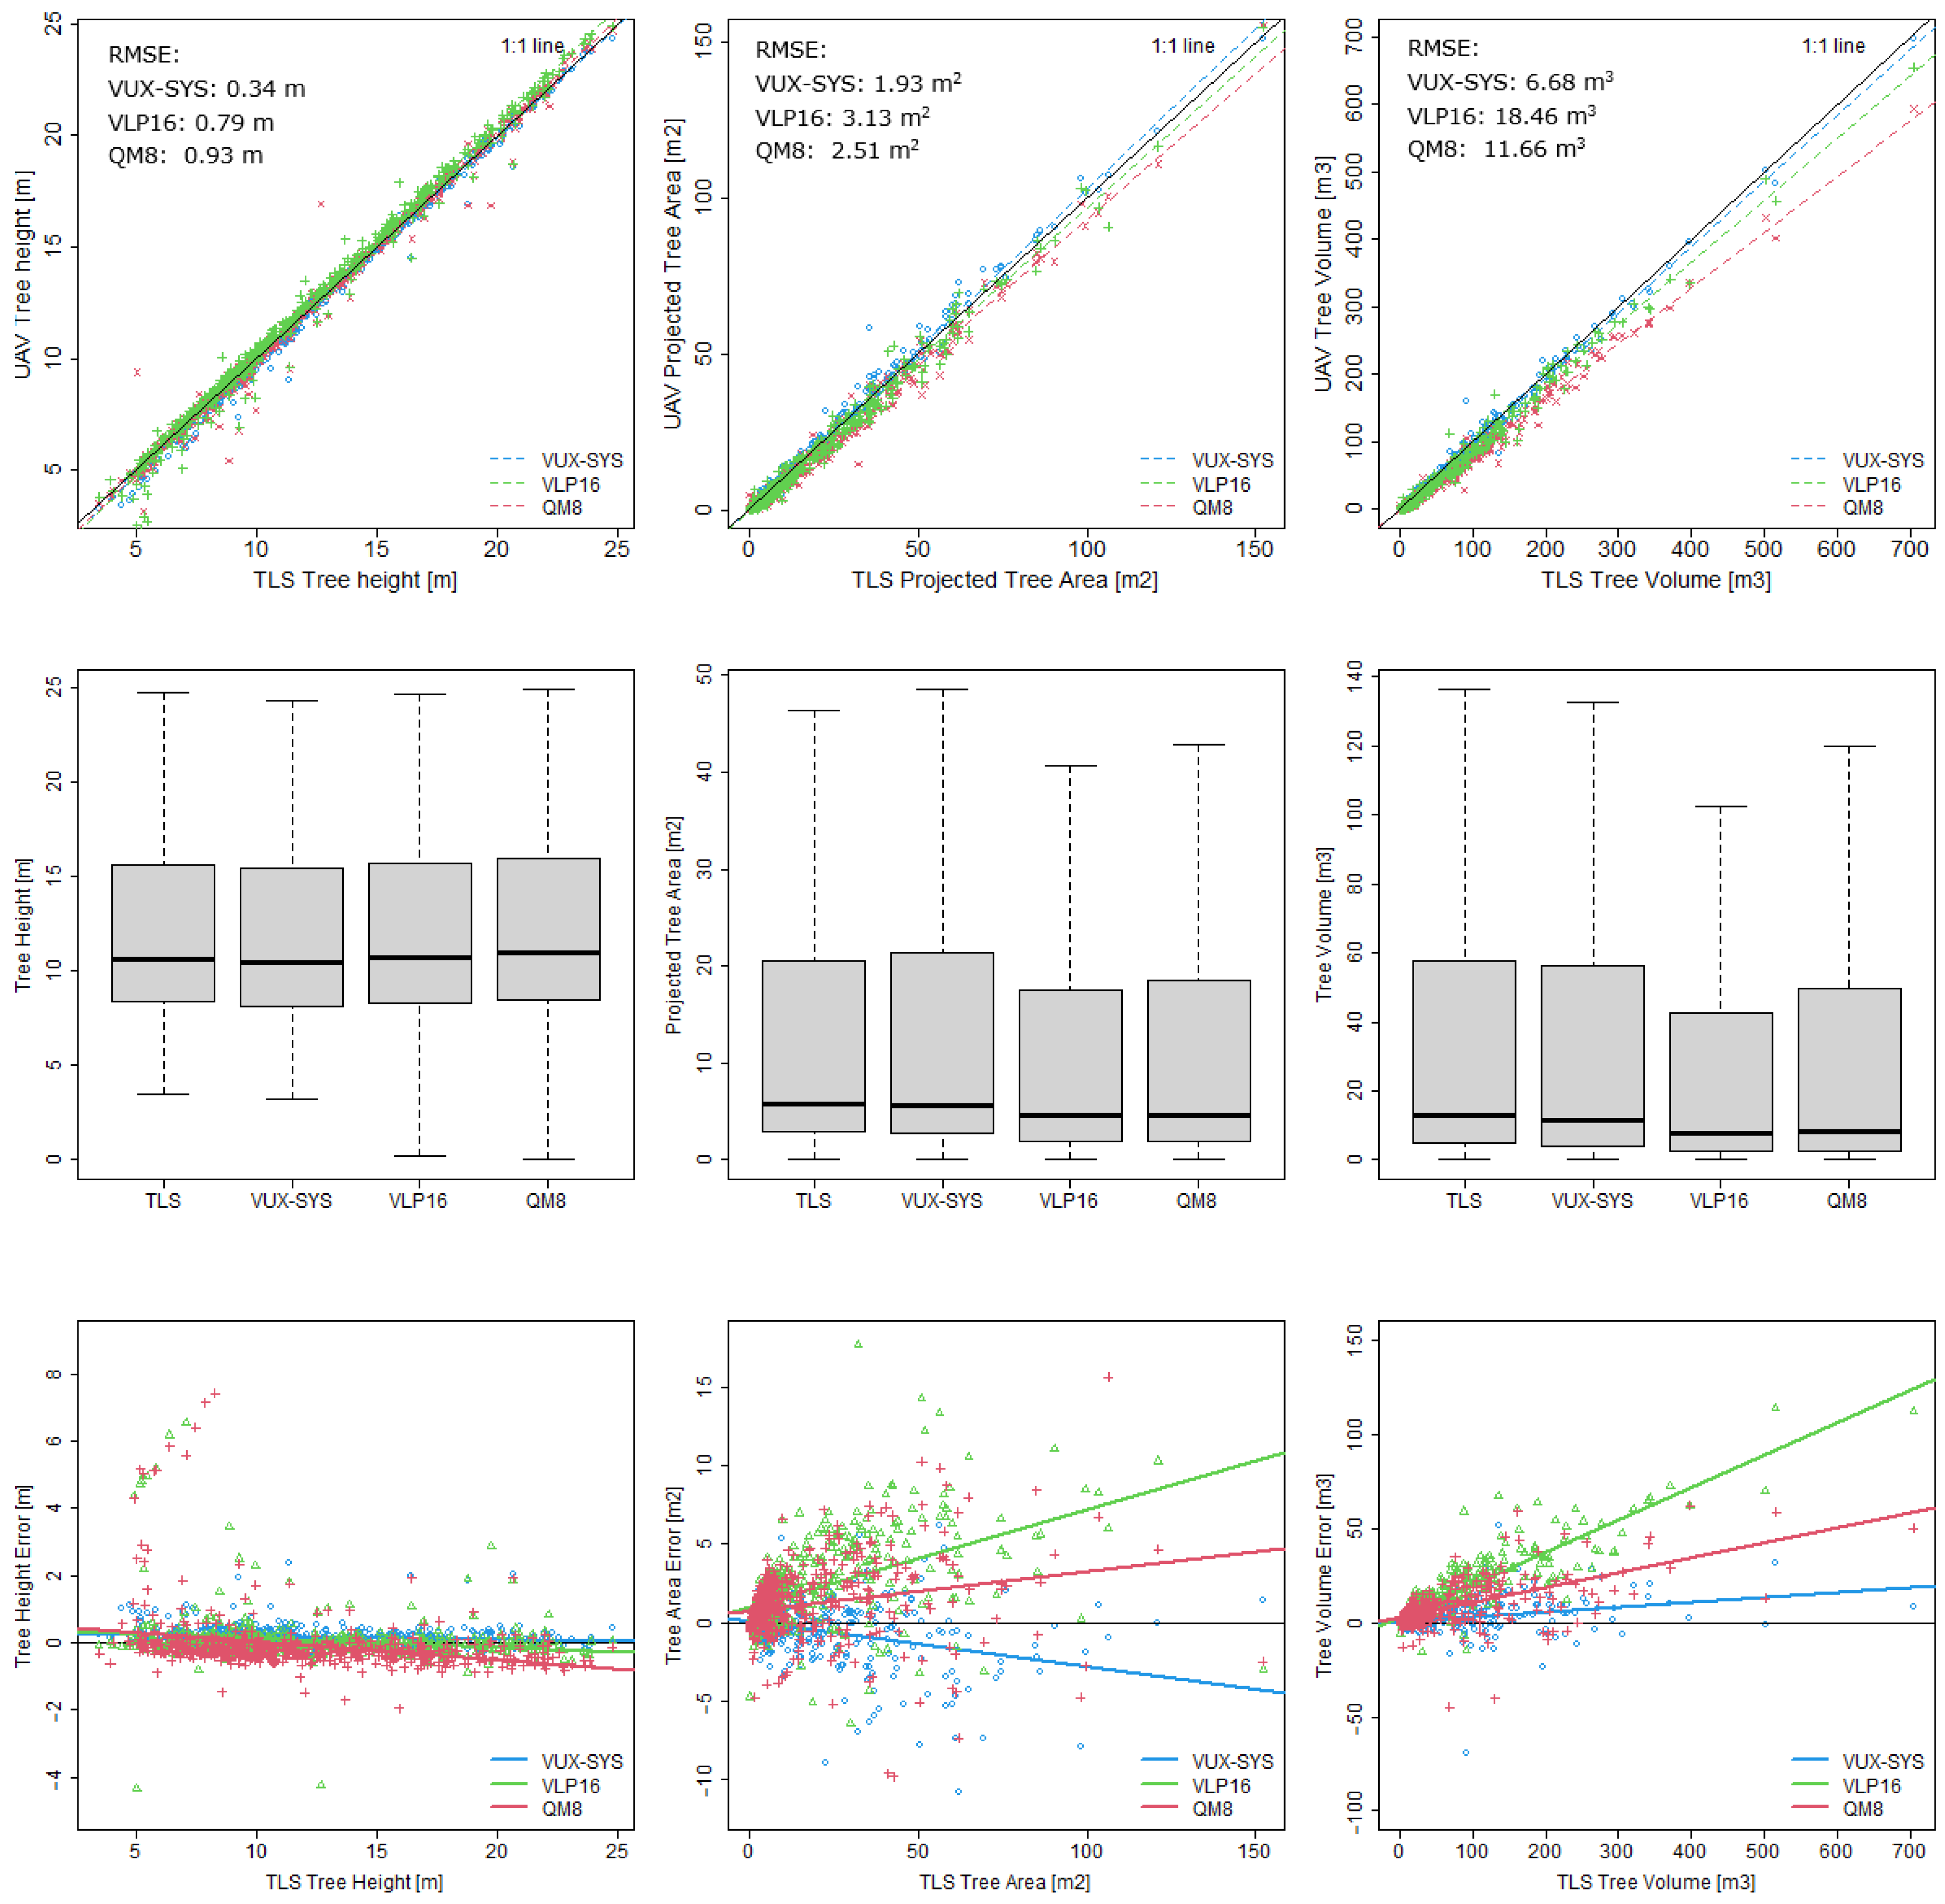
All systems estimated individual tree height well when compared with TLS measurements (Figure 12). The VUX-SYS was, on average, underestimating the tree height by 20 cm (Table 3), whereas the other systems showed a smaller under- (VLP16: 8 cm) or overestimation (QM8: 6 cm). However, the variation in tree height estimation error was larger for the VLP16- and QM8-based systems, which is a risk when the focus is on a few individual trees. This was also expressed in a larger RMSE for those systems (Table 3). The error plots (bottom Figure 12) show that the error in height estimation for the VLP16 and QM8 was slightly more negative for taller trees than for shorter trees, indicating that those systems tended to overestimate the height of taller trees more than for smaller trees. This plot also showed that fewer smaller trees were detected by the matching procedure for the VLP16 and QM8 point clouds, but contained too few points to derive a reliable tree height. The VUX-SYS does not show a relationship between the tree height and error in height estimation.
The tree volume derived from the VUX-SYS point clouds showed very similar values to the measurements based on the TLS data (Table 3). Both the VLP16 and QM8 systems showed underestimations of the tree volume (Figure 12). This was indicated by a negative mean difference, but the scatter plots and box plot also showed that for almost all trees, the tree volume measurements with the VLP16 and QM8 were lower. The VUX-SYS measurements showed variations around the 0 m3 difference, but those variations occurred in both negative and positive directions (MAE = 3.39 m3, RMSE = 6.68 m3). Therefore, we conclude that the VUX-SYS data described the individual tree volume much better than the other systems. Comparable conclusions can be drawn for the projected tree area (Figure 12, Table 3). The VUX-SYS captures the dimensions of the crown better than the VLP16 and QM8, which both showed a consistent underestimation of the crown dimensions. For the tree crown area and tree volume, there was a relationship between the size of the tree and the error. This was most pronounced for the VLP16, which underestimated the tree volume in general, but the absolute error became larger when the tree volume increased.
In Section 2.4, we hypothesised that the higher-end VUX-SYS would deliver more accurate individual tree metrics than the mid-range VLP16 and QM8 systems. Considering TLS as the ground-truth for complete tree structure parameters, this hypothesis can be confirmed. For tree height, area, and volume, the VUX-SYS results are, on average, consistently closer to the TLS-derived values than the VLP16 and QM8 results.

4. Discussion

The technical specifications of the scanner can be evaluated well in a laboratory setup; however, the performance of the entire UAV–LiDAR system is harder to assess. A crucial part of the system is the INS, which is essential for proper alignment of the scans. When comparing the systems for a specific application, as performed in this study, there were observable differences in co-registration quality. There are no real straightforward methods to determine the internal quality of a point cloud in a dynamic environment such as a forest, but a comparison of the different datasets shows that investing in a higher-quality system does pay off, especially when the focus is an individual tree assessment, opening possibilities for more advanced analysis [31]. On a tree level, the parameters derived from the VUX-SYS data were closest to the TLS-derived parameters, which is considered a good standard for tree-level parameter estimates.
Our results show that in the context of the data-interoperability of time series measurements of a forest site, it is crucial to use the same system, or cross-calibrate derived forest structural metrics. The products derived from the different scanners show differences which are likely larger than actual changes taking place within the forest, as shown in Figure 10, where the VLP16 and QM8 canopy cover is lower than the ALS canopy cover, although the ALS data are 6 years old and the canopy has likely changed over the years. General products such as the DTM and CHM are reasonably comparable for different UAV–LiDAR sensors; however, differences can also be observed here, especially for the CHM. Analysis of specific forest structural parameters, such as canopy height or canopy cover, shows that the choice for one UAV–LiDAR sensor or the another has a considerable influence on the derived parameter values. Therefore, one UAV–LiDAR system cannot be interchanged for the other, and forest products derived from different sensors are not comparable. This is crucial when building UAV–LiDAR time series for any ecological interpretation of observed changes, or extending ALS time-series with UAV–LiDAR data. LiDAR has been used to study multi-temporal forest dynamics [32,33,34], but it is clear that UAV–LiDAR should be added to the toolbox with utmost care.
Some of the larger errors in tree height estimation were caused by missing lower parts of the trees. We defined the tree height as the difference between minimum and maximum Z in the point cloud; therefore, missing the lower parts of the stem during scanning resulted in an underestimated tree height. Adaptions of the method to calculate the tree height may decrease those errors, for example, by comparing the treetop with the ground instead of treetop with the bottom of the stem. The larger differences mainly reflect the difficulties the VLP16 and QM8 have to record below canopy structure. Therefore, research focus could also be on developing algorithms that are less sensitive to data-interoperability issues.
We did not investigate the influence of repeated flights with the same system. A slightly different flight pattern may result in a different sampling of the area, and thus, in a different point distribution. However, we believe that this will lead to much smaller differences in the point clouds than the differences we observe between the different scanners.
Our sensor comparison was performed in savanna woodland, characterised by an open structure, which makes it easier for LiDAR to penetrate deep within the canopy. For more complex forests, with denser vegetation and multiple canopy layers, differences between systems might even be larger. Previous research by Terryn et al. [7] showed that, using the VUX-SYS system, differences in flight speed and multiple vs. single returns resulted in significant differences in derived forest parameters for dense tropical forest. High laser power and multiple return capabilities will be crucial in such cases for good characterisation of the forest structure. Brede et al. [35] showed in their experiment over a tropical forest plot that the technical settings of the system (such as pulse repetition rate and laser power) have a considerable influence on how well the different canopy layers are sampled. For many low-cost systems, range is limited, and the laser power cannot be adapted, which will limit their use in more dense or multi-layered canopies. Experiments such as those performed by Brede et al. and Terryn et al. are essential to gain better insight in which factors have the strongest impact on the properties of the acquired point cloud.
With our experimental setup, we were not able to quantify the importance of different flight parameters (e.g., height and speed), beam divergence, laser power, or pulse discretization. For this, repeated and controlled experiments are needed, or virtual LiDAR simulations such as those facilitated by HELIOS++ software [36]. Such LiDAR simulation software offers the possibility to produce datasets as they would be acquired by different sensors, while keeping all environmental parameters constant. We are confident that the vegetation in the plot did not change significantly during the 6 days between UAV–LiDAR flights, but a stable environment can be assured using simulations. Furthermore, simulations offer the possibility to test much more different scenarios than could be assessed during our field campaign. For example, flight operational factors such as speed, height, and the number of flight lines influence the quality of the data, of which the influence could be systematically tested with LiDAR simulation software. In our comparison, we used different flight parameters, mostly following the manufacturers’ instructions; however, we could not validate how large the influence of those parameters was on the acquired datasets.
Developments in UAV–LiDAR sensors are rapidly progressing, with systems becoming smaller and less expensive [13,37]. Specification sheets all promise highly accurate and reliable 3D point clouds, but in practice there are considerable differences in data quality. The advances in technology present many great possibilities for measuring forest structure and monitoring the structural dynamics. However, in this comparison, we demonstrated a large variation in point density between sensors, which significantly influenced the derived forest parameters. Therefore, the main conclusion is that the interpretation of multi-sensor UAV–LiDAR datasets and drawing ecological conclusions from them should be carried out with utmost care.
However, we should not neglect that the rapid developments in UAV–LiDAR systems, in tandem with rapidly dropping prices, bring those systems within reach for a much larger user community. The systems presented here require sizeable investments (we refer to the companies or resellers for exact pricing information), but systems built around LIVOX sensors, for example, are available for around EUR 10,000. The absolute quality of those cheaper sensors is lower compared with high-end systems such as the VUX-SYS, but the user base will be much larger. Therefore, those lower-end systems should not be neglected because they may open up new directions such as covering larger areas, more frequently, and at lower costs. However, we showed that data quality will have a considerable influence on the derived forest parameters; thus, users should be aware of this.
The intention of this paper was not to give best-buy advice, because there are many reasons why to decide on one system over another. We focussed on the derived forest parameters, but many practical considerations precede this, such as operational use (flight time and ease of operation), processing efficiency (number of user interventions and time investment) and costs (for purchase but also maintenance and operations).
Given the speed at which forest structures change, time series would ideally extend multiple decades, which is beyond the expected technical lifespan of UAV–LiDAR systems. Nowadays, we are just at the beginning of the construction of such long time-series. Future research should focus on quantifying data operability issues, as we have shown in this research. Algorithms should be tested for their robustness to the system properties, and the focus should be on developing algorithms which yield robust estimates of the forest structure, independent on the sensors used.

5. Conclusions

In this study, we compared forest structural parameters derived from data recorded with three different UAV–LiDAR systems. The results showed that there were considerable differences in the derived forest parameters, indicating that studying forest dynamics with multiple UAV–LiDAR should be performed with utmost care, because data operability is a major challenge. When combining different sensors in a UAV–LiDAR time-series, the differences in derived tree or forest parameters between systems is likely larger than the actual changes within the forest.

Author Contributions

Data were collected by H.B., T.W., K.C., R.B., S.R.L., and L.T.; R.B., S.R.L., and T.W. arranged crucial parts of the permissions and logistics. Pre-processing and analysis were performed by H.B., T.W., S.M.K.M., L.T., and K.C.; H.B., K.C., S.R.L., H.V. and T.W. conceptualised the experiment. All co-authors contributed to the writing process. All authors have read and agreed to the published version of the manuscript.

Funding

The fieldwork was funded by BELSPO (Belgian Science Policy Office) in the frame of the STEREO III programme project 3D-FOREST (SR/02/355).

Data Availability Statement

The data presented in this study are available on request from the corresponding author or [email protected]. The data are not yet publicly available due to ongoing research on the acquired datasets.

Acknowledgments

We thank Barbara D’hont for assistance during the TLS fieldwork. We acknowledge the Ecosystem Processes facility in Australia’s Terrestrial Ecosystem Research Network (TERN) and NT Parks and Wildlife.

Conflicts of Interest

The authors declare no conflict of interest. The funders had no role in the design of the study; in the collection, analyses, or interpretation of data; in the writing of the manuscript; or in the decision to publish the results.

References

  1. Goodwin, N.R.; Coops, N.C.; Culvenor, D.S. Assessment of forest structure with airborne LiDAR and the effects of platform altitude. Remote Sens. Environ. 2006, 103, 140–152. [Google Scholar] [CrossRef]
  2. Zhang, Z.; Cao, L.; She, G. Estimating forest structural parameters using canopy metrics derived from airborne LiDAR data in subtropical forests. Remote Sens. 2017, 9, 940. [Google Scholar] [CrossRef] [Green Version]
  3. Simard, M.; Pinto, N.; Fisher, J.B.; Baccini, A. Mapping forest canopy height globally with spaceborne lidar. J. Geophys. Res. Biogeosci. 2011, 116, 103592. [Google Scholar] [CrossRef] [Green Version]
  4. Tang, H.; Armston, J.; Hancock, S.; Marselis, S.; Goetz, S.; Dubayah, R. Characterizing global forest canopy cover distribution using spaceborne lidar. Remote Sens. Environ. 2019, 231, 111262. [Google Scholar] [CrossRef]
  5. Calders, K.; Adams, J.; Armston, J.; Bartholomeus, H.; Bauwens, S.; Bentley, L.P.; Chave, J.; Danson, F.M.; Demol, M.; Disney, M. Terrestrial laser scanning in forest ecology: Expanding the horizon. Remote Sens. Environ. 2020, 251, 112102. [Google Scholar] [CrossRef]
  6. Bauwens, S.; Bartholomeus, H.; Calders, K.; Lejeune, P. Forest inventory with terrestrial LiDAR: A comparison of static and hand-held mobile laser scanning. Forests 2016, 7, 127. [Google Scholar] [CrossRef] [Green Version]
  7. Terryn, L.; Calders, K.; Bartholomeus, H.; Bartolo, R.E.; Brede, B.; D’hont, B.; Disney, M.; Herold, M.; Lau, A.; Shenkin, A. Quantifying tropical forest structure through terrestrial and UAV laser scanning fusion in Australian rainforests. Remote Sens. Environ. 2022, 271, 112912. [Google Scholar] [CrossRef]
  8. Côté, J.-F.; Fournier, R.A.; Egli, R. An architectural model of trees to estimate forest structural attributes using terrestrial LiDAR. Environ. Model. Softw. 2011, 26, 761–777. [Google Scholar] [CrossRef]
  9. Neuville, R.; Bates, J.S.; Jonard, F. Estimating forest structure from UAV-mounted LiDAR point cloud using machine learning. Remote Sens. 2021, 13, 352. [Google Scholar] [CrossRef]
  10. Liu, K.; Shen, X.; Cao, L.; Wang, G.; Cao, F. Estimating forest structural attributes using UAV-LiDAR data in Ginkgo plantations. ISPRS J. Photogramm. Remote Sens. 2018, 146, 465–482. [Google Scholar] [CrossRef]
  11. Wallace, L.; Lucieer, A.; Malenovský, Z.; Turner, D.; Vopěnka, P. Assessment of forest structure using two UAV techniques: A comparison of airborne laser scanning and structure from motion (SfM) point clouds. Forests 2016, 7, 62. [Google Scholar] [CrossRef] [Green Version]
  12. Brede, B.; Lau, A.; Bartholomeus, H.M.; Kooistra, L. Comparing RIEGL RiCOPTER UAV LiDAR derived canopy height and DBH with terrestrial LiDAR. Sensors 2017, 17, 2371. [Google Scholar] [CrossRef] [PubMed]
  13. Hu, T.; Sun, X.; Su, Y.; Guan, H.; Sun, Q.; Kelly, M.; Guo, Q. Development and performance evaluation of a very low-cost UAV-LiDAR system for forestry applications. Remote Sens. 2020, 13, 77. [Google Scholar] [CrossRef]
  14. Wallace, L.; Lucieer, A.; Watson, C.; Turner, D. Development of a UAV-LiDAR system with application to forest inventory. Remote Sens. 2012, 4, 1519–1543. [Google Scholar] [CrossRef] [Green Version]
  15. Gyawali, A.; Aalto, M.; Peuhkurinen, J.; Villikka, M.; Ranta, T. Comparison of Individual Tree Height Estimated from LiDAR and Digital Aerial Photogrammetry in Young Forests. Sustainability 2022, 14, 3720. [Google Scholar] [CrossRef]
  16. Ganz, S.; Käber, Y.; Adler, P. Measuring tree height with remote sensing—A comparison of photogrammetric and LiDAR data with different field measurements. Forests 2019, 10, 694. [Google Scholar] [CrossRef] [Green Version]
  17. Thiel, C.; Schmullius, C. Comparison of UAV photograph-based and airborne lidar-based point clouds over forest from a forestry application perspective. Int. J. Remote Sens. 2017, 38, 2411–2426. [Google Scholar] [CrossRef]
  18. Moe, K.T.; Owari, T.; Furuya, N.; Hiroshima, T. Comparing individual tree height information derived from field surveys, LiDAR and UAV-DAP for high-value timber species in Northern Japan. Forests 2020, 11, 223. [Google Scholar] [CrossRef] [Green Version]
  19. Levick, S.R.; Whiteside, T.; Loewensteiner, D.A.; Rudge, M.; Bartolo, R. Leveraging TLS as a Calibration and Validation Tool for MLS and ULS Mapping of Savanna Structure and Biomass at Landscape-Scales. Remote Sens. 2021, 13, 257. [Google Scholar] [CrossRef]
  20. Hyyppä, E.; Yu, X.; Kaartinen, H.; Hakala, T.; Kukko, A.; Vastaranta, M.; Hyyppä, J. Comparison of backpack, handheld, under-canopy UAV, and above-canopy UAV laser scanning for field reference data collection in boreal forests. Remote Sens. 2020, 12, 3327. [Google Scholar] [CrossRef]
  21. Rudge, M.L.; Levick, S.R.; Bartolo, R.E.; Erskine, P.D. Modelling the diameter distribution of savanna trees with drone-based LiDAR. Remote Sens. 2021, 13, 1266. [Google Scholar] [CrossRef]
  22. TERN. Litchfield Savanna SuperSite. Available online: http://www.tern-supersites.net.au/supersites/lfld (accessed on 13 June 2022).
  23. CloudCompare; v2.11.3. [GPL Software], 2020. Available online: http://www.cloudcompare.org (accessed on 13 June 2022).
  24. Wilkes, P.; Lau, A.; Disney, M.; Calders, K.; Burt, A.; Gonzalez de Tanago, J.; Bartholomeus, H.; Brede, B.; Herold, M. Data acquisition considerations for Terrestrial Laser Scanning of forest plots. Remote Sens. Environ. 2017, 196, 140–153. [Google Scholar] [CrossRef]
  25. Roussel, J.-R.; Auty, D.; Coops, N.C.; Tompalski, P.; Goodbody, T.R.H.; Meador, A.S.; Bourdon, J.-F.; de Boissieu, F.; Achim, A. lidR: An R package for analysis of Airborne Laser Scanning (ALS) data. Remote Sens. Environ. 2020, 251, 112061. [Google Scholar] [CrossRef]
  26. Isenburg, M. LAStools—Efficient Tools for LiDAR Processing. 2020. Available online: https://rapidlasso.com/lastools/ (accessed on 13 June 2022).
  27. R Core Team. R: A Language and Environment for Statistical Computing; R Foundation for Statistical Computing: Vienna, Austria, 2010. [Google Scholar]
  28. Bouvier, M.; Durrieu, S.; Fournier, R.A.; Renaud, J.-P. Generalizing predictive models of forest inventory attributes using an area-based approach with airborne LiDAR data. Remote Sens. Environ. 2015, 156, 322–334. [Google Scholar] [CrossRef]
  29. Terryn, L.; Calders, K.; Akerblom, M.; Bartholomeus, H.; Disney, M.; Levick, S.R.; Origo, N.; Raumonen, P.; Verbeeck, H. Analysing individual 3D tree structure using the R package ITSMe. Methods Ecol. Evol. 2022, 00, 1–11. [Google Scholar] [CrossRef]
  30. Jalobeanu, A.; Kim, A.M.; Runyon, S.C.; Olsen, R.; Kruse, F.A. Uncertainty assessment and probabilistic change detection using terrestrial and airborne LiDAR. In Proceedings of the Laser Radar Technology and Applications XIX; and Atmospheric Propagation XI, Baltimore, MD, USA, 6–7 May 2014; pp. 228–246. [Google Scholar]
  31. Brede, B.; Calders, K.; Lau, A.; Raumonen, P.; Bartholomeus, H.M.; Herold, M.; Kooistra, L. Non-destructive tree volume estimation through quantitative structure modelling: Comparing UAV laser scanning with terrestrial LIDAR. Remote Sens. Environ. 2019, 233, 111355. [Google Scholar] [CrossRef]
  32. Duncanson, L.; Dubayah, R. Monitoring individual tree-based change with airborne lidar. Ecol. Evol. 2018, 8, 5079–5089. [Google Scholar] [CrossRef] [Green Version]
  33. Levick, S.R.; Asner, G.P. The rate and spatial pattern of treefall in a savanna landscape. Biol. Conserv. 2013, 157, 121–127. [Google Scholar] [CrossRef]
  34. Zhao, K.; Suarez, J.C.; Garcia, M.; Hu, T.; Wang, C.; Londo, A. Utility of multitemporal lidar for forest and carbon monitoring: Tree growth, biomass dynamics, and carbon flux. Remote Sens. Environ. 2018, 204, 883–897. [Google Scholar] [CrossRef]
  35. Brede, B.; Bartholomeus, H.; Barbier, N.; Pimont, F.; Vincent, G.; Herold, M. Peering through the thicket: Effects of UAV LiDAR scanner settings and flight planning on canopy volume discovery. J. Appl. Earth Obs. Geoinf. 2022, 114, 103056. [Google Scholar] [CrossRef]
  36. Winiwarter, L.; Pena, A.M.E.; Weiser, H.; Anders, K.; Sánchez, J.M.; Searle, M.; Höfle, B. Virtual laser scanning with HELIOS++: A novel take on ray tracing-based simulation of topographic full-waveform 3D laser scanning. Remote Sens. Environ. 2022, 269, 112772. [Google Scholar] [CrossRef]
  37. Torresan, C.; Berton, A.; Carotenuto, F.; Chiavetta, U.; Miglietta, F.; Zaldei, A.; Gioli, B. Development and performance assessment of a low-cost UAV laser scanner system (LasUAV). Remote Sens. 2018, 10, 1094. [Google Scholar] [CrossRef]
Figure 1. The Litchfield study area, located in Litchfield National Park, Northern Territory Australia. The left pane shows an aerial photograph, overlaid with the Canopy Height Model derived from the VUX-SYS dataset. The top right pane in an enhanced view of part of the Litchfield National Park. The bottom right map shows the zooms further out to Northern Australia. Coordinates on the X and Y axes are given in UTM Zone 52S.
Remotesensing 14 05992 g001
Figure 2. Flowchart of the followed methodology.
Remotesensing 14 05992 g002
Figure 3. Point density plots, indicating the number of pts/m2. The area shown covers the 200 × 200 m study area; coordinates on the x and y axes are given in UTM Zone 52S. Note that colour scales are different per plot.
Remotesensing 14 05992 g003
Figure 4. Cross sections of a 5 m slice show the differences in point density and point distribution. This is especially visible by the greater detail in the understory for the VUX-SYS. The flux tower was established after the ALS data acquisition, and was therefore lacking in the upper slice. The area shown covers a 200 m slice in the X direction, and 5 m in the Y direction. Values on the X axis are X-coordinates; values on the Y axis are heights given in UTM Zone 52S.
Remotesensing 14 05992 g004
Figure 5. Side views of the top of the flux tower, with the points coloured by GPS time; thus, different passes with the systems are shown in different colours. Co-registration issues between the different flight lines are visible for the VLP16 and QM8 sensors.
Remotesensing 14 05992 g005
Figure 6. Frequency profiles showing the number of points per 0.5 m height above the terrain bins, for the entire 200 × 200 m study area. The black line shows the number of points including all returns, and the red, green, and blue lines show the first, second, and third or higher returns, respectively.
Remotesensing 14 05992 g006
Figure 7. (Left) Digital terrain models acquired with the different sensors; elevation is given in metres above sea level. (Right) Canopy height models acquired with the different sensors; elevation is given in metres above the terrain. The area shown covers the 200 × 200 m study area; coordinates on the x and y axes are given in UTM Zone 52S.
Remotesensing 14 05992 g007
Figure 8. Difference maps of the UAV–LiDAR-derived digital terrain models and the ALS DTM. The three maps show the absolute differences spatially. The boxplot shows a summary of the differences for all pixels in the study area. The area shown covers the 200 × 200 m study area; coordinates on the x and y axes are given in UTM Zone 52S.
Remotesensing 14 05992 g008
Figure 9. Canopy cover (%) acquired by the different sensors (pixel size = 1 m). The area shown covers the 200 × 200 m study area; coordinates on the x and y axes are given in UTM Zone 52S. Large differences in canopy cover can be observed between the different datasets.
Remotesensing 14 05992 g009
Figure 10. Boxplots of canopy cover (%) values for the 200 × 200 m study area, acquired by the different sensors. The boxplots show that the average canopy cover is much higher for VUX = SYS than for the other UAV data and the older ALS data.
Remotesensing 14 05992 g010
Figure 11. Gap fraction profiles of three randomly selected 20 m radius areas plots. Height is given in m.a.s.l.
Remotesensing 14 05992 g011
Figure 12. Tree height (Left), tree projected area (Middle), and tree crown volume (Right) derived from individual tree point clouds for the different sensors, compared with TLS-derived values. On the top, scatterplots are given, with the regression lines of TLS vs. UAV data. In the middle, the data are represented in boxplots to summarise the differences for all trees within the 100 × 100 m study area. At the bottom, the differences in the TLS-derived parameters minus the UAV-derived parameters are plotted against the TLS-derived values.
Remotesensing 14 05992 g012
Table 1. System and flight specifications.
UAV–LiDAR SystemRIEGL VUX-SYSNextcore Gen-1
VLP16
Nextcore RN50
QM8
Technology Time of FlightTime of FlightTime of Flight
View angle (degrees)330360360
Wavelength (nm)1550903905
Max number of returns923
Max range (m)600100100
Beam divergence (mrad)0.353.0unknown
IntensityYesYesYes
Accuracy (cm)1~3<3
Flight speed (m/s)3–54–54–5
Flight height above ground (m)554040
Line spacing (m)manual16–2316–23
Sensor pulse rate (M points/s)0.550.61.2
Data acquisition date (Y/M/D)12 September 20186 September 20186 September 2018
Table 3. Mean values for individual tree parameters calculated for all trees in the plot, and the mean absolute errors and root-mean-squared error for individual tree parameters, using TLS data as reference.
TLSVUX-SYSVLP16QM8
Mean Height [m]11.9311.7311.8511.99
Mean Tree Area [m2]14.9915.3213.0713.83
Mean Tree volume [m3]47.2345.2436.4140.97
MAE Height [m]-0.230.310.46
RMSE Height [m]-0.340.790.93
MAE Tree Area [m2]-12.151.76
RMSE Tree Area [m2]-1.933.132.51
MAE Tree Volume [m3]-3.39117.11
RMSE Tree Volume [m3]-6.6818.4611.66
Publisher’s Note: MDPI stays neutral with regard to jurisdictional claims in published maps and institutional affiliations.