Article

Satellite Remote Sensing Identification of Discolored Standing Trees for Pine Wilt Disease Based on Semi-Supervised Deep Learning

1
Key Laboratory for Silviculture and Conservation of Ministry of Education, Beijing Forestry University, Beijing 100083, China
2
Center for Biological Disaster Prevention and Control, National Forestry and Grassland Administration, Shenyang 110034, China
3
China SIWEI Surveying & Mapping Technology Co., Ltd., Beijing 100048, China
4
Key Laboratory of Digital Earth Science, Aerospace Information Research Institute, Chinese Academy of Sciences, Beijing 100094, China
*
Author to whom correspondence should be addressed.
These authors contributed equally to this work.
Remote Sens. 2022, 14(23), 5936; https://doi.org/10.3390/rs14235936
Submission received: 8 October 2022 / Revised: 15 November 2022 / Accepted: 21 November 2022 / Published: 23 November 2022
(This article belongs to the Special Issue Advanced Earth Observations of Forest and Wetland Environment)

Abstract

:
Pine wilt disease (PWD) is the most dangerous biohazard of pine species and poses a serious threat to forest resources. Coupling satellite remote sensing technology and deep learning technology for the accurate monitoring of PWD is an important tool for the efficient prevention and control of PWD. We used Gaofen-2 remote sensing images to construct a dataset of discolored standing tree samples of PWD and selected three semantic segmentation models—DeepLabv3+, HRNet, and DANet—for training and to compare their performance. To build a GAN-based semi-supervised semantic segmentation model for semi-supervised learning training, the best model was chosen as the generator of generative adversarial networks (GANs). The model was then optimized for structural adjustment and hyperparameter adjustment. Aimed at the characteristics of Gaofen-2 images and discolored standing trees with PWD, this paper adopts three strategies—swelling prediction, raster vectorization, and forest floor mask extraction—to optimize the image identification process and results and conducts an application demonstration study in Nanping city, Fujian Province. The results show that among the three semantic segmentation models, HRNet was the optimal conventional semantic segmentation model for identifying discolored standing trees of PWD based on Gaofen-2 images and that its MIoU value was 68.36%. Additionally, the GAN-based semi-supervised semantic segmentation model GAN_HRNet_Semi improved the MIoU value by 3.10%, and its recognition segmentation accuracy was better than the traditional semantic segmentation model. The recall rate of PWD discolored standing tree monitoring in the demonstration area reached 80.09%. The combination of semi-supervised semantic segmentation technology and high-resolution satellite remote sensing technology provides new technical methods for the accurate wide-scale monitoring, prevention, and control of PWD.

1. Introduction

Pine wilt disease (PWD) is one of the most dangerous forest biohazards in China. PWD is also known as the “cancer of pine trees” because of its highly infectious and lethal characteristics and is a devastating disease for pine species. The pine wood nematodes (Bursaphelenchus xylophilus) that cause the disease are native to North America and have spread to other regions [1,2]. Currently, PWD is mainly located in China, Korea, and Japan in East Asia; Portugal and Spain in Europe; and the United States, Mexico, and Canada in North America [3]. PWD was first detected in mainland China in 1982 in Nanjing, Jiangsu Province [4], after which the disease continued to spread outward, with Jiangsu, Guangdong, Shandong, and Zhejiang Provinces consecutively discovering PWD in subsequent years [5,6]. By the end of 2021, the PWD epidemic had occurred in 742 counties (districts and cities) of China’s 19 provinces (districts and cities) and 5530 townships and 34.05 million sub-compartments of pine forests [7], thus seriously undermining the ecological security of pine forests, threatening national forest resources, and causing immense economic losses.
Presently, the prevention and control of PWD are becoming increasingly difficult; traditional monitoring mainly uses field surveys, which are time-consuming and laborious; furthermore, some areas have dense forests and treacherous terrain, hindering the ability to accurately monitor and master PWD epidemic information [8]. Remote sensing images have the unique advantages of real-time dynamics, large area coverage, low susceptibility to environmental interference, and short cycle time, which are conducive to the monitoring, localization, and evaluation of variegated pine trees and provide a new and effective way to monitor PWD.
The canopies of pine wood nematode-susceptible pine trees and healthy pine trees show different reflectance spectral characteristics, and the different stages of the chlorophyll content and leaf water content of susceptible pine trees show different reflectance spectral characteristics, which supports early monitoring of these trees based on remote sensing images [9,10]. Earlier use of remote sensing images for monitoring PWD was mainly based on the analysis of different spectral values exhibited by susceptible trees and healthy pine trees [11,12]. Subsequently, researchers investigated the identification of typical band features, the construction of spectral feature indicators, and the determination of the relationship between spectral features and plant physiological characteristics, revealing the characteristics of PWD via actual spectral observations [13,14,15] and applying this property to PWD monitoring using satellite remote sensing images [16,17,18].
Since the 21st century, an increasing number of scholars have carried out research on forest disease and pest monitoring based on sub-meter-resolution satellite remote sensing images [19]. Meanwhile, the application of machine learning techniques in high-resolution satellite imagery ensures the advantages of satellite image monitoring. Decision trees, support vector machines, and other machine learning techniques were used to identify PWD based on the spectral features of pine trees susceptible to pine wood nematode disease [20,21,22], and image enhancement techniques such as panchromatic sharpening methods were utilized to improve the image feature display of discolored standing trees with PWD while machine learning techniques were used for classification, both of which achieved high monitoring accuracy [22,23]. Additionally, some scholars have conducted research on the possibility of detecting PWD using remote sensing data under multi-resolution multi-sensor conditions; verified the feasibility of PWD detection by high-resolution images [14,24]; and identified areas of PWD in true color, high-resolution images using a decision tree algorithm [25].
Deep convolutional neural networks have been widely employed in computer vision and other fields in recent years by virtue of their accurate and efficient image recognition capabilities and have been introduced into the field of remote sensing for remote sensing big data analysis [26,27]. Based on numerous samples, multiple implicit layer neurons were used to meet the needs of remote sensing technology for disease and pest monitoring. However, the current remote sensing processing methods based on deep convolutional neural networks are mostly applied in the fields of land use type classification and vehicle-ship target recognition [28,29], while only a few studies have involved PWD monitoring and control, and most of them investigated the monitoring of PWD incidence areas. Huang et al. (2022) constructed a pine nematode disease sample dataset based on enhanced Gaofen-2 images, used a deep convolutional neural network model for the identification of PWD incidence areas, and achieved an accuracy of 94.90% [30]. Zhou et al. (2022) rapidly located PWD-infected areas by classifying and identifying high-resolution satellite remote sensing images with a deep convolutional neural network technique [31]. Zhang et al. (2021) applied spectral indices combined with spatial convolution image enhancement techniques to achieve a monitoring method for spatiotemporal variation with a 13.5% improvement in direct classification accuracy compared with the use of a single date image [18]. To find the area of PWD incidence in a wide range of detection, the disease needs to spread to a certain extent before it is easy to detect as it is very easy to miss new occurrences of PWD, which offers limited assistance to the actual control work.
Most existing studies on satellite image-based PWD surveillance are conducted at the regional scale, and traditional deep learning techniques have the disadvantage of requiring the construction of large sample datasets. There are few studies on deep learning techniques in the PWD surveillance of discolored standing trees, especially semi-supervised learning. This study investigates a semi-supervised deep semantic segmentation model suitable for remote sensing image recognition and monitoring of discolored standing trees with PWD. First, a sample dataset is established by using diseased standing trees with PWD in Gaofen-2 remote sensing images. Second, three semantic segmentation models (DeepalBV3+, HRNet, and DANet) are trained based on the sample datasets, the model with the best effect is selected as the generator, and a GAN-based semi-supervised semantic segmentation model is built. After model optimization, a semi-supervised deep semantic segmentation model suitable for identifying PWD-inflicted trees in satellite remote sensing images is formed. The model obtained in this study can compensate for the lack of accuracy in identifying disease-susceptible pine trees in remote sensing images for PWD surveillance and the labor and time costs of building a training sample set in traditional deep learning. Thus, this study aims to provide a technical method reference for accurate and efficient monitoring of discolored standing trees with PWD from satellite remote sensing images.

2. Material and Methods

2.1. Study Area

The study area of this paper includes Luotian County in Hubei Province (Figure 1a); Shunchang County, Jianou city, and Yanping District in Fujian Province (Figure 1b); Chun’an County in Zhejiang Province (Figure 1c); and Gan County in Jiangxi Province, for a total of four areas (Figure 1d). Luotian County (115°06′–115°46′E, 30°35′–31°16′N) is part of Huanggang city, Hubei Province; it was officially declared a PWD epidemic area by the State Forestry Administration of China in February 2018. Shunchang County (117°30′–118°14′E, 26°39′–27°12′N), Jianou city (117°58′–118°57′E, 26°38′–27°20′N), and Yanping District (117°50′–118°40′E, 26°15′–26°52′N) are part of Nanping city, Fujian Province, and PWD has occurred there for many years since 2008. Chun’an County (118°20′–119°20′E, 29°11′–30°02′N) is part of Hangzhou city, Zhejiang Province, and forest cover comprises 76.89% of this region [32]. In addition, PWD occurred in 139.47 hectares, with 2769 diseased trees in 2018 [33]. Ganxian District (114°42′–115°22′E, 25°26′–26°17′N) is part of Ganzhou city, Jiangxi Province, where 326.43 hectares of pine nematode disease incidence and 878 dead pine trees were detected in 2014.

2.2. Remote Sensing Image Data

In this study, 21 scenes of Gaofen-2 images of product grade 1A, covering a total of six districts and counties in four provinces, namely Hubei, Zhejiang, Jiangxi, and Fujian, were employed (Figure 1). Among them are Luotian County, Hubei Province; the junction of Shunchang County, Jianou city, and Yanping District, Fujian Province; An County, Zhejiang Province; and Gan County District, Ganzhou City, Jiangxi Province. Details of the data are shown in Table 1.

2.3. Ground Survey Data and Woodland Distribution Data

Based on high-resolution satellite images and unmanned aerial vehicle (UAV) images, visual interpretation was conducted to discover suspected PWD discolored standing trees, and then, a ground investigation was conducted to verify and identify them as ground investigation sites. Ground survey site data were obtained from the Center for Biological Disaster Prevention and Control of the State Forestry and Grassland Administration of China (https://www.bdpc.org.cn/ (accessed on 16 January 2022)). Within the image coverage, there are 153 locations in Luotian County, Hubei Province; 119 locations in Nanping City, Fujian Province; 110 locations in An County, Zhejiang Province; and 959 locations in Gan County District, Jiangxi Province (Figure 1).
Woodland distribution data from the 10 m resolution land cover data FEOM_GLC10 [34], ground survey data, and forest distribution data can assist in the visual interpretation, image annotation, and result optimization of PWD discolored standing trees.

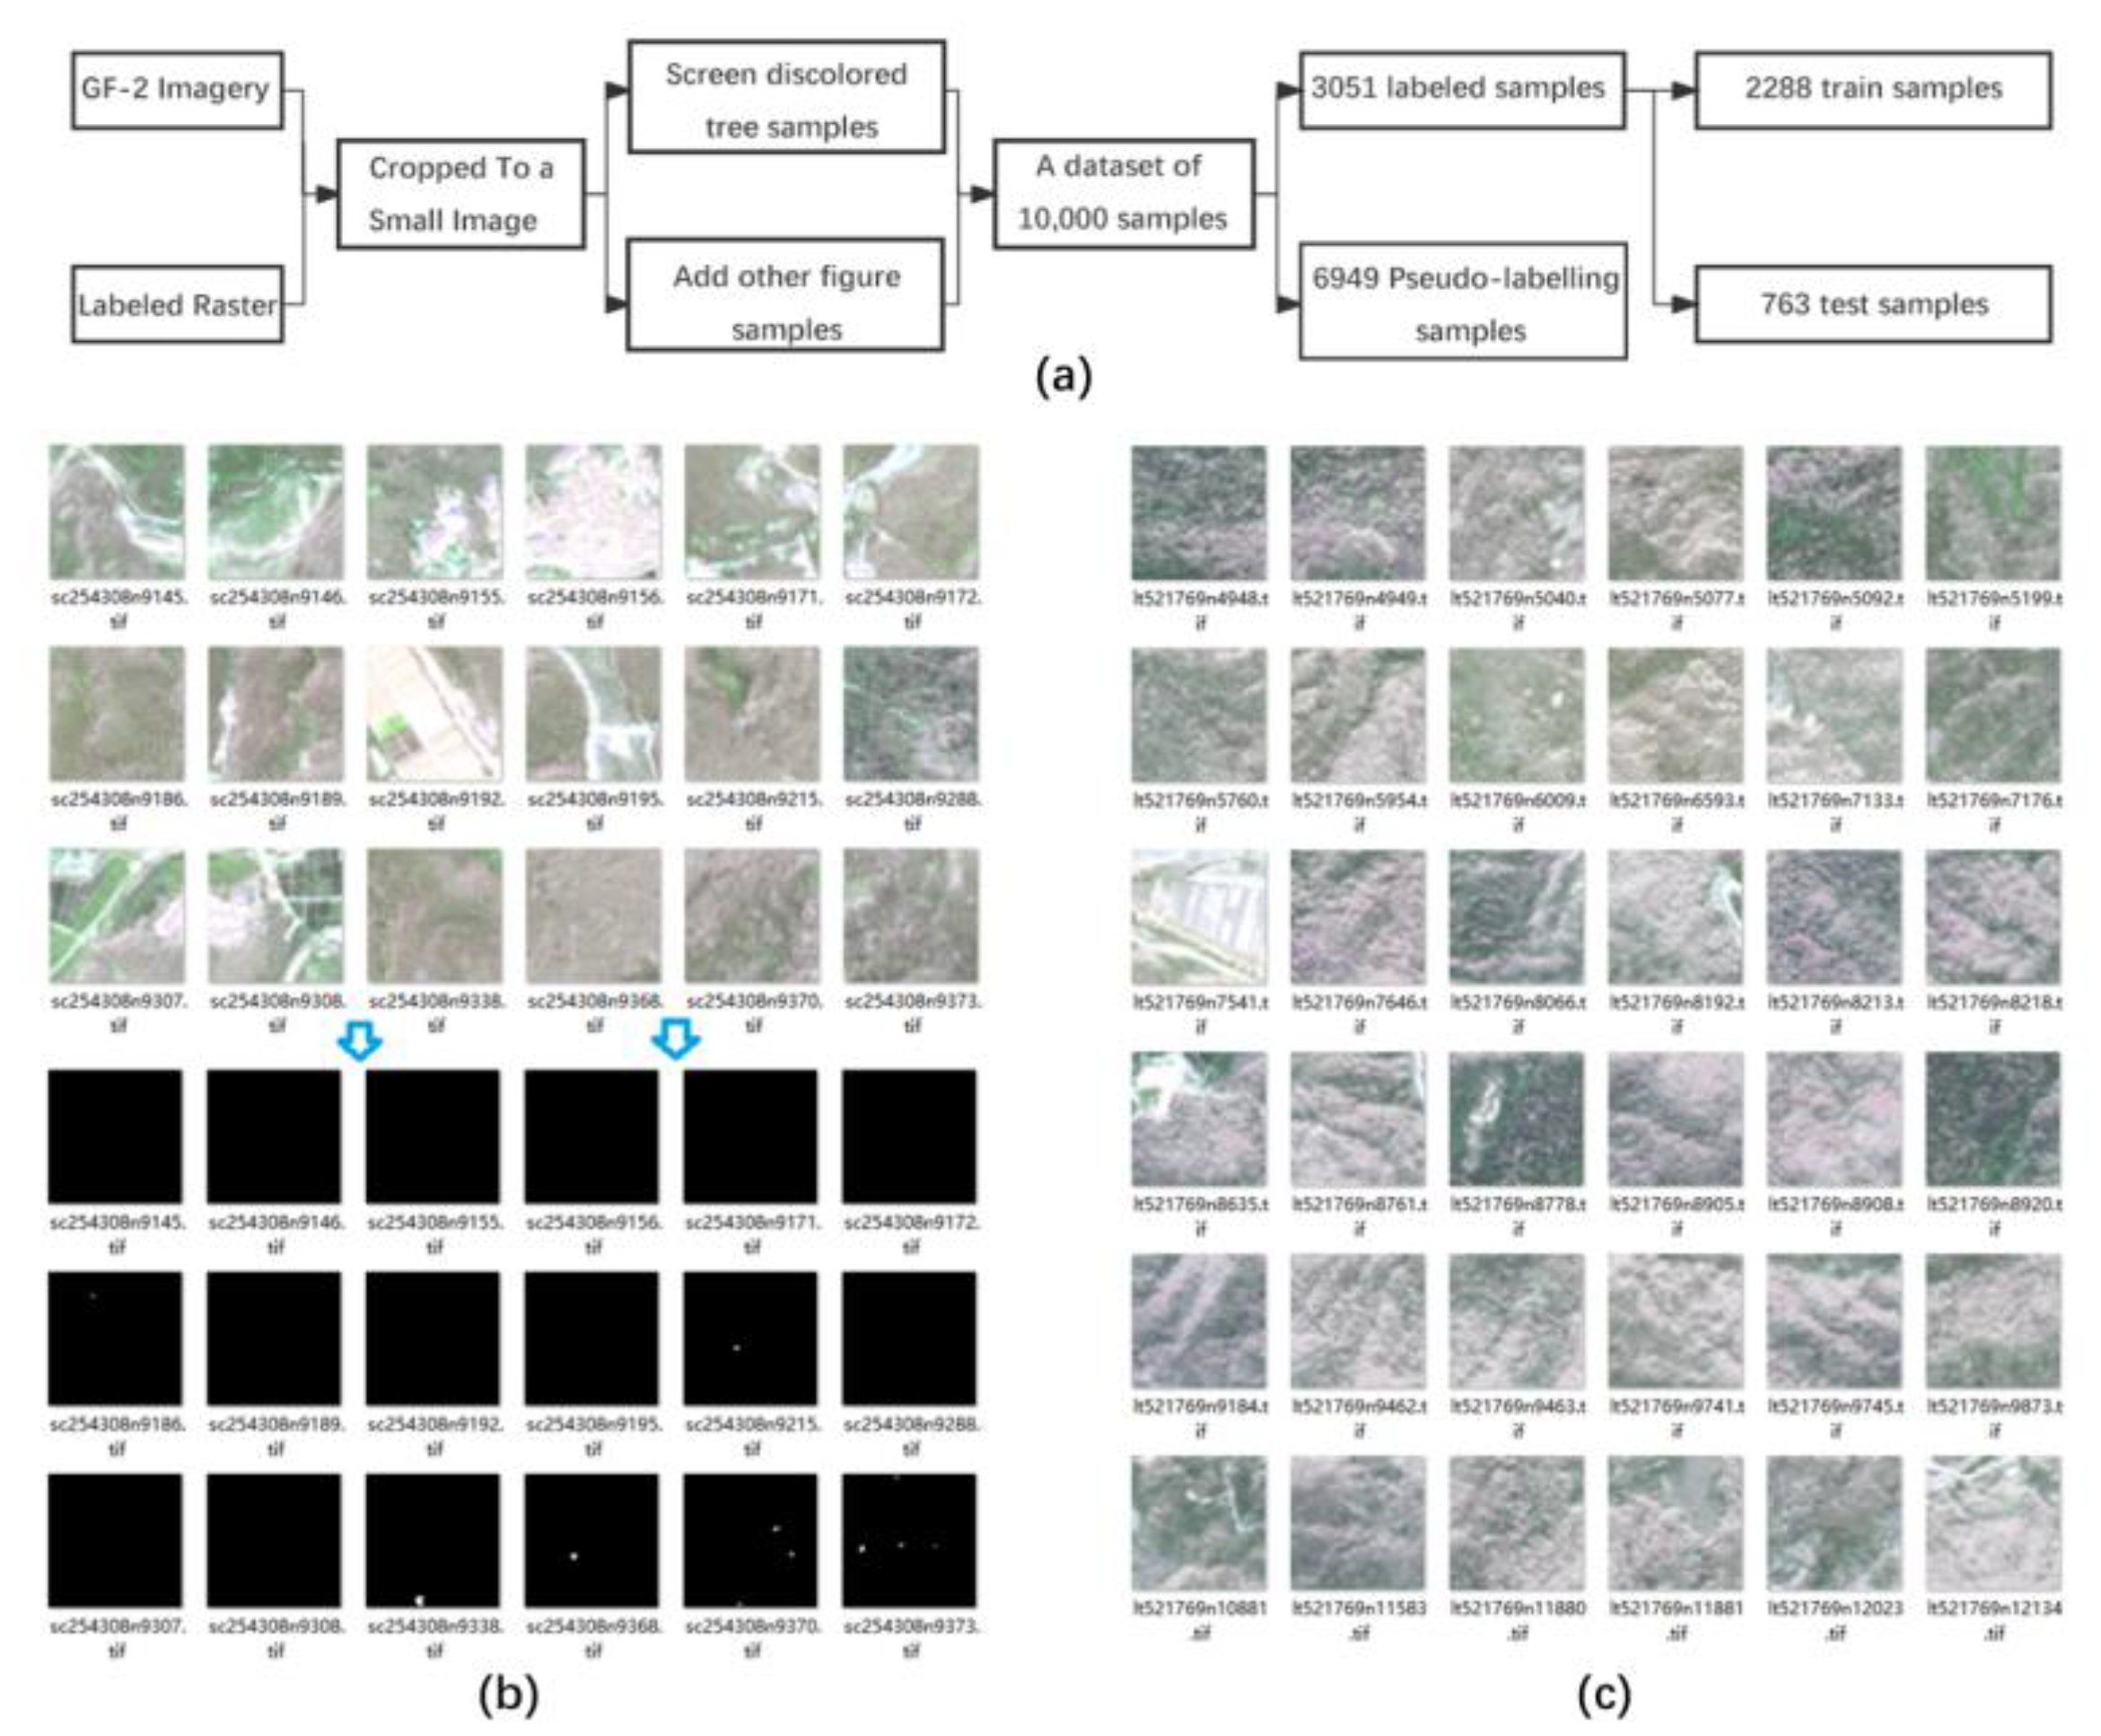
2.4. Construction of a Semantic Segmentation Sample Dataset for PWD Discolored Standing Trees

In this study, based on Gaofen-2 satellite image data, ground survey point data, and woodland distribution data, the construction of a sample dataset for semantic segmentation of PWD discolored standing trees was carried out, and ArcGIS 10.4 software (ESRI, Redlands, CA, USA) and the Python GDAL library (https://gdal.org/ (accessed on 14 September 2020)) were utilized to construct a sample dataset.
The raster labels were made by manually labeling some areas of discolored standing trees with PWD using ArcGIS 10.4 software. To avoid the problem of memory overflow due to the direct input of the whole scene image into the deep learning network, the whole scene image needed to be cropped into image blocks. Python was used to build a sliding window algorithm to crop the original image and raster labels with a sliding step of 256 pixels, and the cropped original image corresponded to the raster label image. A small number of manually labeled PWD discolored standing trees were selected as labeled sample data, which could be applied for supervised learning and semi-supervised learning experiments. Numerous unlabeled samples served as unlabeled sample data only for semi-supervised learning experiments.

2.5. Construction of the Deep Semantic Segmentation Model

In this study, DeepLabv3+, HRNet, and DANet models were built using the TensorFlow framework with superior performance for deep semantic segmentation network models. According to the Gaofen-2 remote sensing image and sample size characteristics and recognition results, which only contained discolored standing trees and background requirements, the input size of the three models was set to (256 × 256 × 4), and the output size of the models was set to (256 × 256 × 2). Fifty-fold cross-validation of the DeepLabv3+, HRNet, and DANet models was performed based on 2288 training validation sample datapoints from the Gaofen-2 PWD semantic segmentation sample dataset. The model performance was evaluated by (i) the validation set MIoU (mean intersection over union), (ii) the number of model parameters, (iii) the convergence speed (the number of training rounds where the model reaches the maximum MIoU), and (iv) the training time. The four evaluation indices were comprehensively compared to obtain the model with the best performance in identifying discolored standing trees with PWD.
MIoU is the mean value of IoU for each category of objects, which is the most important evaluation index in semantic segmentation for evaluating the accuracy of the semantic segmentation model for image segmentation. In this study, the mean value of IoU was determined for the two categories of PWD discolored standing trees and background.
M I O U = 1 K + 1 i = 0 K P i i j = 0 K P i j + j = 0 K P j i P i i
where P i j is the number of true values of i that are predicted to be j , P i i is the number of true values of i that are predicted to be i , P j i is the number of true values of j that are predicted to be i , and K + 1 is the number of categories. In this study, the value of K is 1 and the value of K + 1 is 2, representing the two categories of PWD discolored standing trees and background, respectively, in this study.

2.6. Semi-Supervised Semantic Segmentation Model Construction Based on GANs

The generative adversarial network (GAN) model was proposed in 2014 [35]; its network structure is divided into two main parts: the generator and the discriminator. The input to the generator is a random value that generates pseudo-sample data, with the goal of minimizing the difference between the distribution of pseudo-sample data and that of real data. The inputs to the discriminator are the real sample data and the pseudo-sample data from the generator. The two kinds of data are discriminated, and the discriminant result is fed to the generator model to train the generator, whose goal is to maximize the distribution gap between the pseudo-sample data and the real data. In the whole network training process, the two are implemented through a dynamic adversarial game so that the whole network continuously enhances optimization and achieves a Nash equilibrium. In semi-supervised learning, the model is trained to learn based on labeled sample data and unlabeled sample data. The model utilizes unlabeled sample data, which allows the model to fully learn the data and enhances the model generalization performance.

2.6.1. GAN-Based Supervised Semantic Segmentation Model

The best performing models selected from the recognition performance analysis of three deep semantic segmentation models, DeepLabv3+, HRNet, and DANet, were chosen as the generators of GANs, and a convolutional neural network model including 3 convolutional layers and 1 upsampling layer was constructed as a discriminator to construct a GAN-based semantic segmentation model. The convolutional neural network model of this discriminator was set to a step size of 2 for the first 3 convolutional operations for downsampling, and the feature map size was reduced by half to enable the discriminator to extract more contextual information. The last upsampling made the output bit space probability map size and the input classification map size consistent, and the pixel classification was performed by the sigmoid activation function (Figure 2). The generator was a semantic segmentation network that was used to generate the classification map of an image. The input of the generator was a labeled sample image with an input size of (256 × 256 × 4), and the output of the generator was a classification map with a size of (256 × 256 × 2). The discriminator was used to discriminate whether each pixel in the classification graph input to the discriminator was a real label or a classification result generated by the generator. The input to the discriminator was a (256 × 256 × 2) classification graph and real labels, and the output was a (256 × 256 × 1) bit-space probability graph. The value of each pixel point in the spatial probability map ranged from 0 to 1, representing the confidence that this pixel point is the true label. If the value of this pixel point is closer to 1, then the pixel point at the corresponding position in the input classification map is the true label, and the discriminator judges that the pixel point at the corresponding position is the classification result generated by the generator.
The GAN-based supervised semantic segmentation model is not applicable to unlabeled data; it is a supervised learning method, and only labeled sample images were used for training. The loss of the generator of this model consists of two parts. The first part is the cross-entropy loss of the classification result and the true label obtained from the labeled sample images passing through the generator. The second part is the discriminant result of the discriminator and the adversarial loss of the generator.

2.6.2. Semi-Supervised Semantic Segmentation Model Based on GAN

In this study, we have constructed a semantic segmentation model suitable for identifying discolored standing trees with PWD based on the GAN-based semi-supervised semantic segmentation method proposed by Hung [36] (Figure 3). The model adds the learning mechanism of unlabeled sample images to the former, which can be learned for both labeled sample images and unlabeled sample images. The core of the model is that the discriminator identifies plausible regions in the classification results of unlabeled images, i.e., the pixel regions of discolored standing trees, thus providing additional supervised signals for the training of the generator to achieve semi-supervised learning and to enhance the semantic segmentation performance of the generator. The structure of the model is basically similar to the former. The main difference is that the input of the generator varies, the input of the semi-supervised semantic segmentation model generator is labeled sample images and unlabeled sample images, the sizes of the input and output results are the same as the former, and the input and output results of the discriminator are the same as the former.
The loss function of the generator of this model differs from the former in that its loss consists of three parts. The first part is the cross-entropy loss of the classification result and the true label obtained from the labeled sample image after the generator. The second part is the discriminant result of the discriminator and the adversarial loss of the generator. The third part is the semi-supervised loss of plausible regions. After adding the unlabeled sample images, the generator identifies and classifies them, obtains the classification results and the plausible regions of the recognition results through the discriminator (the discriminator discriminates the pixel points in the classification map as the regions composed of the true labeled pixel points), keeps the plausible regions as the true labels of the unlabeled sample images, and thus obtains the cross-entropy loss function values of the unlabeled sample images (semi-supervised loss of plausible regions).

2.7. Semi-Supervised Semantic Segmentation Model Optimization Based on GANs

2.7.1. Model Macro Restructuring

In this study, the structure of the GAN-based semi-supervised semantic segmentation model was improved to enhance the recognition capability of the model. Based on the discriminator constructed by three convolutional downsampling layers and one upsampling layer at the beginning, we tried two structural ways to increase the semantic segmentation accuracy of this model by structural adjustment. The first discriminator structure removed the downsampling and upsampling layers based on the original discriminator structure, and the discriminator consisted of 4 convolutional layers. The step size was set to 1 during the 4 convolutional operations without downsampling, and the size of the feature map remained unchanged during the calculation. The second type added two convolutional layers to the original discriminator structure, and the discriminator consisted of five convolutional downsampling layers and one upsampling layer. The first five convolutional operations were set to 2 steps for downsampling, and the last upsampling operation made the output layer size and the input map size consistent [36].

2.7.2. Model Hyperparameter Optimization

In addition to the structure of the deep convolutional neural network, the hyperparameters set when training the model have a direct impact on the knowledge effect of the semantic segmentation model. The hyperparameters that have an important role in the network feature learning performance are batch size and learning rate.
For batch size, augmentation within a reasonable range can improve the efficiency of hardware memory usage, reduce the number of parameter updates during each round of sample training, increase the processing speed of the same data volume, stabilize the model training process, and improve the accuracy of the stochastic gradient descent direction [37,38]. However, a batch size beyond a reasonable range may degrade the generalization performance of the model and may cause the model to be untrained due to insufficient hardware memory capacity. The batch size is generally set to the nth power of 2 to adapt to the storage and computation methods of the computer hardware. In this study, the batch size was set to 2, 4, and 8 to identify the most suitable batch size for the constructed semi-supervised semantic segmentation model.
For the learning rate, an excessively high value will cause the gradient of the model to fall too fast in backpropagation, thus missing the solution of the minimization loss function, which will limit or even reduce the accuracy of the model in segmenting the discolored standing trees with PWD. However, excessively low values make the correction of the weight parameters slow and may make the model fall into the local optimal solution of the minimization loss function instead of the global optimal solution, which not only reduces the speed of network convergence but also leads to poor model accuracy. A smaller learning rate is generally utilized in deep learning to train the network, allowing the model to fully learn the features of the dataset. In this study, we set 6 learning rates with sizes of 1.0 × 10⁻¹, 1.0 × 10⁻², 1.0 × 10⁻³, 1.0 × 10⁻⁴, 1.5 × 10⁻⁵ and 1.0 × 10⁻⁵ and compared the training effects of the models with different learning rates to identify the most suitable learning rate for the constructed semi-supervised semantic segmentation model.

2.8. Optimization and Evaluation of Discolored Standing Tree Identification Results of PWD

2.8.1. Swelling Prediction

When using a sliding window for traversal cropping of remotely sensed images, it will affect the recognition of discolored standing trees with PWD at the edges due to there being less contextual information in the edge area of each image block obtained by cropping. To solve this problem, this study adopted the method of expansion prediction for image recognition with swelling prediction. The sliding window size was set to 256 × 256, the sliding step size was set to 128 each time, and only the recognition result of the center part of 128 × 128 size was retained for each recognition, thus avoiding inaccurate recognition results of discolored standing trees with PWD caused by the feature extraction problem of the boundary.

2.8.2. Woodland Mask Extraction

Satellite remote sensing feature types are complex, and red houses, bare ground, and other features can interfere with the predicted recognition of PWD discolored stands, producing false recognition results such as red houses in the recognition results of PWD discolored stands. The PWD discolored standing trees were distributed in forests, and the point file after vectorization of the model recognition results was extracted by masking using the forest distribution data, which can remove some incorrect recognition points and improve the accuracy of PWD discolored standing tree recognition.

2.8.3. Evaluation of Results

Manual labeling results of PWD discolored standing trees were obtained based on manual visual interpretation, and the model recognition results were compared with the former. The model recognition results were evaluated using the precision rate P, recall rate R, and F1 score. The precision rate P is used to measure the accuracy of the model in identifying PWD discolored trees. The recall rate was applied to assess the comprehensiveness of the model in identifying PWD discolored standing trees. The F1 score was the summed average of the precision rate P and the recall rate R, taking both into account. The indicators were calculated as follows:
P = T P T P + F P
R = T P T P + F N
F 1 = 2 × P × R P + R
where T P represents the number of correctly identified PWD discolored stands, F P represents the number of other features that were incorrectly identified as PWD discolored stands, and F N represents the number of PWD discolored stands that were incorrectly identified as other features.

3. Results

3.1. Sample Dataset for Semantic Segmentation of PWD Based on Gaofen-2 Images

A total of 438,342 sample images were obtained based on the Gaofen-2 images, from which 8615 samples containing pine nematode discolored standing trees were selected, and 2099 samples out of these had real labels. In order to enhance the generalization performance of the model, we added 1385 samples of other various feature types (houses, water bodies, bare ground, grassland, etc.), of which 952 samples had real labels.
The sample dataset of this study consisted of 10,000 samples, divided into 3051 labeled samples and 6949 unlabeled samples. The 3051 labeled samples were used for supervised learning and semi-supervised learning experiments, and the other 6949 unlabeled samples were used for semi-supervised learning experiments only (Figure 4).

3.2. Analysis of Recognition Performance of Three Traditional Semantic Segmentation Models

Fine identification of PWD discolored standing trees was performed by the DeepLabv3+, HRNet, and DANet models based on 2288 training sample datapoints from the semantic segmentation sample dataset of Gaofen-2 images. The study results show that HRNet was the most suitable semantic segmentation model for PWD discolored standing tree identification, which showed an optimal performance with the highest MIoU values and the lowest number of parameters (Table 2). Compared with DeepLabv3+, HRNet improved the MIoU by 10.78% and reduced the number of parameters to 41.37% of that of the former at the cost of 4.76 h of training time and four rounds of convergence speed. Compared with DANet, HRNet’s MIoU was 7.9% higher, the number of parameters was only 23.79% of that of the former, and the training time was 6.95 h less than that of the former. Only the convergence speed was 21 rounds greater than that of the former, and the overall performance was much better than that of the former. The HRNet model was selected to build a semi-supervised semantic segmentation model based on GANs, taking into account the results of the four evaluation indices: MIoU, number of model parameters, convergence speed, and training time.

3.3. Analysis of the Recognition Effect of the GAN-Based Semi-Supervised Semantic Segmentation Model

GAN_HRNet_Semi, a semi-supervised semantic segmentation model based on GANs, improved the semantic segmentation accuracy of PWD discolored standing trees by adding unlabeled data (Table 3). As the GAN-based semi-supervised semantic segmentation model GAN_HRNet_Semi added discriminators, the number of parameters increased by 500,000 compared with HRNet. The training time of GAN_HRNet_Semi increased due to the addition of numerous unlabeled image data, which increased the computational load of the model. Additionally, the training time of GAN_HRNet_Semi was 1.6 times longer than that of HRNet and 1.2 times longer than that of GAN_HRNet, but its semantic segmentation accuracy improved, and the MIoU in the test set reached 68.36%, which is 3.10% higher than that of HRNet and 1.81% higher than that of GAN_HRNet. The MIoU value of HRNet in the test set was 65.26%, which is lower than that of both GAN_HRNet and GAN_HRNet_Semi, but the convergence speed was the fastest, the number of parameters was the lowest, and the training time was the shortest among the three models. GAN_HRNet added the idea of a GAN to HRNet, following which the MIoU value increased by 1.29% compared with HRNet, the model convergence speed was slower than HRNet, and the training time increased by 1.037 h compared with HRNet.

3.4. Optimization Results of the GAN-Based Semi-Supervised Semantic Segmentation Model

3.4.1. Analysis of Model Macrostructural Adjustment Results

Based on the semantic segmentation sample dataset of Gaofen-2 PWD images, an experimental study of discriminator structure adjustment was conducted. The results of the study showed that the discriminator consisting of the structure of three convolutional layers and one upsampling layer, constructed at the beginning, was most suitable for the GAN_HRNet_Semi model to recognize the discolored standing trees with PWD (Table 4). Structure Adjustment 1: The downsampling operation of the starting structure was adjusted to an ordinary convolution operation without downsampling, and the size of the feature map was kept unchanged, which increased the computational load of the model and increased the training time by 0.7 times. The model converged eight rounds at a faster rate, but the speed of convergence and the increase in training time did not improve the MIoU value. The MIoU decreased by 0.54% after the structure adjustment. Structure Adjustment 2: Two downsampling layers were added to the starting structure, resulting in the size of the feature map becoming one-thirtieth of a second of the original size after the discriminator performed five downsampling operations. The proportion of pixels occupied by PWD discolored stands in the input map was too small, causing the loss of pine wood nematode variegated stand information and making it difficult for the discriminator to extract the feature information of discolored stands, thus resulting in the adjusted MIoU being 4.09% lower than before adjustment. In summary, both structural adjustments failed to improve the image segmentation ability of the original model for the discolored standing trees with PWD, and so the discriminator structure designed at the beginning was the most suitable for this research task.

3.4.2. Analysis of Model Hyperparameter Optimization Results

The batch size comparison results (Table 5) showed that a batch size of two is the appropriate batch size for GAN_HRNet_Semi for PWD discolored standing tree extraction. Compared with a batch size of four, when the batch size was reduced to two, the performance balance of the generator and the discriminator in the model was easier to maintain as the batch size was smaller, and the adversarial loss in the training process accelerated the training of the generator, which increased the convergence speed of the model by 25 rounds, caused the generator to extract more feature information, and enhanced the generalization performance of the model, thus increasing the MIoU value of the model by 2.06% to 70.42%.
The learning rate comparison results (Table 6) showed that a learning rate of 1.0 × 10⁻³ is the appropriate learning rate for GAN_HRNet_Semi for PWD discolored standing tree extraction. First, when the learning rate was set to 1.0 × 10⁻¹, an explosion of loss values occurred, and the model could not converge. When the learning rate was reduced from 1.0 × 10⁻¹ to 1.0 × 10⁻³, the results showed that the learning rate was reasonably reduced to increase the accuracy of model recognition, the convergence speed was accelerated, and the model stability and generalization performance were enhanced. When the learning rate was set to 1.0 × 10⁻³, the MIoU value reached the maximum value of 72.02%, and the model recognition accuracy was the highest. Second, when the green learning rate decreased from 1.0 × 10⁻³ to 1.0 × 10⁻⁵, the recognition accuracy of the model gradually decreased.

3.5. Identification Results of Gaofen-2 Remote Sensing Monitoring Application Demonstration of PWD

Through the model structure adjustment experiment and the optimization of hyperparameters, the GAN-based semi-supervised semantic segmentation model GAN_HRNet_Semi was trained to identify pine nematode discoloration standing trees with the best performance. Based on the model, the three methods of swelling prediction, raster vectorization, and forest floor mask extraction were combined to optimize the results of PWD discolored tree identification and monitoring and to identify discolored trees covering the occurrence of PWD in three Jing Gaofen-2 remote sensing shadows in Nanping city, Fujian Province. Nanping city is located in a subtropical, maritime monsoon climate, which is suitable for the growth and reproduction of PWD. The region is a heavy epidemic area, with the onset of PWD in the three districts and counties occurring at different times and having a strong representation.
The experimental results showed that under the premise of focusing on the recall rate index in PWD discolored tree monitoring, two methods of optimization of the PWD discolored tree identification results—swelling prediction and stand extraction—had the best identification effect, with 69.61% identification accuracy, 80.09% recall rate, and 74.48% F1-score (Table 7, Figure 5). Compared with the inflated prediction process for recognition results only, adding the forestland extraction optimization method improved the accuracy and F1-score of this model by 0.51% and 0.24%, reaching 69.61% and 74.48%, respectively, while the recall rate was reduced by only 0.03%.

4. Discussion

This study used a semi-supervised deep learning semantic segmentation technique to monitor and identify discolored standing trees with PWD in high-resolution remote sensing images. First, a sample dataset for semantic segmentation of PWD was constructed based on discolored trees with PWD in Gaofen-2 images, and three deep learning semantic segmentation models with superior performance—DeepLabv3+, HRNet, and DANet—were constructed for five-fold cross-validation. HRNet was determined to be the most suitable semantic segmentation model for identifying discolored trees with PWD. Then, a GAN-based semi-supervised semantic segmentation model, GAN_HRNet_Semi, was constructed with HRNet as the generator and a convolutional neural network model, including three convolutional downsampling layers and one upsampling layer as the discriminator to achieve semi-supervised training learning of discolored standing trees with PWD. Furthermore, the constructed GAN-based semi-supervised semantic segmentation model was optimized by improving the structure through adjustment and the two hyperparameters of batch size and learning rate. The generator structure of 3 convolutional downsampling layers and 1 upsampling layer, a batch size of two, and a learning rate of 1.0 × 10⁻³ were determined as the optimal settings for this model. The results of the study showed that the model implemented with the optimization strategy can be employed to monitor and identify discolored standing trees with PWD, providing an important technical tool for the monitoring and control of PWD.
In this study, three deep learning semantic segmentation models with superior performance, namely DeepLabv3+, HRNet, and DANet, were constructed to obtain the most suitable model for this research task. HRNet can retain high-resolution feature information while performing repetitive fusion of multi-scale feature maps due to its feature extraction [39]. The discolored standing trees with PWD in the Gaofen-2 image provide some detailed information, prompting HRNet to achieve optimal results in this research task with a small number of parameters.
The GAN-based semantic segmentation model GAN_HRNet was constructed by integrating the idea of a GAN on the basis of HRNet, and the accuracy of the semantic segmentation of the generator was improved by adding the discriminator and the adversarial information generated by the generator composed of HRNet.
GAN_HRNet_Semi learns and extracts features from labeled image samples and unlabeled image samples by semi-supervised learning. By adding unlabeled data, the generalization performance of the GAN_HRNet_Semi generator (semantic segmentation model) can be improved, and the model’s ability to extract and segment discolored standing trees with PWD is enhanced. The increase in discriminators and unlabeled data leads to an increase in computation and thus a longer training time for the model and may cause interference with the generator due to the increased adversarial loss of the discriminators. Therefore, the generator is not able to sufficiently learn the data features during the initial training, thus reducing the convergence speed of the model. The results demonstrated that the GAN-based semi-supervised semantic segmentation model GAN_HRNet_Semi improved the segmentation accuracy of PWD discolored standing trees compared with the traditional semantic segmentation model, although it sacrificed the training time and model convergence speed within an acceptable range.
Few studies have applied semi-supervised deep semantic segmentation techniques to remote sensing images for standing tree identification and monitoring of PWD. Of these studies, deep learning techniques have only been applied to UAV remote sensing images for PWD monitoring and classification [40] or to satellite remote sensing images for area identification of PWD [30,31], while research based on semi-supervised deep semantic segmentation of satellite remote sensing images for PWD discolored standing tree identification and monitoring is lacking. Based on Gaofen-2 satellite images, this study used deep learning technology to achieve single location identification of PWD discolored standing trees. The identification results are finer than area identification, which improves the accuracy of PWD satellite remote sensing identification. In this study, a GAN-based semi-supervised semantic segmentation method was applied for the recognition of PWD discolored standing trees, which fully utilized numerous unlabeled sample data from a small amount of manually labeled sample data to reduce the workload of building sample datasets and to further improve the semantic segmentation accuracy of PWD discolored standing trees.
From the semi-supervised deep semantic segmentation technique applied here to the segmentation of discolored standing trees with PWD in satellite remote sensing images, good results were achieved. However, some aspects of this study still need to be improved and extended. First, the accuracy of sample labeling was not sufficient when constructing the sample datasets as the remote sensing feature types and weather conditions in different areas vary; furthermore, the onset of PWD is a gradual process, and the onset characteristics at different stages vary. Second, verification of the results of the identification of discolored standing trees with PWD in the demonstration area was carried out by manual visual interpretation for comparative verification, and the verification results were not very accurate. Third, although the highest spatial resolution of the Gaofen-2 remote sensing images used in this study reached 0.8 m, the spatial resolution was still relatively coarse for the segmentation of PWD discolored trees. Due to the existence of mixed image elements, some discolored trees with small canopy widths might have been missed in the images.

5. Conclusions

Current satellite remote sensing image processing methods based on semi-supervised deep semantic segmentation are less applied to the field of forest diseases and pests, especially in the identification of PWD discolored standing trees. By applying semi-supervised learning to disease and pest monitoring, we can reduce the cost of sample annotation and obtain models with high generalization performance based on limited annotated samples. In this paper, we constructed three semantic segmentation models based on a PWD discolored standing trees dataset for training, selected the optimal model to build the GAN-based semi-supervised semantic segmentation model GAN_HRNet_Semi, and adjusted and optimized the model and its practical application results to perform the application of semi-supervised deep learning for remote sensing recognition of PWD discolored standing trees. The MIoU value in the test set reached 72.02%, and the recall rate in the practical application reached 80.09% in the model. The experimental results show that the GAN-based semi-supervised semantic segmentation model achieved good results in satellite remote sensing image identification and monitoring of PWD discolored standing trees, which can realize macroscopic and accurate monitoring of PWD discolored standing trees, provide information and decision support for the monitoring and control of PWD, and reduce the ecological and economic losses.

Author Contributions

Conceptualization, J.H. and G.F.; methodology, J.W., X.L. and J.Z.; validation, J.W. and J.Z.; formal analysis, X.L.; resources, G.F.; data curation, H.S. and S.W.; writing—original draft, J.Z., X.L. and J.W; writing—review and editing, J.H.; project administration, J.H. and G.F. All authors have read and agreed to the published version of the manuscript.

Funding

This research was supported by the National Key R&D Program of China (2021YFD1400900), the National Key Research and Development Program of China (2019YFA0606600), and the Major Emergency Science and Technology Projects of the State Forestry and Grassland Administration (ZD202001-06).

Data Availability Statement

Gao Fen images (GF-2) can be requested from China Centre for Resources Satellite Data and Application (CRESDA, https://data.cresda.cn/#/2dMap (accessed on 8 October 2022)) and Ground survey site data can be obtained from the Center for Biological Disaster Prevention and Control of the State Forestry and Grassland Administration of China (BDPC, https://www.bdpc.org.cn/ (accessed on 8 October 2022)).

Conflicts of Interest

The authors declare no conflict of interest.

References

  1. Mota, M.M.; Futai, K.; Vieira, P. Pine Wilt Disease and the Pinewood Nematode, Bursaphelenchus Xylophilus. In Integrated Management of Fruit Crops Nematodes; Springer: Dordrecht, The Netherlands, 2009; Volume 4, pp. 253–274. [Google Scholar]
  2. Robinet, C.; Van Opstal, N.; Baker, R.; Roques, A. Applying a spread model to identify the entry points from which the pine wood nematode, the vector of pine wilt disease, would spread most rapidly across Europe. Biol. Invasions 2011, 13, 2981–2995. [Google Scholar] [CrossRef] [Green Version]
  3. Wang, X.; Cao, Y.; Wang, L.; Pu, C.; Li, C. Occurrence and control status of pine wilt diseases. Nat. Enemies Insects 2018, 40, 256–267. [Google Scholar]
  4. Zhang, K.; Liang, J.; Yan, D.; Zhang, X. Research on pine wilt disease in China. World For. Res. 2010, 23, 59–63. [Google Scholar]
  5. Zhai, J.; Lu, L.; Chen, Y. Distribution characteristics and control ideas of pine wood nematode in Xiangshan County, Ningbo. China For. Sci. Technol. 1992, 04, 41–42. [Google Scholar] [CrossRef]
  6. Wang, X.; Wang, Q. A preliminary report on pine wilt diseases in Ma’anshan, Anhui province. Plant Quar. 1989, 260, 5–8. [Google Scholar]
  7. Fang, G.; Huang, W.; Mou, X.; Liu, H.; Zhou, H.; Zhang, J.; Zhang, B.; Li, X.; Chen, Y. Practice and prospect of precise monitoring of pine wilt diseases epidemic. For. Pest Dis. 2022, 41, 16–23. [Google Scholar]
  8. Jiang, M.; Huang, B.; Yu, X.; Zhen, W.; Jin, Y.; Liao, M. Distribution, damage and control measures of pine wilt disease. J. Zhejiang For. Sci. Technol. 2018, 38, 83–91. [Google Scholar]
  9. Ju, Y.; Pan, J.; Wang, X.; Zhang, H. Detection of Bursaphelenchus xylophilus infection in Pinus massoniana from hyperspectral data. Nematology 2014, 16, 1197–1207. [Google Scholar] [CrossRef]
  10. Lee, J.B.; Kim, E.S.; Lee, S.H. An analysis of spectral pattern for detecting pine wilt disease using ground-based hyperspectral camera. Korean J. Remote Sens. 2014, 30, 665–675. [Google Scholar] [CrossRef] [Green Version]
  11. Kim, J.-B.; Jo, M.-H.; Kim, I.-H.; Kim, Y.-K. A Study on the Extraction of Damaged Area by Pine Wood Nematode Using High Resolution IKONOS Satellite Images and GPS. J. Korean Soc. For. Sci. 2003, 92, 362–366. [Google Scholar]
  12. Kim, J.-B.; Park, J.-H.; Jo, M.-H. A Spectral Characteristic Analysis of Damaged Pine Wilt Disease Area in IKONOS Image; Department of Urban Information Engineering, Kyungil University: Kyungbuk, Republic of Korea, 2000. [Google Scholar]
  13. Wang, Z.; Zhang, X.; An, S. Spectral characterization of Pinus sylvestris stands infested with pine wood nematode. Remote Sens. Technol. Appl. 2007, 03, 367–370. [Google Scholar]
  14. Lee, S.-H.; Cho, H.-K.; Lee, W.-K. Detection of The Pine Trees Damaged by Pine Wilt Disease using High Resolution Satellite and Airborne Optical Imagery. Korean J. Remote Sens. 2007, 23, 409–420. [Google Scholar]
  15. Kim, S.-R.; Lee, W.-K.; Lim, C.-H.; Kim, M.; Kafatos, M.C.; Lee, S.-H.; Lee, S.-S. Hyperspectral analysis of pine wilt disease to determine an optimal detection index. Forests 2018, 9, 115. [Google Scholar] [CrossRef] [Green Version]
  16. Kim, S.-R.; Kim, E.-S.; Nam, Y.; Choi, W.I.; Kim, C.-M. Distribution Characteristics Analysis of Pine Wilt Disease Using Time Series Hyperspectral Aerial Imagery. Korean J. Remote Sens. 2015, 31, 385–394. [Google Scholar] [CrossRef] [Green Version]
  17. Xu, P.; Zhou, X.; Yu, A. Sky-land integrated three-dimensional monitoring technology for pine wood nematode disease. Surv. Mapp. 2020, 43, 104–108. [Google Scholar]
  18. Zhang, B.; Ye, H.; Lu, W.; Huang, W.; Wu, B.; Hao, Z.; Sun, H. A Spatiotemporal Change Detection Method for Monitoring Pine Wilt Disease in a Complex Landscape Using High-Resolution Remote Sensing Imagery. Remote Sens. 2021, 13, 2083. [Google Scholar] [CrossRef]
  19. Bright, B.C.; Hudak, A.T.; Egan, J.M.; Jorgensen, C.L.; Rex, F.E.; Hicke, J.A.; Meddens, A.J.H. Using Satellite Imagery to Evaluate Bark Beetle-Caused Tree Mortality Reported in Aerial Surveys in a Mixed Conifer Forest in Northern Idaho, USA. Forests 2020, 11, 529. [Google Scholar] [CrossRef]
  20. Kim, J.-B.; Jo, M.-H.; Oh, J.-S.; Lee, K.-J.; Park, S.-J. Extraction Method of Dam-Aged Area by Pine Wilt Disease (Bursaphelenchus Xylophilus) Using Remotely Sensed Data and Gis. In Proceedings of the ACRS, 2001, 22nd Asian Conference on Remote Sensing, Singapore, 5–9 November 2001. [Google Scholar]
  21. Zhang, T. Research on Remote Sensing Monitoring and Prediction of Pine Wood Nematode Disease in Sanming, Fujian Province. Master’s Thesis, Beijing Forestry University, Beijing, China, 2010. [Google Scholar]
  22. Johnson, B.A.; Tateishi, R.; Hoan, N.T. A hybrid pansharpening approach and multiscale object-based image analysis for mapping diseased pine and oak trees. Int. J. Remote Sens. 2013, 34, 6969–6982. [Google Scholar] [CrossRef]
  23. Takenaka, Y.; Katoh, M.; Deng, S.; Cheung, K. Detecting forests damaged by pine wilt disease at the individual tree level using airborne laser data and worldview-2/3 images over two seasons. Int. Arch. Photogramm. Remote Sens. Spat. Inf. Sci. 2017, XLII-3/W3, 181–184. [Google Scholar] [CrossRef]
  24. Beck, P.S.; Zarco-Tejada, P.; Strobl, P.; San Miguel, J. The feasibility of detecting trees affected by the pine wood nematode using remote sensing. EUR—Sci. Tech. Res. Rep. 2015, 1831–9424. Available online: https://data.europa.eu/doi/10.2788/711975 (accessed on 8 October 2022).
  25. Olegario, T.V.; Baldovino, R.G.; Bugtai, N.T. A Decision Tree-based Classification of Diseased Pine and Oak Trees Using Satellite Imagery. In Proceedings of the 2020 IEEE 12th International Conference on Humanoid, Nanotechnology, Information Technology, Communication and Control, Environment, and Management (HNICEM), Manila, Philippines, 3–7 December 2020; pp. 1–4. [Google Scholar]
  26. Zhang, L.; Zhang, L.; Du, B. Deep learning for remote sensing data: A technical tutorial on the state of the art. IEEE Geosci. Remote Sens. Mag. 2016, 4, 22–40. [Google Scholar] [CrossRef]
  27. Li, W.; Hsu, C.-Y. Automated terrain feature identification from remote sensing imagery: A deep learning approach. Int. J. Geogr. Inf. Sci. 2020, 34, 637–660. [Google Scholar] [CrossRef]
  28. Zhang, C.; Sargent, I.; Pan, X.; Li, H.; Gardiner, A.; Hare, J.; Atkinson, P.M. Joint Deep Learning for land cover and land use classification. Remote Sens. Environ. 2019, 221, 173–187. [Google Scholar] [CrossRef] [Green Version]
  29. Lin, Z.; Ji, K.; Leng, X.; Kuang, G. Squeeze and Excitation Rank Faster R-CNN for Ship Detection in SAR Images. IEEE Geosci. Remote Sens. Lett. 2019, 16, 751–755. [Google Scholar] [CrossRef]
  30. Huang, J.; Lu, X.; Chen, L.; Sun, H.; Wang, S.; Fang, G. Accurate Identification of Pine Wood Nematode Disease with a Deep Convolution Neural Network. Remote Sens. 2022, 14, 913. [Google Scholar] [CrossRef]
  31. Zhou, H.; Yuan, X.; Zhou, H.; Shen, H.; Ma, L.; Sun, L.; Fang, G.; Sun, H. Surveillance of pine wilt disease by high resolution satellite. J. For. Res. 2022, 33, 1401–1408. [Google Scholar] [CrossRef]
  32. Hu, J. Discussion on the prevention and control of pine wilt nematode in Chun’an County. East China For. Manag. 2020, 34, 32–34. [Google Scholar]
  33. Pan, T.; Yu, C.; Xu, G. Thousand island lake area pine nematode disease prevention and control analysis. Prot. For. Sci. Technol. 2019, 02, 90–92. [Google Scholar]
  34. Chen, L.-C.; Zhu, Y.; Papandreou, G.; Schroff, F.; Adam, H. Encoder-Decoder with Atrous Separable Convolution for Semantic Image Segmentation. In Proceedings of the European Conference on Computer Vision (ECCV), Munich, Germany, 8–14 September 2018; pp. 833–851. [Google Scholar]
  35. Goodfellow, I.J.; Pouget-Abadie, J.; Mirza, M.; Xu, B.; Warde-Farley, D.; Ozair, S.; Courville, A.; Bengio, Y. Generative Adversarial Networks. arXiv 2014, arXiv:1406.2661. [Google Scholar] [CrossRef]
  36. Hung, W.-C.; Tsai, Y.-H.; Liou, Y.-T.; Lin, Y.-Y.; Yang, M.-H. Adversarial Learning for Semi-Supervised Semantic Segmentation. arXiv 2018, arXiv:1802.07934. [Google Scholar]
  37. Masters, D.; Luschi, C. Revisiting small batch training for deep neural networks. arXiv 2018, arXiv:1804.07612. [Google Scholar]
  38. McCandlish, S.; Kaplan, J.; Amodei, D.; Team, O.D. An empirical model of large-batch training. arXiv 2018, arXiv:1812.06162. [Google Scholar]
  39. Sun, K.; Xiao, B.; Liu, D.; Wang, J. Deep High-Resolution Representation Learning for Human Pose Estimation. In Proceedings of the IEEE/CVF Conference on Computer Vision and Pattern Recognition, Long Beach, CA, USA, 15–20 June 2019; pp. 5693–5703. [Google Scholar]
  40. Park, H.G.; Yun, J.P.; Kim, M.Y.; Jeong, S.H. Multichannel Object Detection for Detecting Suspected Trees With Pine Wilt Disease Using Multispectral Drone Imagery. IEEE J. Sel. Top. Appl. Earth Obs. Remote Sens. 2021, 14, 8350–8358. [Google Scholar] [CrossRef]
Figure 1. Study area (red dots indicate PWD infestation sites).
Remotesensing 14 05936 g001
Figure 2. GAN-based supervised semantic segmentation model.
Remotesensing 14 05936 g002
Figure 3. Semi-supervised semantic segmentation model based on GANs.
Remotesensing 14 05936 g003
Figure 4. Sample dataset: (a) sample dataset creation details, (b) labeled samples, and (c) unlabeled samples.
Remotesensing 14 05936 g004
Figure 5. Identification results of pine wood nematode monitoring in Shunchang County, Jianou city, and Yanping District. (a) Results of selected swelling prediction, (b) results of manual labeling, (c) results of selected swelling prediction combined with extraction by stand, and (d) results of manual labeling combined with extraction by stand.
Remotesensing 14 05936 g005
Table 1. Remote sensing image data details.
ProvinceNumbers
/Scenes
Resolution/mCloud Percent
/%
Receive TimeCoverage Area /km2
Hubei 31 m<52018.10.041193.87
Fujian31 m<52019.09.191229.23
Zhejiang21 m<52022.05.12770.58
Jiangxi131 m<52019.09.244162.13
Table 2. Performance comparison of three semantic segmentation models.
DeepLabv3+HRNetDANet
MIoU (%)55.5566.3358.43
Parameters41,253,61817,066,87471,730,442
Convergence rate (time)283413
Training time (s)29,68646,82471,859
Table 3. Experimental results of the GAN-based semi-supervised semantic segmentation model.
HRNetGAN_HRNetGAN_HRNet_Semi
MIoU (%)65.2666.5568.36
Parameters17,066,87417,599,74917,599,749
Convergence rate (time)234648
Training time (s)984613,58015,809
Table 4. Results of discriminator structure adjustment.
Start StructureStructure Adjustment 1Structure Adjustment 2
MIoU (%)68.3667.8264.27
Parameters17,599,74917,267,84519,830,597
Convergence rate (time)484050
Training time (s)15,80926,97915,773
Table 5. Model training results under different batch size conditions.
bt2bt4
MIoU (%)70.4268.36
Parameters17,599,74917,599,749
Convergence rate (time)2348
Training time (s)18,89915,809
Table 6. Model training results under different learning rate conditions.
1.0 × 10−11.0 × 10−21.0 × 10−31.0 × 10−41.5 × 10−51.0 × 10−5
MIoU (%)61.1171.6872.0271.4470.4269.41
Parameters17,599,74917,599,74917,599,74917,599,74917,599,74917,599,749
Convergence rate (time)N/A4823402349
Training time (s)18,31518,57618,95318,93518,89918,720
Table 7. Monitoring results of pine wilt nematodes in Shunchang County, Jianou city, and Yanping District.
Inflation PredictionInflation Prediction + Extract by Woodland
Manual labeled (number)25962586
Model prediction (number)30102975
Correct identification (number)20802071
Precision (%)69.1069.61
Recall (%)80.1280.09
F1-score (%)74.2074.48
Publisher’s Note: MDPI stays neutral with regard to jurisdictional claims in published maps and institutional affiliations.

