Abstract
Severe hailstorms frequently occurred in Beijing between May and August 2021, leading to extensive hail damage. These hailstorms were observed by radar and satellite data, and reported by surface observers. In this study, the spectral and cloud microphysical characteristics of typical Beijing events in 2021 were analyzed using Himawari-8 satellite products and ground-based S-band weather radar data obtained from the Beijing Meteorological Bureau. The relationship between Himawari-8 brightness temperature differences (BTD) and radar reflectivity was also investigated. The results revealed that the significant spectral depression of brightness temperatures (BTs) in hail clouds was observed by a satellite. Furthermore, the stronger the radar reflectivity was, the more rapidly BTD decreased, with a nonlinear relationship between them. The results of cloud physical characteristics show that, for cloud-top heights above 10 km, the cloud effective radius was about 25 μm, with a cloud-top temperature of 225 K during these hail events. By means of Gaussian fitting, the BT threshold value (11.2 μm) was determined by satellite at 230 K, with a BTD focused on 1.9 K when hailstorms occurred. These results will help us better understand the characteristics of hailstorms, while also providing information for future hail suppression in Beijing.
1. Introduction
Severe hailstorms in summer are a common meteorological risk in Beijing. They can bring severe damage to agriculture and infrastructure, resulting in serious economic losses [1,2,3,4]. Knowledge on the characteristics of hailstorms is of great importance to meteorologists, weather modification workers and farmers [4,5]. Meteorologists and weather modification workers need it in order to improve their understanding of atmospheric processes and to devise better methods for hail suppression [5]. Farmers require information about hail hazard to take appropriate crop protection measures. Hailstorms in China are usually reported at meteorological stations [6]. However, no continuous, systematic ground observations for hail events are available that cover the Beijing region. Remote-sensing instruments, such as radars and satellites, allow consistent measurements of hail characteristics and intensity across large areas with high spatial and temporal resolution [5,6,7,8]. For example, weather radars are often used to identify hail using radar reflectivity [9,10,11,12,13]. Some researchers pointed out that the 55 dBZ threshold about radar reflectivity factor Z is a reasonable value for indicating the presence of hail [14,15]. Nevertheless, the 45 dBZ threshold has also been used in the past [16,17]. In recent years, radar technology has developed significantly, allowing hail events to be detected and analyzed much more accurately. Nisi et al. analyzed the spatial and temporal distribution of hailstorm in the Alpine based on C-band Doppler radar [8]. Kumjian et al. matched beams and minimal attenuation differences using the dual-X-band-frequency Doppler on Wheels radar to detect hail [18]. Capozzi et al. developed a fuzzy-logic approach for hail detection based on single polarization X-band radar measurements in the Naples metropolitan area [12].
In addition to this, satellite sensors have potential advantages for detecting strong convective updrafts [19,20,21,22,23,24,25,26,27,28,29,30]. Hail clouds are produced in deep convective storms that are characterized by strong updrafts; large, supercooled liquid water content; and high cloud tops [26]. Thus, the overshooting cloud top (OT) may represent a convective updraft suitable for generating hail [27,28]. Consequently, satellites can detect OT by following strong convective updrafts to identify potential hazardous hailstorms across a wide area [29,30]. Particularly, severe hailstorms show an obvious OT signature [5,29], meaning OT satellite detection can be used as an appropriate indicator of hail. Setvák showed that the brightness temperature difference (BTD) between water vapor (WV, 6.2 μm) and IR (10.8 μm) channels from the Meteosat Second Generation (MSG) satellite was a good proxy for overshooting above the coldest cloud top [31]. Bedka et al. proposed a method for identifying the OTs based on the 6 to 7 μm WV channel and the IR channel taken from satellite imagery [32]. Punge et al. developed a hail event dataset for Europe based on the OT algorithm by using MSG-SEVIRI data [5,19]. In recent years, many studies have also found that hailstorms can be accurately captured by combing satellite and radar, improving the effectiveness of statistical analysis and artificial hail suppression [33,34,35,36,37,38,39,40,41]. Auer et al. proposed a hail recognition technique through the combined use of radar reflectivity and cloud-top temperatures (CTT) to forecast hail [33]. Duan et al. reconstructed the radar reflectivity of convective storms by using a deep learning method based on Himawari-8 observations [35]. Gallo et al. identified hail swaths by using satellite data and analyzing their relationships by the means of radars based on a hailstorm event on 9 August 2009 [38].
Beijing lies in northern China, where the weather is usually influenced by the Eurasian continent. In the rainy season, hailstorms occur often in this region. In particular, severe hailstorms occurred more frequently in the summer of 2021 compared with other years. Nevertheless, the detailed characteristics of hail clouds associated with hail events in this area is still unclear, a fact which seriously limits our understanding of scientific hail prediction and suppression. The new generation of the Himawari-8 geostationary meteorological satellite yields a high-quality signal and enhanced spatio-temporal and spectral resolution that is more powerful than that of its predecessors [35]. These characteristics have turned Himawari-8 into an extremely useful tool for understanding convective storms with rapid growth and a short lifetime. Some researchers have used Himawari-8 to investigate the characteristics of convective storms [34,35]. However, few studies have analyzed hail characteristics in the Beijing area by combining Himawari-8 and weather radar data. Up to now, the relationship between the radar and satellite data in this region is also unclear when hailstorms are concerned. The absence of such information may limit effective hail identification and suppression.
Therefore, in this study, the first goal is to investigate hail characteristics over Beijing based on high-resolution Himawari-8 satellite and S-band weather radar data. A second goal is to further analyze the hail identification characteristics of satellite and its relationship with radar reflectivity factors based on severe hailstorm events. Several typical hailstorms in this region that occurred in summer of 2021 are chosen for statistical analysis by using Himawari-8 in combination with radar-based products. The paper is structured as follows: data and methods are described in Section 2, Section 3 presents an analysis of the results, while conclusions and further discussion are provided in Section 4.
2. Materials and Methods
2.1. Data
2.1.1. Himawari-8
Himawari-8 is a next-generation geostationary meteorological satellite, and was launched on 7 October 2014 by the Japan Meteorological Agency (JMA) [42]. The Advanced Himawari Imager (AHI) onboard Himawari-8 is equipped with 16 channels, including visible bands (ranging from 0.47 µm to 0.64 µm), near-infrared bands (ranging from 0.86 µm to 2.3 µm) and infrared bands (ranging from 3.9 µm to 13.3 µm) [35]. The AHI can provide significantly high spatiotemporal resolution observations of the Earth system from space [43]. These advantages make it possible to detect the rapid movement and development of convective clouds.
In this study, Himawari-8 L1 and L2 data from late May to August of 2021 were downloaded by registering on the Japan Aerospace Exploration Agency (JAXA) website (https://www.eorc.jaxa.jp/ptree/, accessed on 5 November 2021); these data were then used to detect hail cases and analyze their characteristics. The infrared bands were of particular interest, especially those at a spatial resolution of 0.05° × 0.05° and a temporal resolution of 10 min. Himawari-8 WV channels can estimate the cloud-top temperature and content of water vapor in two distinct layers of the atmosphere. IR channels (3.9, 8.7, 9.7, 10.8 and 12 μm) can give a good estimation of cloud-top temperature during both the day and the night, essential for cloud system-recognition [35]. Based on Duan et al. [35], Band 07 (3.9 μm), Band 09 (7.0 μm) and Band 14 (11.2 μm) were selected for this study. The BTD between Band 14 and Band 9 (denoted as Band 14−9) was used to identify the developmental characteristics of convective systems [42]. In addition, although the cloud optical depth (COD) and cloud effective radius (CER) are easily affected by the retrieval system (e.g., satellite viewing angle or assumptions made for retrievals), the AHI cloud products can provide variations of the optical and microphysical properties of clouds during the convective cloud generation process [44,45]. Therefore, Himawari-8 L2 cloud products were used to analyze the particular physical characteristics of typical hailstorm events, including cloud-top height (CTH), CTT, COD and CER.
2.1.2. Radar Data
The radar data used in this study were from composited S-band weather radars reflectivity products at the Beijing Meteorological Bureau with a 6 min time interval and a spatial resolution of 500 m. The composited radars from 9 stations: Chanping, Fangshan, Huairou, Mentougou, Miyun, Pinggu, Shunyi, Tongzhou and Yanqing stations in Beijing. Radar images at frequencies of 6 min allow for the accurate determination of the lifetime of the hailstorm. Samples were collected from Beijing and its neighboring regions, in northern China. The latitudinal and longitudinal ranges of this region are 39°N–42°N and 115°E–118°E, respectively. Radar data can be used to determine the strength and variation trends of convective storms. Considering the fact that summer hailstorm events occur frequently in Beijing, 15 convective samples from late May to August were selected to form the dataset. S-band weather radar data were used extensively for hail identification and associated vertical structures.
2.2. Method
Satellite data suggest that highly supercooled water frequently forms below the 243 K threshold, indicating the presence of strong convective updrafts and continental convective storms [20]. However, it is not clear what the brightness temperature (BT) threshold of hailstorms over the Beijing area is. To detect and forecast severe hailstorm cases, the BT threshold should also be considered and determined for this region. Therefore, the BT threshold of the IR (11.2 μm) channel on hailstorm events in 2021 needs to be obtained by the means of statistical analyses. The BTD between the WV and IR channels is supported by the fact that, as the top of a vertically developed cloud approaches the tropopause, it blocks radiation from the troposphere as it attempts to escape into space [20]. The difference between the brightness temperatures (BTs) depends on the actual height of the cloud top and on the amount of stratospheric WV [46]. In this study, The BTD algorithm was used to indicate the variation characteristics of hail clouds.
A Gaussian curve fitting method is used to analyze the distribution trends and threshold of BT and BTD for hailstorm events in Beijing and its neighboring region. In total, 6332 samples were obtained during the summer of 2021. The detailed Gaussian function is as shown in Formula (1):
where , A0 is the height of the Gaussian function, A1 is its center, and A2 is its width (the standard deviation).
To further investigate the relationship between satellite BTD and radar reflectivity factor Z when severe hailstorm events occur, the spatial and temporal resolutions of the two kinds of data needed to be matched. Radar data were firstly sampled on a 0.05° grid to ensure its spatial resolution was consistent with that of the satellite data. Then, the spatial matching method was adopted to classify the radar echoes of 10–60 dBZ in steps of 5 dBZ at the region of interest (ROI), denoted in this study by Beijing and the surrounding regions. Then, the corresponding sample mean values of Z and BTD are calculated at each step. It should be mentioned that the mean Z can provide better results in some cases. Warren and Protat have discussed the use of the mean value of dBZ instead of Z in the past [47]. In this study, hourly radar and satellite data were used. The detailed formulas are listed below as (2) and (3):
where is the mean value of Z, and is the mean value of BTD at the corresponding steps of Z. n is the number of Z or BTD for each step over the Beijing or surrounding regions. i is the step size.
3. Results
3.1. Spatio-Temporal Characteristics of a Typical Hail Case on 1 July 2021
A typical example of a severe hailstorm event, captured by a weather radar of the Beijing Meteorological Administration on 1 July 2021, is displayed in Figure 1. A strong squall line process was observed by radar, lasting from 15:00 to 20:00 BeiJing Time (BJT) in Beijing. It was one of the most destructive hailstorms in the summer of 2021, influencing a large area and producing hailstones with a maximum diameter of 3.2 cm. From Figure 1, it can be seen that the squall line moved from northwest to southeast, impacting the Beijing, Hebei and Tianjin area. Radar reflectivity factor Z greater than 55 dBZ can indicate the presence of severe hailstorms [14,15]. From Figure 1, hailstorms in Beijing can be identified by high Z, especially at 16:00–18:00 BJT. At the same time, through a comparison with multiple infrared images between 16:00–18:00 BJT, the lower brightness temperature values from the Himawari-8 infrared image (11.2 μm) in Figure 2 may indicate the existence of convective clouds. From Figure 2, The intense convective clouds obviously impacted the Himawari-8 infrared BTs, which were lower than 230 K when convective updrafts occurred. The spatial pattern of the Himawari-8 was mostly consistent with the composited radar reflectivity factors. The average rainfall in the period from 14:00–20:00 BJT in this area was up to 20.6 mm on that day, with the maximum rain intensity even reaching as high as 89.5 mm per hour at the PingGu measurement station.
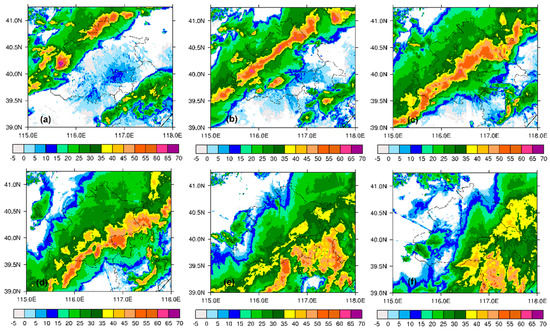
Figure 1.
Spatial distribution of hourly composited S-band radar reflectivity factor Z (unit: dBZ) in Beijing on 1 July 2021. (a–f) Radar reflectivity factors at 15:00–20:00 BJT.
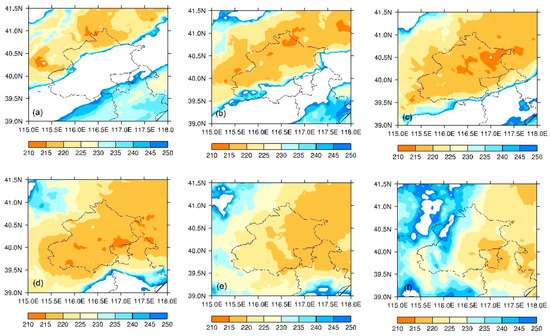
Figure 2.
Spatial distribution of hourly satellite brightness temperatures (BTs, unit: K) from Himawari-8 in Beijing on 1 July 2021. (a–f) Infrared BTs (11.2 μm) at 15:00–20:00 BJT.
To investigate the spectral characteristics of hail clouds, the Himawari-8 BTs of channel 9 and 14 transecting at the northern latitude 40.5° are depicted in Figure 3 at 14:00−20:00 BJT on 1 July 2021. The strong convections in Beijing had a large impact on the Himawari-8 BTs, causing them to reach very low values when approaching the storm core. For channel 9: BT15hour = 242.16 K, TB16hour = 217.21 K, TB17hour = 216.71 K, TB18hour = 218.91 K, and TB19hour = 219.84 K. For channel 14: BT15hour = 260.87 K, TB16hour = 217.03 K, TB17hour = 216.60 K, TB18hour = 218.96 K, and TB19hour = 219.91 K. The BTs in two channels (9, 14) in Figure 3 rapidly decreased from 15:00 BJT, showing their high sensitivity to the presence of hail cloud. In particular, channel 14 (11.2 μm) exhibited relatively high BT variation relative to those in channel 9 (7.0 μm). However, the BT at channels 14 and 9 gradually began to rise, starting at around 19:00 BJT when the strong convection started to fade away.
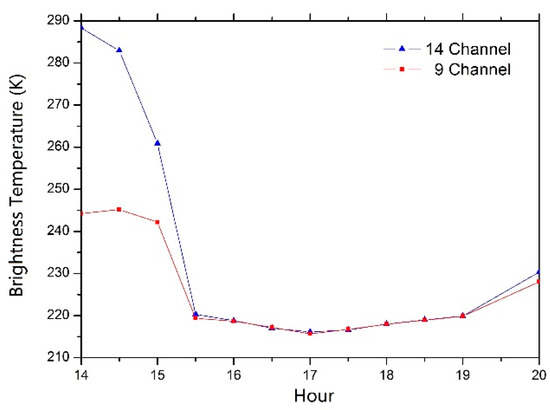
Figure 3.
Time series variation of BTs in channels 9 (7.0 μm) and 14 (11.2 μm) transecting the main core of the hailstorm for the analyzed case study on 1 July 2021.
The BTD between the WV and IR channels was a good indicator for deep convection [31]. In subsequent hail events, Himawari-8 IR 11.2 μm and WV 7.0 μm channels will be explored to further interpret the characteristics of hail clouds.
Based on satellite retrieval data, the cloud physical characteristics during a hail event on 1 July 2021 were analyzed for this study. Figure 4 shows the spatial distribution of CTH and the relationship between the CTT and CER from the Himawari-8 satellite at 13:30 BJT on that day. From Figure 4a, before the hailstorm arrived over Beijing, the CTH reached up to 12 km. Figure 4b further reveals the relationship between the CTT and CER within this region in Figure 4a. The result shows that the CER was mostly below 20 μm when the cloud-top temperature varied from 215 K to 230 K at 13:30 BJT during this hail event. This indicates that small particles could be found before the hailstorm arrived over Beijing, which may be consistent with Rosenfeld et al. [48,49]. Their theory pointed out that the stronger the updraft in the convective cloud, the shorter the time for cloud droplet collision and growth. This would also delay the crystallization process, finally resulting in the inhibition of effective particle growth [48,49].
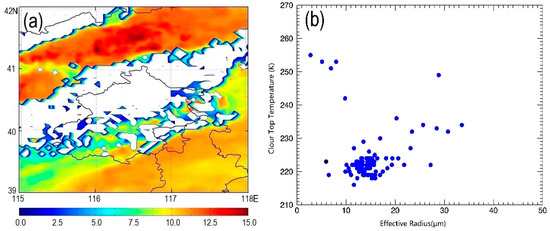
Figure 4.
Spatial distribution of cloud-top height (CTH, unit: km) and the relationship between cloud-top temperature (CTT, unit: K) and cloud effective radius (CER, unit: μm) retrieved from the Himawari-8 satellite over the Beijing region at 13:30 BJT on 1 July 2021. (a) CTH from Himawari-8 at 13:30 BJT on 1 July 2021; (b) CTT as a function of CER at 13:30 BJT on 1 July 2021 over the corresponding area in (a).
3.2. Comparison of Characteristics for Typical Hail Events
A comprehensive analysis of hailstorm information during 2021 in Beijing was carried out. First, all hail events that occurred over Beijing from late May to August 2021 were summarized in terms of hail size, precipitation, location, duration and hail period. A total of 15 hail events in Beijing are listed in Table 1. For simplicity, the specific location names are abbreviated: MenTouGou as MTG, FangShan as FS, ShiJingShan as SJS, YanQin as YQ, ChangPing as CP, HaiDian as HD, ChaoYang as CY, FengTai as FT, DaXing as DX, TongZhou as TZ, MiYun as MY, PingGu as PG, ShunYi as SY and HuaiRou as HR.

Table 1.
Hailstorm information from May to August 2021 in Beijing.
Table 1 shows the hailstorm information that occurred over Beijing from late May to August 2021. It is worth noting that the value of precipitation selected for each hail event was taken as the maximum value among the weather stations affected by the storms. From Table 1, large hailstones with diameters from 0.5 to 4.5 cm were produced during the 15 hail events. Moreover, all of the 15 hail events took place in the afternoon and evening. The highest hail frequency and maximum duration occurred in June. Furthermore, the largest hail size was observed on 25 June at 4.5 cm. The hail samples on 25 and 30 June 2021 were also obtained from the YanQing observation station, as shown in Figure 5. The hail shapes were different from the two cases in Figure 5. The maximum precipitation for these hail events occurred in July. The largest precipitation area was observed on 1 July, during a storm which swept through seven regions including FS, HR, CP, MTG, HD, SY, CY, PG and DX. By considering the precipitation, hail size, duration and locations, four typical hail events on 25 June, 30 June, 1 July and 9 August will be further analyzed, compared and discussed in the next sections.
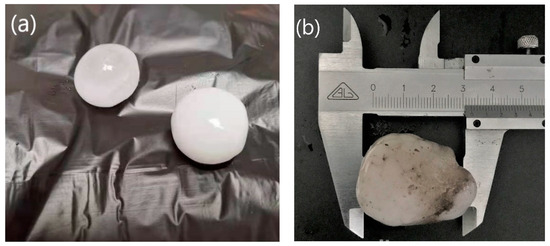
Figure 5.
Hail samples taken at YanQing observation station. (a) Hail samples from 25 June 2021; (b) hail samples and measurements from 30 June 2021.
3.2.1. Comparison of Spatial Characteristics for Hail Events Based on Weather Radar
Four severe hailstorm events were compared based on composited weather radar in terms of their spatial distribution and vertical structures. These were the hail events at 20:00 BJT on 25 June 2021, 16:00 BJT on 30 June 2021, 16:00 BJT on 1 July 2021 and 17:00 BJT on 9 August 2021, as depicted in Figure 6 and Figure 7. Among these cases, cloud precipitation on 25 June and 1 July consisted of systematic convective cloud with squall lines observed by S-band weather radar in Figure 6, while isolated convective cloud clusters were dominant on 30 June and 9 August. Table 1 shows that the maximum precipitation was found to be 79.3 mm, 69.4 mm, 89.5 mm and 10.5 mm, respectively, for these hail events. The result implies that the squall lines for hail events on 25 June and 1 July were accompanied by extensive regions of heavy rainfall. As shown by Figure 7, the heights of the strong convective clouds reached up to 12 km for these hail events, especially on 1 July, where they even went above 12 km. The result in Figure 7 reveals that the cloud heights had a certain directive significance on hail clouds. From Figure 6, high radar reflectivity factor Z was found in these four cases, indicating the existence of hail. Correspondingly, Figure 8 shows the spatial distribution of hail for these four events, which was consistent with the high Z regions seen in Figure 6. Figure 9 shows the vertical cross section of hail and non-hail derived from S-band radar. The height distribution of hail clouds was different for these cases, varying from 3 km to 12 km. Meanwhile, the height of hail occurring on 25 June was the highest, and was also accompanied by the largest hailstone size (4.5 cm) shown in Table 1. This reveals that the height of hail clouds may be related to hailstone size, a question which requires further investigations in the future.
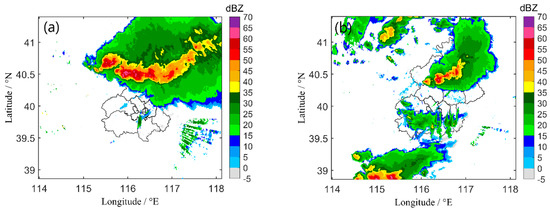
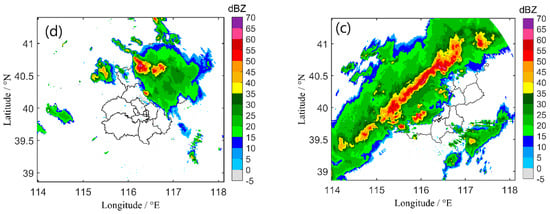
Figure 6.
Composited S-band radar reflectivity factor Z (unit: dBZ) in Beijing. (a) Z at 20:00 BJT on 25 June 2021; (b) Z at 16:00 BJT on 30 June 2021; (c) Z at 16:00 BJT on 1 July 2021; (d) Z at 17:00 BJT on 9 August 2021.
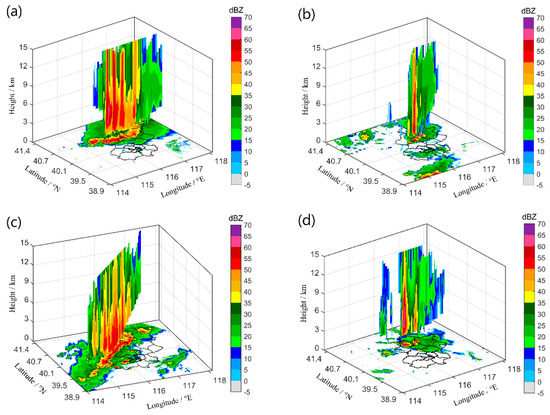
Figure 7.
Vertical cross section of Z for different heights (unit: km) during a hailstorm in Beijing. (a) Vertical cross section of Z at 20:00 BJT on 25 June 2021; (b) vertical cross section of Z at 16:00 BJT on 30 June 2021; (c) vertical cross section of Z at 16:00 BJT on 1 July 2021; (d) vertical cross section of Z at 17:00 BJT on 9 August 2021.
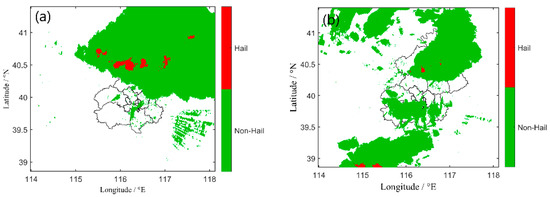
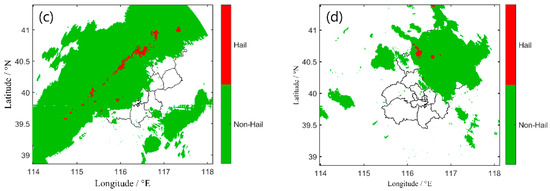
Figure 8.
Hail−bearing locations according to radar data from Beijing. (a) Hail−bearing locations from the radar at 20:00 BJT on 25 June 2021; (b) hail−bearing locations from the radar at 16:00 BJT on 30 June 2021; (c) hail−bearing locations from the radar at 16:00 BJT on 1 July 2021; (d) hail−bearing locations from the radar at 17:00 BJT on 9 August 2021.
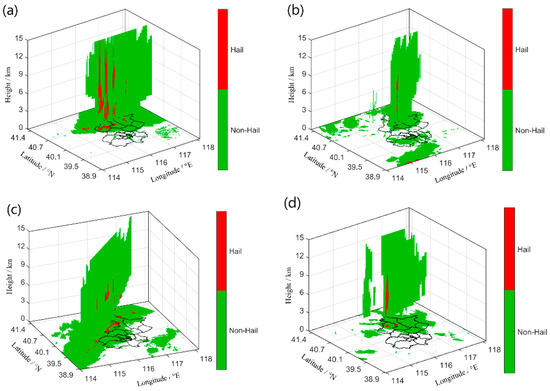
Figure 9.
Vertical cross section of hail (unit: km) derived from the radar in Beijing. (a) Vertical cross section of hail derived from the radar at 20:00 BJT on 25 June 2021; (b) vertical cross section of hail derived from the radar at 16:00 BJT on 30 June 2021; (c) vertical cross section of hail derived from the radar at 16:00 BJT on 1 July 2021; (d) vertical cross section of hail derived from the radar at 17:00 BJT on 9 August 2021.
3.2.2. Comparison of Spectral Characteristics for Hail Events
The Himawari-8 channel 7 (3.9 μm) is a shortwave infrared window indicating low clouds or fog. Channel 9 (7.0 μm) can estimate water vapor contents in the atmosphere. Channel 14 (11.2 μm) can give a good estimation of cloud-top temperature [35]. Here, the BTs of these three channels (3.9 μm, 7.0 μm and 11.2 μm, respectively) measured by Himawari-8 are shown in Figure 10, transecting at the northern latitude 40.5° and crossing the main core of the hailstorm for the events that occurred on 25 June, 30 June, 1 July and 9 August. As expected, the Himawari-8 satellite signal near the hailstorm reveals that the BTs rapidly dropped when they approached the hail cloud. Several differences characterized each hailstorm event. However, the four plates display an overall decrease in BT in each case. All three channels from the Himawari-8 exhibited high sensitivity to the hail, showing large BT reductions. In particular, the signal dropped down to BT < 230 K for channel 9 and channel 14 when it approached the hail cloud. Nevertheless, the dropping trend for channel 7 is obviously lower than these two channels. By comparing the individual response of all three channels, it can be said that the difference (BT14–BT9) oscillated significantly when hailstorm was captured. This phenomenon was consistent with results obtained by other researchers [30,50]. Therefore, Himawari-8 IR 11.2 μm and WV 7.0 μm channels will be explored further in this study, in order to interpret hail clouds more clearly.
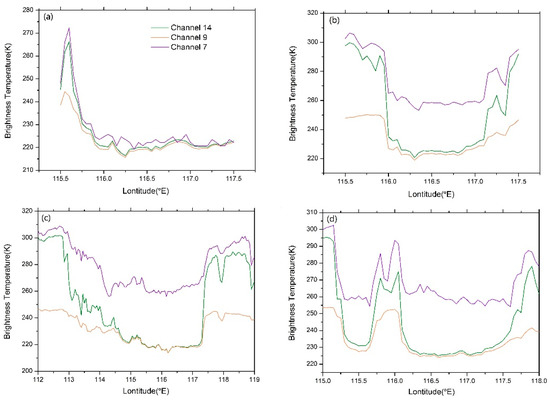
Figure 10.
Brightness temperature (BT) distribution (channel 7: violet line; channel 9: orange line; channel 14: olive line) along transects (40.5°N) crossing the main core of the hailstorm in the longitudinal direction for the analyzed case studies. (a) BT at 20:00 BJT on 25 June 2021; (b) BT at 16:00 BJT on 30 June 2021; (c) BT at 16:00 BJT on 1 July 2021; (d) BT at 17:00 BJT on 9 August 2021.
The brightness temperature differences (BTDs) were calculated and obtained from channel 14 and channel 9 along transects (40.5°N) crossing the main core of the hailstorm for the events of 25 June 20:00 BJT, 30 June 16:00 BJT, 1 July 16:00 BJT and 9 August 17:00 BJT. From Figure 11, the BTDs of these hail events show high sensitivity in capturing hail cloud features. This sensitivity was clearly seen in Figure 11 where the hail clouds could be easily identified from the radar image. The average BTD values were mostly located at 0–2.0 K for the hailstorm region. In addition, the BTD shape on 30 June was similar to that on 1 July and 9 August, as shown by Figure 11, which rapidly decreased when it approached the hail core, and then increased quickly along the longitudinal line. However, it was different from the shape on 25 June. This may be related to the spatial pattern of hail events and other meteorological factors. Additionally, the radar reflectivity Z along longitudinal transects at the point of 40.5°N was also shown in Figure 12. Compared with the spectral variations of BTD, the radar Z shows a roughly opposite trend. Z was higher when the BTD was lower. At the same time, it seems that the BTD shows a slightly earlier spectral reduction than the enhancement of radar Z. The result indicates that the cloud-top information taken from satellite observation seems to be better at forecasting severe convective weather in advance than the radar. However, the radar Z may provide more detailed changes when indicating hail. For example, the spectral value at 116°E–117°E on 30 June focused on 0–2 K when crossing the main core of the hailstorm, but the radar Z also displayed some obvious shake variations over these regions, which may depict the variations of hail cloud in detail. The result implies that there may be some limitations when only relying on BTD, or a single channel, to identify hailstorm. It is important to combine both satellite and radar data in order to accurately predict hail.
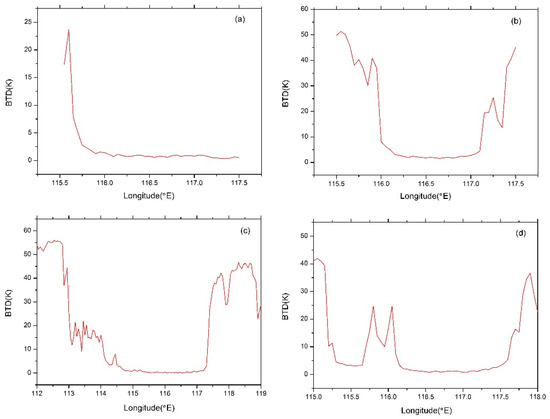
Figure 11.
Brightness temperature difference (BTD) distribution along transects (40.5°N) crossing the main core of the hailstorm in the longitudinal direction for the analyzed case studies. (a) BTD on 25 June 2021; (b) BTD on 30 June 2021; (c) BTD on 1 July 2021; (d) BTD on 9 August 2021.
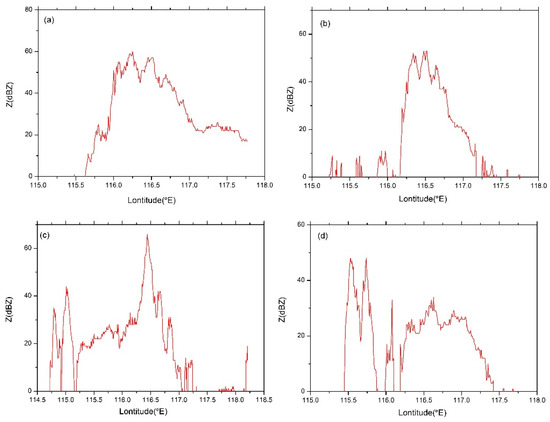
Figure 12.
Radar reflectivity factor Z distribution along transects (40.5°N) crossing at the main core of the hailstorm in the longitudinal direction for the analyzed case studies. (a) Radar Z at 20:00 BJT on 25 June 2021; (b) radar Z at 16:00 BJT on 30 June 2021; (c) radar Z at 16:00 BJT on 1 July 2021; (d) radar Z at 17:00 BJT on 9 August 2021.
3.2.3. Relationship between Satellite BTD and Radar Reflectivity for Hail Events
The BTDs from Himawari-8 IR 11.2 μm and WV 7.0 μm have high sensitivity to hailstorms, while weather radar data can detect localized hail events [11]. It is of great importance to understand the relationship between them to construct a more accurate hail identification algorithm. To investigate the correlation between satellite BTD and radar reflectivity factor Z, four typical hail events were analyzed in this study, involving the time periods of 21:00–22:00 BJT 25 June, 21:00 BJT 30 June, 16:00–17:00 BJT 1 July and 16:00–17:00 BJT 9 August. The satellite and radar data were first extracted and processed using the spatial matching method as described in Section 2. The result in Figure 13 suggests that the relationship between satellite BTD and radar reflectivity was not linear. The BTDs gradually decreased with increasing radar reflectivity. From Figure 13, BTDs displayed a rapid reduction when radar reflectivity factors were around 10–20 dBZ, showing marked exponential variations with the radar data on 25 June and 1 July, which were different from the variation trends of the correlation lines on 30 June and 9 August. This may be related to the particular weather system, such as the squall line on 25 June and 1 July. Furthermore, BTDs were mainly distributed around 0–2 K when radar echo reflectivity was greater than 55 dBZ. This indicates that satellite BTD and radar reflectivity have a certain correlation when hailstorms occur. Physically, both Himawari-8 and weather radar observations provide information on hail clouds, respectively. However, The BTD from Himawari-8 reflects the variation of cloud-top information, while the reflectivity based on weather radar is related to the size, number and phase state of precipitation particles. This study implies that it may be useful for improving and optimizing the accuracy of a hail identification algorithm by combining radar with satellite data in the future.
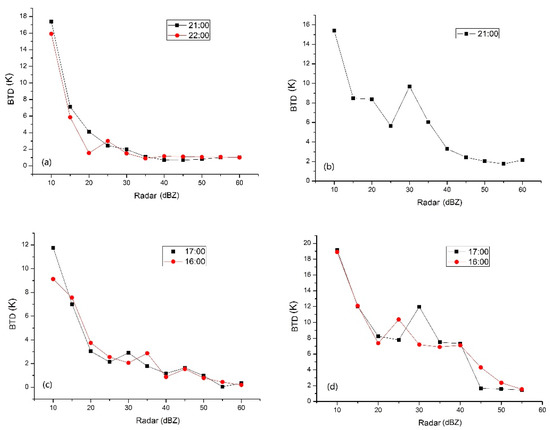
Figure 13.
Relationship between satellite BTD and radar reflectivity factors Z for the analyzed case studies. (a) Relationship between BTD and Z on 25 June 2021; (b) relationship between BTD and Z on 30 June 2021; (c) relationship between BTD and Z on 1 July 2021; (d) relationship between BTD and Z on 9 August 2021.
3.2.4. Cloud Physical Characteristics during Hail Events
The height of convective clouds in hail events can reach up to or greater than 10 km, based on the radar observations seen in Figure 7. The variation in cloud physical characteristics is not yet clear, especially for CTH greater than 10 km and the differences relative to those below 10 km. Therefore, to evaluate the physical characteristics of these hail events, we also calculated the means of COD, CER and CTT on 25 June, 30 June, 1 July and 9 August 2021 based on CTH greater or lower than 10 km. Since the Himawari-8 L2 cloud data only involve daily products, the mean value is based on daytime data for hail events. Figure 14 shows the variability of the mean values of COD over Beijing and the surrounding regions when CTH is greater or lower than 10 km. From Figure 14, the mean values of COD were significantly larger for all hailstorm events when CTH was above 10 km. Particularly on 1 July 2021, the mean values of COD reached up to 64.88—6.5 times the value of CTH observed below 10 km on that day. The results for COD indicate strong scattering effects of hail clouds on these cases when compared with those for CTH below 10 km. On the contrary, the mean values of CER for these hailstorm events were slightly lower, and mainly concentrated below 25 μm for CTH greater than 10 km, as shown in Figure 15. This illustrates that the effects of hail clouds were extremely significant on cloud droplet collision and growth, resulting in the inhibition of effective particle growth, a fact which is consistent with Rosenfeld et al. [48,49]. For CTH above 10 km, the mean CTT values shown in Figure 16 were around 225 K for clouds above 10 km. The result that the CTT of hail clouds is generally smaller could suggest that this value can serve as an indicator for forecasting and identifying hail events.
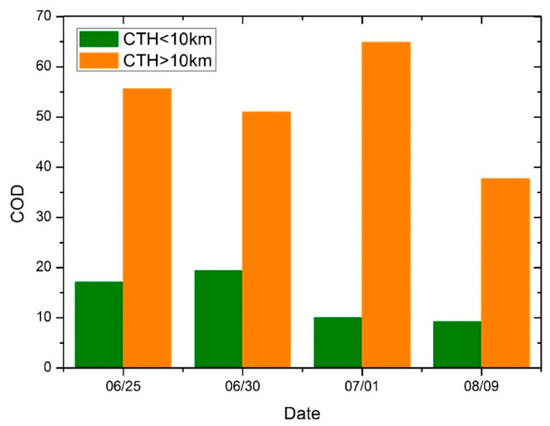
Figure 14.
Comparison of the cloud optical depth (COD) over the CTH > 10 km region (orange bar) and CTH < 10 km region (green bar). Histograms are for 25 June, 30 June, 1 July and 9 August 2021.
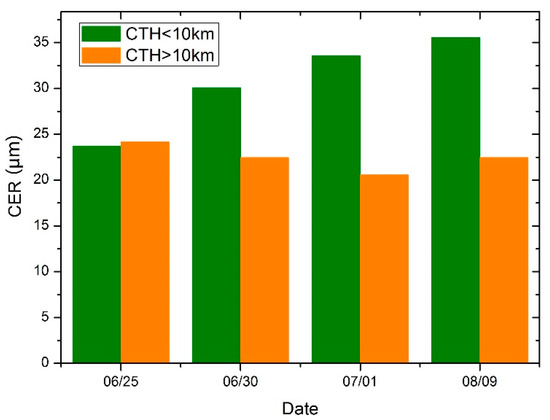
Figure 15.
Comparison of the cloud effective radius (CER) over the CTH > 10 km region (orange bar) and CTH < 10 km region (green bar). Histograms are for 25 June, 30 June, 1 July and 9 August 2021.
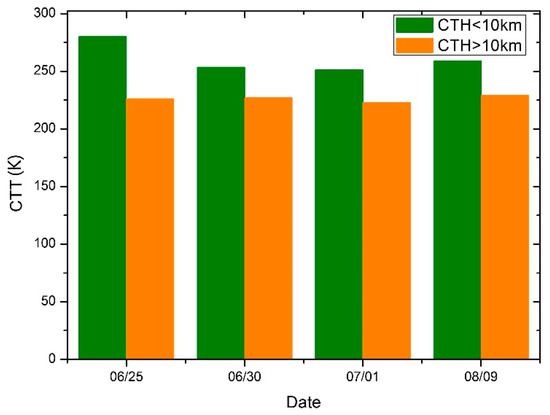
Figure 16.
Comparison of the cloud-top temperature (CTT) over the CTH > 10 km region (orange bar) and CTH < 10 km region (green bar). The histograms are for 25 June, 30 June, 1 July and 9 August 2021.
4. Discussion
4.1. Comparison of Cloud-Top Heights from Satellite and Echo Top Heights from Weather Radar
Ground-based weather radar has the ability to monitor hail cloud processes from bottom to up, which includes certain information about echo reflectivity and echo top height (ETH). The ETH from weather radar is defined as the maximum height of the minimum detectable echo, which thus, implies the CTH at a certain area [45]. The Himawari-8 satellite has some great advantages due to its high spatio-temporal resolution over a large area, enabling it to detect the rapidly changing cloud parameters (e.g., CTH) during the growth process of hail clouds [45]. Different from weather radar, the space-based Himawari-8 is able to provide the cloud-top information for hail clouds. Here, the difference between the CTH from the Himawari-8 data and the echo top height (ETH) from composited weather radar measurements is compared and discussed in the selected area between 116°E–117.5°E and 40°N–40.5°N on 1 July 2021. The color bar in Figure 17 is the density of the pixels in the observed data. Figure 17a,b show the CTH at 10 min observation frequency and the ETH at 6 min observation frequency as a function of observation time in the selected area. From Figure 17a, the satellite CTH increases significantly with the growth of the hail clouds after the observation at 15:00 BJT. Most of the hail cloud pixels from the CTH data changed from 10 to 16 km after 15:30 BJT. The CTH at lower levels (below 5 km) was not considered in this hail event. In Figure 17b, most ETH values increased from 8 to 12 km after the observation at 15:00 BJT. The CTH values from Himawari-8 were higher than the ETH values obtained from weather radar shown in Figure 17. Additionally, the increasing trend of the CTH is more obvious than that of the ETH. Although there were some differences in their magnitudes, the variation trend of the CTH from Himawari-8 was in relatively good agreement with the ETH taken from the radar measurements. The result indicates that Himawari-8 has the potential to monitor variations of the cloud microphysical properties for hail clouds. The result also implies that it is meaningful for monitoring the growth of the hail cloud as well as interpreting general hail characteristics by combining weather radar with satellite.

Figure 17.
Cloud-top height (CTH) taken from the satellite and echo top height (ETH) from the weather radar as a function of observation time in the selected area between 116°E–117.5°E and 40°N–40.5°N on 1 July 2021; the color bar indicates the density of the image pixels in the observed data. (a) CTH from the Himawari-8 data. (b) ETH based on the composited weather radar.
4.2. Threshold Characteristics for BT and BTD
The BT and BTD threshold characteristics of satellite IR bands can be used to identify and track hail clouds with high spatial and temporal resolutions. To investigate the identification characteristics of hail clouds over the Beijing region, histograms of the pixel-level BTs and BTDs for five typical hail cases in the summer of 2021 including 22 May, 25 June, 30 June, 1 July and 9 August were calculated in this study, as shown in Figure 18 and Figure 19. A Gaussian fitting method was used to fit and estimate the pixel peak and center of the observed BT and BTD data points. The detail Gaussian function is described in Section 2. From Figure 18, the Gaussian bell-shaped curve center position of BT is determined at 229.66 K—this illustrates the brightness temperature, which is distributed around 230 K for these hail events. This result is relatively consistent with existing research, such as Silva et al. [20]. From Figure 19, the Gaussian bell-shaped curve center position of BTD is at 1.9 K. On the right side of the peak, the tail of the curve quickly falls off and approaches the x-axis. This result implies that the BTD threshold for hail clouds can be around 1.9 K.
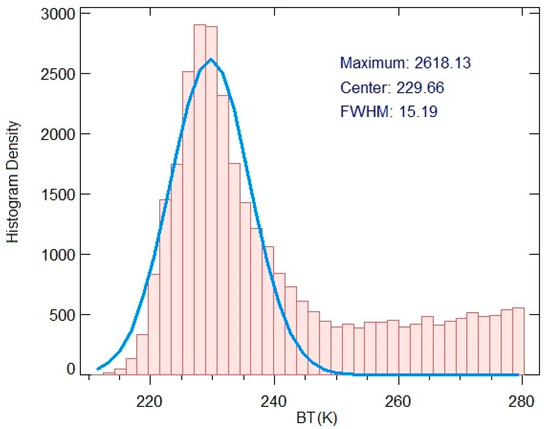
Figure 18.
Histogram of BTs for typical hailstorm events by using the Gaussian fitting method over the Beijing region.
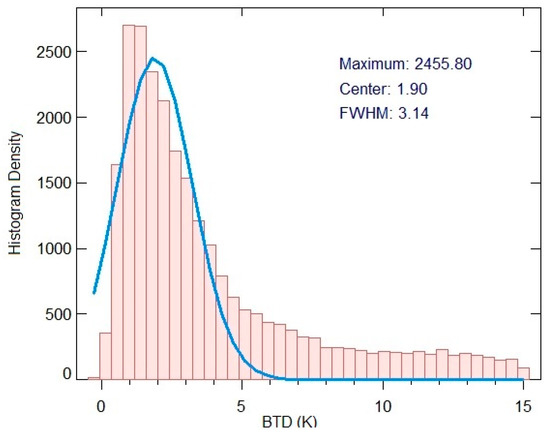
Figure 19.
Histogram of BTDs for typical hailstorm events over the Beijing region.
The results from Figure 18 and Figure 19 reveal that the determination of the threshold of BT and BTD has some directive significance for the identification of hail clouds. However, a small number of hail events may not be sufficient to represent all forms of hail weather in Beijing. Nevertheless, satellite observations can cover larger areas in comparison with radar, which can establish the relationship with radar Z to identify severe hail events more accurately. In future studies, sufficient hail case data from satellite observation will be considered so that the joint recognition algorithm can be devised that includes both satellite and radar data.
5. Conclusions
This study analyzed the characteristics of hailstorms in Beijing during the period from late May to August 2021 using satellite data from Himawari-8 and radar data from Beijing Meteorological Bureau. A total of 15 hail events were collected in the summer of 2021. Of these, four typical hail cases were discussed in detail, looking at the key features of strong convection, heavy rainfall and large hailstone sizes. The BTDs were derived from Himawari-8 BTs at channel 14 (11.2 μm) and channel 9 (7.0 μm) to detect hail clouds and analyze the spectral variation of the hail events, occurring on 25 June, 30 June, 1 July and 9 August 2021. By comparing their spectral variations, the results showed that the spectral lines of these hail events dropped rapidly when they approached the hailstorm core. They also illustrate that the BTs became significantly lower for hail clouds, most of which were located below 230 K. However, obvious differences from spectral shapes were also observed in different hail cases, which may be due to different spatial patterns and weather conditions. The physical characteristics of these hail clouds were investigated for all of these cases, including CTT, COD and CER. When CTH was higher than 10 km, the CTT values observed on 25 June, 30 June, 1 July and 9 August 2021 were mostly lower than 225 K; the CER was less than 25 μm, which was consistent with Rosenfeld et al. [48]. In addition, the BT threshold was determined by Gaussian fitting at 230 K, while the BTD threshold was found to be with 1.9 K for these hail events. The results will be useful for better understanding the characteristics of hailstorms and for predicting future hailstorms; this may also help to improve hail suppression efforts over the Beijing region.
The findings of this study show that there were some differences in magnitudes between Himawari-8 CTH and ETH from radar measurements, but their variation trends performed relatively good agreement. A nonlinear relationship was also found between the radar reflectivity and satellite BTD. However, the dataset obtained is not large enough to statistically analyze the regression variations for severe hailstorms. In addition, machine learning technology will provide more accurate hail detection by combined radar and satellite observations. In future studies, the derived statistics based on machine learning technology will progressively improve our understanding of hailstorms in and around the Beijing region.
Author Contributions
The work presented in this paper was carried out in a collaboration between all authors. Conceptualization, Y.J. and Y.C.; methodology, Y.J. and Y.C.; software, Y.J. and Y.C.; formal analysis, Y.J. and Y.C.; resources, X.M., J.M., X.L., N.M. and K.B.; data curation, Y.J. and Y.C.; writing—original draft preparation, Y.J., Y.C., X.M., J.M., X.L., N.M. and K.B.; writing—review and editing, Y.J., Y.C., X.M., J.M., X.L., N.M. and K.B. All authors have read and agreed to the published version of the manuscript.
Funding
This research was funded by National Key R&D Program of China (Grant No. 2019YFC1510301), special program of innovation and development, China Meteorological Administration (Grant No. CXFZ2021J038), the National Natural Science Foundation of China (Grant No. 42075092) and the Science and Technology Project of Beijing Meteorological Bureau of China (Grant No. BMBKJ202003013).
Data Availability Statement
Not applicable.
Acknowledgments
We acknowledge the P-Tree System of Japan Aerospace Exploration Agency for providing Himawari-8/AHI data that are used in this paper. The authors also acknowledge Beijing Meteorological Administration for supplying the Radar, rainfall and hail data.
Conflicts of Interest
The authors declare no conflict of interest.
References
- Liu, D.; Feng, G.; Wu, S. The characteristics of cloud-to-ground lightning activity in hailstorms over northern China. Atmos. Res. 2009, 91, 459–465. [Google Scholar] [CrossRef]
- Li, X.; Zou, T.; Lin, J.; Kong, H.; Ren, Z. Decreased hail size in China since 1980. Sci. Rep. 2017, 7, 10913. [Google Scholar]
- Wapler, K. The life-cycle of hailstorms: Lightning, radar reflectivity and rotation characteristics. Atmos. Res. 2017, 193, 60–72. [Google Scholar] [CrossRef]
- Punge, H.J.; Kunz, M. Hail observations and hailstorm characteristics in Europe: A review. Atmos. Res. 2016, 176, 159–184. [Google Scholar] [CrossRef]
- Punge, H.J.; Bedka, K.M.; Kunz, M.; Bang, S.D.; Itterly, K.F. Characteristics of hail hazard in South Africa based on satellite detection of convective storms. Nat. Hazards Earth Syst. Sci. Discuss. 2021, 1–32. [Google Scholar] [CrossRef]
- Li, M.; Zhang, Q.; Zhang, F. Hail day frequency trends and associated atmospheric circulation patterns over China during 1960–2012. J. Clim. 2016, 29, 7027–7044. [Google Scholar] [CrossRef]
- Allen, J.; Giammanco, I.M.; Kumjian, M.R.; Punge, H.J.; Zhang, Q.; Groenemeijer, P.; Kunz, M.; Ortega, K. Understanding hail in the earth system. Rev. Geophys. 2020, 58, e2019RG000665. [Google Scholar] [CrossRef]
- Nisi, L.; Martius, O.; Hering, A.; Kunz, M.; Germann, U. Spatial and temporal distribution of hailstorms in the Alpine region: A long-term, high resolution, radar-based analysis. Q. J. R. Meteorol. Soc. 2016, 142, 1590–1604. [Google Scholar] [CrossRef]
- Holleman, I. Hail Detection Using Single-Polarization Radar; Ministerie van Verkeer en Waterstaat, Koninklijk Nederlands Meteorologisch Instituut: De Bilt, The Nederlands, 2001. [Google Scholar]
- Anderson, M.E.; Carey, L.D.; Petersen, W.A.; Knupp, K.R. C-band dual-polarimetric radar signatures of hail. Electron. J. Oper. Meteor. 2011, 12, 1–30. [Google Scholar]
- Lukach, M.; Foresti, L.; Giot, O.; Delobbe, L. Estimating the occurrence and severity of hail based on 10 years of observations from weather radar in Belgium. Meteorol. Appl. 2017, 24, 250–259. [Google Scholar] [CrossRef]
- Capozzi, V.; Picciotti, E.; Mazzarella, V.; Marzano, F.S.; Budillon, G. Fuzzy-logic detection and probability of hail exploiting short-range X-band weather radar. Atmos. Res. 2018, 201, 17–33. [Google Scholar] [CrossRef]
- Stržinar, G.; Skok, G. Comparison and optimization of radar-based hail detection algorithms in Slovenia. Atmos. Res. 2018, 203, 275–285. [Google Scholar] [CrossRef]
- Trefalt, S.; Martynov, A.; Barras, H.; Besic, N.; Hering, A.M.; Lenggenhager, S.; Noti, P.; Röthlisberger, M.; Schemm, S.; Germann, U.; et al. A severe hail storm in complex topography in Switzerland-Observations and processes. Atmos. Res. 2018, 209, 76–94. [Google Scholar] [CrossRef]
- Stefan, S.; Barbu, N. Radar-derived parameters in hail-producing storms and the estimation of hail occurrence in Romania using a logistic regression approach. Meteorol. Appl. 2018, 25, 614–621. [Google Scholar] [CrossRef]
- Aran, M.; Sairouni, A.; Bech, J.; Toda, J.; Rigo, T.; Cunillera, J.; Moré, J. Pilot project for intensive surveillance of hail events in Terres de Ponent (Lleida). Atmos. Res. 2007, 83, 315–335. [Google Scholar] [CrossRef]
- Pilorz, W.; Zięba, M.; Szturc, J.; Łupikasza, E. Large hail detection using radar-based VIL calibrated with isotherms from the ERA5 reanalysis. Atmos. Res. 2022, 274, 106185. [Google Scholar] [CrossRef]
- Kumjian, M.R.; Richardson, Y.P.; Meyer, T.; Kosiba, K.A.; Wurman, J. Resonance scattering effects in wet hail observed with a dual-X-band-frequency, dual-polarization Doppler on Wheels radar. J. Appl. Meteorol. Climatol. 2018, 57, 2713–2731. [Google Scholar] [CrossRef]
- Punge, H.J.; Bedka, K.M.; Kunz, M.; Werner, A. A new physically based stochastic event catalog for hail in Europe. Nat. Hazards 2014, 73, 1625–1645. [Google Scholar] [CrossRef]
- da Silva Neto, C.P.; Barbosa, H.A.; Beneti, C.A.A. A method for convective storm detection using satellite data. Atmósfera 2016, 29, 343–358. [Google Scholar] [CrossRef]
- Ravinder, A.; Reddy, P.K.; Prasad, N. Detection of wavelengths for hail identification using satellite imagery of clouds. In Proceedings of the 2013 Fifth International Conference on Computational Intelligence, Communication Systems and Networks, Madrid, Spain, 5–7 June 2013; IEEE: Piscataway, NJ, USA, 2013; pp. 205–211. [Google Scholar]
- Guerrero-Higueras, A.M.; Merino, A.; López, L.; Sánchez, J.L.; Matellán, V. Identification of summer hailstorm from MSG data using Python. In Proceedings of the Third Symposium on Advances in Modeling and Analysis Using Python, AMS Annual Meeting, Austin, TX, USA, 5 January 2013. [Google Scholar]
- Merino, A.; López, L.; Sánchez, J.L.; García-Ortega, E.; Cattani, E.; Levizzani, V. Daytime identification of summer hailstorm cells from MSG data. Nat. Hazards Earth Syst. Sci. 2014, 14, 1017–1033. [Google Scholar] [CrossRef]
- Bang, S.D.; Cecil, D.J. Constructing a multifrequency passive microwave hail retrieval and climatology in the GPM domain. J. Appl. Meteorol. Climatol. 2019, 58, 1889–1904. [Google Scholar] [CrossRef]
- Bauer-Messmer, B.; Waldvogel, A. Satellite data based detection and prediction of hail. Atmos. Res. 1997, 43, 217–231. [Google Scholar] [CrossRef]
- Houze, R.A., Jr. Nimbostratus and the separation of convective and stratiform precipitation. In International Geophysics; Academic Press: Cambridge, MA, USA, 2014; Volume 104, pp. 141–163. [Google Scholar]
- Mikuš, P.; Mahović, N.S. Satellite-based overshooting top detection methods and an analysis of correlated weather conditions. Atmos. Res. 2013, 123, 268–280. [Google Scholar] [CrossRef]
- Khlopenkov, K.V.; Bedka, K.M.; Cooney, J.W.; Itterly, K. Recent Advances in Detection of Overshooting Cloud Tops from Longwave Infrared Satellite Imagery. J. Geophys. Res. Atmos. 2021, 126, e2020JD034359. [Google Scholar] [CrossRef]
- Wilhelm, J.; Mohr, S.; Punge, H.J.; Mühr, B.; Schmidberger, M.; Daniell, J.E.; Kunz, M. Severe thunderstorms with large hail across Germany in June 2019. Weather 2021, 76, 228–237. [Google Scholar] [CrossRef]
- Guihua, L.; Xing, Y.; Ling, J.; Jin, D. Satellite retrieval of a strong hailstorm process. Atmos. Ocean. Sci. Lett. 2009, 2, 103–107. [Google Scholar] [CrossRef]
- Setvák, M.; Lindsey, D.T.; Rabin, R.M.; Wang, P.K.; Demeterová, A. Indication of water vapor transport into the lower stratosphere above midlatitude convective storms: Meteosat Second Generation satellite observations and radiative transfer model simulations. Atmos. Res. 2008, 89, 170–180. [Google Scholar] [CrossRef]
- Bedka, K.M. Overshooting cloud top detections using MSG SEVIRI Infrared brightness temperatures and their relationship to severe weather over Europe. Atmos. Res. 2011, 99, 175–189. [Google Scholar] [CrossRef]
- Auer, A.H., Jr. Hail recognition through the combined use of radar reflectivity and cloud-top temperatures. Mon. Weather. Rev. 1994, 122, 2218–2221. [Google Scholar] [CrossRef]
- Nugroho, A.D.; Winarso, P.A. Atmospheric Dynamics Analysis of Hail Events Using Radar C-Bands Imagery and Satellite Himawari-8 (Case Study: Yogyakarta January). In Proceedings of the 6th Geoinformation Science Symposium 2019, Yogyakarta, Indonesia, 26–27 August 2019; p. 48. [Google Scholar]
- Duan, M.; Xia, J.; Yan, Z.; Han, L.; Zhang, L.; Xia, H.; Yu, S. Reconstruction of the Radar Reflectivity of Convective Storms Based on Deep Learning and Himawari-8 Observations. Remote Sens. 2021, 13, 3330. [Google Scholar] [CrossRef]
- Hardaker, P.J.; Auer, A.H., Jr. The separation of rain and hail using single polarisation radar echoes and IR cloud-top temperatures. Meteorol. Appl. 1994, 1, 201–204. [Google Scholar] [CrossRef]
- Schuster, S.S.; Blong, R.J.; Leigh, R.J.; McAneney, K.J. Characteristics of the 14 April 1999 Sydney hailstorm based on ground observations, weather radar, insurance data and emergency calls. Nat. Hazards Earth Syst. Sci. 2005, 5, 613–620. [Google Scholar] [CrossRef]
- Gallo, K.; Smith, T.; Jungbluth, K.; Schumacher, P. Hail swaths observed from satellite data and their relation to radar and surface-based observations: A case study from Iowa in 2009. Weather. Forecast. 2012, 27, 796–802. [Google Scholar] [CrossRef]
- Kuzhevskaia, I.; Volkova, M.; Nechepurenko, O.; Chursin, V. A study of hailstorms in the South of Western Siberia. In IOP Conference Series: Materials Science and Engineering; IOP Publishing: Bristol, UK, 2019; Volume 698, p. 044036. [Google Scholar]
- Nisi, L.; Hering, A.; Germann, U.; Schroeer, K.; Barras, H.; Kunz, M.; Martius, O. Hailstorms in the Alpine region: Diurnal cycle, 4D-characteristics, and the nowcasting potential of lightning properties. Q. J. R. Meteorol. Soc. 2020, 146, 4170–4194. [Google Scholar] [CrossRef]
- Bechis, H.; Galligani, V.; Imaz, M.A.; Cancelada, M.; Simone, I.; Piscitelli, F.; Maldonado, P.; Salio, P.; Nesbitt, S.W. A case study of a severe hailstorm in Mendoza, Argentina, during the RELAMPAGO-CACTI field campaign. Atmos. Res. 2022, 271, 106127. [Google Scholar] [CrossRef]
- Bessho, K.; Date, K.; Hayashi, M.; Ikeda, A.; Imai, T.; Inoue, H.; Kumagai, Y.; Miyakawa, T.; Murata, H.; Ohno, T.; et al. An introduction to Himawari-8/9—Japan’s new-generation geostationary meteorological satellites. J. Meteorol. Soc. Japan. Ser. II 2016, 94, 151–183. [Google Scholar] [CrossRef]
- Yasuhiko, S.; Hiroshi, S.; Takahito, I.; Akira, S. Convective Cloud Information derived from Himawari-8 data. In Meteorological Satellite Center Technical Note; Meteorological Satellite Center (MSC): Kiyose, Tokyo, Japan, 2017; p. 22. [Google Scholar]
- Lai, R.; Teng, S.; Yi, B.; Letu, H.; Min, M.; Tang, S.; Liu, C. Comparison of cloud properties from Himawari-8 and FengYun-4A geostationary satellite radiometers with MODIS cloud retrievals. Remote Sens. 2019, 11, 1703. [Google Scholar] [CrossRef]
- Letu, H.; Nagao, T.M.; Nakajima, T.Y.; Riedi, J.; Ishimoto, H.; Baran, A.J.; Shang, H.; Sekiguchi, M.; Kikuchi, M. Ice cloud properties from Himawari-8/AHI next-generation geostationary satellite: Capability of the AHI to monitor the DC cloud generation process. IEEE Trans. Geosci. Remote Sens. 2018, 57, 3229–3239. [Google Scholar] [CrossRef]
- Schmetz, J.; Tjemkes, S.A.; Gube, M.; Van de Berg, L. Monitoring deep convection and convective overshooting with METEOSAT. Adv. Space Res. 1997, 19, 433–441. [Google Scholar] [CrossRef]
- Warren, R.A.; Protat, A. Should Interpolation of Radar Reflectivity be Performed in Z or dB Z? J. Atmos. Ocean. Technol. 2019, 36, 1143–1156. [Google Scholar] [CrossRef]
- Rosenfeld, D.; Woodley, W.L.; Lerner, A.; Kelman, G.; Lindsey, D.T. Satellite detection of severe convective storms by their retrieved vertical profiles of cloud particle effective radius and thermodynamic phase. J. Geophys. Res. Atmos. 2008, 113, D4. [Google Scholar] [CrossRef]
- Lensky, I.M.; Rosenfeld, D. The time-space exchangeability of satellite retrieved relations between cloud top temperature and particle effective radius. Atmos. Chem. Phys. 2006, 6, 2887–2894. [Google Scholar] [CrossRef]
- Laviola, S.; Levizzani, V.; Ferraro, R.R.; Beauchamp, J. Hailstorm detection by satellite microwave radiometers. Remote Sens. 2020, 12, 621. [Google Scholar] [CrossRef]
Publisher’s Note: MDPI stays neutral with regard to jurisdictional claims in published maps and institutional affiliations. |
© 2022 by the authors. Licensee MDPI, Basel, Switzerland. This article is an open access article distributed under the terms and conditions of the Creative Commons Attribution (CC BY) license (https://creativecommons.org/licenses/by/4.0/).