Abstract
Given the advantages of remote sensing, an increasing number of satellite aerosol optical depths (AOD) have been utilized to evaluate near-ground PM2.5. However, the spatiotemporal relationship between AODs and PM2.5 still lacks a comprehensive investigation, especially in some regions with severe pollution within China. Here, we investigated the spatiotemporal relationships between several satellite AODs and the near-surface PM2.5 concentration across China and its 14 representative regions during 2016–2018 using the correlation coefficient (R), the PM2.5/AOD ratio (η), the geo-detector (q), and the different aerosol-dominated regimes. The results showed that the MODIS AOD from the Multi-Angle Implementation of Atmospheric Correction (MAIAC) algorithm strongly correlates with PM2.5 (R > 0.6) in China, particularly in the Chengyu (CY), Beijing-Tianjin-Hebei (BTH), and Yangtze River Delta (YRD) regions. The close correlations (R = 0.7) exist between PM2.5 and MODIS and VIIRS AOD from the deep blue (DB) algorithm in the CY, BTH, and YRD regions. Under the key aerosols affecting China (e.g., sulfate and dust), there is a strong correlation (R > 0.5) between the PM2.5 and MODIS and VIIRS AODs from the MAIAC and DB algorithms, with the higher concentration of ground-level PM2.5 per unit of these AODs (η > 130). The MAIAC AOD (Terra/Aqua) can better explain the spatial distribution (q > 0.4) of PM2.5 than those of AODs from the dark target (DT) and DB algorithms applied to the MODIS over China and its specific regions across seasons. The performance of the Advanced Himawari Imager (AHI) AOD (R > 0.5, q > 0.3) was close to that of the MAIAC AOD during the spring and summer; however, it was far less than the MAIAC AOD in the autumn and winter seasons. The investigation provides instructions for estimating the near-surface PM2.5 concentration based on AOD in different regions of China.
1. Introduction
As solid particles or droplets suspended in the atmosphere, atmospheric aerosol significantly impacts global climate and human health [1,2,3,4], which has been a wide focus of climate change and air quality communities [5,6,7,8,9]. Fine aerosol particles with an aerodynamic diameter of less than 2.5 μm (PM2.5) have a substantial influence on human health. Epidemiological studies have demonstrated that long-term or short-term exposure to PM2.5 increases morbidity and mortality [10,11], including through respiratory diseases, cardiovascular diseases, and brain neurological diseases [12,13,14]. Aerosol optical depth (AOD) retrievals from satellite remote sensing are frequently employed as proxies for estimating the near-ground PM2.5 concentration and its spatial heterogeneity.
AOD, an important optical parameter for aerosol remote sensing retrievals, depicts the integration of the aerosol extinction coefficient from the surface to the top of the atmosphere and is used to represent the aerosol content of the whole atmospheric column. In the air quality community, AOD (unitless parameter) is frequently used to evaluate the spatial and temporal variability of the near-surface PM2.5 concentration at the regional and global scale due to the scarcity and uneven distribution of PM2.5 (μg/m3) ground-based monitoring stations [15,16]. Nevertheless, satellite AODs and the near-surface PM2.5 concentration are fundamentally two distinct variables. In addition, ambient aerosols and their sources are highly heterogenous at both the spatial and temporal scale across many urban agglomerations in China, where air pollution has been severe in the last decades. Hence, before estimating the near-ground PM2.5 concentration using the satellite AOD retrievals, it is crucial to ensure that there is a close correlation between satellite AODs and the near-ground PM2.5 concentration at different spatial and temporal scales, as well as that the AOD retrievals can explain the spatial heterogeneity of the ground-level PM2.5 concentration to the greatest extent possible.
As a foundation for estimating PM2.5 using satellite AOD, several studies investigated the spatial and temporal relationships between AOD and PM2.5, as well as their affecting factors [17,18,19,20,21,22,23,24]. Koelemeijer et al. (2006) explored the spatial and temporal variation of the MODIS AOD-PM2.5 relation in Europe, revealing a significant spatial correlation (correlation coefficient (R) > 0.6) but a poor temporal correlation (hourly R = 0.3, daily R = 0.2) [25]. According to Guo et al. (2009), compared to the daily mean PM2.5, MODIS AOD showed a stronger correlation with an hourly mean PM2.5 concentration within ±1 h of MODIS overpass [26]. Based on a ground-based observation across China, Xin et al. (2016) analyzed the relationship between AOD and PM2.5, and their findings suggest that the correlation coefficient ranged from 0.06 to 0.75 across regions and seasons [27]. Using MODIS AOD and near-surface PM2.5 concentration data, Yang et al. (2019) revealed a high correlation over the Beijing-Tianjin-Hebei and Chengdu-Chongqing regions, especially between May and September compared to the other months [28]. Xu et al. (2021) demonstrated that the association between hourly Advanced Himawari Imager (AHI) AOD and PM2.5 was highly variable, especially in eastern China [29]. However, these investigations only evaluated the relationship between specific satellite AODs and the PM2.5 concentration. In addition, there are presently more satellite AODs accessible, such as low-earth orbit (LEO) and geostationary earth orbit (GEO) satellites. These satellite AODs have been widely used for PM2.5 estimation [30,31,32,33,34,35]. Therefore, as the foundation for evaluating the PM2.5 concentration using these satellite AODs, a comprehensive analysis and comparison of the spatial-temporal relationships between various satellite AODs and the near-ground PM2.5 mass concentration are essential to select better satellite AOD products and develop accurate PM2.5 estimate models.
In this study, we aimed to comprehensively investigate the spatial and temporal relationships between PM2.5 and various satellite AODs and the variation of these relationships under different aerosol types, particularly over typical heavily polluted urban agglomerations in China. These satellite AOD products include MODIS Dark Target (DT), Deep Blue (DB), Multi-Angle Implementation of Atmospheric Correction (MAIAC), Multi-angle Imaging Spectroradiometer (MISR), Visible Infrared Imaging Radiometer Suite (VIIRS) DT/DB, and Advanced Himawari Imager (AHI) AOD. Section 2 introduces the study area and data collecting and analysis methods. In Section 3, we illustrate the spatial and temporal relationships between multi-source satellite AODs and PM2.5 in 14 typical urban clusters in China, as well as the relation between these AODs and PM2.5 under the various aerosol types. In addition, we explore the difference in multi-AOD retrieval availability. In Section 4, the conclusions are presented.
2. Materials and Methods
2.1. Study Region
As shown in Figure 1, the study area covers 368 cities and 14 typical urban agglomerations in China [29]. The fourteen urban agglomerations depicted in Figure 1b are all national urban agglomerations authorized by the State Council of China and span the majority of mainland China, including inland and coastal regions that are heavily inhabited and have a developed economy. With the continuous development of the economy, most urban agglomerations have been subjected to severe air pollution in the last decades, especially BTH, CP, GZP, YRD, YRM, and CY. Therefore, we chose them for regional-scale research. Descriptions of the fourteen urban agglomerations are presented in detail in Supplemental Table S1.
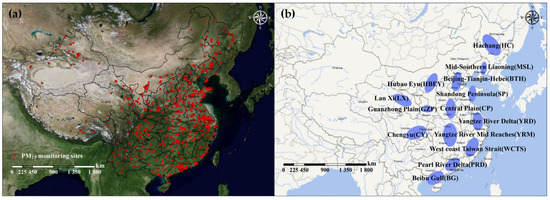
Figure 1.
Study area: (a) the 1523 monitoring sites for surface air quality and (b) the fourteen urban agglomerations in China [29].
2.2. Data Collection
2.2.1. Satellite AOD
Based on Level 2 (L2) and Level 3 (L3) aerosol retrieval algorithms [36,37], the Japan Meteorological Agency (JMA) released two operational aerosol products in July 2015, including L2 min and L3 hourly AOD with a 5 km spatial resolution covering the western Pacific, East Asia, Southeast Asia, and Australia. AHI AOD products have been updated from version 010 to version 031 since 2015. In this study, we used version 031 of the AHI L3 AOD.
MAIAC was developed as a general-purpose algorithm on MODIS [38,39,40], which enables simultaneous aerosol retrieval and atmospheric correction at dark and bright surfaces by analyzing remote sensing image time series. Lyapustin et al. (2018) released Collection 6 (C6) of the MAIAC algorithm, which provides a complete set of atmospheric and terrestrial outputs, including AOD in both blue and green bands [41]. The spatial resolution was extended to 1 km, and the algorithm’s precision was enhanced with the addition of smoke and dust detection and enhanced cloud identification. In this study, the green band at 550 nm AOD was selected.
MISR aboard the Terra satellite is equipped with nine cameras positioned at fixed angles (0°, ±26.1°, ±45.6°, ±60.0°, ±70.5°) along the spacecrafts’ track, which enhance its sensitivity to aerosol and clouds. The MISR AOD development team released version 23 (V23) in 2020 [42], which increased spatial coverage and spatial resolution (from 17.6 km to 4.4 km), improved agreement with ground-based AERONET AOD, mitigated the underestimation of high terrestrial AOD values, and more accurately captured the highest and lowest AOD.
MODIS carries 36 bands ranging from 0.4 to 14.4 μm onboard the Terra and Aqua satellites. By assuming the relationship between two visible bands (0.47 μm and 0.65 μm) and one short-wave infrared band (2.12 μm) over dense vegetation and dark soil targets, the dark target (DT) algorithm retrieves aerosol properties over these surfaces [43,44], which fully utilizes the strong spectral dependence at visible-near infrared bands of most aerosol types to decouple land-atmosphere signals. For bright surfaces, such as deserts and urban areas, the deep blue (DB) algorithm retrieves the aerosol properties based on the lower reflectance of bright surfaces in the blue band relative to longer bands [45,46,47]. Collection 6.1 (C6.1), the latest version, enhanced the MODIS radiometric calibrations, the cloud contamination screen, and the surface reflectance modeling in the high-latitude terrain complex regions, which makes DB/DT AOD products more accurate and covers more regions.
In 2011, VIIRS on the Suomi National Polar-orbiting Partnership (Suomi-NPP) was launched to maintain the MODIS data archive. Applications were transferred using the MODIS DT/DB algorithms [48,49]. The VIIRS DB and DT AOD products were initially provided with a 6 km spatial resolution in 2018 and 2019, respectively.
As shown in Table 1, the following satellite AOD products were collected for this study: AHI L3 AOD, MODIS MAIAC AOD, MISR AOD, MODIS DT/DB AOD, and VIIRS DT/DB AOD. Except for the Himawari-8 (GEO) AOD covering the entire study area with a disk, the AOD products for the other satellites (LEO) are released as granules and do not cover the entire study region. Therefore, the MODIS, MISR, and VIIRS AODs must be reprojected and stitched before use. Among all satellites, the AHI L3 product has a high temporal resolution while MCD19A2 has a high spatial resolution.

Table 1.
Summary of the satellite AOD products used in this work.
2.2.2. Near-Surface PM2.5 Concentration
Ground-level hourly PM2.5 mass concentration data for 2016–2018 were obtained from the Data Center of the Ministry of Environmental Protection of China (http://datacenter.mep.gov.cn/index, accessed on 7 July 2020). The PM2.5 concentration is measured by either a tapered element oscillating microbalance (TEOM) or a beta attenuation monitor. Figure 1a depicts the sites, which contain a total of 1536 stations.
2.2.3. Assimilated AOD
M2T1NXAER (or tavg1 2d aer Nx) is a collection of two-dimensional hourly time-averaged data in Modern-Era Retrospective analysis for Research and Applications version 2 (MERRA-2). This collection comprises aerosol diagnostics that have been assimilated. The aerosol components are black carbon, dust, sea salt, sulfate, and organic carbon. MERRA-2 is the most recent version of global atmospheric reanalysis for the satellite era developed by NASA’s Global Modeling and Assimilation Office (GMAO) leveraging the Goddard Earth Observing System (GEOS) version 5.12.4 [50]. The dataset spans the years 1980 through the present. The dataset has a spatial resolution of 0.5° × 0.625° and a temporal resolution of 1 h. In this study, we used the extinction aerosol optical thickness at 550 nm of the aerosol components.
2.3. Methodology
2.3.1. Spatial-Temporal Matchup
To investigate the spatial-temporal relationship between the LEO/GEO satellite AODs and the near-ground PM2.5 concentration, the primary task is to perform the spatial and temporal collocation of these AODs and PM2.5. Spatially, the satellite AODs (MODIS MAIAC AOD, MISR AOD, MODIS DT/DB AOD, and VIIRS DT/DB AOD) pixel closest to the PM2.5 monitoring station was extracted for the LEO satellite. Temporally, the average PM2.5 concentration within ±1 h of a satellite overpass was calculated. For the GEO satellite (Himawari-8), the spatial matching method was the same as the LEO satellite AOD. Nevertheless, for the temporal collocation, the AHI L3 AOD corresponding to the PM2.5 monitoring hour was chosen.
Furthermore, to explore the differences in the relationship between satellite AODs and near-surface PM2.5 under different aerosol-dominated regimes, using the same spatial-temporal collocation method as the GEO satellite AOD, we also extracted the extinction aerosol optical thickness of black carbon, organic carbon, sulfate, dust, and sea salt from the Modern-Era Retrospective analysis for Research and Applications version 2 (MERRA-2) product collection. We then used the maximum of five aerosol extinction thicknesses of MERRA-2 as the dominant aerosol for the analysis. The following evaluation metrics were all calculated based on the spatial and temporal collocations of this subsection. Additionally, the sample size of the spatial-temporal collocations per site must be at least 10%, and the correlation coefficients and q-statistics must be statistically significant (p < 0.05) when calculating the metrics of the evaluation presented below.
2.3.2. Evaluation Metrics
AOD-PM2.5 Correlation Analysis
Due to the non-linear relationship between satellite AODs and near-ground PM2.5 and the fact that the Spearman correlation coefficient is more robust than the Pearson correlation coefficient [51], the Spearman’s correlation coefficient was chosen for this study’s correlation analysis and is calculated as follows:
PM2.5/AOD Ratio
The ratio between PM2.5 and AOD was first proposed by Van Donkelaar et al. (2010), who used the ratio as a conversion factor to explain the spatial and temporal variability of AOD and PM2.5 [52]. This metric indicates the near-surface dry mass concentration of fine particles per unit of AOD [22]. Moreover, the PM2.5/AOD ratio is influenced by several factors, including aerosol size, aerosol type, daily aerosol variability, relative humidity, and the vertical structure of aerosol extinction [53]. Previous studies have demonstrated that this ratio is an excellent parameter for measuring the relationship between PM2.5 concentration and ambient AOD [22,52,53]. The ratio is commonly denoted by η and is computed as follows:
Since PM2.5 is the mass concentration in μg/m3 and AOD (dimensionless) is the integral of aerosol extinction coefficient, the unit of η is the same as PM2.5.
AOD-PM2.5 Spatial Similarity Metrics
The geo-detector is a quantitative tool for measuring the similarity of the spatial distribution of a geostatistical variable (e.g., PM2.5) and its covariates (e.g., AOD) [54,55]. If the independent variable (AOD) is correlated with the dependent variable (PM2.5), then the spatial distributions of AOD and PM2.5 will be comparable. That is, if the satellite AOD can substitute the spatial variation of the near-ground PM2.5 concentration, then the spatial distribution of the satellite AOD and near-ground PM2.5 is similar. The geo-detector uses the q-statistic to determine how well the satellite AOD explains the spatial variance of the near-surface PM2.5 concentration. This is performed as follows:
where N is the sample size in the study area; is the sample size in stratum h; is the variance of PM2.5 in the study area; represents the variance of PM2.5 in stratum h; L (h = 1, 2, …, L) is the total number of strata of PM2.5. The strata of PM2.5 are a partition of PM2.5 by satellite AOD, which is a categorical variable. AOD should be stratified if it is a numerical variable. The number of strata (L) might be determined according to prior knowledge. The q-statistic ranges from 0 to 1. q = 0 indicates that there is no association between PM2.5 and satellite AOD; q = 1 indicates that PM2.5 is completely determined by satellite AOD; the value of the q-statistic indicates that AOD explains q*100% of PM2.5. The q-statistic measures the association between AOD and PM2.5, both linearly and nonlinearly.
In this work, the q-statistic was determined by stratifying the satellite AOD first. Generally, 0 < AOD ≤ 0.2 stands for clean; 0.2 < AOD ≤ 0.4 represents some degree of aerosol pollution; 0.4 < AOD ≤ 0.6 characterizes relatively severe aerosol pollution; 0.6 < AOD ≤ 1.5 denotes extremely severe biomass burning or dust aerosol pollution; 1.5 < AOD ≤ 3 and greater than 3 indicate extremely severe aerosol pollution with limited visibility of the sun [56]. The classifications can partially represent the spatial interpretation of satellite AOD on the near-surface PM2.5 concentration at various aerosol pollution levels. The AOD values were divided into six groups, and then the q-statistic was calculated using the factor detector function (FDF measures the determinant power of a covariate AOD of PM2.5) provided by the R language package.
3. Results and Discussion
3.1. Spatial Variation of the Association between Multiple AODs and PM2.5
Figure 2 depicts the distribution of correlation coefficients between the nine AODs and PM2.5 for the morning (Terra) and afternoon (Aqua/Suomi-NPP) satellites. For satellites overpassing in the morning, the Terra MISR AOD was the most strongly correlated with PM2.5, with an average correlation coefficient (R) above 0.5, followed by the Terra MAIAC AOD, with correlation coefficients of 0.6 or higher in the CY and YRD regions. For the satellite overpassing in the afternoon, the correlation between Aqua MAIAC AOD and PM2.5 was higher than that of other AODs. There was a substantial difference between the correlation in the morning (Terra) and afternoon (Aqua) for MAIAC AOD, suggesting that MAIAC AOD may capture the daily variation, as Xu et al. (2021) found in the relationship between AHI hourly AOD and PM2.5 [29]. For the Suomi-NPP satellite, the correlations for VIIRS DB AOD were significantly higher than that of the VIIRS DT AOD at the national scale, indicating that VIIRS DB AOD may be more appropriate for evaluating near-surface PM2.5 than VIIRS DT AOD. This is likely due to the fact that the majority of PM2.5 monitoring stations are located in urban areas, where the DB AOD has more retrievals and higher accuracy than the DT AOD.
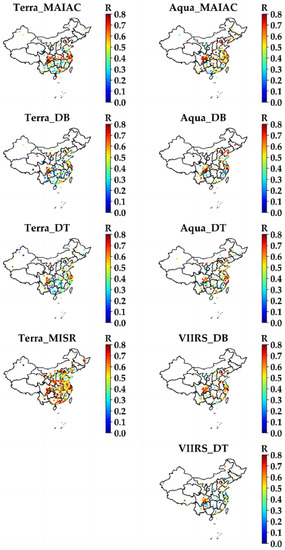
Figure 2.
The spatial distribution of the correlation coefficient (R) between satellite AODs and the PM2.5 concentration. Terra_MAIAC and Aqua_MAIAC represent the distribution of the R for MODIS AOD retrieved by the MAIAC algorithm on the Terra and Aqua satellites; Terra_DB, Aqua_DB, Terra_DT, and Aqua_DT are for MODIS AOD retrieved by the DB, and DT algorithms on the Terra and Aqua satellites; Terra_MISR is for MISR AOD for version 23 on the Terra satellite. The VIIRS_DB and VIIRS_DT are for VIIRS AOD retrieved by the DB and DT algorithms on the Suomi-NPP satellite. Note that the points in the map are filtered by statistical significance (p-value < 0.05).
Figure 3 displays the distribution of the PM2.5/multi-AOD ratios in the morning and afternoon. There is a significant discrepancy in the ratio (η) of PM2.5 to satellite AODs. The η values for the MODIS AODs (MAIAC, DT, and DB algorithms) show a considerable decreasing trend from morning (Terra) to afternoon (Aqua) in the eastern region of China. Moreover, a similar spatial pattern is present for the η values of the AOD using the same algorithm, such as DT and DB AOD retrieval algorithms applied to MODIS and VIIRS. There are high-value hotspots of the η for the DB AODs (MODIS and VIIRS) in the southwest and northwest regions. There are low-value hotspots (η < 100) of the η for DT AODs (MODIS and VIIRS) in the CY, YRD, PRD, and SP regions. One probable explanation is that the DT algorithm retrieves effectively in areas with favorable vegetation cover [43,44,48,49]. The results indicate good consistency in applying the DT and DB algorithms on the two sensors (MODIS and VIIRS). After the MODIS decommissioning, it is anticipated that the VIIRS AOD will continue to be used for long-term remote sensing observations of PM2.5. Additionally, the spatial distribution of the η for the Terra MAIAC AOD and MISR AOD is also similar, indicating that MAIAC and MISR might adequately explain the spatial variance of PM2.5.
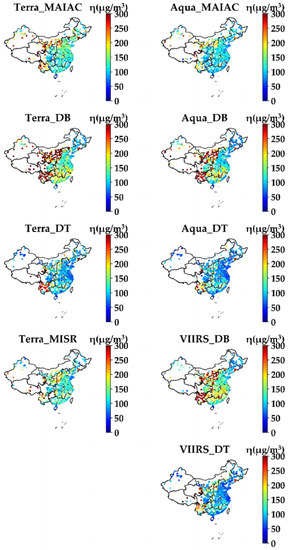
Figure 3.
The spatial distribution of the PM2.5/satellite AOD ratio (η). Terra_MAIAC, Aqua_MAIAC, Terra_DB, Aqua_DB, Terra_DT, Aqua_DT, Terra_MISR, VIIRS_DB, and VIIRS_DT represent the same implication as in Figure 2.
3.2. Temporal Variation of the Relationship between Multiple AODs and PM2.5
Based on the spatial-temporal collocations of AOD and PM2.5 for the years 2016–2018, Figure 4 shows the daily variation of the correlation coefficients between the LEO/GEO satellite’s AODs and PM2.5. Since the AHI L3 AOD is an hourly aerosol product, it is possible to determine the correlation coefficients with the ground-level PM2.5 at the hourly scale using the collocations for the three years. In contrast, the maximum temporal resolution for the LEO satellite AODs, such as MODIS on the Terra and Aqua satellites, is only twice per day. It demonstrates that over the 14 typical urban agglomerations, the correlation coefficient between MAIAC AOD (Terra and Aqua) and PM2.5 is consistently higher than the other satellite AODs, during both 10:00–13:00 and 12:00–15:00 local time (Figure 4). In addition, there is a comparable daily variation for the R for MAIAC AOD (Terra and Aqua) and AHI hourly AOD (showing a distinct daily variation as found in Xu et al. (2021) [29]), suggesting that it could be used to evaluate the daily variation of PM2.5 more accurately by merging the LEO and GEO satellite AODs (increasing the observations in a day).
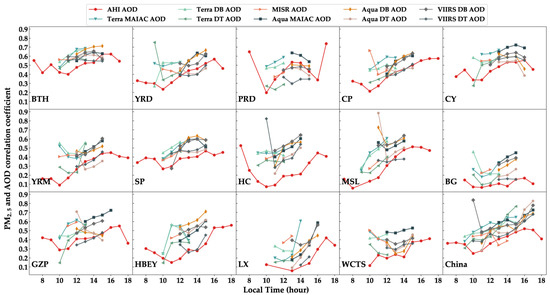
Figure 4.
The daily variation in the correlation coefficients (R) between the PM2.5 concentration and LEO/GEO satellite AODs. For the LEO satellite, the observation/overpass time found in each AOD file is the local time hour. The Terra’s overpass time in various regions of China is typically between 10:00 and 13:00, while the Aqua’s time is typically between 12:00 and 15:00.
As shown in Figure 5, for the GEO satellite (AHI AOD), the η increases and then decreases throughout the day, reaching a peak around 11:00 a.m. across China, especially for the YRM, PRD, WCTS, and BG regions. This is most likely due to the combination of local traffic emissions and boundary layer variation during the day. There is no apparent daily pattern of variation for the LEO satellites (Terra/Aqua MAIAC, DT and DB AOD, MISR AOD, VIIRS DT/DB AOD). One possible explanation is that the observed frequency of the LEO satellites is insufficient to capture the daily variation pattern properly. Nevertheless, the PM2.5/MAIAC AOD ratio showed a slight decreasing trend from 10:00 to 15:00 local time (overpass time of Terra and Aqua satellite). In addition, the η for LEO satellite AODs was much lower than that of the GEO satellite AOD during the morning period, whereas the η for the LEO and GEO satellite AODs was more similar during the afternoon period in regions such as YRD, PRD, CP, CY, YRM, and BG. This demonstrates a substantial discrepancy between the LEO satellite AODs (Terra MAIAC, DB, DT AODs) and the GEO AOD (AHI AOD) in the morning period. These findings suggest that this ratio (PM2.5/AOD) can be an important influence factor in the near-surface PM2.5 estimation model, especially on a daily scale, and at least two AOD observations per day are required to determine the daily variance of the PM2.5 concentration.
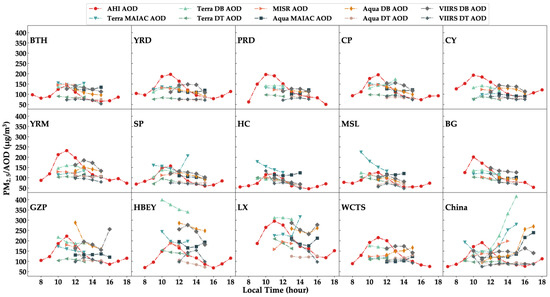
Figure 5.
The daily variation of the ratio (η) between the near-surface PM2.5 concentration and the LEO-GEO satellite AODs. The symbols on the graph are similar to Figure 4, except that the vertical axis is the ratio of PM2.5/AOD.
There is a seasonal variance for the atmospheric aerosol extinction capacity (AOD) and near-surface PM2.5 concentration. Figure 6 illustrates the seasonal variations of the relationship between LEO-GEO satellite AODs and the near-surface PM2.5 mass concentration and the number of spatial-temporal collocations between them over China and its 14 representative regions during the different seasons. In general, the AODs of MAIAC and DB algorithms (MODIS and VIIRS) are highly correlated with PM2.5 (R > 0.5) and adequately describe its spatial distribution (q-value ≥ 0.4) across seasons and typical regions, particularly in the BTH, YRD, PRD, and CY regions. During the summer, the R and q are up to 0.5 and 0.4, respectively, for the DT AODs (MODIS and VIIRS) over China, especially the Aqua MODIS DT AOD. This may be due to the denser vegetation covered in summer, when the DT algorithm can obtain higher retrieval accuracy and more retrievals (as shown in Figure 6b). During the winter, the MODIS DT AOD (Aqua) and MISR AOD can better interpret the spatial distribution of PM2.5 over the MSL and HBEY, suggesting that MODIS and MISR AOD can be integrated for a more accurate estimation of PM2.5 near the surface. Moreover, given the same aerosol retrieval algorithms (MAIAC, DB, and DT), the AOD-PM2.5 correlation for the Aqua satellite is always more robust than that of the Terra satellite over most typical regions of China during various seasons. This is consistent with the differences between them in the morning and afternoon described previously.
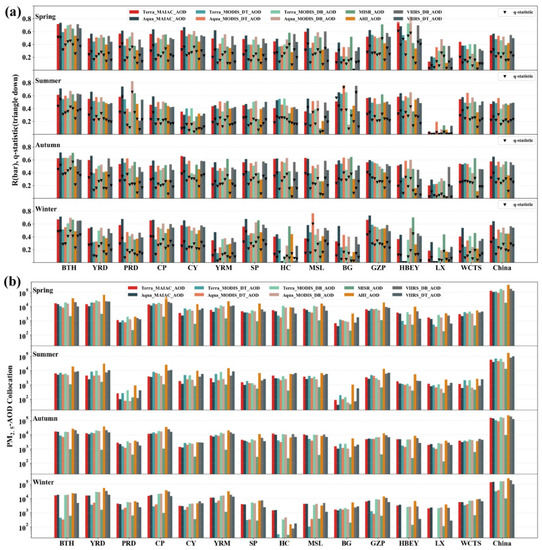
Figure 6.
Seasonal fluctuations of the correlation coefficients (R), q-statistics (a), and spatial-temporal collocations (b) of AODs-PM2.5 over China and its 14 typical urban agglomerations. The black down triangle is the q-statistics of geo-detectors for each season; the different colored bars represent the relationship between multi-AODs and PM2.5.
3.3. Relation for the AODs-PM2.5 under the Different Aerosol Types
AOD is the measurement of extinction (scattering and absorption) of solar radiation by aerosols in the atmospheric column. AOD quantifies the aerosol concentration in the atmospheric column, which is a concept of total aerosol, without distinguishing between different types of aerosol. In order to further investigate the relationship between LEO/GEO AODs and near-surface PM2.5 under different aerosol-dominated regimes, Table 2 displays the metrics based on the aerosol types derived using MERRA-2 data. In terms of the spatial-temporal collocations (N) of AOD-PM2.5 under different aerosol dominating types, the most important aerosols affecting China are sulfate and dust (N > 100,000 for the most AODs in Table 2). Under sulfate aerosol domination, there is a strong correlation (R > 0.5) between near-surface PM2.5 and MODIS and VIIRS AODs from MAIAC and DB algorithms and the higher concentration of ground-level PM2.5 per unit of these AODs (η > 130). For dust aerosol domination, these AODs still have a robust correlation with PM2.5, and the η is over 150. The results revealed that MODIS and VIIRS AODs retrieved from the MAIAC and DB algorithms have a well-defined strength in near-surface PM2.5 modeling in China. Moreover, during the domination of black carbon aerosols, there is a strong correlation between all AODs and PM2.5 and a very high concentration of near-surface PM2.5 per unit AOD (η around 300). For the four aerosol types, AHI AOD correlates best with PM2.5 only when black carbon aerosols dominate. This demonstrates that, in the future, AOD with a combination of high temporal (AHI AOD) and spatial resolution (MAIAC AOD) may be able to more accurately capture the spatial and temporal variation of the near-ground PM2.5 concentration.
Table 2.
The association between satellite AODs and PM2.5 under different aerosol dominant types over China. R (correlation coefficient), η (PM2.5/AOD), and N (spatial-temporal collocations).
3.4. Discussion
MAIAC, DT, DB MODIS AOD, and AHI L3 AOD are the only satellite AOD products with at least two observations per day included in this study. In Figure 7 and Figure 8, we quantitatively estimate the association between MAIAC, DT, DB MODIS AOD (Terra/Aqua), AHI AOD, and PM2.5 in different seasons, using PM2.5 monitoring stations and MODIS overpass time as a spatial-temporal benchmark. There is no available collocation between PM2.5 and the four AODs simultaneously, such as the MSL, HC, LX, and HBEY regions; thus, specific statistics were not calculated. For the MODIS sensor aboard the Aqua satellite, AOD retrieved from the MAIAC algorithm correlates more strongly with PM2.5 and can better explain the spatial distribution of PM2.5 than AODs from the DT and DB algorithms applied to the same sensor (Aqua MODIS) throughout China during all four seasons (Figure 7a). This demonstrates the reliability of MAIAC AOD for estimating the near-surface PM2.5 concentration over China. For instance, the Aqua MAIAC AOD has an excellent association with PM2.5 (R > 0.6) in the spring of PRD and GZP regions; in the summer of YRD, HBEY, and GZP regions; in the autumn of CY, HC, BG, and WCTS regions; and in the winter of BTH, CP, and SP regions. In addition, for the AHI and MODIS aboard the GEO and LEO satellites, the performance of AHI AOD (R > 0.5, q > 0.3) is comparable to that of the MAIAC AOD over China during the spring and summer. As demonstrated in Figure 7b, the values of AHI AOD and MODIS AODs (MAIAC, DT, DB) are comparable between spring and summer. However, in the fall and winter seasons, it is less significant than MAIAC AOD.
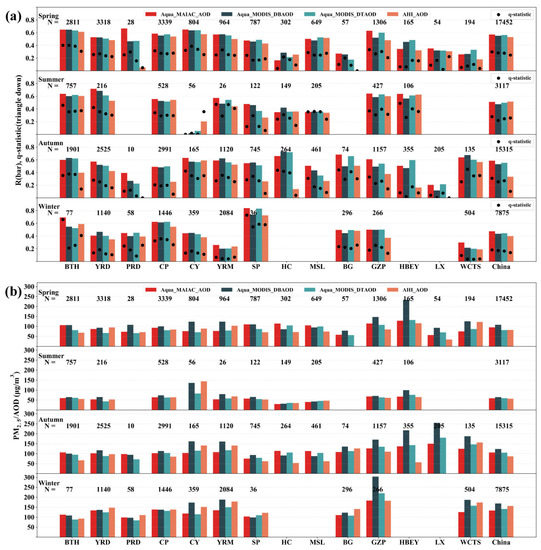
Figure 7.
The relationships between Aqua MAIAC AOD, Aqua DT AOD, Aqua DB AOD, AHI AOD, and the ground-level PM2.5 concentration over China and its typical regions during different seasons. (a) The correlation coefficient (bar) and the q statistic (black dots); (b) the ratio (η). Note that when calculating the η, the PM2.5 is the same for all AODs.
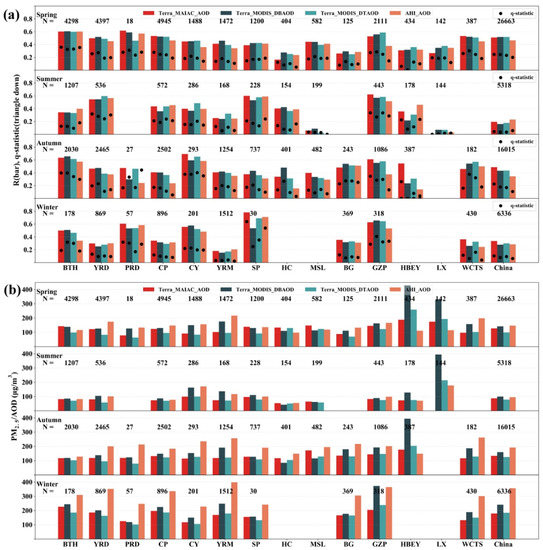
Figure 8.
The relationship between Terra MAIAC AOD, Terra DT AOD, Terra DB AOD, AHI AOD, and the ground-level PM2.5 concentration over China mainland and its typical regions over various seasons. (a) The correlation coefficient (bar) and the q statistic (black dots); (b) the ratio (η). Note that when calculating the η, the PM2.5 concentration is the same for different AODs.
Figure 8a indicates that, for the MODIS sensor aboard the Terra satellite, the correlation between MAIAC AOD and PM2.5 is stronger than DT and DB AODs over China during the summer, autumn, and winter. Nonetheless, DT and DB AODs perform better than MAIAC AOD in some regions, including the spring in YRD, YRM, GZP, HBEY, and LX regions; the summer in YRD, YRM, and CY; the autumn in BTH, YRD, YRM, SP, HC, BG, and WCTS regions; and the winter in BTH, CY, and GZP. Additionally, under the different sensor, satellite, and aerosol algorithm conditions, the correlation between AHI AOD and PM2.5 is more significant in the spring than MODIS AOD (MAIAC, DT, and DB).
Furthermore, in Figure 8b, when calculating the PM2.5/AOD ratio in the same season and region, PM2.5 is the same for all AODs. Consequently, we may indirectly compare the magnitude of LEO and GEO AOD over typical regions of China by using the metric. AHI AOD is much smaller than the MODIS AOD (MAIAC, DT, DB) during the fall and winter seasons. However, there is no significant difference between AHI AOD and MODIS AOD (MAIAC, DT, DB) in Figure 7b, implying the AHI AOD differences in the morning and afternoon, as discovered by Xu et al. (2020) [57]. With respect to the same sensor (Terra MODIS), the AOD of the DB algorithm is lower than the AOD of the MAIAC and DT algorithms in the GZP, HBEY, and LX regions. In addition, the ratio for MAIAC AOD is close to the ratio for DT AOD in CY and YRM regions. This is also the same case in Figure 7b, suggesting that the MAIAC and DT algorithms may have comparable MODIS AOD retrieval performance across these regions. The ratio metric can be used not only as an independent variable in PM2.5 modeling but also to qualitatively compare the magnitude of different satellite AODs to complement the scarce observations of ground-based AOD (Aerosol Robotic Network). Overall, these results provide general instructions for selecting the appropriate AOD or merging the different AODs for the PM2.5 estimation in various regions of China.
Satellite AOD retrievals suffer from missing data frequently due to the influence of clouds and heavy haze. Therefore, in Figure 9, we investigate the percentage of available days for matching LEO-GEO satellite AODs with near-surface PM2.5 concentration during 2016–2018 (1096 days in total). For the GEO satellite AOD (AHI AOD), when limiting at least three AOD retrievals per day, the percentage of available days is up to 20–30% in the BTH, CP, SP, and YRD regions, which is a similar spatial distribution with Aqua MAIAC AOD. When setting at least five retrievals per day, the proportion of AHI AOD can approach 10% in the BTH, CP, and SP regions. When limiting at least one retrieval per day, the percentage of AHI AOD is 40–50% in the North China Plain (BTH, CP and SP). The increased frequency of observations facilitates the statistical representation of PM2.5 estimate models.
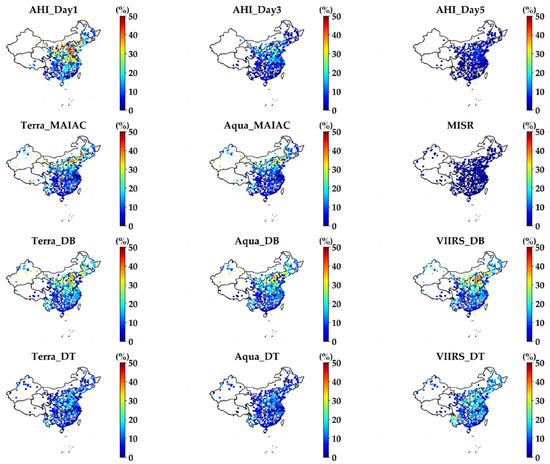
Figure 9.
The percentage availability of the LEO-GEO satellite AODs with valid matches to the PM2.5 concentration in each monitoring site for 2016–2018. AHI_Day1 represents at least one AHI AOD match to PM2.5 per station per day, AHI_Day3 denotes at least 3 matches per station per day, and AHI_Day5 stands for at least 5 AODs per station per day. The remaining are the LEO satellite AODs.
For the LEO satellite AODs, MAIAC AODs (Terra/Aqua) show a considerable north-south difference in the valid match with PM2.5, with the proportion in northern China reaching up to 30%. Thus, the MAIAC algorithm should be improved to increase the number of AOD retrievals in China, especially in the south. For AODs from the DB algorithm, the effective match with PM2.5 has a similar spatial distribution between different sensors (MODIS and VIIRS). In all regions outside CY, PRD, and BG, the percentage reaches 20%, and in the BTH region, it even gets to 40%. For AODs derived from the DT algorithm, the percentage of VIIRS DT AOD is 20% over China, which is greater than MODIS DT AOD (Aqua). Additionally, the percentage of available days for matching MISR AOD with near-surface PM2.5 is less than 10% due to the observation frequency of nine days. In general, when more AODs match up with PM2.5 every day, there is a stronger correlation between AOD and PM2.5. This means that estimates of the near-surface PM2.5 concentration are more statistically significant.
We investigated the spatio-temporal relationship between various satellite AODs and the near-surface PM2.5 concentration over China, but there were a few limitations. The boundary layer height and relative humidity influence the hygroscopic growth of aerosols [58], which in turn affects the correlation between PM2.5 and AOD. In the future, we will pay more attention to the influence of meteorological factors on the relationship between PM2.5 and various satellite AODs. In addition, some episodes of high AOD may be linked to photochemical processes. The volatile organic compounds (VOCs) and NOx are precursors for tropospheric ozone and secondary aerosols [59]. In the future, we would also like to make more investigations on the PM2.5-AODs relationships in perspective of photochemical processes.
4. Conclusions
In this paper, we comprehensively evaluated and compared the spatiotemporal relationships between LEO/GEO satellite AODs and the ground-level PM2.5 concentration for 2016–2018 across China and its 14 typical urban agglomerations, providing a reference for the PM2.5 estimation based on the AODs in different regions of China. The following findings were drawn:
Although AHI AOD can clearly capture the daily variation of the near-ground PM2.5 concentration and MISR AOD has a stronger correlation with PM2.5, we still prefer to recommend MAIAC AOD (Terra/Aqua) with 1 km resolution for estimating the near-ground PM2.5 concentration on a daily scale in China, followed by DB AOD of MODIS (Terra/Aqua) and VIIRS with 10 km and 6 km resolutions, respectively. The MODIS AOD from the MAIAC algorithm closely correlates with the near-surface PM2.5 concentration, especially in the CY, BTH, and YRD regions, with a correlation coefficient of >0.6. In the CY, BTH, and YRD regions, the correlation coefficient is as high as 0.7 between the MODIS and VIIRS AOD retrieved from the DB algorithm and the near-surface PM2.5 concentration. Under the most important aerosols affecting China (sulfate and dust), there is a strong association (R > 0.5) between near-surface PM2.5 and MODIS and VIIRS AODs from the MAIAC and DB algorithms, as well as a higher concentration of ground-level PM2.5 per unit of these AODs (η > 130). Moreover, MAIAC AOD in the morning (Terra) and afternoon (Aqua) can capture the daily variation of the PM2.5 concentration near the surface.
For MODIS AOD from MAIAC, DB, and DT retrieval algorithms, MAIAC AOD (Terra/Aqua) can better explain the spatial distribution (q > 0.4) of PM2.5 than those of AODs from DT and DB algorithms applied to the same sensor over China and its specific regions across seasons. For instance, during the spring of PRD and GZP regions; in the summer of YRD, HBEY, and GZP regions; during the autumn of CY, HC, BG, and WCTS regions; in the winter of BTH, CP, and SP regions. In addition, by quantitative analysis of the PM2.5/AOD ratio metric, we found that the AOD value of the DB algorithm was less than that of the MAIAC and DT algorithms in the GZP, HBEY, and LX regions. The MAIAC and DT algorithms may have comparable performance retrieving MODIS AOD in CY and YRM regions. Our findings provide instructions for selecting the appropriate AOD or merging various AODs for developing models with the statistical representativeness for the near-surface PM2.5 concentration in different regions of China.
Supplementary Materials
The following supporting information can be downloaded at: https://www.mdpi.com/article/10.3390/rs14225841/s1, Table S1: The detailed information for 14 urban agglomerations in our study.
Author Contributions
Conceptualization, Q.X.; Methodology, Q.X.; Software, Q.X.; Validation, Q.X.; Formal analysis, Q.X.; Investigation, Q.X.; Resources, Q.X. and S.K.; Data curation, Q.X., J.D. and L.T.; Writing—original draft, Q.X.; Writing—review & editing, Q.X., X.C., D.R., L.T. and S.K.; Visualization, Q.X.; Supervision, S.K.; Project administration, S.K.; Funding acquisition, D.R. and S.K. All authors have read and agreed to the published version of the manuscript.
Funding
This research was supported by the Strategic Priority Research Program of Chinese Academy of Sciences (XDA20040501). Dipesh Rupakheti acknowledges The Startup Foundation for Introducing Talent of NUIST (2022r024).
Acknowledgments
This research was supported by the Strategic Priority Research Program of Chinese Academy of Sciences (XDA20040501). Dipesh Rupakheti acknowledges The Startup Foundation for Introducing Talent of NUIST (2022r024). The authors gratefully acknowledge the China National Environmental Monitoring Center, the Land Processes Distributed Active Archive Center (LP DAAC), the Dark Target aerosol team, the Deep Blue aerosol team, and the Japan Aerospace Exploration Agency for their hard work. Thank you to the anonymous reviewers for their informative and insightful comments that helped to improve the quality of the manuscript.
Conflicts of Interest
The authors declare no conflict of interest.
References
- King, M.D.; Kaufman, Y.J.; Tanré, D.; Nakajima, T. Remote Sensing of Tropospheric Aerosols from Space: Past, Present, and Future. Bull. Am. Meteorol. Soc. 1999, 80, 2229–2260. [Google Scholar] [CrossRef]
- Holben, B.N.; Tanre, D.; Smirnov, A.; Eck, T.F.; Slutsker, I.; Abuhassan, N.; Newcomb, W.W.; Schafer, J.S.; Chatenet, B.; Lavenu, F. An Emerging Ground-based Aerosol Climatology: Aerosol Optical Depth from AERONET. J. Geophys. Res. Atmos. 2001, 106, 12067–12097. [Google Scholar] [CrossRef]
- Kaufman, Y.J.; Tanré, D.; Boucher, O. A Satellite View of Aerosols in the Climate System. Nature 2002, 419, 215–223. [Google Scholar] [CrossRef]
- Kim, K.-H.; Kabir, E.; Kabir, S. A Review on the Human Health Impact of Airborne Particulate Matter. Environ. Int. 2015, 74, 136–143. [Google Scholar] [CrossRef]
- Bellouin, N.; Quaas, J.; Gryspeerdt, E.; Kinne, S.; Stier, P.; Watson-Parris, D.; Boucher, O.; Carslaw, K.S.; Christensen, M.; Daniau, A.-L. Bounding Global Aerosol Radiative Forcing of Climate Change. Rev. Geophys. 2020, 58, e2019RG000660. [Google Scholar] [CrossRef]
- Bellouin, N.; Boucher, O.; Haywood, J.; Reddy, M.S. Global Estimate of Aerosol Direct Radiative Forcing from Satellite Measurements. Nature 2005, 438, 1138–1141. [Google Scholar] [CrossRef] [PubMed]
- Colmer, J.; Hardman, I.; Shimshack, J.; Voorheis, J. Disparities in PM2.5 Air Pollution in the United States. Science 2020, 369, 575–578. [Google Scholar] [CrossRef] [PubMed]
- Menon, S.; Hansen, J.; Nazarenko, L.; Luo, Y. Climate Effects of Black Carbon Aerosols in China and India. Science 2002, 297, 2250–2253. [Google Scholar] [CrossRef]
- Yang, Y.; Ren, L.; Li, H.; Wang, H.; Wang, P.; Chen, L.; Yue, X.; Liao, H. Fast Climate Responses to Aerosol Emission Reductions during the COVID-19 Pandemic. Geophys. Res. Lett. 2020, 47, e2020GL089788. [Google Scholar] [CrossRef]
- Brunekreef, B.; Holgate, S.T. Air Pollution and Health. Lancet 2002, 360, 1233–1242. [Google Scholar] [CrossRef]
- Chan, C.K.; Yao, X. Air Pollution in Mega Cities in China. Atmos. Environ. 2008, 42, 1–42. [Google Scholar] [CrossRef]
- Dominici, F.; Peng, R.D.; Bell, M.L.; Pham, L.; McDermott, A.; Zeger, S.L.; Samet, J.M. Fine Particulate Air Pollution and Hospital Admission for Cardiovascular and Respiratory Diseases. Jama 2006, 295, 1127–1134. [Google Scholar] [CrossRef]
- Kioumourtzoglou, M.-A.; Schwartz, J.D.; Weisskopf, M.G.; Melly, S.J.; Wang, Y.; Dominici, F.; Zanobetti, A. Long-Term PM2.5 Exposure and Neurological Hospital Admissions in the Northeastern United States. Environ. Health Perspect. 2016, 124, 23–29. [Google Scholar] [CrossRef]
- Shou, Y.; Huang, Y.; Zhu, X.; Liu, C.; Hu, Y.; Wang, H. A Review of the Possible Associations between Ambient PM2.5 Exposures and the Development of Alzheimer’s Disease. Ecotoxicol. Environ. Saf. 2019, 174, 344–352. [Google Scholar] [CrossRef]
- Van Donkelaar, A.; Martin, R.V.; Brauer, M.; Boys, B.L. Use of Satellite Observations for Long-Term Exposure Assessment of Global Concentrations of Fine Particulate Matter. Environ. Health Perspect. 2015, 123, 135–143. [Google Scholar] [CrossRef]
- Van Donkelaar, A.; Martin, R.V.; Brauer, M.; Hsu, N.C.; Kahn, R.A.; Levy, R.C.; Lyapustin, A.; Sayer, A.M.; Winker, D.M. Global Estimates of Fine Particulate Matter Using a Combined Geophysical-Statistical Method with Information from Satellites, Models, and Monitors. Environ. Sci. Technol. 2016, 50, 3762–3772. [Google Scholar] [CrossRef]
- Paciorek, C.J.; Liu, Y.; Moreno-Macias, H.; Kondragunta, S. Spatiotemporal Associations between GOES Aerosol Optical Depth Retrievals and Ground-Level PM2.5. Environ. Sci. Technol. 2008, 42, 5800–5806. [Google Scholar] [CrossRef] [PubMed]
- Paciorek, C.J.; Liu, Y. Limitations of Remotely Sensed Aerosol as a Spatial Proxy for Fine Particulate Matter. Environ. Health Perspect. 2009, 117, 904–909. [Google Scholar] [CrossRef] [PubMed]
- Toth, T.D.; Zhang, J.; Campbell, J.R.; Hyer, E.J.; Reid, J.S.; Shi, Y.; Westphal, D.L. Impact of Data Quality and Surface-to-Column Representativeness on the PM2.5/Satellite AOD Relationship for the Contiguous United States. Atmos. Chem. Phys. 2014, 14, 6049–6062. [Google Scholar] [CrossRef]
- Guo, J.; Xia, F.; Zhang, Y.; Liu, H.; Li, J.; Lou, M.; He, J.; Yan, Y.; Wang, F.; Min, M. Impact of Diurnal Variability and Meteorological Factors on the PM2.5-AOD Relationship: Implications for PM2.5 Remote Sensing. Environ. Pollut. 2017, 221, 94–104. [Google Scholar] [CrossRef] [PubMed]
- Loría-Salazar, S.M.; Panorska, A.; Arnott, W.P.; Barnard, J.C.; Boehmler, J.M.; Holmes, H.A. Toward Understanding Atmospheric Physics Impacting the Relationship between Columnar Aerosol Optical Depth and Near-Surface PM2.5 Mass Concentrations in Nevada and California, USA, during 2013. Atmos. Environ. 2017, 171, 289–300. [Google Scholar] [CrossRef]
- Zheng, C.; Zhao, C.; Zhu, Y.; Wang, Y.; Shi, X.; Wu, X.; Chen, T.; Wu, F.; Qiu, Y. Analysis of Influential Factors for the Relationship between PM2.5 and AOD in Beijing. Atmos. Chem. Phys. 2017, 17, 13473–13489. [Google Scholar] [CrossRef]
- Wang, J.; Christopher, S.A. Intercomparison between Satellite-derived Aerosol Optical Thickness and PM2.5 Mass: Implications for Air Quality Studies. Geophys. Res. Lett. 2003, 30. [Google Scholar] [CrossRef]
- Jin, Q.; Crippa, P.; Pryor, S.C. Spatial Characteristics and Temporal Evolution of the Relationship between PM2.5 and Aerosol Optical Depth over the Eastern USA during 2003–2017. Atmos. Environ. 2020, 239, 117718. [Google Scholar] [CrossRef]
- Koelemeijer, R.B.A.; Homan, C.D.; Matthijsen, J. Comparison of Spatial and Temporal Variations of Aerosol Optical Thickness and Particulate Matter over Europe. Atmos. Environ. 2006, 40, 5304–5315. [Google Scholar] [CrossRef]
- Guo, J.-P.; Zhang, X.-Y.; Che, H.-Z.; Gong, S.-L.; An, X.; Cao, C.-X.; Guang, J.; Zhang, H.; Wang, Y.-Q.; Zhang, X.-C. Correlation between PM Concentrations and Aerosol Optical Depth in Eastern China. Atmos. Environ. 2009, 43, 5876–5886. [Google Scholar] [CrossRef]
- Xin, J.; Gong, C.; Liu, Z.; Cong, Z.; Gao, W.; Song, T.; Pan, Y.; Sun, Y.; Ji, D.; Wang, L. The Observation-based Relationships between PM2.5 and AOD over China. J. Geophys. Res. Atmos. 2016, 121, 10,701–10,716. [Google Scholar] [CrossRef]
- Yang, Q.; Yuan, Q.; Yue, L.; Li, T.; Shen, H.; Zhang, L. The Relationships between PM2.5 and Aerosol Optical Depth (AOD) in Mainland China: About and behind the Spatio-Temporal Variations. Environ. Pollut. 2019, 248, 526–535. [Google Scholar] [CrossRef]
- Xu, Q.; Chen, X.; Yang, S.; Tang, L.; Dong, J. Spatiotemporal Relationship between Himawari-8 Hourly Columnar Aerosol Optical Depth (AOD) and Ground-Level PM2.5 Mass Concentration in Mainland China. Sci. Total Environ. 2021, 765, 144241. [Google Scholar] [CrossRef] [PubMed]
- Chen, J.; Yin, J.; Zang, L.; Zhang, T.; Zhao, M. Stacking Machine Learning Model for Estimating Hourly PM2.5 in China Based on Himawari 8 Aerosol Optical Depth Data. Sci. Total Environ. 2019, 697, 134021. [Google Scholar] [CrossRef] [PubMed]
- Wei, J.; Huang, W.; Li, Z.; Xue, W.; Peng, Y.; Sun, L.; Cribb, M. Estimating 1-Km-Resolution PM2.5 Concentrations across China Using the Space-Time Random Forest Approach. Remote Sens. Environ. 2019, 231, 111221. [Google Scholar] [CrossRef]
- Zhang, T.; Zang, L.; Wan, Y.; Wang, W.; Zhang, Y. Ground-Level PM2.5 Estimation over Urban Agglomerations in China with High Spatiotemporal Resolution Based on Himawari-8. Sci. Total Environ. 2019, 676, 535–544. [Google Scholar] [CrossRef]
- Zhang, T.; Geng, G.; Liu, Y.; Chang, H.H. Application of Bayesian Additive Regression Trees for Estimating Daily Concentrations of PM2.5 Components. Atmosphere 2020, 11, 1233. [Google Scholar] [CrossRef] [PubMed]
- Geng, G.; Meng, X.; He, K.; Liu, Y. Random Forest Models for PM2.5 Speciation Concentrations Using MISR Fractional AODs. Environ. Res. Lett. 2020, 15, 034056. [Google Scholar] [CrossRef]
- Meng, X.; Liu, C.; Zhang, L.; Wang, W.; Stowell, J.; Kan, H.; Liu, Y. Estimating PM2.5 Concentrations in Northeastern China with Full Spatiotemporal Coverage, 2005–2016. Remote Sens. Environ. 2021, 253, 112203. [Google Scholar] [CrossRef]
- Kikuchi, M.; Murakami, H.; Suzuki, K.; Nagao, T.M.; Higurashi, A. Improved Hourly Estimates of Aerosol Optical Thickness Using Spatiotemporal Variability Derived from Himawari-8 Geostationary Satellite. IEEE Trans. Geosci. Remote Sens. 2018, 56, 3442–3455. [Google Scholar] [CrossRef]
- Yoshida, M.; Kikuchi, M.; Nagao, T.M.; Murakami, H.; Nomaki, T.; Higurashi, A. Common Retrieval of Aerosol Properties for Imaging Satellite Sensors. J. Meteorol. Soc. Japan. Ser. II 2018, 96, 193–209. [Google Scholar] [CrossRef]
- Lyapustin, A.; Martonchik, J.; Wang, Y.; Laszlo, I.; Korkin, S. Multiangle Implementation of Atmospheric Correction (MAIAC): 1. Radiative Transfer Basis and Look-up Tables. J. Geophys. Res. Atmos. 2011, 116. [Google Scholar] [CrossRef]
- Lyapustin, A.; Wang, Y.; Laszlo, I.; Kahn, R.; Korkin, S.; Remer, L.; Levy, R.; Reid, J.S. Multiangle Implementation of Atmospheric Correction (MAIAC): 2. Aerosol Algorithm. J. Geophys. Res. Atmos. 2011, 116. [Google Scholar] [CrossRef]
- Lyapustin, A.I.; Wang, Y.; Laszlo, I.; Hilker, T.; Hall, F.G.; Sellers, P.J.; Tucker, C.J.; Korkin, S.V. Multi-Angle Implementation of Atmospheric Correction for MODIS (MAIAC): 3. Atmospheric Correction. Remote Sens. Environ. 2012, 127, 385–393. [Google Scholar] [CrossRef]
- Lyapustin, A.; Wang, Y.; Korkin, S.; Huang, D. MODIS Collection 6 MAIAC Algorithm. Atmos. Meas. Tech. 2018, 11, 5741–5765. [Google Scholar] [CrossRef]
- Garay, M.J.; Witek, M.L.; Kahn, R.A.; Seidel, F.C.; Limbacher, J.A.; Bull, M.A.; Diner, D.J.; Hansen, E.G.; Kalashnikova, O.V.; Lee, H. Introducing the 4.4 Km Spatial Resolution Multi-Angle Imaging SpectroRadiometer (MISR) Aerosol Product. Atmos. Meas. Tech. 2020, 13, 593–628. [Google Scholar] [CrossRef]
- Kaufman, Y.J.; Tanré, D.; Remer, L.A.; Vermote, E.F.; Chu, A.; Holben, B.N. Operational Remote Sensing of Tropospheric Aerosol over Land from EOS Moderate Resolution Imaging Spectroradiometer. J. Geophys. Res. Atmos. 1997, 102, 17051–17067. [Google Scholar] [CrossRef]
- Levy, R.C.; Remer, L.A.; Mattoo, S.; Vermote, E.F.; Kaufman, Y.J. Second-generation Operational Algorithm: Retrieval of Aerosol Properties over Land from Inversion of Moderate Resolution Imaging Spectroradiometer Spectral Reflectance. J. Geophys. Res. Atmos. 2007, 112. [Google Scholar] [CrossRef]
- Hsu, N.C.; Tsay, S.-C.; King, M.D.; Herman, J.R. Aerosol Properties over Bright-Reflecting Source Regions. IEEE Trans. Geosci. Remote Sens. 2004, 42, 557–569. [Google Scholar] [CrossRef]
- Hsu, N.C.; Tsay, S.-C.; King, M.D.; Herman, J.R. Deep Blue Retrievals of Asian Aerosol Properties during ACE-Asia. IEEE Trans. Geosci. Remote Sens. 2006, 44, 3180–3195. [Google Scholar] [CrossRef]
- Hsu, N.C.; Jeong, M.-J.; Bettenhausen, C.; Sayer, A.M.; Hansell, R.; Seftor, C.S.; Huang, J.; Tsay, S.-C. Enhanced Deep Blue Aerosol Retrieval Algorithm: The Second Generation. J. Geophys. Res. Atmos. 2013, 118, 9296–9315. [Google Scholar] [CrossRef]
- Hsu, N.C.; Lee, J.; Sayer, A.M.; Kim, W.; Bettenhausen, C.; Tsay, S.-C. VIIRS Deep Blue Aerosol Products over Land: Extending the EOS Long-term Aerosol Data Records. J. Geophys. Res. Atmos. 2019, 124, 4026–4053. [Google Scholar] [CrossRef]
- Sawyer, V.; Levy, R.C.; Mattoo, S.; Cureton, G.; Shi, Y.; Remer, L.A. Continuing the MODIS Dark Target Aerosol Time Series with VIIRS. Remote Sens. 2020, 12, 308. [Google Scholar] [CrossRef]
- Global Modeling and Assimilation Office (GMAO). MERRA-2 tavg1_2d_aer_Nx: 2d, 1-Hourly, Time-Averaged, Single-Level, Assimilation, Aerosol Diagnostics V5.12.4; Goddard Earth Sciences Data and Information Services Center (GES DISC): Greenbelt, MD, USA, 2015. [CrossRef]
- Sayer, A.M.; Hsu, N.C.; Lee, J.; Kim, W.V.; Dutcher, S.T. Validation, Stability, and Consistency of MODIS Collection 6.1 and VIIRS Version 1 Deep Blue Aerosol Data Over Land. J. Geophys. Res. Atmos. 2019, 124, 4658–4688. [Google Scholar] [CrossRef]
- Van Donkelaar, A.; Martin, R.V.; Brauer, M.; Kahn, R.; Levy, R.; Verduzco, C.; Villeneuve, P.J. Global Estimates of Ambient Fine Particulate Matter Concentrations from Satellite-Based Aerosol Optical Depth: Development and Application. Environ. Health Perspect. 2010, 118, 847–855. [Google Scholar] [CrossRef] [PubMed]
- Van Donkelaar, A.; Martin, R.V.; Park, R.J. Estimating Ground-level PM2.5 Using Aerosol Optical Depth Determined from Satellite Remote Sensing. J. Geophys. Res. Atmos. 2006, 111. [Google Scholar] [CrossRef]
- Wang, J.-F.; Li, X.-H.; Christakos, G.; Liao, Y.-L.; Zhang, T.; Gu, X.; Zheng, X.-Y. Geographical Detectors-based Health Risk Assessment and Its Application in the Neural Tube Defects Study of the Heshun Region, China. Int. J. Geogr. Inf. Sci. 2010, 24, 107–127. [Google Scholar] [CrossRef]
- Wang, J.F.; Xu, C.D. Geodetector: Principle and Prospective. Acta Geogr. Sin. 2017, 72, 116–134. [Google Scholar]
- Jethva, H.; Satheesh, S.K.; Srinivasan, J. Seasonal Variability of Aerosols over the Indo-Gangetic Basin. J. Geophys. Res. Atmos. 2005, 110. [Google Scholar] [CrossRef]
- Xu, Q.; Chen, X.; Li, J.; Sun, K.; Zhang, T.; Yang, S.; Tang, L.; Dong, J. Impact of Environmental Pollution on the Retrieval of Hourly Aerosol Products from Advanced Himawari Imager (AHI) over Beijing. Atmos. Pollut. Res. 2020, 11, 1115–1126. [Google Scholar] [CrossRef]
- Liu, Q.; Jia, X.; Quan, J.; Li, J.; Li, X.; Wu, Y.; Chen, D.; Wang, Z.; Liu, Y. New Positive Feedback Mechanism between Boundary Layer Meteorology and Secondary Aerosol Formation during Severe Haze Events. Sci. Rep. 2018, 8, 6095. [Google Scholar] [CrossRef] [PubMed]
- Systematic Observation Requirements for Satellite-Based Products for Climate Supplemental Details to the Satellite-Based Component of the Implementation Plan for the Global Observing System for Climate in Support of the UNFCCC: 2011 Update. Available online: https://library.wmo.int/index.php?lvl=notice_display&id=12907 (accessed on 14 November 2022).
Publisher’s Note: MDPI stays neutral with regard to jurisdictional claims in published maps and institutional affiliations. |
© 2022 by the authors. Licensee MDPI, Basel, Switzerland. This article is an open access article distributed under the terms and conditions of the Creative Commons Attribution (CC BY) license (https://creativecommons.org/licenses/by/4.0/).