


Remote Sensing Monitoring of Rice and Wheat Canopy Nitrogen: A Review


Abstract
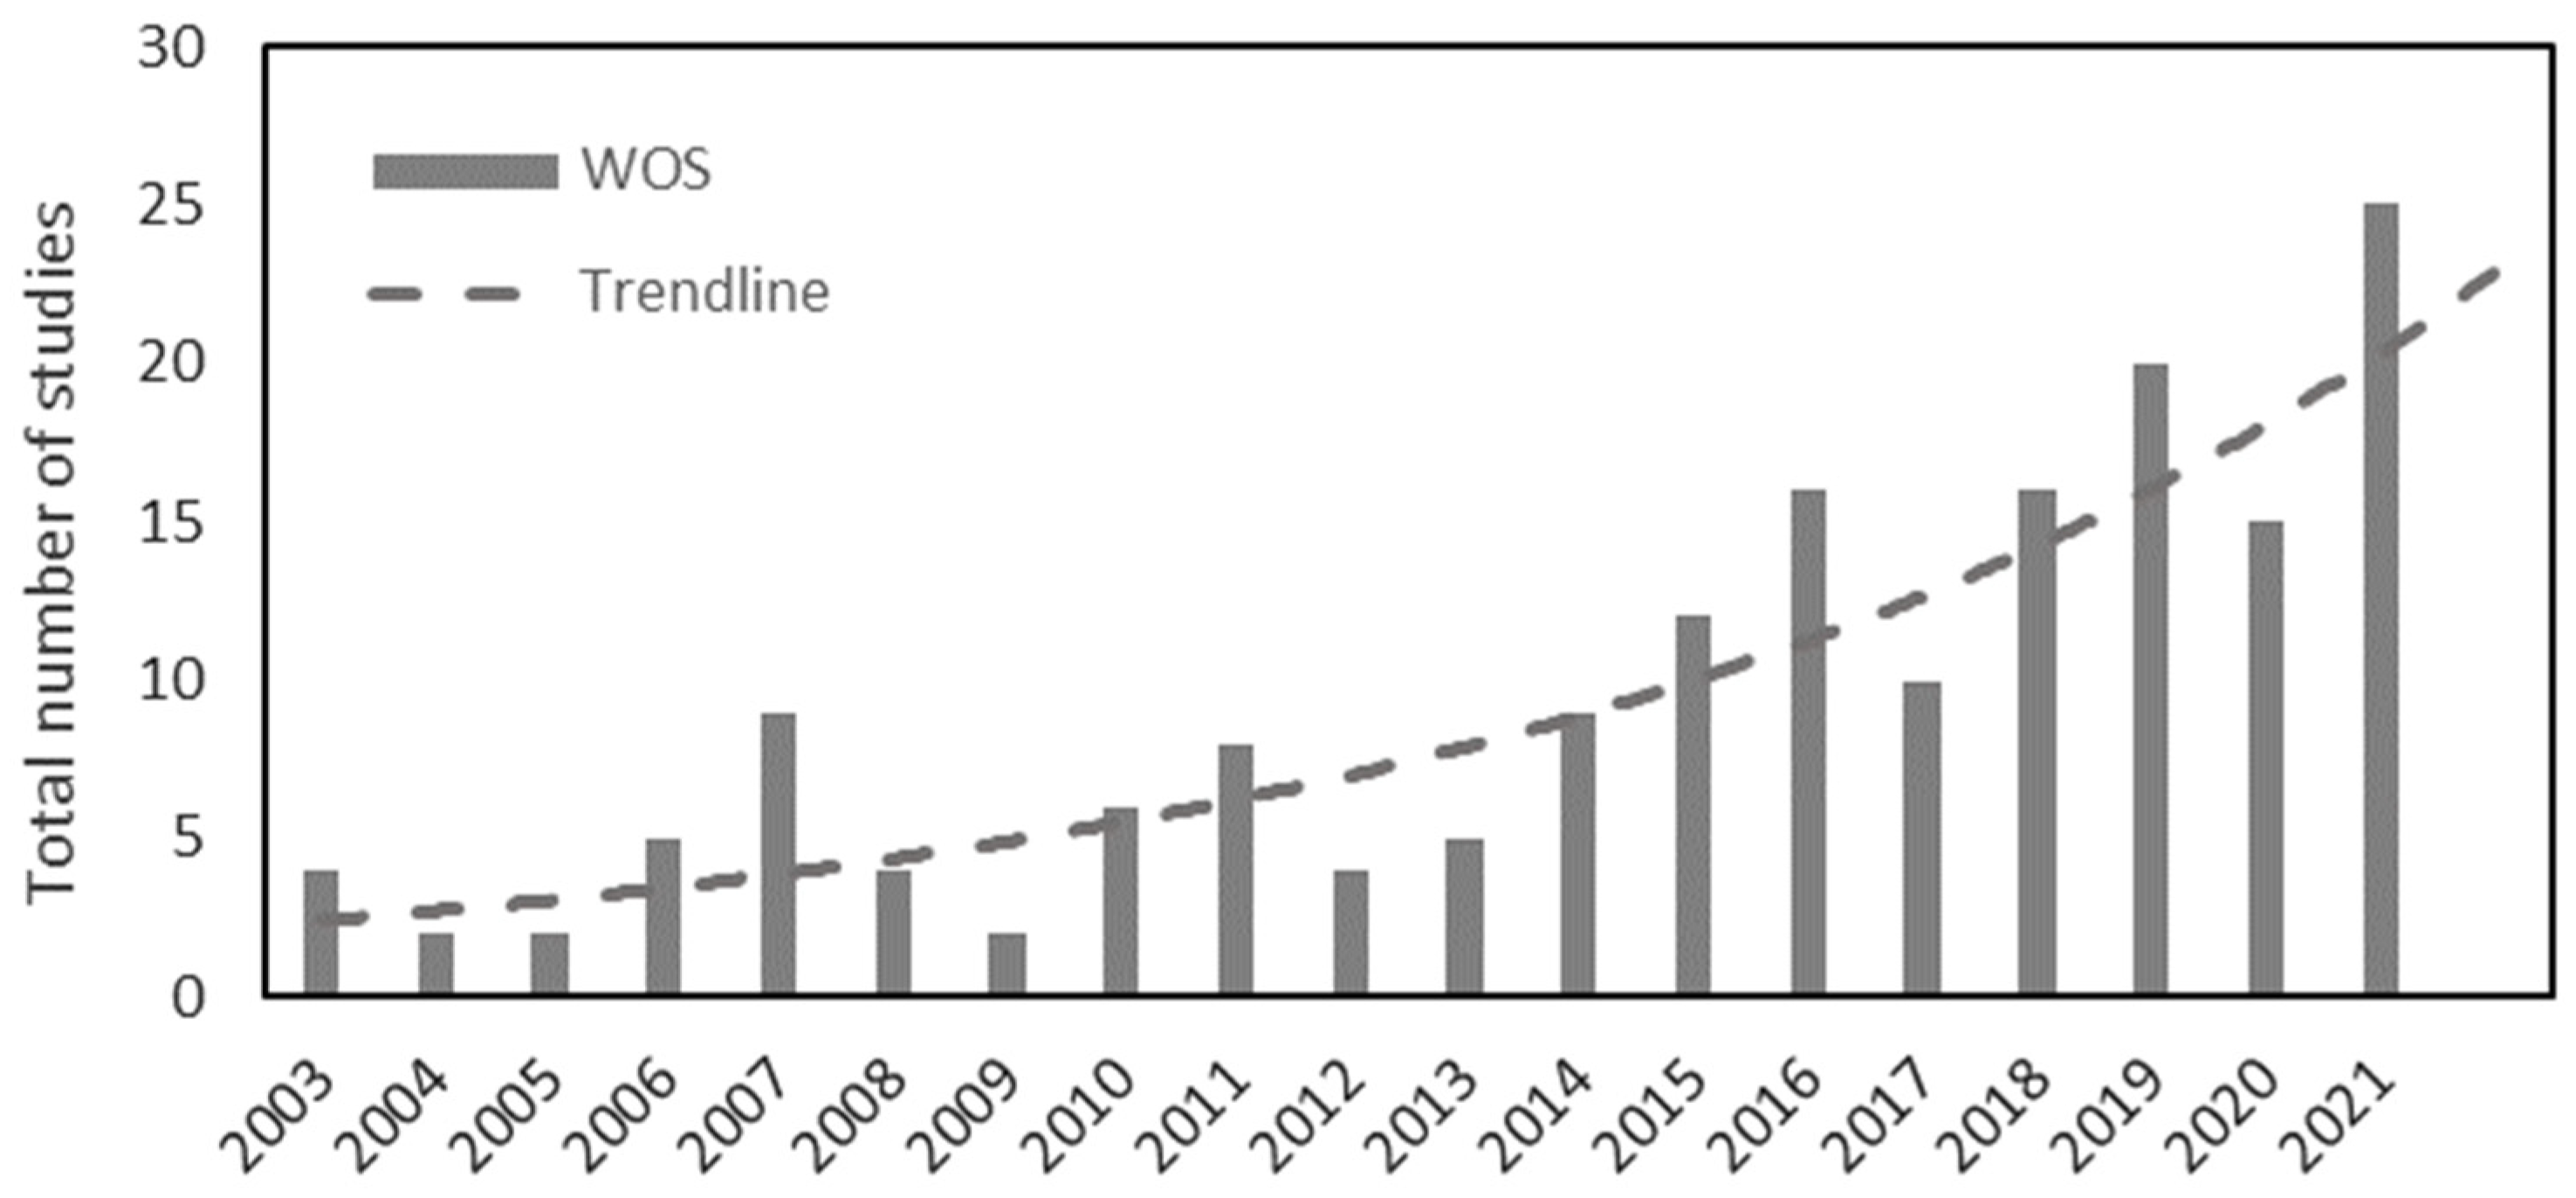
1. Introduction
2. Mechanisms for Remote Sensing Monitoring of Canopy N
2.1. Physiological Mechanisms of Crop N
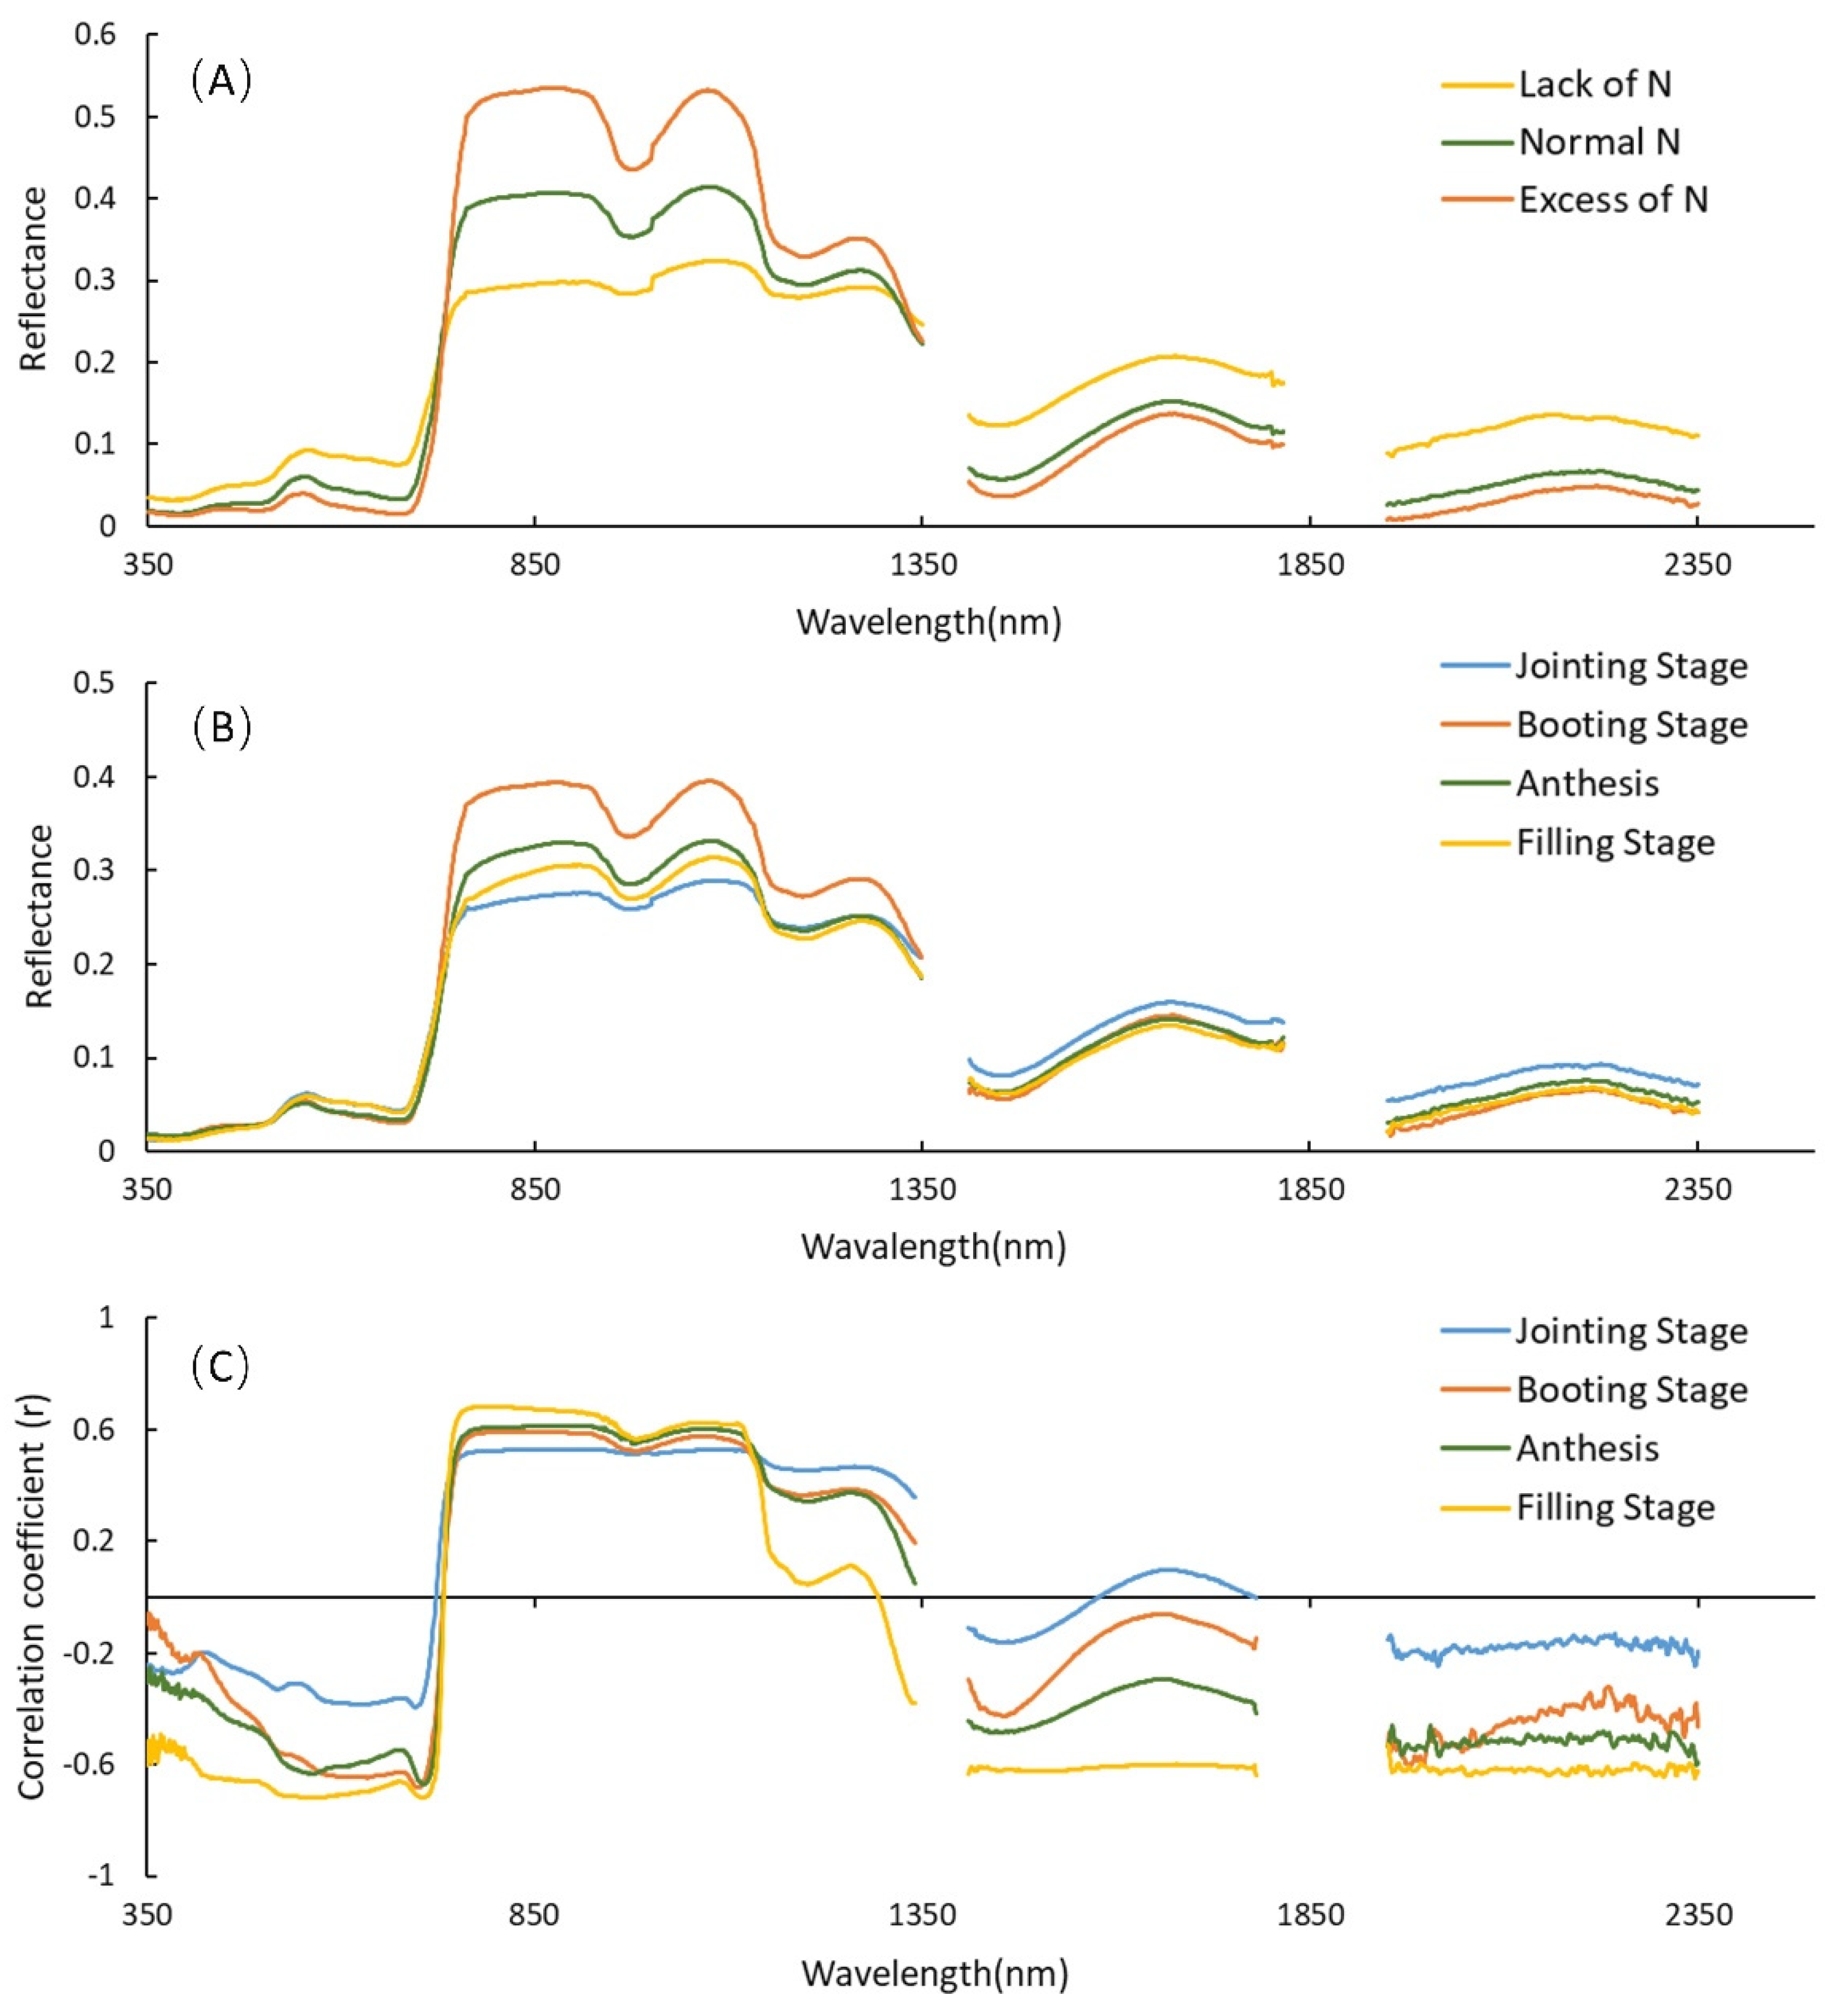
2.2. Spectral Response Properties of Canopy N
3. Techniques for Remote Sensing Monitoring of Canopy N
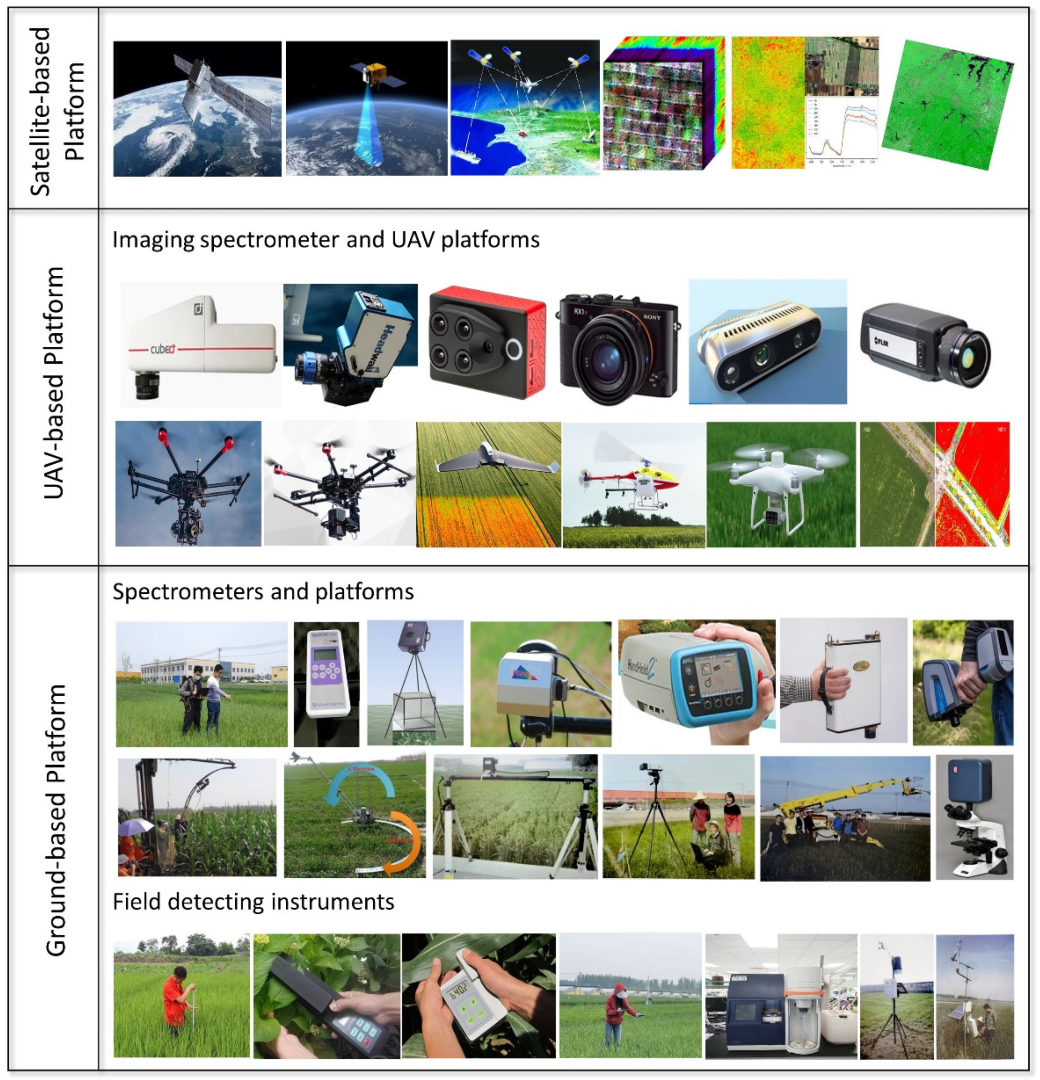
3.1. Remote Sensing Platforms for Canopy N Monitoring
3.1.1. Ground-Based Platform
3.1.2. UAV-Based Platform
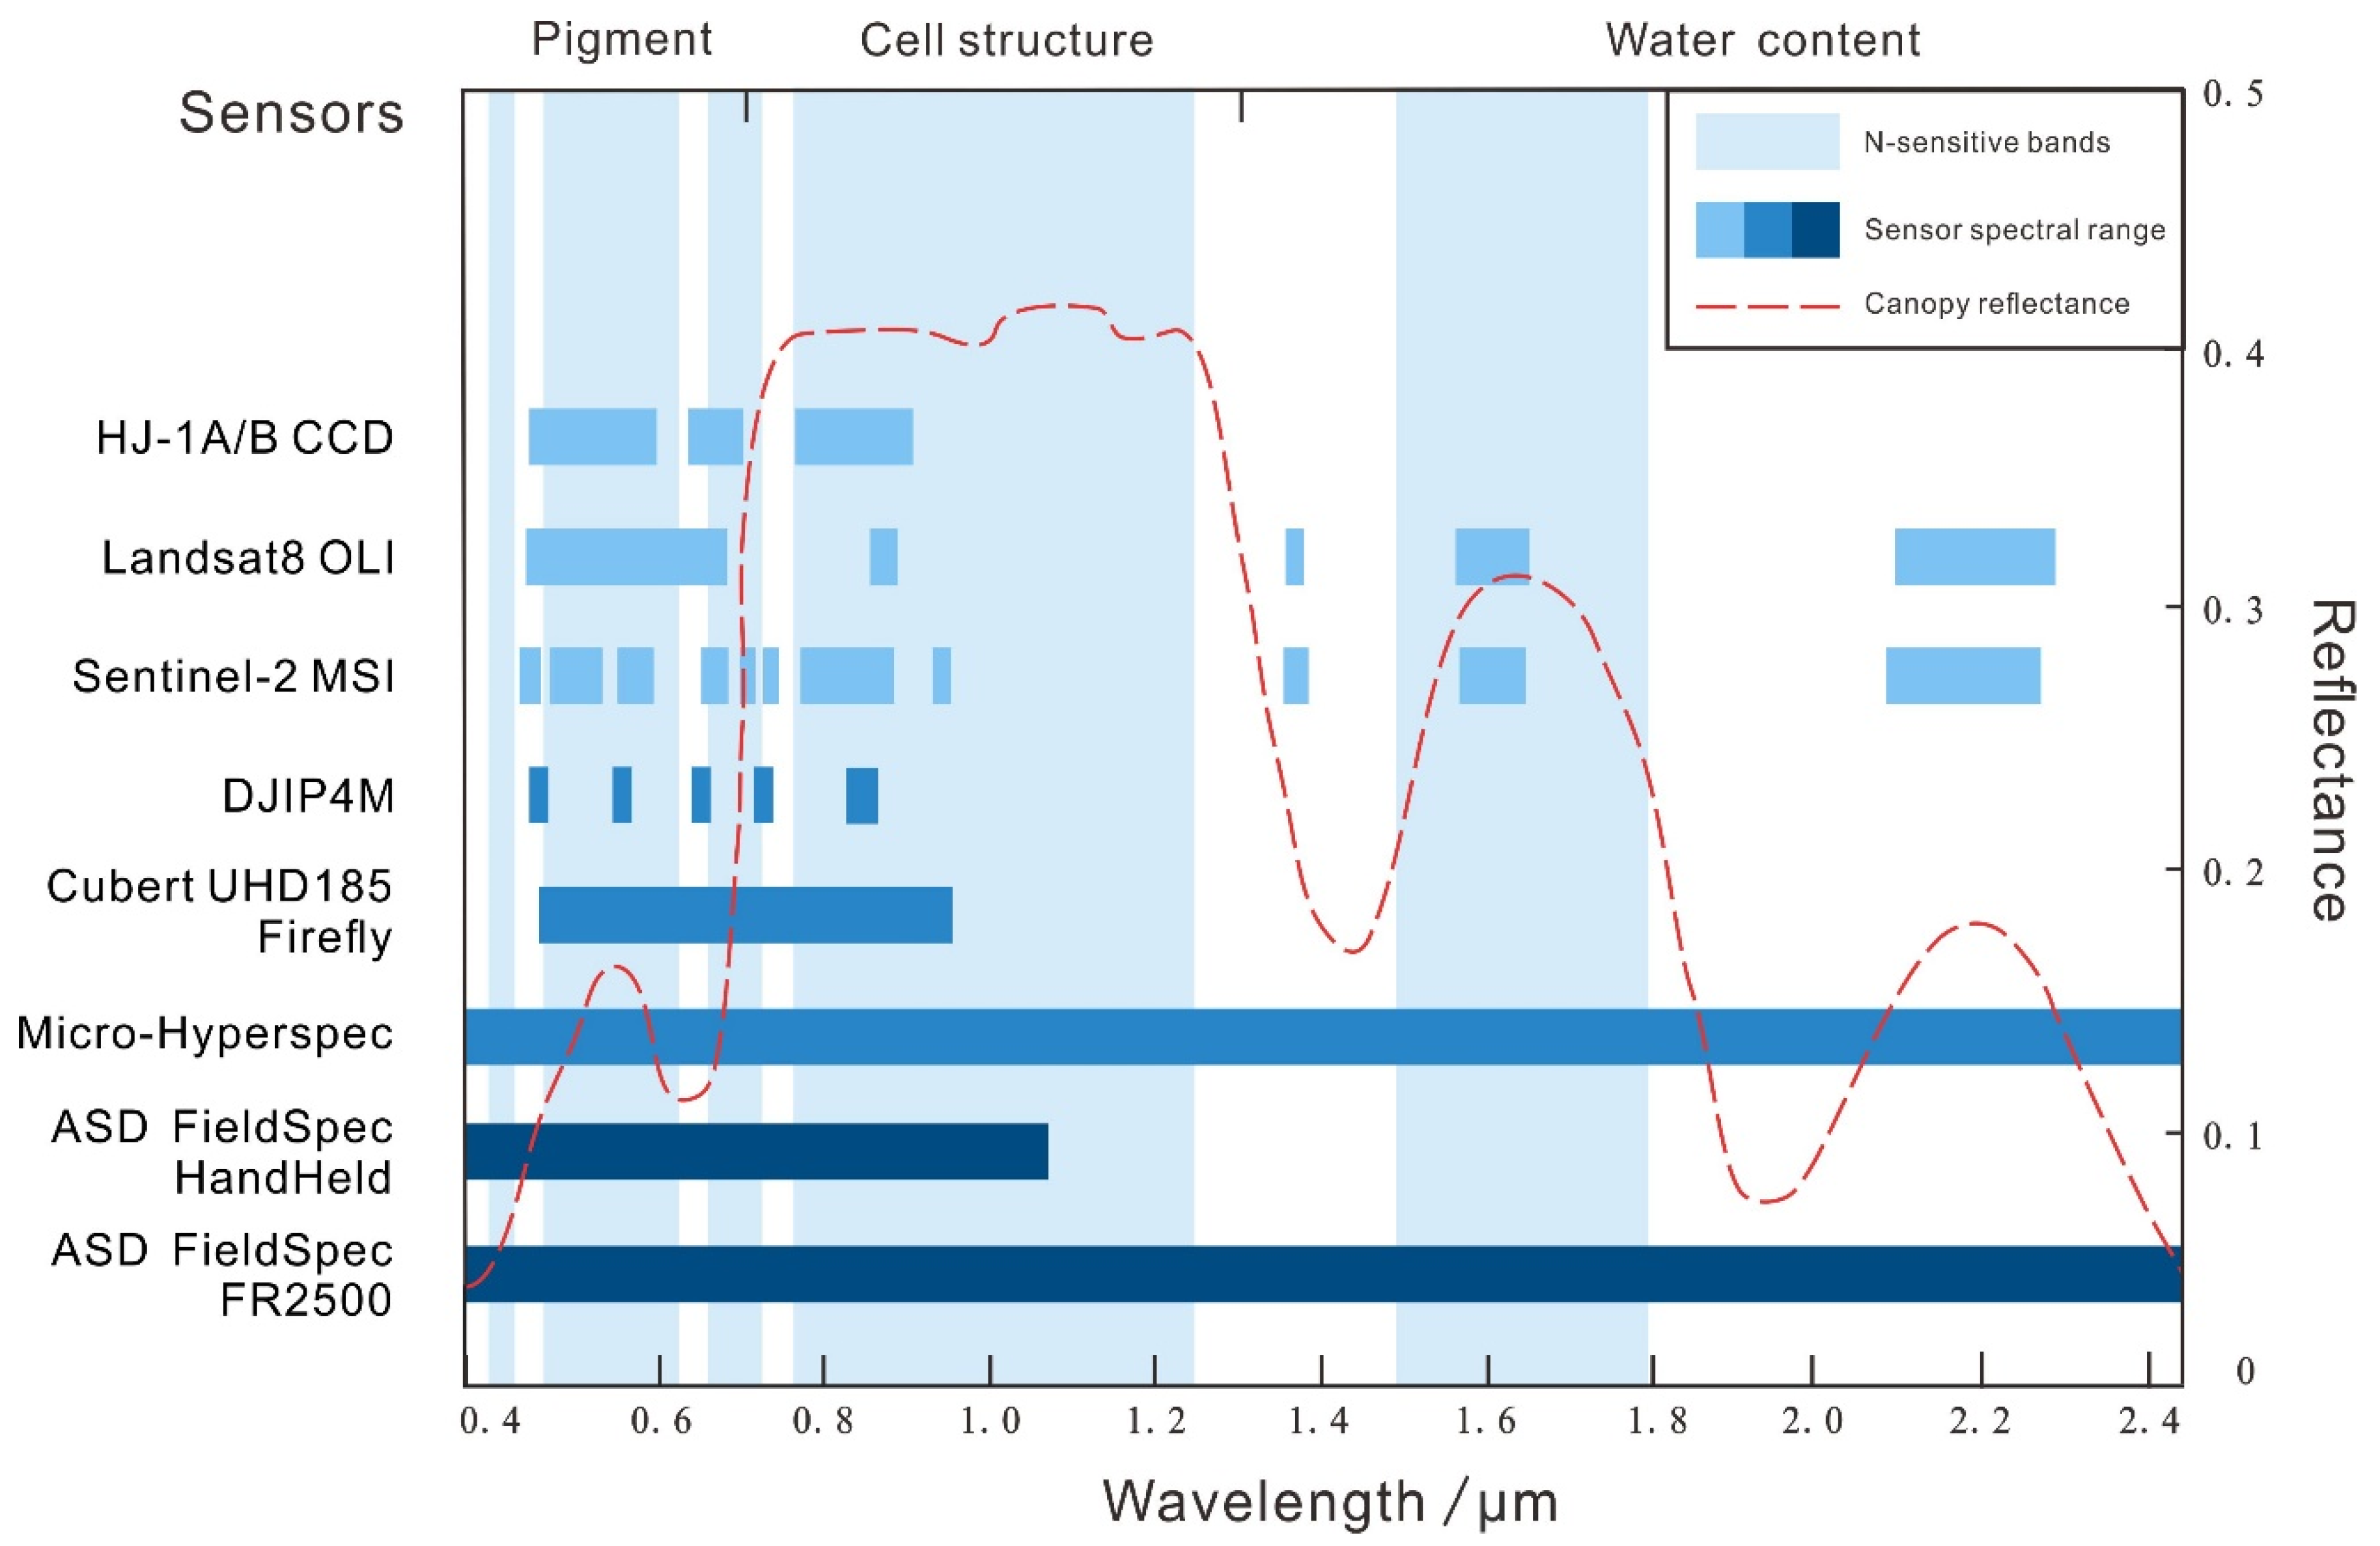
3.1.3. Satellite-Based Platform
3.2. Correlations between Remotely Sensed Data and N Status
3.2.1. Sensitive Spectral Extraction
3.2.2. Mathematical Transformations of Spectra
3.2.3. Spectral Indices

| Index | Formula | Reference |
|---|---|---|
| Nitrogen Reflectance Index | [125] | |
| Red Edge Position: Linear Extrapolation Method | linear extrapolation of two straight lines on the derivative spectral curve (lines formed by 680 nm and 694 nm, and formed by 732 nm and 760 nm) | [126] |
| Normalized Difference Red Edge | [33] | |
| Double-peak Canopy Nitrogen Index | [127] | |
| Nitrogen Planar Domain Index | [118] | |
| Water Resistance Nitrogen Index | [128] | |
| Canopy Chlorophyll Content Index | [129] | |
| Modified Chlorophyll Absorption Ratio Index | [130] | |
| MCARI/MTVI2 | | [131] |
3.3. Retrieval Methods of Canopy N Status
3.3.1. Traditional Statistical Methods
3.3.2. Machine Learning Methods
3.3.3. Physically Based Methods
4. Influential Factors on Accuracy of Remote Sensing Monitoring of Canopy N
4.1. Differences in Data Acquisition Angles
4.2. Vertical Distribution of Leaf N
4.3. Dynamic Changes in N during the Growth Stages
4.4. Physiological Differences in Plants
5. Challenges and Perspectives
6. Conclusions
Author Contributions
Funding
Data Availability Statement
Conflicts of Interest
References
- Miao, Y.; Stewart, B.A.; Zhang, F. Long-term experiments for sustainable nutrient management in China. A review. Agron. Sustain. Dev. 2011, 31, 397–414. [Google Scholar] [CrossRef]
- Liang, G.; Sun, P.; Waring, B.G. Nitrogen agronomic efficiency under nitrogen fertilization does not change over time in the long term: Evidence from 477 global studies. Soil Tillage Res. 2022, 223, 105468. [Google Scholar] [CrossRef]
- Diacono, M.; Rubino, P.; Montemurro, F. Precision nitrogen management of wheat. A review. Agron. Sustain. Dev. 2013, 33, 219–241. [Google Scholar] [CrossRef]
- Lu, J.J.; Wang, H.Y.; Miao, Y.X.; Zhao, L.Q.; Zhao, G.M.; Cao, Q.; Kusnierek, K. Developing an active canopy sensor-based integrated precision rice management system for improving grain yield and quality, nitrogen use efficiency, and lodging resistance. Remote Sens. 2022, 14, 2440. [Google Scholar] [CrossRef]
- Chang, J.F.; Havlik, P.; Leclere, D.; de Vries, W.; Valin, H.; Deppermann, A.; Hasegawa, T.; Obersteiner, M. Reconciling regional nitrogen boundaries with global food security. Nat. Food 2021, 2, 700–711. [Google Scholar] [CrossRef]
- Ren, K.; Xu, M.; Li, R.; Zheng, L.; Liu, S.; Reis, S.; Wang, H.; Lu, C.; Zhang, W.; Gao, H.; et al. Optimizing nitrogen fertilizer use for more grain and less pollution. J. Clean. Prod. 2022, 360, 132180. [Google Scholar] [CrossRef]
- Yang, G.J.; Zhao, C.J.; Li, Z.H. Quantitative Remote Sensing of Crop Nitrogen Nutrition and Its Application; Science Press: Beijing, China, 2019. [Google Scholar]
- Andrews, M.; Raven, J.A.; Lea, P.J. Do plants need nitrate? The mechanisms by which nitrogen form affects plants. Ann. Appl. Biol. 2013, 163, 174–199. [Google Scholar] [CrossRef]
- Li, D.; Tian, M.; Cai, J.; Jiang, D.; Cao, W.; Dai, T. Effects of low nitrogen supply on relationships between photosynthesis and nitrogen status at different leaf position in wheat seedlings. Plant Growth Regul. 2013, 70, 257–263. [Google Scholar] [CrossRef]
- Wang, L.; Xue, C.; Pan, X.; Chen, F.; Liu, Y. Application of controlled-release urea enhances grain yield and nitrogen use efficiency in irrigated rice in the Yangtze River Basin, China. Front. Plant Sci. 2018, 9, 999. [Google Scholar] [CrossRef]
- Fu, Y.; Yang, G.; Li, Z.; Song, X.; Li, Z.; Xu, X.; Wang, P.; Zhao, C. Winter wheat nitrogen status estimation using UAV-based RGB imagery and gaussian processes regression. Remote Sens. 2020, 12, 3778. [Google Scholar] [CrossRef]
- Moharana, S.; Dutta, S. Spatial variability of chlorophyll and nitrogen content of rice from hyperspectral imagery. ISPRS J. Photogramm. Remote Sens. 2016, 122, 17–29. [Google Scholar] [CrossRef]
- Thorp, K.R.; Wang, G.; Bronson, K.F.; Badaruddin, M.; Mon, J. Hyperspectral data mining to identify relevant canopy spectral features for estimating durum wheat growth, nitrogen status, and grain yield. Comput. Electron. Agric. 2017, 136, 1–12. [Google Scholar] [CrossRef]
- Fu, Y.; Yang, G.; Pu, R.; Li, Z.; Li, H.; Xu, X.; Song, X.; Yang, X.; Zhao, C. An overview of crop nitrogen status assessment using hyperspectral remote sensing: Current status and perspectives. Eur. J. Agron. 2021, 124, 126241. [Google Scholar] [CrossRef]
- Sun, J.; Shi, S.; Wang, L.; Li, H.; Wang, S.; Gong, W.; Tagesson, T. Optimizing LUT-based inversion of leaf chlorophyll from hyperspectral lidar data: Role of cost functions and regulation strategies. Int. J. Appl. Earth Obs. Geoinf. 2021, 105, 102602. [Google Scholar] [CrossRef]
- Vigneau, N.; Ecarnot, M.; Rabatel, G.; Roumet, P. Potential of field hyperspectral imaging as a non destructive method to assess leaf nitrogen content in Wheat. Field Crops Res. 2011, 122, 25–31. [Google Scholar] [CrossRef]
- Shao, Y.; Zhao, C.; Bao, Y.; He, Y. Quantification of nitrogen status in rice by least squares support vector machines and reflectance spectroscopy. Food Bioprocess Technol. 2012, 5, 100–107. [Google Scholar] [CrossRef]
- Li, S.; Ji, W.; Chen, S.; Peng, J.; Zhou, Y.; Shi, Z. Potential of VIS-NIR-SWIR spectroscopy from the Chinese soil spectral library for assessment of nitrogen fertilization rates in the paddy-rice region, China. Remote Sens. 2015, 7, 7029–7043. [Google Scholar] [CrossRef]
- Maes, W.H.; Steppe, K. Perspectives for remote sensing with unmanned aerial vehicles in precision agriculture. Trends Plant Sci. 2019, 24, 152–164. [Google Scholar] [CrossRef]
- Inoue, Y.; Sakaiya, E.; Zhu, Y.; Takahashi, W. Diagnostic mapping of canopy nitrogen content in rice based on hyperspectral measurements. Remote Sens. Environ. 2012, 126, 210–221. [Google Scholar] [CrossRef]
- Kattenborn, T.; Schiefer, F.; Zarco-Tejada, P.; Schmidtlein, S. Advantages of retrieving pigment content [μg/cm2] versus concentration [%] from canopy reflectance. Remote Sens. Environ. 2019, 230, 111195. [Google Scholar] [CrossRef]
- Cai, C.; Li, G.; Di, L.; Ding, Y.; Fu, L.; Guo, X.; Struik, P.C.; Pan, G.; Li, H.; Chen, W.; et al. The acclimation of leaf photosynthesis of wheat and rice to seasonal temperature changes in T-FACE environments. Glob. Chang. Biol. 2020, 26, 539–556. [Google Scholar] [CrossRef] [PubMed]
- Boogaard, H.; Van Diepen, C.; Rotter, R.; Cabrera, J.; Van Laar, H. WOFOST 7.1: User’s Guide for the WOFOST 7.1 Crop Growth Simulation Model and WOFOST Control Center 1.5; Wageningen University & Research: Wageningen, The Netherlands, 1998. [Google Scholar]
- Li, D.; Chen, J.M.; Yan, Y.; Zheng, H.; Yao, X.; Zhu, Y.; Cao, W.; Cheng, T. Estimating leaf nitrogen content by coupling a nitrogen allocation model with canopy reflectance. Remote Sens. Environ. 2022, 283, 113314. [Google Scholar] [CrossRef]
- Ohyama, T. Nitrogen as a major essential element of plants. Nitrogen Assim. Plants 2010, 37, 2–17. [Google Scholar]
- Wang, Y.-P.; Chang, Y.-C.; Shen, Y. Estimation of nitrogen status of paddy rice at vegetative phase using unmanned aerial vehicle based multispectral imagery. Precis. Agric. 2022, 23, 1–17. [Google Scholar] [CrossRef]
- Li, D.; Wang, X.; Zheng, H.; Zhou, K.; Yao, X.; Tian, Y.; Zhu, Y.; Cao, W.; Cheng, T. Estimation of area- and mass-based leaf nitrogen contents of wheat and rice crops from water-removed spectra using continuous wavelet analysis. Plant Methods 2018, 14, 76. [Google Scholar] [CrossRef]
- Berger, K.; Verrelst, J.; Feret, J.-B.; Wang, Z.; Wocher, M.; Strathmann, M.; Danner, M.; Mauser, W.; Hank, T. Crop nitrogen monitoring: Recent progress and principal developments in the context of imaging spectroscopy missions. Remote Sens. Environ. 2020, 242, 111758. [Google Scholar] [CrossRef]
- Botha, E.J.; Leblon, B.; Zebarth, B.J.; Watmough, J. Non-destructive estimation of wheat leaf chlorophyll content from hyperspectral measurements through analytical model inversion. Int. J. Remote Sens. 2010, 31, 1679–1697. [Google Scholar] [CrossRef]
- Feret, J.-B.; Berger, K.; de Boissieu, F.; Malenovsky, Z. PROSPECT-PRO for estimating content of nitrogen-containing leaf proteins and other carbon-based constituents. Remote Sens. Environ. 2021, 252, 112173. [Google Scholar] [CrossRef]
- Berger, K.; Verrelst, J.; Feret, J.-B.; Hank, T.; Wocher, M.; Mauser, W.; Camps-Valls, G. Retrieval of aboveground crop nitrogen content with a hybrid machine learning method. Int. J. Appl. Earth Obs. Geoinf. 2020, 92, 102174. [Google Scholar] [CrossRef]
- Zhu, Y.; Yao, X.; Tian, Y.; Liu, X.; Cao, W. Analysis of common canopy vegetation indices for indicating leaf nitrogen accumulations in wheat and rice. Int. J. Appl. Earth Obs. Geoinf. 2008, 10, 1–10. [Google Scholar] [CrossRef]
- Fitzgerald, G.J.; Rodriguez, D.; Christensen, L.K.; Belford, R.; Sadras, V.O.; Clarke, T.R. Spectral and thermal sensing for nitrogen and water status in rainfed and irrigated wheat environments. Precis. Agric. 2006, 7, 233–248. [Google Scholar] [CrossRef]
- Zhu, Y.; Tian, Y.; Yao, X.; Liu, X.; Cao, W. Analysis of common canopy reflectance spectra for indicating leaf nitrogen concentrations in wheat and rice. Plant Prod. Sci. 2007, 10, 400–411. [Google Scholar] [CrossRef]
- Hua, Q.; Yu, Y.; Dong, S.; Li, S.; Shen, H.; Han, Y.; Zhang, J.; Xiao, J.; Liu, S.; Dong, Q.; et al. Leaf spectral responses of Poa crymophila to nitrogen deposition and climate change on Qinghai-Tibetan Plateau. Agric. Ecosyst. Environ. 2019, 284, 106598. [Google Scholar] [CrossRef]
- Tang, Y.L.; Wang, R.C.; Huang, J.F. Relations between red edge characteristics and agronomic parameters of crops. Pedosphere 2004, 14, 467–474. [Google Scholar]
- Zha, H.; Miao, Y.; Wang, T.; Li, Y.; Zhang, J.; Sun, W.; Feng, Z.; Kusnierek, K. Improving unmanned aerial vehicle remote sensing-based rice nitrogen nutrition index prediction with machine learning. Remote Sens. 2020, 12, 215. [Google Scholar] [CrossRef]
- Wang, W.; Yao, X.; Tian, Y.-C.; Liu, X.-J.; Ni, J.; Cao, W.-X.; Zhu, Y. Common spectral bands and optimum vegetation indices for monitoring leaf nitrogen accumulation in rice and wheat. J. Integr. Agric. 2012, 11, 2001–2012. [Google Scholar] [CrossRef]
- Nguyen, H.T.; Lee, B.W. Assessment of rice leaf growth and nitrogen status by hyperspectral canopy reflectance and partial least square regression. Eur. J. Agron. 2006, 24, 349–356. [Google Scholar] [CrossRef]
- He, J.; Ma, J.; Cao, Q.; Wang, X.; Yao, X.; Cheng, T.; Zhu, Y.; Cao, W.; Tian, Y. Development of critical nitrogen dilution curves for different leaf layers within the rice canopy. Eur. J. Agron. 2022, 132, 126414. [Google Scholar] [CrossRef]
- Li, H.; Zhao, C.; Huang, W.; Yang, G. Non-uniform vertical nitrogen distribution within plant canopy and its estimation by remote sensing: A review. Field Crops Res. 2013, 142, 75–84. [Google Scholar] [CrossRef]
- Wang, J.H.; Wang, Z.J.; Huang, W.J.; Ma, Z.H.; Liu, L.Y.; Zhao, C.J. The vertical dist ribution characteristic and spectral response of canopy nitrogen in different layer of winter wheat. Natl. Remote Sens. Bull. 2004, 8, 309–316. [Google Scholar]
- Duan, D.-D.; Zhao, C.-J.; Li, Z.-H.; Yang, G.-J.; Zhao, Y.; Qiao, X.-J.; Zhang, Y.-H.; Zhang, L.-X.; Yang, W.-D. Estimating total leaf nitrogen concentration in winter wheat by canopy hyperspectral data and nitrogen vertical distribution. J. Integr. Agric. 2019, 18, 1562–1570. [Google Scholar] [CrossRef]
- He, J.; Zhang, X.; Guo, W.; Pan, Y.; Yao, X.; Cheng, T.; Zhu, Y.; Cao, W.; Tian, Y. Estimation of vertical leaf nitrogen distribution within a rice canopy based on hyperspectral data. Front. Plant Sci. 2020, 10, 1802. [Google Scholar] [CrossRef] [PubMed]
- Camino, C.; Gonzalez-Dugo, V.; Hernandez, P.; Sillero, J.C.; Zarco-Tejada, P.J. Improved nitrogen retrievals with airborne-derived fluorescence and plant traits quantified from VNIR-SWIR hyperspectral imagery in the context of precision agriculture. Int. J. Appl. Earth Obs. Geoinf. 2018, 70, 105–117. [Google Scholar] [CrossRef]
- Aranguren, M.; Castellon, A.; Aizpurua, A. Crop sensor based non-destructive estimation of nitrogen nutritional status, yield, and grain protein content in wheat. Agriculture 2020, 10, 148. [Google Scholar] [CrossRef]
- Staenz, K.; Secker, J.; Gao, B.C.; Davis, C.; Nadeau, C. Radiative transfer codes applied to hyperspectral data for the retrieval of surface reflectance. ISPRS J. Photogramm. Remote Sens. 2002, 57, 194–203. [Google Scholar] [CrossRef]
- Peron-Danaher, R.; Russell, B.; Cotrozzi, L.; Mohammadi, M.; Couture, J. Incorporating multi-scale, spectrally detected nitrogen concentrations into assessing nitrogen use efficiency for winter wheat breeding populations. Remote Sens. 2021, 13, 3991. [Google Scholar] [CrossRef]
- Jiang, X.; Zhen, J.; Miao, J.; Zhao, D.; Shen, Z.; Jiang, J.; Gao, C.; Wu, G.; Wang, J. Newly-developed three-band hyperspectral vegetation index for estimating leaf relative chlorophyll content of mangrove under different severities of pest and disease. Ecol. Indic. 2022, 140, 108978. [Google Scholar] [CrossRef]
- Xiong, Y.; Liu, B.; Yue, Y. Inversion of nitrogen content of plant leaves based on ASD and FISS. Ecol. Environ. Sci. 2013, 22, 582–587. [Google Scholar]
- Jiang, J.; Zhang, Z.; Cao, Q.; Liang, Y.; Krienke, B.; Tian, Y.; Zhu, Y.; Cao, W.; Liu, X. Use of an active canopy sensor mounted on an unmanned aerial vehicle to monitor the growth and nitrogen status of winter wheat. Remote Sens. 2020, 12, 3684. [Google Scholar] [CrossRef]
- Wang, J.; Xu, B.; Wang, C.; Yang, G.; Yang, Z.; Mei, X.; Yang, X. Design and application of data acquisition and analysis system for CropSense. Smart Agric. 2019, 1, 91–104. [Google Scholar]
- He, L.; Song, X.; Feng, W.; Guo, B.B.; Zhang, Y.S.; Wang, Y.H.; Wang, C.Y.; Guo, T.C. Improved remote sensing of leaf nitrogen concentration in winter wheat using multi-angular hyperspectral data. Remote Sens. Environ. 2016, 174, 122–133. [Google Scholar] [CrossRef]
- Wu, B.; Huang, W.; Ye, H.; Luo, P.; Ren, Y.; Kong, W. Using multi-angular hyperspectral data to estimate the vertical distribution of leaf chlorophyll content in wheat. Remote Sens. 2021, 13, 1501. [Google Scholar] [CrossRef]
- Liao, Q.; Zhang, D.; Wang, J.; Yang, G.; Yang, H.; Craig, C.; Wong, Z.; Wang, D. Assessment of chlorophyli content using a new vegetation index based on multi-angular hyperspectral image data. Spectrosc. Spectr. Anal. 2014, 34, 1599–1604. [Google Scholar]
- Sun, J.; Shi, S.; Gong, W.; Yang, J.; Du, L.; Song, S.; Chen, B.; Zhang, Z. Evaluation of hyperspectral LiDAR for monitoring rice leaf nitrogen by comparison with multispectral LiDAR and passive spectrometer. Sci. Rep. 2017, 7, 40362. [Google Scholar] [CrossRef]
- Huang, S.; Miao, Y.; Yuan, F.; Cao, Q.; Ye, H.; Lenz-Wiedemann, V.I.S.; Bareth, G. In-season diagnosis of rice nitrogen status using proximal fluorescence canopy sensor at different growth stages. Remote Sens. 2019, 11, 1847. [Google Scholar] [CrossRef]
- Du, L.; Gong, W.; Yang, J. Application of spectral indices and reflectance spectrum on leaf nitrogen content analysis derived from hyperspectral LiDAR data. Opt. Laser Technol. 2018, 107, 372–379. [Google Scholar] [CrossRef]
- Pancorbo, J.L.; Camino, C.; Alonso-Ayuso, M.; Raya-Sereno, M.D.; Gonzalez-Fernandez, I.; Gabriel, J.L.; Zarco-Tejada, P.J.; Quemada, M. Simultaneous assessment of nitrogen and water status in winter wheat using hyperspectral and thermal sensors. Eur. J. Agron. 2021, 127, 126287. [Google Scholar] [CrossRef]
- Zhang, J.; Qiu, X.; Wu, Y.; Zhu, Y.; Cao, Q.; Liu, X.; Cao, W. Combining texture, color, and vegetation indices from fixed-wing UAS imagery to estimate wheat growth parameters using multivariate regression methods. Comput. Electron. Agric. 2021, 185, 106138. [Google Scholar] [CrossRef]
- Oppelt, N.; Mauser, W. Hyperspectral monitoring of physiological parameters of wheat during a vegetation period using AVIS data. Int. J. Remote Sens. 2004, 25, 145–159. [Google Scholar] [CrossRef]
- Lu, B.; Dao, P.D.; Liu, J.; He, Y.; Shang, J. Recent advances of hyperspectral imaging technology and applications in agriculture. Remote Sens. 2020, 12, 2659. [Google Scholar] [CrossRef]
- Zhu, H.; Liu, H.; Xu, Y.; Yang, G. UAV-based hyperspectral analysis and spectral indices constructing for quantitatively monitoring leaf nitrogen content of winter wheat. Appl. Opt. 2018, 57, 7722–7732. [Google Scholar] [CrossRef] [PubMed]
- Wang, L.; Chen, S.; Li, D.; Wang, C.; Jiang, H.; Zheng, Q.; Peng, Z. Estimation of paddy rice nitrogen content and accumulation both at leaf and plant levels from UAV hyperspectral imagery. Remote Sens. 2021, 13, 2956. [Google Scholar] [CrossRef]
- Yi, X.; Lan, A.; Wen, X.; Zhang, Y.; Li, Y. Monitoring of heavy metals in farmland soils based on ASD and GaiaSky-mini. Chin. J. Ecol. 2018, 37, 1781–1788. [Google Scholar]
- Wan, L.; Cen, H.; Zhu, J.; Zhang, J.; Du, X.; He, Y. Using fusion of texture features and vegetation indices from water concentration in rice crop to UAV remote sensing monitor. Smart Agric. 2020, 2, 58–67. [Google Scholar]
- Zhu, J.; Cen, H.; He, L.; He, Y. Development and performance evaluation of a multi-rotor unmanned aircraft system for agricultural monitoring. Smart Agric. 2019, 1, 43–52. [Google Scholar]
- Delloye, C.; Weiss, M.; Defourny, P. Retrieval of the canopy chlorophyll content from Sentinel-2 spectral bands to estimate nitrogen uptake in intensive winter wheat cropping systems. Remote Sens. Environ. 2018, 216, 245–261. [Google Scholar] [CrossRef]
- Zhao, H.; Song, X.; Yang, G.; Li, Z.; Zhang, D.; Feng, H. Monitoring of nitrogen and grain protein content in winter wheat based on Sentinel-2A data. Remote Sens. 2019, 11, 1724. [Google Scholar] [CrossRef]
- Houborg, R.; Cescatti, A.; Migliavacca, M.; Kustas, W.P. Satellite retrievals of leaf chlorophyll and photosynthetic capacity for improved modeling of GPP. Agric. For. Meteorol. 2013, 177, 10–23. [Google Scholar] [CrossRef]
- Hunt, E.R., Jr.; Doraiswamy, P.C.; McMurtrey, J.E.; Daughtry, C.S.T.; Perry, E.M.; Akhmedov, B. A visible band index for remote sensing leaf chlorophyll content at the canopy scale. Int. J. Appl. Earth Obs. Geoinf. 2013, 21, 103–112. [Google Scholar] [CrossRef]
- Huang, S.; Miao, Y.; Yuan, F.; Gnyp, M.L.; Yao, Y.; Cao, Q.; Wang, H.; Lenz-Wiedemann, V.I.S.; Bareth, G. Potential of RapidEye and WorldView-2 satellite data for improving rice nitrogen status monitoring at different growth stages. Remote Sens. 2017, 9, 227. [Google Scholar] [CrossRef]
- Magney, T.S.; Eitel, J.U.H.; Vierling, L.A. Mapping wheat nitrogen uptake from RapidEye vegetation indices. Precis. Agric. 2017, 18, 429–451. [Google Scholar] [CrossRef]
- Cui, B.; Zhao, Q.-J.; Huang, W.-J.; Song, X.-Y.; Ye, H.-C.; Zhou, X.-F. Leaf chlorophyll content retrieval of wheat by simulated RapidEye, Sentinel-2 and EnMAP data. J. Integr. Agric. 2019, 18, 1230–1245. [Google Scholar] [CrossRef]
- Croft, H.; Arabian, J.; Chen, J.M.; Shang, J.; Liu, J. Mapping within-field leaf chlorophyll content in agricultural crops for nitrogen management using Landsat-8 imagery. Precis. Agric. 2020, 21, 856–880. [Google Scholar] [CrossRef]
- Yao, X.; Liu, X.J.; Tian, Y.C.; Cao, W.X.; Zhu, Y.; Zhang, Y. Quantitative relationships between satellite channels-based spectral parameters and wheat canopy leaf nitrogen status. Chin. J. Appl. Ecol. 2013, 24, 431–437. [Google Scholar]
- Tan, C.; Zhou, J.; Luo, M.; Du, Y.; Yang, X.; Ma, C. Using combined vegetation indices to monitor leaf chlorophyll content in winter wheat based on Hj-1a/1b images. Int. J. Agric. Biol. 2017, 19, 1576–1584. [Google Scholar]
- Jiang, X.; Fang, S.; Huang, X.; Liu, Y.; Guo, L. Rice mapping and growth monitoring based on time series GF-6 images and red-edge bands. Remote Sens. 2021, 13, 579. [Google Scholar] [CrossRef]
- Kang, Y.; Meng, Q.; Liu, M.; Zou, Y.; Wang, X. Crop classification based on red edge features analysis of GF-6 WFV data. Sensors 2021, 21, 4328. [Google Scholar] [CrossRef]
- Xia, T.; He, Z.; Cai, Z.; Wang, C.; Wang, W.; Wang, J.; Hu, Q.; Song, Q. Exploring the potential of Chinese GF-6 images for crop mapping in regions with complex agricultural landscapes. Int. J. Appl. Earth Obs. Geoinf. 2022, 107, 102702. [Google Scholar] [CrossRef]
- Wang, C.; Zhang, X.; Shi, T.; Zhang, C.; Li, M. Classification of medicinal plants astragalus mongholicus bunge and sophora flavescens aiton using GaoFen-6 and multitemporal Sentinel-2 data. IEEE Geosci. Remote Sens. Lett. 2022, 19, 2502805. [Google Scholar] [CrossRef]
- Chen, P.; Liang, F. Cotton nitrogen nutrition diagnosis based on spectrum and texture feature of images from low altitude unmanned aerial vehicle. Sci. Agric. Sin. 2019, 52, 2220–2229, (In Chinese with English Abstract). [Google Scholar]
- Yu, Z.; Wang, J.I.; Chen, L.I.; Fu, Y.U.; Zhu, H.O.; Feng, H.A.; Xu, X.I.; Li, Z.H. An entirely new approach based on remote sensing data to calculate the nitrogen nutrition index of winter wheat. J. Integr. Agric. 2021, 20, 2535–2551. [Google Scholar]
- Justes, E.; Mary, B.; Meynard, J.M.; Machet, J.M.; Thelier-Huche, L. Determination of a critical nitrogen dilution curve for winter wheat crops. Ann. Bot. 1994, 74, 397–407. [Google Scholar] [CrossRef]
- Zheng, H.; Ma, J.; Zhou, M.; Li, D.; Yao, X.; Cao, W.; Zhu, Y.; Cheng, T. Enhancing the nitrogen signals of rice canopies across critical growth stages through the integration of textural and spectral information from Unmanned Aerial Vehicle (UAV) multispectral imagery. Remote Sens. 2020, 12, 957. [Google Scholar] [CrossRef]
- Li, H.; Li, D.; Xu, K.; Cao, W.; Jiang, X.; Ni, J. Monitoring of nitrogen indices in wheat leaves based on the integration of spectral and canopy structure information. Agronomy 2022, 12, 833. [Google Scholar] [CrossRef]
- Zhou, K.; Cheng, T.; Zhu, Y.; Cao, W.; Ustin, S.L.; Zheng, H.; Yao, X.; Tian, Y. Assessing the impact of spatial resolution on the estimation of leaf nitrogen concentration over the full season of paddy rice using near-surface imaging spectroscopy data. Front. Plant Sci. 2018, 9, 964. [Google Scholar] [CrossRef]
- Zheng, H.; Cheng, T.; Li, D.; Zhou, X.; Yao, X.; Tian, Y.; Cao, W.; Zhu, Y. Evaluation of RGB, color-infrared and multispectral images acquired from unmanned aerial systems for the estimation of nitrogen accumulation in rice. Remote Sens. 2018, 10, 824. [Google Scholar] [CrossRef]
- Hansen, P.M.; Schjoerring, J.K. Reflectance measurement of canopy biomass and nitrogen status in wheat crops using normalized difference vegetation indices and partial least squares regression. Remote Sens. Environ. 2003, 86, 542–553. [Google Scholar] [CrossRef]
- Dunn, B.W.; Dehaan, R.; Schmidtke, L.M.; Dunn, T.S.; Meder, R. Using field-derived hyperspectral reflectance measurement to identify the essential wavelengths for predicting nitrogen uptake of rice at panicle initiation. J. Near Infrared Spectrosc. 2016, 24, 473–483. [Google Scholar] [CrossRef]
- Feng, M.-C.; Zhao, J.-J.; Yang, W.-D.; Wang, C.; Zhang, M.-J.; Xiao, L.-J.; Ding, G.-W. Evaluating winter wheat (Triticum aestivum L.) nitrogen status using canopy spectrum reflectance and multiple statistical analysis. Spectrosc. Lett. 2016, 49, 507–513. [Google Scholar] [CrossRef]
- Tan, C.; Du, Y.; Zhou, J.; Wang, D.; Luo, M.; Zhang, Y.; Guo, W. Analysis of different hyperspectral variables for diagnosing leaf nitrogen accumulation in wheat. Front. Plant Sci. 2018, 9, 674. [Google Scholar] [CrossRef]
- Wang, J.-J.; Song, X.-Y.; Mei, X.; Yang, G.-J.; Li, Z.-H.; Li, H.-L.; Meng, Y. Sensitive bands selection and nitrogen content monitoring of rice based on gaussian regression analysis. Spectrosc. Spectr. Anal. 2021, 41, 1722–1729. [Google Scholar]
- Yu, F.; Feng, S.; Du, W.; Wang, D.; Guo, Z.; Xing, S.; Jin, Z.; Cao, Y.; Xu, T. A study of nitrogen deficiency inversion in rice leaves based on the hyperspectral reflectance differential. Front. Plant Sci. 2020, 11, 573272. [Google Scholar] [CrossRef] [PubMed]
- Liu, T.; Xu, T.; Yu, F.; Yuan, Q.; Guo, Z.; Xu, B. A method combining ELM and PLSR (ELM-P) for estimating chlorophyll content in rice with feature bands extracted by an improved ant colony optimization algorithm. Comput. Electron. Agric. 2021, 186, 106177. [Google Scholar] [CrossRef]
- Yang, B.; Chen, J.; Chen, L.; Cao, W.; Yao, X.; Zhu, Y. Estimation model of wheat canopy nitrogen content based on sensitive bands. Trans. Chin. Soc. Agric. Eng. 2015, 31, 176–182. [Google Scholar]
- Cao, Y.L.; Xiao, W.; Liu, Y.D.; Jiang, K.L.; Guo, B.Y.; Yu, F.H. Dimension reduction of hyperspectral data and analysis of rice nitrogen content. J. Shenyang Agric. Univ. 2021, 52, 109–115. [Google Scholar]
- Liu, H.; Zhu, H.; Wang, P. Quantitative modelling for leaf nitrogen content of winter wheat using UAV-based hyperspectral data. Int. J. Remote Sens. 2017, 38, 2117–2134. [Google Scholar] [CrossRef]
- Lu, J.; Li, W.; Yu, M.; Zhang, X.; Ma, Y.; Su, X.; Yao, X.; Cheng, T.; Zhu, Y.; Cao, W.; et al. Estimation of rice plant potassium accumulation based on non-negative matrix factorization using hyperspectral reflectance. Precis. Agric. 2021, 22, 51–74. [Google Scholar] [CrossRef]
- Xu, X.G.; Zhao, C.J.; Wang, J.H.; Li, C.J.; Yang, X.D. Associating new spectral features from visible and near infrared regions with optimal combination principle to monitor leaf nitrogen concentration in barley. J. Infrared Millim. Waves 2013, 32, 351–358+365. [Google Scholar] [CrossRef]
- An, G.; Xing, M.; He, B.; Liao, C.; Huang, X.; Shang, J.; Kang, H. Using machine learning for estimating rice chlorophyll content from in situ hyperspectral data. Remote Sens. 2020, 12, 3104. [Google Scholar] [CrossRef]
- Boochs, F.; Kupfer, G.; Dockter, K.; Kühbauch, W. Shape of the red edge as vitality indicator for plants. Remote Sens. 1990, 11, 1741–1753. [Google Scholar] [CrossRef]
- Horler, D.N.H.; Barber, J.; Barringer, A.R. Effects of heavy metals on the absorbance and reflectance spectra of plants. Int. J. Remote Sens. 1980, 1, 121–136. [Google Scholar] [CrossRef]
- Feng, W.; Yao, X.; Zhu, Y.; Tian, Y.C.; Cao, W. Monitoring leaf nitrogen status with hyperspectral reflectance in wheat. Eur. J. Agron. 2008, 28, 394–404. [Google Scholar] [CrossRef]
- Tian, Y.; Yao, X.; Yang, J.; Cao, W.; Zhu, Y. Extracting red edge position parameters from ground- and space-based hyperspectral data for estimation of canopy leaf nitrogen concentration in rice. Plant Prod. Sci. 2011, 14, 270–281. [Google Scholar] [CrossRef]
- Li, D.; Cheng, T.; Zhou, K.; Zheng, H.; Yao, X.; Tian, Y.; Zhu, Y.; Cao, W. WREP: A wavelet-based technique for extracting the red edge position from reflectance spectra for estimating leaf and canopy chlorophyll contents of cereal crops. ISPRS J. Photogramm. Remote Sens. 2017, 129, 103–117. [Google Scholar] [CrossRef]
- Guo, B.-B.; Qi, S.-L.; Heng, Y.-R.; Duan, J.-Z.; Zhang, H.-Y.; Wu, Y.-P.; Feng, W.; Xie, Y.-X.; Zhu, Y.-J. Remotely assessing leaf N uptake in winter wheat based on canopy hyperspectral red-edge absorption. Eur. J. Agron. 2017, 82, 113–124. [Google Scholar] [CrossRef]
- Blackburn, G.A. Wavelet decomposition of hyperspectral data: A novel approach to quantifying pigment concentrations in vegetation. Int. J. Remote Sens. 2007, 28, 2831–2855. [Google Scholar] [CrossRef]
- Guo, J.; Zhang, J.; Xiong, S.; Zhang, Z.; Wei, Q.; Zhang, W.; Feng, W.; Ma, X. Hyperspectral assessment of leaf nitrogen accumulation for winter wheat using different regression modeling. Precis. Agric. 2021, 22, 1634–1658. [Google Scholar] [CrossRef]
- Liang, T.; Duan, B.; Luo, X.; Ma, Y.; Yuan, Z.; Zhu, R.; Peng, Y.; Gong, Y.; Fang, S.; Wu, X. Identification of high nitrogen use efficiency phenotype in rice (Oryza sativa L.) through entire growth duration by unmanned aerial vehicle multispectral imagery. Front. Plant Sci. 2021, 12, 740414. [Google Scholar] [CrossRef]
- Cui, B.; Zhao, Q.; Huang, W.; Song, X.; Ye, H.; Zhou, X. A new integrated vegetation index for the estimation of winter wheat leaf chlorophyll content. Remote Sens. 2019, 11, 974. [Google Scholar] [CrossRef]
- Zhu, Y.; Zhou, D.; Yao, X.; Tian, Y.; Cao, W. Quantitative relationships of leaf nitrogen status to canopy spectral reflectance in rice. Aust. J. Agric. Res. 2007, 58, 1077–1085. [Google Scholar] [CrossRef]
- Wang, W.; Yao, X.; Yao, X.; Tian, Y.; Liu, X.; Ni, J.; Cao, W.; Zhu, Y. Estimating leaf nitrogen concentration with three-band vegetation indices in rice and wheat. Field Crops Res. 2012, 129, 90–98. [Google Scholar] [CrossRef]
- Tian, Y.C.; Yao, X.; Yang, J.; Cao, W.X.; Hannaway, D.B.; Zhu, Y. Assessing newly developed and published vegetation indices for estimating rice leaf nitrogen concentration with ground- and space-based hyperspectral reflectance. Field Crops Res. 2011, 120, 299–310. [Google Scholar] [CrossRef]
- Yao, Y.; Miao, Y.; Cao, Q.; Wang, H.; Gnyp, M.L.; Bareth, G.; Khosla, R.; Yang, W.; Liu, F.; Liu, C. In-season estimation of rice nitrogen status with an active crop canopy sensor. IEEE J. Sel. Top. Appl. Earth Obs. Remote Sens. 2014, 7, 4403–4413. [Google Scholar] [CrossRef]
- Wang, W.; Wu, Y.; Zhang, Q.; Zheng, H.; Yao, X.; Zhu, Y.; Cao, W.; Cheng, T. AAVI: A novel approach to estimating leaf nitrogen concentration in rice from unmanned aerial vehicle multispectral imagery at early and middle growth stages. IEEE J. Sel. Top. Appl. Earth Obs. Remote Sens. 2021, 14, 6716–6728. [Google Scholar] [CrossRef]
- Patel, M.K.; Ryu, D.; Western, A.W.; Suter, H.; Young, I.M. Which multispectral indices robustly measure canopy nitrogen across seasons: Lessons from an irrigated pasture crop. Comput. Electron. Agric. 2021, 182, 106000. [Google Scholar] [CrossRef]
- Li, F.; Mistele, B.; Hu, Y.; Yue, X.; Yue, S.; Miao, Y.; Chen, X.; Cui, Z.; Meng, Q.; Schmidhalter, U. Remotely estimating aerial N status of phenologically differing winter wheat cultivars grown in contrasting climatic and geographic zones in China and Germany. Field Crops Res. 2012, 138, 21–32. [Google Scholar] [CrossRef]
- Palka, M.; Manschadi, A.M.; Koppensteiner, L.; Neubauer, T.; Fitzgerald, G.J. Evaluating the performance of the CCCI-CNI index for estimating N status of winter wheat. Eur. J. Agron. 2021, 130, 126346. [Google Scholar] [CrossRef]
- Duan, B.; Fang, S.; Zhu, R.; Wu, X.; Wang, S.; Gong, Y.; Peng, Y. Remote estimation of rice yield with Unmanned Aerial Vehicle (UAV) data and spectral mixture analysis. Front. Plant Sci. 2019, 10, 204. [Google Scholar] [CrossRef]
- Schirrmann, M.; Giebel, A.; Gleiniger, F.; Pflanz, M.; Lentschke, J.; Dammer, K.-H. Monitoring agronomic parameters of winter wheat crops with low-cost UAV imagery. Remote Sens. 2016, 8, 706. [Google Scholar] [CrossRef]
- Wang, Y.; Wang, D.; Shi, P.; Omasa, K. Estimating rice chlorophyll content and leaf nitrogen concentration with a digital still color camera under natural light. Plant Methods 2014, 10, 36. [Google Scholar] [CrossRef]
- Zhang, J.; Cheng, T.; Shi, L.; Wang, W.; Niu, Z.; Guo, W.; Ma, X. Combining spectral and texture features of UAV hyperspectral images for leaf nitrogen content monitoring in winter wheat. Int. J. Remote Sens. 2022, 43, 2335–2356. [Google Scholar] [CrossRef]
- Xu, K.; Zhang, J.; Li, H.; Cao, W.; Zhu, Y.; Jiang, X.; Ni, J. Spectrum- and RGB-D-based image fusion for the prediction of nitrogen accumulation in wheat. Remote Sens. 2020, 12, 4040. [Google Scholar] [CrossRef]
- Bausch, W.C.; Duke, H.R. Remote sensing of plant nitrogen status in corn. Trans. ASAE 1996, 39, 1869–1875. [Google Scholar] [CrossRef]
- Cho, M.A.; Skidmore, A.K. A new technique for extracting the red edge position from hyperspectral data: The linear extrapolation method. Remote Sens. Environ. 2006, 101, 181–193. [Google Scholar] [CrossRef]
- Chen, P.; Haboudane, D.; Tremblay, N.; Wang, J.; Vigneault, P.; Li, B. New spectral indicator assessing the efficiency of crop nitrogen treatment in corn and wheat. Remote Sens. Environ. 2010, 114, 1987–1997. [Google Scholar] [CrossRef]
- Feng, W.; Zhang, H.-Y.; Zhang, Y.-S.; Qi, S.-L.; Heng, Y.-R.; Guo, B.-B.; Ma, D.-Y.; Guo, T.-C. Remote detection of canopy leaf nitrogen concentration in winter wheat by using water resistance vegetation indices from in-situ hyperspectral data. Field Crops Res. 2016, 198, 238–246. [Google Scholar] [CrossRef]
- Barnes, E.; Clarke, T.; Richards, S.; Colaizzi, P.; Haberland, J.; Kostrzewski, M.; Waller, P.; Choi, C.; Riley, E.; Thompson, T. Coincident Detection of Crop Water Stress, Nitrogen Status and Canopy Density Using Ground Based Multispectral Data. In Proceedings of the Fifth International Conference on Precision Agriculture, Bloomington, MN, USA, 16–19 July 2000; p. 6. [Google Scholar]
- Daughtry, C.S.; Walthall, C.; Kim, M.; De Colstoun, E.B.; McMurtrey Iii, J.E. Estimating corn leaf chlorophyll concentration from leaf and canopy reflectance. Remote Sens. Environ. 2000, 74, 229–239. [Google Scholar] [CrossRef]
- Eitel, J.U.H.; Long, D.S.; Gessler, P.E.; Hunt, E.R. Combined spectral index to improve ground-based estimates of nitrogen status in dryland wheat. Agron. J. 2008, 100, 1694–1702. [Google Scholar] [CrossRef]
- Lelong, C.C.D.; Burger, P.; Jubelin, G.; Roux, B.; Labbe, S.; Baret, F. Assessment of unmanned aerial vehicles imagery for quantitative monitoring of wheat crop in small plots. Sensors 2008, 8, 3557–3585. [Google Scholar] [CrossRef]
- Chen, Z.; Miao, Y.; Lu, J.; Zhou, L.; Li, Y.; Zhang, H.; Lou, W.; Zhang, Z.; Kusnierek, K.; Liu, C. In-season diagnosis of winter wheat nitrogen status in smallholder farmer fields across a village using unmanned aerial vehicle-based remote sensing. Agronomy 2019, 9, 619. [Google Scholar] [CrossRef]
- Brinkhoff, J.; Dunn, B.W.; Robson, A.J.; Dunn, T.S.; Dehaan, R.L. Modeling mid-season rice nitrogen uptake using multispectral satellite data. Remote Sens. 2019, 11, 1837. [Google Scholar] [CrossRef]
- Yang, J.; Gong, W.; Shi, S.; Du, L.; Sun, J.; Song, S.L. Estimation of nitrogen content based on fluorescence spectrum and principal component analysis in paddy rice. Plant Soil Environ. 2016, 62, 178–183. [Google Scholar] [CrossRef]
- Yl, Q.-X.; Huang, J.-F.; Wang, F.-M.; Wang, X.-Z.; Liu, Z.-Y. Monitoring rice nitrogen status using hyperspectral reflectance and artificial neural network. Environ. Sci. Technol. 2007, 41, 6770–6775. [Google Scholar]
- Du, L.; Yang, J.; Sun, J.; Shi, S.; Gong, W. Leaf biochemistry parameters estimation of vegetation using the appropriate inversion strategy. Front. Plant Sci. 2020, 11, 533. [Google Scholar] [CrossRef] [PubMed]
- Yang, J.; Du, L.; Gong, W.; Shi, S.; Sun, J. Estimating leaf nitrogen concentration based on the combination with fluorescence spectrum and first-derivative. R. Soc. Open Sci. 2020, 7, 191941. [Google Scholar] [CrossRef]
- Yang, J.; Song, S.; Du, L.; Shi, S.; Gong, W.; Sun, J.; Chen, B. Analyzing the effect of fluorescence characteristics on leaf nitrogen concentration estimation. Remote Sens. 2018, 10, 1402. [Google Scholar] [CrossRef]
- Yao, X.; Huang, Y.; Shang, G.; Zhou, C.; Cheng, T.; Tian, Y.; Cao, W.; Zhu, Y. Evaluation of six algorithms to monitor wheat leaf nitrogen concentration. Remote Sens. 2015, 7, 14939–14966. [Google Scholar] [CrossRef]
- Wang, L.; Zhou, X.; Zhu, X.; Guo, W. Estimation of leaf nitrogen concentration in wheat using the MK-SVR algorithm and satellite remote sensing data. Comput. Electron. Agric. 2017, 140, 327–337. [Google Scholar] [CrossRef]
- Liang, L.; Di, L.; Huang, T.; Wang, J.; Lin, L.; Wang, L.; Yang, M. Estimation of leaf nitrogen content in wheat using new hyperspectral indices and a random forest regression algorithm. Remote Sens. 2018, 10, 1940. [Google Scholar] [CrossRef]
- Van Wittenberghe, S.; Verrelst, J.; Rivera, J.P.; Alonso, L.; Moreno, J.; Samson, R. Gaussian processes retrieval of leaf parameters from a multi-species reflectance, absorbance and fluorescence dataset. J. Photochem. Photobiol. B-Biol. 2014, 134, 37–48. [Google Scholar] [CrossRef]
- Chlingaryan, A.; Sukkarieh, S.; Whelan, B. Machine learning approaches for crop yield prediction and nitrogen status estimation in precision agriculture: A review. Comput. Electron. Agric. 2018, 151, 61–69. [Google Scholar] [CrossRef]
- Shah, S.H.; Angel, Y.; Houborg, R.; Ali, S.; McCabe, M.F. A random forest machine learning approach for the retrieval of leaf chlorophyll content in wheat. Remote Sens. 2019, 11, 920. [Google Scholar] [CrossRef]
- Jacquemoud, S.; Baret, F. PROSPECT: A model of leaf optical properties spectra. Remote Sens. Environ. 1990, 34, 75–91. [Google Scholar] [CrossRef]
- Feret, J.-B.; Francois, C.; Asner, G.P.; Gitelson, A.A.; Martin, R.E.; Bidel, L.P.R.; Ustin, S.L.; Le Maire, G.; Jacquemoud, S. PROSPECT-4 and 5: Advances in the leaf optical properties model separating photosynthetic pigments. Remote Sens. Environ. 2008, 112, 3030–3043. [Google Scholar] [CrossRef]
- Jacquemoud, S.; Verhoef, W.; Baret, F.; Bacour, C.; Zarco-Tejada, P.J.; Asner, G.P.; Francois, C.; Ustin, S.L. PROSPECT plus SAIL models: A review of use for vegetation characterization. Remote Sens. Environ. 2009, 113, S56–S66. [Google Scholar] [CrossRef]
- Verhoef, W. Light scattering by leaf layers with application to canopy reflectance modeling: The SAIL model. Remote Sens. Environ. 1984, 16, 125–141. [Google Scholar] [CrossRef]
- Danner, M.; Berger, K.; Wocher, M.; Mauser, W.; Hank, T. Retrieval of biophysical crop variables from multi-angular canopy spectroscopy. Remote Sens. 2017, 9, 726. [Google Scholar] [CrossRef]
- Sun, J.; Shi, S.; Yang, J.; Chen, B.; Gong, W.; Du, L.; Mao, F.; Song, S. Estimating leaf chlorophyll status using hyperspectral lidar measurements by PROSPECT model inversion. Remote Sens. Environ. 2018, 212, 1–7. [Google Scholar] [CrossRef]
- Luo, Y.; Weng, E.; Wu, X.; Gao, C.; Zhou, X.; Zhang, L. Parameter identifiability, constraint, and equifinality in data assimilation with ecosystem models. Ecol. Appl. 2009, 19, 571–574. [Google Scholar] [CrossRef]
- Combal, B.; Baret, F.; Weiss, M.; Trubuil, A.; Mace, D.; Pragnere, A.; Myneni, R.; Knyazikhin, Y.; Wang, L. Retrieval of canopy biophysical variables from bidirectional reflectance—Using prior information to solve the ill-posed inverse problem. Remote Sens. Environ. 2003, 84, 1–15. [Google Scholar] [CrossRef]
- Thorp, K.R.; Wang, G.; West, A.L.; Moran, M.S.; Bronson, K.F.; White, J.W.; Mon, J. Estimating crop biophysical properties from remote sensing data by inverting linked radiative transfer and ecophysiological models. Remote Sens. Environ. 2012, 124, 224–233. [Google Scholar] [CrossRef]
- Yang, G.; Zhao, C.; Pu, R.; Feng, H.; Li, Z.; Li, H.; Sun, C. Leaf nitrogen spectral reflectance model of winter wheat (Triticum aestivum) based on PROSPECT: Simulation and inversion. J. Appl. Remote Sens. 2015, 9, 095976. [Google Scholar] [CrossRef]
- Li, Z.; Jin, X.; Yang, G.; Drummond, J.; Yang, H.; Clark, B.; Li, Z.; Zhao, C. Remote sensing of leaf and canopy nitrogen status in winter wheat (Triticum aestivum L.) based on N-PROSAIL model. Remote Sens. 2018, 10, 1463. [Google Scholar] [CrossRef]
- Li, Z.; Li, Z.; Fairbairn, D.; Li, N.; Xu, B.; Feng, H.; Yang, G. Multi-LUTs method for canopy nitrogen density estimation in winter wheat by field and UAV hyperspectral. Comput. Electron. Agric. 2019, 162, 174–182. [Google Scholar] [CrossRef]
- Verrelst, J.; Berger, K.; Rivera-Caicedo, J.P. Intelligent sampling for vegetation nitrogen mapping based on hybrid machine learning algorithms. IEEE Geosci. Remote Sens. Lett. 2021, 18, 2038–2042. [Google Scholar] [CrossRef]
- Stagakis, S.; Markos, N.; Sykioti, O.; Kyparissis, A. Monitoring canopy biophysical and biochemical parameters in ecosystem scale using satellite hyperspectral imagery: An application on a Phlomis fruticosa Mediterranean ecosystem using multiangular CHRIS/PROBA observations. Remote Sens. Environ. 2010, 114, 977–994. [Google Scholar] [CrossRef]
- Nagol, J.R.; Sexton, J.; Kim, D.-H.; Anand, A.; Morton, D.; Vermote, E.; Townshend, J.R. Bidirectional effects in Landsat reflectance estimates: Is there a problem to solve? ISPRS J. Photogramm. Remote Sens. 2015, 103, 129–135. [Google Scholar] [CrossRef]
- Song, X.; Feng, W.; He, L.; Xu, D.; Zhang, H.-Y.; Li, X.; Wang, Z.-J.; Coburn, C.A.; Wang, C.-Y.; Guo, T.-C. Examining view angle effects on leaf N estimation in wheat using field reflectance spectroscopy. ISPRS J. Photogramm. Remote Sens. 2016, 122, 57–67. [Google Scholar] [CrossRef]
- Lu, N.; Wang, W.; Zhang, Q.; Li, D.; Yao, X.; Tian, Y.; Zhu, Y.; Cao, W.; Baret, F.; Liu, S.; et al. Estimation of nitrogen nutrition status in winter wheat from unmanned aerial vehicle based multi-angular multispectral imagery. Front. Plant Sci. 2019, 10, 1601. [Google Scholar] [CrossRef]
- Sun, T.; Fang, H.; Liu, W.; Ye, Y. Impact of water background on canopy reflectance anisotropy of a paddy rice field from multi-angle measurements. Agric. For. Meteorol. 2017, 233, 143–152. [Google Scholar] [CrossRef]
- Huang, W.; Yang, Q.; Pu, R.; Yang, S. Estimation of nitrogen vertical distribution by bi-directional canopy reflectance in winter wheat. Sensors 2014, 14, 20347–20359. [Google Scholar] [CrossRef]
- Ma, C.; Zhai, L.; Li, C.; Wang, Y. Hyperspectral estimation of nitrogen content in different leaf positions of wheat using machine learning models. Appl. Sci. 2022, 12, 7427. [Google Scholar] [CrossRef]
- He, L.; Liu, M.-R.; Guo, Y.-L.; Wei, Y.-K.; Zhang, H.-Y.; Song, X.; Feng, W.; Guo, T.-C. Angular effect of algorithms for monitoring leaf nitrogen concentration of wheat using multi-angle remote sensing data. Comput. Electron. Agric. 2022, 195, 106815. [Google Scholar] [CrossRef]
- Zhang, J.; Miao, Y.; Batchelor, W.D.; Lu, J.; Wang, H.; Kang, S. Improving high-latitude rice nitrogen management with the CERES-rice crop model. Agronomy 2018, 8, 263. [Google Scholar] [CrossRef]
- Zhao, P.; Zhou, Y.; Li, F.; Ling, X.; Deng, N.; Peng, S.; Man, J. The adaptability of APSIM-wheat model in the middle and lower reaches of the Yangtze River Plain of China: A case study of winter wheat in Hubei Province. Agronomy 2020, 10, 981. [Google Scholar] [CrossRef]
- Si, Z.; Zain, M.; Li, S.; Liu, J.; Liang, Y.; Gao, Y.; Duan, A. Optimizing nitrogen application for drip-irrigated winter wheat using the DSSAT-CERES-wheat model. Agric. Water Manag. 2021, 244, 106592. [Google Scholar] [CrossRef]
- Cao, J.; Liu, X.J.; Tang, L.; Cao, W.X.; Zhu, Y. Model designing for suitable nitrogen index dynamics of rice and wheat. Chin. J. Appl. Ecol. 2010, 21, 359–364. [Google Scholar]
- Zhang, X.; Friedl, M.A.; Schaaf, C.B. Global vegetation phenology from Moderate Resolution Imaging Spectroradiometer (MODIS): Evaluation of global patterns and comparison with in situ measurements. J. Geophys. Res.-Biogeosci. 2006, 111. [Google Scholar] [CrossRef]
- Zheng, H.; Cheng, T.; Yao, X.; Deng, X.; Tian, Y.; Cao, W.; Zhu, Y. Detection of rice phenology through time series analysis of ground-based spectral index data. Field Crops Res. 2016, 198, 131–139. [Google Scholar] [CrossRef]
- Zhang, M.; Zhu, D.; Su, W.; Huang, J.; Zhang, X.; Liu, Z. Harmonizing multi-source remote sensing images for summer corn growth monitoring. Remote Sens. 2019, 11, 1266. [Google Scholar] [CrossRef]
- Shu, M.; Gu, X.; Zhou, L.; Xu, B.; Yang, G. Establishing NDRE dynamic models of winter wheat under multi-nitrogen rates based on a field spectral sensor. Appl. Opt. 2021, 60, 993–1002. [Google Scholar] [CrossRef] [PubMed]
- Schlemmer, M.R.; Francis, D.D.; Shanahan, J.F.; Schepers, J.S. Remotely measuring chlorophyll content in corn leaves with differing nitrogen levels and relative water content. Agron. J. 2005, 97, 106–112. [Google Scholar] [CrossRef]
- Kusnierek, K.; Korsaeth, A. Simultaneous identification of spring wheat nitrogen and water status using visible and near infrared spectra and powered partial least squares regression. Comput. Electron. Agric. 2015, 117, 200–213. [Google Scholar] [CrossRef]
- Klem, K.; Zahora, J.; Zemek, F.; Trunda, P.; Tuma, I.; Novotna, K.; Hodanova, P.; Rapantova, B.; Hanus, J.; Vavrikova, J.; et al. Interactive effects of water deficit and nitrogen nutrition on winter wheat. Remote sensing methods for their detection. Agric. Water Manag. 2018, 210, 171–184. [Google Scholar] [CrossRef]
- Berger, K.; Machwitz, M.; Kycko, M.; Kefauver, S.C.; Van Wittenberghe, S.; Gerhards, M.; Verrelst, J.; Atzberger, C.; van der Tol, C.; Damm, A.; et al. Multi-sensor spectral synergies for crop stress detection and monitoring in the optical domain: A review. Remote Sens. Environ. 2022, 280, 113198. [Google Scholar] [CrossRef]
- Devadas, R.; Lamb, D.W.; Backhouse, D.; Simpfendorfer, S. Sequential application of hyperspectral indices for delineation of stripe rust infection and nitrogen deficiency in wheat. Precis. Agric. 2015, 16, 477–491. [Google Scholar] [CrossRef]
- Raj, R.; Walker, J.P.; Pingale, R.; Banoth, B.N.; Jagarlapudi, A. Leaf nitrogen content estimation using top-of-canopy airborne hyperspectral data. Int. J. Appl. Earth Obs. Geoinf. 2021, 104, 102584. [Google Scholar] [CrossRef]
- Wu, S.; Deng, L.; Guo, L.; Wu, Y. Wheat leaf area index prediction using data fusion based on high-resolution unmanned aerial vehicle imagery. Plant Methods 2022, 18, 68. [Google Scholar] [CrossRef]
- Qiao, L.; Gao, D.; Zhang, J.; Li, M.; Sun, H.; Ma, J. Dynamic influence elimination and chlorophyll content diagnosis of maize using UAV spectral imagery. Remote Sens. 2020, 12, 2650. [Google Scholar] [CrossRef]
- Xu, X.; Fan, L.; Li, Z.; Meng, Y.; Feng, H.; Yang, H.; Xu, B. Estimating leaf nitrogen content in corn based on information fusion of multiple-sensor imagery from UAV. Remote Sens. 2021, 13, 340. [Google Scholar] [CrossRef]
- Yao, X.; Ren, H.; Cao, Z.; Tian, Y.; Cao, W.; Zhu, Y.; Cheng, T. Detecting leaf nitrogen content in wheat with canopy hyperspectrum under different soil backgrounds. Int. J. Appl. Earth Obs. Geoinf. 2014, 32, 114–124. [Google Scholar] [CrossRef]
- Upreti, D.; Huang, W.; Kong, W.; Pascucci, S.; Pignatti, S.; Zhou, X.; Ye, H.; Casa, R. A comparison of hybrid machine learning algorithms for the retrieval of wheat biophysical variables from Sentinel-2. Remote Sens. 2019, 11, 481. [Google Scholar] [CrossRef]
- Verger, A.; Baret, F.; Camacho, F. Optimal modalities for radiative transfer-neural network estimation of canopy biophysical characteristics: Evaluation over an agricultural area with CHRIS/PROBA observations. Remote Sens. Environ. 2011, 115, 415–426. [Google Scholar] [CrossRef]
- Doktor, D.; Lausch, A.; Spengler, D.; Thurner, M. Extraction of plant physiological status from hyperspectral signatures using machine learning methods. Remote Sens. 2014, 6, 12247–12274. [Google Scholar] [CrossRef]


| Crop | N Status | Data Platforms | Indices | Retrieval Method | Results | References |
|---|---|---|---|---|---|---|
| Wheat | LNA | ASD FieldSpec Pro | Spectral bands VIs | PLSR SVM RF | R2 = 0.895 RMSE = 0.903 g/m2 | [109] |
| Rice | LNC CNC | ASD FieldSpec Pro2500 ASD FieldSpec3 | Spectral bands VIs | GPR RF, GPR-RF SVR, GPR=SVR | R2 > 0.94 NRMSE < 6% | [52] |
| Wheat | CND | ASD FieldSpec Handheld UAV (UHD 185 Firefly) | VIs | N-PROSAIL | Field: R2 = 0.83 RMSE = 0.23 UAV: R2 = 0.74 RMSE = 0.26 | [157] |
| Wheat | N concentration N content | ASD FieldSpec HandHeld | Spectral bands VIs | Statistical analysis | N concentration: R2 = 0.81 RMSE = 0.72% N content: R2 = 0.96 RMSE = 0.83 g/m2 | [119] |
| Wheat | LNA | ASD FieldSpec HandHeld 2 RealSense depth camera D435i | VIs Texture | MLR BP | R2 = 0.74 RRMSEs = 40.13% | [124] |
| Rice | LNC | UAV (AIRPHEN multispectral camera) | VIs | Linear spectral mixture analysis Statistical analysis | R2 = 0.78 RMSE = 0.26% RMSE = 10.4% | [116] |
| Wheat | LNC | UAV (hyperspectral camera) | VIs Texture | RR PLSR SVR RF | R2 = 0.84 RMSE = 0.25 | [123] |
| Wheat | LNC LNA | ASD FieldSpec Handheld 2 RealSense depth camera D435i | VIs Canopy structural | PLS RF | LNC: R2 = 0.78 RMSE = 0.35% LNA: R2 = 0.79 RMSE = 1.54 g/m2 | [86] |
| Rice | NNI | UAV (Parrot Sequoia camera) | Spectral bands VIs | LR, SMLR RF SVM ANN | RF accuracy is the highest: R2 = 0.61 (stem elongation stage) R2 = 0.79 (heading stage) RMSEs = 0.09 | [37] |
| Rice | LNC PNC LNA PNA | UAV (Cubert S185 hyperspectral camera) | Spectral bands VIs | LR, MLR PLSR ANN RF SVM | At single growth stage, LR estimation N status based on VIs has the highest accuracy; at multiple growth stages, PLSR and ML are better. | [64] |
| Wheat | N content | HyMap sensor | Spectral bands | PROSAIL-PRO GP Heteroscedastic GP | RMSE = 2.1 g/m2 The optimal N retrieval spectral bands are in the SWIR. | [31] |
| Wheat | LCC | Landsat8 ASD FieldSpec Pro | VIs | LR PROSPECT SAIL | Use hyperspectral leaf reflectance data to simulate Landsat-8 bands LR: R2 = 0.59 PROSPECT: R2 = 0.64 | [75] |
| Wheat | LCC | Sentinel-2 RapidEye EnMAP | Spectral bands | PLSR | Sentinel-2: R2 = 0.755 RapidEye: R2 = 0.689 EnMAP: R2 = 0.735 | [74] |
| Wheat | LNC | ASD FieldSpec HandHeld | VIs | Statistical analysis | AIVI could overcomes the impact of VZAs: R2 = 0.84 at −20° R2 = 0.83 at −10° to −40° | [53] |
| Wheat | LNC | ASD FieldSpec | VIs Spectral bands | VIs BPNN XGBoost PLSR | R2 ≥ 0.83 at 0° to −30° VZAs range The accuracy of PLSR is better than VIs (16–17%), BPNN (15–16%) and XGBoost (29–58%) at VZAs ±60° | [166] |
| Rice | LNCLi | ASD FieldSpec4 | VIs | Vertical distribution model | LNCL1: R2 = 0.768 LNCL2: R2 = 0.700 LNCL3: R2 = 0.623 LNCL4: R2 = 0.549 | [44] |
| Wheat | NNI | ASD FieldSpec Micro-Hyperspec and NIR-100 imager SC655 thermal camera | VIs Thermal indices | Statistical analysis | The combination of CCCI and DWI can overcome the influence of water to retrieve NNI, and the RMSE is reduced to 0.109. | [59] |
Publisher’s Note: MDPI stays neutral with regard to jurisdictional claims in published maps and institutional affiliations. |
© 2022 by the authors. Licensee MDPI, Basel, Switzerland. This article is an open access article distributed under the terms and conditions of the Creative Commons Attribution (CC BY) license (https://creativecommons.org/licenses/by/4.0/).
Share and Cite
Zheng, J.; Song, X.; Yang, G.; Du, X.; Mei, X.; Yang, X. Remote Sensing Monitoring of Rice and Wheat Canopy Nitrogen: A Review. Remote Sens. 2022, 14, 5712. https://doi.org/10.3390/rs14225712
Zheng J, Song X, Yang G, Du X, Mei X, Yang X. Remote Sensing Monitoring of Rice and Wheat Canopy Nitrogen: A Review. Remote Sensing. 2022; 14(22):5712. https://doi.org/10.3390/rs14225712
Chicago/Turabian StyleZheng, Jie, Xiaoyu Song, Guijun Yang, Xiaochu Du, Xin Mei, and Xiaodong Yang. 2022. "Remote Sensing Monitoring of Rice and Wheat Canopy Nitrogen: A Review" Remote Sensing 14, no. 22: 5712. https://doi.org/10.3390/rs14225712
APA StyleZheng, J., Song, X., Yang, G., Du, X., Mei, X., & Yang, X. (2022). Remote Sensing Monitoring of Rice and Wheat Canopy Nitrogen: A Review. Remote Sensing, 14(22), 5712. https://doi.org/10.3390/rs14225712