Abstract
The dynamic evolutions of the noon ionospheric Equatorial Ionization Anomaly (EIA) owing to the 2022 Tonga volcanic eruption were investigated using the ionospheric plasma measurements from the Swarm satellite, the science experiment of the Constellation Observing Systems for Meteorology, Ionosphere, and Climate (COSMIC) mission, and the thermospheric wind observations from the Ionospheric Connection Explorer (ICON). At 14.1 universal time (UT), the noon EIA was enhanced for the upward plasma drifts, when the F2-layer was significantly uplifted from 360 km to 410 km. At 15.6 UT, because of the downward drifts, the intensity of the EIA reduced, and hmF2 decreased to 270 km. At 17–18 UT, the EIA recovered and reformed, and hmF2 increased to 350 km. A two-peak structure in the plasma was observed at Swarm altitudes. The temporal evolution might be related to the vertical plasma drifts (both downward and upward) from the E-region electric field.
1. Introduction
Since its discovery, plasma in the Earth’s ionosphere has been important for radio wave propagation and has important application value for communication, navigation, and positioning. At different latitudes, the ionospheric plasma shows significantly different behaviors. For example, the Equatorial Ionization Anomaly (EIA) at ±15° Magnetic latitudes (MLat) [1,2], and the tongue of ionization at polar latitudes [3,4]. Electron density is also clearly dependent upon altitude, which usually reaches a maximum at the F2-layer peak height (hmF2) [5]. Therefore, understanding the behaviors of ionospheric plasma, and the associated dynamic and electrodynamic processes, has great scientific value for the modeling and forecasting of weather in near-Earth space.
During the past few decades, it has been reported that the ionosphere can be influenced by the forcings from below in lower atmosphere. This includes hazardous events such as thunderstorms and earthquakes, and these effects have been reported in previous studies, e.g., [6,7,8,9]. Tropospheric thunderstorms can regulate nighttime electron density in the lower ionosphere at altitudes of 65–90 km because of lightning discharge effects [9]. Shao et al. [9] suggested that the electric field produced by lightning discharges can reduce the electron density at 75~85 km owing to enhanced electron attachment to atmospheric molecular O2. It also increased the plasma density at 85~95 km for the ionization of molecular N2 and O2. A large amount of energy could be released into the atmosphere via waves and electric fields, because of the movement of Earth’s lithospheric plate [7,8]. For example, the imprints of earthquakes in zonal plasma drifts at the equatorial F-layer and the related spatial structures of plasma bubbles (ionospheric structures whose density is significantly less than the background density) were observed by Gurram et al. [7]. A significant enhancement (~88.5 m/s) in the equatorial plasma drifts occurred 20 min prior to the start of a major earthquake on 28 March 2005 with its epicenter near Sumatra, Indonesia.
In addition to the effects of earthquakes and thunderstorms, potential physical connections between volcanic eruptions and the ionosphere have been previously reported [10,11,12,13,14,15,16,17]. Using total electron content (TEC) observations from the ground-based Global Navigation Satellite System (GNSS), Cahyadi et al. [10] found that TEC disturbances during five different volcanic explosions had a large degree of similarity in the N-shape structures with periods of approximately 1.3 min. Dautermann et al. [11] found that at the Soufrière Hills on 13 July 2003, volcano-linked acoustic waves had a velocity of ~624 m/s. On 15 January 2022, an enormous geohazard of underwater volcanic eruptions occurred at 4.25 universal time (UT) on the Tonga Islands. The energy released by the volcanic eruption was equivalent to 4–18 megatons of TNT. It was the most powerful volcanic explosion in more than 30 years. To date, a large amount of attention had been paid to the understanding of volcano-linked ionospheric disturbances and their related potential physical mechanisms [18,19,20,21,22,23,24,25]. Using a 2DH ocean numerical model, Amores et al. [19] simulated the propagation and characteristics of Lamb waves. Their results showed that Lamb waves propagated across the Earth several times, and for the first time, at a speed of ~312 m/s. Using TEC data from the BeiDou Navigation Satellite System, Chen et al. [20] found that Lamb waves traveled at a speed of ~335 m/s in the ionosphere [23], which was faster than that in the troposphere (~305 m/s). A primary speed of 300–350 m/s in traveling ionospheric disturbances (TIDs) was also reported by Zhang et al. [25] based on GPS TEC data. The effects of the Tonga volcanic eruption on dayside ionospheric wind dynamics were estimated by Harding et al. [21] using data from the National Aeronautics and Space Administration Ionospheric Connection Explorer (ICON) and European Space Agency (ESA) Swarm satellites. The Lamb waves entering the dayside triggered a strong westward enhanced zonal wind at 90–300 km at the wave crest, and eastward enhanced zonal wind at the wave trough, as observed by ICON. Corresponding extreme westward and eastward equatorial electrojets at ~110 km were observed by the Swarm satellites. Both values exceeded 99.9% of the typical observed values. The westward electrojet driven by strong westward winds suggested that the wind dynamo was one of the key factors in the ionospheric responses to the Tonga event.
Previous studies have only focused on TEC changes and the associated TID structures. The behaviors of the EIA (an interesting physical phenomenon at low latitudes, with two peaks at ±15° MLat) at daytime and nighttime in the American sector have been investigated by Aa et al. [18]. They found that the daytime EIA crests had severe suppression of more than 10 TECU, and the nighttime EIA crests had a drastic deformation in a unique X-pattern at −20~−40° GLon at 22 UT. Both the suppression of the daytime EIA and X-pattern of the nighttime EIA were attributed to the westward equatorial zonal dynamo electric field. However, the temporal evolution of the EIA and the vertical profile of ionospheric plasma changes due to the Tonga volcano have not yet been explored. These are the main differences between our work and Aa et al. [18]. Our work aims to address the potential physical drivers and diagnose the E- and F-region coupling during volcano eruption periods.
2. Data Description and Processing
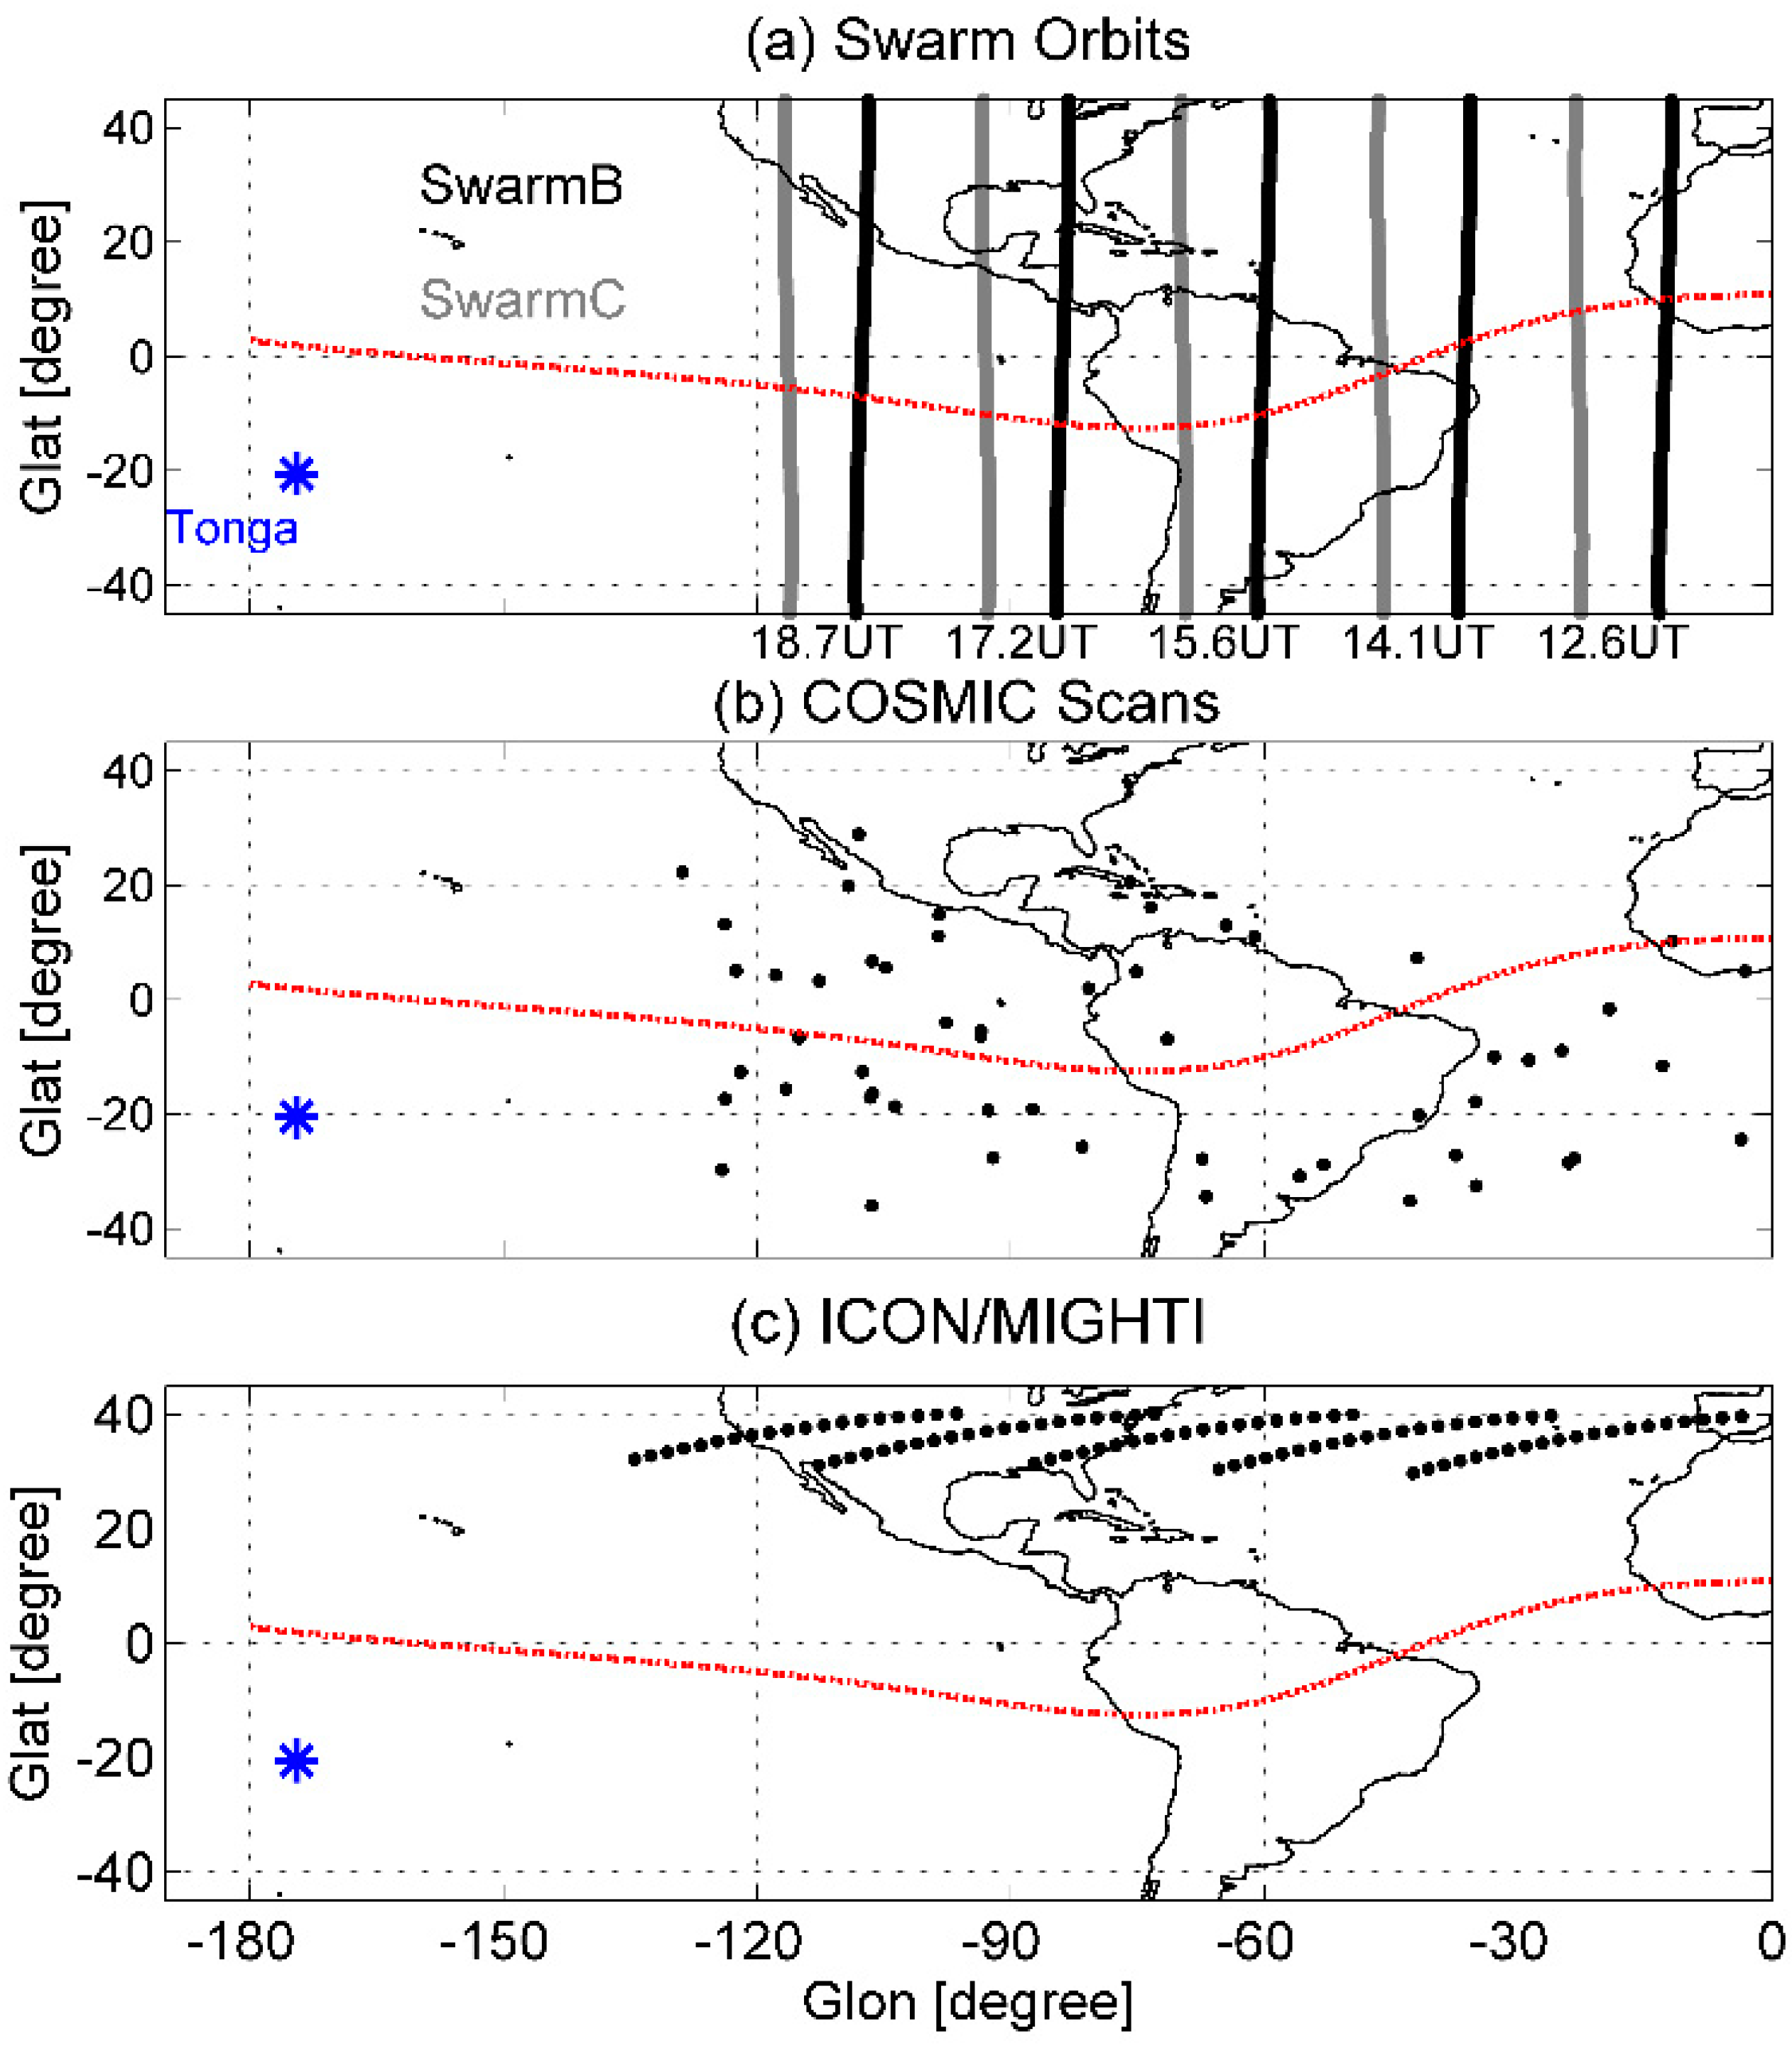
The ESA Swarm satellites were successfully launched on 22 November 2013 in a polar orbit at an inclination of ~87°, which consisted of three identical satellites: Alpha, Bravo, and Charlie (A, B, and C) [26]. Swarm A and C flew side-by-side at ~450 km, while Swarm B flew at ~530 km. The Swarm satellites have a period of ~96 min. Figure 1a illustrates the orbits of Swarm B and C during the Tonga eruption. The orbit of Swarm C is located at −46°, −69°, −93°, and −116° geographic longitude (GLon) at 14.1, 15.6, 17.2, and 18.7 UT, respectively. Comparing to Swarm A and C, Swarm B has a longitudinal difference of ~10°. According to the speed of Lamb waves, at 14 UT, when Swarm B and C fly across the longitudes of −46° GLon, Lamb waves reach in several minutes. Wind disturbances due to Tonga-related Lamb waves lasted for ~6 h [22]. Therefore, this study has selected four orbits of 6 h and a previous orbit at ~12.6 UT (as shown by the vertical gray and black bold lines in Figure 1a) to show the temporal variations of electron density (Ne) at 11 LT.
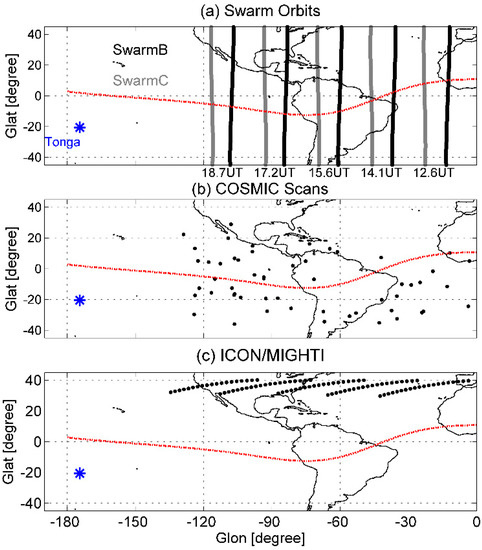
Figure 1.
The orbits of (a) Swarm B and C, (b) COSMIC, and (c) ICON/MIGHTI satellites at low latitudes on 15 January 2022. The orbits of Swarm B and C are given in black and gray bold lines, respectively. The COSMIC and ICON/MIGHTI are given in black dots. The blue star is the geographic location of the Tonga volcano. The red dotted line is the geomagnetic equator.
The science experiment of the Constellation Observing Systems for Meteorology, Ionosphere, and Climate (COSMIC) mission, a constellation of six microsatellites at an altitude of 750–800 km, was a microsatellite mission for space weather forecast [27]. The footprint of COSMIC covers all longitudinal and latitudinal bands. The vertical profiles of ionospheric plasma at 50~550 km were obtained from COSMIC, covering the E- and F-regions. The altitudes of COSMIC observations also cover the altitudes of the Swarm-observed local plasma (450 and 530 km). Moreover, no available measurements of the in situ plasma drift providing in the IVM of COSMIC could be found on 15 January 2022. A comparison further confirmed the reliability of both observations. In this work, the COSMIC data were sorted into UT and GLon bins, with a resolution of 1 h in UT and 40° in GLon. The longitude band of 40° GLon was used to ensure sufficient data in each bin. In Figure 1b, tens of profiles of ionospheric Ne were derived, as indicated by the black dots.
Thermospheric neutral winds were obtained from the Ionospheric Connection Explorer (ICON) onboard Michelson Interferometer for Global High-Resolution Thermospheric Imaging (MIGHTI) [28]. The ICON/MIGHTI mission was launched on 11 October 2019 at an inclination of 27°, with an altitude of 600 km. The onboard instruments were designed to estimate the vertical profiles of thermospheric winds and temperatures at 90–300 km, and in situ plasma drifts. However, no available equatorial upward ion velocity data can be obtained in ICON observations. The data were sorted into bins of GLon and UT with a resolution similar to that of the COSMIC data bin. Figure 1c depicts the orbits of ICON/MIGHTI at 12–18 UT on 15 January 2022. The selected tens of data points are shown as black dots, confirming the statistical significance of the analysis.
In the LEO-satellite measurements, the temporal evolution of Swarm/ICON/COSMIC observations also contains longitude variations since the data are sampled across a wide longitudinal area and at different local time, indicating the mixing of the spatial and temporal information. However, this does not affect our results because the inherent variations of the EIA during non-disturbed periods could be assumed to be much smaller than that during volcanic eruption periods. As reported in previous studies [29,30], the EIA at 11–12 LT can be easily found at all longitudes, with closed magnitudes, confirming the inherent variations of the EIA during non-disturbed periods.
3. Results and Discussions
3.1. Temporal Evolutions of Plasma
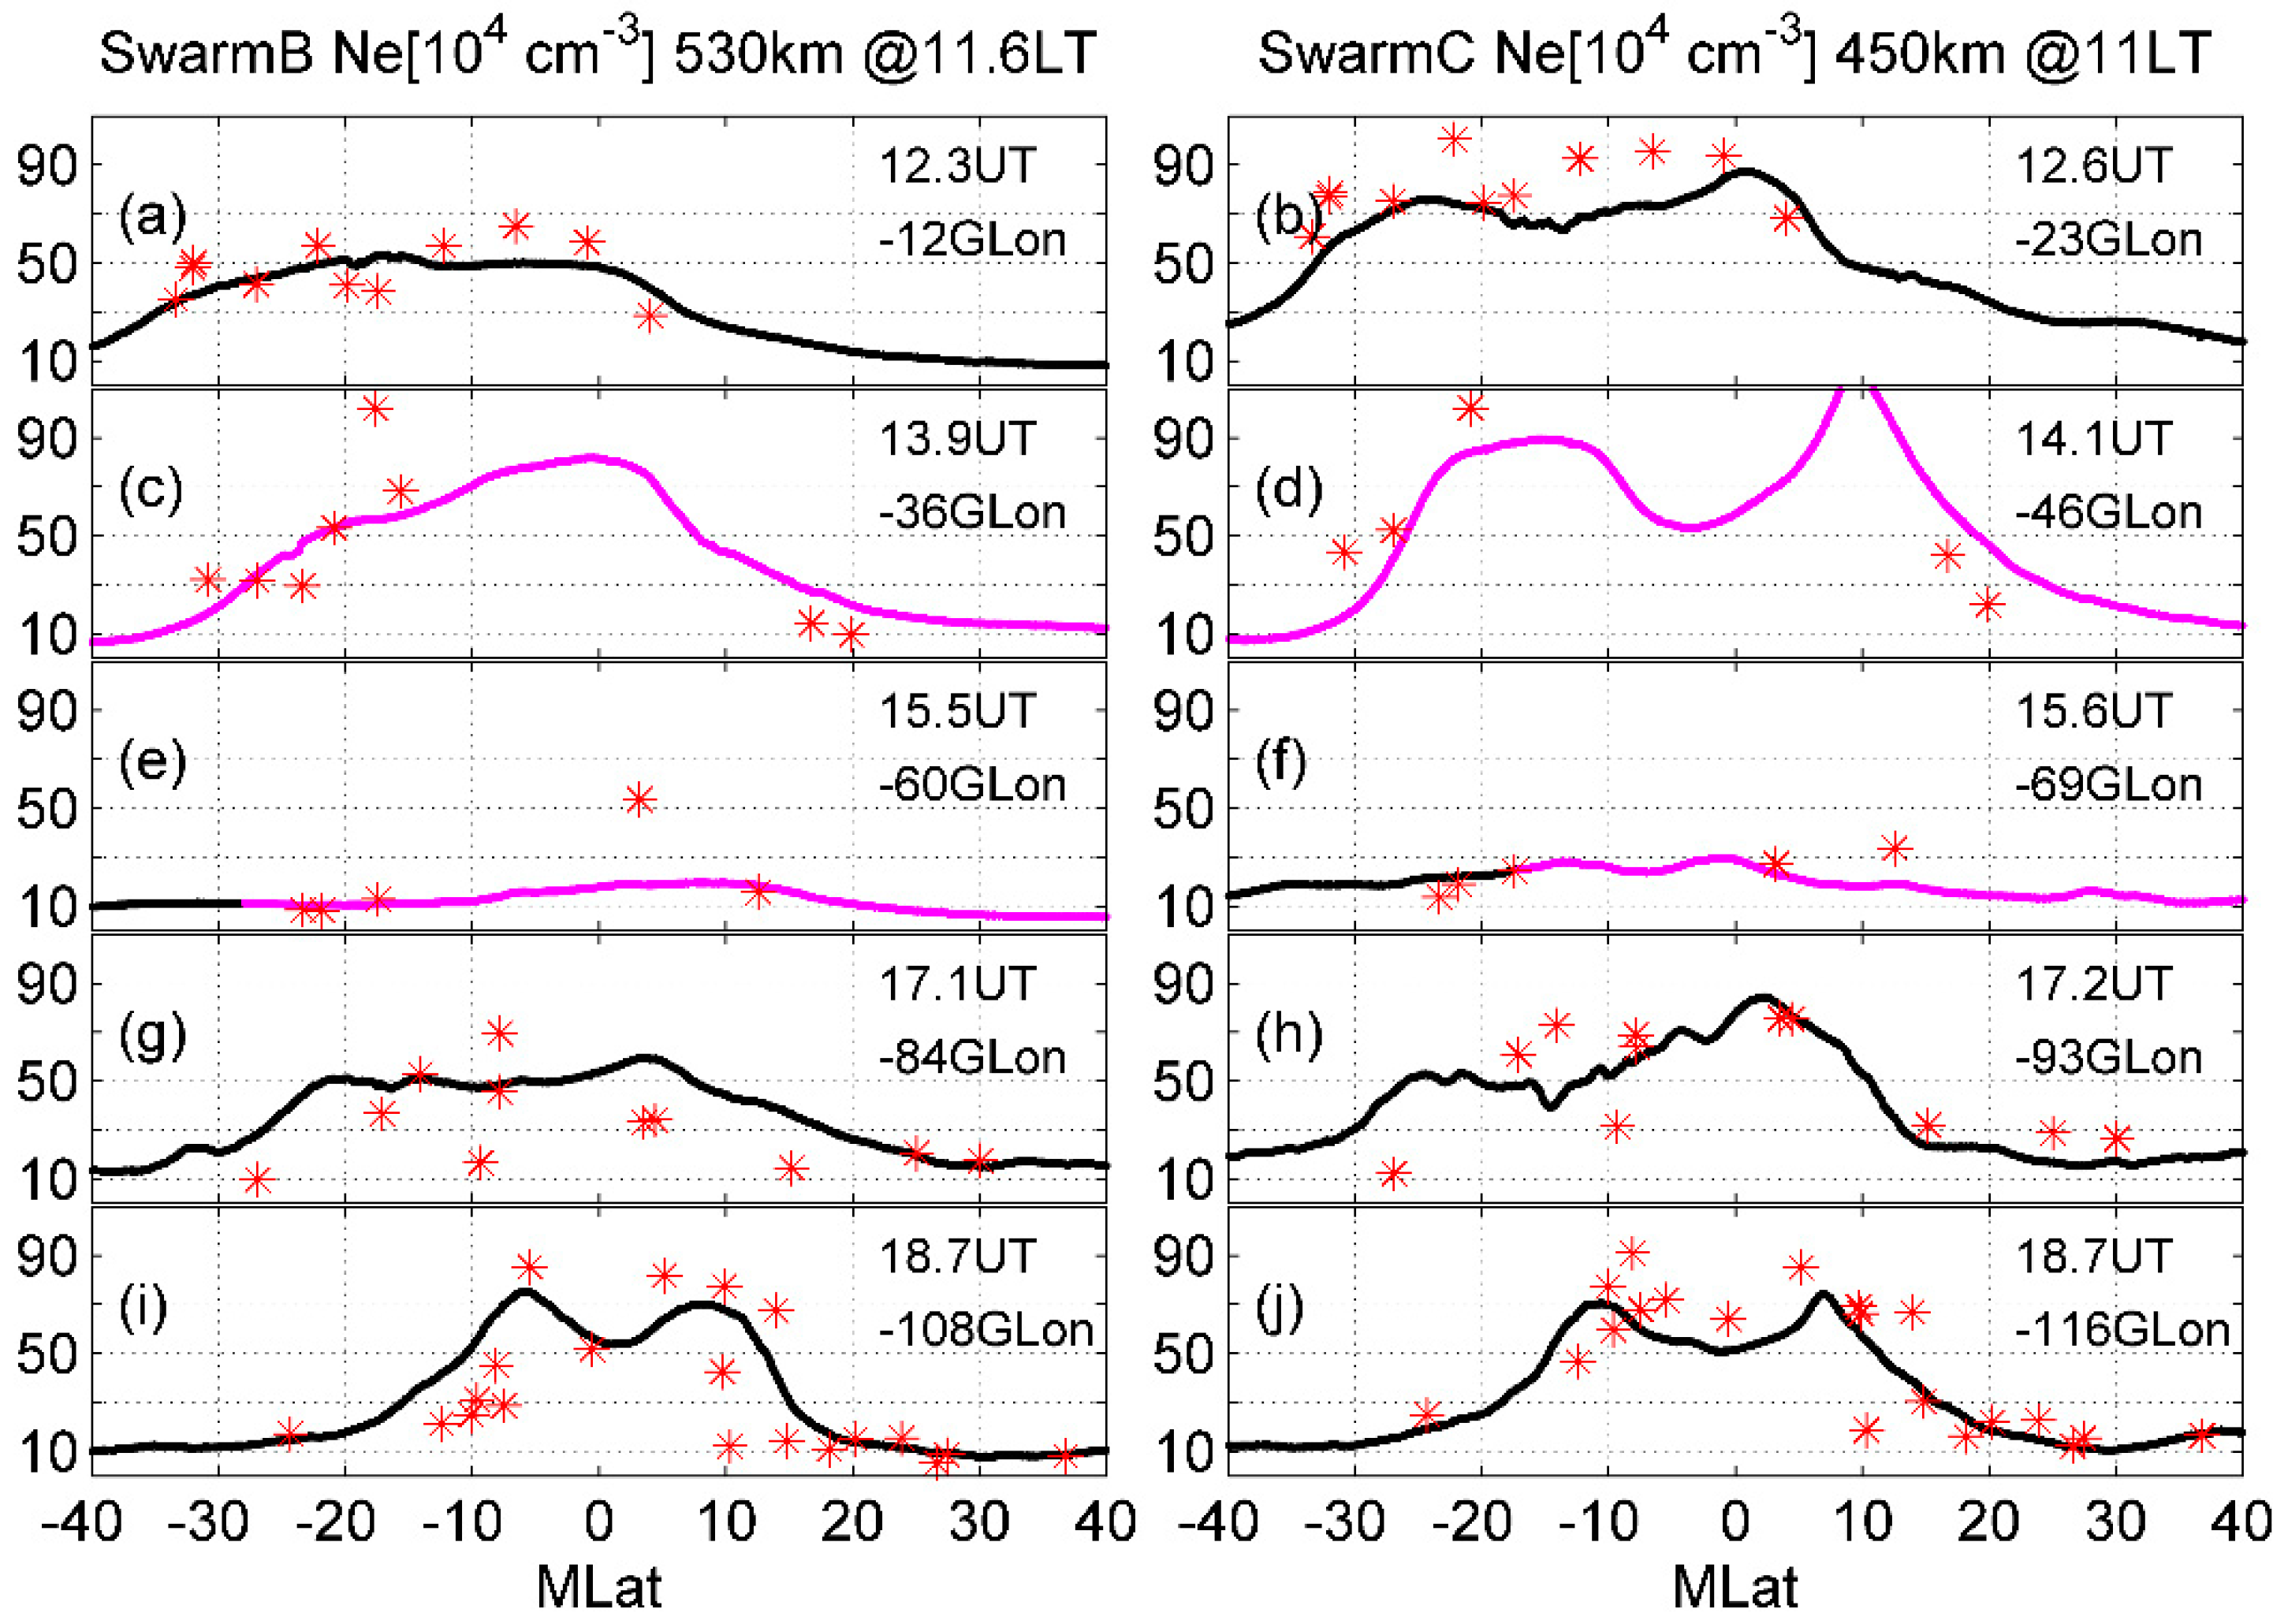
Figure 2 depicts the magnetic latitude (MLat) variations of noon Ne from Swarm-B and Swarm-C observations at 530 and 450 km at 12–18 UT. At 12 UT, the Tonga-related Lamb wave in the ionosphere did not arrive at the longitudes of the Swarm orbits. In Figure 2a, Swarm B (at 12 UT and −12° GLon) observed Ne is enhanced from 1.86 × 105 cm−3 at −40° MLat to 5.34 × 105 cm−3 at −16.7° MLat. It then varies around 5 × 105 cm−3 at −16.7~0° MLat. Finally, it slowly decreases to 8.53 × 104 cm−3 at 40° MLat. Ignoring the small-scale perturbations, in Figure 2b, Swarm C (at 12.6 UT and −23° GLon) observed Ne has a similar large-scale structure to that of Swarm B at 530 km (Figure 2a), but with a significantly higher density. The peak Ne in Figure 2b is 8.73 × 105 cm−3 at 0° MLat, which is 63.5% (3.39 × 105 cm−3) stronger than that in Figure 2a. This is a result of the altitudinal dependence of ionospheric plasma, which decreases with altitude above hmF2. At 14.1 UT, the Tonga-generated Lamb wave has reached longitude bands of −36~−46° GLon of Swarm orbits. In Figure 2c, when the small-scale perturbations are not considered, Ne is enhanced slowly from 6.94 × 104 cm−3 at −40° MLat, to 8.18 × 105 cm−3 at 0° MLat, and then decreases to 1.25 × 105 cm−3 at 40° MLat. Most of the low-latitude Ne at 530 km at 13.9 UT is significantly stronger than that at 12.3 UT, indicating the strong presence of the Lamb wave. A comparison between Figure 2b,d shows a similar conclusion: due to the effects of the Tonga-associated Lamb wave, noon Ne at 450 km is enhanced to 1.10 × 106 cm−3 at 14.1 UT. Moreover, an obvious two-peak structure in ionospheric Ne at 450 km is observed in Figure 2d. The peaks are located at −20~−10° and 10° MLat, with densities of 9 × 105 cm−3 and 1.10 × 106 cm−3, respectively. This might be related to altitude, because the EIA would gradually disappear at altitudes above 400 km [29]. Owing to the effects of Tonga’s Lamb wave, the ionosphere may have been uplifted to a higher altitude. Swarm C could fly across the plasma crest at both EIA latitudes, resulting in a two-peak structure. However, Swarm B has a higher orbit; hence, it orbits across the plasma crest at the dip equator and has a one-peak structure.
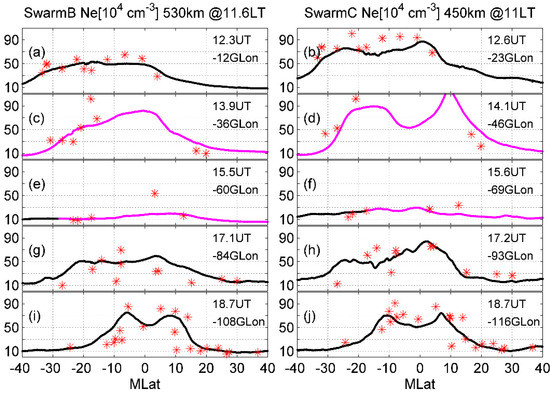
Figure 2.
MLat variations of noon Ne from Swarm B (left) and C (right) on 15 January 2022. The magenta lines are referred to as the plasma during the arrival of the Lamb wave. The density at the remaining times is indicated by black lines. The red star is the COSMIC-observed Ne at corresponding altitudes, longitudes, and latitudes. The UT and GLon of each Swarm orbit are given in the right hand of each subfigure. The density is given in 104 cm−3.
At 15 UT, Swarm B and C orbit across −60° and −69° GLon, through which most of the Lamb wave penetrates. It can be seen that almost all Ne values are significantly weaker at 15 UT than that at 14 UT. For example, in Figure 2e, Swarm-B-observed Ne has a peak of 1.92 × 105 cm−3 at 10° MLat, with a mean value of 1.24 × 105 cm−3. In Figure 2f, the peak density of Swarm-C-observed Ne is 2.98 × 105 cm−3 at 0° MLat, and the average density is 1.97 × 105 cm−3. The peak and average densities are remarkably weaker at approximately 15.5 UT than that at 14 UT (Figure 2c,d). Therefore, it can be concluded that, because of the continuous Lamb wave effects, the ionospheric plasma appears to be reduced at 450 and 530 km.
At ~17 UT, Swarm B and C satellites orbit across −84° and −93° GLon, respectively. Although the Tonga-related Lamb had entirely penetrated through, the disturbances in the plasma remained, which might be related to the remaining disturbances in the E-region thermospheric winds due to the inertia of neutrals and will be explored later. The peak Ne is ~5.91 × 105 cm−3 at 4.4° MLat (Figure 2g) and ~8.40 × 105 cm−3 at 2.1° MLat (Figure 2h). Thus, the ionospheric plasma density at 450 km and 520 km recovers after the Lamb wave passes. At 18 UT (Figure 2i,j), a two-peak structure is shown at both 450 and 530 km. The peaks at 530 (450) km occur at −5.5° and 8.4° (−10° and 6.9°) MLat, with Ne of 8.53 (7.0) × 105 cm−3 and 7.03 (7.43) × 105 cm−3, respectively. Therefore, in comparison with that at 17 UT, the ionospheric EIA at 18 UT continually recover. This means that more plasma at the dip equator has been uplifted to higher altitudes, and then moved downward along the geomagnetic field line, forming an EIA at 450 and 530 km.
3.2. Potential Mechanism
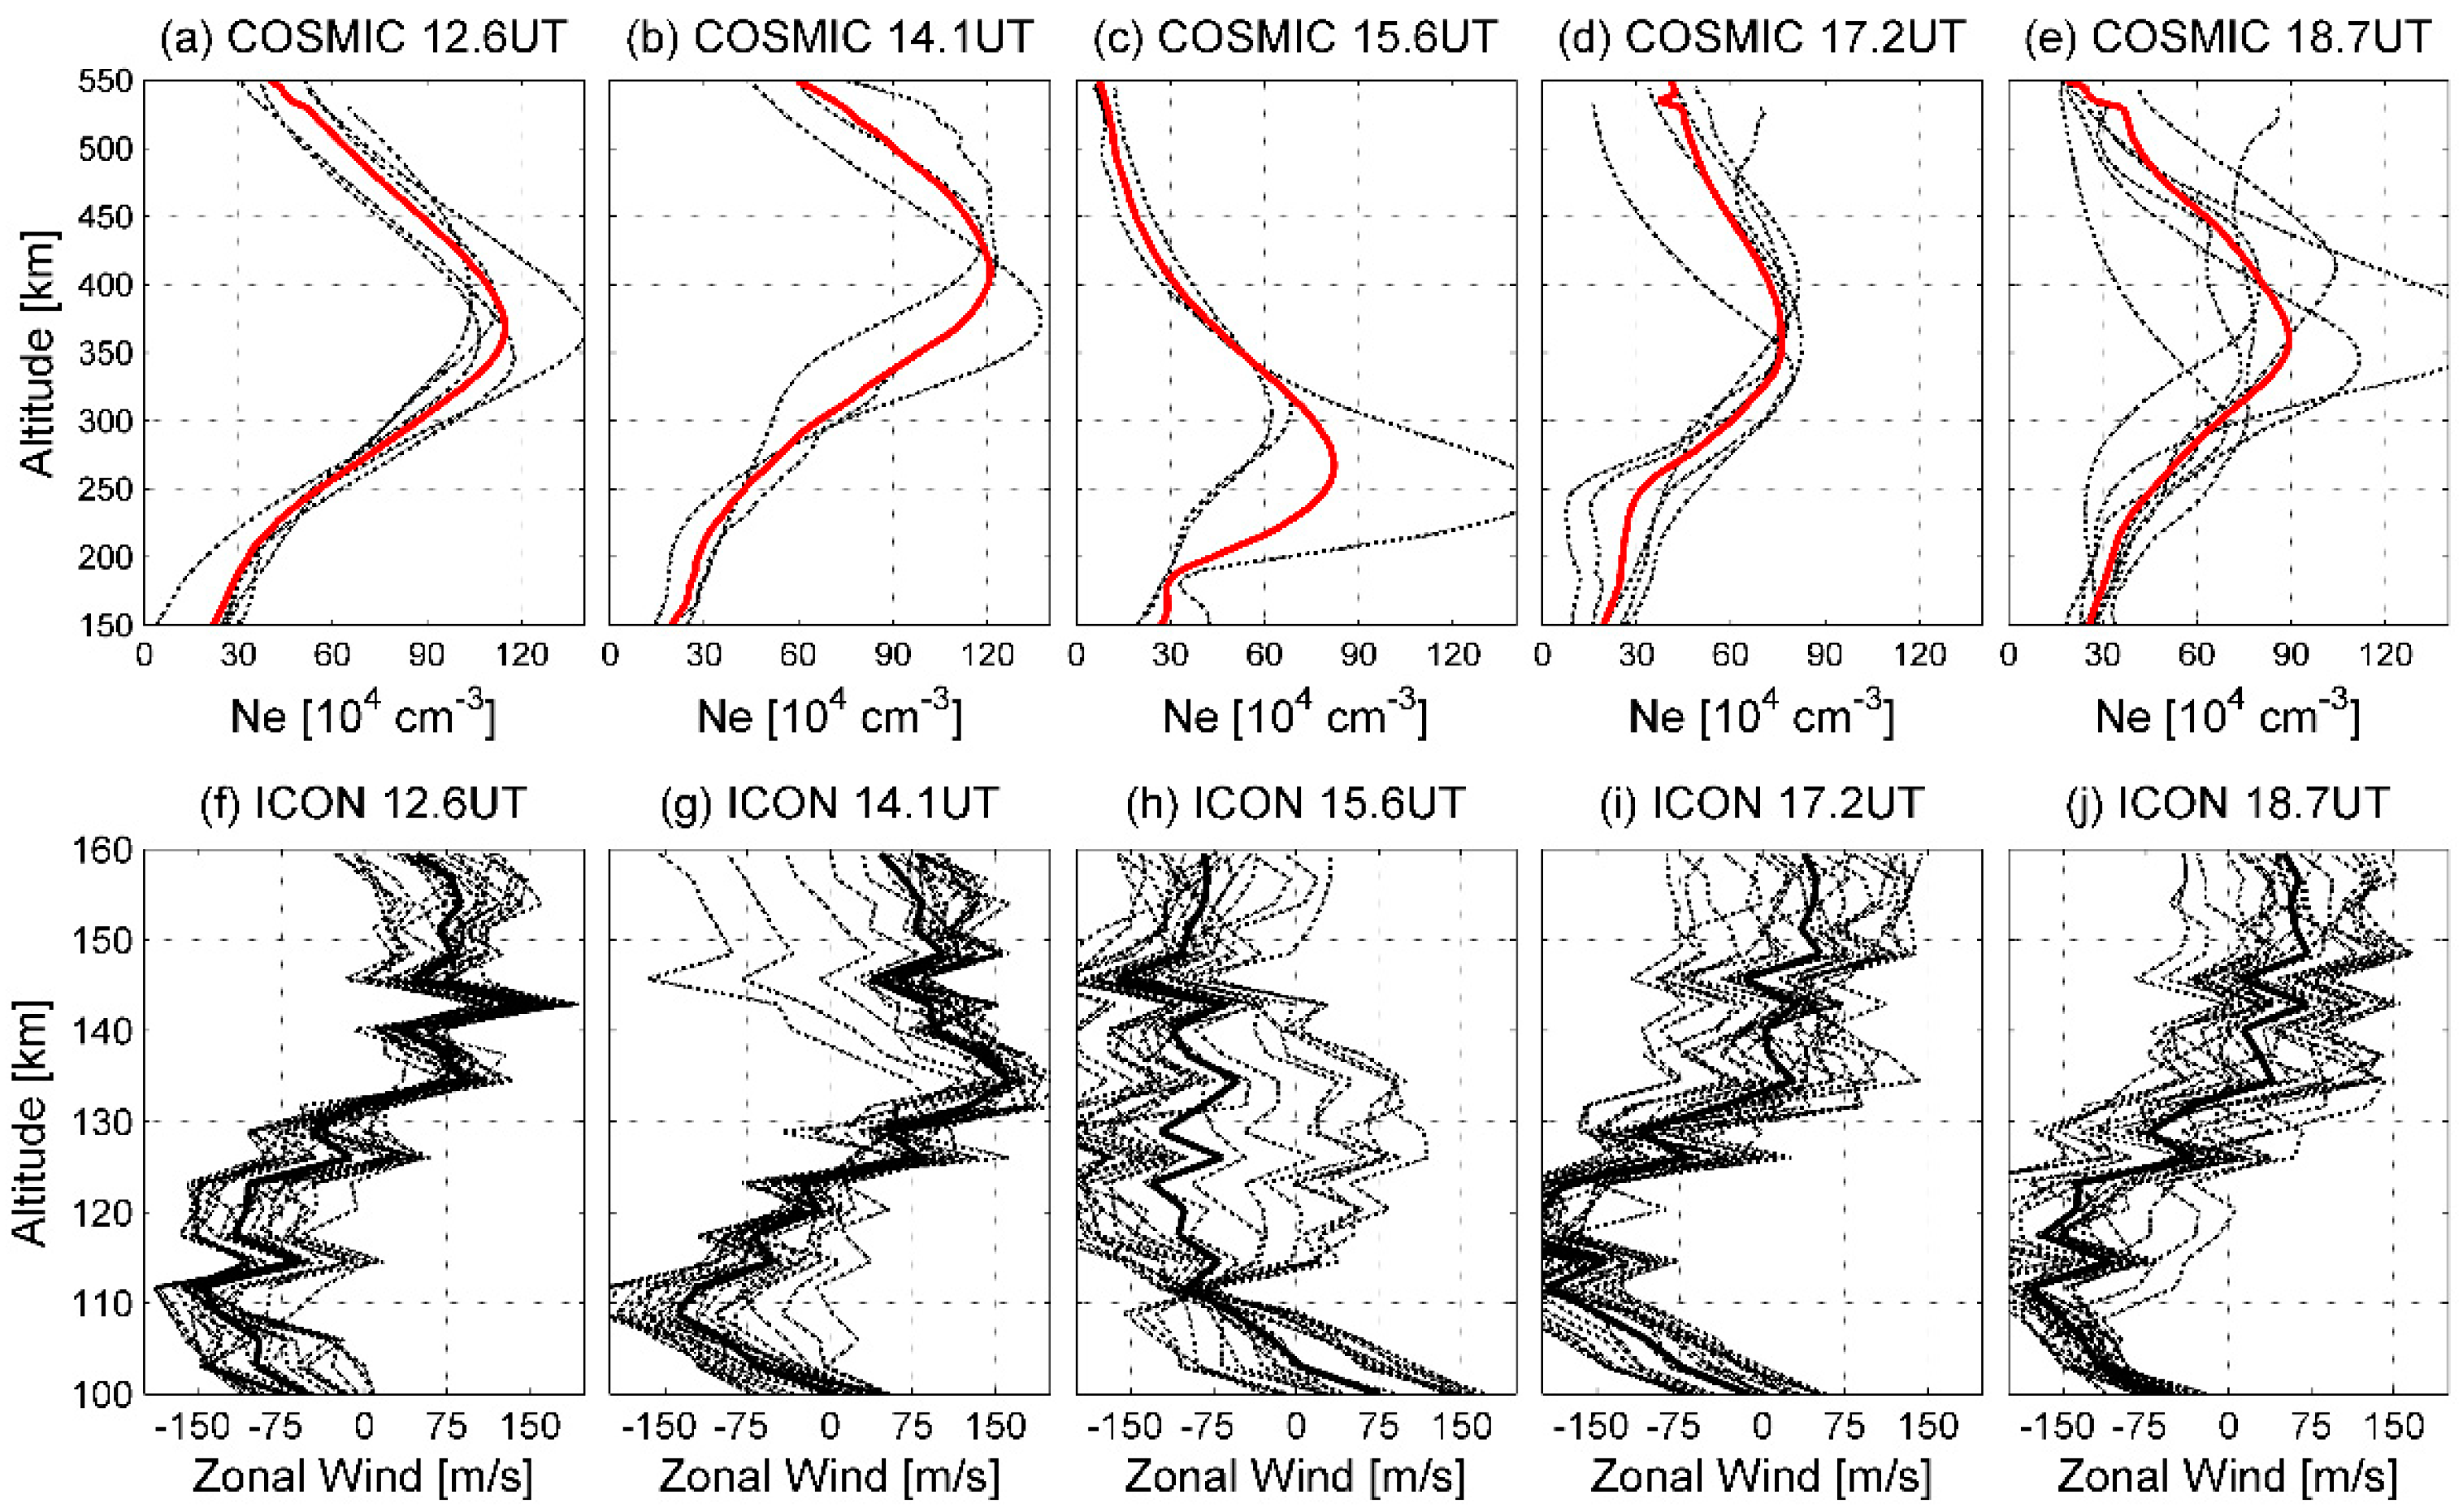
In Figure 2, COSMIC-observed Ne (red stars) has a density similar to that of the Swarm observations at 12–18 UT. For instance, in Figure 2a, both COSMIC- and Swarm-observed Ne increases from 3.52 × 105 cm−3 at −33° MLat to 5.70 × 105 cm−3 at −10° MLat. This confirms the reliability of the COSMIC data in the temporal evolutions of the EIA. Figure 3a–e give the altitudinal profiles of the ionospheric Ne at 12–18 UT. Owing to the data source, only ionospheric Ne in the Southern EIA is continuous, and useful for the study.
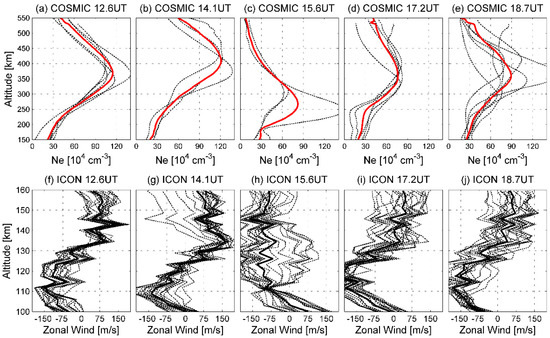
Figure 3.
The vertical profile of (a–e) COSMIC-observed Ne in the Southern EIA and (f–j) ICON-observed zonal winds. (a–e) Black dotted and red solid lines are all profiles of selected Ne and the average profile of Ne, respectively. (f–j) The zonal winds are given in m/s (positive for eastward).
Swarm observations show that the ionospheric EIA is enhanced at 12–14 UT. In Figure 3a, at 12.6 UT, the average Ne is significantly increased from 1.80 × 105 cm−3 at 150 km to 1.10 × 106 cm−3 at 360 km, then decreases with altitudes with a minimum of 4.29 × 105 cm−3 at 550 km. In Figure 3b, at 14.1 UT, the average Ne has a maximum value of 1.21 × 106 cm−3 at 410 km. NmF2 is about 10% stronger at 14.1 UT than that at 12.6 UT. Additionally, hmF2 increases from 360 km to 410 km. Considering the Ne enhancement at 450 and 530 km, it can be assumed here that, due to the effects of the Lamb wave, ionospheric Ne at lower altitudes has been significantly uplifted.
Previous studies have demonstrated that the spatial and temporal distributions of ionospheric plasma are controlled by the chemical processes (production and loss), transport effects due to E × B drifts, neutral winds, and ambipolar diffusion, e.g., [3,4,30,31]. During the Tonga volcanic eruptions, the primary chemical processes (including production and recombination loss) do not exhibit significant changes in the ionosphere. This is because volcano-linked air pollution only affects electrical properties in the troposphere [14], and cannot directly reach the F-region. Ambipolar diffusion is related to the relative motion between charged ions and electrons. When the effects of a volcanic eruption are introduced into the ionosphere, the atmospheric wave is generally located at E-region altitudes [21,22]. During the daytime, thermospheric wind disturbances at altitudes below 160 km cannot directly produce significant F-region plasma changes. This is because the E-region plasma moves with neutrals and not along the magnetic field line to a higher altitude [32]. Therefore, only transport from the F-region E × B drifts is considered. The daytime F-region electric field is dominated by the E-region wind dynamo [33]. The ionospheric conductivity in the E-region is high during the daytime, which contributes to the upward mapping of the E-region electric field along the geomagnetic field line.
To explore the potential drivers, Figure 3f,g depict the ICON-observed low-latitude E-region zonal wind at 12–14 UT. The results show that, at 12.6 (14.1) UT, the average zonal wind is westward at a maximum speed of 135 (147) m/s at lower altitudes below 130 km and eastward at a peak speed of 149 (162) m/s at 130–160 km. Thus, after the arrival of the Lamb wave, the westward winds at 100–130 km and the eastward winds at 130–160 km are enhanced, which both generate eastward electric field [34,35]. This eastward electric field could map into the F-region for the high E-region ionospheric conductivity and dominates the F-region electric field, generating an upward E × B drift, and pushes the plasma to a higher altitude where it has a slower chemical loss rate. This could help the Ne enhancement at Swarm altitudes from 12.6 UT to 14.1 UT (Figure 2a–d), and upward movement of the F2-layer to 410 km (Figure 3a,b).
The equatorial fountain is a phenomenon in which the daytime equatorial plasma moves upward to a high altitude for the eastward electric field, and then downward along the magnetic field line to form the ionization crest at EIA latitudes. The Swarm-observed plasma at the EIA is enhanced. Thus, it can be assumed that more plasma at the equator has been moved upward and then diffused toward the EIA latitudes, leading to the reduction in equatorial Ne. This assumption has been confirmed in the Swarm-C observations through a comparison between Figure 2b,d, where the equatorial Ne is reduced from 8.68 × 105 cm−3 at 12.6 UT to 6.02 × 105 cm−3 at 14.1 UT.
Compared with that at 14 UT (Figure 2c,d), the Ne at 15.6 UT and low latitudes is significantly reduced (Figure 2e,f). At the Southern EIA, the peak of average Ne at 15.6 UT reduces to 8.20 × 105 cm−3, and hmF2 decreases to 270 km (Figure 3c). Therefore, it can be concluded that the equatorial fountain is significantly prevented at 15.6 UT. As discussed previously, the eastward F-region electric field mapping from the E-region could push the plasma upward via upward E × B drifts. Therefore, the Ne reduction at 15.6 UT might be attributed to the westward E-region electric field. Figure 3h shows the altitudinal profiles of the ICON-observed E-region zonal winds at 15.7 UT. The observed zonal winds are westward and increase with altitudes, with a maximum speed of 162 m/s at 145 km. A strong westward E-region electric field may be generated by fast westward winds at 130–160 km, which could overcome the eastward E-region electric field owing to the slow westward wind at 100–130 km. Therefore, a westward E-region electric field could map into the F-region, resulting in downward E × B drifts [33]. The downward E × B pulls plasma downward, preventing the formation of the EIA phenomenon, thereby reducing the plasma crest at the EIA latitudes and the equator.
In Figure 2i,j, the two-peak structure begins to be reformed, which is not present in Figure 2g,h. Moreover, in Figure 3d,e, the vertical profile of the Ne shows that hmF2 increases to approximately 350 km and NmF2 is continually enhanced from 7.61 × 105 cm−3 at 17.2 UT to 8.93 × 105 cm−3 at 18.7 UT. The reformation of the EIA might also be related to E-region zonal wind disturbances. Owing to the inertia of neutral particles, disturbances in E-region zonal winds should remain [36,37,38]. In Figure 3i,j, at lower altitudes below 130 km, zonal winds keep strong westward at peak speeds of 200 and 179 m/s at 17.2 and 18.7 UT, respectively. At 130–160 km, zonal winds reverse from westward at 15.6 UT to eastward at 17–18 UT. Similar to that at 14.1 UT, an eastward E-region electric field would be generated by the eastward (westward) winds at 130–160 (100–130) km [35]. Both can map into the F-layer along the geomagnetic field line, and drive the upward E × B drifts [22,31], which could continually move plasma upward at 17–18 UT, thereby contributing to the reformation of the two-peak structure at Swarm altitudes.
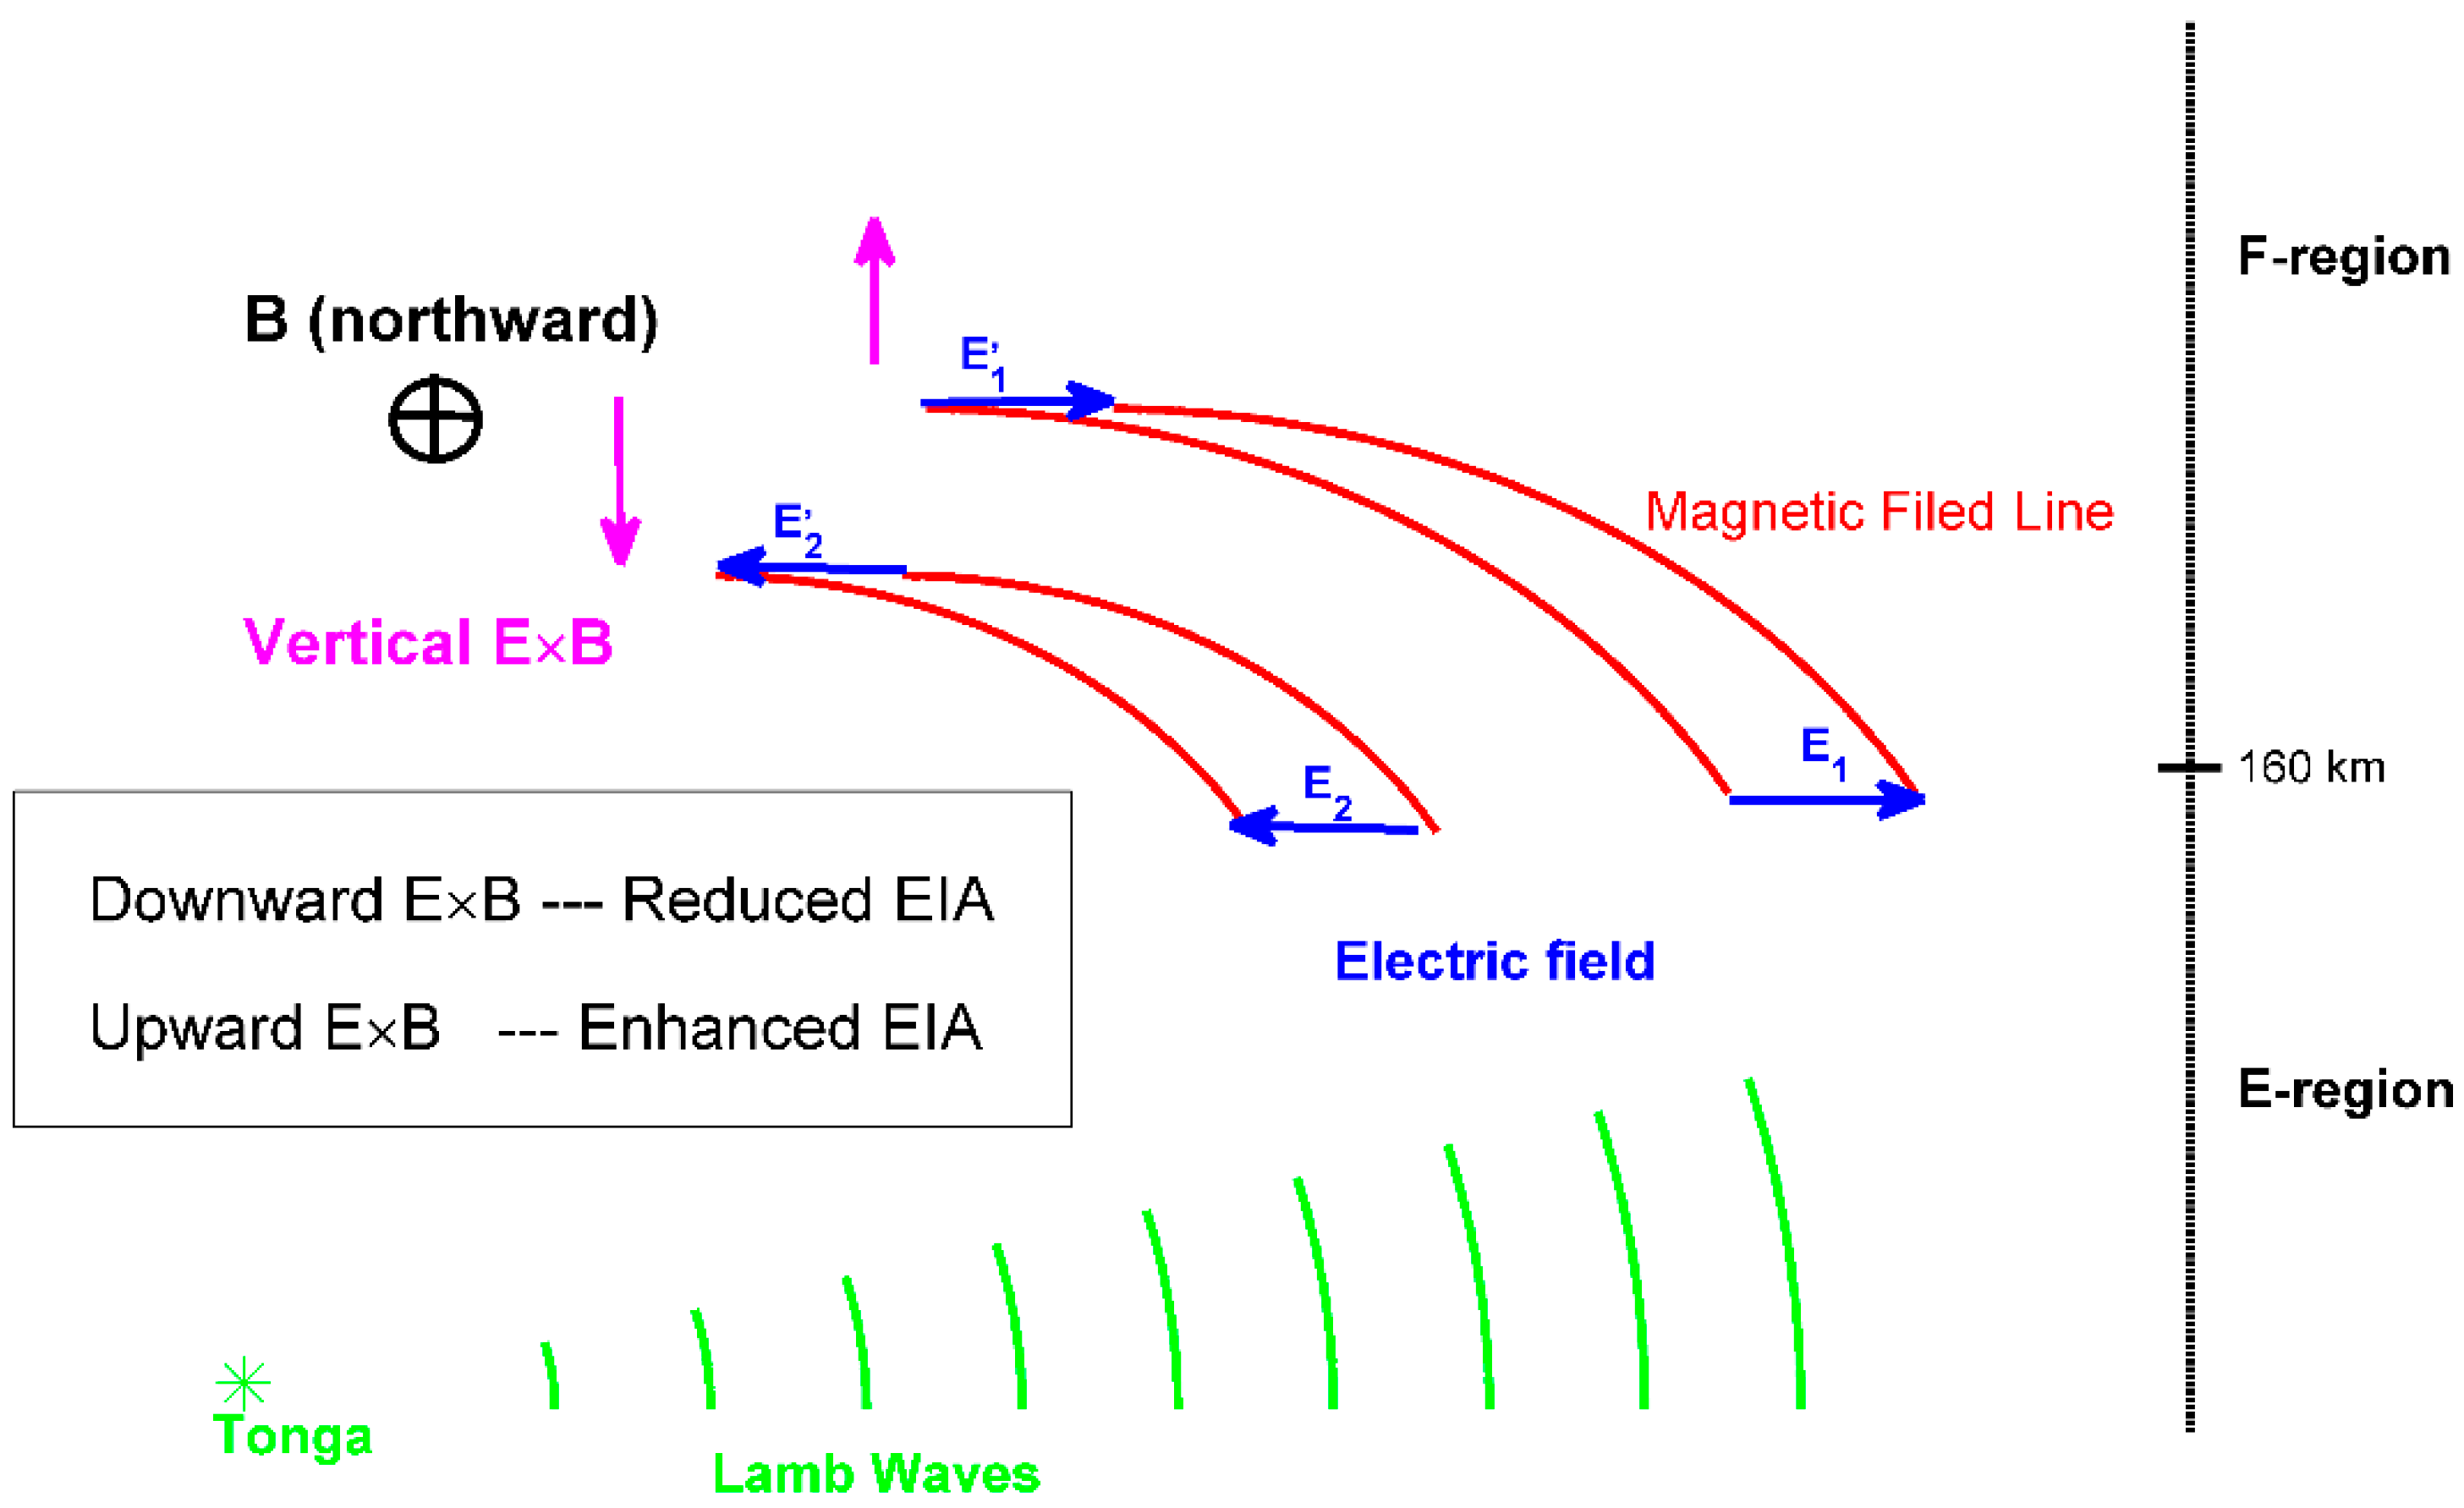
To illustrate the inherent physical mechanism more clearly, a schematic illustration is depicted in Figure 4. The green waves represent the penetration of the Tonga-volcano-linked Lamb wave. The magenta and blue arrows represent the vertical E × B and zonal electric fields, respectively. With the arrival of the Lamb wave, an eastward polarization electric field (E1) would be generated for thermospheric wind disturbances. The E1 maps into the F-region and drives an upward E × B, which promotes the formation of the EIA phenomenon. Subsequently, a westward electric field (E2) would be generated in the E-region. The E2 could map into the F-region, causing a downward E × B, and preventing the formation of the EIA. Finally, when the Lamb wave had entirely penetrated, a continuous eastward electric field would be generated because of the inertia of neutral particles. This could drive the recovery of the EIA, and the reformation of the two-peak structures at Swarm altitudes.
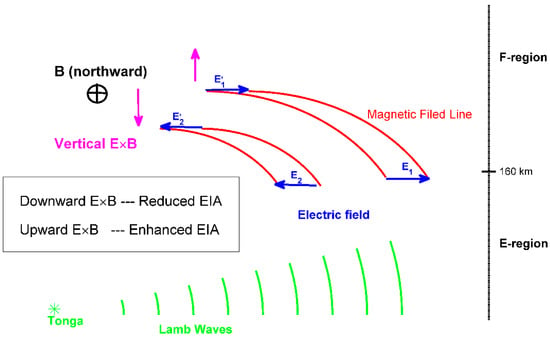
Figure 4.
Schematic illustration of E- and F-region coupling during the Tonga eruption period. The green and red curves are Lamb waves and magnetic field lines, respectively. The blue and magenta arrows are electric fields and vertical E × B drifts, respectively. B is the magnetic field. E1 and E2 are electric fields.
4. Summary
Using space-based observations from Swarm, ICON, and COSMIC, the dynamic evolutions of ionospheric EIA responses to the Tonga volcanic eruption have been investigated in this work. Several interesting results were obtained, and the main conclusions are summarized below:
1. At the arrival of the Tonga-related Lamb wave, the plasma crest at the EIA latitudes in both hemispheres are enhanced at 14.1 UT. The potential cause is the upward E × B due to the eastward electric field. This eastward electric field is mapped from the E-region electric field induced by the westward winds at 100–130 km and eastward winds at 130–160 km via wind dynamo.
2. At 15.6 UT, the thermospheric wind at the E-layer is reversed; that is, strong westward wind at 130–160 km, driving a westward polarization electric field. This electric field can map into the F-region along the magnetic field line and drive a downward E × B. Therefore, Ne at the EIA and the equator has been depleted.
3. At 17–18 UT, because of the inertia of neutrals, the Lamb-wave-induced disturbances in thermospheric westward winds at 100–130 km and eastward winds at 130–160 km remain, causing an eastward electric field. This eastward electric field is responsible for the recovery of the EIA and the reformation of the two-peak structures at Swarm altitudes.
Author Contributions
Conceptualization, K.Z. and H.W.; methodology, K.Z.; software, Y.Z.; validation, K.Z.; formal analysis, H.X.; investigation, C.Q.; data curation, K.Z.; writing—original draft preparation, K.Z.; writing—review and editing, H.W.; visualization, K.Z.; supervision, H.W.; project administration, H.W.; funding acquisition, H.W. and K.Z. All authors have read and agreed to the published version of the manuscript.
Funding
We are grateful for the sponsorship from the National Natural Science Foundation of China Basic Science Center (42188101), the Fundamental Research Funds for the Central Universities (2042021kf0208), the National Nature Science Foundation of China (NO. 41974182, 41674153, and 42004135), and China Postdoctoral Science Foundation (2020M682465). ICON is supported by NASA’s Explorers Program through contracts NNG12FA45C and NNG12FA42I.
Data Availability Statement
The Swarm data can be accessed from the European Space Agency (ESA) (http://swarm-diss.eo.esa.int, accessed on 15 January 2022). The COSMIC data can be downloaded at https://data.cosmic.ucar.edu/gnss-ro/cosmic2/nrt/level2/2022/, accessed on 15 January 2022. The ICON/MIGHTI data are stored in an online dataset (https://icon.ssl.berkeley.edu/Data, accessed on 15 January 2022).
Acknowledgments
We are grateful to the Editor and anonymous reviewers for their assistance in improving the manuscript.
Conflicts of Interest
The authors declare no conflict of interest.
References
- Qian, L.; Burns, A.G.; Wang, W.; Solomon, S.C.; Zhang, Y.; Hsu, V. Effects of the equatorial ionosphere anomaly on the interhemispheric circulation in the thermosphere. J. Geophys. Res. Space Phys. 2016, 121, 2522–2530. [Google Scholar] [CrossRef]
- Sori, T.; Shinbori, A.; Otsuka, Y.; Tsugawa, T.; Nishioka, M.; Yoshikawa, A. Generation mechanisms of plasma density irregularity in the equatorial ionosphere during a geomagnetic storm on December 21 and 22, 2014. J. Geophy. Res. Space Phys. 2022, 127, e2021JA030240. [Google Scholar] [CrossRef]
- Liu, J.; Wang, W.; Burns, A.; Solomon, S.C.; Zhang, S.; Zhang, Y.; Huang, C. Relative importance of horizontal and vertical transports to the formation of ionospheric storm-enhanced density and polar tongue of ionization. J. Geophys. Res. Space Phys. 2016, 121, 8121–8133. [Google Scholar] [CrossRef]
- Zhang, K.; Wang, H.; Liu, J.; Zheng, Z.; He, Y.; Gao, J.; Sun, L.; Zhong, Y. Dynamics of the tongue of ionizations during the geomagnetic storm on September 7, 2015. J. Geophys. Res. Space Phys. 2021, 126, e2020JA029038. [Google Scholar] [CrossRef]
- Burns, A.G.; Solomon, S.C.; Wang, W.; Qian, L.; Zhang, Y.; Paxton, L.J. Daytime climatology of ionospheric NmF2 and hmF2 from COSMIC data. J. Geophys. Res. 2012, 117, A09315. [Google Scholar] [CrossRef]
- Davis, C.J.; Johnson, C.G. Lightning-induced intensification of the ionospheric sporadic E layer. Nature 2005, 435, 799–801. [Google Scholar] [CrossRef]
- Gurram, P.; Kakad, B.; RaviKumar, M.; Bhattacharyya, A. Earthquake/tsunami-linked imprints in the equatorial F region zonal plasma drifts and spatial structures of plasma bubbles. J. Geophys. Res. Space Phys. 2019, 124, 504–520. [Google Scholar] [CrossRef]
- Guo, Q.; Chernogor, L.F.; Garmash, K.P.; Rozumenko, V.T.; Zheng, Y. Dynamical processes in the ionosphere following the moderate earthquake in Japan on 7 July 2018. J. Atmos. Sol.-Terr. Phys. 2019, 186, 88–103. [Google Scholar] [CrossRef]
- Shao, X.M.; Lay, E.H.; Jacobson, A.R. Reduction of electron density in the night-time lower ionosphere in response to a thunderstorm. Nat. Geosci. 2013, 6, 29–33. [Google Scholar] [CrossRef]
- Cahyadi, M.N.; Handoko, E.Y.; Rahayu, R.W.; Heki, K. Comparison of volcanic explosions in Japan using impulsive ionospheric disturbances. Earth Planets Space 2021, 73, 228. [Google Scholar] [CrossRef]
- Dautermann, T.; Calais, E.; Mattioli, G.S. Global Positioning System detection and energy estimation of the ionospheric wave caused by the 13 July 2003 explosion of the Soufriere Hills Volcano, Montserrat. J. Geophys. Res. 2009, 114, B02202. [Google Scholar] [CrossRef]
- Li, W.; Guo, J.; Yue, J.; Shen, Y.; Yang, Y. Total electron content anomalies associated with global VEI4+ volcanic eruptions during 2002–2015. J. Volcanol. Geotherm. Res. 2016, 325, 98–109. [Google Scholar] [CrossRef]
- Liu, X.; Zhang, Q.; Shah, M.; Hong, Z. Atmospheric-ionospheric disturbances following the April 2015 Calbuco volcano from GPS and OMI observations. Adv. Space Res. 2017, 60, 2836–2846. [Google Scholar] [CrossRef]
- Pulinets, S.; Davidenko, D.; Pulinets, M. Atmosphere-ionosphere coupling induced by volcanoes eruption and dust storms and role of GEC as the agent of geospheres interaction. Adv. Space Res. 2022, 69, 4319–4334. [Google Scholar] [CrossRef]
- Rozhnoi, A.; Hayakawa, M.; Solovieva, M.; Hobara, Y.; Fedun, V. Ionospheric effects of the Mt. Kirishima volcanic eruption as seen from subionospheric VLF observations. J. Atmos. Sol.-Terr. Phys. 2014, 107, 54–59. [Google Scholar] [CrossRef]
- Shestakov, N.; Orlyakovskiy, A.; Perevalova, N.; Titkov, N.; Chebrov, D.; Ohzono, M.; Takahashi, H. Investigation of ionospheric response to June 2009 Sarychev Peak Volcano eruption. Remote Sens. 2021, 13, 638. [Google Scholar] [CrossRef]
- Shults, K.; Astafyeva, E.; Adourian, S. Ionospheric detection and localization of volcano eruptions on the example of the April 2015 Calbuco events. J. Geophys. Res. Space Phys. 2016, 121, 10–303. [Google Scholar] [CrossRef]
- Aa, E.; Zhang, S.R.; Wang, W.; Erickson, P.J.; Qian, L.; Eastes, R.; Harding, B.J.; Immel, T.J.; Karan, D.K.; Daniell, R.E.; et al. Pronounced suppression and X-pattern merging of equatorial ionization anomalies after the 2022 Tonga volcano eruption. J. Geophys. Res. Space Phys. 2022, 127, e2022JA030527. [Google Scholar] [CrossRef]
- Amores, A.; Monserrat, S.; Marcos, M.; Argüeso, D.; Villalonga, J.; Jordà, G.; Gomis, D. Numerical Simulation of Atmospheric Lamb Waves Generated by the 2022 Hunga-Tonga Volcanic Eruption. Geophys. Res. Lett. 2022, 49, e2022GL098240. [Google Scholar] [CrossRef]
- Chen, C.H.; Zhang, X.; Sun, Y.Y.; Wang, F.; Liu, T.C.; Lin, C.Y.; Gao, Y.; Lyu, J.; Jin, X.; Zhao, X.; et al. Individual Wave Propagations in Ionosphere and Troposphere Triggered by the Hunga Tonga-Hunga Ha’apai Underwater Volcano Eruption on 15 January 2022. Remote Sens. 2022, 14, 2179. [Google Scholar] [CrossRef]
- Harding, B.J.; Wu, Y.J.; Alken, P.; Yamazaki, Y.; Triplett, C.C.; Immel, T.J.; Gasque, L.C.; Mende, S.B.; Xiong, C. Impacts of the January 2022 Tonga Volcanic Eruption on the Ionospheric Dynamo: ICON-MIGHTI and Swarm Observations of Extreme Neutral Winds and Currents. Geophys. Res. Lett. 2022, 49, e2022GL098577. [Google Scholar] [CrossRef]
- Le, G.; Liu, G.; Yizengaw, E.; Englert, C.R. Intense Equatorial Electrojet and Counter Electrojet caused by the 15 January 2022 Tonga Volcanic Eruption: Space and Ground-based Observations. Geophys. Res. Lett. 2022, 6, e2022GL099002. [Google Scholar] [CrossRef]
- Lin, J.T.; Rajesh, P.K.; Lin, C.C.; Chou, M.Y.; Liu, J.Y.; Yue, J.; Hsiao, T.Y.; Tsai, H.F.; Chao, H.M.; Kung, M.M. Rapid Conjugate Appearance of the Giant Ionospheric Lamb Wave Signatures in the Northern Hemisphere After Hunga-Tonga Volcano Eruptions. Geophys. Res. Lett. 2022, 49, e2022GL098222. [Google Scholar] [CrossRef]
- Themens, D.R.; Watson, C.; Žagar, N.; Vasylkevych, S.; Elvidge, S.; McCaffrey, A.; Prikryl, P.; Reid, B.; Wood, A.; Jayachandran, P.T. Global propagation of ionospheric disturbances associated with the 2022 Tonga Volcanic Eruption. Geophys. Res. Lett. 2022, 49, e2022GL098158. [Google Scholar] [CrossRef]
- Zhang, S.R.; Vierinen, J.; Aa, E.; Goncharenko, L.P.; Erickson, P.J.; Rideout, W.; Coster, A.J.; Spicher, A. 2022 Tonga volcanic eruption induced global propagation of ionospheric disturbances via Lamb waves. Front. Astron. Space Sci. 2022, 9, 871275. [Google Scholar] [CrossRef]
- Friis-Christensen, E.; Lühr, H.; Knudsen, D.; Haagmans, R. Swarm–an Earth observation mission investigating geospace. Adv. Space Res. 2008, 41, 210–216. [Google Scholar] [CrossRef]
- Rocken, C.; Ying-Hwa, K.; Schreiner, W.S.; Hunt, D.; Sokolovskiy, S.; McCormick, C. COSMIC system description. Terr. Atmos. Ocean. Sci. 2000, 11, 21–52. [Google Scholar] [CrossRef]
- Englert, C.R.; Harlander, J.M.; Brown, C.M.; Marr, K.D.; Miller, I.J.; Stump, J.E.; Hancock, J.; Peterson, J.Q.; Kumler, J.; Morrow, W.H.; et al. Michelson interferometer for global high-resolution thermospheric imaging (MIGHTI): Instrument design and calibration. Space Sci. Rev. 2017, 212, 553–584. [Google Scholar] [CrossRef]
- Tulasi Ram, S.; Su, S.-Y.; Liu, C.H. FORMOSAT-3/COSMIC observations of seasonal and longitudinal variations of equatorial ionization anomaly and its interhemispheric asymmetry during the solar minimum period. J. Geophys. Res. 2009, 114, A06311. [Google Scholar] [CrossRef]
- Lühr, H.; Häusler, K.; Stolle, C. Longitudinal variation of F region electron density and thermospheric zonal wind caused by atmospheric tides. Geophys. Res. Lett. 2007, 34, L16102. [Google Scholar] [CrossRef]
- Kelley, M.C. The Earth’s Ionosphere: Plasma Physics and Electrodynamics; Academic Press: Cambridge, MA, USA, 2009. [Google Scholar]
- Zhang, S.R.; Foster, J.C.; Holt, J.M.; Erickson, P.J.; Coster, A.J. Magnetic declination and zonal wind effects on longitudinal differences of ionospheric electron density at midlatitudes. J. Geophys. Res. Space Phys. 2012, 117, A08329. [Google Scholar] [CrossRef]
- Richmond, A.D. Ionospheric wind dynamo theory: A review. J. Geomagn. Geoelectr. 1979, 31, 287–310. [Google Scholar] [CrossRef]
- Pfaff, R.; Larsen, M.; Abe, T.; Habu, H.; Clemmons, J.; Freudenreich, H.; Rowland, D.; Bullett, T.; Yamamoto, M.Y.; Watanabe, S.; et al. Daytime dynamo electrodynamics with spiral currents driven by strong winds revealed by vapor trails and sounding rocket probes. Geophys. Res. Lett. 2020, 47, e2020GL088803. [Google Scholar] [CrossRef]
- Yamazaki, Y.; Harding, B.J.; Stolle, C.; Matzka, J. Neutral wind profiles during periods of eastward and westward equatorial electrojet. Geophys. Res. Lett. 2021, 48, e2021GL093567. [Google Scholar] [CrossRef]
- Wang, H.; Zhang, K.; Zheng, Z.; Ridley, A.J. The effect of subauroral polarization streams on the mid-latitude thermospheric disturbance neutral winds: A universal time effect. In Annales Geophysicae; Copernicus GmbH: Göttingen, Germany, 2018; Volume 36, pp. 509–525. [Google Scholar]
- Zhang, S.R.; Erickson, P.J.; Zhang, Y.; Wang, W.; Huang, C.; Coster, A.J.; Holt, J.M.; Foster, J.F.; Sulzer, M.; Kerr, R. Observations of ion-neutral coupling associated with strong electrodynamic disturbances during the 2015 St. Patrick’s Day storm. J. Geophys. Res. Space Phys. 2017, 122, 1314–1337. [Google Scholar] [CrossRef]
- Zhang, K.; Wang, H.; Wang, W.; Liu, J.; Zhang, S.; Sheng, C. Nighttime meridional neutral wind responses to SAPS simulated by the TIEGCM: A universal time effect. Earth Planet. Phys. 2021, 5, 52–62. [Google Scholar] [CrossRef]
Publisher’s Note: MDPI stays neutral with regard to jurisdictional claims in published maps and institutional affiliations. |
© 2022 by the authors. Licensee MDPI, Basel, Switzerland. This article is an open access article distributed under the terms and conditions of the Creative Commons Attribution (CC BY) license (https://creativecommons.org/licenses/by/4.0/).

