Article

Estimation of Chlorophyll-a Concentrations in Lanalhue Lake Using Sentinel-2 MSI Satellite Images

by
Francisca Barraza-Moraga
1,
Hernán Alcayaga
1,*,
Alonso Pizarro
1,
Jorge Félez-Bernal
2 and
Roberto Urrutia
2
1
Civil Engeenering School, Universidad Diego Portales, Santiago 8370109, Chile
2
Environmental Science Faculty, Centro EULA-Chile, Universidad de Concepción, Concepción 4070386, Chile
*
Author to whom correspondence should be addressed.
Remote Sens. 2022, 14(22), 5647; https://doi.org/10.3390/rs14225647
Submission received: 28 September 2022 / Revised: 30 October 2022 / Accepted: 2 November 2022 / Published: 9 November 2022
(This article belongs to the Special Issue Remote Sensing for Water Environment Monitoring)

Abstract

:
Inland water is fundamental for the conservation of flora and fauna and is a source of drinking water for humans; therefore, monitoring its quality and ascertaining its status is essential for making decisions in water resources management. As traditional measuring methods present limitations in monitoring with high spatial and temporal coverage, using satellite images to have greater control over lake observation can be a handy tool and have satisfactory results. The study of chlorophyll-a (Chl-a) has been widely used to ascertain the quality of the inland aquatic environment using remote sensing, but in general, it depends on the local conditions of the water body. In this study, the suitability of the Sentinel-2 MSI sensor for Chl-a estimation in a lake in south-central Chile is tested. An empirical approach is proposed, applying multiple linear regressions, comparing the efficiency and performance with L1C and L2A products, separating the equations constructed with spring-summer and fall-winter data, and restricting Chl-a ranges to those measured in the field to generate these regressions. The algorithms combining spectral bans proved to have a good correlation with Chl-a measured in the field, generally resulting in R2 greater than 0.87 and RMSE and MAE with errors less than 6 μg L−1. The spatial distribution of Chl-a concentrations at the study site was obtained based on the proposed equations.

1. Introduction

Surface water bodies are of the utmost importance to sustaining all sources of life; they are essential resources for human needs and preserving biodiversity in the riparian, lake, and wetland ecosystems, providing abundant habitats for flora and fauna [1]. The role of lakes as carbon-cycling hotspots and climate regulators has been recognized. There is an urgent need to understand their condition worldwide better [2].
The chlorophyll-a (Chl-a) concentration is considered an indicator of the abundance and quality of phytoplankton biomass [3,4]. Phytoplankton is generally found in aquatic ecosystems and is known to emerge through natural processes [5] triggered by environmental conditions. Nonetheless, excessive cyanobacteria growth leads to an imbalance in the primary and secondary productivity of lake ecosystems, which can have negative consequences for the aquatic environment [6]; therefore, a monitoring system that allows these changes to be determined is needed. Chlorophyll-a is a representative proxy of water bodies’ health status (quality) [7], acting as a robust and consistent indicator of their trophic status.
Lakes are more complex and diverse than marine or oceanic water bodies; their optical properties may have greater temporal and spatial variation, depending on biological composition [8] and the human activities that have increased nutrients in many water bodies [9]. Cyanobacteria are mainly moving or floating gas-vacuolate microorganisms that produce massive microalga blooms. These surface blooms are highly affected by environmental forcings such as wind, temperature, and sunlight; a massive bloom can appear in a few days and disappear entirely from the surface [10]. Traditional methods of extracting samples from the lake based on sampling points and subsequent laboratory studies are costly, laborious, and slow; and cannot adequately assess the entire water body [11,12]. To overcome these limitations, the challenge lies in incorporating water quality monitoring methods with regular, almost real-time, cost-effective, automated, and noninvasive approaches with adequate spatiotemporal coverage [13,14]. Remote sensing techniques allow various sampling locations to be covered, information on often inaccessible points to be obtained, and quick assessment of the ecological status of the water body, which is advantageous over traditional studies involving sampling and subsequent laboratory analysis [15,16]. The capabilities of these satellite images can be exploited in various areas to survey different phenomena at large scales [17] and detect variations in the water resources in both ground and surface water bodies [18,19].
The United States Geological Survey (USGS), Japan’s Ministry of International Trade and Industry (MITI), NASA, and ESA have worked with Google to make these satellite data available online through Google Earth Engine (GEE) [20]. GEE is a free cloud-based platform for planetary-scale geospatial analysis developed by Google [21]. It provides programming tools and a data library for users with relatively simple code [22]. Thus, GEE enormously reduces the work required to download and process satellite images, simplifying workflows and making satellite information management more accessible [23,24]. It also includes climate and geophysical datasets and ready-to-use products derived from various sensors, such as the Enhanced Vegetation Index (EVI) and the Normalized Difference Vegetation Index (NDVI) [25]. The unique capabilities of GEE provide unprecedented opportunities to use this platform for large data processing and interpretation tasks; therefore, it is effectively applicable in various disciplines in all branches of Earth and environmental sciences [26,27].
Some satellite platforms designed for ocean monitoring, such as NASA’s (National Aeronautics and Space Administration) Moderate Resolution Imaging Spectroradiometer (MODIS), the Visible Infrared Imaging Radiometer Suite (VIIRS), and ESA’s (European Space Agency) Sentinel-3 Ocean and Land Colour Instrument (OLCI), have spatial resolutions of approximately 1000, 740, and 300 m, respectively. However, the 300-m spatial resolution of the OLCI allows monitoring of only 5% of the lakes in North America [28], as coarse resolutions are not adequate for mapping the quality of small inland water bodies [29].
The MSI (Multi-spectral Instrument) optical sensors installed on Sentinel-2 satellites are an effective tool for studying inland freshwater ecosystems [30,31]. The improved spatial resolution of Sentinel-2 and its high data-capture frequency (2 to 3 days) have allowed successful estimation of Chl-a in small lakes using algorithms that relate in situ data to band reflectivity [32,33]. Based on examples from the literature, it is recommended to work with L2A (bottom-of-atmosphere reflectance images, BOA) or apply correction procedures [34] to the L1C data (top-of-atmosphere reflectance in cartographic geometry, TOA). Despite the above, remote sensing studies have applied empirical algorithms using only L1C data (TOA) and obtained good results, such as the study of Peppa et al. [35]. There have also been studies in which the performances of atmospherically corrected (BOA) and uncorrected images (TOA) are compared, such as those of Toming et al. [36] and Grendaitè et al. [37], even providing better results with the TOA data than with BOA data.
Despite significant efforts in this regard, some questions remain unanswered. One of the most critical gaps in the literature is related to the harmonization of new frameworks related to rapidly evolving technology. The latter can be posed as a function of questions that are briefly mentioned as follows: (i) Which satellite product is more suitable for Chl-a concentrations retrieval? (ii) What formulation gives more reliable results? (iii) Does the results performance depend on the location, lake extent, and seasonality? Given the above open questions, the main goal of this paper is to assess the effectiveness of Sentinel-2 MSI data in its L1C and L2A products to map Chl-a concentrations using empirical algorithms based on the bands’ reflectances. The rest of the paper is organized as follows: Section 2 presents the methodology used (case study information, Chl-a models, and performance indices). Section 3 shows the results, highlighting the performance of Sentinel 2 data to retrieve and map Chl-a concentrations in Chilean lakes. Conclusions are provided at the end.

2. Materials and Methods

2.1. Study Site

Lanalhue Lake is located in the Biobío Region. It is part of a system of coastal lakes located in south-central Chile known as the “Nahuelbutan lakes” due to their location on the north-central coastal slope of the Nahuelbuta Range. It has a water surface area of approximately 31.9 km2, and its basin has an area of 327.4 km2. Figure 1 shows this water body’s location and the basin’s land uses.
Land use in the Lanalhue Lake basin has been affected by changes from native forest cover to monoculture forestry plantations Pinus radiata and Eucaliptus globus, which have entailed a modification of hydrological components, increasing the export of sediment and nutrients from the basin to the lake [38]. Additionally, the lake is highly influenced by buildings not served by a wastewater treatment plant and recreational activities (e.g., camping areas, nautical activities, hotels, and hostels for tourism).
Nahuelbutan lakes present significant tourist activities. In addition, Lanalhue Lake is located in areas with a strong Indigenous presence, which in Chile is an essential cultural component in the decision-making process regarding the use and conservation of these aquatic systems [38].

2.2. Acquisition of In Situ Limnological Data

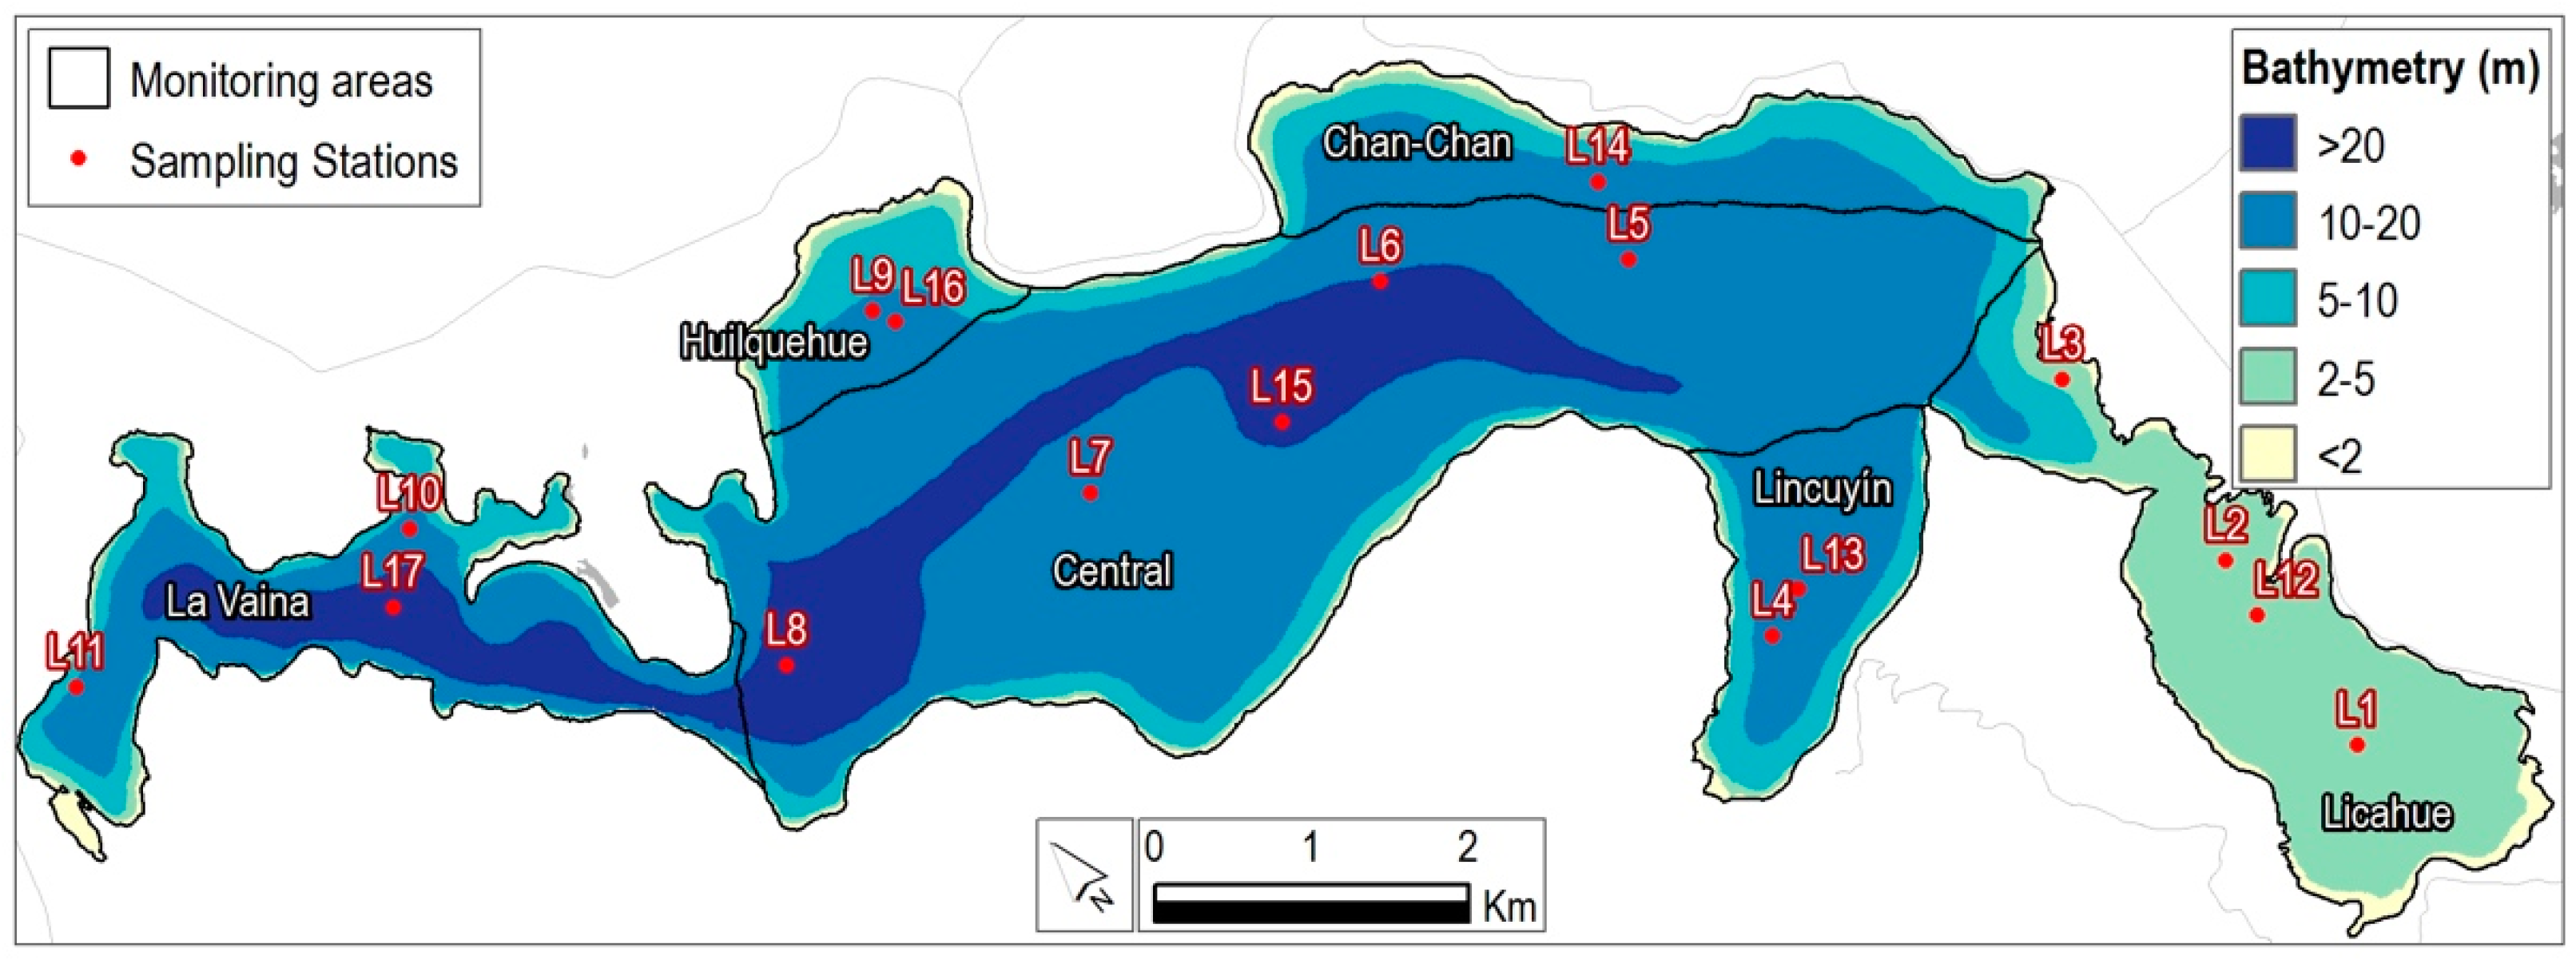
The Chl-a data measured in situ were obtained through field campaigns carried out by PRELA (Program for the Recovery of Environmental Services of the Ecosystems of the Arauco Province). This vital and novel initiative aims to safeguard the quality of inland aquatic water bodies; it promotes an approach of prevention for the oligotrophic and mesotrophic lakes and restoration for those with eutrophication issues. The samplings were carried out between September 2018 and January 2022. The first sampling period (from September 2018 to March 2020) included 11 stations (L1 to L11), while the second period (June 2021 to January 2022) included 6 monitoring stations (L12 to L17). The locations of the sampling points are presented in Figure 2.
For Chl-a analysis, the samples were filtered, extracted, and centrifuged under the EPA 445.0 method (1997). The readings were taken with a Turner Designs model 10-AU-005-CE fluorometer, with the results expressed in μg L−1 or mg m−3. The sampling was planned for geographic sites such as littoral zones influenced by tourism activities and limnetic zones in which the lake is deeper (Figure 2). On the one hand, locations samples points with little intervention were considered, and on the other hand, locations where the main tributaries flow into the lake, contributing to relevant water discharges with nutrients loads exported from the sub-basins (intensified by agricultural and forestry activities and urban water discharge from the Contulmo treatment plant), were considered for the monitoring. Due to these human activities, it is important to monitor Chl-a, as there is potential for the lake to receive a significant quantity of nutrients, making it susceptible to undergoing the eutrophication process [33]. As Chl-a is an optically active pigment that produces a characteristic spectral signature, its concentration should be detectable using multispectral sensors onboard satellites [39].

2.3. Satellite Data and Processing

The images used in this study are from the Sentinel-2 satellite of ESA’s Copernicus Earth observation program. The Sentinel-2 mission operates two twin satellites simultaneously: Sentinel-2A (operational since 2015) and Sentinel-2B (operational since 2017). Each instrument has a multispectral sensor (MSI) that contains 13 bands, from the visible spectral range to shortwave infrared, with spatial resolutions of 10, 20, and 60 m and a temporal resolution of 5 days [40].
As previously mentioned, two Sentinel-2 data products were used in this study: L1C and L2A. The L1C satellite image set (TOA) was obtained from Google Earth Engine (GEE). The GEE data repository and computer algorithms allow cloudless image pixels that approximately coincide with the locations and dates of the water quality samples to be identified (in-situ monitoring locations). Mosaics with the visible range (RGB), red edge, near-infrared (NIR), and shortwave infrared (SWIR) range bands were exported with a resolution of 20 m.
The L2A product provides bottom-of-atmosphere (BOA) reflectance. These images are created by processing L1C images. Sentinel-2 makes processed and ready-to-use images available online. However, the decision was made to correct the images in an external processor because for the first water sampling, which took place during the 4–8 September period, no Sentinel-2 L2A images were available. To carry out this process, L1C images were downloaded from the Copernicus program website: https://scihub.copernicus.eu/ (last access: 22 August 2022). Atmospheric correction was done using the Sen2cor plugin (version 2.5.5), available on ESA’s Sentinel SNAP Toolbox [41,42,43], and imposing the 20-m resolution.
The satellite data capture dates of the chosen images coincided approximately with the sampling dates. Images without cloud cover over the study site were used, as clouds can cause errors in the interpretation of the band reflectance, and these errors can be transferred to the proposed equations. However, considering the pixel size in comparison with the lake extent (20 m in comparison with 32 km2, respectively), it was impossible to have, in some cases, images over the entire lake without clouds. ArcGIS 10.3 was used to work with both satellite image product types. Reflectivity was extracted using the inverse distance squared weighted with a neighborhood of 2 × 2 kernels, taking as reference the location of the samples.

2.4. Chlorophyll-a Models

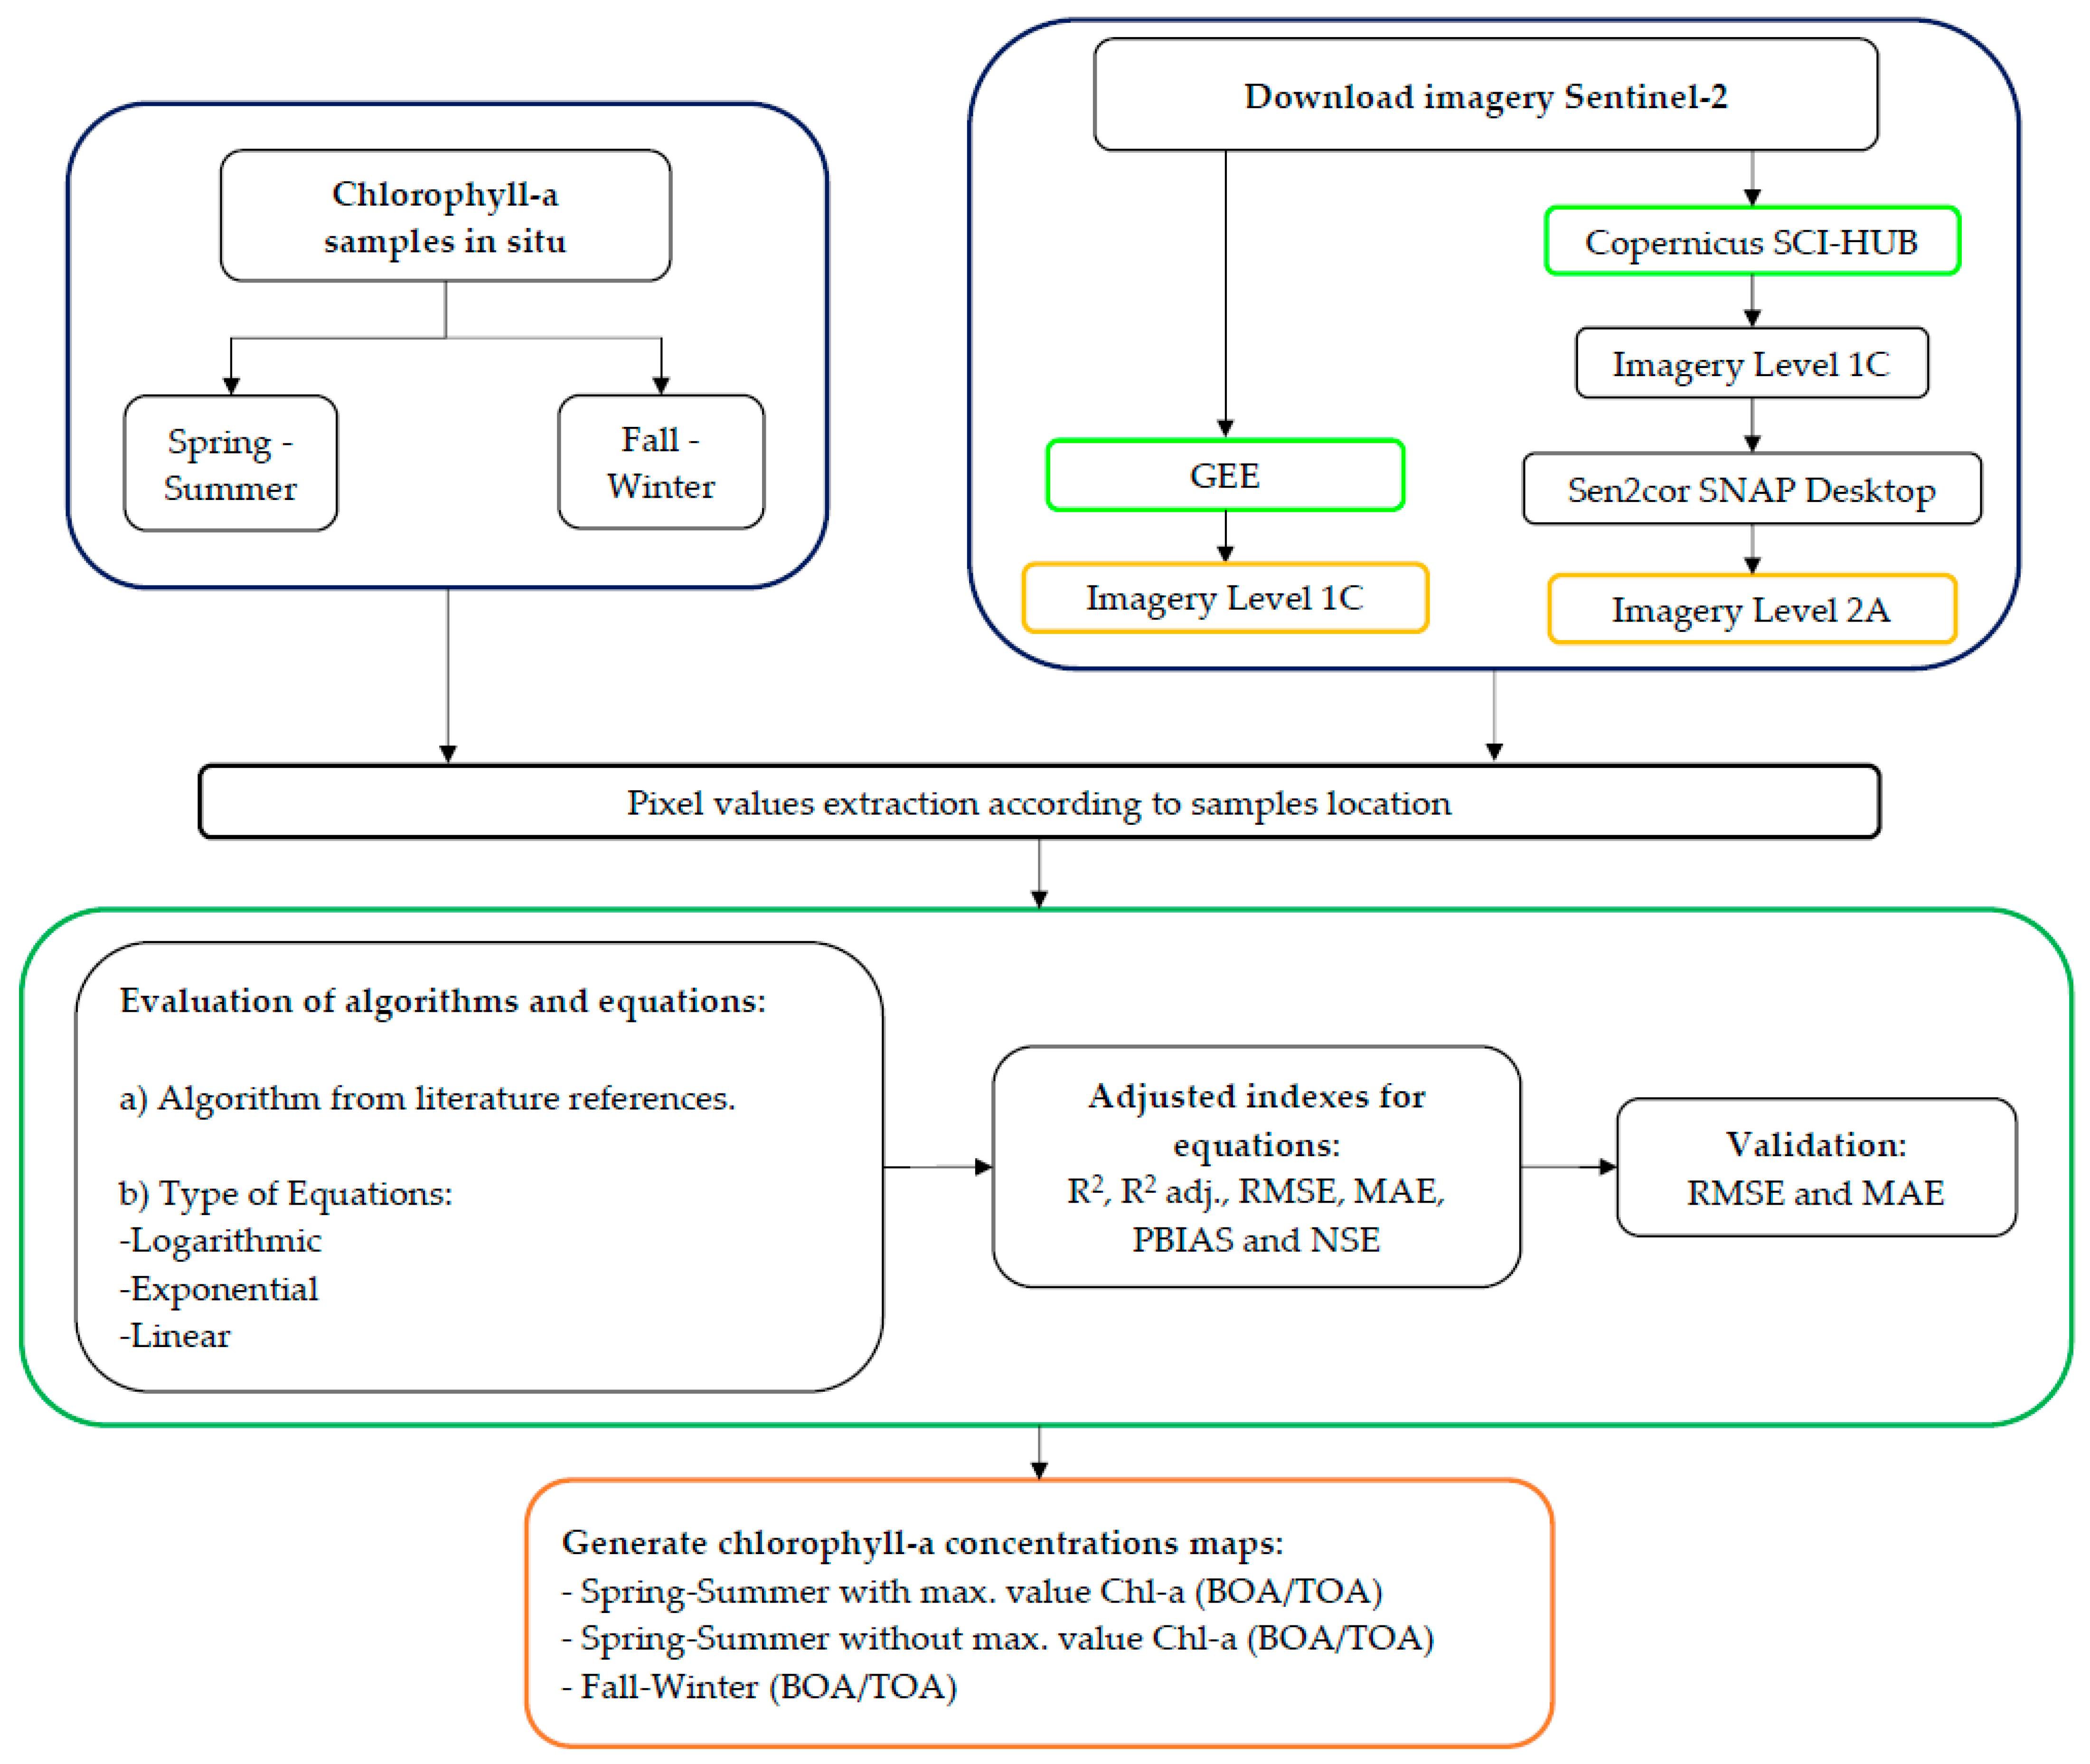
An overview of the methodological procedure in this study is presented in Figure 3. Initially, empirical algorithms (EA) for remote sensing of Chl-a found in the literature were tested. In parallel, multiple linear regressions (MLR) were programmed. For each empirical algorithm found in the literature and those developed in this study, the fit indicators were calculated, and on this basis, the best-performing equations were determined.
The previously mentioned multiple linear regressions were programmed in Rstudio (version R 4.2.1), deriving the Chl-a concentration estimation models (equations) using the existing correlations between the concentrations measured in situ and the reflectance of the satellite images in different Sentinel-2 bands as predictor variables. Images that coincided in time (date) and space (sampling point pixel) were sought and used. To this end, the RGB (B2, B3, and B4), red edge (B5, B6, and B7), NIR (8A), and SWIR (B11 and B12) bands were used. The general formula of the regressions takes the form of Equation (1), in which in situ Chl-a is the dependent variable, α are coefficients related to the independent or predictor variables (which in this case are the reflectivity of the bands (B)), and Ɛ is the residual error associated with the regression. The data set was divided into two parts (calibration and validation) and into two periods: spring-summer and fall-winter. For the selection of predictor bands, the degree of significance of each in the regression was used, with p > 0.05 indicating that it is not statistically significant and thus eliminated. Regressions in which the coefficient of determination (R2) and coefficient of determination adjusted (R2adj) was closest to unity (i.e., their optimal value) were selected.
Chl - a   ( μ g   L 1 ) =   α 0 + α 1 B 1 + α 2 B 2 +   α 3 B 3   α n B n +   ε

2.5. Assessment of Empirical Algorithm (EA) and Multiple Linear Regression (MLR) Performances

We used six statistical efficiency indicators to evaluate the performance of the empirical algorithms and multiple linear regression models in the calibration phase. The calculations of these indicators are based on comparing concentrations observed in the field (O) and those predicted (P) using each EA and MLR equation. The root mean square error (RMSE) and mean absolute error (MAE) indicators were used for validation. The results of these indicators were classified qualitatively according to the Moriasi criteria, which classify these indices for both hydrological and water quality models [44]. The metrics were calculated with the hydroGOF package in Rstudio.
The coefficient of determination (R2) is defined as the Pearson correlation coefficient squared and is calculated following Equation (2):
R 2 = [ i = 1 n ( O i   O ¯ ) ( P i   P ¯ ) i = 1 n ( O i   O ¯ ) 2 i = 1 n ( P i   P ¯ ) 2 ] 2
where   O ¯ is the average of the observed values and   P ¯ is the average of the simulated or predicted values [45]. In addition, the value of the coefficient of determination adjusted (R2adj) was considered. These performance indicators were used to describe the proportion of variance that is explained and can take values between 0 and 1. The difference between R2 and R2adj is that the latter penalizes the number of predictor variables used in the model. R2 always increases when a new predictor variable is added to the model, causing overvaluation of the models [46]; therefore, it was reasonable to incorporate R2adj because of the total number of used bands (predictor variables in Equation (1)).
Two other indicators used to assess the performance of the EA and MLR are RMSE and MAE. These indicators are calculated following Equations (3) and (4), respectively. An RMSE or MAE value of zero indicates a perfect fit, and values lower than half of the standard deviation of the observed data can be considered to indicate a poor fit [45].
RMSE = 1 n 1 = 1 n ( O i P i ) 2
MAE = 1 n i = 1 n | O i P i |
The Nash–Sutcliffe efficiency (NSE), proposed by Nash and Sutcliffe [47], is a statistic that estimates the relative magnitude of the residual variance compared to the measured data. A score of NSE = 1 indicates a perfect fit between the observed and simulated data, NSE = 0 indicates that the simulation model has the same predictive capacity as the mean of the observations, and NSE < 0 indicates that the simulation is a worse predictor than the mean of the observations [47]. NSE is calculated with Equation (5):
NSE = 1 i = 1 n ( O i P i ) 2 i = 1 n ( O i   O ¯ ) 2
The percent of bias (PBIAS) measures the average tendency of the simulated values to be larger or smaller than the observed ones. PBIAS = 0 indicates an optimal value, and values ±5 ≤ PBIAS ≤ ±10 indicate that the model offers a very good simulation. Positive values over 10 indicate that the model has an underestimation bias, and negative values under −5 indicate an overestimation bias [45]. PBIAS was calculated with Equation (6):
PBIAS = i = 1 n O i P i i = 1 n O i   ×   100

3. Results

3.1. Chlorophyll-a and Satellite Image Results

The chlorophyll-a concentrations presented a large variability over time and across the surface of the lake water. In Table 1, the statistical characteristics of the Chl-a concentrations are summarized by period. The concentrations varied between 1.9 μg L−1 and 74.1 μg L−1 in the spring-summer period and between 1.3 μg L−1 and 15.2 μg L−1 in the fall-winter period. Supplementary Material S1 provides all the Chl-a concentration values from all the samplings. As expected, the lake presents a clear upward trend of greater Chl-a concentrations during the spring-summer period, with an average of 20.4 μg L−1 during March 2020. In addition, the Chl-a sampling demonstrated that the concentrations could not be considered spatially homogenous. The Licahue littoral zone (Figure 2) is where the highest Chl-a concentrations were measured during March 2020. Two factors cause the Licahue littoral zone to have the highest Chl-a concentrations: (i) the hydrodynamics of the lake, in which the flow circulation configuration is determined by the bathymetry (Licahue is a flatter zone) and wind patterns (Licahue is located in a confined inland area, protected from the prevailing winds, which come from the northwest); and (ii) The Licahue littoral zone receives nutrients exported from its tributary watersheds, as well as from a number of camping areas and homes without wastewater treatment and the treatment plant in the town of Contulmo (Figure 1).
The selected images coincided with the dates of the samplings at the lake, with the exception of the sampling of 24 November 2021, which could not be matched with the date on which the satellite image was captured (22 November 2021), making a difference of 2 days. While this could introduce uncertainty to the results of this study, in the literature, there are studies in which satellite and field data from different dates have been used, with R2 varying between 0.77 and 0.98 [48].
Table 2 summarizes the information used to calibrate and validate the proposed models (dates of the satellite images; the total matching points between the sampling stations and images; and, Chl-a ranges). Worth mentioning—and due to the satellite pixel size in comparison with the lake extent (20 m and 32 km2, respectively)—is that clouds covered some areas of the lake only. Therefore, it was not possible for all the sampling station points to match the reflectance values in the bands (we avoided using satellite information at lake points covered by clouds). Consequently, not all Chl-a ranges could be covered. As a result, 24 data were available for the spring-summer period and 17 for the fall-winter period. These data were used for calibration and validation.

3.2. Empirical Algorithm and Multiple Linear Regression Results

The empirical algorithms performed very poorly, as shown in Table 3. Linear regression presented better statistical indicators compared to the EA. Other studies have also shown that using linear models gives good results in reservoirs [49,50], but they must be developed for each site (i.e., they are site dependent). The algorithms presented in Table 3 correspond to BOA images without considering seasonality.
In this study, six multiple linear equations were obtained that relate chlorophyll-a concentrations (Table 4) to the reflectance of the different bands. The equations are characterized according to satellite data type (L1C and L2A), year period, and Chl-a concentration ranges. In addition, the equations developed for the spring-summer period were divided into two, as among 24 concentration values, there were two that were much higher than the others (72.4 and 74.1 μg L−1). Therefore, equations that included and excluded these maximum values (maximum Chl-a concentration = 16.4 μg L−1) were sought.
Table 4 shows that all the equations are strongly influenced by the green, red, and red edge bands (B3, B4, and B5, respectively). This is consistent with the reflectance of B3, which has a wavelength of around 560 nm and a low absorption coefficient, which indicates high Chl-a reflectance [55]. In addition, B4 and B5 are in the range of the spectrum in which Chl-a is masked due to the characteristics of chlorophyll pigment absorption. For these bands, the wavelengths are centered at 665 nm and 700 nm, respectively, and for these wavelengths, the high concentrations of Chl-a can be detected (eutrophic lakes), associated with the maximum backscattering [35,56] for chlorophyllous pigments.
The model efficiency results are presented in Table 5 for calibration and validation. Supplementary Material S3 presents the detail of the dataset used for calibration and validation. In calibration, the MLR using TOA and BOA data delivered a very good correlation R2 > 0.87. The R2adj with the lowest value (0.77) was found for the spring-summer period, using TOA data and restricting the Chl-a range to 16.4 μg L−1. However, an R2adj of 0.77 is still within the range categorized as acceptable. Suppose the maximum Chl-a values of up to 74.1 μg L−1 are considered; the R2adj increases to 0.86. The RMSE and MAE indicators were below 6 μg L−1 and 5 μg L−1, respectively; NSE was >0.91 for all cases, and PBIAS was between −4.4 and 0.5. According to [44], all these indicators can be classified as good in assessing water quality models. If we compare the fit metrics, the equations for the spring-summer period developed with BOA data performed better, and the equations for the fall-winter period performed better using TOA data. However, the difference is not very significant.
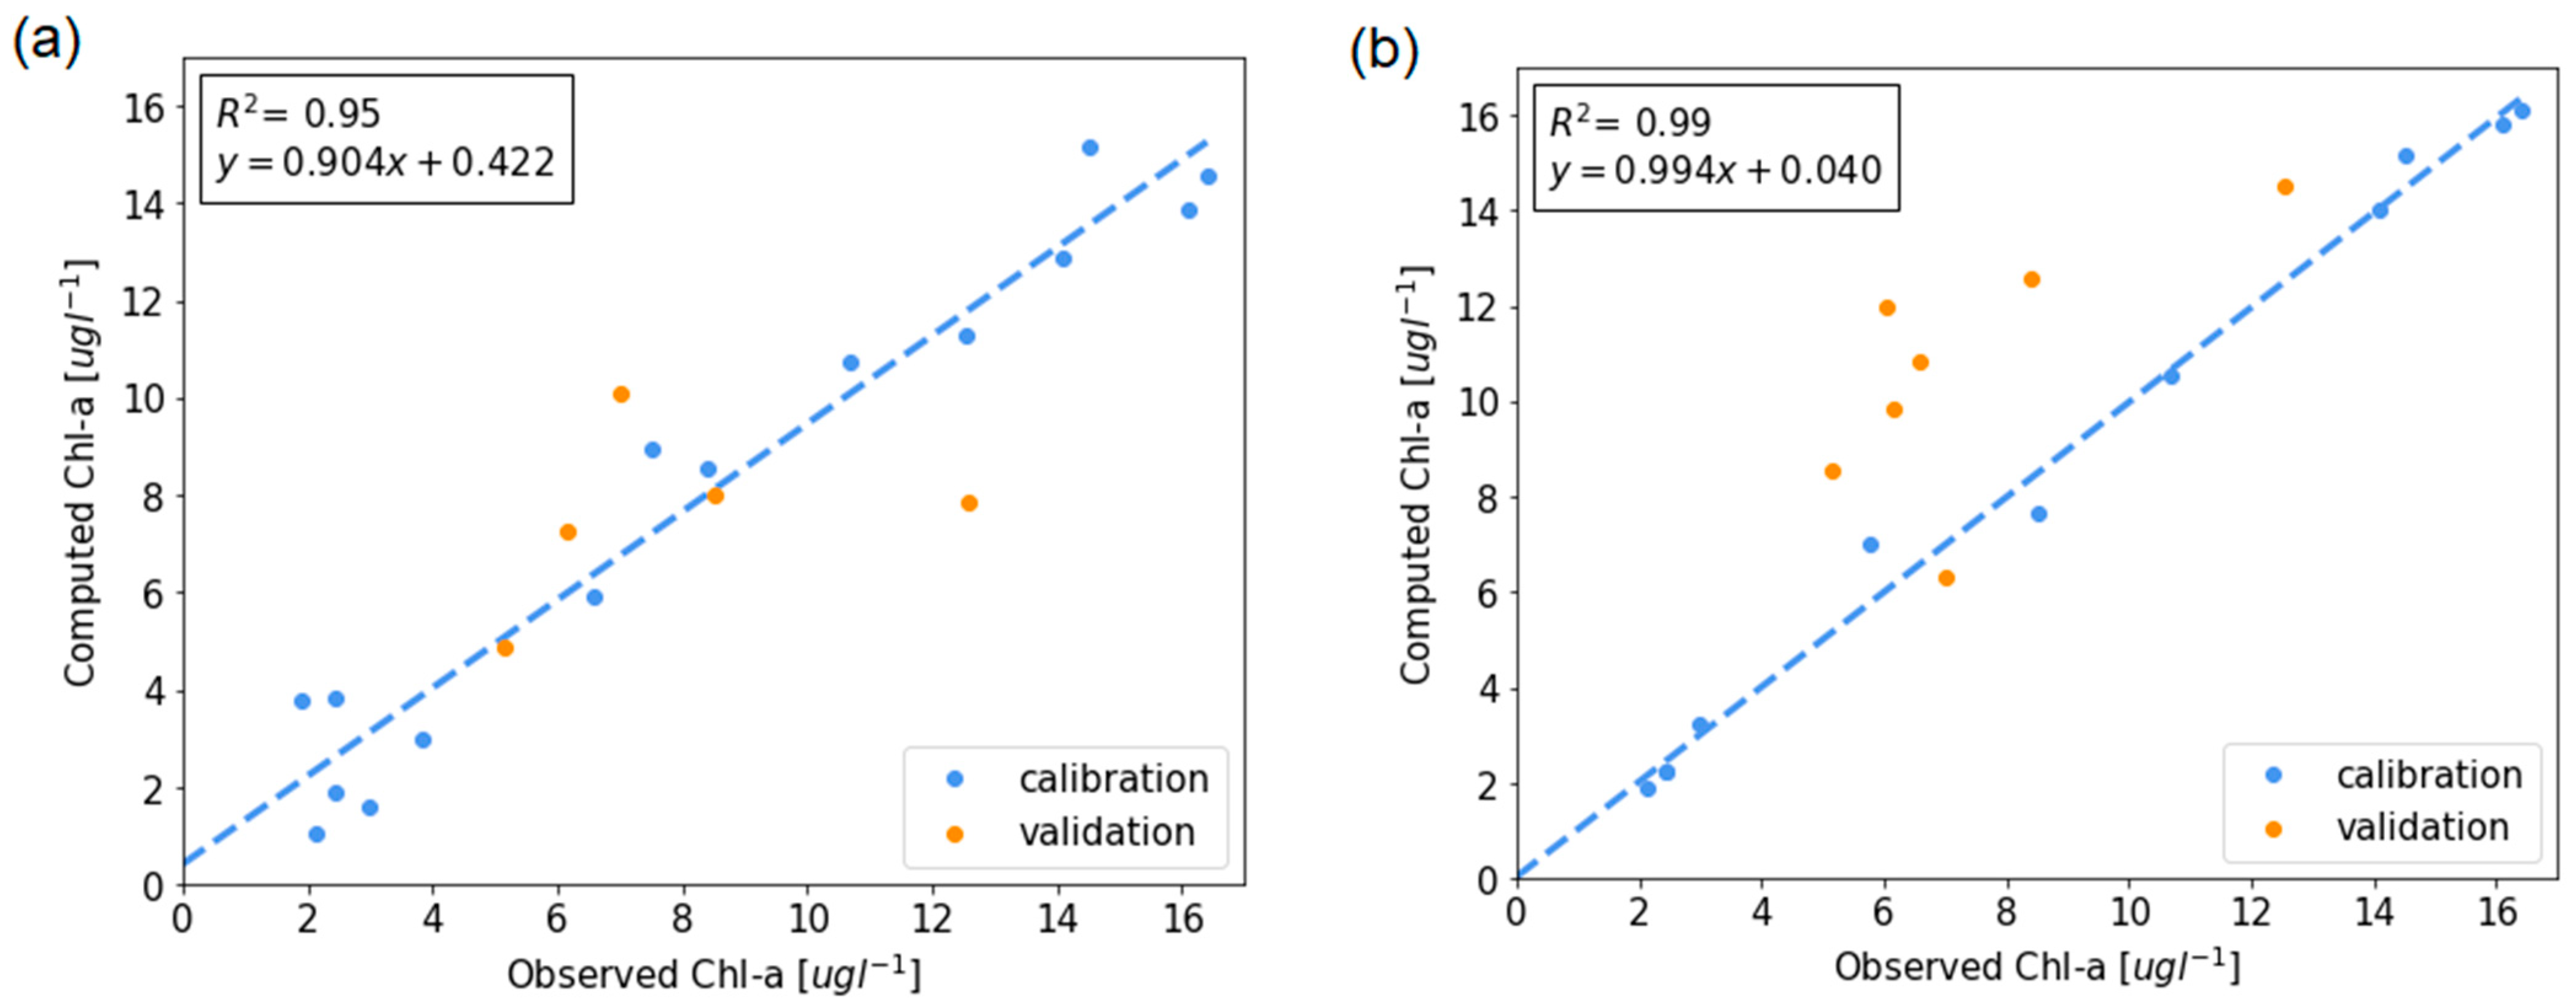
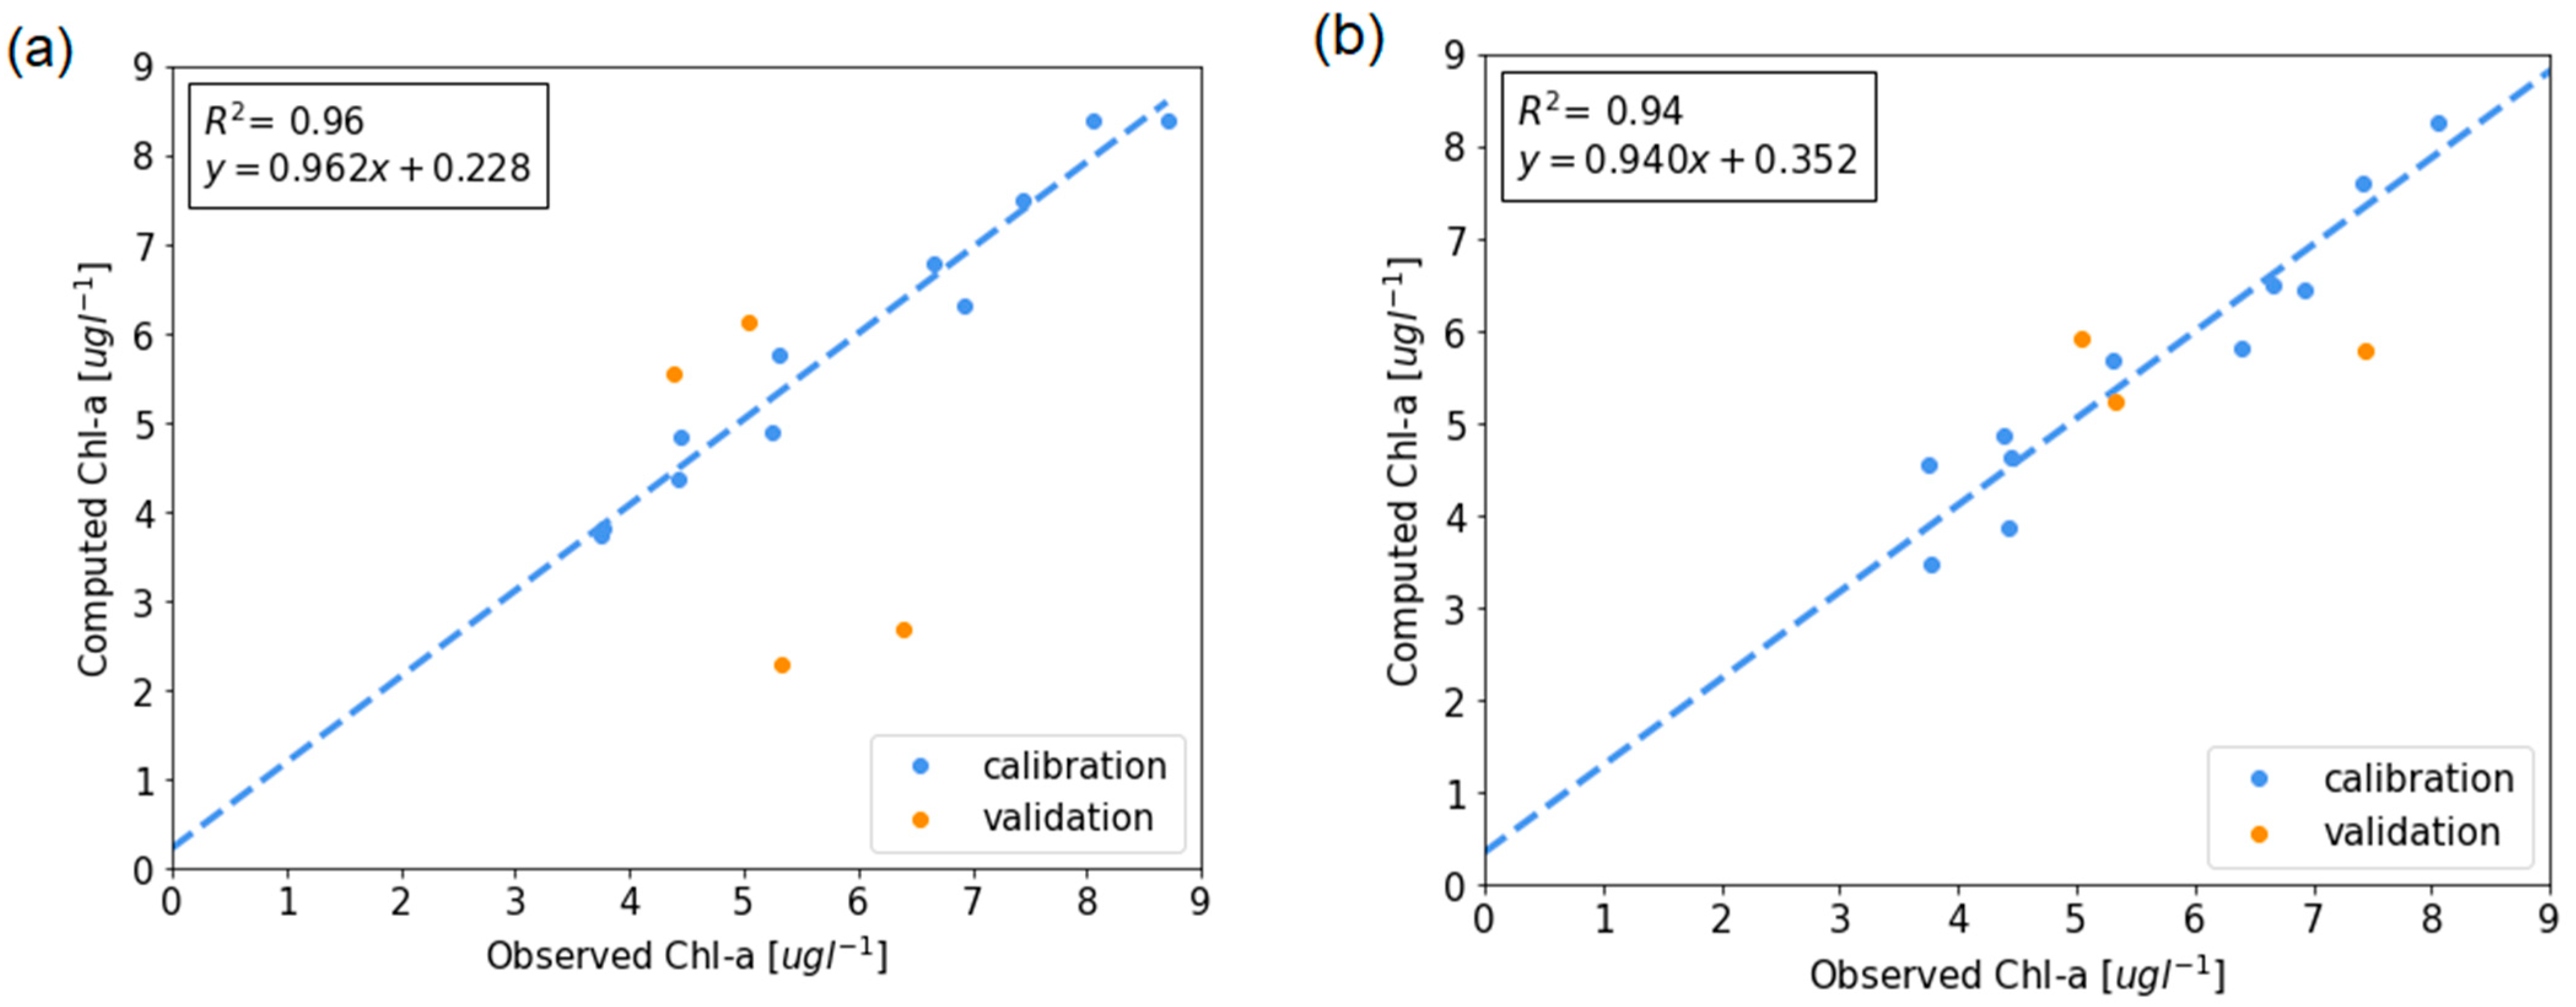
Meanwhile, in the validation stage, the TOA data gave good results in the spring-summer period. The MLR using TOA and BOA data for the fall-winter period gave very similar results classified as good for water quality models [44]. Figure 4, Figure 5 and Figure 6 show the scatter plots of the observed results versus those simulated in calibration and validation.

3.3. Generation of Chlorophyll-a Maps from MLR

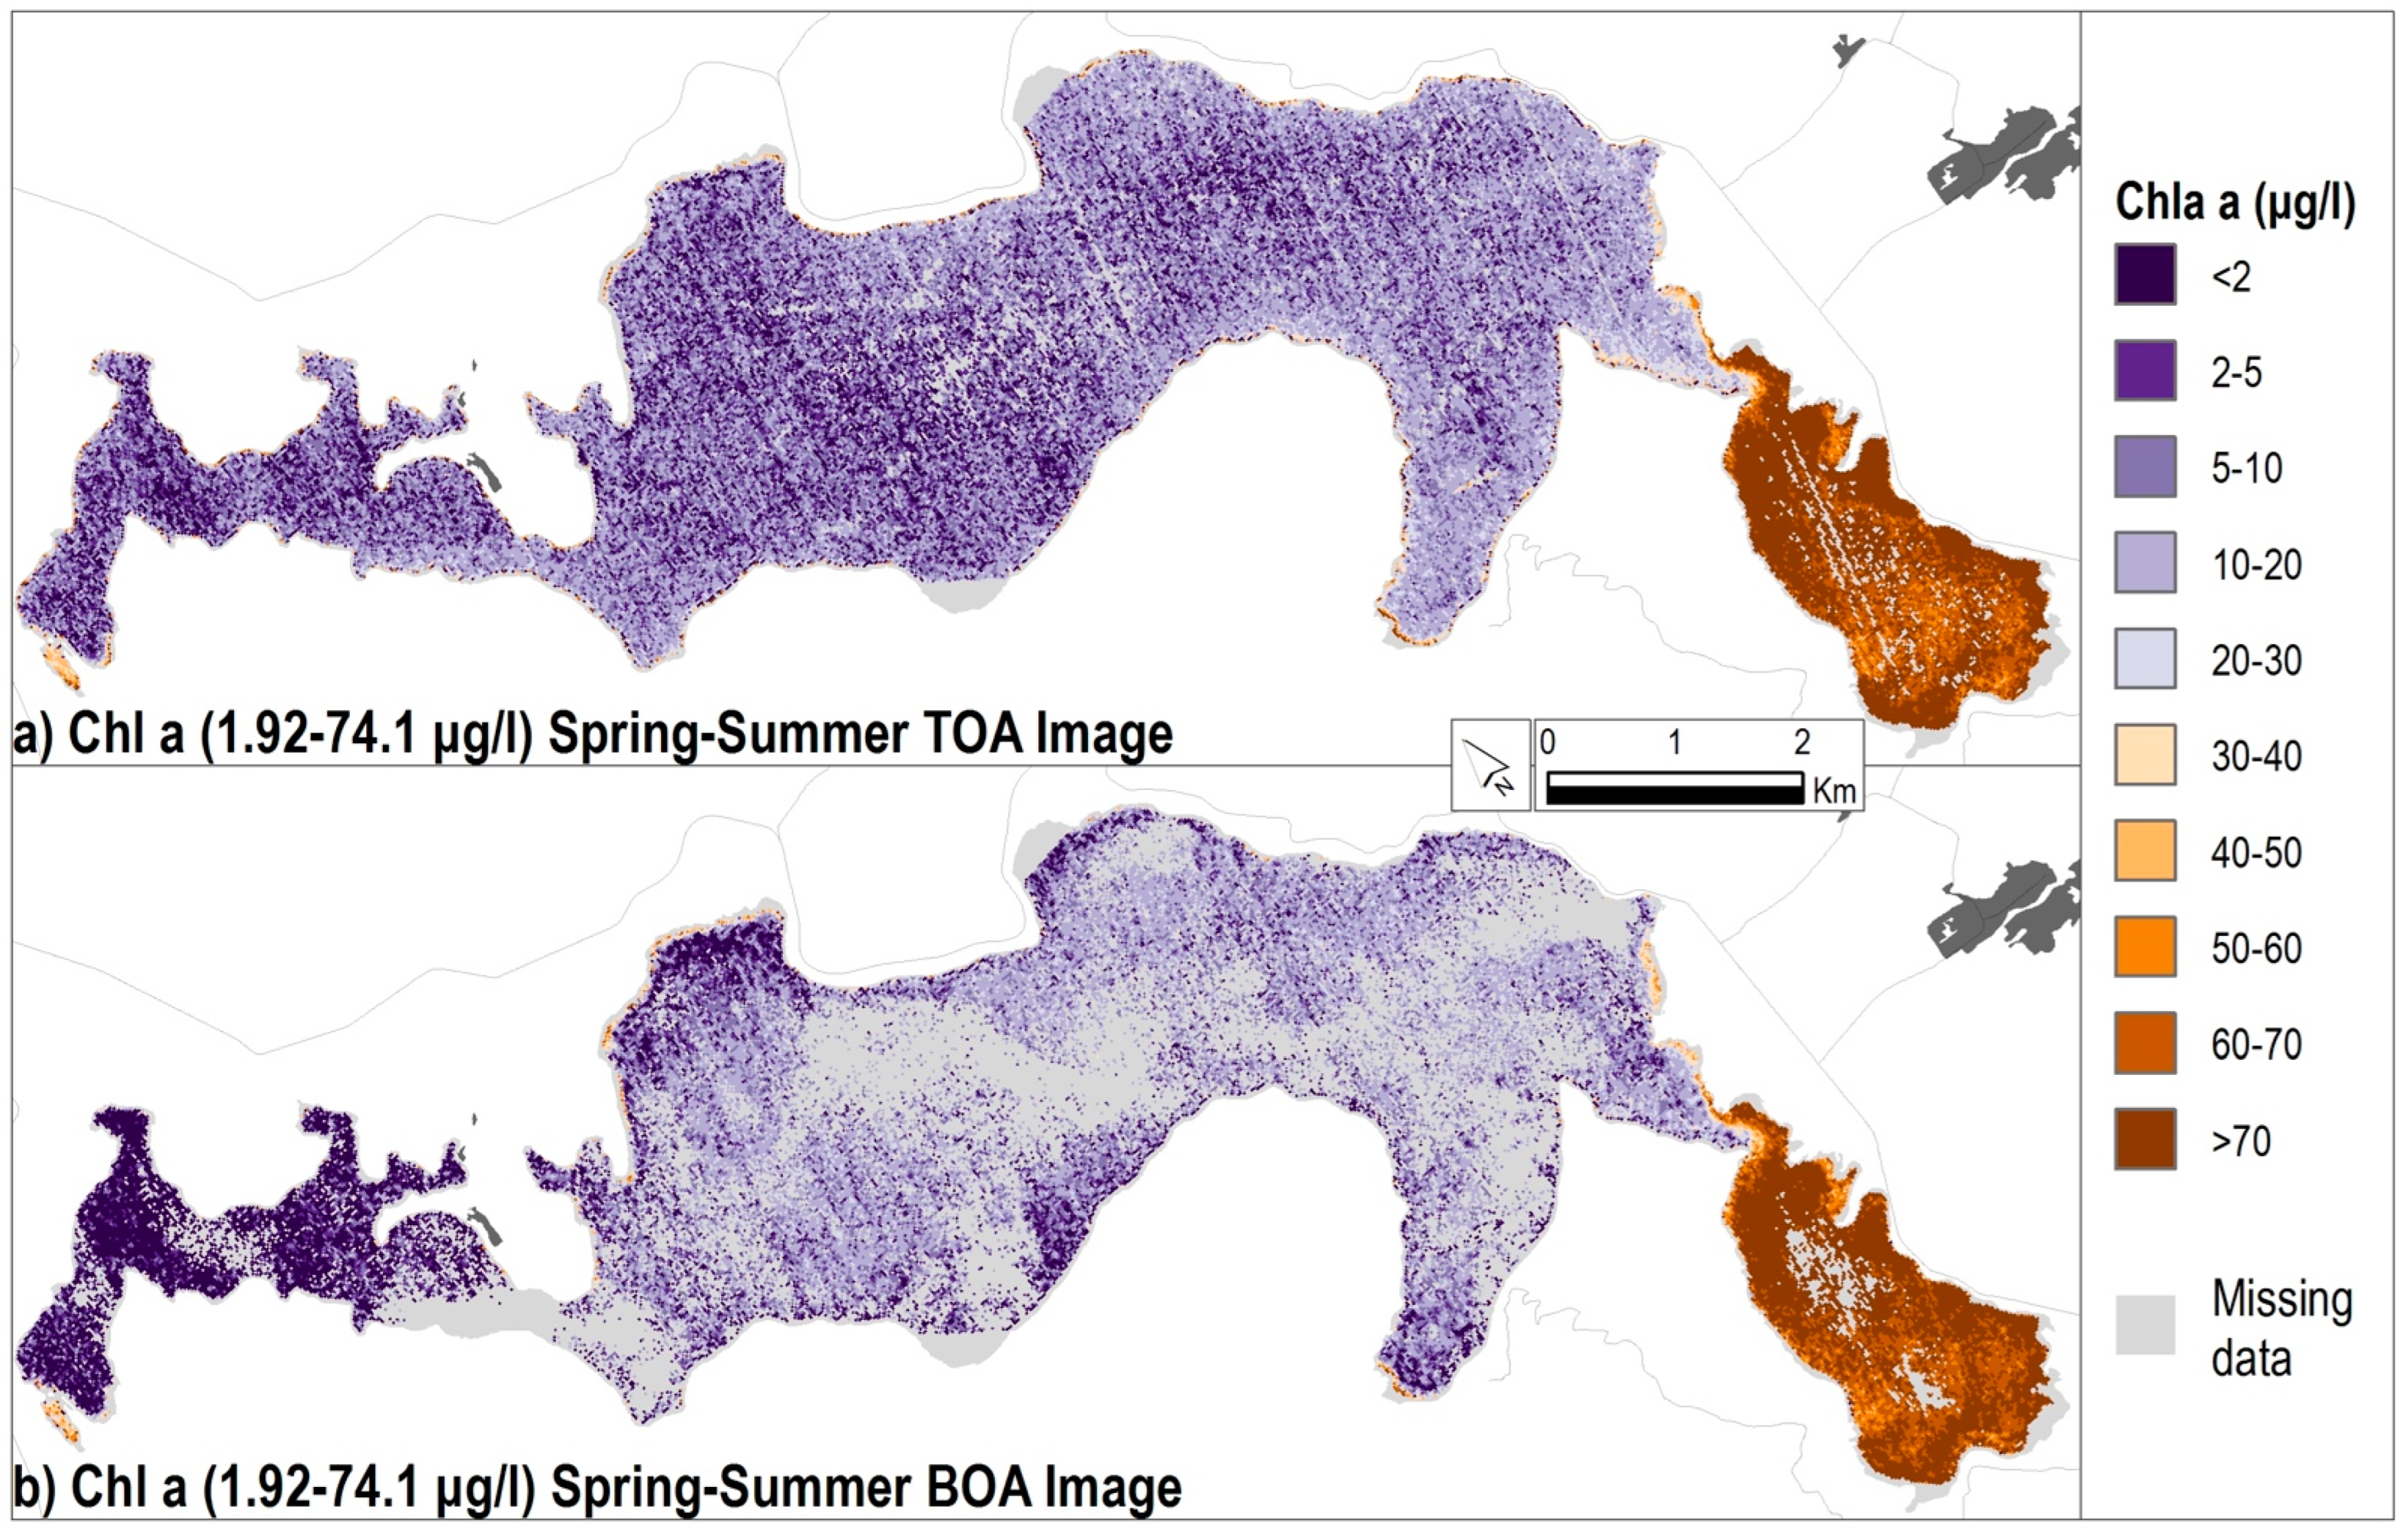
Application of the MLR equations generated the concentration results presented in Figure 7, Figure 8 and Figure 9. Figure 7 shows the spatial distribution of the fall-winter period, both TOA and BOA, for the date 2August 2019, and Figure 8 and Figure 9 show the spatial distribution of the spring-summer period for the date March 14 2020, considering the maximum concentration measured (74.1 μg L−1; Figure 8) and the excluded the maximum concentration measured (Figure 9), for TOA and BOA. In these concentration maps, the white zones (no values) are areas in which it was not possible to calculate concentrations because the reflectance values for the different bands were outside the range (above or below) for which the equation was generated. Supplementary Material S2 presents details on the valid reflectance ranges for each MLR and each band. Similarly, for Figure 8 and Figure 9, when the equations in Table 4 are applied, some of the calculated concentration values are outside the ranges (higher values) with which the MLR was generated; these are shown in white.
In general, the Chl-a distribution shown in the maps is consistent, and, as expected, the area with the highest concentrations is in the Licahue littoral zone. In the fall-winter maps, the equations based on the BOA data manage to determine Chl-a with greater precision than that based on TOA data. With the BOA data, it is possible to determine concentrations in a greater surface area of the lake (Figure 7), as the reflectance ranges with which this equation was developed are wide (see Table 4 BOA equation, fall-winter, and Supplementary Material S2 ranges).
Unlike the case of the fall-winter period, the maps of the spring-summer period generated with TOA data manage to determine Chl-a with more precision than those generated with BOA data. The maps made with TOA data determine Chl-a in a larger surface area of the lake (Figure 8 and Figure 9), as more pixels in these images are within the range of bands for which the MLR was developed. In addition, it was observed that wind increases the surface roughness of the lake water, which alters the reflectance captured by the sensor, especially in the limnetic La Vaina zone, which is more susceptible to prevailing northwest winds.
On the one hand, from an operational perspective, it is better to have concentration maps covering a greater lake surface area to identify areas with high concentrations more precisely. On the other, it must be considered that the concentration maps based on TOA data could generate some concentration values with more significant uncertainty, as some reflectances altered by atmospheric effects would be included. Gas molecules and aerosols in the atmosphere can absorb and disperse light reflecting from the surface, which influences the signal received by the sensor [41].
Finally, if the expanded Chl-a range (with maximum concentration values of 74.1 and 74.4 μg L−1) in the spring-summer period is disregarded, with TOA data, it is only possible to determine concentrations to a maximum of 17 μg L−1 in the Licahue littoral zone, which is not consistent with the field measurements. Under this same condition, using the BOA data for the Licahue littoral zone, it is not possible to obtain concentrations, as this entire area is outside the Chl-a range.

4. Discussion

The MLR equations allowed the reflectances of the different Sentinel-2 sensor bands to be related to Chl-a concentration values. In both the calibration and validation phases, these fit equations were classified as very good according to the criteria of [44]. Despite a difference of two days delay between the sampling and the satellite data capture, for two of the data inputs used to develop the MLR, there was no significant effect on the MLR or the fit indicators.
Sentinel-2 bands 3 (green), 4 (red), and 5 (Vegetation Red Edge) had the greatest importance (weight) among the equations found in the study; therefore, they are vital to quantifying Chl-a concentrations in lakes with characteristics similar to the Lanalhue, such as coastal lakes in the Nahuenbutanean region. Using Landsat-8, Matus-Hernández et al. (2018) [46] concluded that band 3 (green) and additionally band 5 (NIR) work reliably for coastal lakes.
In statistical terms, the most accurate models were those for the spring-summer period with BOA data, in line with the assumption that the Sentinel-2 L2A corrected data would deliver much better results than raw TOA data (L1C), as the latter includes atmospheric influence. However, using both levels of product correction, it was possible to verify that the TOA data signal sometimes delivers better results than the BOA data (e.g., the MLR for the fall-winter period).
The consistency of the spring-summer TOA and BOA images (Figure 8) was tested by a geostatistical analysis in ArcGIS software using the Spatial Analyst module in the Toolbox of ArcGIS; as a result, a very similar spatial pattern was found for both images (see Supplementary Material S4).
In the concentration maps generated from MLR, it was observed that those based on TOA data allowed complete monitoring of the lake more than those based on BOA data. TOA data present a greater quantity of reflectance values within the range considered valid (i.e., for which the MLR were developed); nonetheless, this does not prove that they are better, as they may not be actual results due to the influence of atmospheric effects. The most probable reason (for which the results with BOA data presented zones in which it was not possible to estimate Chl-a) is the L1C data processing procedure, i.e., they could reflect errors derived from the correction method used to suppress the atmospheric effects. In other studies, such as Toming et al., 2016 [36] and Aranha et al., 2022 [55], they conclude that only a simplified atmospheric correction procedure is possible that normalizes the upper Part of the Atmosphere (TOA) signal for Rayleigh effects. In this way, more complex atmospheric corrections (e.g., for aerosols) must be avoided; in some occasions, these corrections generate errors, particularly in water bodies with high turbidity and high biomass content. The correction process can induce errors and uncertainties in the data. It was likely to have occurred in this study when TOA and BOA data were compared for determining Chl-a concentrations. Additional advantages of using TOA data are reduced processing time and simplifying the implementation of monitoring systems. Based on the above, the initiative was taken to use Sentinel-2 level 1C and 2A radiance images to extract the Chl-a concentrations. Regarding the processing time, GEE is a powerful tool to work with this satellite data, and the cloud platforms play a very important role in water quality; knowing that water quality parameters in lakes can change in short periods, the integration of GIS with GEE cloud provides a fast platform to detect changes that occur in the environment [57]. Atmospheric correction of images with a coastal and inland water influence is challenging [36]; there have been advances in atmospheric correction, such as ACOLITE and C2RCC [41]. However, Sen2cor is widely used as it is an open-source SNAP plugin [42,58].
Empirical approaches such as those used in this study present limitations, as their applicability is restricted to the specific sites at which they were developed. The input ranges and characteristics of the reflectance values of the bands limit the use of the entire spectrum of values recorded by the sensor, and, strictly speaking, the concentration ranges obtained using these equations are also limited to the ranges of the field sampling measurements [59].
Reflectance may also be affected by the shoreline interface and in the near coastal area, which depends on the measurement period (in winter, with higher maximum waters, a surface of shallow water is generated with a potential spectral contribution from the bottom). In addition, in the case of Lanalhue Lake, some wetlands are partially covered by vegetation and temporarily covered by water. A buffer zone along the shoreline was created to avoid possible errors generated by these conditions. It is essential to consider these effects, as they can cause errors in determining concentrations and subsequently misinterpret the results. Such an effect can be observed in the Licahue and La Vaina shorelines.
While the high measured Chl-a concentrations (74.1 and 72.4 μg L−1) are isolated values within the range of concentrations that were measured with the greatest frequency during the monitoring campaigns, their use allowed equations that expanded the upper limit for estimating concentrations using TOA and BOA images during the spring-summer period to be obtained. This is important in managing the lake’s water quality because the use of these two high concentrations made it possible to determine that a large part of the Licahue littoral zone was hypereutrophic.
There are more ways to be explored in remote sensing applications for water quality, such as the use of other sensors, such as Landsat-8 (30 m). However, the data capture frequency of the Landsat series satellites is 16 days, which means a great disadvantage because many lacustrine processes (such as the proliferation of algae) can occur in less than 16 days and remain undetected by this type of sensor or the detection may be late. Other satellites have a more frequent data capture, such as Sentinel-3 of the OLCI sensor, which has 21 bands, with 10 in the range of 665 to 865 nm, which may be important for detecting Chl-a. However, coarse image resolutions (300 m) may not be suitable for small inland lakes.
Thanks to technology, it is possible to monitor lakes rapidly. Lake extents and eutrophication (using Chl-a as a proxy) can be determined using satellite products, in-situ empirical equations, or physically-based methodologies. A worthy example of climate change effects in Chile is the Aculeo lake, located in southern Santiago, where the lake extent was reducing to disappear. Aculeo lake was located in a place promoting tourism and economic activities; therefore, its disappearance affected people broadly. New monitoring activities (with higher spatial and temporal resolutions) could help to deal with ad-hoc strategies to avoid climate change effects on lakes [60,61].

5. Conclusions

The traditional sampling method involving sample-taking and subsequent analysis has intrinsic limitations (i.e., low capture of spatial and temporal variability, the delay between the sample date and the analysis results, and the cost associated with the procedure itself). In this study, new empirical algorithms are proposed to determine Chl-a concentrations, specifically for the Lanalhue Lake, but which could potentially be replicable at a regional level in other Nahuelbutan lakes. It was also verified that the Sentinel-2 sensor products (TOA and BOA) perform well in lake monitoring and may be very useful thanks to their temporal frequency and resolution, which allows detailed captures, even for small lakes (water surfaces >0.5 ha). The latter is contingent on the dataset with which the equations are calculated being sufficiently broad in terms of concentration ranges.
Empirical equations were deduced using multiple linear regressions, covering the following information: from September 2018 to January 2022 (4 years); Chl-a ranges between 1.9 and 74.1 ugl-1; and product type data Sentinel-2 (BOA and TOA). The new proposed equations performed better than others in the literature and showed performance indices equal to R2 > 0.87; and RMSE and MAE < 6 mg L−1 (when compared with field data). Additionally, for the season spring-summer, TOA performs better than the BOA in terms of empty values and other performance indicators (Pearson coefficient: 0.83; empty computed pixels for TOA (NaN): 25%; empty computed pixels for BOA (NaN): 55%). The latter could be counterintuitive because the BOA is a corrected version of TOA. Our results validate that both products could be considered to retrieve Chl-a concentrations in lakes. Further research must be conducted to determine which conditions one product underperforms the other.
Our results may provide some guidance to the bodies responsible for the safeguarding/conservation/care of the lakes in the area to identify areas prone to eutrophication and coastal areas that may influence the lake through water channels/basins. Some questions that remain open are related to testing the ability of these products in the determination of other water quality parameters (e.g., suspended solids) in Nahuelbutan lakes; however, a greater challenge will undoubtedly be proposing physically-based equations to determine water quality parameters independent of the study site, with rapid, simple calibration. Finally, the option of enriching these results with other sensors—for example, which has a data capture time of 2 days and the VIIRS satellite—has a data capture frequency of 1 day could improve the detection of high concentrations of Chl-a due to events that occur quickly and activate alerts.

Supplementary Materials

The following supporting information can be downloaded at: https://www.mdpi.com/article/10.3390/rs14225647/s1.

Author Contributions

Conceptualization: F.B.-M., H.A. and J.F.-B.; methodology: F.B.-M., H.A., J.F.-B. and A.P.; software: F.B.-M., H.A. and J.F.-B.; fieldwork: R.U.; laboratory analysis: R.U.; investigation: H.A., J.F.-B., R.U. and A.P.; data curation: F.B.-M., H.A. and R.U.; writing—original draft preparation: F.B.-M., H.A., J.F.-B., R.U. and A.P; writing—review and editing: F.B.-M., H.A., J.F.-B., A.P. and R.U.; visualization: H.A. and A.P.; supervision: H.A., J.F.-B. and R.U. All authors have read and agreed to the published version of the manuscript.

Funding

This research was supported by project ANID/FONDAP/15130015.

Conflicts of Interest

The authors declare no conflict of interest.

References

  1. Huang, C.; Chen, Y.; Zhang, S.; Wu, J. Detecting, Extracting, and Monitoring Surface Water From Space Using Optical Sensors: A Review. Rev. Geophys. 2018, 56, 333–360. [Google Scholar] [CrossRef]
  2. Huovinen, P.; Ramírez, J.; Caputo, L.; Gómez, I. Mapping of spatial and temporal variation of water characteristics through satellite remote sensing in Lake Panguipulli, Chile. Sci. Total Environ. 2019, 679, 196–208. [Google Scholar] [CrossRef] [PubMed]
  3. Ha, N.T.T.; Thao, N.T.P.; Koike, K.; Nhuan, M.T. Selecting the Best Band Ratio to Estimate Chlorophyll-a Concentration in a Tropical Freshwater Lake Using Sentinel 2A Images From a Case Study of Lake Ba Be (Northern Vietnam). ISPRS Int. J. Geo-Inf. 2017, 6, 290. [Google Scholar] [CrossRef] [Green Version]
  4. Chen, J.; Zhu, W.; Tian, Y.Q.; Yu, Q.; Zheng, Y.; Huang, L. Remote estimation of colored dissolved organic matter and chlorophyll-a in Lake Huron using Sentinel-2 measurements. J. Appl. Remote Sens. 2017, 11, 1. [Google Scholar] [CrossRef]
  5. Buma, W.G.; Lee, S.I. Evaluation of Sentinel-2 and Landsat 8 Images for Estimating Chlorophyll-a Concentrations in Lake Chad, Africa. Remote Sens. 2020, 12, 2437. [Google Scholar] [CrossRef]
  6. Yang, X.E.; Wu, X.; Hao, H.L.; He, Z.L. Mechanisms and assessment of water eutrophication. J. Zhejiang Univ. Sci. B 2008, 9, 197–209. [Google Scholar] [CrossRef] [Green Version]
  7. Delegido, J.; Tenjo, C.; Ruiz-Verdú, A.; Peña, R.; Moreno, J. Modelo empírico para la determinación de clorofila-a en aguas continentales a partir de los futuros Sentinel-2 y 3. Validación con imágenes HICO. Rev. Teledetec. 2014, 41, 37–47. [Google Scholar] [CrossRef] [Green Version]
  8. Soomets, T.; Uudeberg, K.; Jakovels, D.; Brauns, A.; Zagars, M.; Kutser, T. Validation and Comparison of Water Quality Products in Baltic Lakes Using Sentinel-2 MSI and Sentinel-3 OLCI Data. Sensors 2020, 20, 742. [Google Scholar] [CrossRef] [Green Version]
  9. Almanza, V.; Pedreros, P.; Laughinghouse IV, H.D.; Félez, J.; Parra, O.; Azócar, M.; Urrutia, R. Association between trophic state, watershed use, and blooms of cyanobacteria in south-central Chile. Limnologica 2019, 75, 30–41. [Google Scholar] [CrossRef]
  10. Bresciani, M.; Cazzaniga, I.; Austoni, M.; Sforzi, T.; Buzzi, F.; Morabito, G.; Giardino, C. Mapping phytoplankton blooms in deep subalpine lakes from Sentinel-2A and Landsat-8. Hydrobiologia 2018, 824, 197–214. [Google Scholar] [CrossRef]
  11. Dörnhöfer, K.; Oppelt, N. Remote sensing for lake research and monitoring—Recent advances. Ecol. Indic. 2016, 64, 105–122. [Google Scholar] [CrossRef]
  12. Potes, M.; Rodrigues, G.; Penha, A.M.; Novais, M.H.; Costa, M.J.; Salgado, R.; Morais, M.M. Use of Sentinel 2—MSI for water quality monitoring at Alqueva reservoir, Portugal. Proc. IAHS 2018, 380, 73–79. [Google Scholar] [CrossRef]
  13. Sent, G.; Biguino, B.; Favareto, L.; Cruz, J.; Sá, C.; Dogliotti, A.I.; Palma, C.; Brotas, V.; Brito, A.C. Deriving Water Quality Parameters Using Sentinel-2 Imagery: A Case Study in the Sado Estuary, Portugal. Remote Sens. 2021, 13, 1043. [Google Scholar] [CrossRef]
  14. Ouma, Y.O.; Noor, K.; Herbert, K. Modelling Reservoir Chlorophyll-a, TSS, and Turbidity Using Sentinel-2A MSI and Landsat-8 OLI Satellite Sensors with Empirical Multivariate Regression. J. Sens. 2020, 2020, 8858408. [Google Scholar] [CrossRef]
  15. Ogashawara, I.; Kiel, C.; Jechow, A.; Kohnert, K.; Ruhtz, T.; Grossart, H.P.; Hölker, F.; Nejstgaard, J.C.; Berger, S.A.; Wollrab, S. The Use of Sentinel-2 for Chlorophyll-A Spatial Dynamics Assessment: A Comparative Study on Different Lakes in Northern Germany. Remote Sens. 2021, 13, 1542. [Google Scholar] [CrossRef]
  16. Ansper, A.; Alikas, K. Retrieval of Chlorophyll a from Sentinel-2 MSI Data for the European Union Water Framework Directive Reporting Purposes. Remote Sens. 2019, 11, 64. [Google Scholar] [CrossRef] [Green Version]
  17. Lama, G.F.C.; Errico, A.; Francalanci, S.; Solari, L.; Chirico, G.B.; Preti, F. Hydraulic Modeling of Field Experiments in a Drainage Channel Under Different Riparian Vegetation Scenarios. In Innovative Biosystems Engineering for Sustainable Agriculture, Forestry and Food Production; Coppola, A., Di Renzo, G., Altieri, G., D’Antonio, P., Eds.; Springer: Cham, Switzerland, 2020; Volume 67, pp. 69–77. [Google Scholar] [CrossRef]
  18. Busico, G.; Kazakis, N.; Cuoco, E.; Colombani, N.; Tedesco, D.; Voudouris, K.; Mastrocicco, M. A novel hybrid method of specific vulnerability to anthropogenic pollution using multivariate statistical and regression analyses. Water Res. 2020, 171, 115386. [Google Scholar] [CrossRef]
  19. Kansoh, R.; Abd-El-Mooty, M.; Abd-El-Baky, R. Computing the Water Budget Components for Lakes by Using Meteorological Data. Civ. Eng. J. 2020, 6, 1255–1265. [Google Scholar] [CrossRef]
  20. Wang, L.; Xu, M.; Liu, Y.; Liu, H.; Beck, R.; Reif, M.; Emery, E.; Young, J.; Wu, Q. Mapping Freshwater Chlorophyll-a Concentrations at a Regional Scale Integrating Multi-Sensor Satellite Observations with Google Earth Engine. Remote Sens. 2020, 12, 3278. [Google Scholar] [CrossRef]
  21. Caballero, I.; Navarro, G. Monitoring cyanoHABs and water quality in Laguna Lake (Philippines) with Sentinel-2 satellites during the 2020 Pacific typhoon season. Sci. Total Environ. 2021, 788, 147700. [Google Scholar] [CrossRef]
  22. Hu, Y.; Xu, X.; Wu, F.; Sun, Z.; Xia, H.; Meng, Q.; Huang, W.; Zhou, H.; Gao, J.; Li, W.; et al. Estimating Forest Stock Volume in Hunan Province, China, by Integrating In Situ Plot Data, Sentinel-2 Images, and Linear and Machine Learning Regression Models. Remote Sens. 2020, 12, 186. [Google Scholar] [CrossRef] [Green Version]
  23. Cardall, A.; Tanner, K.; Williams, G. Google Earth Engine Tools for Long-Term Spatiotemporal Monitoring of Chlorophyll-a Concentrations. Open Water J. 2021, 7, 4. [Google Scholar]
  24. Kumar, L.; Mutanga, O. Google Earth Engine Applications Since Inception: Usage, Trends, and Potential. Remote Sens. 2018, 10, 1509. [Google Scholar] [CrossRef] [Green Version]
  25. Tamiminia, H.; Salehi, B.; Mahdianpari, M.; Quackenbush, L.; Adeli, S.; Brisco, B. Google Earth Engine for geo-big data applications: A meta-analysis and systematic review. ISPRS J. Photogramm. Remote Sens. 2020, 164, 152–170. [Google Scholar] [CrossRef]
  26. Amani, M.; Ghorbanian, A.; Ahmadi, S.A.; Kakooei, M.; Moghimi, A.; Mirmazloumi, S.M.; Moghaddam, S.H.A.; Mahdavi, S.; Ghahremanloo, M.; Parsian, S.; et al. Google Earth Engine Cloud Computing Platform for Remote Sensing Big Data Applications: A Comprehensive Review. IEEE J. Sel. Top. Appl. Earth Obs. Remote Sens. 2020, 13, 5326–5350. [Google Scholar] [CrossRef]
  27. Topp, S.N.; Pavelsky, T.M.; Jensen, D.; Simard, M.; Ross, M.R.V. Research Trends in the Use of Remote Sensing for Inland Water Quality Science: Moving Towards Multidisciplinary Applications. Water 2020, 12, 169. [Google Scholar] [CrossRef] [Green Version]
  28. Bramich, J.; Bolch, C.J.S.; Fischer, A. Improved red-edge chlorophyll-a detection for Sentinel 2. Ecol. Indic. 2021, 120, 106876. [Google Scholar] [CrossRef]
  29. Li, S.; Song, K.; Wang, S.; Liu, G.; Wen, Z.; Shang, Y.; Lyu, L.; Chen, F.; Xu, S.; Tao, H.; et al. Quantification of chlorophyll-a in typical lakes across China using Sentinel-2 MSI imagery with machine learning algorithm. Sci. Total Environ. 2021, 778, 146271. [Google Scholar] [CrossRef]
  30. Drusch, M.; Del Bello, U.; Carlier, S.; Colin, O.; Fernandez, V.; Gascon, F.; Hoersch, B.; Isola, C.; Laberinti, P.; Martimort, P.; et al. Sentinel-2: ESA’s Optical High-Resolution Mission for GMES Operational Services. Remote Sens. Environ. 2012, 120, 25–36. [Google Scholar] [CrossRef]
  31. Molkov, A.A.; Fedorov, S.V.; Pelevin, V.V.; Korchemkina, E.N. Regional Models for High-Resolution Retrieval of Chlorophyll a and TSM Concentrations in the Gorky Reservoir by Sentinel-2 Imagery. Remote Sens. 2019, 11, 1215. [Google Scholar] [CrossRef]
  32. Free, G.; Bresciani, M.; Trodd, W.; Tierney, D.; 0´Boyle, S.; Plant, C.; Deakin, J. Estimation of lake ecological quality from Sentinel-2 remote sensing imagery. Hydrobiologia 2020, 847, 1423–1438. [Google Scholar] [CrossRef]
  33. Pirasteh, S.; Mollaee, S.; Fatholahi, S.N.; Li, J. Estimation of Phytoplankton Chlorophyll-a Concentrations in the Western Basin of Lake Erie Using Sentinel-2 and Sentinel-3 Data. Can. J. Remote Sens. 2020, 46, 585–602. [Google Scholar] [CrossRef]
  34. Kuhn, C.; Valerio, A.M.; Ward, N.; Loken, L.; Sawakuchi, H.O.; Kampel, M.; Richey, J.; Stadler, P.; Crawford, J.; Striegl, R.; et al. Performance of Landsat-8 and Sentinel-2 surface reflectance products for river remote sensing retrievals of chlorophyll-a and turbidity. Remote Sens. Environ. 2019, 224, 104–118. [Google Scholar] [CrossRef] [Green Version]
  35. Peppa, M.; Vasilakos, C.; Kavroudakis, D. Eutrophication Monitoring for Lake Pamvotis, Greece, Using Sentinel-2 Data. ISPRS Int. J. Geo-Inf. 2020, 9, 143. [Google Scholar] [CrossRef] [Green Version]
  36. Toming, K.; Kutser, T.; Laas, A.; Sepp, M.; Paavel, B.; Nõges, T. First Experiences in Mapping Lake Water Quality Parameters with Sentinel-2 MSI Imagery. Remote Sens. 2016, 8, 640. [Google Scholar] [CrossRef] [Green Version]
  37. Grendaitė, D.; Stonevičius, E.; Karosienė, J.; Savadova, K.; Kasperovičienė, J. Chlorophyll-a concentration retrieval in eutrophic lakes in Lithuania from Sentinel-2 data. Geol. Geogr. 2018, T4, 15–28. [Google Scholar] [CrossRef]
  38. Parra, O.; Valdovinos, C.; Urrutia, R.; Cisternas, M.; Habit, E.; Mardones, M. Caracterización y tendencias tróficas de cinco lagos costeros de Chile Central. Limnetica 2003, 22, 51–83. [Google Scholar] [CrossRef]
  39. Ivanda, A.; Šerić, L.; Bugarić, M.; Braović, M. Mapping Chlorophyll-a Concentrations in the Kaštela Bay and Brač Channel Using Ridge Regression and Sentinel-2 Satellite Images. Electronics 2021, 10, 3004. [Google Scholar] [CrossRef]
  40. The European Space Agency. SENTINEL-2 User Handbook. Available online: https://sentinel.esa.int/web/sentinel/user-guides/sentinel-2-msi/document-library (accessed on 20 April 2021).
  41. Tavares, M.H.; Lins, R.C.; Harmel, T.; Fragoso, C.R., Jr.; Martínez, J.M.; Motta-Marques, D. Atmospheric and sunglint correction for retrieving chlorophyll-a in a productive tropical estuarine-lagoon system using Sentinel-2 MSI imagery. ISPRS J. Photogramm. Remote Sens. 2021, 174, 215–236. [Google Scholar] [CrossRef]
  42. Marujo, R.F.B.; Fronza, J.G.; Soares, A.R.; Queiroz, G.R.; Ferreira, K.R. Evaluating the Impact of LASRC and Sen2Cor Atmospheric Correction Algorithms of Landast-8/OLI and Sentinel-2/MSI Data Over AERONET Stations in Brazilan Territory. ISPRS Ann. Photogramm. Remote Sens. Spat. Inf. Sci. 2021, 3, 271–277. [Google Scholar] [CrossRef]
  43. Li, Y.; Chen, J.; Ma, Q.; Zhang, H.K.; Liu, J. Evaluation of Sentinel-2A Surface Reflectance Derived Using Sen2Cor in North America. IEEE J. Sel. Top. Appl. Earth Obs. Remote Sens. 2018, 11, 1997–2021. [Google Scholar] [CrossRef]
  44. Moriasi, D.N.; Gitau, M.W.; Pai, N.; Daggupati, P. Hydrologic and Water Quality Models: Performance Measures and Evaluation Criteria. Trans. ASABE 2015, 58, 1763–1785. [Google Scholar] [CrossRef] [Green Version]
  45. Moriasi, D.N.; Arnold, J.G.; Van Liew, M.W.; Bingner, R.L.; Harmel, R.D.; Veith, T.L. Model Evaluation Guidelines for Systematic Quantification of Accuracy in Watershed Simulations. Trans. ASABE 2007, 3, 885–900. [Google Scholar] [CrossRef]
  46. Matus-Hernández, M.Á.; Hernández-Saavedra, N.Y.; Martínez-Rincón, R.O. Predictive performance of regression models to estimate Chlorophyll-a concentration based on Landsat imagery. PLoS ONE 2018, 13, e0205682. [Google Scholar] [CrossRef] [PubMed] [Green Version]
  47. Knoben, W.J.M.; Freer, J.E.; Woods, R.A. Technical note: Inherent benchmark or not? Comparing Nash-Sutcliffe and Kling-Gupta efficiency scores. Hydrol. Earth Syst. Sci. 2019, 23, 4323–4331. [Google Scholar] [CrossRef] [Green Version]
  48. Briceño, I.; Pérez, W.; San, M.D.; Ramos, S. Determination of water quality vichuquén lake, using satellite images landsat 8, sensor OLI, year 2016, Chile. Rev. Teledetec. 2018, 52, 67–78. [Google Scholar] [CrossRef] [Green Version]
  49. Karaoui, I.; Arioua, A.; Bouldhar, A.; Hssaisoune, M.; Mouatassime, S.E.; Ouhamchich, K.A.; Elhamdouni, D. Evaluating the potential of Sentinel-2 satellite images for water quality characterization of artificial reservoirs: The Bin El Ouidane Reservoir case study (Morocco). Meteorol. Hydrol. Water Manag. 2019, 7, 31–39. [Google Scholar]
  50. Pizani, F.M.C.; Maillard, P.; Ferreira, A.F.F.; De Amorim, C.C. Estimation of Water Quality in a Reservoir from Sentinel-2 MSI and Landsat-8 OLI Sensors. ISPRS Ann. Photogramm. Remote Sens. Spat. Inf. Sci. 2020, 3, 401–408. [Google Scholar] [CrossRef]
  51. Delegido, J.; Tenjo, C.; Ruiz-Verdu, A.; Pereira-Sandoval, M.; Pasqualotto, N.; Gibaja, G.; Verrelst, J.; Peña, R.; Urrego, P.E.; Borràs, J.; et al. Aplicaciones de Sentinel-2 a estudios de vegetación y calidad de aguas continentales. In Geotecnologías, Herramientas para la Construcción de una Nueva Visión del Cambio Global y su Transformación para un Futuro Sostenible: Libro de Actas del XVII Simposio Internacional en Percepción Remota y Sistemas de Información Geográfica, 1st ed.; Sione, W.F., Viva Mayer, F.M., Antes, M.E., Serafini, M.C., Eds.; SELPER: Luján, Argentina, 2017; pp. 1111–1126. Available online: https://www.researchgate.net/publication/311572231 (accessed on 5 September 2022).
  52. O´Reilly, J.E.; Maritorena, S.; Siegel, D.A.; O’Brien, M.C.; Toole, D.; Mitchell, B.G.; Kahru, M.; Chavez, F.P.; Strutton, P.; Cota, G.F.; et al. Ocean Color Chlorophyll a Algorithms for SeaWiFS, OC2 and OC4: Version 4. In SeaWiFS Postlaunch Technical Report Series; NASA Goddard Space Flight Center: Greenbelt, MD, USA, 2000; Volume 11. Available online: https://www.researchgate.net/publication/284044296 (accessed on 5 September 2022).
  53. Hunter, P.H.; Tyler, A.N.; Willby, N.J.; Gilvear, D.J. The spatial dynamics of vertical migration by Microcystis aeruginosa in a eutrophic shallow lake: A case study using high spatial resolution time-series airborne remote sensing. Limnol. Ocean. 2008, 53, 2391–2406. [Google Scholar] [CrossRef]
  54. Kutser, T.; Paavel, B.; Verpoorter, C.; Ligi, M.; Soomets, T.; Toming, K.; Casal, G. Remote Sensing of Black Lakes and Using 810 nm Reflectance Peak for Retrieving Water Quality Parameters of Optically Complex Waters. Remote Sens. 2016, 8, 497. [Google Scholar] [CrossRef]
  55. Aranha, T.R.B.T.; Martinez, J.N.; Souza, E.P.; Barros, M.U.G.; Martins, E.S.P.R. Remote Analysis of the Chlorophyll-a Concentration Using Sentinel-2 MSI Images in a Semiarid Environment in Northeastern Brazil. Water 2022, 14, 451. [Google Scholar] [CrossRef]
  56. Shi, J.; Shen, Q.; Yao, Y.; Li, J.; Chen, F.; Wang, R.; Xu, W.; Gao, Z.; Wang, L.; Zhou, Y. Estimation of Chlorophyll-a Concentrations in Small Water Bodies: Comparison of Fused Gaofen-6 and Sentinel-2 Sensors. Remote Sens. 2022, 14, 229. [Google Scholar] [CrossRef]
  57. Habeeb, N.J.; Weli, S.T. Combination of GIS with Different Technologies for Water Quality: An Overview. HighTech Innov. J. 2021, 2, 262–272. [Google Scholar] [CrossRef]
  58. Katlane, R.; Du-pouy, C.; El Kilani, B.; Berges, J.C. Estimation of Chlorophyll and Turbidity Using Sentinel 2A and EO1 Data in Kneiss Archipelago Gulf of Gabes, Tunisia. Int. J. Geosci. 2020, 11, 708–728. [Google Scholar] [CrossRef]
  59. Watanabe, F.; Alcântara, E.; Rodrigues, T.; Rotta, L.; Bernardo, N.; Imai, N. Remote sensing of the chlorophyll-a based on OLI/Landsat-8 and MSI/Sentinel-2A (Barra Bonita reservoir, Brazil). An. Acad. Bras. Cienc. 2020, 90, 1987–2000. [Google Scholar] [CrossRef] [PubMed] [Green Version]
  60. Barría, P.; Chadwick, C.; Ocampo-Melgar, A.; Galleguillos, M.; Garreaud, R.; Díaz-Vasconcellos, R.; Poblete-Caballero, D. Water management or megadrought: What caused the Chilean Aculeo Lake drying? Reg. Environ. Chang. 2021, 21, 19. [Google Scholar] [CrossRef]
  61. Ocampo-Melgar, A.; Barria, P.; Chadwick, C.; Villoch, P. Restoration perceptions and collaboration challenges under severe water scarcity: The Aculeo Lake process. Restor. Ecol. 2021, 29, e13337. [Google Scholar] [CrossRef]
Figure 1. Location of the Lanalhue Lake and current land use. Forest monoculture represents 43%, the native forest is close to 22%, water bodies and farmlands are approximately 19% (in total), and the rest of the land use (shrubland, mixed forest, wetlands, and urban areas) corresponds to 16%.
Remotesensing 14 05647 g001
Figure 2. Sampling stations, bathymetry, and the six-unit segmentation of Lanalhue Lake.
Remotesensing 14 05647 g002
Figure 3. Schematic diagram of the methodology applied in this study.
Remotesensing 14 05647 g003
Figure 4. Computed vs. observed Chl-a concentrations for the spring-summer period, with the maximum recorded concentrations included: (a) Chl-a calculated using TOA data (L1C) and (b) Chl-a calculated using BOA data (L2A). Dashed lines correspond to the perfect agreement between computed and observed Chl-a concentrations.
Remotesensing 14 05647 g004
Figure 5. Computed vs. observed Chl-a concentrations for the spring-summer period, with the maximum recorded concentrations excluded: (a) Chl-a calculated using TOA data (L1C) and (b) Chl-a calculated using BOA data (L2A). Dashed lines correspond to the perfect agreement between computed and observed Chl-a concentrations.
Remotesensing 14 05647 g005
Figure 6. Computed vs. observed Chl-a concentrations for the fall-winter period: (a) Chl-a calculated using TOA data (L1C) and (b) Chl-a calculated using BOA data (L2A). Dashed lines correspond to the perfect agreement between computed and observed Chl-a concentrations.
Remotesensing 14 05647 g006
Figure 7. Chl-a concentration maps based on MLR for the fall-winter period: (a) made with TOA data (L1C) and (b) made with BOA data (L2A). On the right side of this figure, four Chl-a values of the samplings referred to as L6, L9, L3, and L1 are shown.
Remotesensing 14 05647 g007
Figure 8. Chl-a concentration maps based on MLR for the spring-summer period, with maximum concentrations, included: (a) made with TOA data (L1C) and (b) made with BOA data (L2A).
Remotesensing 14 05647 g008
Figure 9. Chl-a concentration maps based on MLR for the spring-summer period, with maximum concentrations excluded: (a) made with TOA data (L1C) and (b) made with BOA data (L2A).
Remotesensing 14 05647 g009
Table 1. Sampling dates and statistical summary of in situ Chl-a in the Lanalhue Lake. The concentrations are in units of μg L−1.
Dates
Spring–Summer
Sampling
Points
MinimumMaximumMeanStandard
Deviation
8–11 January 2019113.716.49.94.8
12–17 March 2020115.174.120.426.3
24 November 202163.47.95.21.8
18 January 202261.98.44.52.8
Dates
Fall–Winter
Sampling
Points
MinimumMaximumMeanStandard
Deviation
4–8 September 2018113.815.27.93.3
30 July 2019–2 August 2019113.88.15.91.3
30 June 202167.4139.32.0
Table 2. Dates of the Sentinel-2 images used in this study, chlorophyll-a ranges in μg L−1 and the number of matching points.
Sentinel-2 Imagery Dates
Spring–Summer
Matching
Points
Minimum Chl-aMaximum Chl-a
9 January201957.516.4
14 March 2020115.174.1
22 November 202123.86.0
18 January 202261.98.4
Sentinel-2 Imagery Dates
Fall–Winter
Matching
Points
Minimum Chl-aMaximum Chl-a
4 September 201843.88.7
2 August 2019113.88.1
30 June 202127.49.4
Table 3. Empirical algorithm results without calibration (only testing). BOA images without considering seasonality.
Ref.AlgorithmEquationR2R2adjRMSEMAEPBIASNSE
[51] ND = B 5 B 4 B 5 + B 4 Chl - a = 6.9588 e 8.4965 ND 0.850.847.724.76−26.700.72
[51] DO = B 6 ( 1 B 5 1 B 4 ) Chl - a = 11.051 + 134.395 DO 0.24−0.1827.4716.1237.41−1.77
[52]OC2V4
R = log ( B 2 B 3 )
Chl - a = 10 ( 0.139 2.336 R + 0.879 R 2 0.135 R 3 ) 0.07 0.540.5213.726.8861.980.14
[53] R = B 5 B 4 Chl - a = 1.33 + 2.44 log R 0.02−0.117.069.15−88.77−0.34
[54] P = max { B 5 , B 6 }
( B 4 + B 7 2 )
Chl - a = 0.0071 P 0.11 0.620.5816.377.32−67.50−0.24
Table 4. List of multiple linear regressions used to calculate Chl-a (μg L−1) in this study.
Data TypePeriodChl-a Concentration (μg L−1)Multiple Linear Regressions of Chl-a and Sentinel-2 Bands
TOASpring–
Summer
1.9–74.1
1.9–16.4
Chl-a = −32.3888 + 0.1949 × B2 + −0.1527 × B3 + −0.9148 × B4 + 0.8488 × B5 + 0.1287 × B7 + 0.2505 × B8A + 0.1674 × B11 + −0.3580 × B12
Chl-a = −45.8781 + 0.1447 × B2 + −0.1262 × B3 + 0.2150 × B5 + −0.3866 × B6 + 0.2505 × B8A + 0.1203 × B11 + −0.2633 × B12
BOASpring–
Summer
1.9–74.1
1.9–16.4
Chl-a = 8.0035 + 0.0909 × B2 + −0.0999 × B3 + −0.4048 × B4 + 0.6738 × B5 + 0.1491 × B6 + −0.4849 × B7 + 0.2896 × B8A + −0.1577 × B11
Chl-a = 7.3146 + −0.0575 × B02 + 0.1329 × B05 + −0.0925 × B06 + −0.2548 × B07 + 0.3379 × B8A + 0.0479 × B11
TOAFall–
Winter
3.8–8.7Chl-a = −83.3051 + −0.0595 × B2 + 0.4792 × B3 + −0.4375 × B4 + 0.1006 × B5 + −0.1045 × B7
BOAFall–
Winter
3.8–9.4Chl-a = 8.5290 + −0.0460 × B3 − 0.0440 × B4 + 0.1412 × B5 + −0.0288 × B6 + 0.0429 × B7 + −0.2077 × B11 + 0.1669 × B12
Table 5. Summary of the performance indicators of the MLR for calibration and validation in spring-summer and fall-winter periods by product type and Chl-a concentration range (μg L−1).
CalibrationValidation
Data TypePeriodChl-a ValueR2R2adjRMSEMAEPBIASNSERMSEMAE
TOASpring–
Summer
1.9–74.1
1.9–16.4
0.91
0.87
0.86
0.77
5.97
1.27
4.91
1.11
0.5
−4.4
0.91
0.94
3.31
2.58
2.74
1.94
BOASpring–
Summer
1.9–74.1
1.9–16.4
0.98
0.99
0.97
0.98
2.58
0.51
2.00
0.39
0
0
0.98
0.99
4.98
3.79
3.67
3.45
TOAFall–
Winter
3.8–8.70.960.920.320.260.210.962.522.25
BOAFall–
Winter
3.8–9.40.940.830.430.3800.942.681.91
Publisher’s Note: MDPI stays neutral with regard to jurisdictional claims in published maps and institutional affiliations.