Abstract
Semantic segmentation for 3D point clouds plays a critical role in the construction of 3D models. Due to the sparse and disordered natures of the point clouds, semantic segmentation of such unstructured data yields technical challenges. A recently proposed deep neural network, PointNet, delivers attractive semantic segmentation performance, but it only exploits the global features of point clouds without incorporating any local features, limiting its ability to recognize fine-grained patterns. For that, this paper proposes a deeper hierarchical structure called the high precision range search (HPRS) network, which can learn local features with increasing contextual scales. We develop an adaptive ball query algorithm that designs a comprehensive set of grouping strategies. It can gather detailed local feature points in comparison to the common ball query algorithm, especially when there are not enough feature points within the ball range. Furthermore, compared to the sole use of either the max pooling or the mean pooling, our network combining the two can aggregate point features of the local regions from hierarchy structure while resolving the disorder of points and minimizing the information loss of features. The network achieves superior performance on the S3DIS dataset, with a mIoU declined by 0.26% compared to the state-of-the-art DPFA network.
1. Introduction
With the rapid development of acquisition technologies such as lidar sensors and depth cameras, point cloud data have become a widespread application, stimulating researchers’ interest in 3D scene understanding [1,2]. 3D shape recognition mainly includes object classification, part segmentation and semantic segmentation [3,4]. As a challenge task, semantic segmentation for 3D point clouds aims to classify the point into its semantic class by extracting effective feature vectors of 3D point clouds [5,6]. It is a core problem in computer vision with wide-ranging applications, such as autonomous driving, augmented reality, and the construction industry [7,8]. Furthermore, semantic segmentation is of great significance for the construction of 3D models [9,10,11].
Semantic segmentation for 3D point clouds can be classified into three broad classes: multiview-based network, voxel-based network, and point-based network [12,13,14]. The multiview-based network projects 3D point clouds onto 2D perspective views, and then extracts feature information from the views using a 2D Convolutional Neural Network (CNN). Su et al. [15] proposed a multi-view CNN architecture that extracted feature information using a unified CNN architecture with a view-pooling layer. Compared to pairwise single-view representations of 3D shapes, the descriptors obtained by this method can be directly used to compare 3D shapes, thus significantly improving the computational efficiency. Badrinarayanan et al. [16] introduced the SnapNet network, which predicted the inter-class boundaries of the object in various scenarios. The network was efficient in terms of memory and computation time because it only stores max-pooling information for feature images. Kalogerakis et al. [17] proposed a complex multi-view framework combining image-based full convolutional networks with surface-based conditional random fields for 3D shapes segmentation. The architecture can process large-scale image datasets using the image processing layer. Kundu et al. [18] proposed a 3D semantic segmentation technique based on virtual multi-view fusion. The idea of the algorithm was to use a composite image rendered from a virtual view of the 3D scene rather than the raw photographic image acquired by the camera, thus solving the core problem encountered with the view-centric approach.
The voxel-based network divides point clouds into voxelized grids with spatial dependencies and then utilizes CNN to capture feature information for semantic segmentation of point clouds. Tchapmi et al. [19] proposed the SEGCloud framework, which combined the 3D CNN, trilinear interpolation, and fully connected conditional random fields to obtain fine-grained semantic segmentation. The network solved the sparsity of the voxel grid using sparse convolutions, which can additionally improve the performance of 3D semantic segmentation. Rigler et al. [20] presented the OctNet network that used a set of unbalanced octrees to divide the space hierarchically to achieve 3D object classification and semantic segmentation. To reduce the memory occupation of convolution network operating on sparse data, this network implemented an adaptive spatial partition to concentrate the computation on relevant regions. Graham et al. [21] proposed a sparse convolution operation to handle high-dimensional and sparse data. The network can effectively perform semantic segmentation while significantly reducing the prediction model’s computational requirements. Meng et al. [22] presented a novel voxel variational autoencoder network that converted unstructured point clouds into regular voxel grids for point cloud segmentation. The network can not only efficiently extract features without increasing parameters to produce robust segmentation results, but also perform good segmentation on noisy point cloud datasets.
The point-based network applies deep learning models directly to point clouds for feature extraction without converting the point cloud data to other forms. Qi et al. [23] proposed the PointNet network, a pioneering work that was directly applied to extract feature information from point clouds. The basic idea of PointNet was to acquire the feature information of each point by multi-layer perceptron (MLP), and then aggregate all point features into a global point feature using max pooling. The method was robust to perturbation and corruption of the input data. Given the weakness of PointNet without local feature information, Qi et al. [24] proposed a hierarchical neural network named PointNet++ that applied PointNet recursively to nested partitions of the input data. The network was able to learn local and global feature information and outperformed the PointNet network in point cloud segmentation. Li et al. [25] designed the PointCNN network, which used the X-Conv operator to perform weighting and permutation operations on the input points to achieve classification and segmentation tasks. However, the versatility of X transformation has certain limitations due to the higher time complexity of the network when dealing with huge amounts of data. Jiang et al. [26] proposed an effective end-to-end PointSIFT architecture that can encode different orientations information for semantic segmentation of point clouds. Each layer of the entire framework used the PointSIFT integrated into various PointNet-based architectures to significantly improve the representational capabilities of the network. Wang et al. [27] proposed a neural network dubbed EdgeConv, whose graph structure is dynamically updated after each layer of the network instead of being fixed, unlike graph CNNs. The network can extract local geometric structure information of points while maintaining permutation invariance to achieve classification and segmentation tasks of point clouds.
The multiview-based and voxel-based methods still have some shortcomings in 3D shape recognition. The multiview-based method that projects 3D data onto 2D images cannot capture the spatial geometric features of point clouds because it only contains local information. The voxel-based network requires more memory space because the raw data is converted into a regular volume grid, making it difficult to meet the requirements of more applications, especially the processing of big data. Compared with multiview-based and voxel-based networks, the point-based network has a sizable advantage over the feature extraction from point clouds. Inspired by the PointNet network that can directly deal with irregular point clouds without acquiring local information, limiting its capacity to recognize fine-grained patterns. This paper proposes a deeper hierarchical HPRS network that captures point features in a high-precision range for semantic segmentation. Our network develops an adaptive ball query algorithm that designs a comprehensive set of grouping strategies. It can gather critical local feature points in comparison to the common ball query algorithm, especially when there are not enough feature points in the ball range. Furthermore, our network utilizes a combination of the max pooling and the mean pooling to minimize the information loss of features. Our network can obtain the local feature information that the PointNet network doesn’t collect by using acquiring from the local region consisting of the downsampling point as the center point and its neighbor points. Our network outperforms PointNet++ network in that it learns deeper structural information by expanding its network depth in addition to acquiring more detailed local feature points through the adaptive ball query algorithm, which is especially critical when there aren’t enough feature points within the ball range. In addition, our network enhances the segmentation effect by combining the max pooling and the mean pooling in the improved PointNet layer to aggregate point features of the local regions, in contrast to the PointNet++ network that only employs the max pooling to extract features.
2. Methods
This section introduces the HPRS network in detail. We first divide the data into overlapping small regions, and then utilize the HPRS network to process each small region’s data. The network consists of the set abstraction layer, the feature propagation layer, and the fully connected layer. The set abstraction layer downsamples the data from the small region and perform high-dimensional feature extraction of the local region, consisting of the downsampling point as the center point and its neighbor points. The feature propagation layer restores the original data by upsampling the data from the set abstraction layer and aggregates the features of each point. Finally, the features of each point are processed through the fully connected layer to achieve the semantic segmentation of the entire point set. Figure 1 presents the HPRS framework.

Figure 1.
The HPRS framework based on hierarchical structures for point cloud segmentation.
Each set abstraction layer consists of three parts: (1) the sampling layer: The farthest point sampling algorithm is used to downsample the data from the small region data. The sampling principle is to select a sampling point that is farthest from all selected points to ensure that the entire sample space is covered. (2) The grouping layer: An adaptive ball query algorithm is used to gather important feature points with different radii to divide the local neighborhood of sampling points into groups. (3) The improved PointNet layer: The improved PointNet network is applied to extract features from groups composed of local point sets.
2.1. Set Abstraction Layer
The encoding part of the network has six set abstraction layers to attain a deeper hierarchical structure. Each set abstraction layer consists of the sampling layer, the grouping layer, and the improved PointNet layer. The local region is generated by a combination of the sampling layer and the grouping layer.
2.1.1. Sampling Layer
This paper adopts the farthest point sampling algorithm to downsample the data from the small region data while minimizing the impact on the segmentation effect. The farthest point sampling algorithm [28,29] is an iterative sampling method with better coverage and uniformity over the entire point set. The main idea of the algorithm is to calculate the distance between the rest point and the selected point set, and then select the point with the largest distance from the selected point set to join the selected point set and repeat this process until the number of selected points is met. The process of the algorithm is as follows (Figure 2):

Figure 2.
Extracting sampling points by the farthest point sampling algorithm.
- (1)
- Assuming the input point clouds contain N points, select point P0 from the point cloud as the initial point to obtain the sampling point set as S = {P0}.
- (2)
- Calculate and store in the array L the distance from the rest points containing (N − 1) points to P0. The sample point set is then updated to S = {P0, P1} by selecting the point corresponding to the maximum value in array L as P1.
- (3)
- Calculate the distance from the rest point containing (N − 2) points to P1. If the distance from the rest point Pi to P1 is less than L[i], update L[i] = d(Pi, P1). Then select the point corresponding to the maximum value in L as P2, update S = {P0, P1, P2}.
- (4)
- Repeat steps 2–3 until the required number of sampling points has been reached.
2.1.2. Grouping Layer
The obtained sampling point is used as the center point, and its neighborhood points are grouped according to the spatial geometric information. Since the set abstraction layer is a continuous downsampling process, it will encounter the situation that there are not enough feature points near the center point. The common ball query algorithm repeatedly extracts the point closest to the center point when there aren’t enough feature points within the ball range, resulting in the inability to obtain detailed feature points. We develop an adaptive ball query algorithm that designs a comprehensive set of grouping strategies. It can gather detailed local feature points in comparison to the common ball query algorithm, especially when there are not enough feature points within the ball range.
The adaptive ball query algorithm includes two parameters: the radius of the ball and the number of neighborhood points (Figure 3) [30]. Three cases are involved with the values of these two parameters. Assuming that there are M points within the radius of the center point, K is the required number within the radius of the center point. In the first case, the K points closest to the center point are sampled if M is more than K. In the second case, the points within the radius are sampled H times where H is the multiple of K divided by M if K is more than M and can be divisible by M. In the third case, the points within the radius are first sampled H times where H is the multiple of K divided by M. The S points closest to the center point are then sampled where S is the remainder of K divided by M if K is more than M and cannot be divisible by M. The following is the calculation formula for the third case:
where M is the number of points within the radius of the center point, K is the required number within the radius of the center point. H and S are the multiple and remainder of K divided by M, respectively.
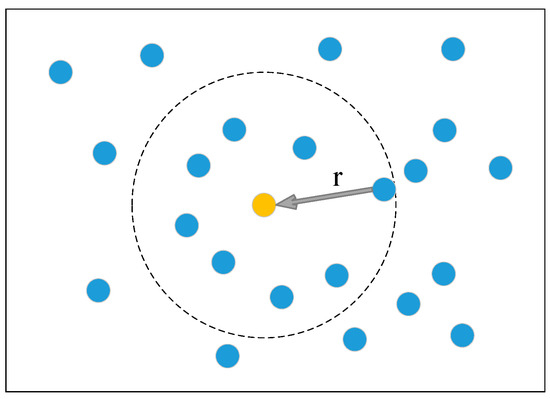
Figure 3.
Dividing the local neighborhood of sampling points into groups by the adaptive ball query algorithm.
2.1.3. Improved PointNet Layer
Due to the uneven distribution of the S3DIS dataset acquired by the Matterport Camera, we aggregate the features extracted by the improved PointNet layer from the grouping data composed of sample points at different radii to capture the finest details. The improved PointNet layer combines the shared multi-layer perceptron network and the pooling layer. The shared multi-layer perceptron network upscales the data to higher dimensions to extract high-dimensional features of points while avoiding the information loss of features. The pooling layer can not only aggregate point features of the local regions from hierarchy structure, but also solve the disorder of point clouds. Pooling methods mainly include the max pooling and the mean pooling. Max pooling can retain more texture information while reducing the deviation of the estimated mean caused by the parameter error of the convolutional layer [31,32]. Mean pooling can preserve more background information while reducing the increase in the estimated variance value caused due to the limited size of the neighborhood [33,34]. Some feature points may be lost if neighborhood features are integrated only using the mean pooling or the maximum pooling. In this paper, we use a combination of 0.8x max pooling and 0.2x mean pooling to aggregate point features of the local regions from hierarchy structure after learning point cloud features with the multi-layer perceptron. The features from a group composed of local point sets are obtained by the following formula:
where S represents the group composed of local points, g is the max pooling function. γ represents the mean pooling function. h represents the multi-layer perceptron network.
2.2. Feature Propagation Layer
The decoding part of the network with six feature propagation layers restores the original data by upsampling the data of the set abstraction layer and aggregates the feature information of each point. The feature propagation is based on the idea of PointNet++ network [24]. The idea of feature propagation is to propagate point features from current layer points to upper layer points, where these two layers are adjacent layers of the set abstraction layer. Its operation process is to first upsample the data of the set abstraction layer using the inverse distance weighted average based on k (k = 3) nearest neighbors (as in Equations (4) and (5)) [35,36]. These interpolated features are then concatenated with point features from the upper layer of the set abstraction layer. Finally, the improved PointNet layer is applied to process the concatenated features to aggregate the features of each point.
where f(x) is the interpolating feature values of current layer points at coordinates of the upper layer points, C is the dimension of the feature points of the current layer.
3. Validation
3.1. Benchmark Methods
To demonstrate the effectiveness of our method, we conduct comparative experiments with other methods on the dataset. In this paper, the semantic segmentation results of the HPRS network are compared to those of the PointNet, PointNet++, G+RCU, RSNet, 3P-RNN, and DPFA networks under 6-fold cross-validation on the S3DIS dataset, as well as those of the PointNet, SEGCloud, DGCNN, RSNet, TangenConv, and PointCNN networks under the Area 5 as the test set. The TangenConv [37] network is a multi-view-based network that performs efficient semantic segmentation of point clouds through tangent convolution, which is based on projecting local surface geometry onto tangent planes. SEGCloud [19] belongs to the voxel-based network. PointNet [23], PointNet++ [24], G+RCU [10], RSNet [38], 3P-RNN [39], DPFA [40], DGCNN [27], and PointCNN [25] networks belong to the point-based networks, with the G+RCU network investigating two mechanisms for integrating into the PointNet network, namely input-level contexts and output-level con-texts, with the aim of incorporating contexts into a point cloud processing architecture for semantic segmentation. The RSNet network acquires efficient local context information through a combination of the slice pooling layer, recurrent neural network layers, and the slice unpooling layer. The slice pooling layer projects the features of unordered points onto an ordered sequence. The 3P-RNN network consists of the pointwise pyramid pooling module and the two-direction hierarchical recurrent neural network. The network exploits the inherent contextual features to achieve efficient 3D semantic segmentation. The DPFA network implements semantic segmentation of point clouds through a dynamic pool and attention mechanism to selectively perform neighborhood feature aggregation. The network can aggregate features from different neighbors to provide more selective and broader views for query points.
Furthermore, this paper uses the K-means algorithm [41,42] in conjunction with the farthest point sampling algorithm within the same HPRS network to compare the segmentation effects of different sampling methods. The K-means algorithm is a clustering similarity algorithm, which uses the mean value of the objects in each cluster to obtain a central point for calculation. The principle of the K-means algorithm is to first randomly select k points as the centroid of cluster. The rest points are assigned to the closest cluster based on the distance of the point to the centroid of each cluster, and the centroids of each cluster are recalculated. The above process is repeated until the position of the centroid no longer changes or the set number of iterations is met. The operation flow of the K-means clustering algorithm is shown in Figure 4.
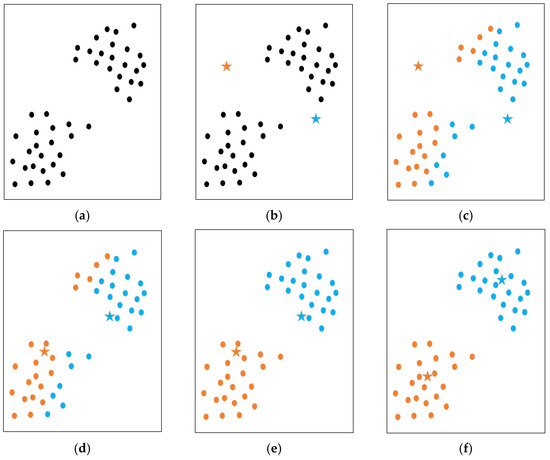
Figure 4.
The K-means algorithm: (a) raw point cloud; (b) the star symbol represents the centers of random initial clusters and points marked with the same color are represented as being divided into the same cluster; (c–f) the iterative running process of the K-means algorithm. In each iteration, the point is assigned to the center of the nearest cluster.
3.2. Evaluation Metrics
Overall Accuracy (OA), mean class Accuracy (mAcc) and mean Intersection over Union (mIoU) are effective means for evaluating the semantic segmentation of point clouds. OA represents the proportion of points predicted to be correctly classified out of the total number of point clouds. mAcc represents the mean of the accuracy of all classes, where per-class accuracy is the ratio of the number of correctly predicted points to the total number of points in per-class. IoU serves as the standard for evaluating the precision of each class’s measurement, and it represents the point set predicted to be the ith class and the point set that originally belonged to the ith class, with the intersection of these two sets accounting for the proportion of their union. mIoU is the mean of IoU. These measurements are calculated using the equations as follows [43,44]:
where Pii represents the class i is correctly classified as the class i, Pij denotes the class i is wrongly classified as the class j. Pji denotes class j is wrongly classified as the class i.
4. Experiment
4.1. Dataset
In order to verify the semantic segmentation effect of the proposed HPRS network, this paper takes the S3DIS dataset scanned using Matterport camera, combining three structured light sensors with different spacings as the experimental research object [45]. The dataset contains 271 rooms in 6 areas and mainly covers 13 classes, namely ceiling, floor, wall, beam, column, window, door, table, chair, sofa, bookcase, board, and clutter (Figure 5). The point cloud data of each room in the dataset is divided into a cube size of 1 m × 1 m × 1 m with a step size of 0.5 m, in which 4096 sample points are randomly collected for each cube.
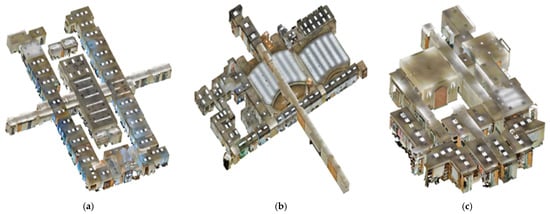
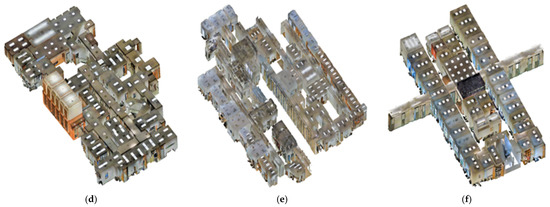
Figure 5.
The S3DIS dataset: (a) Area 1; (b) Area 2; (c) Area 3; (d) Area 4; (e) Area 5; (f) Area 6.
4.2. Experiment Settings
The coding part of the HPRS network is composed of six set abstraction layers. The parameters information of each set abstraction layer is shown in Table 1. The input feature point has nine-dimensional features, including RGB color data, normalized coordinates, and three-dimensional coordinates. For the SA1 layer, the layer’s 1024 points are sampled from the original point cloud’s 4096 points using the farthest point sampling algorithm. Taking the sampling point as the center, the adaptive ball query algorithm is then used to sample 8 points within a radius of 0.05 m and 16 points within a radius of 0.10 m, respectively. Finally, the improved PointNet network is applied to extract features from groups composed of local point sets and aggregate the features of different radius regions, where the convolution kernels corresponding to the different groups with radii of 0.05 m and 0.1 m are (16,16,32) and (16,16,32), respectively. The input data for the next layer of the set abstraction layer is taken from the output data of the current layer, that is, the 1024 points obtained in the SA1 layer are used as the input data of the SA2 layer to generate deeper features.

Table 1.
The parameter information of the set abstraction layer where the SA1 to SA6 represent the first to sixth layers of the set abstraction layer, respectively.
The decoding part of the HPRS network consists of six feature propagation layers. The parameters information of each feature propagation layer is shown in Table 2. For the FP6 layer, k nearest neighbors of the 32 feature points from the SA6 layer are sought in the SA5 layer, and their corresponding interpolation features are generated using the inverse distance weighted average based on k nearest neighbors. The interpolated SA6 layer’s features are then concatenated with the SA5 layer’s point features. Finally, the improved PointNet network is applied to process the concatenated features to obtain the features of the FP6 layer. The input data for the upper layer of the feature propagation layer is taken from the output data of the current layer, that is, the 64 points obtained in the PF6 layer are used as the input data of the FP5 layer. Upsampling the data of the feature propagation layer until the original data is restored. Finally, the features from the FP1 layer are processed through the fully connected layer to obtain the semantic segmentation result of each point.

Table 2.
The parameter information of the feature propagation layer where the FP1 to FP6 represent the first to sixth layers of the feature propagation layer, respectively.
All experiments are conducted on the same machine with an Intel (R) Core (TM) i7-7700k @4.20GHz CPU and an NVIDIA GeForce RTX 3060 GPU.
4.3. Results and Discussion
In this paper, we adopted 6-fold cross-validation on the S3DIS dataset to test the segmentation effect of the HPRS network. The results show that the HPRS network can effectively perform semantic segmentation for the S3DIS dataset, with OA, mAcc and mIoU of 84.70%, 72.71%, and 61.35%, respectively. The OA, mAcc, and mIoU of the HPRS network reached the highest of 90.24%, 88.01%, and 76.45%, respectively in Area 6, while the lowest were 77.67%, 59.25%, and 43.76%, respectively. The segmentation result of HPRS network in Area 6 was significantly better than those in Area 2, indicating that the semantic class distribution is uneven, resulting in different segmentation results for six areas (Table 3 and Table 4). In addition, the eight classes of ceiling, floor, wall, window, door, table, chair, and board had a mIoU of more than 60% in the six areas, which may be because these eight classes occupy a large proportion of the dataset, so the network learns stronger features to improve segmentation effect. The IoU of beam, column, and sofa was less than 50%, which may be because these classes occupy a small proportion of the dataset. On the other hand, it may be because these classes share similar characteristics (e.g., column and wall), resulting in lower segmentation accuracy (Table 4).

Table 3.
Segmentation results for the S3DIS datasets by the HPRS network (%).

Table 4.
Quantitative results of different approaches for the S3DIS dataset under 6-fold cross-validation (%).
In addition, HPRS network’s segmentation results were compared to that of the PointNet, PointNet++, G+RCU, RSNet, 3P-RNN, and DPFA networks under 6-fold cross-validation on the S3DIS dataset (Table 4). The results show the ability of learning point cloud features for the HPRS network outperformed PointNet, PointNet++, G+RCU, and RSNet networks (Table 4). The HPRS network’s OA and mAcc declined by 2.2% and 0.89%, respectively, as compared to the 3P-RNN network, while its mIoU improved by 5.05%. Compared with the state-of-art DPFA network, the HPRS network’s OA declined 4.31%, while its mIoU only declined by 0.26%. The segmentation results of each class of the HPRS network were superior to those of the PointNet network, with the exception of the beam’s IoU, of which OA, mAcc and mIoU were gained of 6.20%, 6.51% and 13.75%, respectively, indicating that the HRPS network’s detailed local feature acquisition considerably enhances the segmentation result. Despite the fact that PointNet++ network, when compared to PointNet, enhances the segmentation effect by obtaining local feature information, HPRS network can optimize the segmentation effect more effectively through deeper structural information and the adaptive ball query algorithm. In comparison to the PointNet++ network, the OA and mIoU of the HPRS network improved by 3.80% and 8.15%, respectively. In addition, HPRS network can enhance the segmentation result by combining the max pooling and the mean pooling to aggregate point features of the local regions, in contrast to the PointNet++ network that only employs the max pooling to extract features. The IoU of the bookcase of the HPRS network reached 56.10%, while it was 39.0% and 16.42% for G+RCU and RSNet networks. The IoU of the board of the HPRS network reached 60.13%, compared with 30.0%, 44.85% and 36.7% of the G+RCU, RSNet, and 3P-RNN networks, indicating that the proposed HPRS network enhances the segmentation effect of semantic classes. This further shows that the segmentation performance can be significantly improved with our deeper hierarchical HPRS network.
To compare the segmentation effect of the HPRS network and the PointNet, SEGCloud, DGCNN, RSNet, TangenConv, and PointCNN networks on a single test set, we chose Area 5 with the largest amount of data as the test set, and other areas as the train set (Table 5). We displayed the segmentation results of each area using the HPRS network under the Area 5 as the test set (Figure 6). The OA, mAcc and mIoU of the proposed HPRS network were 84.12%, 64.76% and 56.66%, respectively, with the IoU of the ceiling, floor, and chair exceeding 80.00%. The results show that the HPRS network’s capacity for learning point cloud features outperformed the PointNet, SEGCloud, DGCNN, RSNet, and TangenConv networks. Compared to the state-of-the-art PointCNN network, the HPRS network’s mAcc improved by 0.9%, and its OA and mIoU declined by 1.79% and 0.6%, respectively. The segmentation accuracy of each class, with the exception of the beam, was enhanced by the HPRS network in comparison to the segmentation results of the PointNet network, with gains in mAcc and mIoU of 15.78% and 15.57%, respectively. The mAcc and mIoU of the HPRS network improved by 4.96% and 5.16%, and 5.34% and 4.73%, when compared to the DGCNN and RSNet networks, respectively. In comparison to the SEGCloud network, a classic voxel-based network, the mAcc and mIoU of the HPRS network improved by 7.41% and 7.74%, respectively, indicating that the HPRS network is exceptional at semantic segmentation of the Area 5.

Table 5.
Quantitative results of different approaches for the Area 5 (%).
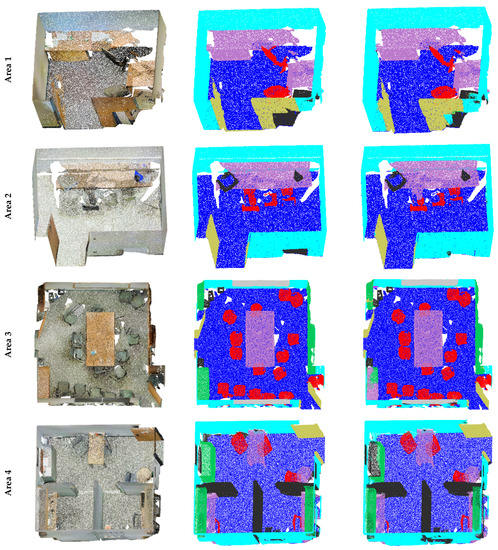
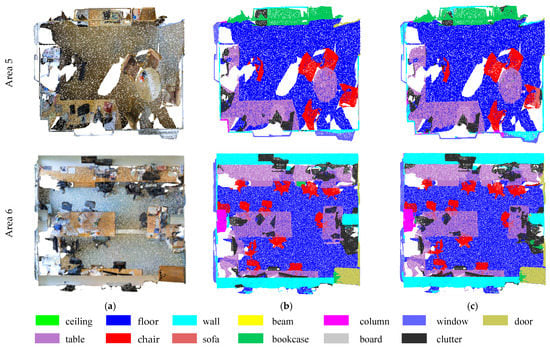
Figure 6.
Segmentation results of the Area 5: (a) the original point cloud data; (b) ground truth; (c) the segmentation results using the HPRS network.
Selecting the appropriate sampling points plays an important role in the sampling layer, which may affect the feature extraction in the improved PointNet layer and the final segmentation result. To compare the segmentation effects of different sampling methods, we adopted the K-means algorithm to contrast with the farthest point sampling algorithm within the same HPRS network under the Area 5 as the test set. Since the K-means algorithm takes longer to compute the cluster centers as the number of clusters increases, and the farthest point sampling with a certain number of sampling points can gather the important feature points required by the K-means algorithm. Therefore, the farthest point sampling algorithm was used in the SA1 layer and SA2 layer, while the other layers of SA adopted the K-means algorithm to extract sampling points. To exhibit the comparison intuitively, we visualized the semantic segmentation results of PointNet, HPRS (K-means) that used the K-means algorithm to extract sampling points, and HPRS networks in Figure 7. It is clear that the segmentation effect of the HPRS and HPRS (K-means) networks outperformed that of PointNet network (Figure 7). Compared with HPRS networks, HPRS (K-means) network can identify objects that had a high degree of similarity and were indistinguishable, such as the chair and clutter, because the K-means algorithm can group similar features together. (Figure 7 (col 1)). The three networks had low recognition of the door (Figure 7 (col 2)), probably because the door only occupies a small proportion of the Area 5. In comparison to the HPRS (K-means) network, the HPRS network not only improved its OA and mIoU by 1.02% and 0.21%, respectively, but also had a lower time complexity, with each epoch being about 1:59:04 (h/min/s) during training, while the HPRS (K-means) network approaching 4:15:17 (h/min/s). The results show that the farthest point sampling algorithm can effectively and efficiently extract sampling points than the K-means algorithm.
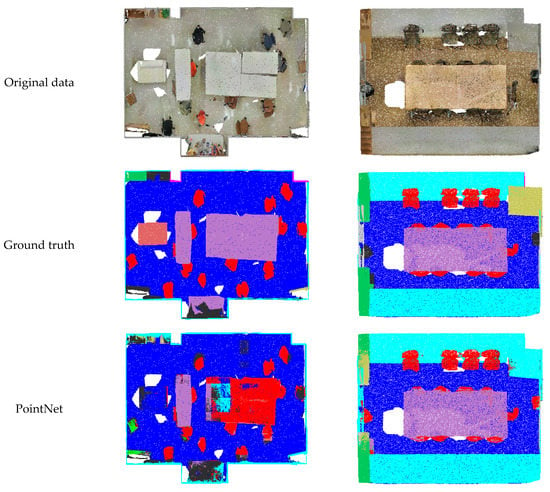
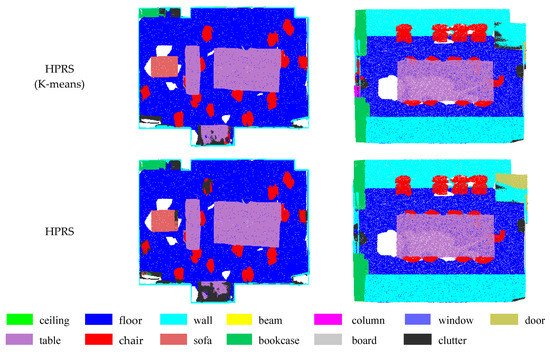
Figure 7.
Visualization of segmentation results of the baseline network PointNet, HPRS (K-means) and HPRS on the Area 5.
Since the set abstraction layer is a continuous downsampling process, it will encounter the situation that there are not enough feature points near the center point. Different grouping algorithms may cause different semantic segmentation effects when there are not enough feature points within the ball range. Therefore, we compared the segmentation effects of different grouping algorithms within the same HPRS network under the Area 5 as the test set. In comparison to the HPRS (the common ball query algorithm) network that used the common ball query algorithm to divide the local neighborhood of sampling points into groups, the OA, mAcc and mIoU of the HPRS (the adaptive ball query algorithm) network that used the adaptive ball query algorithm to divide the local neighborhood of sampling points into groups improved by 0.95%, 1.03% and 1.87%, respectively (Table 6). The IoU of the board of the HPRS (the adaptive ball query algorithm) network reached 65.5%, while it was 56.7% for HPRS (the common ball query algorithm) network. The results show that the HRPS network can obtain superior the segmentation effect by the adaptive ball query algorithm to divide the local neighborhood of sampling points into groups in comparison to the common ball query algorithm, especially when there are not enough feature points within the ball range.

Table 6.
Quantitative results of different grouping algorithms within the same HPRS network for the Area 5 (%).
In addition, the pooling layer plays an important role in aggregating the point features of local regions from hierarchy structure. In this paper, we compared the segmentation results of the mean pooling, the max pooling, and the combination of the max pooling and the mean pooling within the same HPRS network under the Area 5 as the test set. The OA, mAcc and mIoU of the HPRS (max pooling and mean pooling) network that used a combination of 0.8x max pooling and 0.2x mean pooling to aggregate point features of the local regions improved by 1.63%, 5.38%, and 5.56%, 1.17%, 3.15%, and 3.36%, respectively, when compared to the HPRS (mean pooling) network that used the mean pooling to aggregate point features of the local regions and HPRS (max pooling) network that used the max pooling to aggregate point features of the local regions (Table 7). The IoU of the door of the HPRS (max pooling and mean pooling) network reached 24.5%, while that of HPRS (mean pooling) and HPRS (max pooling) network is 14.7% and 7.7% respectively. The results show that, in comparison to using either the max pooling or the mean pooling alone, the HRPS network can improve the segmentation effect by combining the two techniques in the improved PointNet layer to aggregate point features of the local regions.

Table 7.
Quantitative results of different pooling methods within the same HPRS network for the Area 5 (%).
5. Conclusions
This paper proposes a deeper hierarchical HPRS network that captures point features in a high-precision range to achieve semantic segmentation for 3D point clouds. The results show that the HPRS network can effectively perform semantic segmentation for the S3DIS dataset under 6-fold cross validation, with the OA, mAcc, and mIoU of 84.70%, 72.71%, and 61.35%, respectively. The HPRS network outperformed the PointNet, PointNet++, G+RCU, and RSNet networks under 6-fold cross-validation. Furthermore, the HPRS network’s capacity for learning point cloud features was superior to those of PointNet, SEGCloud, DGCNN, RSNet, and TangenConv networks under the Area 5 as the test set. In comparison to the HPRS (K-means) network, the HPRS network not only improved its OA and mIoU by 1.02% and 0.21%, respectively, but also had a lower time complexity. The results show that the farthest point sampling algorithm can effectively and efficiently extract sampling points than the K-means algorithm. Furthermore, the HRPS network can obtain superior the segmentation effect by the adaptive ball query algorithm to divide the local neighborhood of sampling points into groups in comparison to the common ball query algorithm. Future tests of this network will be conducted on complex outdoor scenarios or other complex datasets.
Author Contributions
Z.S., G.Z. and K.-K.M. designed and performed the experiments. Z.S., K.-K.M., G.Z., F.L. and S.L. contributed to the manuscript writing. All authors have read and agreed to the published version of the manuscript.
Funding
This research was funded by the National Natural Science Foundation of China (42271427 and 62071340).
Data Availability Statement
The S3DIS dataset were obtained based on the Stanford Large-Scale 3D Indoor Spaces Dataset by Matterport Camera (http://buildingparser.stanford.edu/, accessed on 13 November 2020).
Acknowledgments
The authors want to thank H. You and X. Lu for proofreading this article. The authors would also like to thank the anonymous referees for constructive criticism and comments.
Conflicts of Interest
The authors declare no conflict of interest.
References
- Hackel, T.; Wegner, J.D.; Schindler, K. Fast semantic segmentation of 3D point clouds with strongly varying density. ISPRS Ann. Photogramm. Remote Sens. Spat. Inf. Sci. 2016, 3, 177–184. [Google Scholar] [CrossRef]
- Xu, Y.; Tong, X.; Stilla, U. Voxel-based representation of 3D point clouds: Methods, applications, and its potential use in the construction industry. Automat. Constr. 2021, 126, 103675. [Google Scholar] [CrossRef]
- Guo, Y.; Wang, H.; Hu, Q.; Liu, H. Deep learning for 3d point clouds: A survey. IEEE Trans. Pattern Anal. Mach. Intell. 2020, 43, 4338–4364. [Google Scholar] [CrossRef]
- Yan, X.; Zheng, C.; Li, Z.; Wang, S.; Cui, S. Pointasnl: Robust point clouds processing using nonlocal neural networks with adaptive sampling. In Proceedings of the IEEE/CVF Conference on Computer Vision and Pattern Recognition (CVPR), Seattle, WA, USA, 13–19 June 2020; pp. 5589–5598. [Google Scholar]
- Chen, X.T.; Li, Y.; Fan, J.H.; Wang, R. RGAM: A novel network architecture for 3D point cloud semantic segmentation in indoor scenes. Inform. Sci. 2021, 571, 87–103. [Google Scholar] [CrossRef]
- Wang, L.; Huang, Y.; Hou, Y.; Zhang, S.; Shan, J. Graph attention convolution for point cloud semantic segmentation. In Proceedings of the IEEE/CVF Conference on Computer Vision and Pattern Recognition (CVPR), Long Beach, CA, USA, 15–20 June 2019; pp. 10296–10305. [Google Scholar]
- Qin, N.; Hu, X.; Dai, H. Deep fusion of multi-view and multimodal representation of ALS point cloud for 3D terrain scene recognition. ISPRS J. Photogramm. Remote Sens. 2018, 143, 205–212. [Google Scholar] [CrossRef]
- Song, S.; Xiao, J. Deep sliding shapes for amodal 3d object detection in rgb-d images. In Proceedings of the IEEE Conference on Computer Vision and Pattern Recognition (CVPR), Las Vegas, NV, USA, 27–30 June 2016; pp. 808–816. [Google Scholar]
- Yin, C.; Wang, B.; Gan, V.J.L.; Wang, M.; Cheng, J.C.P. Automated semantic segmentation of industrial point clouds using ResPointNet++. Automat. Constr. 2021, 130, 103874. [Google Scholar] [CrossRef]
- Engelmann, F.; Kontogianni, T.; Hermans, A.; Leibe, B. Exploring spatial context for 3D semantic segmentation of point clouds. In Proceedings of the IEEE International Conference on Computer Vision Workshops (ICCVW), Venice, Italy, 22–29 October 2017; pp. 716–724. [Google Scholar]
- Qi, X.; Liao, R.; Jia, J.; Fidler, S.; Urtasun, R. 3d graph neural networks for rgbd semantic segmentation. In Proceedings of the IEEE International Conference on Computer Vision (ICCV), Venice, Italy, 22–29 October 2017; pp. 5199–5208. [Google Scholar]
- Guerry, J.; Boulch, A.; Saux, B.L.; Moras, J.; Plyer, A.; Filliat, D. SnapNet-R: Consistent 3D Multi-view Semantic Labeling for Robotics. In Proceedings of the IEEE International Conference on Computer Vision (ICCV), Venice, Italy, 22–29 October 2017; pp. 669–678. [Google Scholar]
- Hu, Z.; Bai, X.; Shang, J.; Zhang, R.; Dong, J.; Wang, X.; Sun, G. Vmnet: Voxel-mesh network for geodesic-aware 3d semantic segmentation. In Proceedings of the IEEE/CVF International Conference on Computer Vision (ICCV), Montreal, QC, Canada, 10–17 October 2021; pp. 15488–15498. [Google Scholar]
- Hu, Q.; Yang, B.; Xie, L.; Rosa, S.; Guo, Y.; Wang, Z.; Trigoni, N.; Markham, A. Randla-net: Efficient semantic segmentation of large-scale point clouds. In Proceedings of the IEEE/CVF Conference on Computer Vision and Pattern Recognition (CVPR), Seattle, WA, USA, 13–19 June 2020; pp. 11108–11117. [Google Scholar]
- Su, H.; Maji, S.; Kalogerakis, E.; Learned-Miller, E. Multi-view Convolutional Neural Networks for 3D Shape Recognition. In Proceedings of the IEEE International Conference on Computer Vision (ICCV), Santiago, Chile, 7–13 December 2015; pp. 945–953. [Google Scholar]
- Badrinarayanan, V.; Kendall, A.; Cipolla, R. Segnet: A deep convolutional encoder-decoder architecture for image segmentation. IEEE Trans. Pattern Anal. Mach. Intell. 2017, 39, 2481–2495. [Google Scholar] [CrossRef] [PubMed]
- Kalogerakis, E.; Averkiou, M.; Maji, S.; Chaudhuri, S. 3D Shape Segmentation with Projective Convolutional Networks. In Proceedings of the IEEE Conference on Computer Vision and Pattern Recognition (CVPR), Honolulu, HI, USA, 21–26 July 2017; pp. 3779–3788. [Google Scholar]
- Kundu, A.; Yin, X.; Fathi, A.; Ross, D.; Brewington, B.; Funkhouser, T.; Pantofaru, C. Virtual multi-view fusion for 3d semantic segmentation. In Proceedings of the 16th European Conference on Computer Vision, Glasgow, UK, 23–28 August 2020; pp. 518–535. [Google Scholar]
- Tchapmi, L.P.; Choy, C.B.; Armeni, I.; Gwak, J.Y.; Savarese, S. SEGCloud: Semantic Segmentation of 3D Point Clouds. In Proceedings of the IEEE Conference on Computer Vision and Pattern Recognition (CVPR), Honolulu, HI, USA, 21–26 July 2017; pp. 537–547. [Google Scholar]
- Riegler, G.; Ulusoy, A.O.; Geiger, A. Octnet: Learning deep 3d representations at high resolutions. In Proceedings of the IEEE Conference on Computer Vision and Pattern Recognition (CVPR), Honolulu, HI, USA, 21–26 July 2017; pp. 3577–3586. [Google Scholar]
- Graham, B.; Engelcke, M.; Maaten, L.V.D. 3d semantic segmentation with submanifold sparse convolutional networks. In Proceedings of the IEEE/CVF Conference on Computer Vision and Pattern Recognition, Salt Lake City, UT, USA, 18–22 June 2018; pp. 9224–9232. [Google Scholar]
- Meng, H.Y.; Gao, L.; Lai, Y.K.; Manocha, D. Vv-net: Voxel vae net with group convolutions for point cloud segmentation. In Proceedings of the IEEE/CVF International Conference on Computer Vision (ICCV), Seoul, Korea, 27 October–2 November 2019; pp. 8500–8508. [Google Scholar]
- Qi, C.R.; Su, H.; Mo, K.; Guibas, L.J. PointNet: Deep Learning on Point Sets for 3D Classification and Segmentation. In Proceedings of the IEEE Conference on Computer Vision and Pattern Recognition (CVPR), Honolulu, HI, USA, 21–26 July 2017; pp. 652–660. [Google Scholar]
- Qi, C.R.; Yi, L.; Su, H.; Guibas, L.J. PointNet++: Deep Hierarchical Feature Learning on Point Sets in a Metric Space. In Proceedings of the IEEE Conference on Computer Vision and Pattern Recognition (CVPR), Honolulu, HI, USA, 21–26 July 2017; p. 30. [Google Scholar]
- Li, Y.; Bu, R.; Sun, M.; Wu, W.; Di, X.; Chen, B. PointCNN: Convolution On X-Transformed Points. In Proceedings of the IEEE/CVF Conference on Computer Vision and Pattern Recognition, Salt Lake City, UT, USA, 18–22 June 2018; p. 31. [Google Scholar]
- Jiang, M.; Wu, Y.; Zhao, T.; Zhao, Z. Pointsift: A sift-like network module for 3d point cloud semantic segmentation. In Proceedings of the IEEE/CVF Conference on Computer Vision and Pattern Recognition, Salt Lake City, UT, USA, 18–22 June 2018. [Google Scholar]
- Wang, Y.; Sun, Y.; Liu, Z.; Sarma, S.E.; Bronstein, M.M.; Solomon, J.M. Dynamic Graph CNN for Learning on Point Clouds. ACM Trans. Graph. 2019, 38, 1–12. [Google Scholar] [CrossRef]
- Lang, I.; Manor, A.; Avidan, S. Samplenet: Differentiable point cloud sampling. In Proceedings of the IEEE/CVF Conference on Computer Vision and Pattern Recognition (CVPR), Seattle, WA, USA, 13–19 June 2020; pp. 7578–7588. [Google Scholar]
- Moenning, C.; Dodgson, N.A. A new point cloud simplification algorithm. In Proceedings of the 3rd IASTED International Conference on Visualization, Imaging, and Image Processing (VIIP 2003), Benalmádena, Spain, 8–10 September 2003; pp. 1027–1033. [Google Scholar]
- Fan, H.; Yang, Y. PointRNN: Point recurrent neural network for moving point cloud processing. In Proceedings of the IEEE/CVF Conference on Computer Vision and Pattern Recognition (CVPR), Long Beach, CA, USA, 15–20 June 2019. [Google Scholar]
- Xie, X.; Zhang, W.; Wang, H.; Li, L.; Feng, Z.; Wang, Z.; Wang, Z.; Pan, X. Dynamic adaptive residual network for liver CT image segmentation. Comput. Electr. Eng. 2021, 91, 107024. [Google Scholar] [CrossRef]
- Li, B.; Lima, D. Facial expression recognition via ResNet-50. Int. J. Cogn. Comput. Eng. 2021, 2, 57–64. [Google Scholar] [CrossRef]
- Song, Z.; Liu, Y.; Song, R.; Chen, Z.; Yang, J.; Zhang, C.; Jiang, Q. A sparsity-based stochastic pooling mechanism for deep convolutional neural networks. Neural Netw. 2018, 105, 340–345. [Google Scholar] [CrossRef] [PubMed]
- Li, Y.; Zhang, X.; Chen, D. Csrnet: Dilated convolutional neural networks for understanding the highly congested scenes. In Proceedings of the IEEE/CVF Conference on Computer Vision and Pattern Recognition, Salt Lake City, UT, USA, 18–22 June 2018; pp. 1091–1100. [Google Scholar]
- Mei, G.; Xu, L.; Xu, N. Accelerating adaptive inverse distance weighting interpolation algorithm on a graphics processing unit. R. Soc. Open Sci. 2017, 4, 170436. [Google Scholar] [CrossRef] [PubMed]
- Lu, G.Y.; Wong, D.W. An adaptive inverse-distance weighting spatial interpolation technique. Comput. Geosci. 2008, 34, 1044–1055. [Google Scholar] [CrossRef]
- Tatarchenko, M.; Park, J.; Koltun, V.; Zhou, Q. Tangent convolutions for dense prediction in 3d. In Proceedings of the IEEE/CVF Conference on Computer Vision and Pattern Recognition, Salt Lake City, UT, USA, 18–22 June 2018; pp. 3887–3896. [Google Scholar]
- Huang, Q.; Wang, W.; Neumann, U. Recurrent slice networks for 3d segmentation of point clouds. In Proceedings of the IEEE/CVF Conference on Computer Vision and Pattern Recognition, Salt Lake City, UT, USA, 18–22 June 2018; pp. 2626–2635. [Google Scholar]
- Ye, X.; Li, J.; Huang, H.; Du, L.; Zhang, X. 3d recurrent neural networks with context fusion for point cloud semantic segmentation. In Proceedings of the European Conference on Computer Vision (ECCV), Munich, Germany, 8–14 September 2018; pp. 403–417. [Google Scholar]
- Chen, J.; Kakillioglu, B.; Velipasalar, S. Background-Aware 3-D Point Cloud Segmentation with Dynamic Point Feature Aggregation. IEEE Trans. Geosci. Remote Sens. 2022, 60, 1–12. [Google Scholar] [CrossRef]
- Shi, B.Q.; Liang, J.; Liu, Q. Adaptive simplification of point cloud using k-means clustering. Comput. Aided Des. 2011, 43, 910–922. [Google Scholar] [CrossRef]
- Yedla, M.; Pathakota, S.R.; Srinivasa, T.M. Enhancing K-means clustering algorithm with improved initial center. Int. J. Comput. Sci. Inform. Technol. 2010, 1, 121–125. [Google Scholar]
- Lin, H.; Wu, S.; Chen, Y.; Li, W.; Luo, Z.; Guo, Y.; Wang, C.; Li, J. Semantic segmentation of 3D indoor LiDAR point clouds through feature pyramid architecture search. ISPRS J. Photogramm. Remote Sens. 2021, 177, 279–290. [Google Scholar] [CrossRef]
- Zhang, Y.; Zhou, Z.; David, P.; Yue, X.; Xi, Z.; Gong, B.; Foroosh, H. Polarnet: An improved grid representation for online lidar point clouds semantic segmentation. In Proceedings of the IEEE/CVF Conference on Computer Vision and Pattern Recognition (CVPR), Seattle, WA, USA, 13–19 June 2020; pp. 9601–9610. [Google Scholar]
- Armeni, I.; Sener, O.; Zamir, A.R.; Jiang, H. 3d semantic parsing of large-scale indoor spaces. In Proceedings of the IEEE Conference on Computer Vision and Pattern Recognition (CVPR), Las Vegas, NV, USA, 27–30 June 2016; pp. 1534–1543. [Google Scholar]
Publisher’s Note: MDPI stays neutral with regard to jurisdictional claims in published maps and institutional affiliations. |
© 2022 by the authors. Licensee MDPI, Basel, Switzerland. This article is an open access article distributed under the terms and conditions of the Creative Commons Attribution (CC BY) license (https://creativecommons.org/licenses/by/4.0/).