
Unsustainable Anthropogenic Activities: A Paired Watershed Approach of Lake Urmia (Iran) and Lake Van (Turkey)


Abstract
:1. Introduction
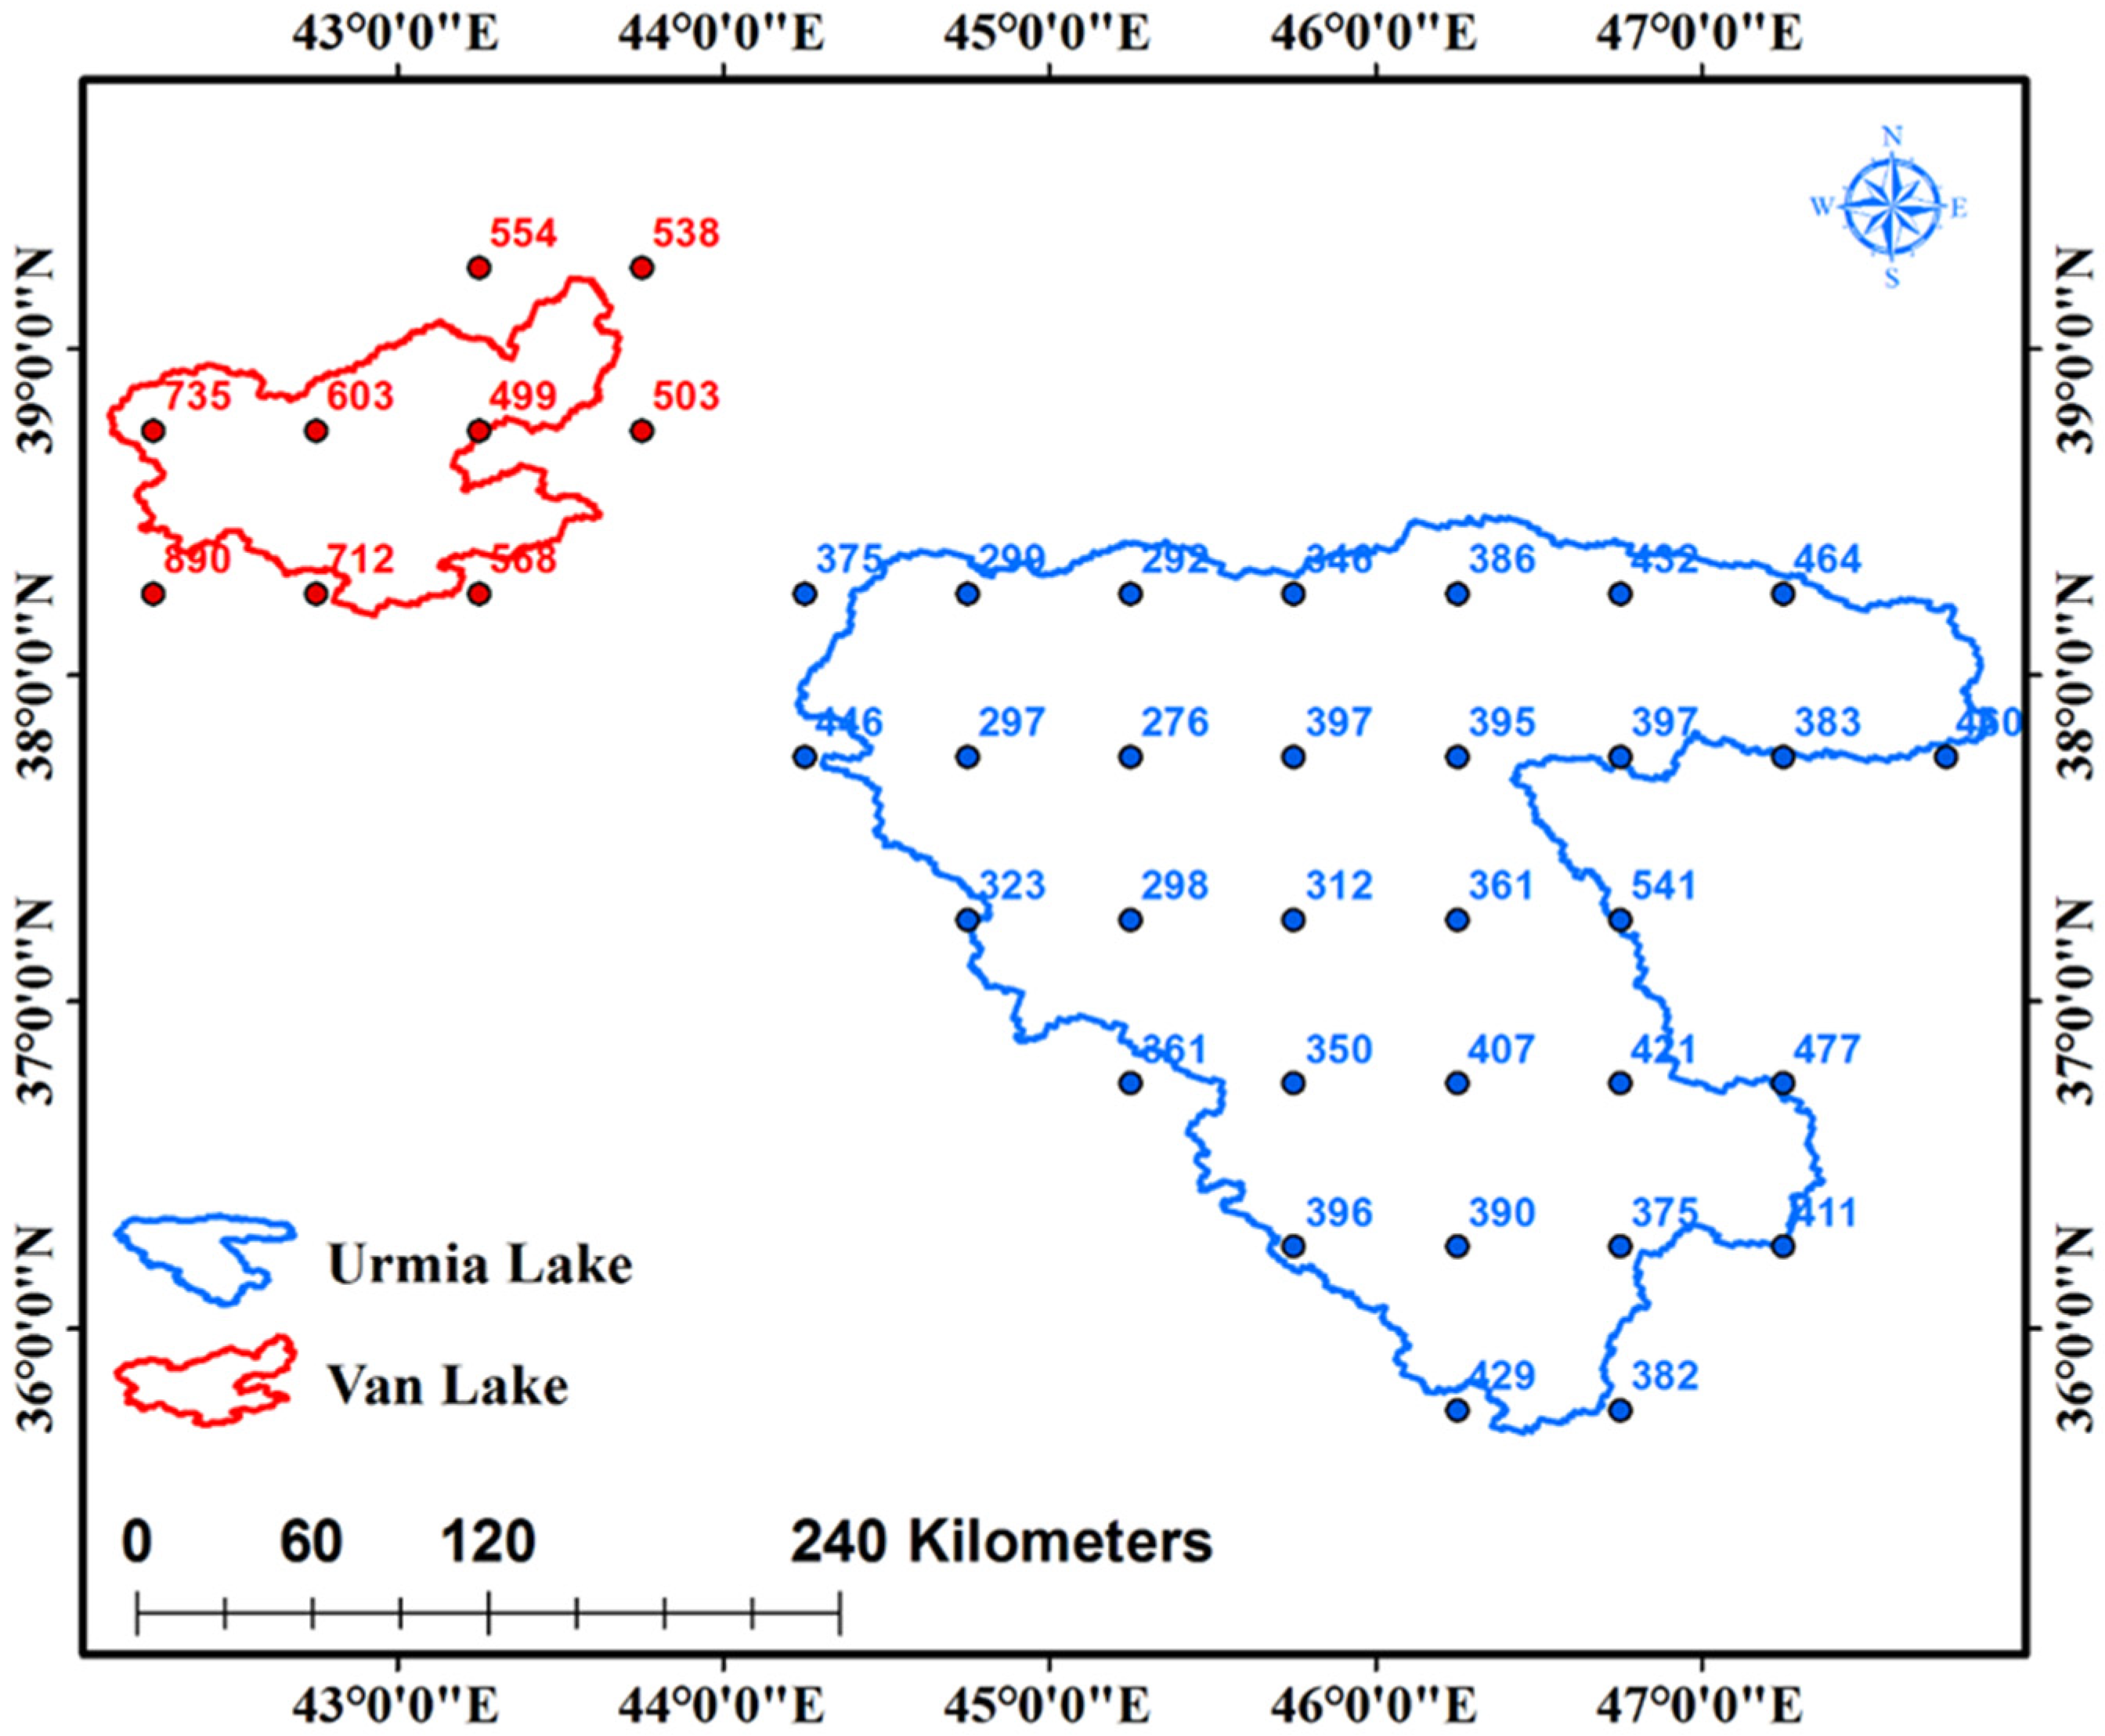
2. Study Area and Methods
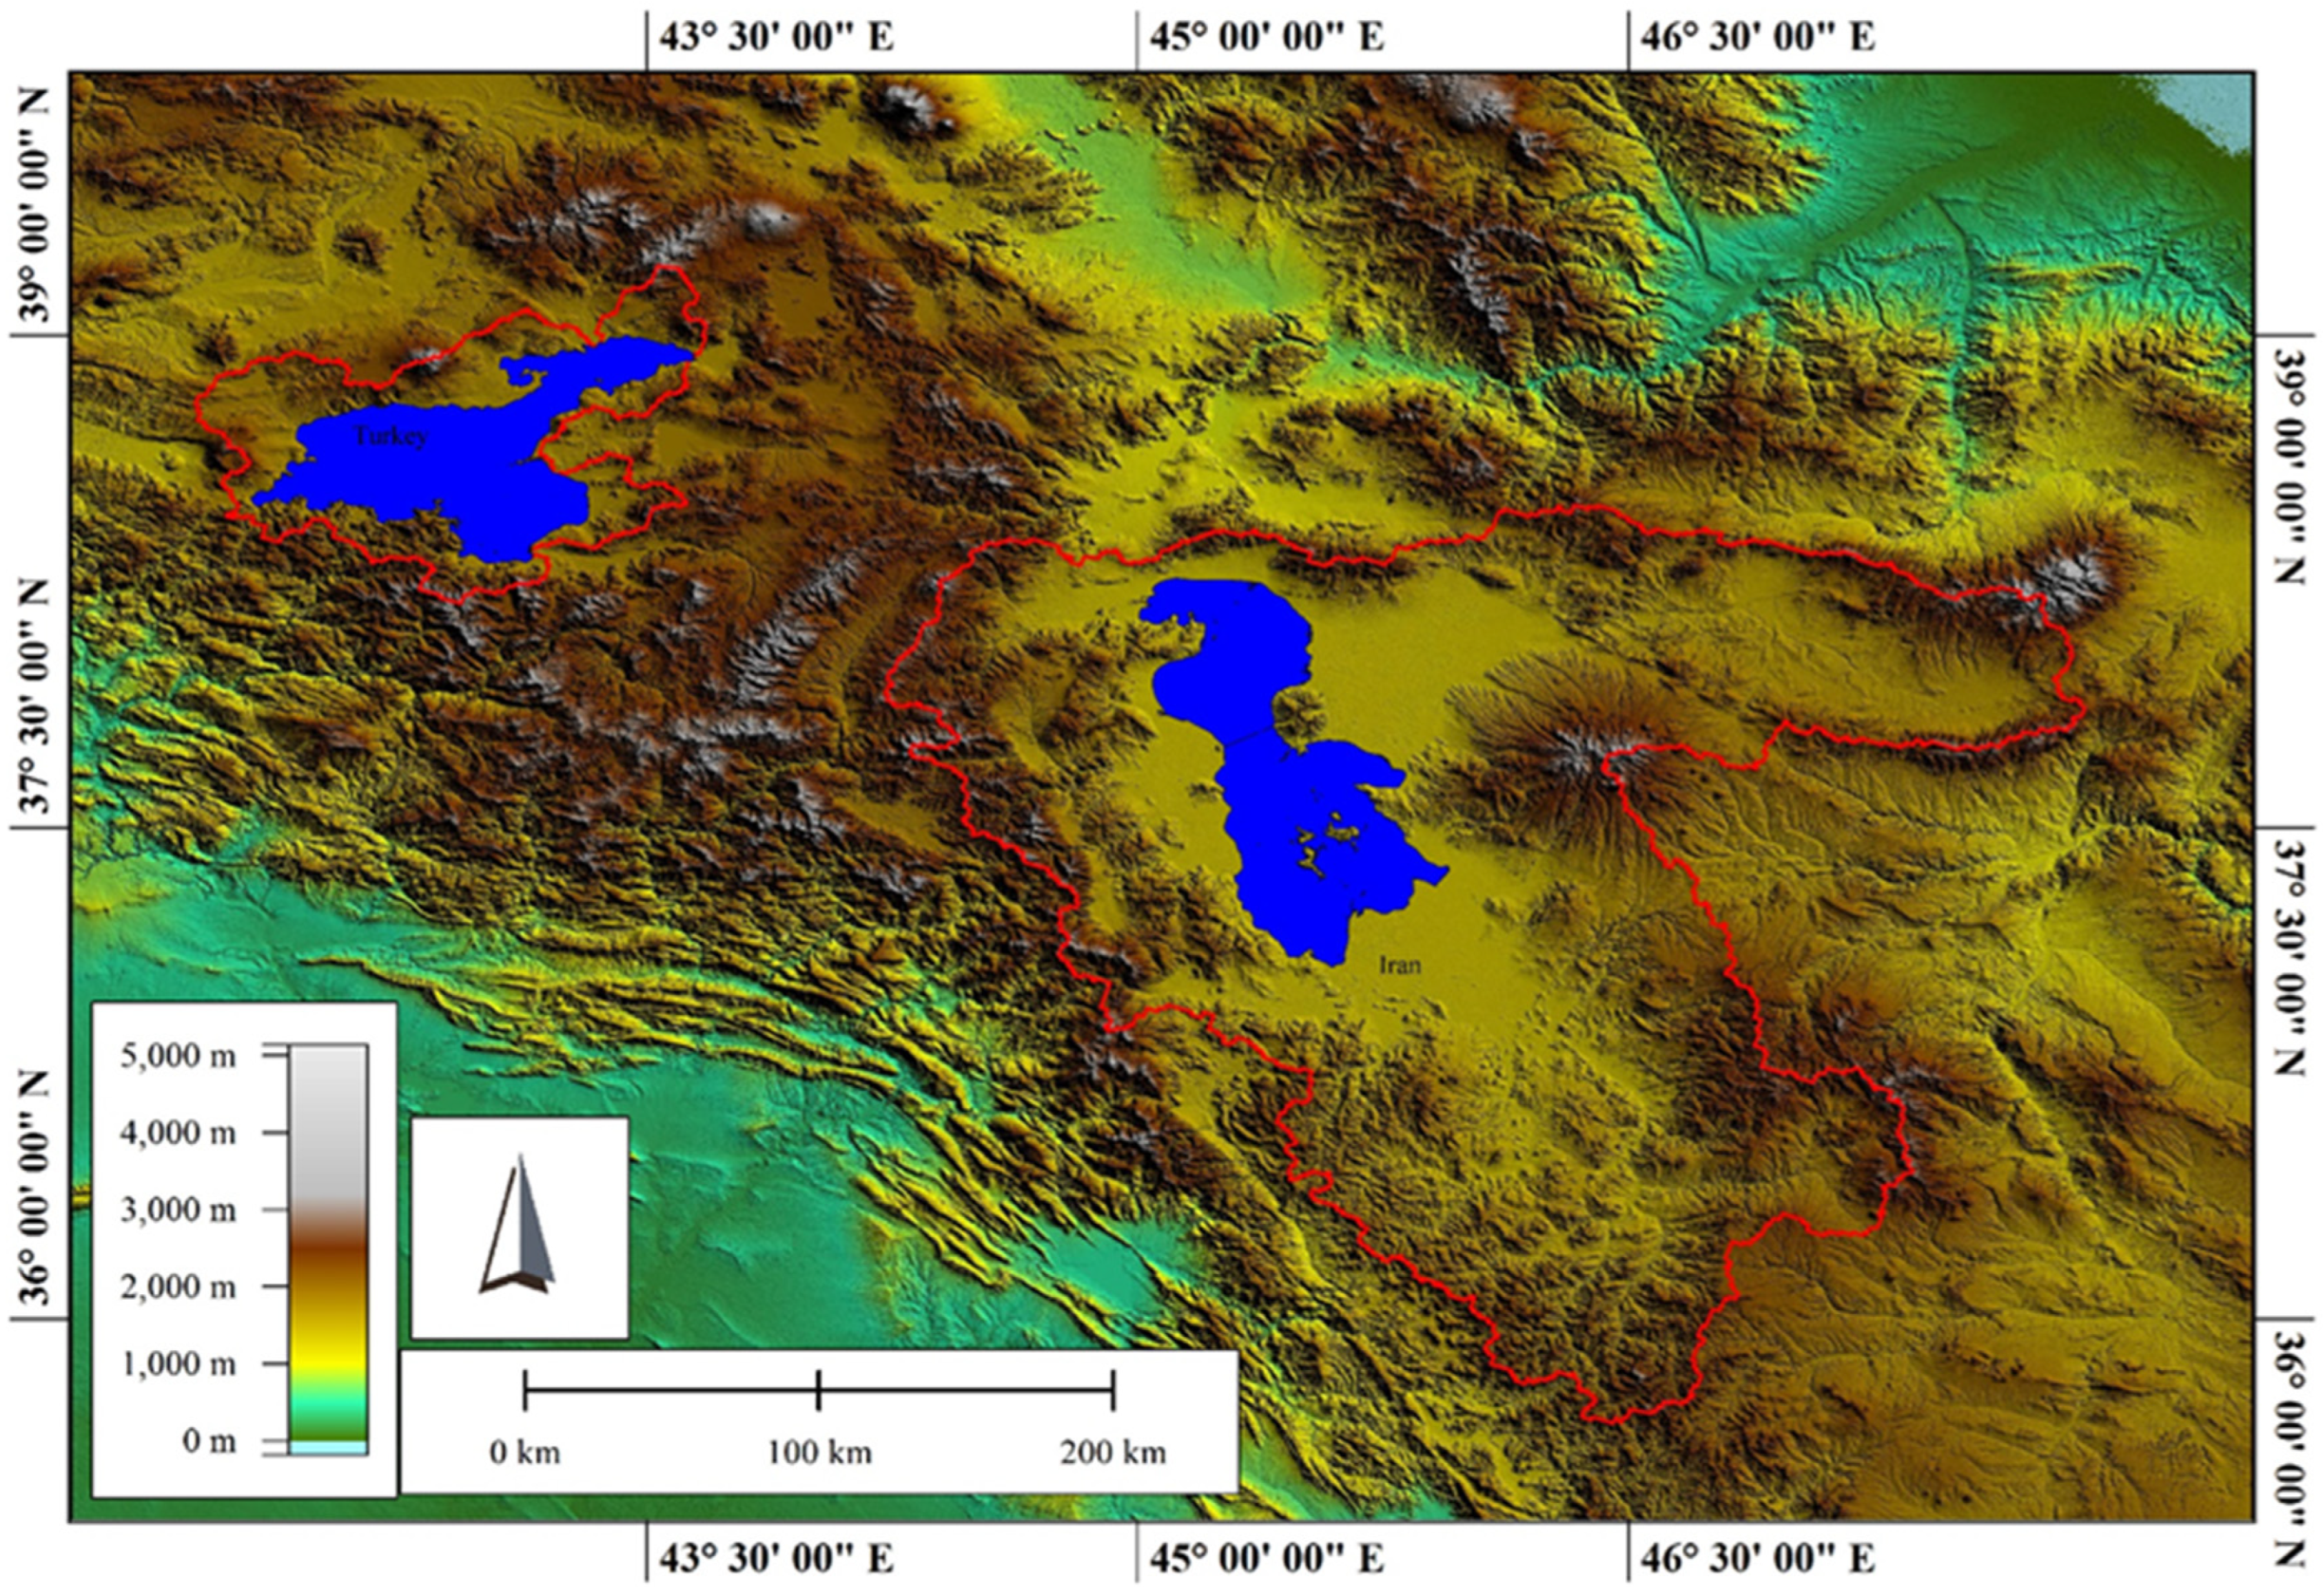
2.1. Study Area—LU
2.2. Study Area—LV
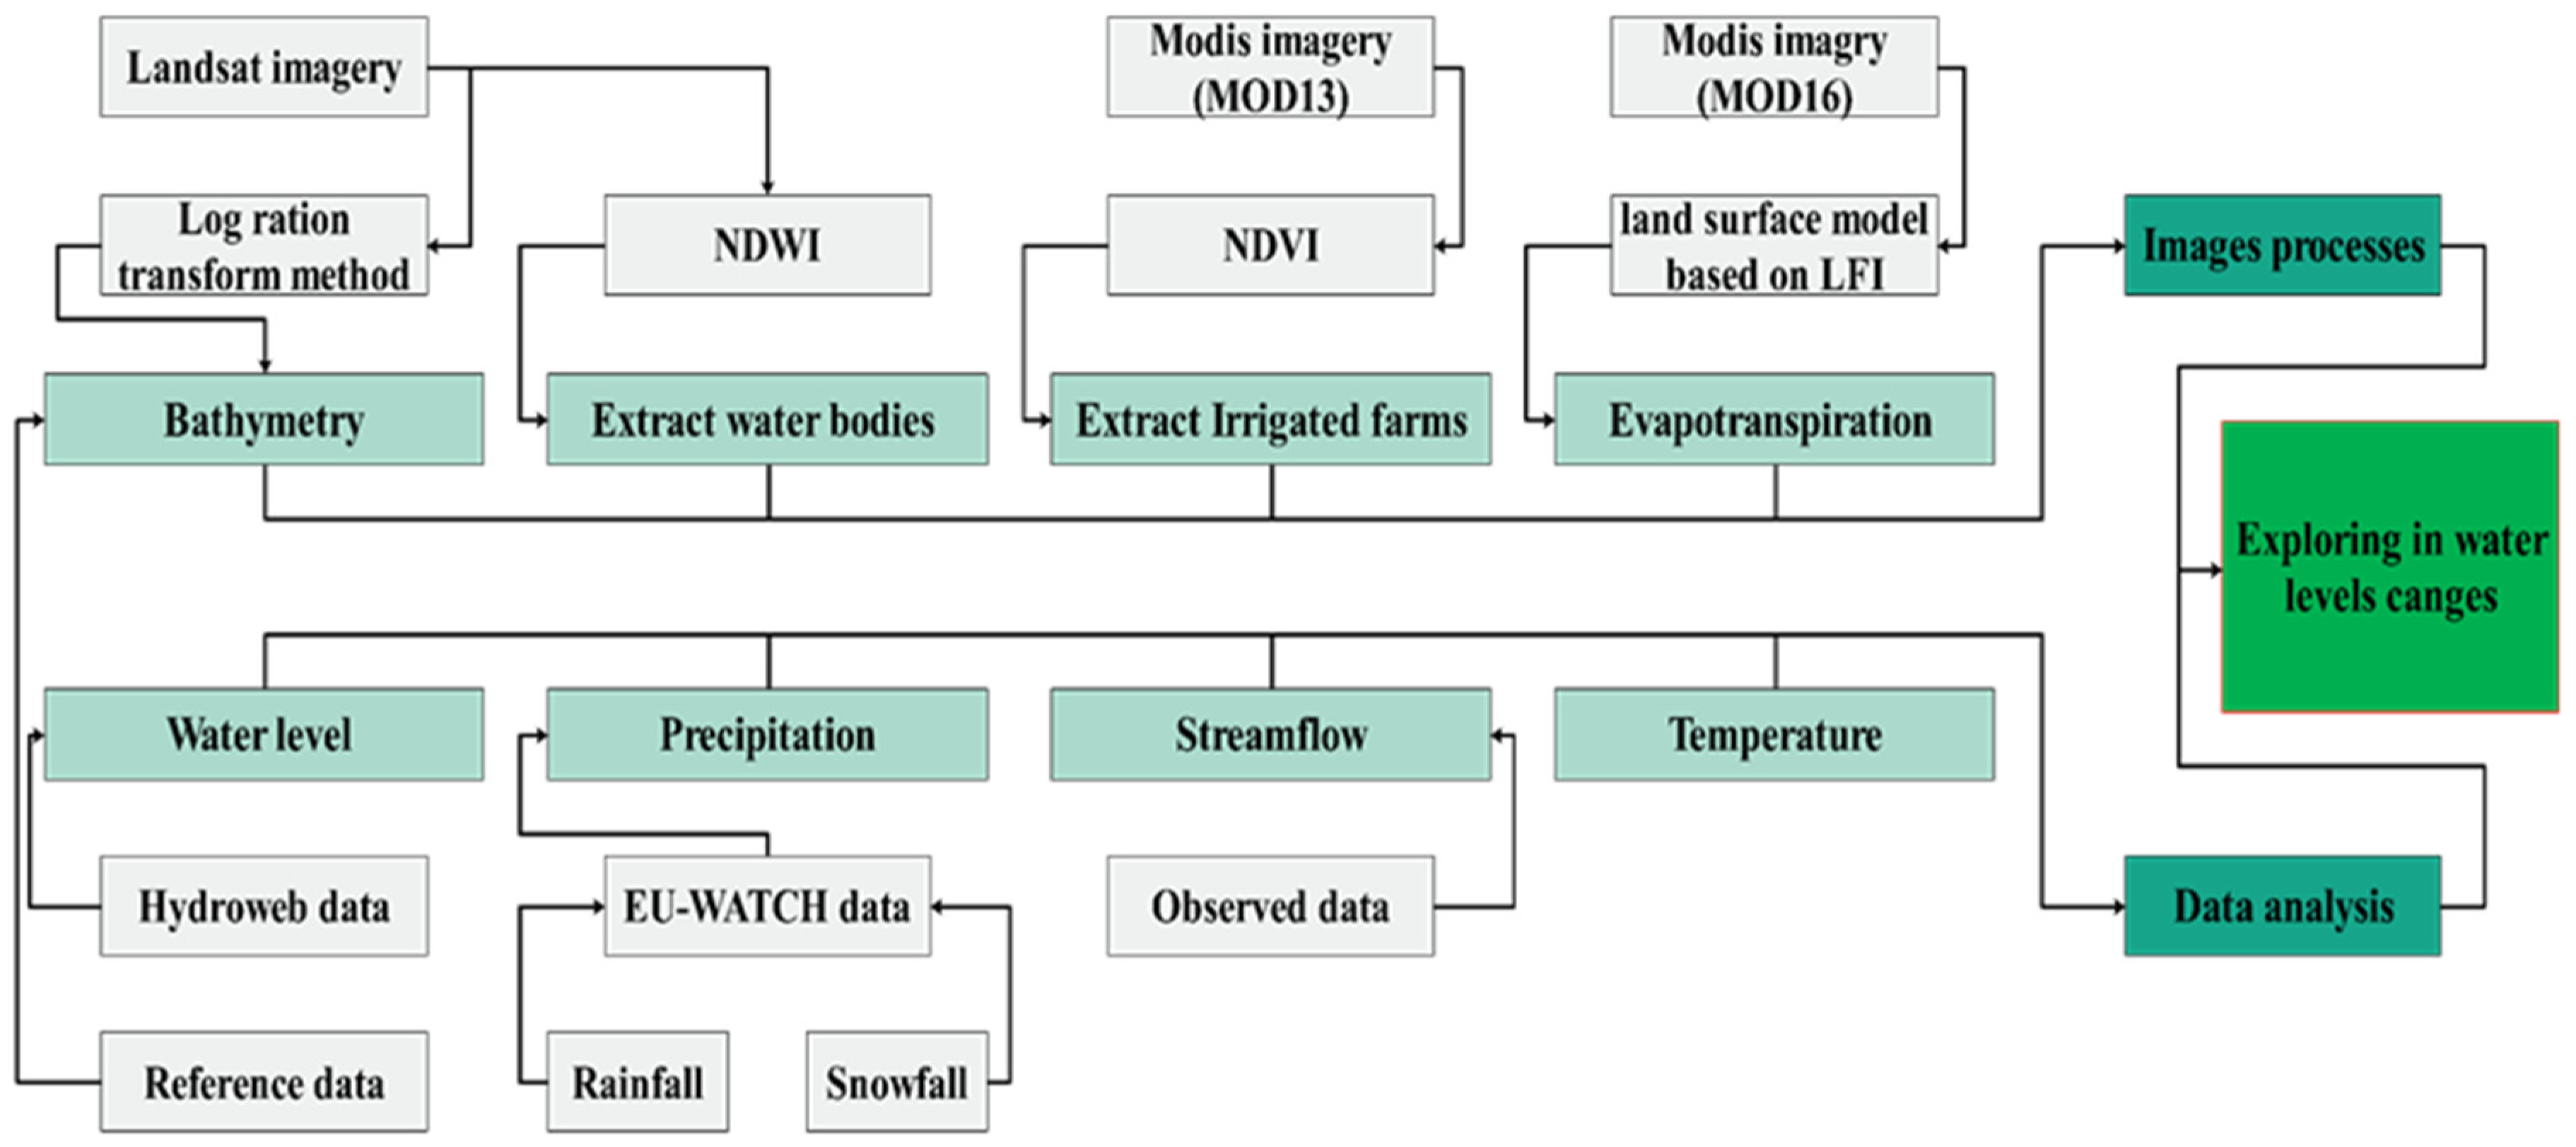
2.3. Methods
2.3.1. Data Collection and Analysis
Precipitation
Temperature
- 1.
- Conversion of DN to BT
- 2.
- Brightness Temperature (BT)
- 3.
- Normalized Difference Vegetation Index (NDVI)
- 4.
- Fractional Vegetation Cover (FVC)
- 5.
- Land Surface Emissivity (LSE)
- 6.
- Land Surface Temperature (LST)
Water Level Data
Dam Constriction and Hydrometric Data
2.3.2. Water Body Extraction
Vegetation Index
Water Depth
Evapotranspiration
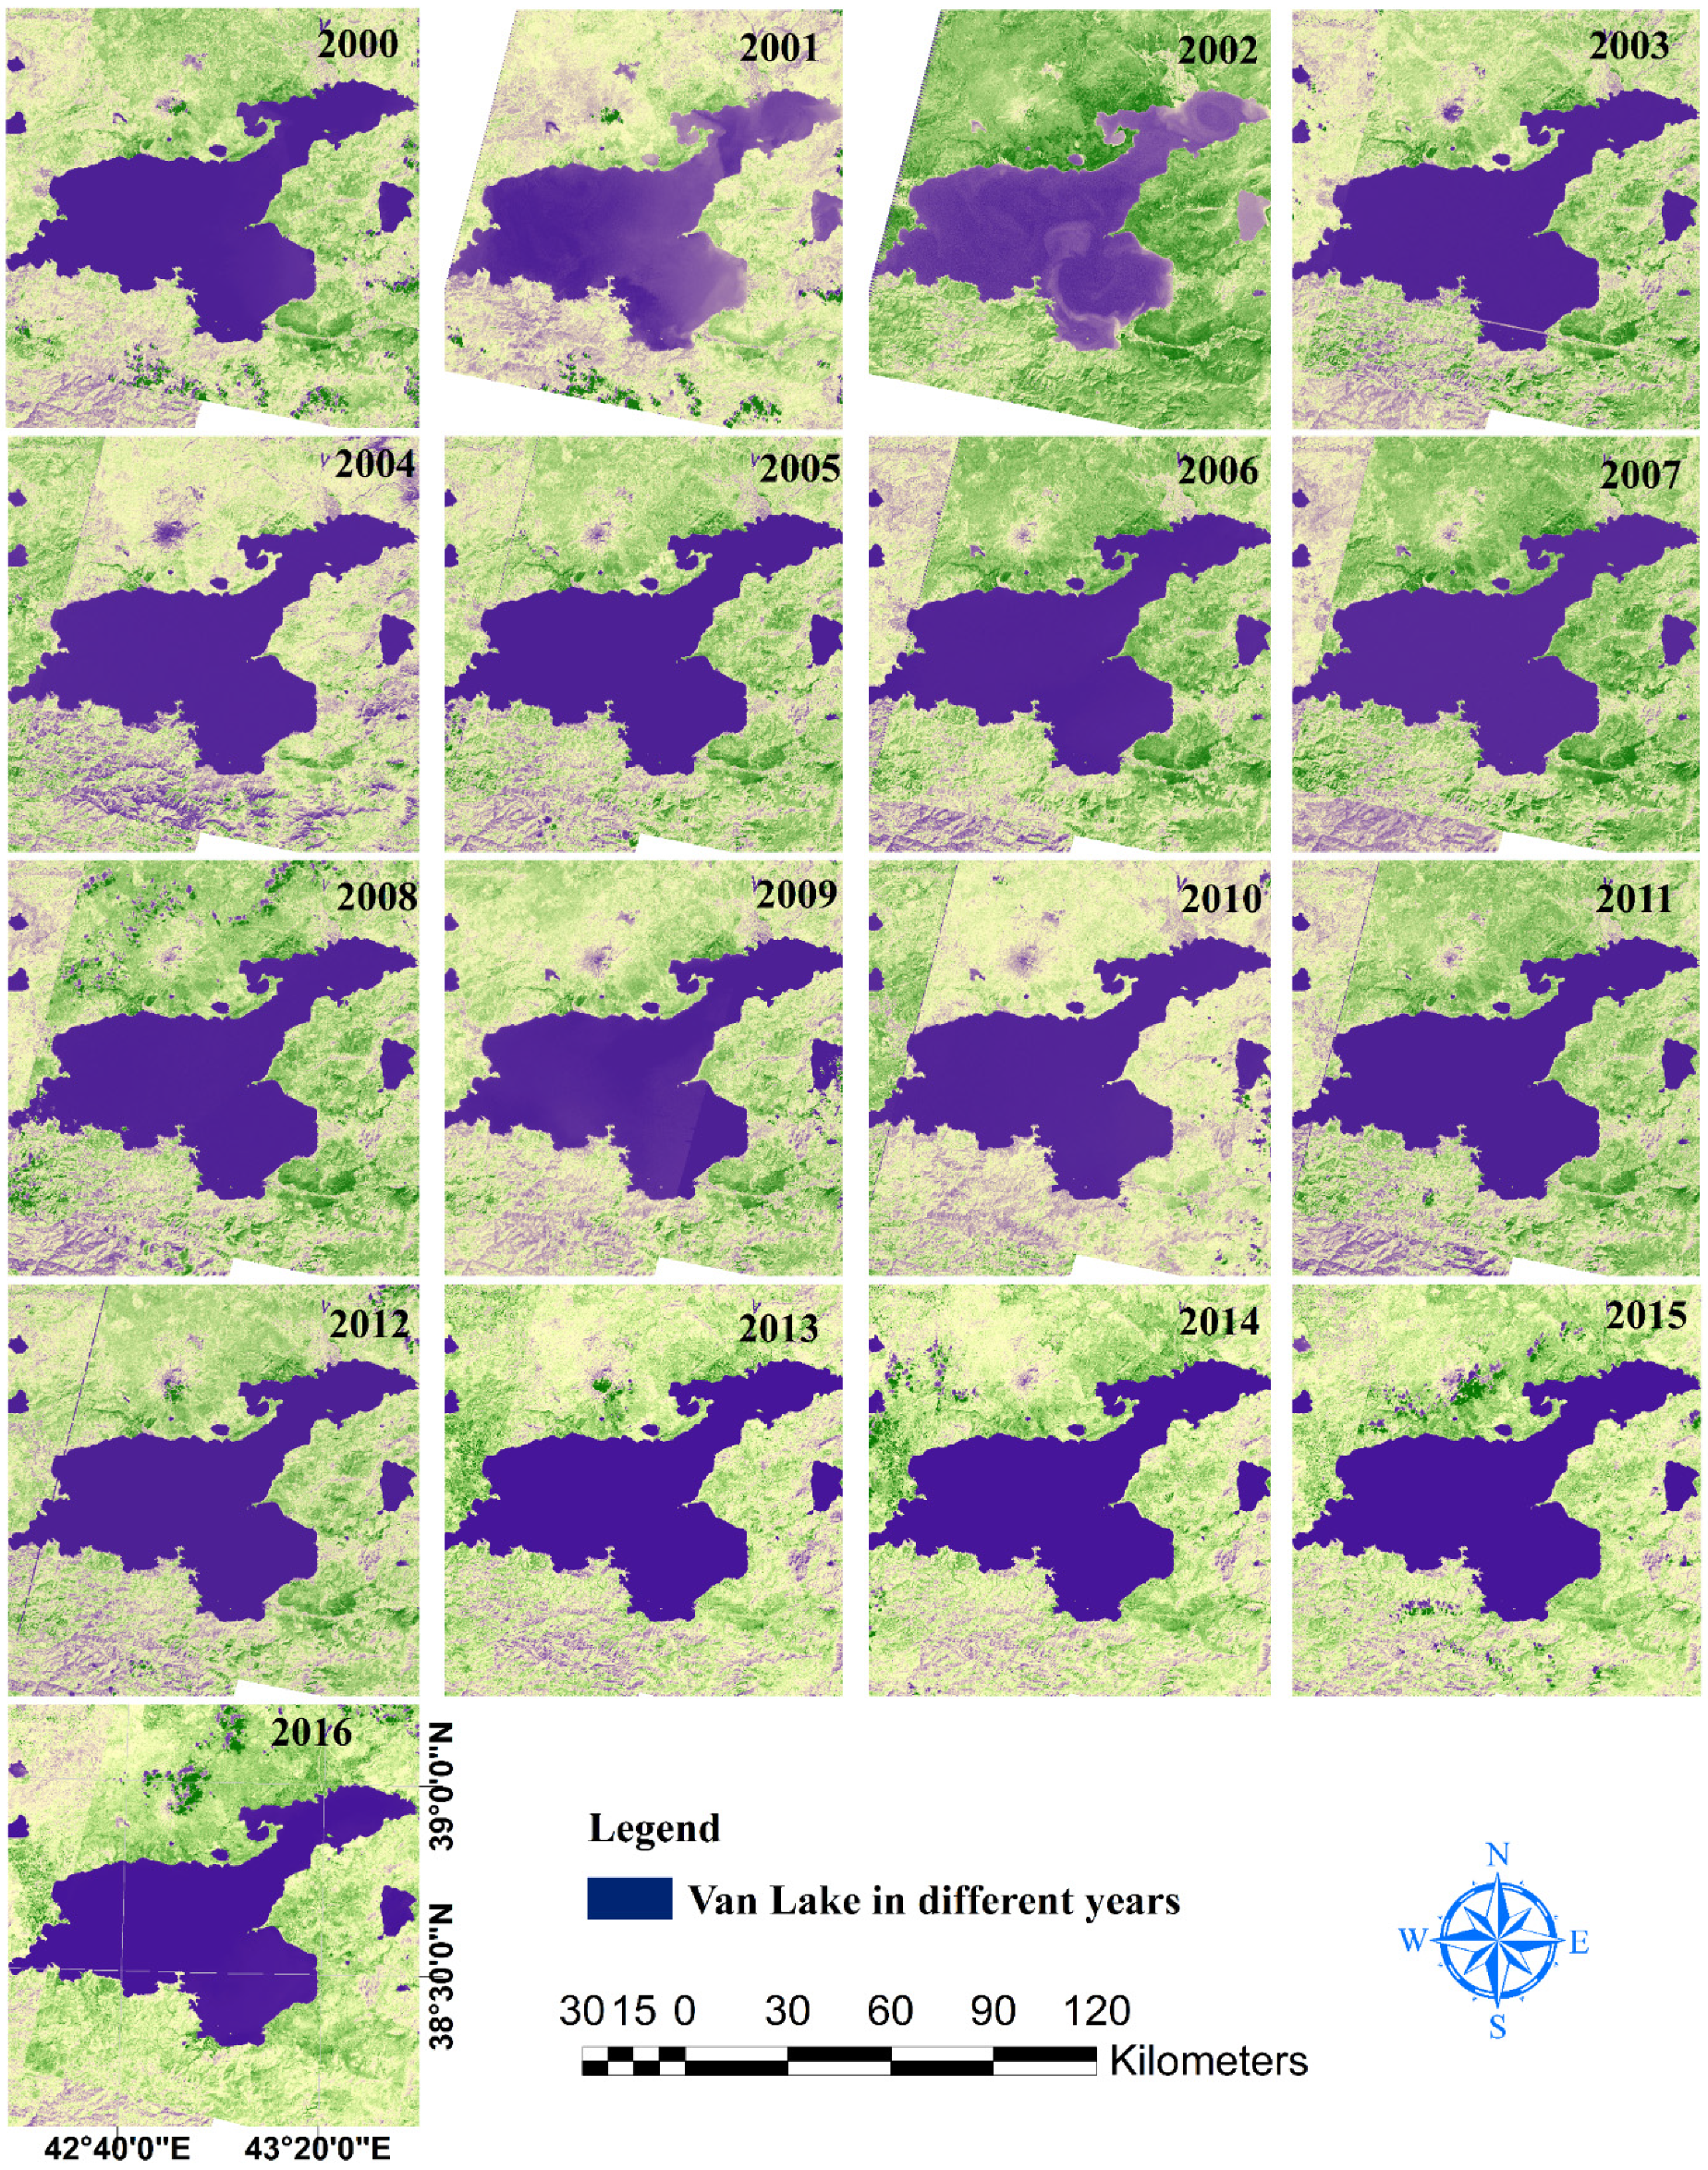
3. Results
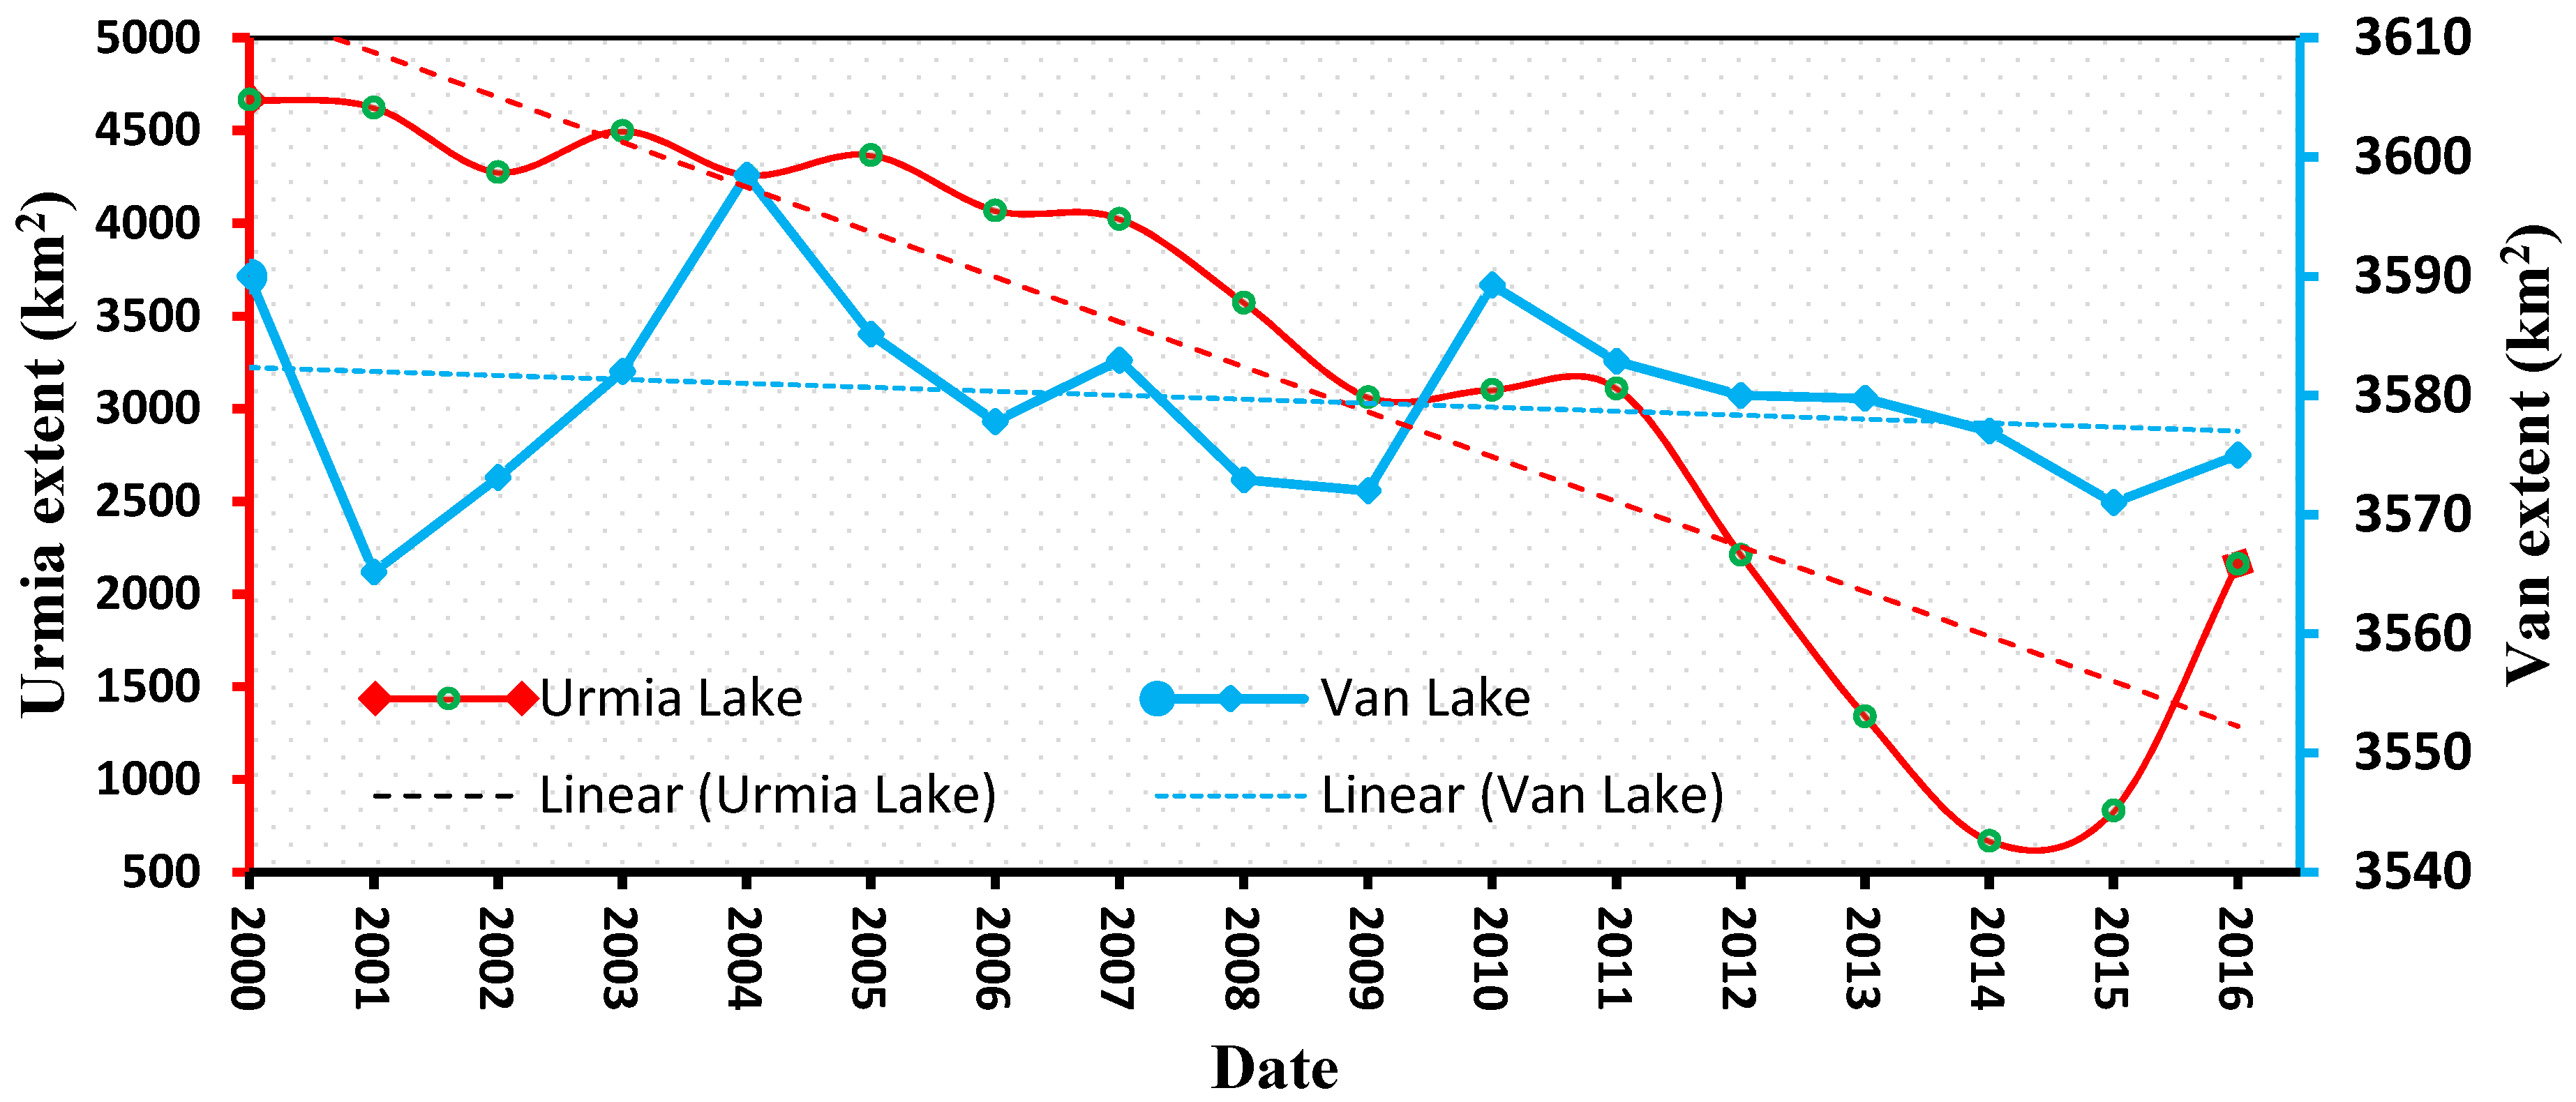
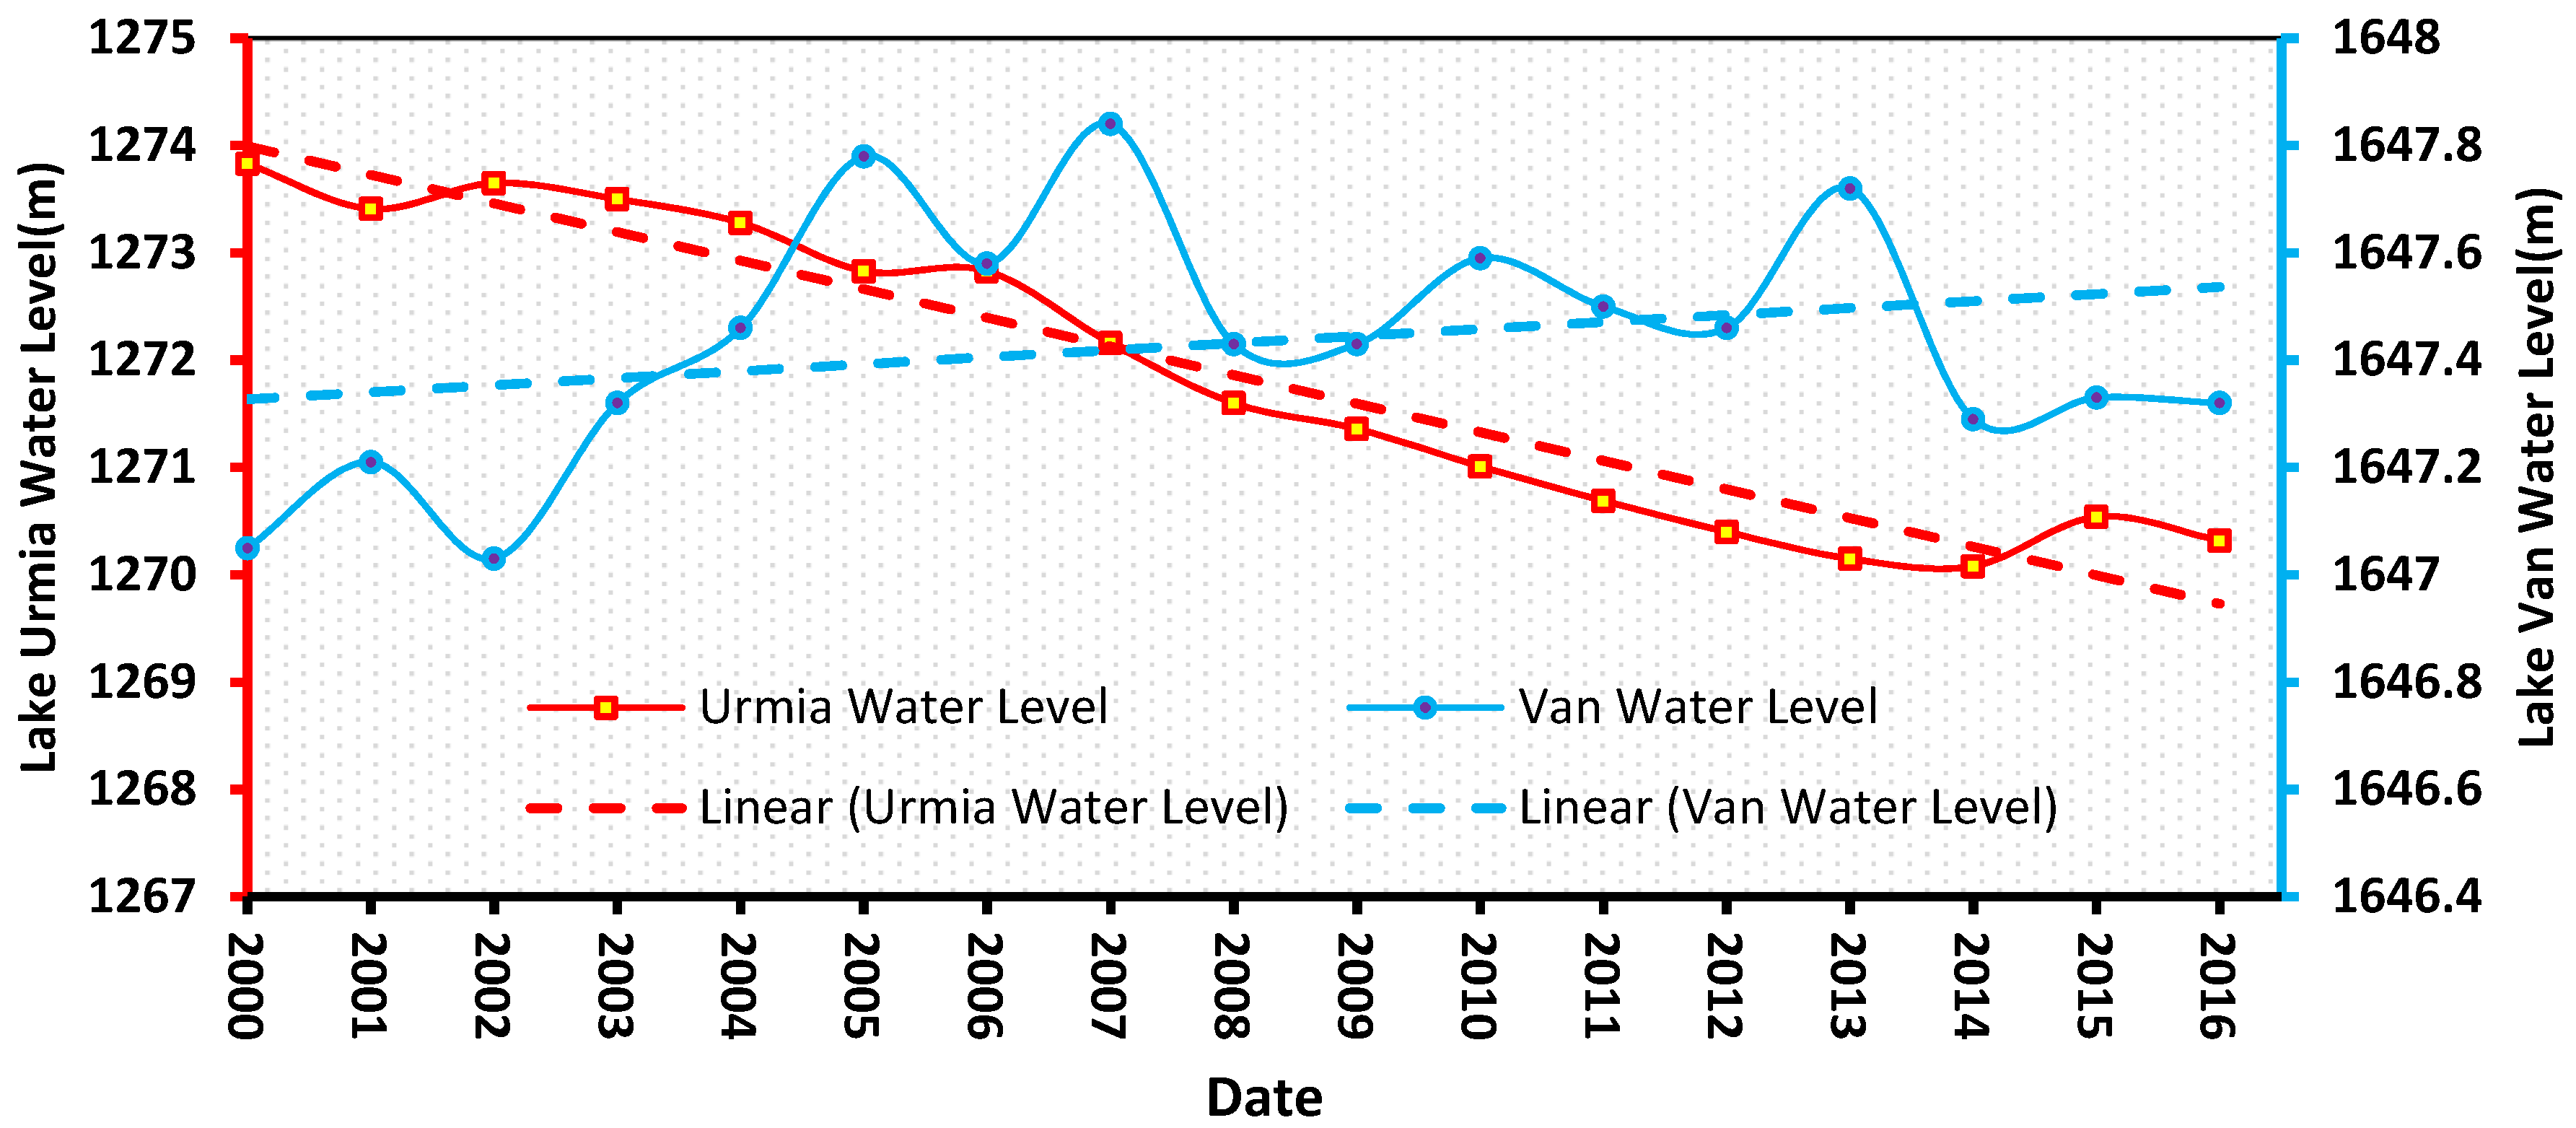
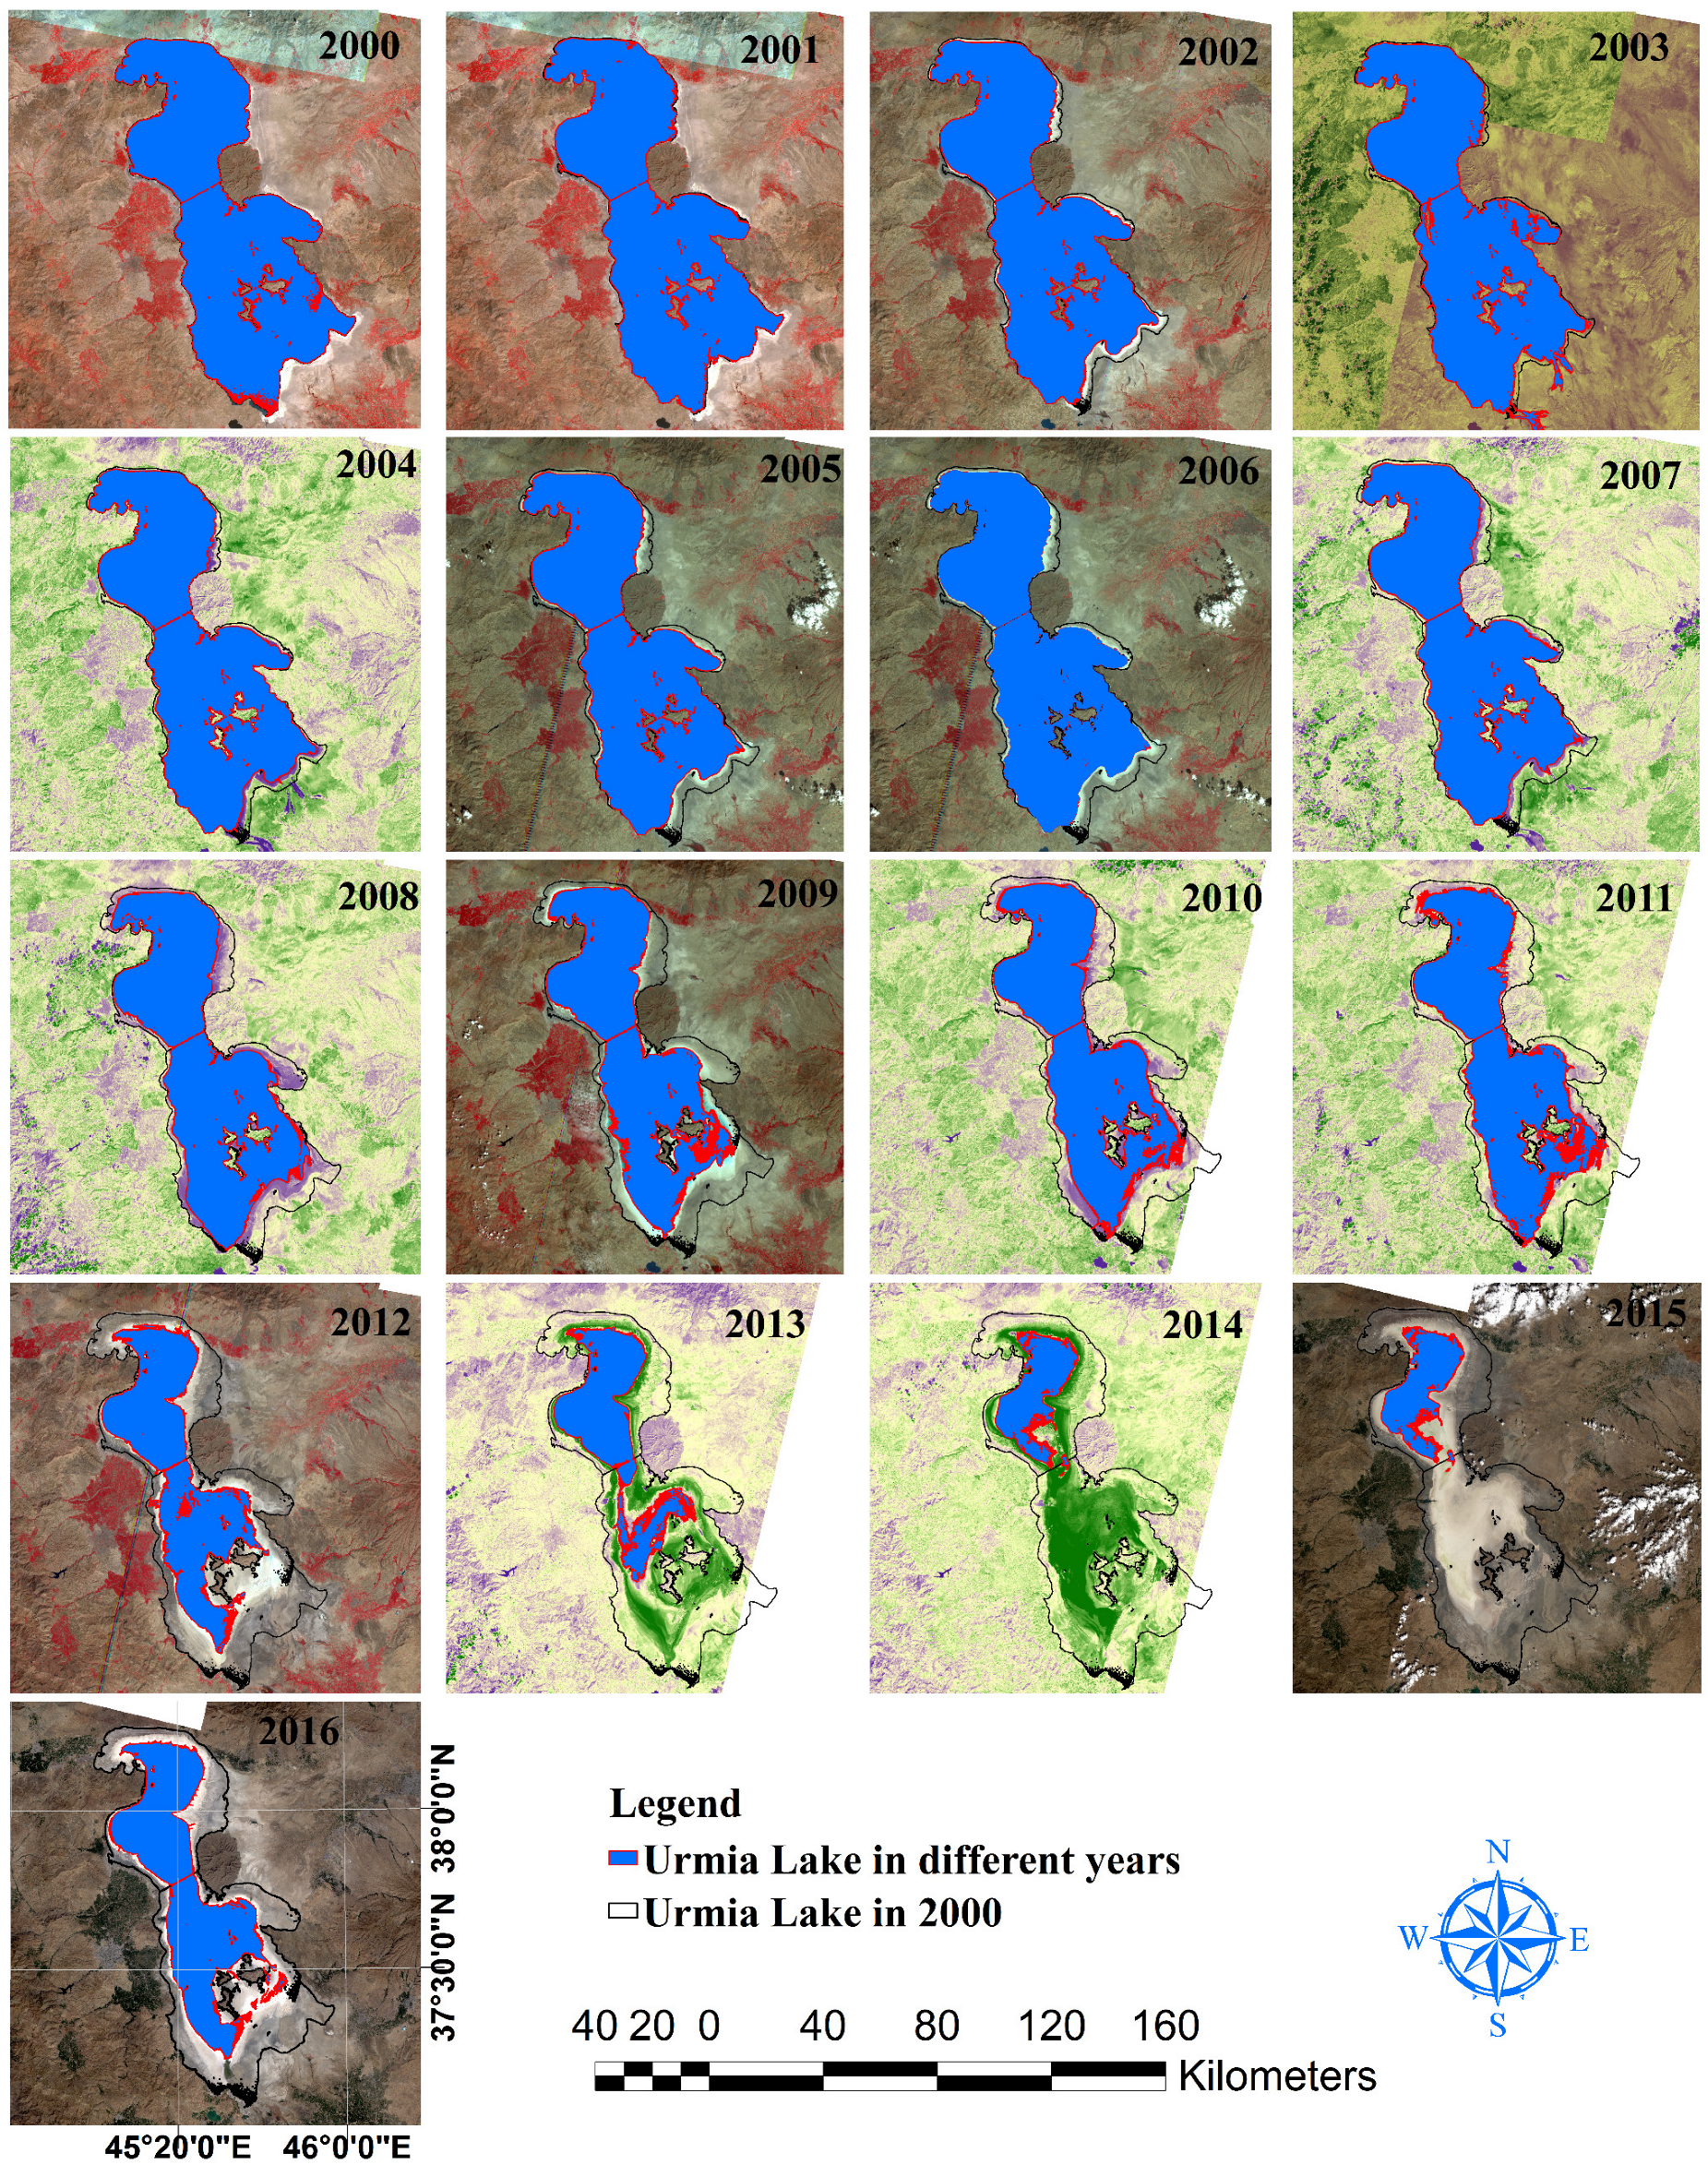
3.1. Analysis of Lake Extents and Water Levels
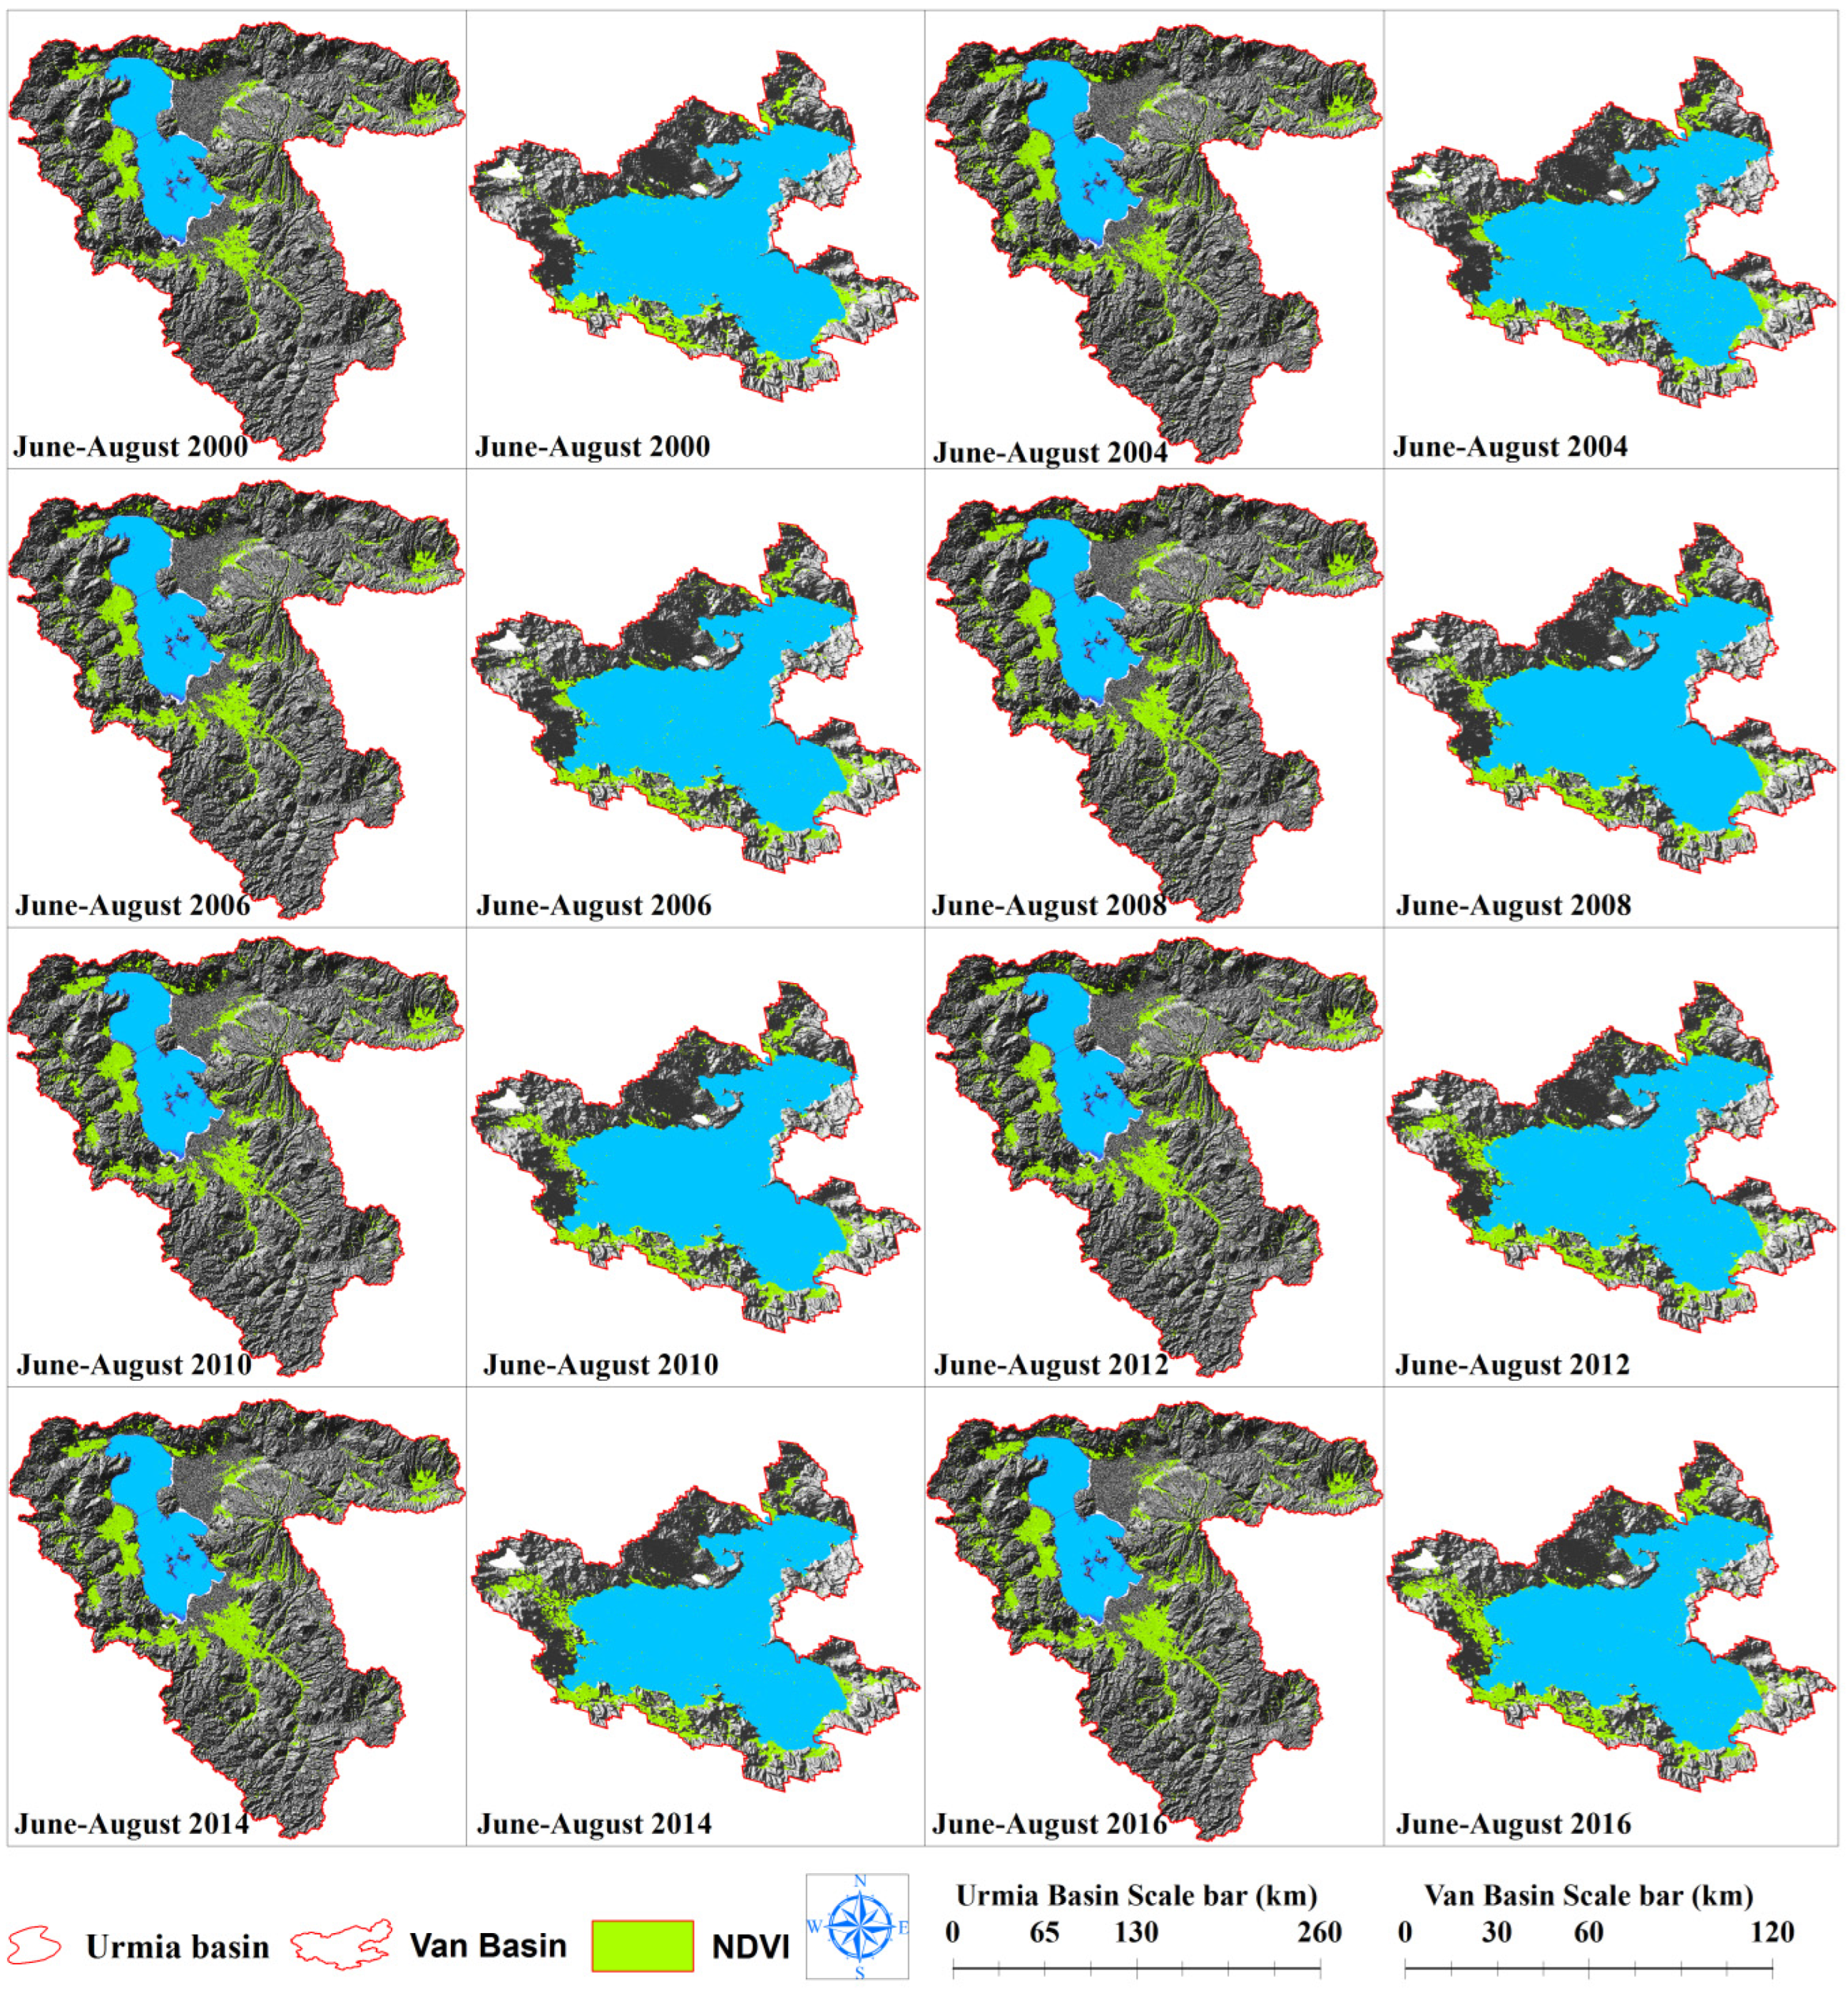
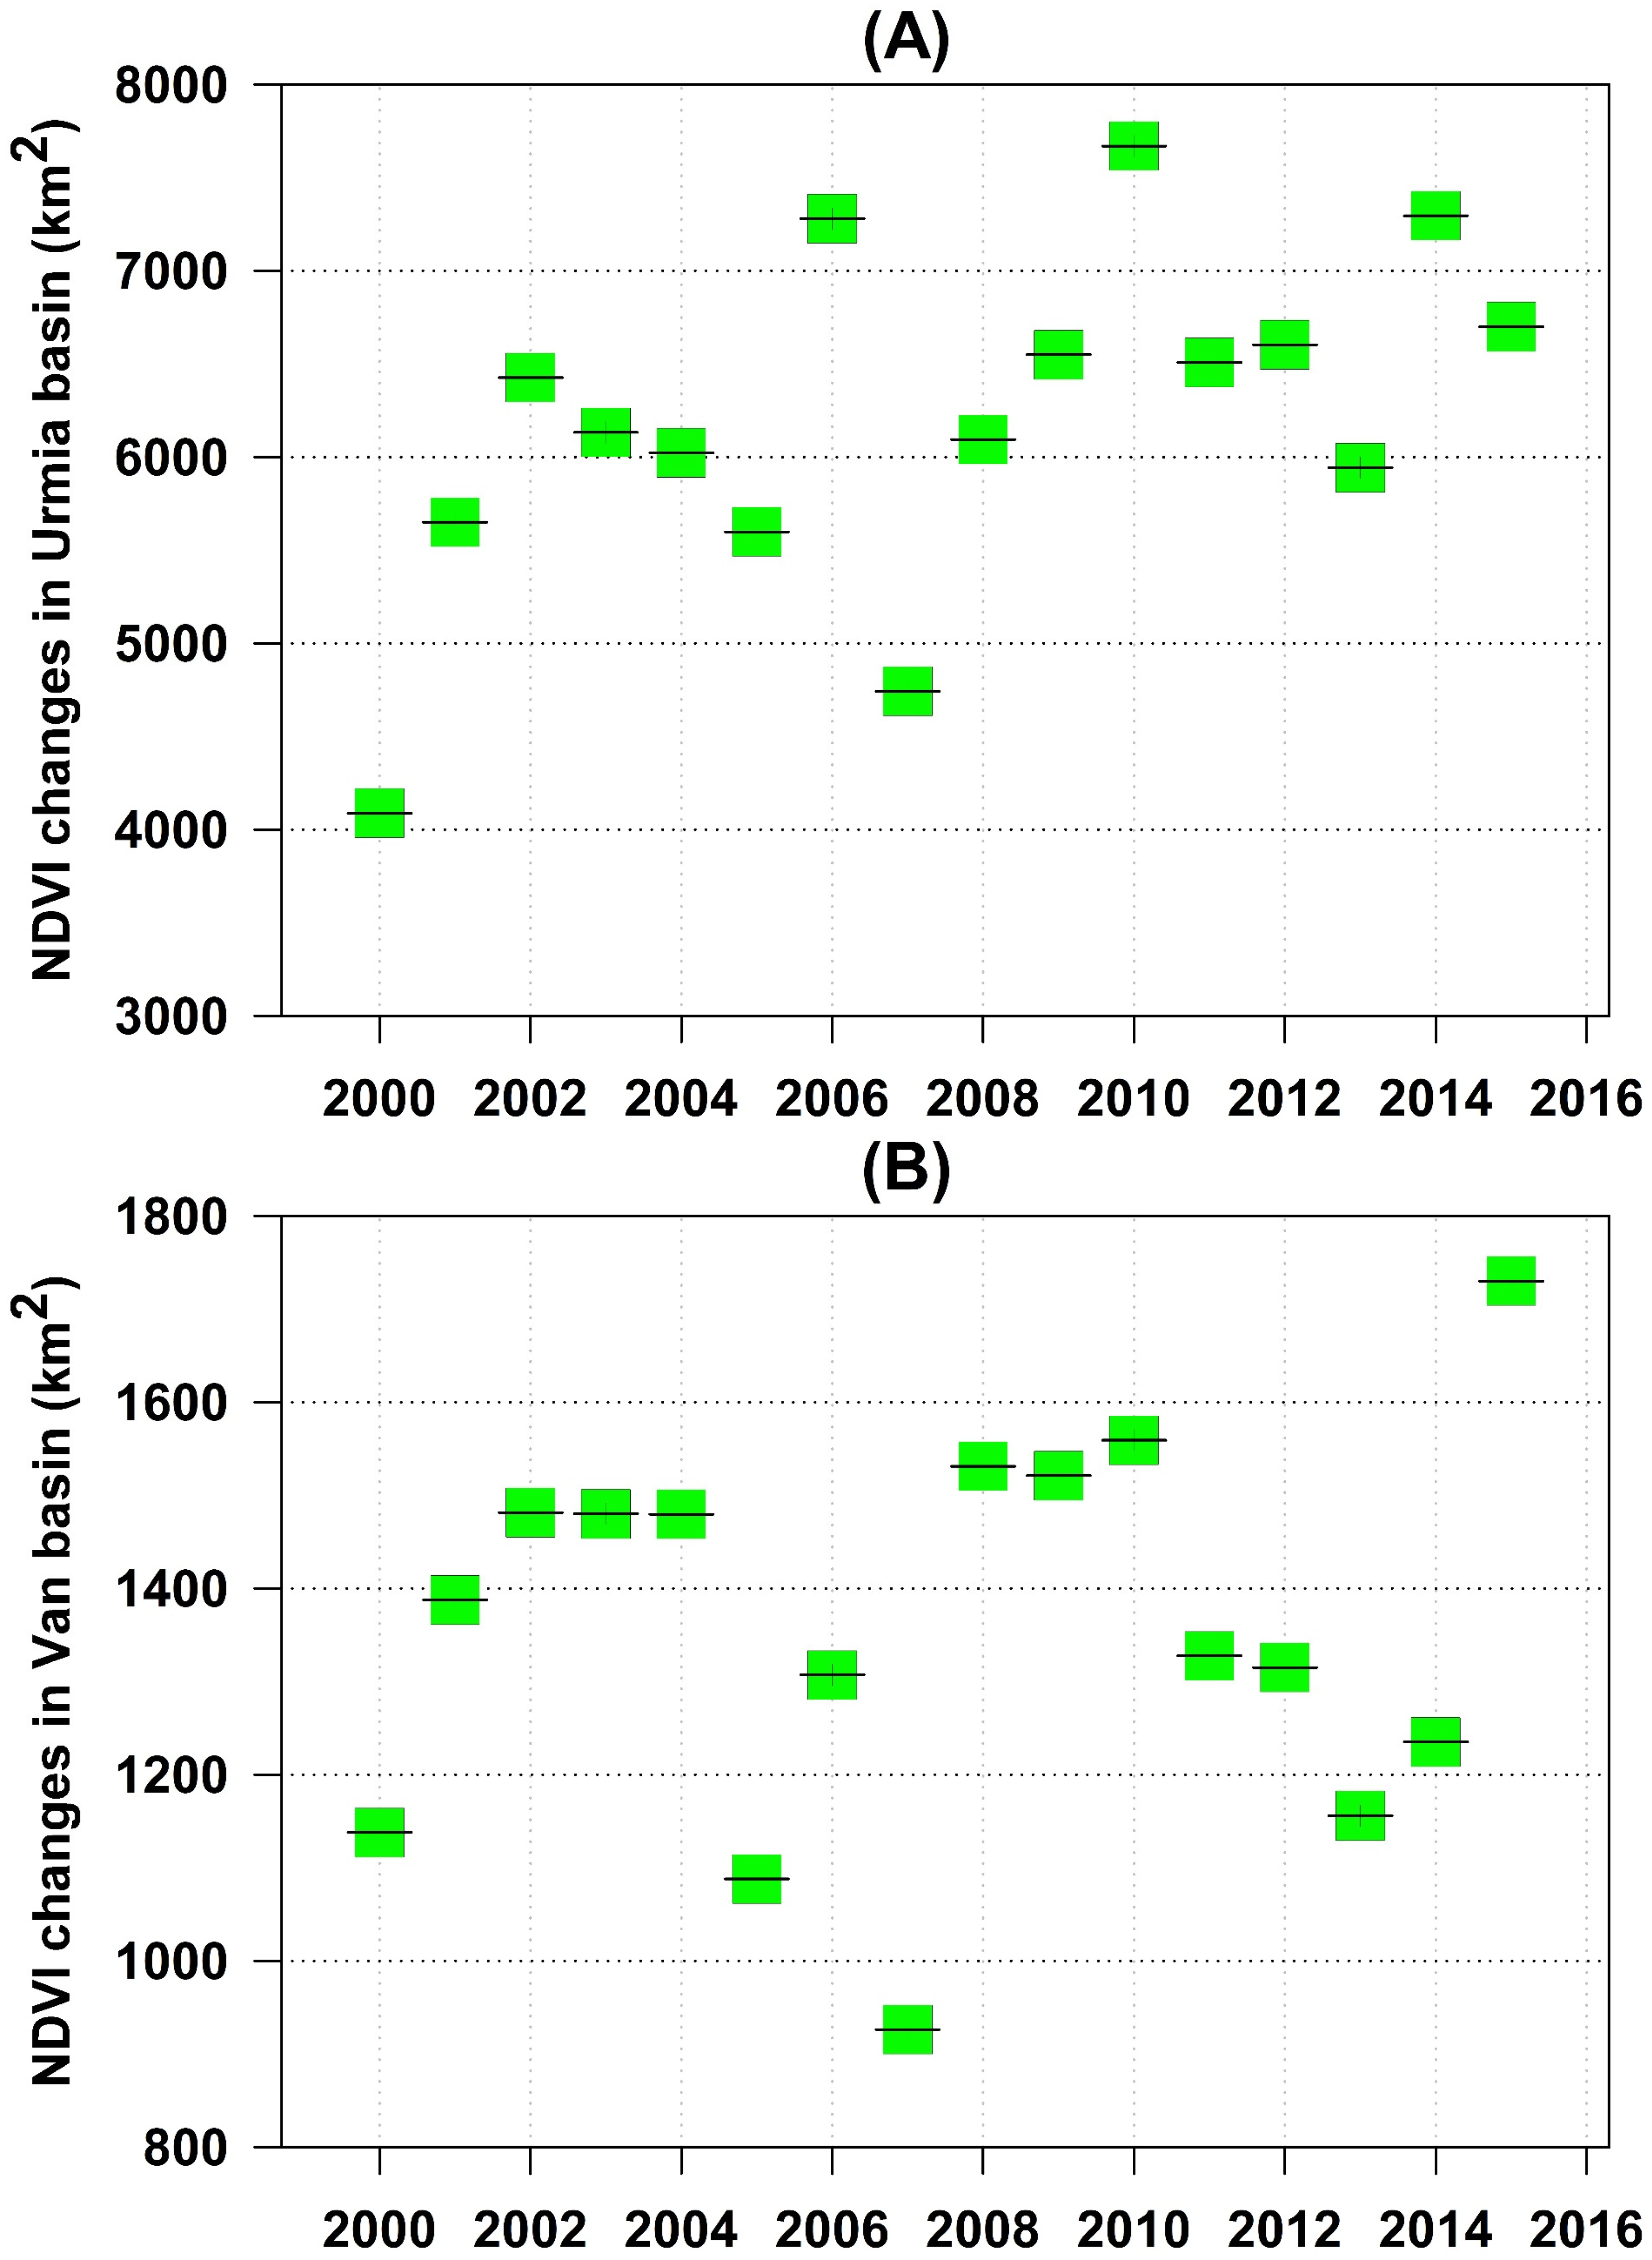
3.2. NDVI
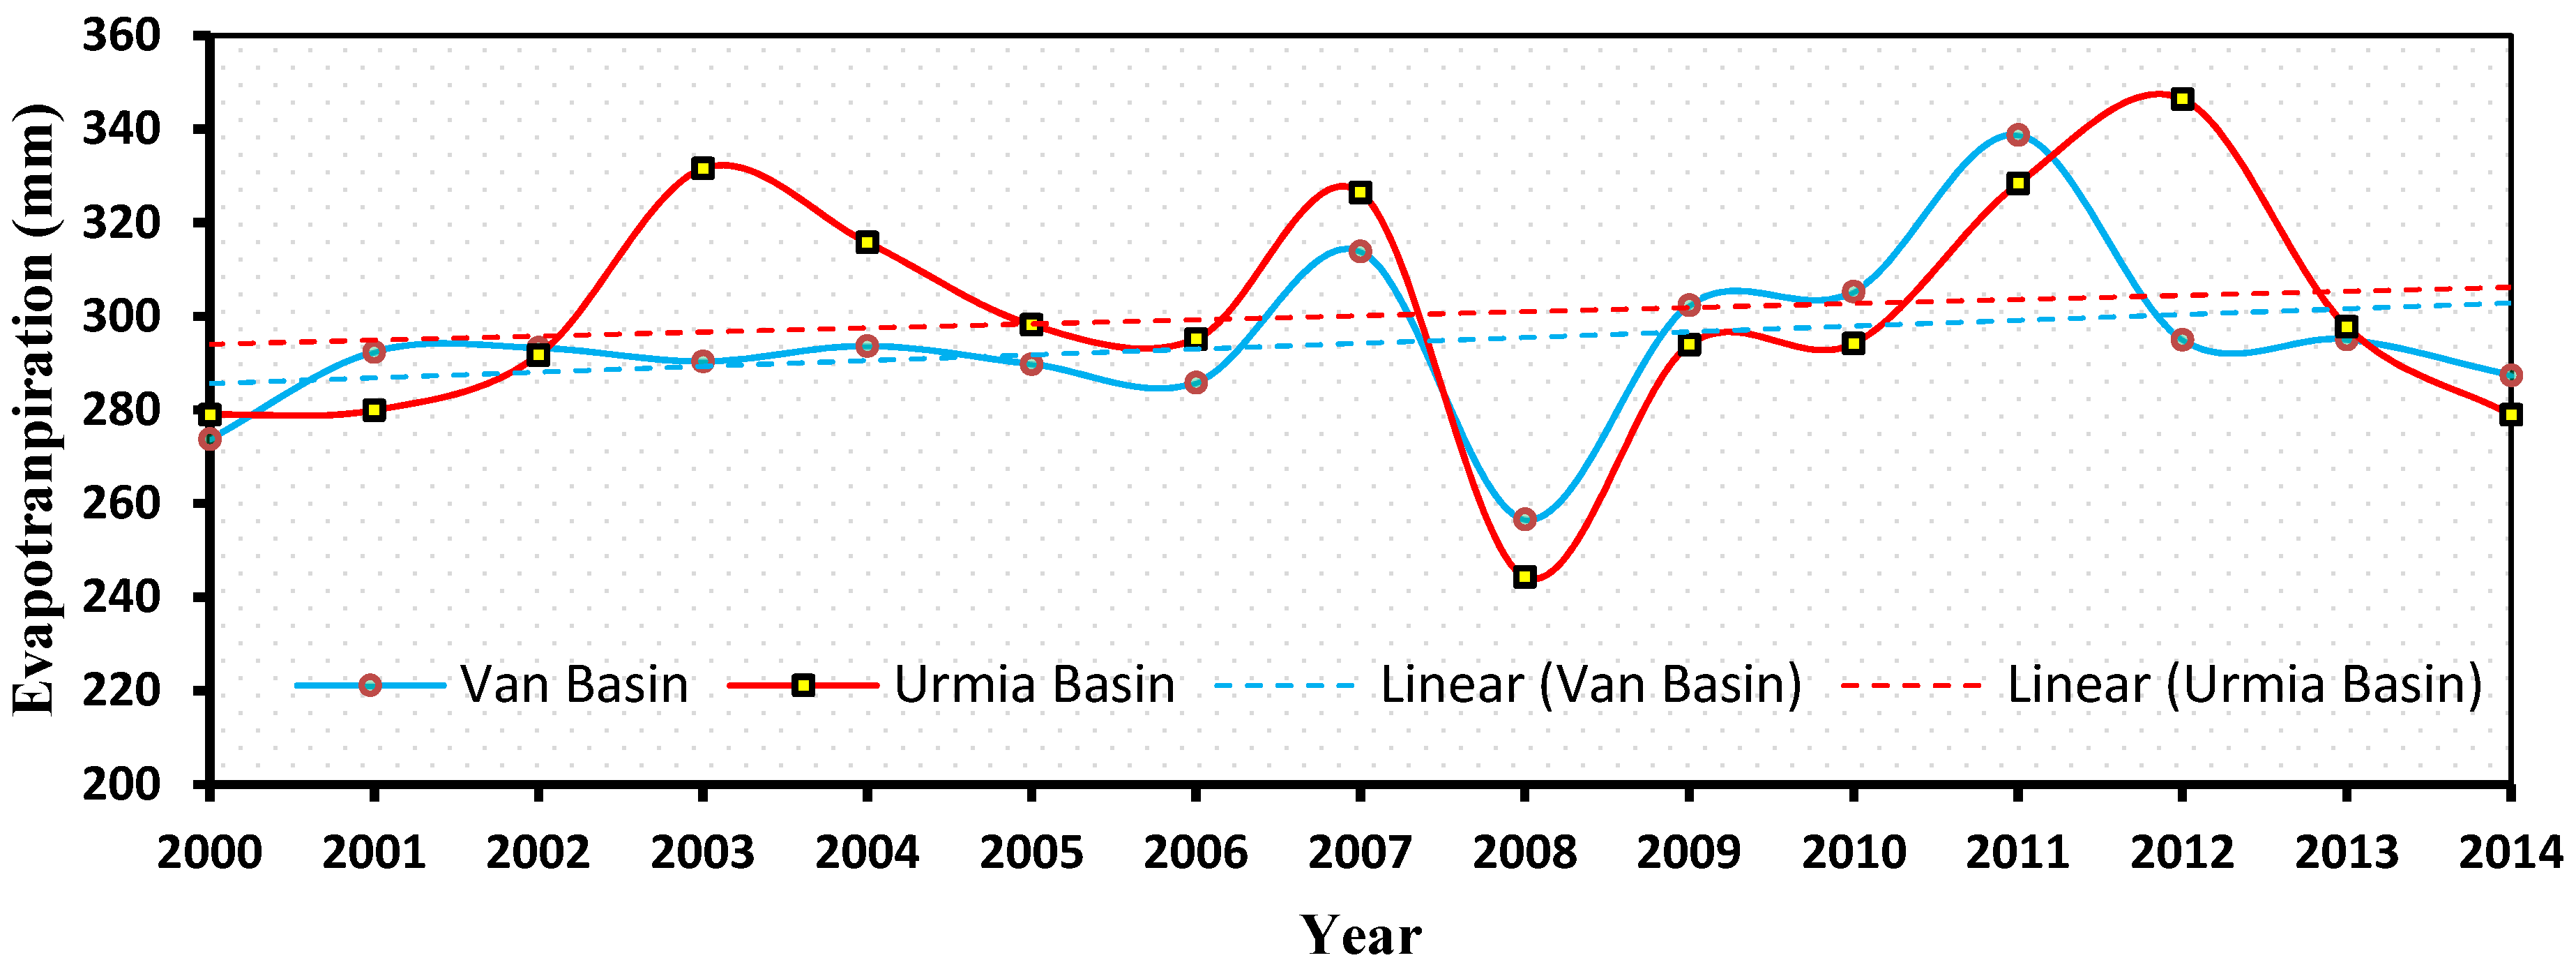
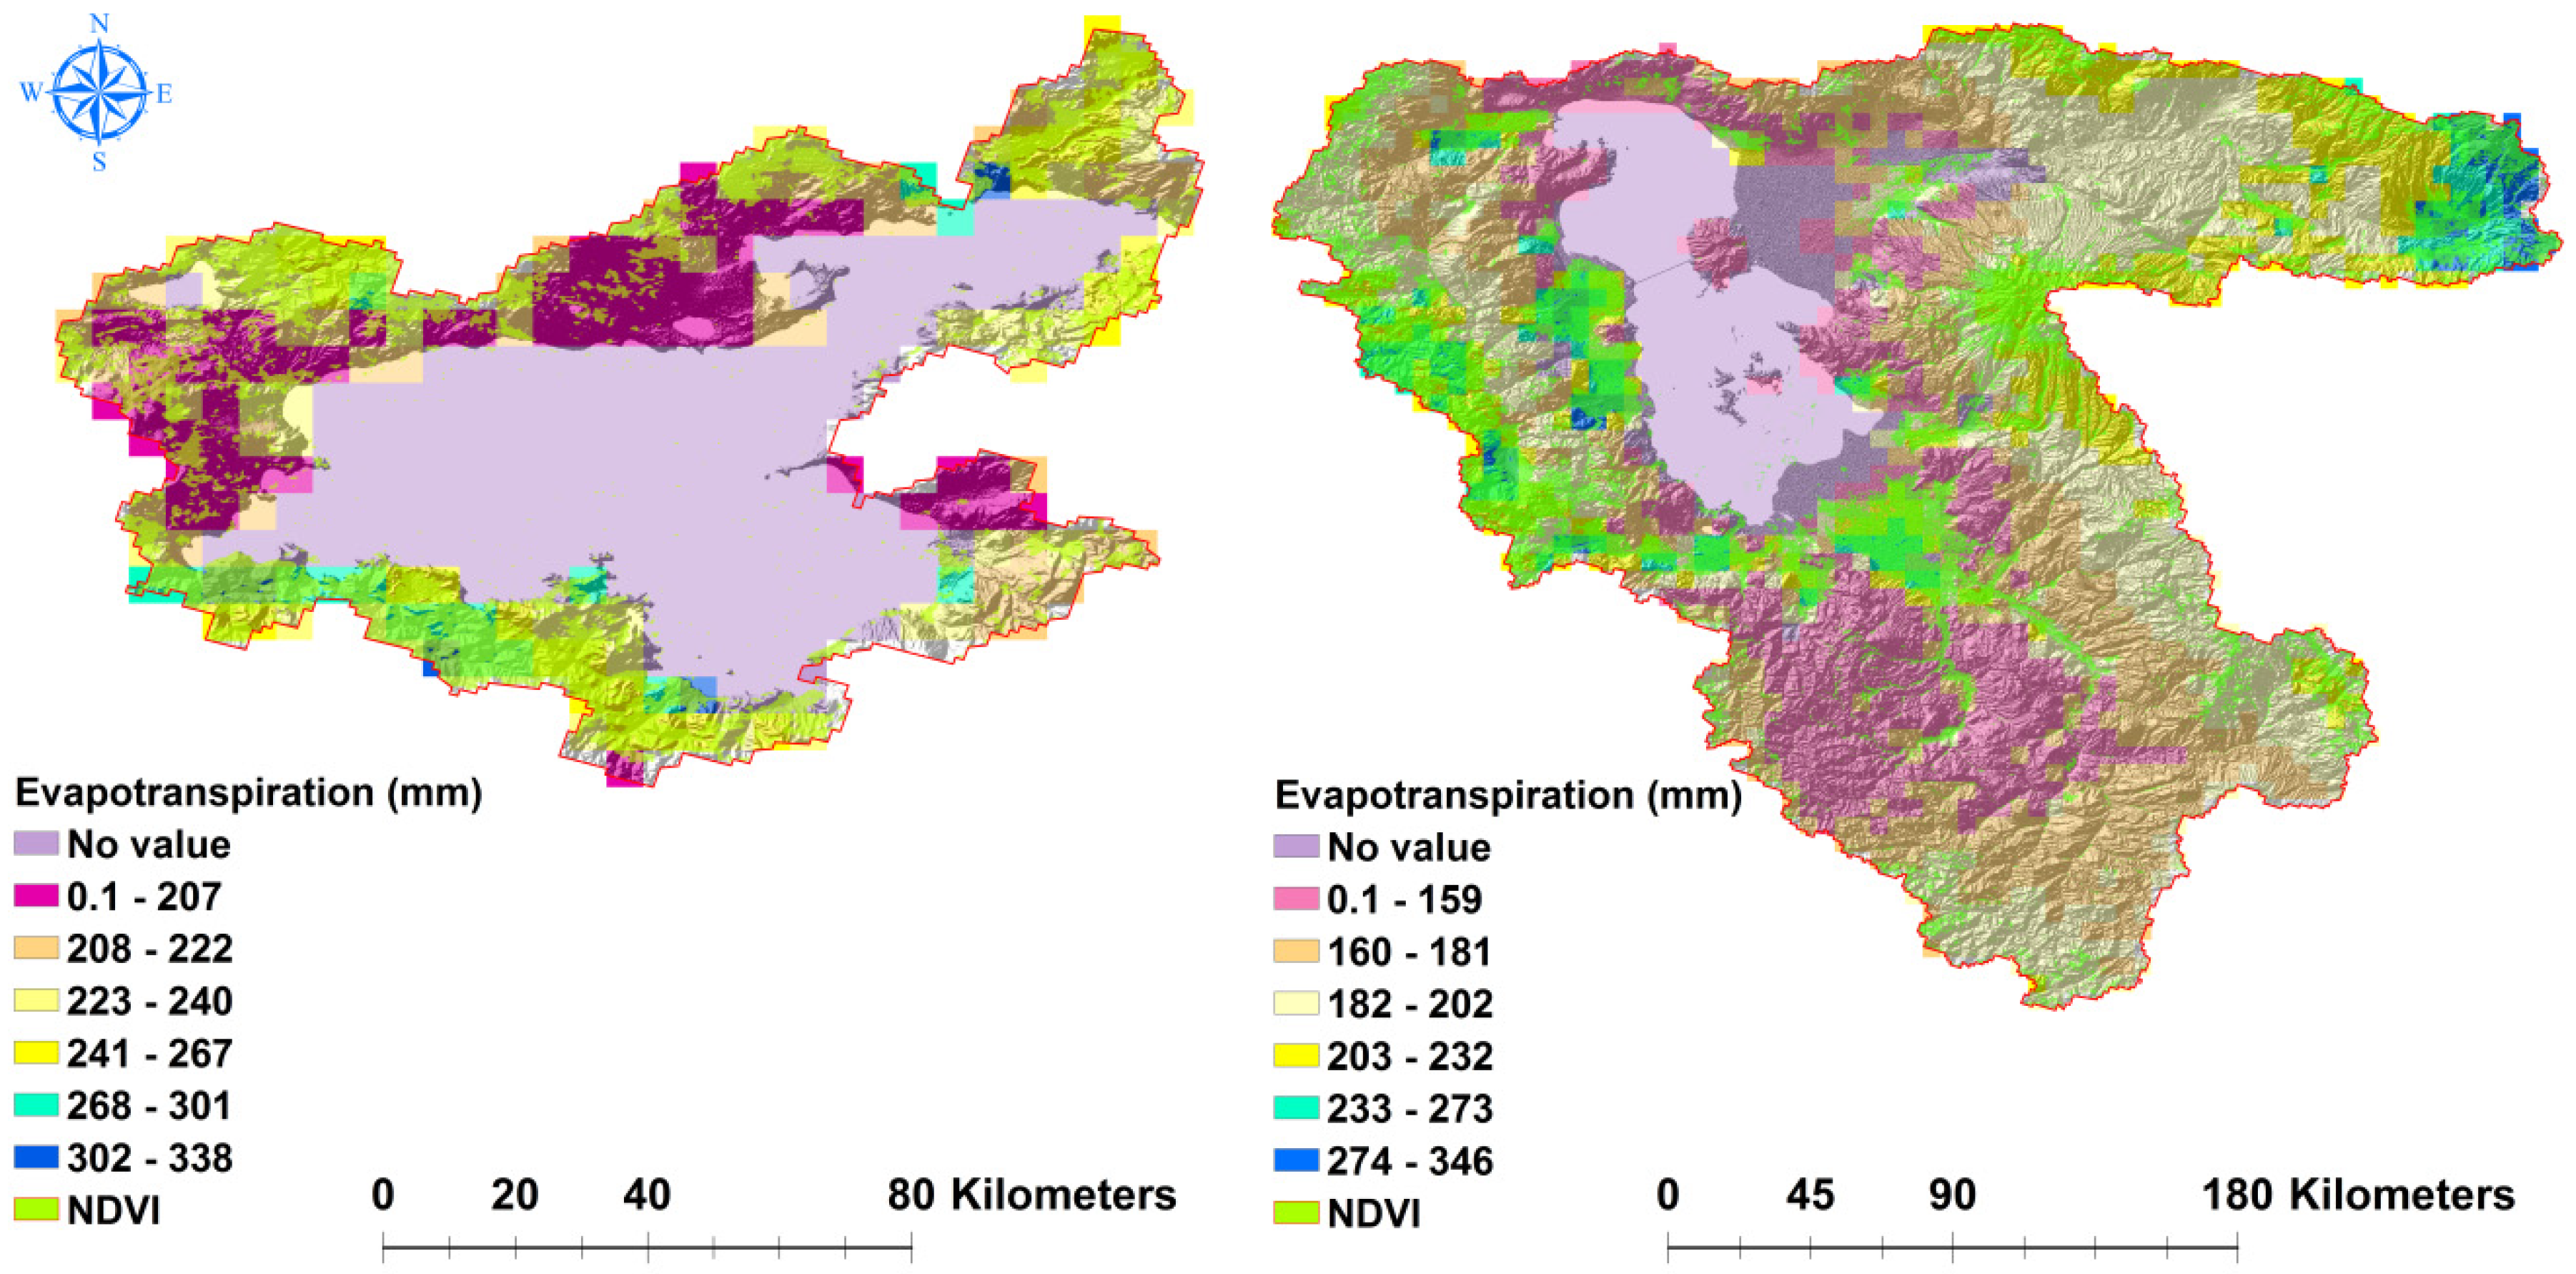
3.3. Satellite-Derived Evapotranspiration (ET)
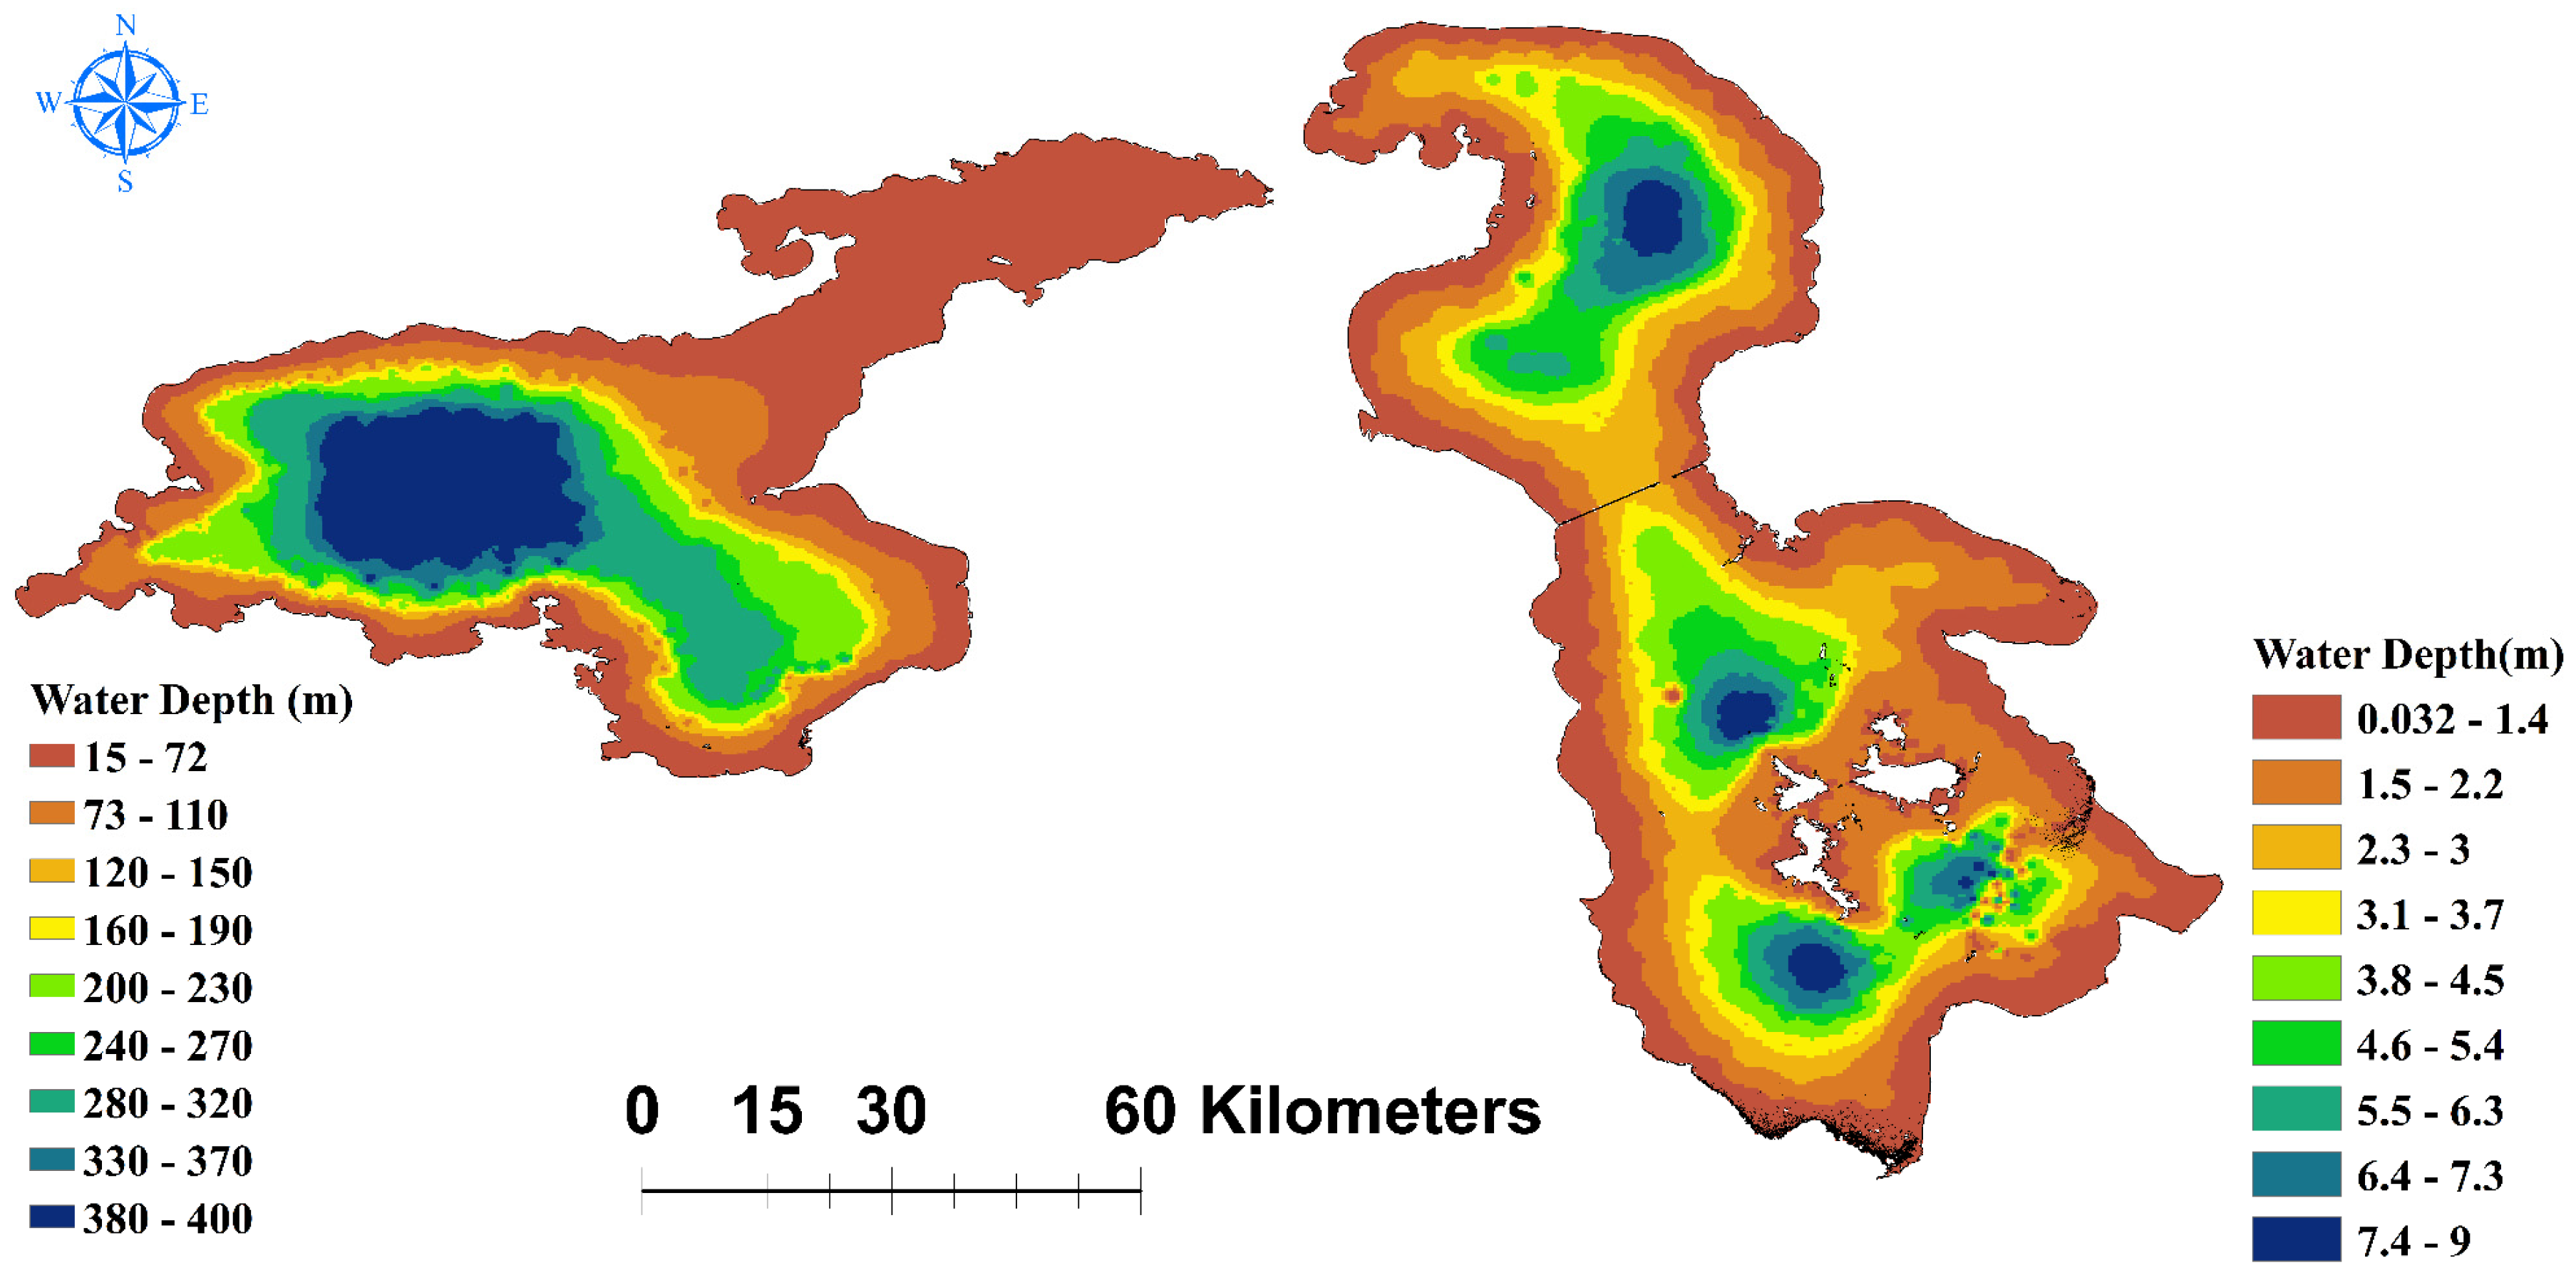
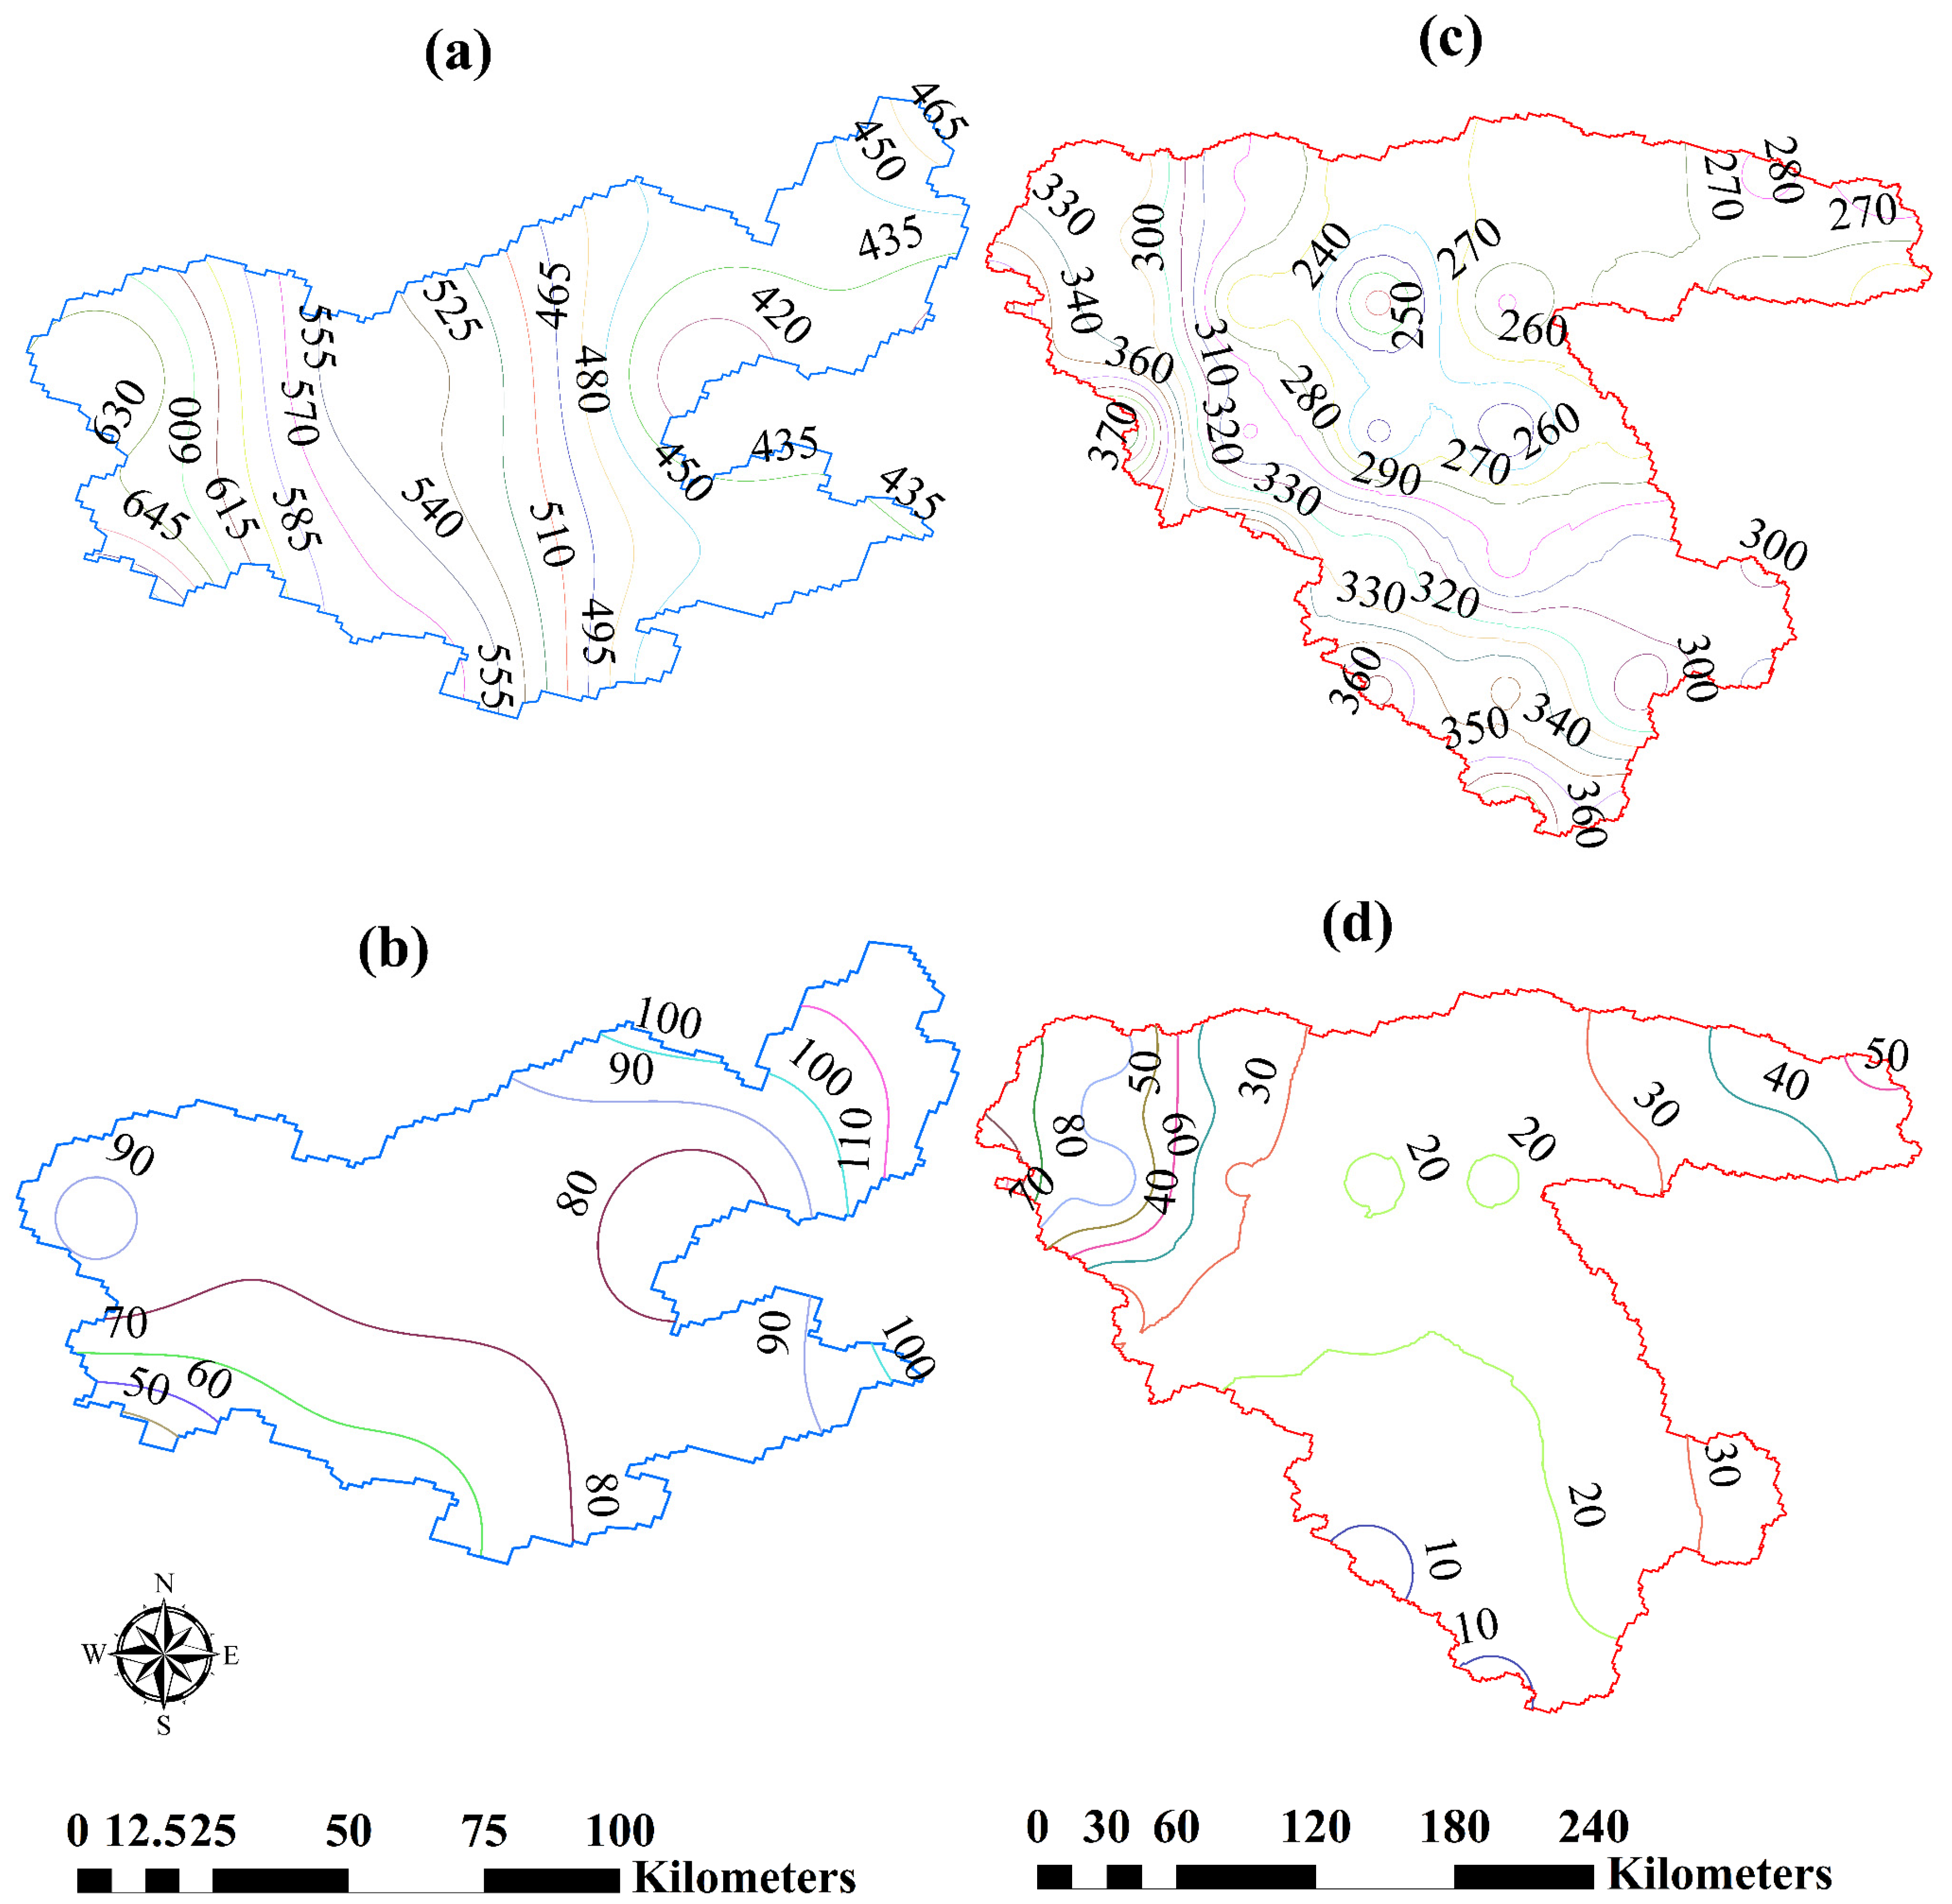
3.4. Spatial Distribution of Water Depth
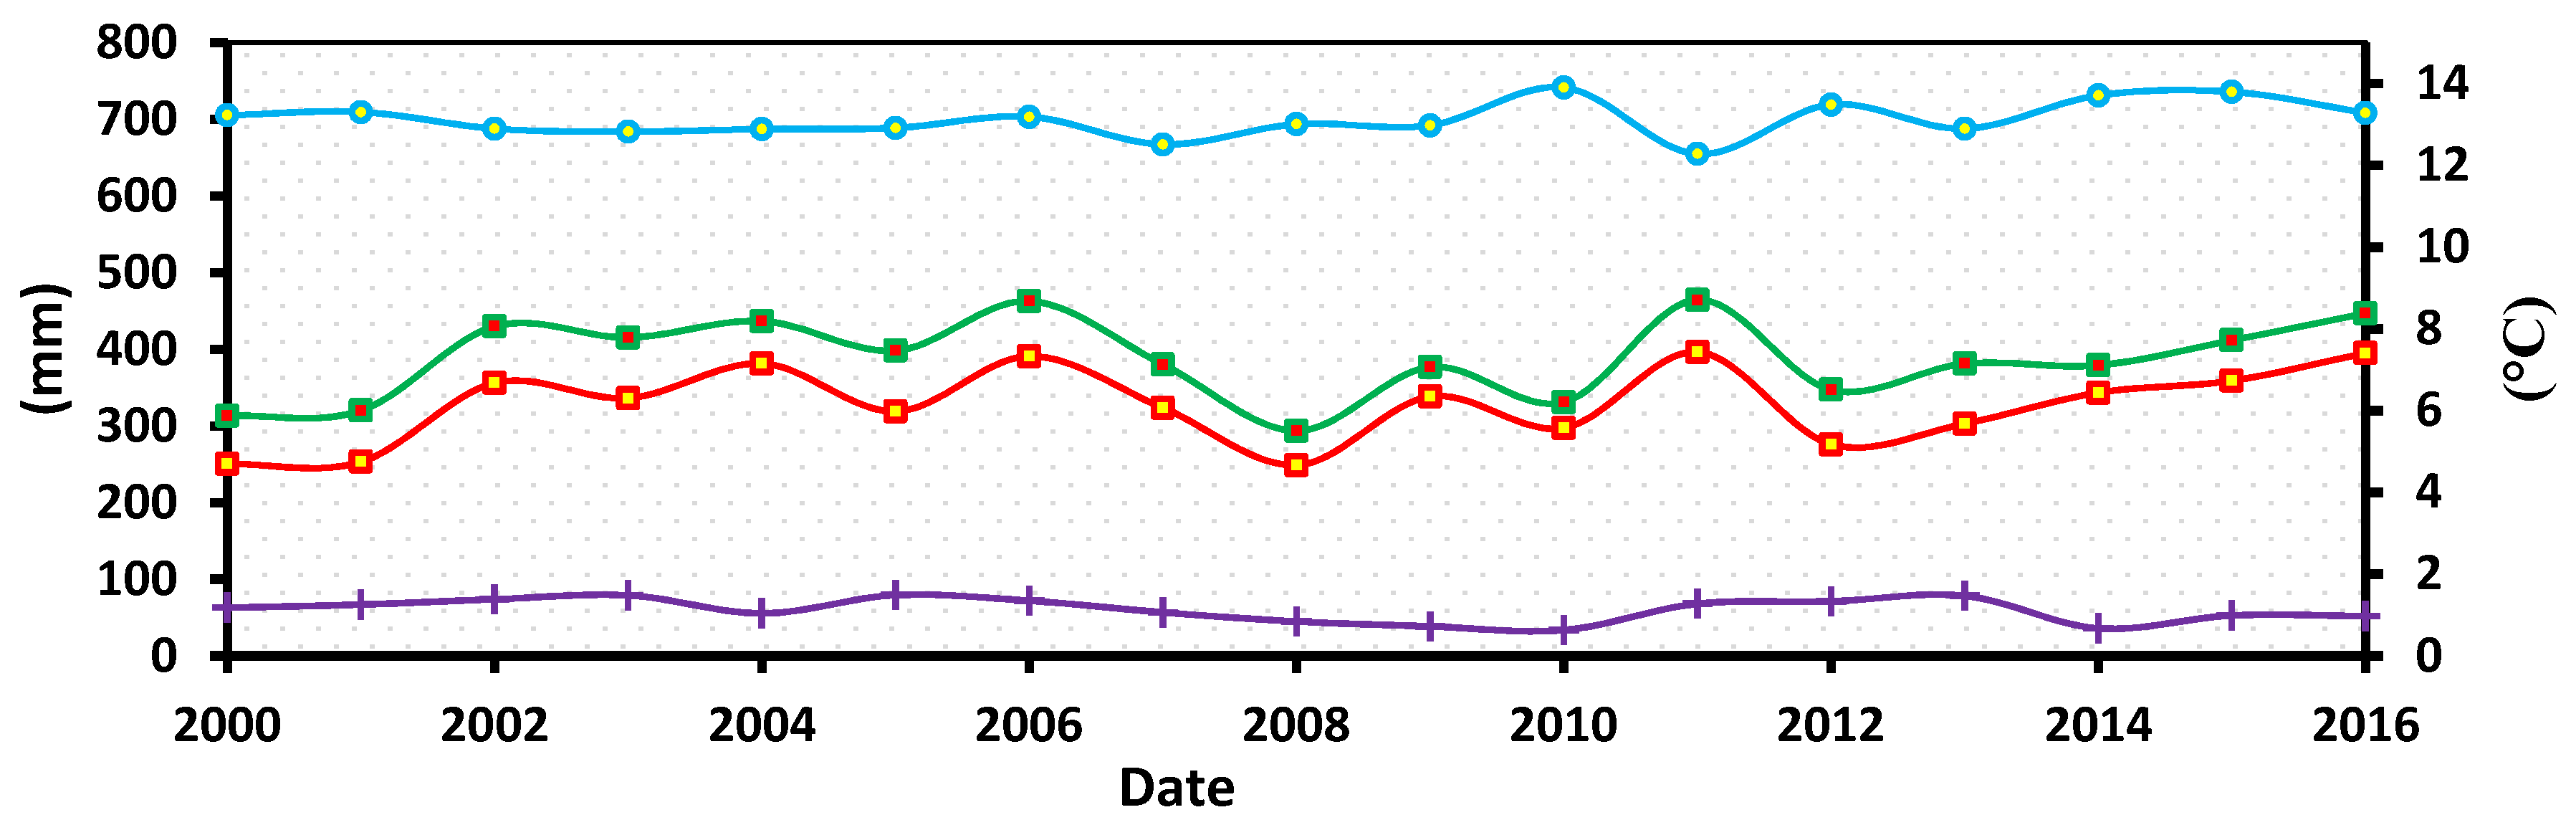
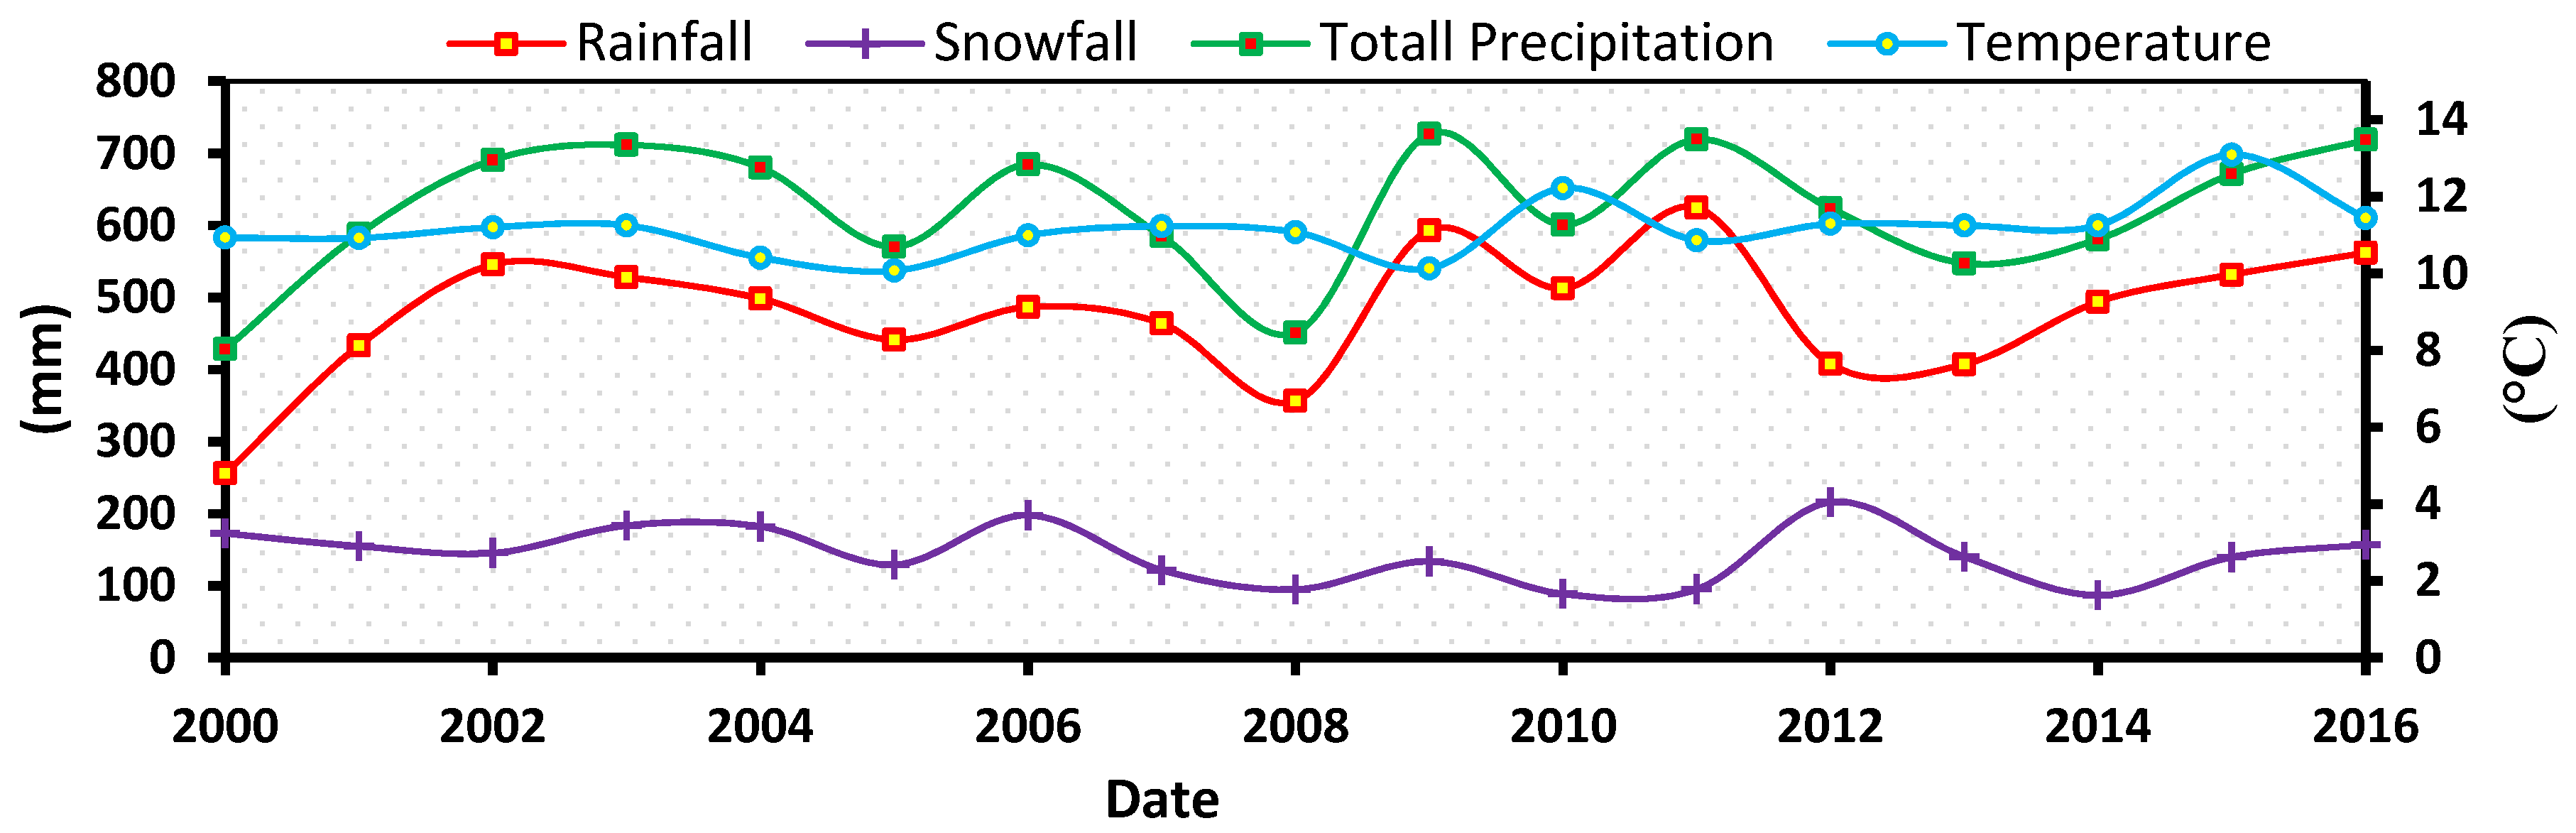
3.5. Precipitation and Temperature
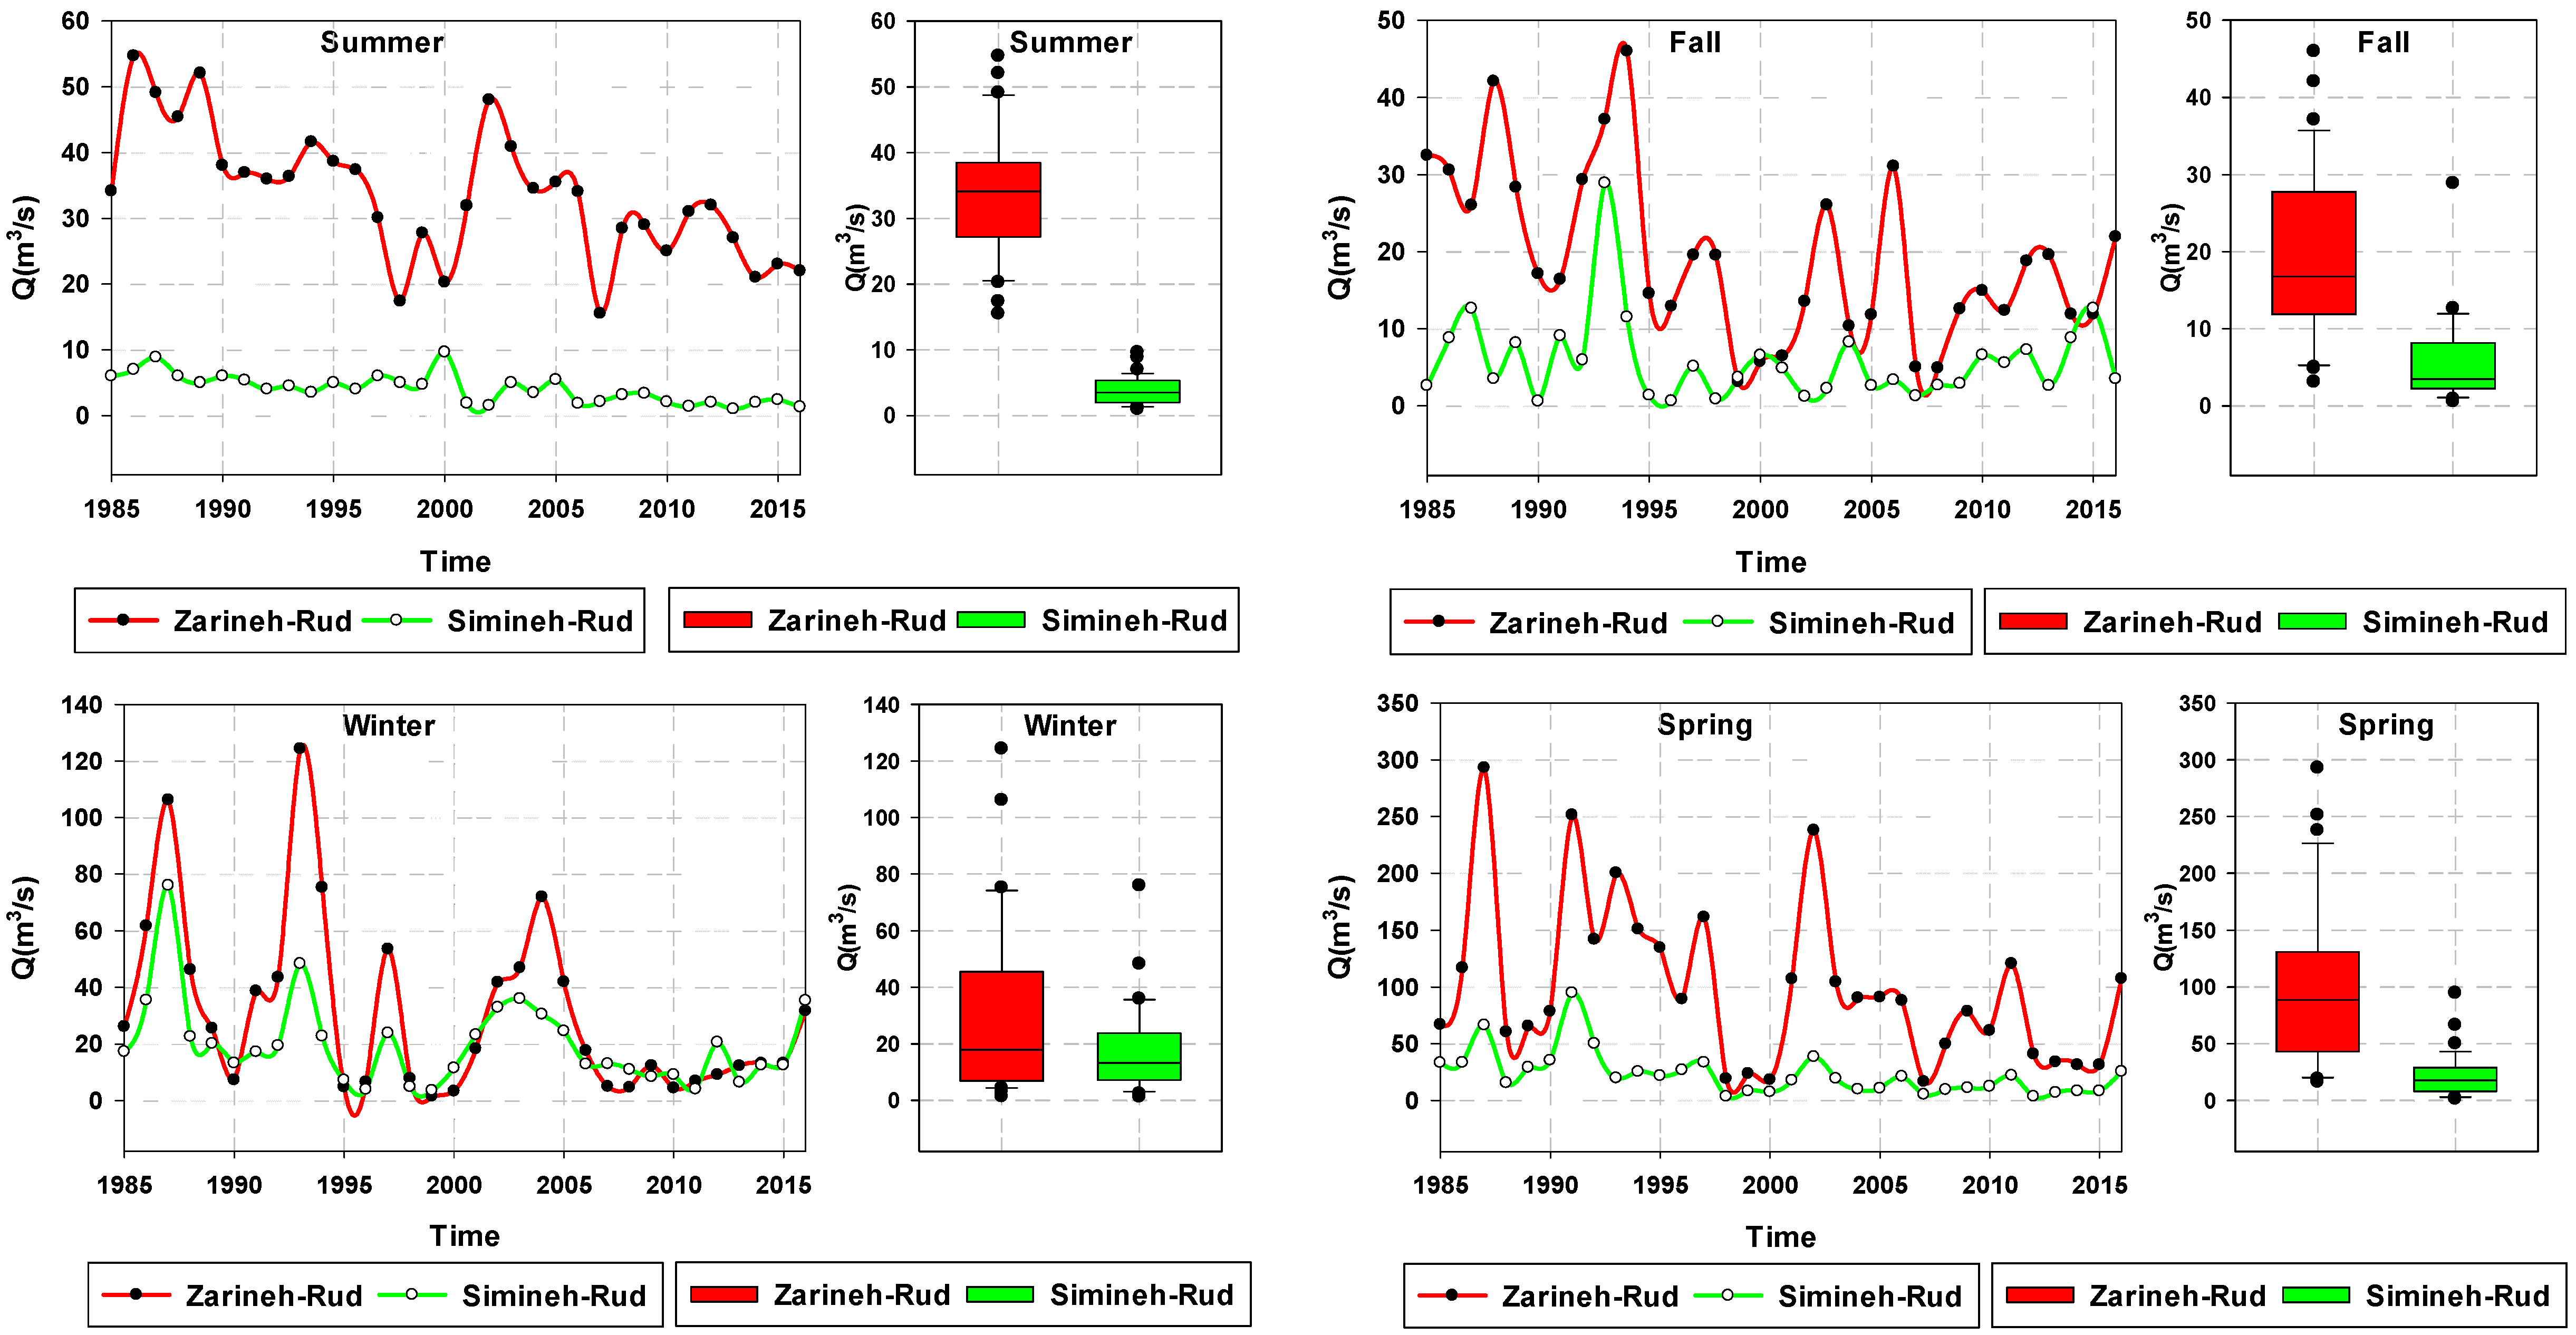
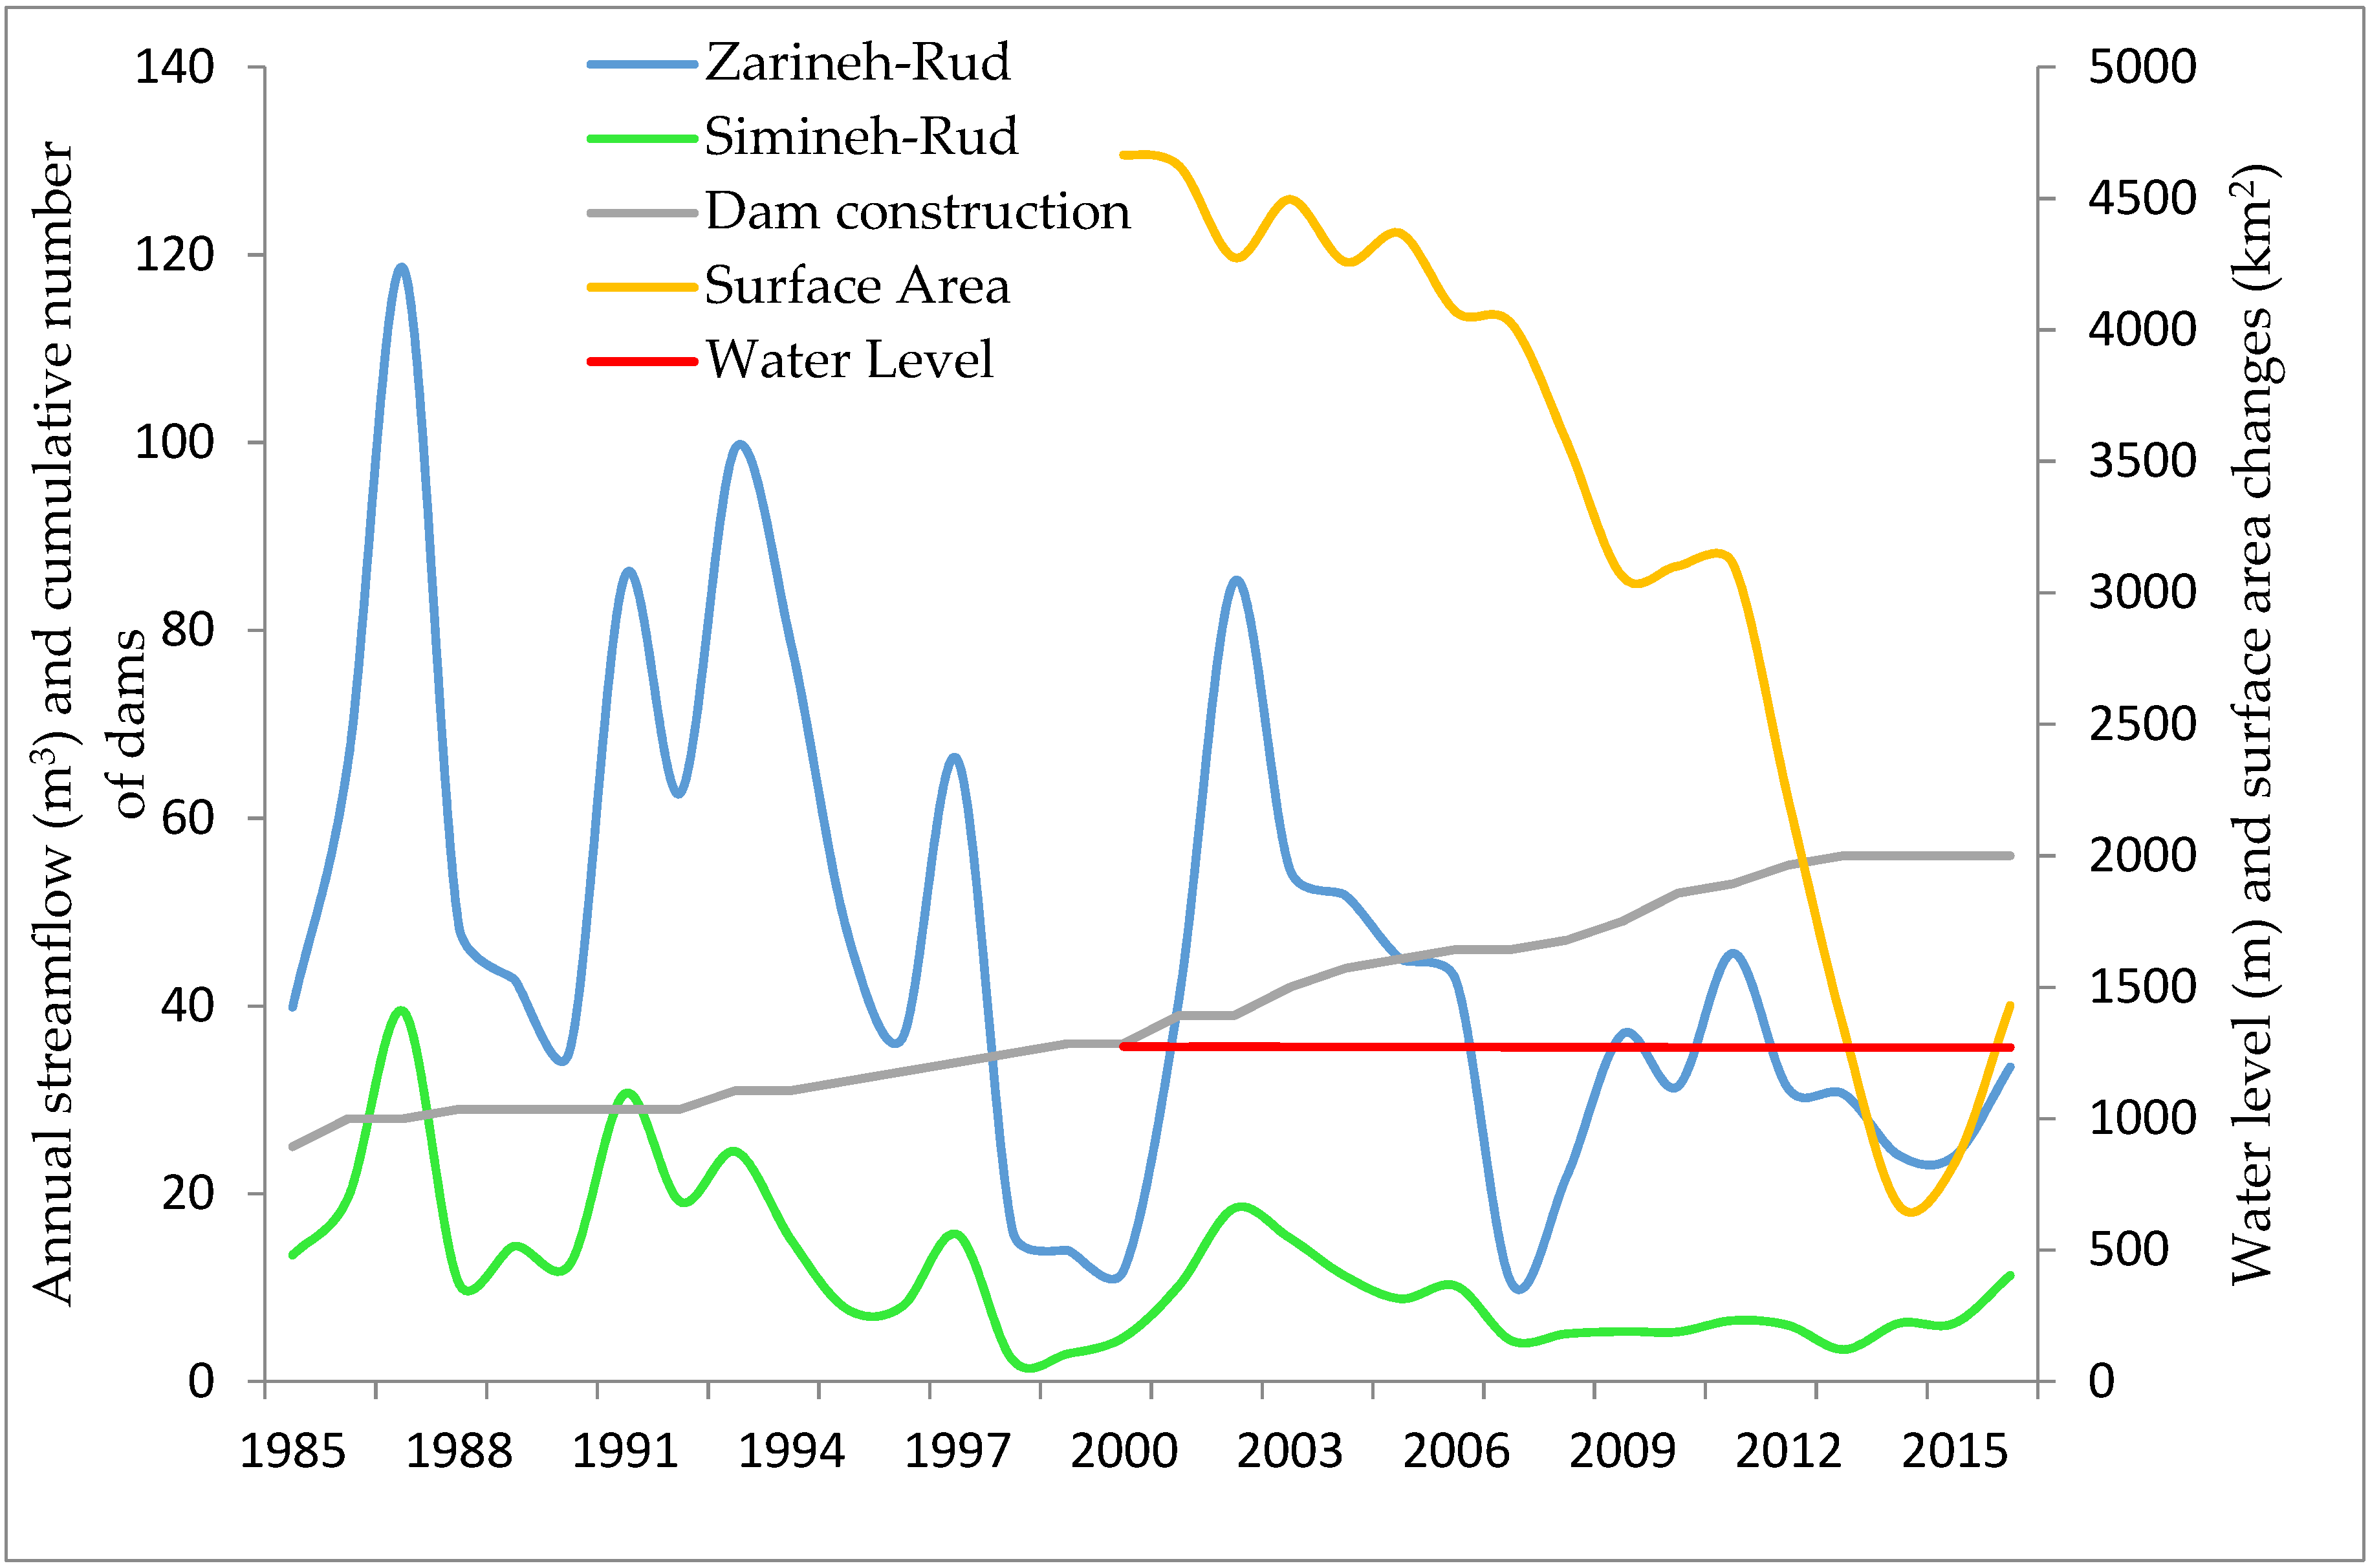
3.6. Stream Flow and Dam Construction
4. Discussion
5. Conclusions
Author Contributions
Funding
Acknowledgments
Conflicts of Interest
References
- Brown, L.C.; Duguay, C.R. The response and role of ice cover in lake-climate interactions. Prog. Phys. Geogr. 2010, 34, 671–704. [Google Scholar] [CrossRef]
- Gross, M. The world’s vanishing lakes. Curr. Biol. 2017, 27, R43–R46. [Google Scholar] [CrossRef]
- Wurtsbaugh, W.A. Management of the Great Salt Lake Ecosystem: Water, Economic Values and Competing Interests. Watershed Sci. Fac. Publ. 2014, 26, 594. Available online: http://digitalcommons.usu.edu/wats_facpub/594 (accessed on 27 May 2020).
- Gao, H.; Bohn, T.J.; Podest, E.; McDonald, K.C.; Lettenmaier, D.P. On the causes of the shrinking of Lake Chad. Environ. Res. Lett. 2011, 6, 034021. [Google Scholar] [CrossRef] [Green Version]
- Wurtsbaugh, W.A.; Miller, C.; Null, S.E.; Derose, R.J.; Wilcock, P.; Hahnenberger, M.; Howe, F.; Moore, J. Decline of the world’s saline lakes. Nat. Geosci. 2017, 10, 816–821. [Google Scholar] [CrossRef]
- Zhang, M.; Wang, S.; Gao, G.; Fu, B.; Ye, Z.; Shen, Q. Exploring responses of lake area to river regulation and implications for lake restoration in arid regions. Ecol. Eng. 2019, 128, 18–26. [Google Scholar] [CrossRef]
- Khazaei, B.; Khatami, S.; Alemohammad, S.H.; Rashidi, L.; Wu, C.; Madani, K.; Kalantari, Z.; Destouni, G.; Aghakouchak, A. Climatic or regionally induced by humans? Tracing hydro-climatic and land-use changes to better understand the Lake Urmia tragedy. J. Hydrol. 2019, 569, 203–217. [Google Scholar] [CrossRef]
- Wilcox, D.A.; Thompson, T.A.; Booth, R.K.; Nicholas, J.R. Lake-level variability and water availability in the Great Lakes. U.S. Geol. Surv. Circ. 2007, 1–29. [Google Scholar] [CrossRef]
- Yin, X.A.; Yang, Z.F. A method to assess the alteration of water-level-fluctuation patterns in lakes. Procedia Environ. Sci. 2012, 13, 2427–2436. [Google Scholar] [CrossRef] [Green Version]
- Kakahaji, H.; Banadaki, H.D.; Kakahaji, A.; Kakahaji, A. Prediction of Urmia Lake Water-Level Fluctuations by Using Analytical, Linear Statistic and Intelligent Methods. Water Resour. Manag. 2013, 27, 4469–4492. [Google Scholar] [CrossRef]
- La Valle, P.D.; Lakhan, V.C.; Trenhaile, A.S. Short term fluctuations of Lake Erie water levels and the El Niño/Southern Oscillation. Great Lakes Geogr. 2000, 7, 1–8. [Google Scholar]
- Ouarda, T.B.M.J.; Ehsanzadeh, E.; Saley, H.M.; Khaliq, N.; Seidou, O.; Charron, C.; Pietroniro, A.; Lee, D. Analysis of Changes in the Great Lakes Net Basin Supply (NBS) Components and Explanatory Variables. 2009, pp. 1–73. Available online: https://www.academia.edu/26609186/Analysis_of_Changes_in_the_Great_Lakes_Net_Basin_Supply_NBS_Components_and_Explanatory_Variables?from_sitemaps=true&version=2 (accessed on 27 May 2020).
- Sellinger, C.E.; Stow, C.A.; Lamon, E.C.; Qian, S.S. Recent water level declines in the Lake Michigan-Huron system. Environ. Sci. Technol. 2008, 42, 367–373. [Google Scholar] [CrossRef] [PubMed]
- Ülgen, U.B.; Franz, S.O.; Biltekin, D.; Çagatay, M.N.; Roeser, P.A.; Doner, L.; Thein, J. Climatic and environmental evolution of Lake Iznik (NW Turkey) over the last ∼4700 years. Quat. Int. 2012, 274, 88–101. [Google Scholar] [CrossRef]
- Jalili, S.; Hamidi, S.A.; Morid, S.; Namdar Ghanbari, R. Comparative analysis of Lake Urmia and Lake Van water level time series. Arab. J. Geosci. 2016, 9, 644. [Google Scholar] [CrossRef]
- Shadkam, S.; Ludwig, F.; van Oel, P.; Kirmit, Ç.; Kabat, P. Impacts of climate change and water resources development on the declining inflow into Iran’s Urmia Lake. J. Great Lakes Res. 2016, 42, 942–952. [Google Scholar] [CrossRef] [Green Version]
- AghaKouchak, A.; Norouzi, H.; Madani, K.; Mirchi, A.; Azarderakhsh, M.; Nazemi, A.; Nasrollahi, N.; Farahmand, A.; Mehran, A.; Hasanzadeh, E. Aral Sea syndrome desiccates Lake Urmia: Call for action. J. Great Lakes Res. 2015, 41, 307–311. [Google Scholar] [CrossRef]
- Barideh, R.; Nasimi, F. Investigating the changes in agricultural land use and actual evapotranspiration of the Urmia Lake basin based on FAO’s WaPOR database. Agric. Water Manag. 2022, 264, 107509. [Google Scholar] [CrossRef]
- Çimen, M.; Kisi, O. Comparison of two different data-driven techniques in modeling lake level fluctuations in Turkey. J. Hydrol. 2009, 378, 253–262. [Google Scholar] [CrossRef]
- EU-WATCH. Available online: http://www.eu-watch.org (accessed on 27 May 2020).
- Weedon, G.P.; Gomes, S.; Viterbo, P.; Shuttleworth, W.J.; Blyth, E.; Österle, H.; Adam, J.C.; Bellouin, N.; Boucher, O.; Best, M. Creation of the WATCH forcing data and its use to assess global and regional reference crop evaporation over land during the twentieth century. J. Hydrometeorol. 2011, 12, 823–848. [Google Scholar] [CrossRef] [Green Version]
- Stahl, K.; Tallaksen, L.M.; Gudmundsson, L.; Christensen, J.H. Streamflow data from small basins: A challenging test to high-resolution regional climate modeling. J. Hydrometeorol. 2011, 12, 900–912. [Google Scholar] [CrossRef]
- Jiménez-Muñoz, J.C. Correction to “A generalized single-channel method for retrieving land surface temperature from remote sensing data” by Juan C. Jiménez-Muñoz and José A. Sobrino. J. Geophys. Res. 2004, 109, 8112. [Google Scholar] [CrossRef] [Green Version]
- Weng, Q.; Lu, D.; Schubring, J. Estimation of land surface temperature-vegetation abundance relationship for urban heat island studies. Remote Sens. Environ. 2004, 89, 467–483. [Google Scholar] [CrossRef]
- Theia. Available online: http://hydroweb.theia-land.fr/ (accessed on 27 May 2020).
- Zambrano-Bigiarini, M. Goodness-of-Fit Functions for Comparison of Simulated and Observed Hydrological Time Series. 2020, Volume 22. Available online: https://github.com/hzambran/hydroGOF (accessed on 27 May 2020).
- Park, E.; Lewis, Q.W.; Sanwlani, N. Large lake gauging using fractional imagery. J. Environ. Manage. 2019, 231, 687–693. [Google Scholar] [CrossRef]
- USGS. Available online: https://earthexplorer.usgs.gov/ (accessed on 27 May 2020).
- NASA Earth Data Search. Available online: https://search.earthdata.nasa.gov/search (accessed on 27 May 2020).
- Zhang, Z.; Teng, H. An inversion method of remote sensing water depth based on transmission bands ratio. In Proceedings of the 2011 Fourth International Joint Conference on Computational Sciences and Optimization, Kunming/Lijiang, China, 15–19 April 2011; pp. 1002–1006. [Google Scholar]
- Le, Y.; Hu, M.; Chen, Y.; Yan, Q.; Zhang, D.; Li, S.; Zhang, X.; Wang, L. Investigating the Shallow-Water Bathymetric Capability of Zhuhai-1 Spaceborne Hyperspectral Images Based on ICESat-2 Data and Empirical Approaches: A Case Study in the South China Sea. Remote Sens. 2022, 14, 3406. [Google Scholar] [CrossRef]
- Nan, Y.; Jianhui, L.; Wenbo, M.; Wangjun, L.; Di, W.; Wanchao, G.; Changhao, S. Water depth retrieval models of East Dongting Lake, China, using GF-1 multi-spectral remote sensing images. Glob. Ecol. Conserv. 2020, 22, e01004. [Google Scholar] [CrossRef]
- Urmia Lake Restoration Program. 2015. Available online: http://ulrp.sharif.ir/en (accessed on 3 September 2016).
- Fathian, F.; Morid, S.; Kahya, E. Identification of trends in hydrological and climatic variables in Urmia Lake basin, Iran. Theor. Appl. Climatol. 2015, 119, 443–464. [Google Scholar] [CrossRef]
- Hassanzadeh, E.; Zarghami, M.; Hassanzadeh, Y. Determining the Main Factors in Declining the Urmia Lake Level by Using System Dynamics Modeling. Water Resour. Manag. 2012, 26, 129–145. [Google Scholar] [CrossRef]
- Jalili, S.; Hamidi, S.A.; Namdar Ghanbari, R. Climate variability and anthropogenic effects on Lake Urmia water level fluctuations, northwestern Iran. Hydrol. Sci. J. 2016, 61, 1759–1769. [Google Scholar] [CrossRef] [Green Version]
- Chaudhari, S.; Felfelani, F.; Shin, S.; Pokhrel, Y. Climate and anthropogenic contributions to the desiccation of the second largest saline lake in the twentieth century. J. Hydrol. 2018, 560, 342–353. [Google Scholar] [CrossRef]
- Mehrian, M.R.; Hernandez, R.P.; Yavari, A.R.; Faryadi, S.; Salehi, E. Investigating the causality of changes in the landscape pattern of Lake Urmia basin, Iran using remote sensing and time series analysis. Environ. Monit. Assess. 2016, 188, 1–13. [Google Scholar] [CrossRef] [PubMed]
- Xu, X.; Shrestha, S.; Gilani, H.; Gumma, M.K.; Siddiqui, B.N.; Jain, A.K. Dynamics and drivers of land use and land cover changes in Bangladesh. Reg. Environ. Chang. 2020, 20, 1–11. [Google Scholar] [CrossRef]
- Orth, R.; Destouni, G. Drought reduces blue-water fluxes more strongly than green-water fluxes in Europe. Nat. Commun. 2018, 9, 1–8. [Google Scholar] [CrossRef] [PubMed]
- Adam, J.C.; Haddeland, I.; Su, F.; Lettenmaier, D.P. Simulation of reservoir influences on annual and seasonal streamflow changes for the Lena, Yenisei, and Ob’ rivers. J. Geophys. Res. Atmos. 2007, 112, 1–22. [Google Scholar] [CrossRef]
- Fathian, F.; Dehghan, Z.; Eslamian, S. Analysis of water level changes in Lake Urmia based on data characteristics and non-parametric test. Int. J. Hydrol. Sci. Technol. 2014, 4, 18–38. [Google Scholar] [CrossRef]
- Naboureh, A.; Li, A.; Ebrahimy, H.; Bian, J.; Azadbakht, M.; Amani, M.; Lei, G.; Nan, X. Assessing the effects of irrigated agricultural expansions on Lake Urmia using multi-decadal Landsat imagery and a sample migration technique within Google Earth Engine. Int. J. Appl. Earth Obs. Geoinf. 2021, 105, 102607. [Google Scholar] [CrossRef]


| Dataset | Date | Source Reference | Band Number |
|---|---|---|---|
| Landsat 8 OLI * (path/row: 168/34, 169/33, 169/34 and 170/33, 171/33) | September 2016 | WGS84 | 3, 5, 10 and 11 |
| - | - | - | |
| - | - | - | |
| Landsat 8 OLI * (path/row: 168/34, 169/33, 169/34 and 170/33, 171/33) | September 2013 | WGS84 | 3, 5, 10 and 11 |
| Landsat 7 ETM †,* (path/row: 168/34, 169/33, 169/34 and 170/33, 171/33) | September 2012 | WGS84 | 2, 5 and 6 |
| - | - | - | - |
| - | - | - | - |
| Landsat 7 ETM †,* (path/row: 168/34, 169/33, 169/34 and 170/33, 171/33) | September 2000 | WGS84 | 2, 5 and 6 |
| Band | Red | Green | Blue | NIR | In (Red) | In (Green) | In (Blue) | In (NIR) |
|---|---|---|---|---|---|---|---|---|
| Correlation coefficient | 0.79 | 0.93 | 0.84 | 0.41 | 0.83 | 0.91 | 0.81 | 0.087 |
| Combination of bands | Ln (red/green) | Ln (red/blue) | Ln (red/NIR) | Ln (blue/green) | Ln (blue/NIR) | Ln (green/NIR) | ||
| Correlation coefficient | 0.87 | 0.92 | 0.03 | 0.56 | 0.311 | 0.47 | ||
Publisher’s Note: MDPI stays neutral with regard to jurisdictional claims in published maps and institutional affiliations. |
© 2022 by the authors. Licensee MDPI, Basel, Switzerland. This article is an open access article distributed under the terms and conditions of the Creative Commons Attribution (CC BY) license (https://creativecommons.org/licenses/by/4.0/).
Share and Cite
Khoshnood, S.; Lotfata, A.; Sharifi, A. Unsustainable Anthropogenic Activities: A Paired Watershed Approach of Lake Urmia (Iran) and Lake Van (Turkey). Remote Sens. 2022, 14, 5269. https://doi.org/10.3390/rs14205269
Khoshnood S, Lotfata A, Sharifi A. Unsustainable Anthropogenic Activities: A Paired Watershed Approach of Lake Urmia (Iran) and Lake Van (Turkey). Remote Sensing. 2022; 14(20):5269. https://doi.org/10.3390/rs14205269
Chicago/Turabian StyleKhoshnood, Sajad, Aynaz Lotfata, and Ayyoob Sharifi. 2022. "Unsustainable Anthropogenic Activities: A Paired Watershed Approach of Lake Urmia (Iran) and Lake Van (Turkey)" Remote Sensing 14, no. 20: 5269. https://doi.org/10.3390/rs14205269
APA StyleKhoshnood, S., Lotfata, A., & Sharifi, A. (2022). Unsustainable Anthropogenic Activities: A Paired Watershed Approach of Lake Urmia (Iran) and Lake Van (Turkey). Remote Sensing, 14(20), 5269. https://doi.org/10.3390/rs14205269