
A GIS-Based Spatiotemporal Impact Assessment of Droughts in the Hyper-Saline Urmia Lake Basin on the Hydro-Geochemical Quality of Nearby Aquifers


Abstract
:1. Introduction
2. Study Area
3. Materials and Methods
3.1. Geological Setting of the ULB
3.2. Dataset
3.3. Water Quality Index Implementation
3.4. Data Analysis
4. Results
4.1. Groundwater Quality
4.2. Groundwater Quality Analysis
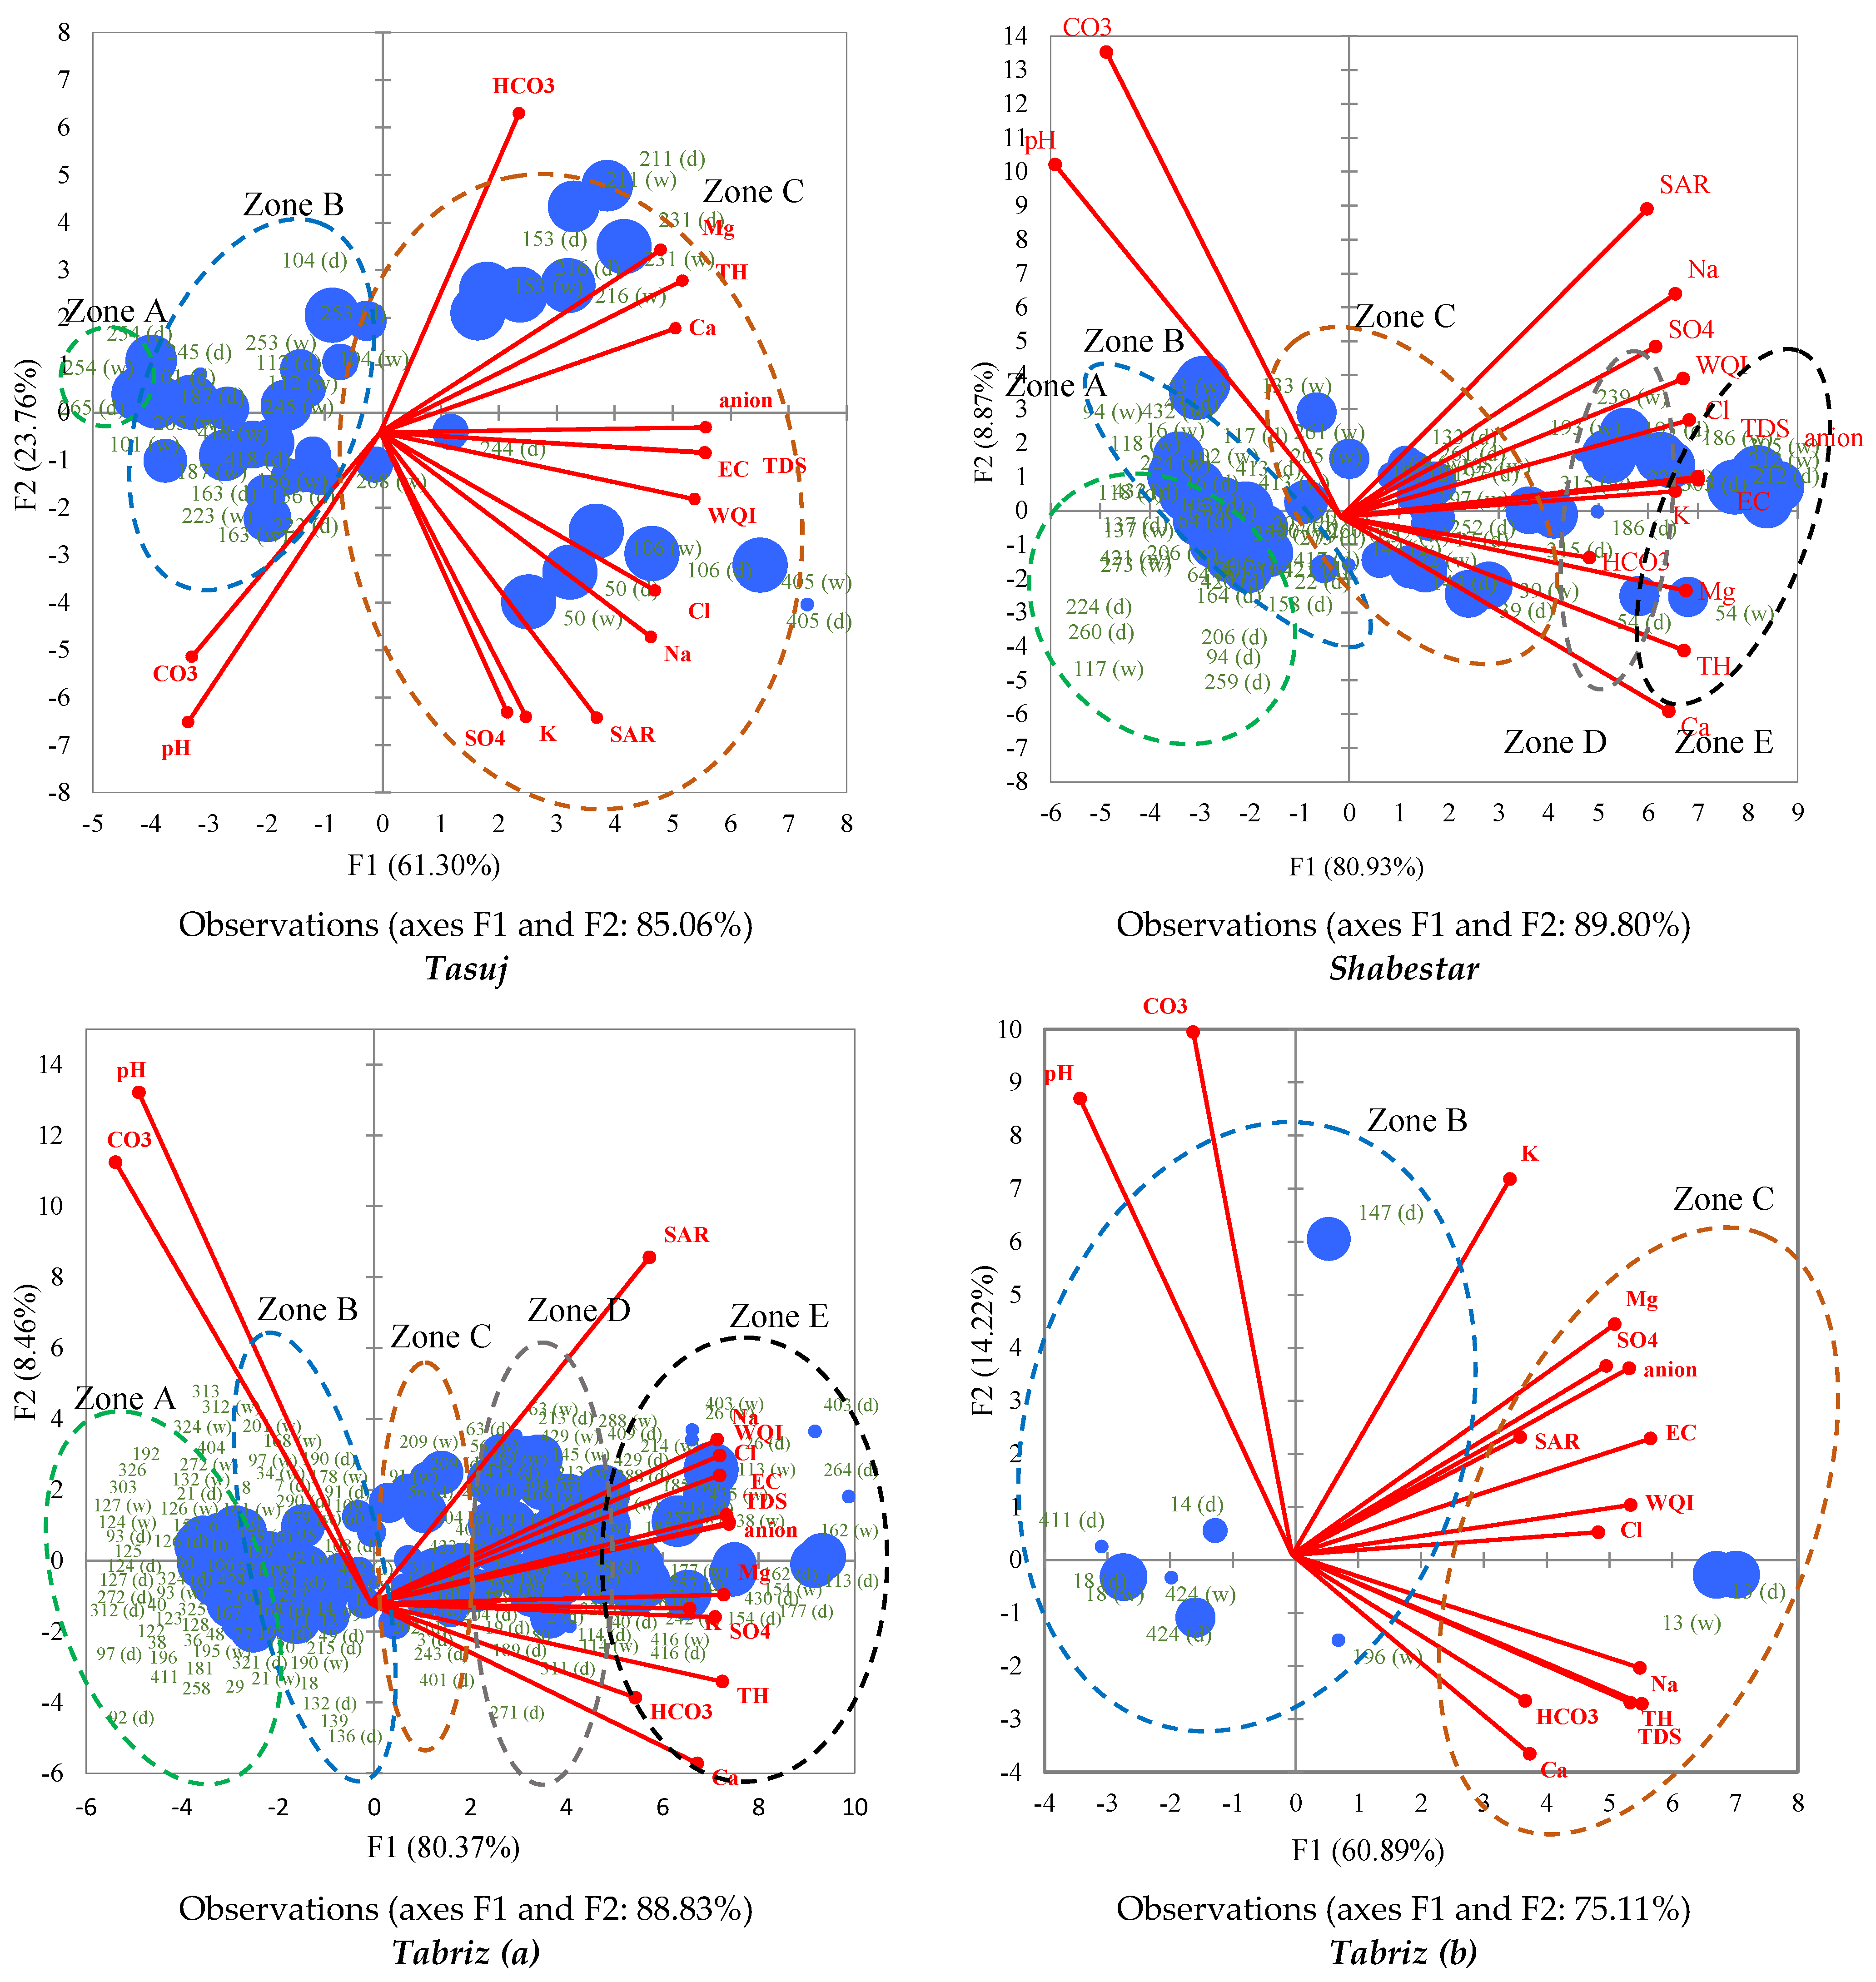
4.2.1. Tasuj Aquifer
4.2.2. Shabestar-Sufian Aquifer
4.2.3. Tabriz Aquifer
4.2.4. Shiramin Aquifer
4.2.5. Azarshahr Aquifer
4.2.6. Maragheh Aquifer
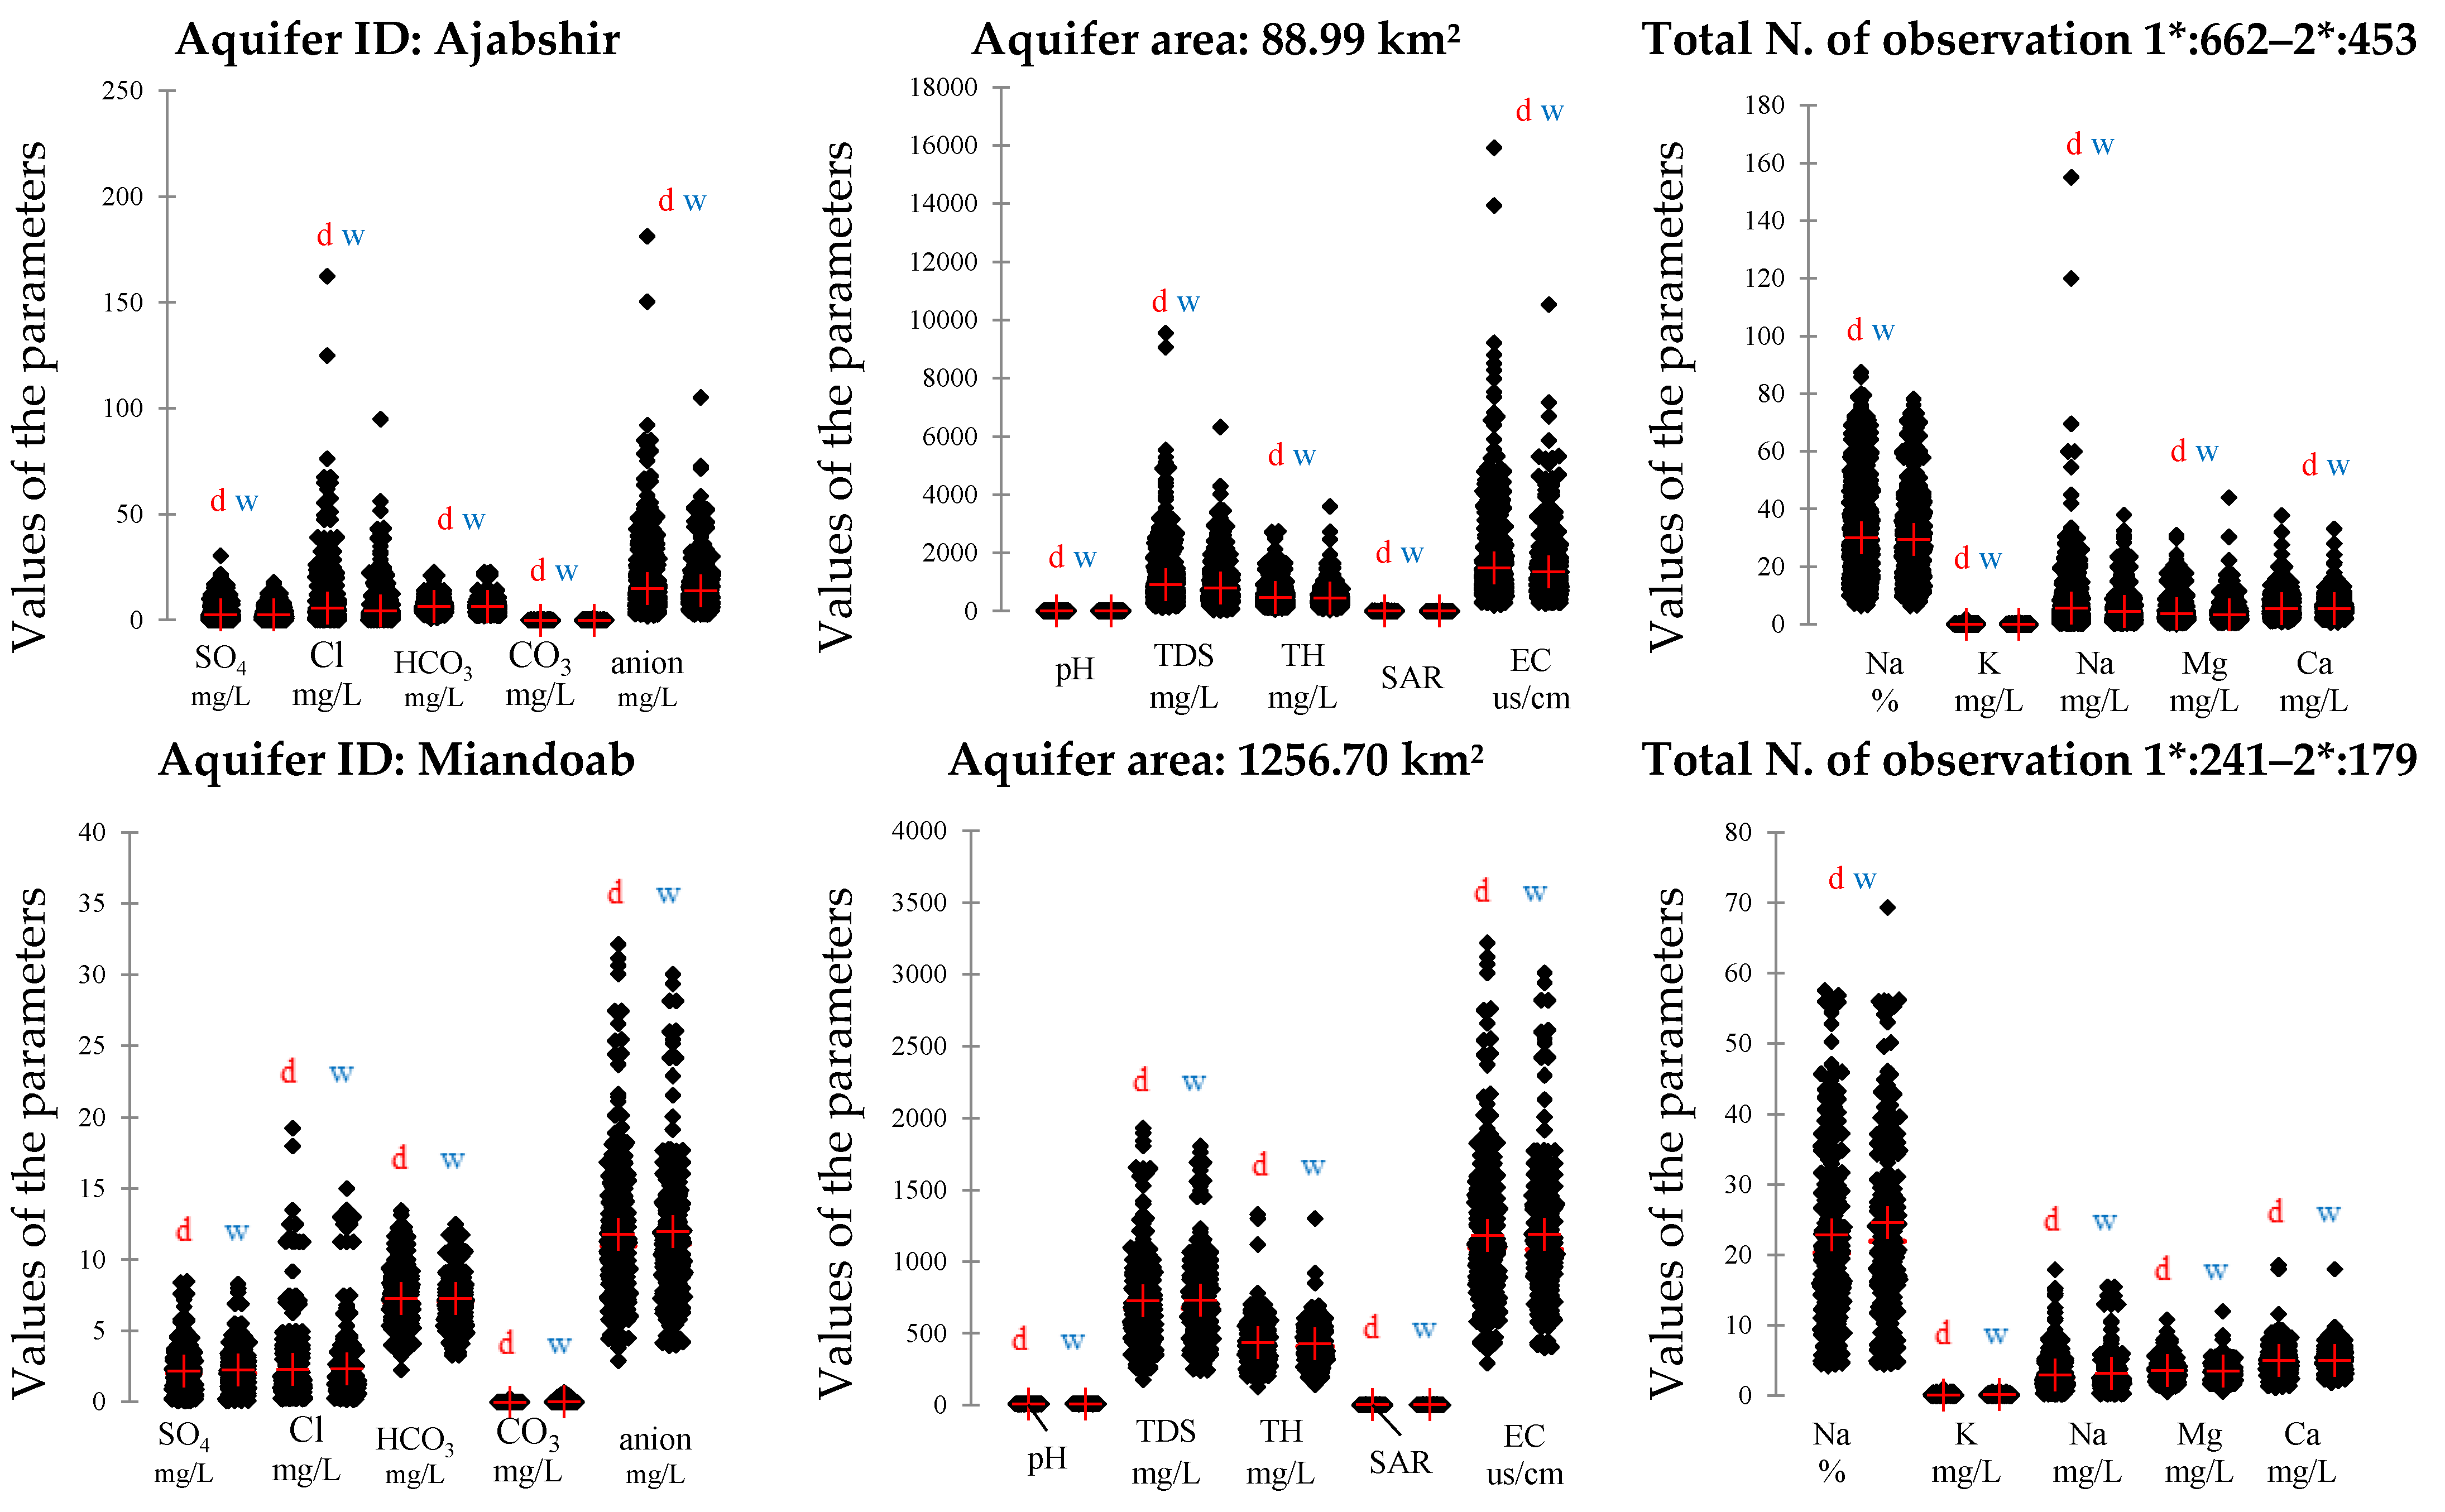
4.2.7. Ajabshir Aquifer
4.2.8. Miandoab Aquifer
5. Discussion
6. Conclusions and Outlook
Author Contributions
Funding
Data Availability Statement
Conflicts of Interest
References
- Silva, M.I.; Gonçalves, A.M.L.; Lopes, W.A.; Lima, M.T.V.; Costa, C.T.F.; Paris, M.; Firmino, P.R.A.; De Paula Filho, F.J. Assessment of groundwater quality in a Brazilian semiarid basin using an integration of GIS, water quality index and multivariate statistical techniques. J. Hydrol. 2021, 598, 126346. [Google Scholar] [CrossRef]
- Hasan, M.S.U.; Rai, A.K. Groundwater quality assessment in the Lower Ganga Basin using entropy information theory and GIS. J. Clean. Prod. 2020, 274, 123077. [Google Scholar] [CrossRef]
- Al-Taani, A.A.; Nazzal, Y.; Howari, F.M. Groundwater scarcity in the Middle East. In Global Groundwater—Source, Scarcity, Sustainability, Security, and Solutions; Elsevier: Amsterdam, The Netherlands, 2021; pp. 163–175. [Google Scholar]
- Michel, D. Iran’s Impending Water Crisis. In Water, Security and US Foreign Policy; Routledge: Abingdon, UK, 2017; 168p. [Google Scholar]
- Lehane, S. The Iranian Water Crisis; Strategic Analysis Paper; Future Directions International International Pty Ltd.: Perth, Australia, 2014; p. 11. [Google Scholar]
- Wang, H.; Xu, J.; Sheng, L.; Ma, L.; Liu, X. Time-space analysis of groundwater in China plain area and its water quantity balance analysis. Arab. J. Geosci. 2020, 13, 92. [Google Scholar] [CrossRef]
- Ávila-García, D.; Morató, J.; Pérez-Maussán, A.I.; Santillán-Carvantes, P.; Alvarado, J.; Comín, F.A. Impacts of alternative land-use policies on water ecosystem services in the Río Grande de Comitán-Lagos de Montebello watershed, Mexico. Ecosyst. Serv. 2020, 45, 101179. [Google Scholar] [CrossRef]
- Heydarirad, L.; Mosaferi, M.; Pourakbar, M.; Esmailzadeh, N.; Maleki, S. Groundwater salinity and quality assessment using multivariate statistical and hydrogeochemical analysis along the Urmia Lake coastal in Azarshahr plain, North West of Iran. Environ. Earth Sci. 2019, 78, 670. [Google Scholar] [CrossRef]
- Mallick, J.; Singh, C.K.; Almesfer, M.K.; Kumar, A.; Khan, R.A.; Islam, S.; Rahman, A. Hydro-geochemical assessment of groundwater quality in Aseer Region, Saudi Arabia. Water 2018, 10, 1847. [Google Scholar] [CrossRef] [Green Version]
- Srebotnjak, T.; Carr, G.; de Sherbinin, A.; Rickwood, C. A global Water Quality Index and hot-deck imputation of missing data. Ecol. Indic. 2012, 17, 108–119. [Google Scholar] [CrossRef]
- Forootan, E.; Rietbroek, R.; Kusche, J.; Sharifi, M.; Awange, J.; Schmidt, M.; Omondi, P.; Famiglietti, J. Separation of large scale water storage patterns over Iran using GRACE, altimetry and hydrological data. Remote Sens. Environ. 2014, 140, 580–595. [Google Scholar] [CrossRef] [Green Version]
- Sima, S.; Rosenberg, D.E.; Wurtsbaugh, W.A.; Null, S.E.; Kettenring, K.M. Managing Lake Urmia, Iran for diverse restoration objectives: Moving beyond a uniform target lake level. J. Hydrol. Reg. Stud. 2021, 35, 100812. [Google Scholar] [CrossRef]
- Valiallahi, J. Evaluating groundwater level and water-quality variation in Oshnaveh–Naqadeh Plain, Urmia Lake basin, northwestern Iran. Int. J. Energy Water Resour. 2020, 4, 27–35. [Google Scholar] [CrossRef]
- Feizizadeh, B.; Garajeh, M.K.; Lakes, T.; Blaschke, T. A deep learning convolutional neural network algorithm for detecting saline flow sources and mapping the environmental impacts of the Urmia Lake drought in Iran. Catena 2021, 207, 105585. [Google Scholar] [CrossRef]
- Garajeh, M.K.; Malakyar, F.; Weng, Q.; Feizizadeh, B.; Blaschke, T.; Lakes, T. An automated deep learning convolutional neural network algorithm applied for soil salinity distribution mapping in Lake Urmia, Iran. Sci. Total Environ. 2021, 778, 146253. [Google Scholar] [CrossRef] [PubMed]
- Kamran, K.V.; Khorrami, B. Change Detection and Prediction of Urmia Lake and its Surrounding Environment during the Past 60 Years Applying Geobased Remote Sensing Analysis. Int. Arch. Photogramm. Remote Sens. Spat. Inf. Sci. 2018, 42, 519–525. [Google Scholar] [CrossRef] [Green Version]
- Yadav, K.K.; Gupta, N.; Kumar, V.; Choudhary, P.; Khan, S.A. GIS-based evaluation of groundwater geochemistry and statistical determination of the fate of contaminants in shallow aquifers from different functional areas of Agra city, India: Levels and spatial distributions. RSC Adv. 2018, 8, 15876–15889. [Google Scholar] [CrossRef] [Green Version]
- Zarghami, M. Effective watershed management: Case study of Urmia Lake, Iran. Lake Reserv. Manag. 2011, 27, 87–94. [Google Scholar] [CrossRef]
- Abadi, B. The determining factors of farmers’ water conservation behavior in agricultural sector: A case from farmers of the Southern Basin of Lake Urmia. Azarian J. Agric. 2017, 4, 110–126. [Google Scholar]
- Vaheddoost, B.; Aksoy, H. Interaction of groundwater with Lake Urmia in Iran. Hydrol. Process. 2018, 32, 3283–3295. [Google Scholar] [CrossRef]
- Machiwal, D.; Jha, M.K. Identifying sources of groundwater contamination in a hard-rock aquifer system using multivariate statistical analyses and GIS-based geostatistical modeling techniques. J. Hydrol. Reg. Stud. 2015, 4, 80–110. [Google Scholar] [CrossRef] [Green Version]
- Tay, C.K.; Hayford, E.K.; Hodgson, I.O.A. Application of multivariate statistical technique for hydrogeochemical assessment of groundwater within the Lower Pra Basin, Ghana. Appl. Water Sci. 2017, 7, 1131–1150. [Google Scholar] [CrossRef] [Green Version]
- Singh, C.K.; Kumar, A.; Shashtri, S.; Kumar, A.; Kumar, P.; Mallick, J. Multivariate statistical analysis and geochemical modeling for geochemical assessment of groundwater of Delhi, India. J. Geochem. Explor. 2017, 175, 59–71. [Google Scholar] [CrossRef]
- Celestino, A.E.M.; Leal, J.A.R.; Cruz, D.A.M.; Vargas, J.T.; Bashulto, J.D.L.; Ramírez, J.M. Identification of the Hydrogeochemical Processes and Assessment of Groundwater Quality, Using Multivariate Statistical Approaches and Water Quality Index in a Wastewater Irrigated Region. Water 2019, 11, 1702. [Google Scholar] [CrossRef] [Green Version]
- Awomeso, J.; Ahmad, S.; Taiwo, A. Multivariate assessment of groundwater quality in the basement rocks of Osun State, Southwest, Nigeria. Environ. Earth Sci. 2020, 79, 108. [Google Scholar] [CrossRef]
- Sood, S.; Sharma, P. Unsupervised learning techniques in groundwater quality assessment of Mewat region, Haryana, India. Sustain. Water Resour. Manag. 2020, 6, 118. [Google Scholar] [CrossRef]
- Li, W.; Wu, J.; Zhou, C.; Nsabimana, A. Groundwater Pollution Source Identification and Apportionment Using PMF and PCA-APCS-MLR Receptor Models in Tongchuan City, China. Arch. Environ. Contam. Toxicol. 2021, 81, 397–413. [Google Scholar] [CrossRef] [PubMed]
- Abdelaziz, S.; Gad, M.I.; El Tahan, A.H.M. Groundwater quality index based on PCA: Wadi El-Natrun, Egypt. J. Afr. Earth Sci. 2020, 172, 103964. [Google Scholar] [CrossRef]
- Badeenezhad, A.; Tabatabaee, H.R.; Nikbakht, H.-A.; Radfard, M.; Abbasnia, A.; Baghapour, M.A.; Alhamd, M. Estimation of the groundwater quality index and investigation of the affecting factors their changes in Shiraz drinking groundwater, Iran. Groundw. Sustain. Dev. 2020, 11, 100435. [Google Scholar] [CrossRef]
- Horton, R.K. An index number system for rating water quality. J. Water Pollut. Control. Fed. 1965, 37, 300–306. [Google Scholar]
- Sharma, P.; Meher, P.K.; Kumar, A.; Gautam, Y.P.; Mishra, K.P. Changes in water quality index of Ganges river at different locations in Allahabad. Sustain. Water Qual. Ecol. 2014, 3, 67–76. [Google Scholar] [CrossRef]
- Wu, Z.; Zhang, D.; Cai, Y.; Wang, X.; Zhang, L.; Chen, Y. Water quality assessment based on the water quality index method in Lake Poyang: The largest freshwater lake in China. Sci. Rep. 2017, 7, 17999. [Google Scholar] [CrossRef]
- Castaño-Sánchez, A.; Hose, G.C.; Reboleira, A.S.P. Salinity and temperature increase impact groundwater crustaceans. Sci. Rep. 2020, 10, 12328. [Google Scholar] [CrossRef]
- Feizizadeh, B.; Lakes, T.; Omarzadeh, D.; Sharifi, A.; Blaschke, T.; Karimzadeh, S. Scenario-based analysis of the impacts of lake drying on food production in the Lake Urmia Basin of Northern Iran. Sci. Rep. 2022, 12, 6237. [Google Scholar] [CrossRef] [PubMed]
- Shokati, B.; Feizizadeh, B. Sensitivity and uncertainty analysis of agro-ecological modeling for saffron plant cultivation using GIS spatial decision-making methods. J. Environ. Plan. Manag. 2019, 62, 517–533. [Google Scholar] [CrossRef]
- Valiallahi, J.; Soltani, A.; Ahmadi Eghbal, M. Evaluating Climate Change and Anthropogenic effects on inducing Salt Storms Aerosol Hazards Risk in Urmia Lake. Anthr. Pollut. J. 2019, 3, 25–32. [Google Scholar]
- Feizizadeh, B.; Mohmmadzadeh Alajuela, K.; Lakes, T.; Blaschke, T.; Omarzadeh, D. A comparison of the integrated fuzzy object-based deep learning approach and three machine learning techniques for land use/cover change monitoring and environmental impacts assessment. GISci. Remote Sens. 2022, 58, 1543–1570. [Google Scholar] [CrossRef]
- Karimzadeh, S.; Matsuoka, M.; Ogushi, F. Spatiotemporal deformation patterns of the Lake Urmia Causeway as characterized by multisensor InSAR analysis. Sci. Rep. 2018, 8, 5357. [Google Scholar] [CrossRef] [Green Version]
- Mahdavi, T.; Hosseini, S. Aquifers Sustainability Assessment by Integrated Groundwater Footprint Indicator (Case Study: East Azerbaijan Province). Iran-Water Resour. Res. 2019, 15, 438–452. [Google Scholar]
- Mahmoudi, M.; Khojasteh, E.R.; Sharghi, Y. Geostatistical modelling of the subsurface geological-geotechnical heterogeneities in the Tabriz Subway, East Azarbayjan Province, Iran. Z. Dtsch. Ges. Für Geowiss. 2019, 170, 145–159. [Google Scholar] [CrossRef]
- Sadeghzadeh Sadat, M.; Nazemi, A.; Sadraddini, A. Impacts of Surface Water Quality on Groundwater Quality (Case study: Tabriz plain). Water Soil Sci. 2017, 27, 225–237. [Google Scholar]
- Feizizadeh, B.; Omarzadeh, D.; Garajeh, M.K.; Lakes, T.; Blaschke, T. Machine learning data-driven approaches for land use/cover mapping and trend analysis using Google Earth Engine. J. Environ. Plan. Manag. 2021, 1–33. [Google Scholar] [CrossRef]
- Garcia, C.A.B.; Silva, I.S.; Mendonça, M.C.S.; Garcia, H.L. Evaluation of water quality indices: Use, evolution and future perspectives. In Advances in Environmental Monitoring and Assessment; IntechOpen: London, UK, 2018; p. 18. [Google Scholar]
- Jeon, C.; Raza, M.; Lee, J.-Y.; Kim, H.; Kim, C.-S.; Kim, B.; Kim, J.-W.; Kim, R.-H.; Lee, S.-W. Countrywide Groundwater Quality Trend and Suitability for Use in Key Sectors of Korea. Water 2020, 12, 1193. [Google Scholar] [CrossRef]
- Hamzaoui-Azaza, F.; Bouhlila, R.; Gueddari, M. Geochemistry of fluoride and major ion in the groundwater samples of triassic aquifer (South Eastern Tunisia), through multivariate and hydrochemical techniques. J. Appl. Sci. Res. 2009, 5, 1941–1951. [Google Scholar]
- Abdollahi, Z.; Kavian, A.; Sadeghi, S.H.R.; Khosrovyan, A.; Delvalls, A. Identifying environmental risk associated with anthropogenic activities in Zanjanrud River, Iran, using an integrated approach. Catena 2019, 183, 104156. [Google Scholar] [CrossRef]
- Varol, M.; Gökot, B.; Bekleyen, A.; Şen, B. Spatial and temporal variations in surface water quality of the dam reservoirs in the Tigris River basin, Turkey. Catena 2012, 92, 11–21. [Google Scholar] [CrossRef]
- Hu, Y.; Li, K.; Meng, A. Agglomertive Hierarchical Clustering Using Ward Linkage. 2018. Available online: https://jbhender.github.io/Stats506/F18/GP/Group10.html (accessed on 9 February 2022).
- Adeogun, A.O.; Babatunde, T.A.; Chukwuka, A.V. Spatial and temporal variations in water and sediment quality of Ona river, Ibadan, Southwest Nigeria. Eur. J. Sci. Res. 2012, 74, 186–204. [Google Scholar]
- Yao, H.; Qian, X.; Gao, H.; Wang, Y.; Xia, B. Seasonal and spatial variations of heavy metals in two typical Chinese rivers: Concentrations, environmental risks, and possible sources. Int. J. Environ. Res. Public Health 2014, 11, 11860–11878. [Google Scholar] [CrossRef] [Green Version]
- Zavareh, M.; Maggioni, V.; Sokolov, V. Investigating Water Quality Data Using Principal Component Analysis and Granger Causality. Water 2021, 13, 343. [Google Scholar] [CrossRef]
- Shlens, J. A tutorial on principal component analysis. arXiv 2014, arXiv:1404.1100. [Google Scholar]
- Jolliffe, I.T.; Cadima, J. Principal component analysis: A review and recent developments. Philos. Trans. R. Soc. A Math. Phys. Eng. Sci. 2016, 374, 20150202. [Google Scholar] [CrossRef]
- Abdi, H.; Williams, L.J. Principal component analysis. Wiley Interdiscip. Rev. Comput. Stat. 2010, 2, 433–459. [Google Scholar] [CrossRef]
- Khosrovyan, A.; Delvalls, T.; Riba, I. Effects of simulated CO2 escape from sediments on the development of midge Chironomus riparius. Aquat. Toxicol. 2014, 156, 230–239. [Google Scholar] [CrossRef]
- Bhat, S.A.; Meraj, G.; Yaseen, S.; Pandit, A.K. Statistical assessment of water quality parameters for pollution source identification in Sukhnag stream: An inflow stream of lake Wular (Ramsar Site), Kashmir Himalaya. J. Ecosyst. 2014, 2014, 898054. [Google Scholar] [CrossRef]
- Ma, L.; Qian, J.; Zhao, W.; Curtis, Z.; Zhang, R. Hydrogeochemical analysis of multiple aquifers in a coal mine based on nonlinear PCA and GIS. Environ. Earth Sci. 2016, 75, 716. [Google Scholar] [CrossRef]
- Tarawneh, M.S.M.; Janardhana, M.; Ahmed, M.M. Hydrochemical processes and groundwater quality assessment in North eastern region of Jordan valley, Jordan. J. Hydro-Environ. Res. 2019, 2, 129–145. [Google Scholar] [CrossRef]
- Khan, A.; Khan, H.H.; Umar, R. Impact of land-use on groundwater quality: GIS-based study from an alluvial aquifer in the western Ganges basin. Appl. Water Sci. 2017, 7, 4593–4603. [Google Scholar] [CrossRef] [Green Version]
- Abou Zakhem, B.; Al-Charideh, A.; Kattaa, B. Using principal component analysis in the investigation of groundwater hydrochemistry of Upper Jezireh Basin, Syria. Hydrol. Sci. J. 2017, 62, 2266–2279. [Google Scholar] [CrossRef]
- Kwami, I.; Ishaku, J.; Hamza, Y.; Bello, A.; Mukkafa, S. Application of Multivariate Statistical Techniques for the Interpretation of Groundwater Quality in Gombe and Environs, North-East Nigeria. J. Geosci. Geomat. 2019, 7, 9–14. [Google Scholar]
- Loucks, D.P. Sustainable water resources management. Water Int. 2000, 25, 3–10. [Google Scholar] [CrossRef]
- Guizani, M.; Fujii, T.; Hijikata, N.; Funamizu, N. Salt removal from soil during rainy season of semi-arid climate following an assumed salt accumulation from previous cultivations fertilized with urine. Euro-Mediterr. J. Environ. Integr. 2016, 1, 10. [Google Scholar] [CrossRef] [Green Version]
- Ozler, H.M. Active saltwater encroachment (from Lake Van) in the Van aquifer, East Turkey. In Proceedings of the First International Conference on Saltwater Intrusion and Coastal Aquifers–Monitoring, Modeling and Management, Essaouira, Morocco, 23–25 April 2001. [Google Scholar]
- Huang, P.; Wang, X. Groundwater-Mixing Mechanism in a Multiaquifer System Based on Isotopic Tracing Theory: A Case Study in a Coal Mine District, China. Geofluids 2018, 2018, 9549141. [Google Scholar] [CrossRef]
- Alizadeh Govarchian Ghale, Y.; Baykara, M.; Unal, A. Analysis of decadal land cover changes and salinization in Urmia Lake Basin using remote sensing techniques. Nat. Hazards Earth Syst. Sci. Discuss. 2017, 1–15. [Google Scholar] [CrossRef]
- Alizadeh Govarchian Ghale, Y. Urmia Lake Desiccation as a New Source of Dust in the Middle East: Investigation of the Anthropogenic Impactsand Climatic Factors on Drying up of Urmia Lake. Ph.D. Thesis, Eurasia Institute of Earth Sciences, Stanbul Technical University, Istanbul, Turkey, 2020. [Google Scholar]
- Hemmati, M.; Ahmadi, H.; Hamidi, S.A.; Naderkhanloo, V. Environmental effects of the causeway on water and salinity balance in Lake Urmia. Reg. Stud. Mar. Sci. 2021, 44, 101756. [Google Scholar] [CrossRef]
- Feizizadeh, B.; Omarzadeh, D.; Ronagh, Z.; Sharifi, A.; Blaschke, T.; Lakes, T. A scenario-based approach for urban water management in the context of the COVID-19 pandemic and a case study for the Tabriz metropolitan area, Iran. Sci. Total Environ. 2021, 790, 148272. [Google Scholar] [CrossRef] [PubMed]
- Feizizadeh, B.; Ronagh, Z.; Pourmoradian, S.; Gheshlaghi, H.A.; Lakes, T.; Blaschke, T. An efficient GIS-based approach for sustainability assessment of urban drinking water consumption patterns: A study in Tabriz city, Iran. Sustain. Cities Soc. 2020, 64, 102584. [Google Scholar] [CrossRef]


| Parameter | Unit | WHO’s Standard (Si) | Weight of Each Parameter (wi) | Relative Weight (Wi) |
|---|---|---|---|---|
| SO42− | mg/L | 250 | 4 | 0.121 |
| Cl− | mg/L | 250 | 3 | 0.091 |
| HCO3− | mg/L | 500 | 3 | 0.091 |
| pH | - | 6.5–8.5 | 4 | 0.121 |
| EC | us/cm | 500 | 4 | 0.121 |
| TDS | mg/L | 500 | 5 | 0.152 |
| TH | mg/L | 500 | 3 | 0.091 |
| K+ | mg/L | 12 | 2 | 0.061 |
| Na+ | mg/L | 200 | 2 | 0.061 |
| Mg2+ | mg/L | 50 | 1 | 0.030 |
| Ca2+ | mg/L | 75 | 2 | 0.061 |
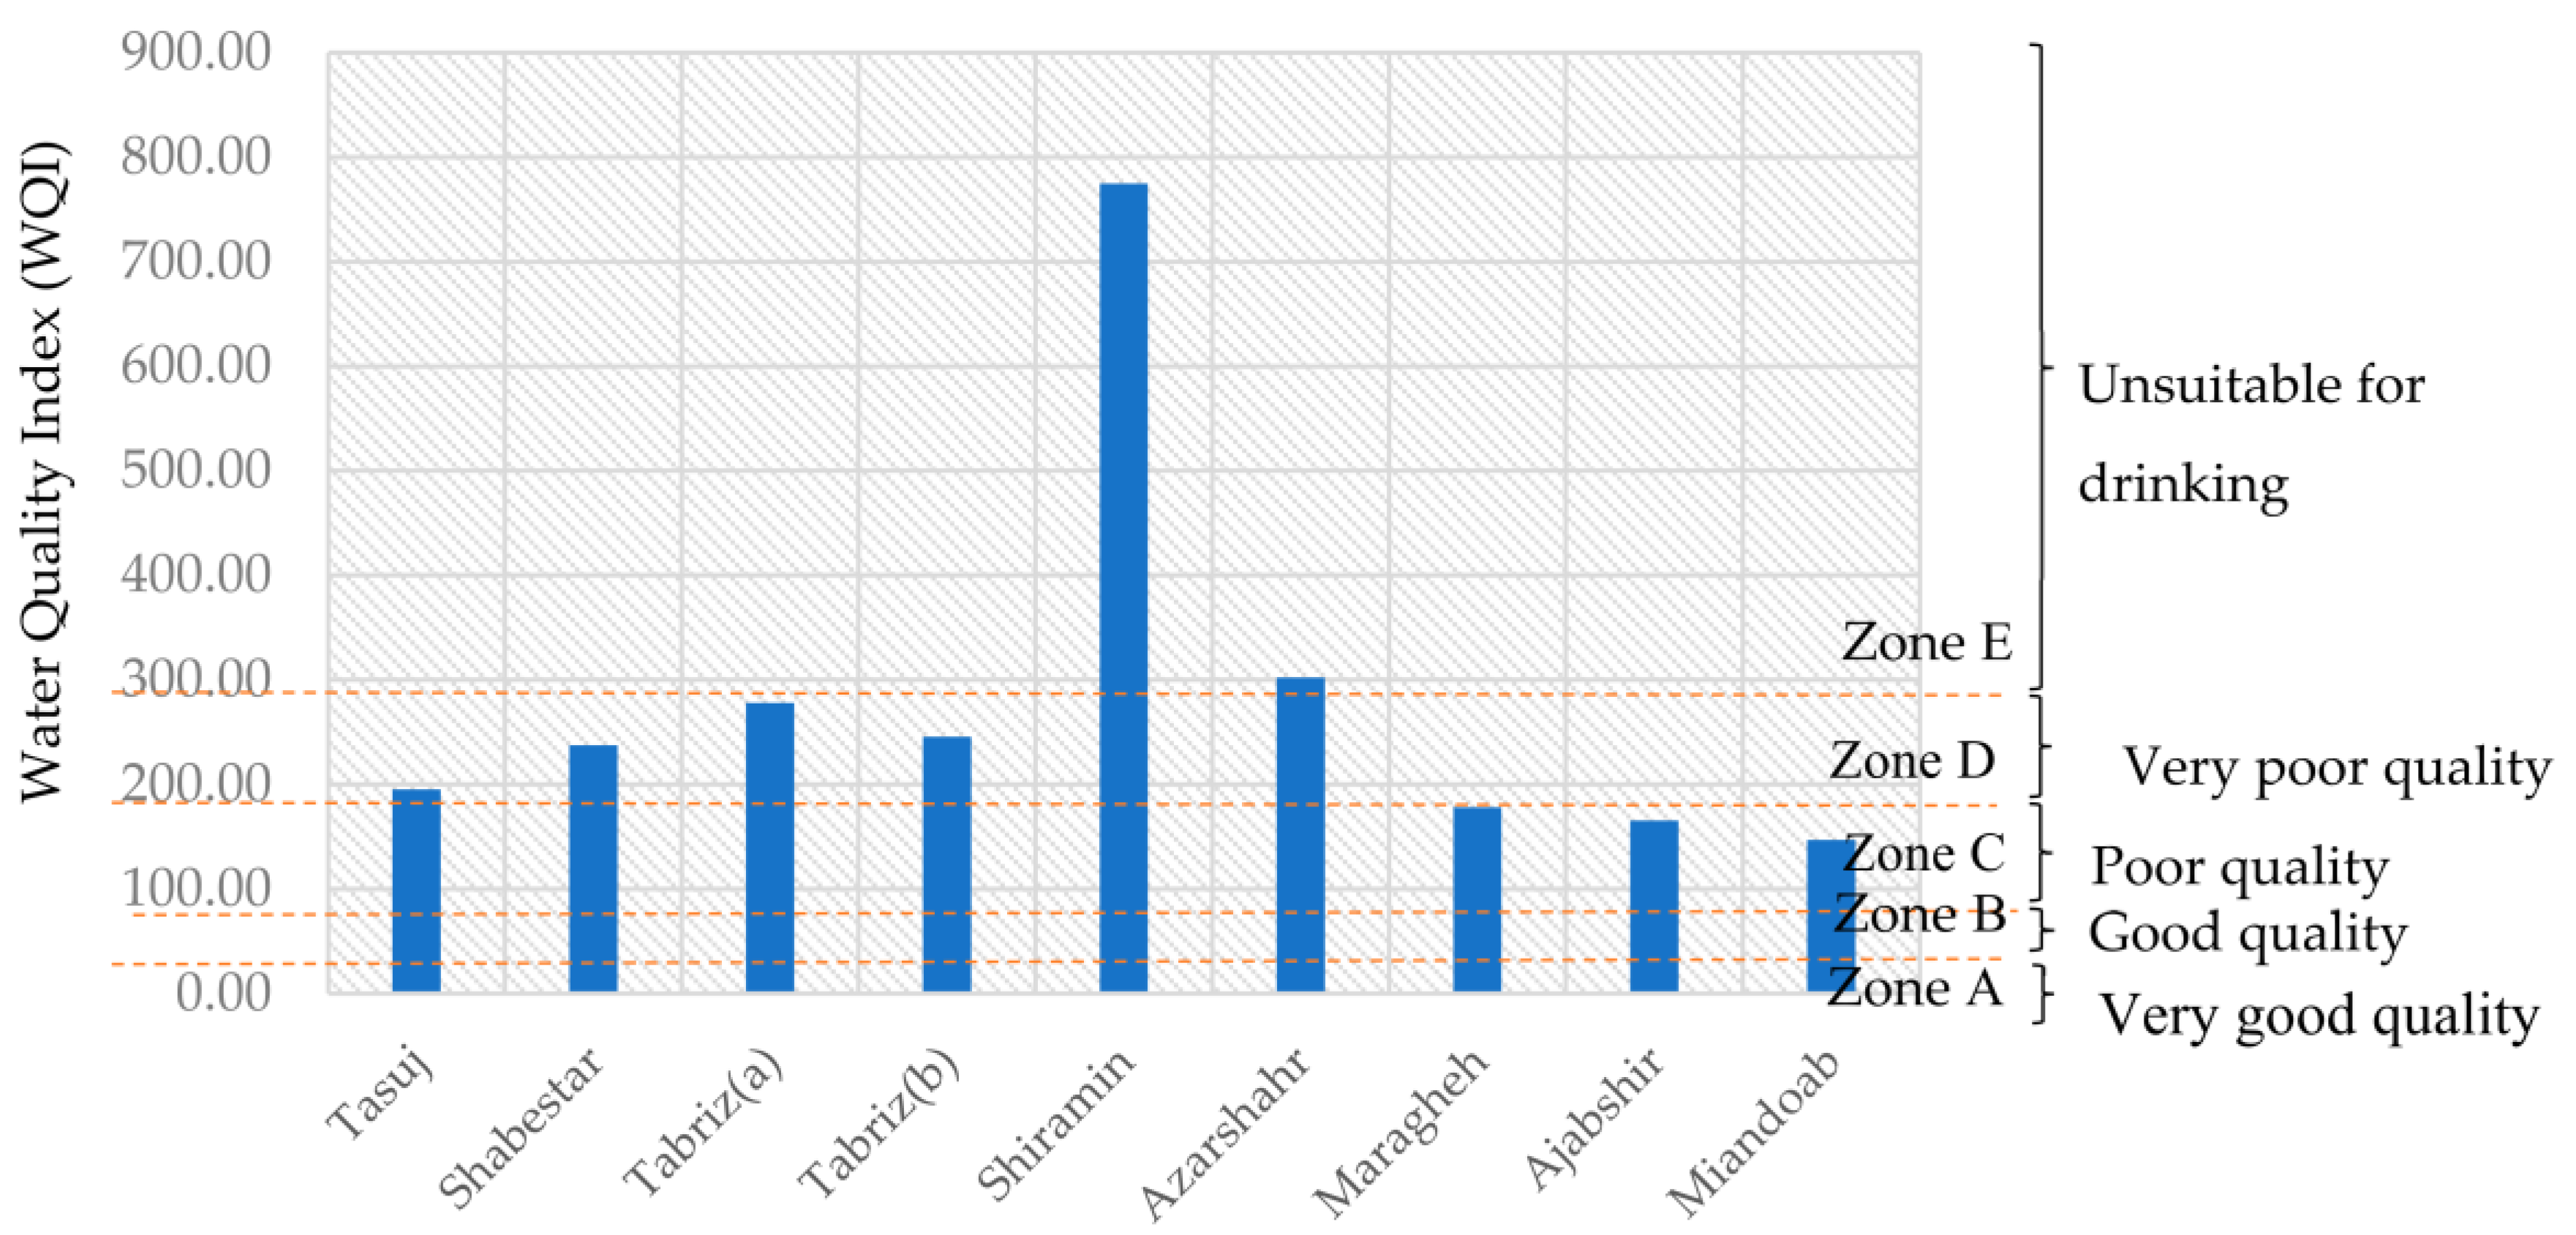
| WQI Value | Quality Based on the WQI | |||
| Less than 50 | Excellent | |||
| 50–100 | Good | |||
| 100–200 | Poor | |||
| 200–300 | Very poor | |||
| More than 300 | Unsuitable for drinking purposes | |||
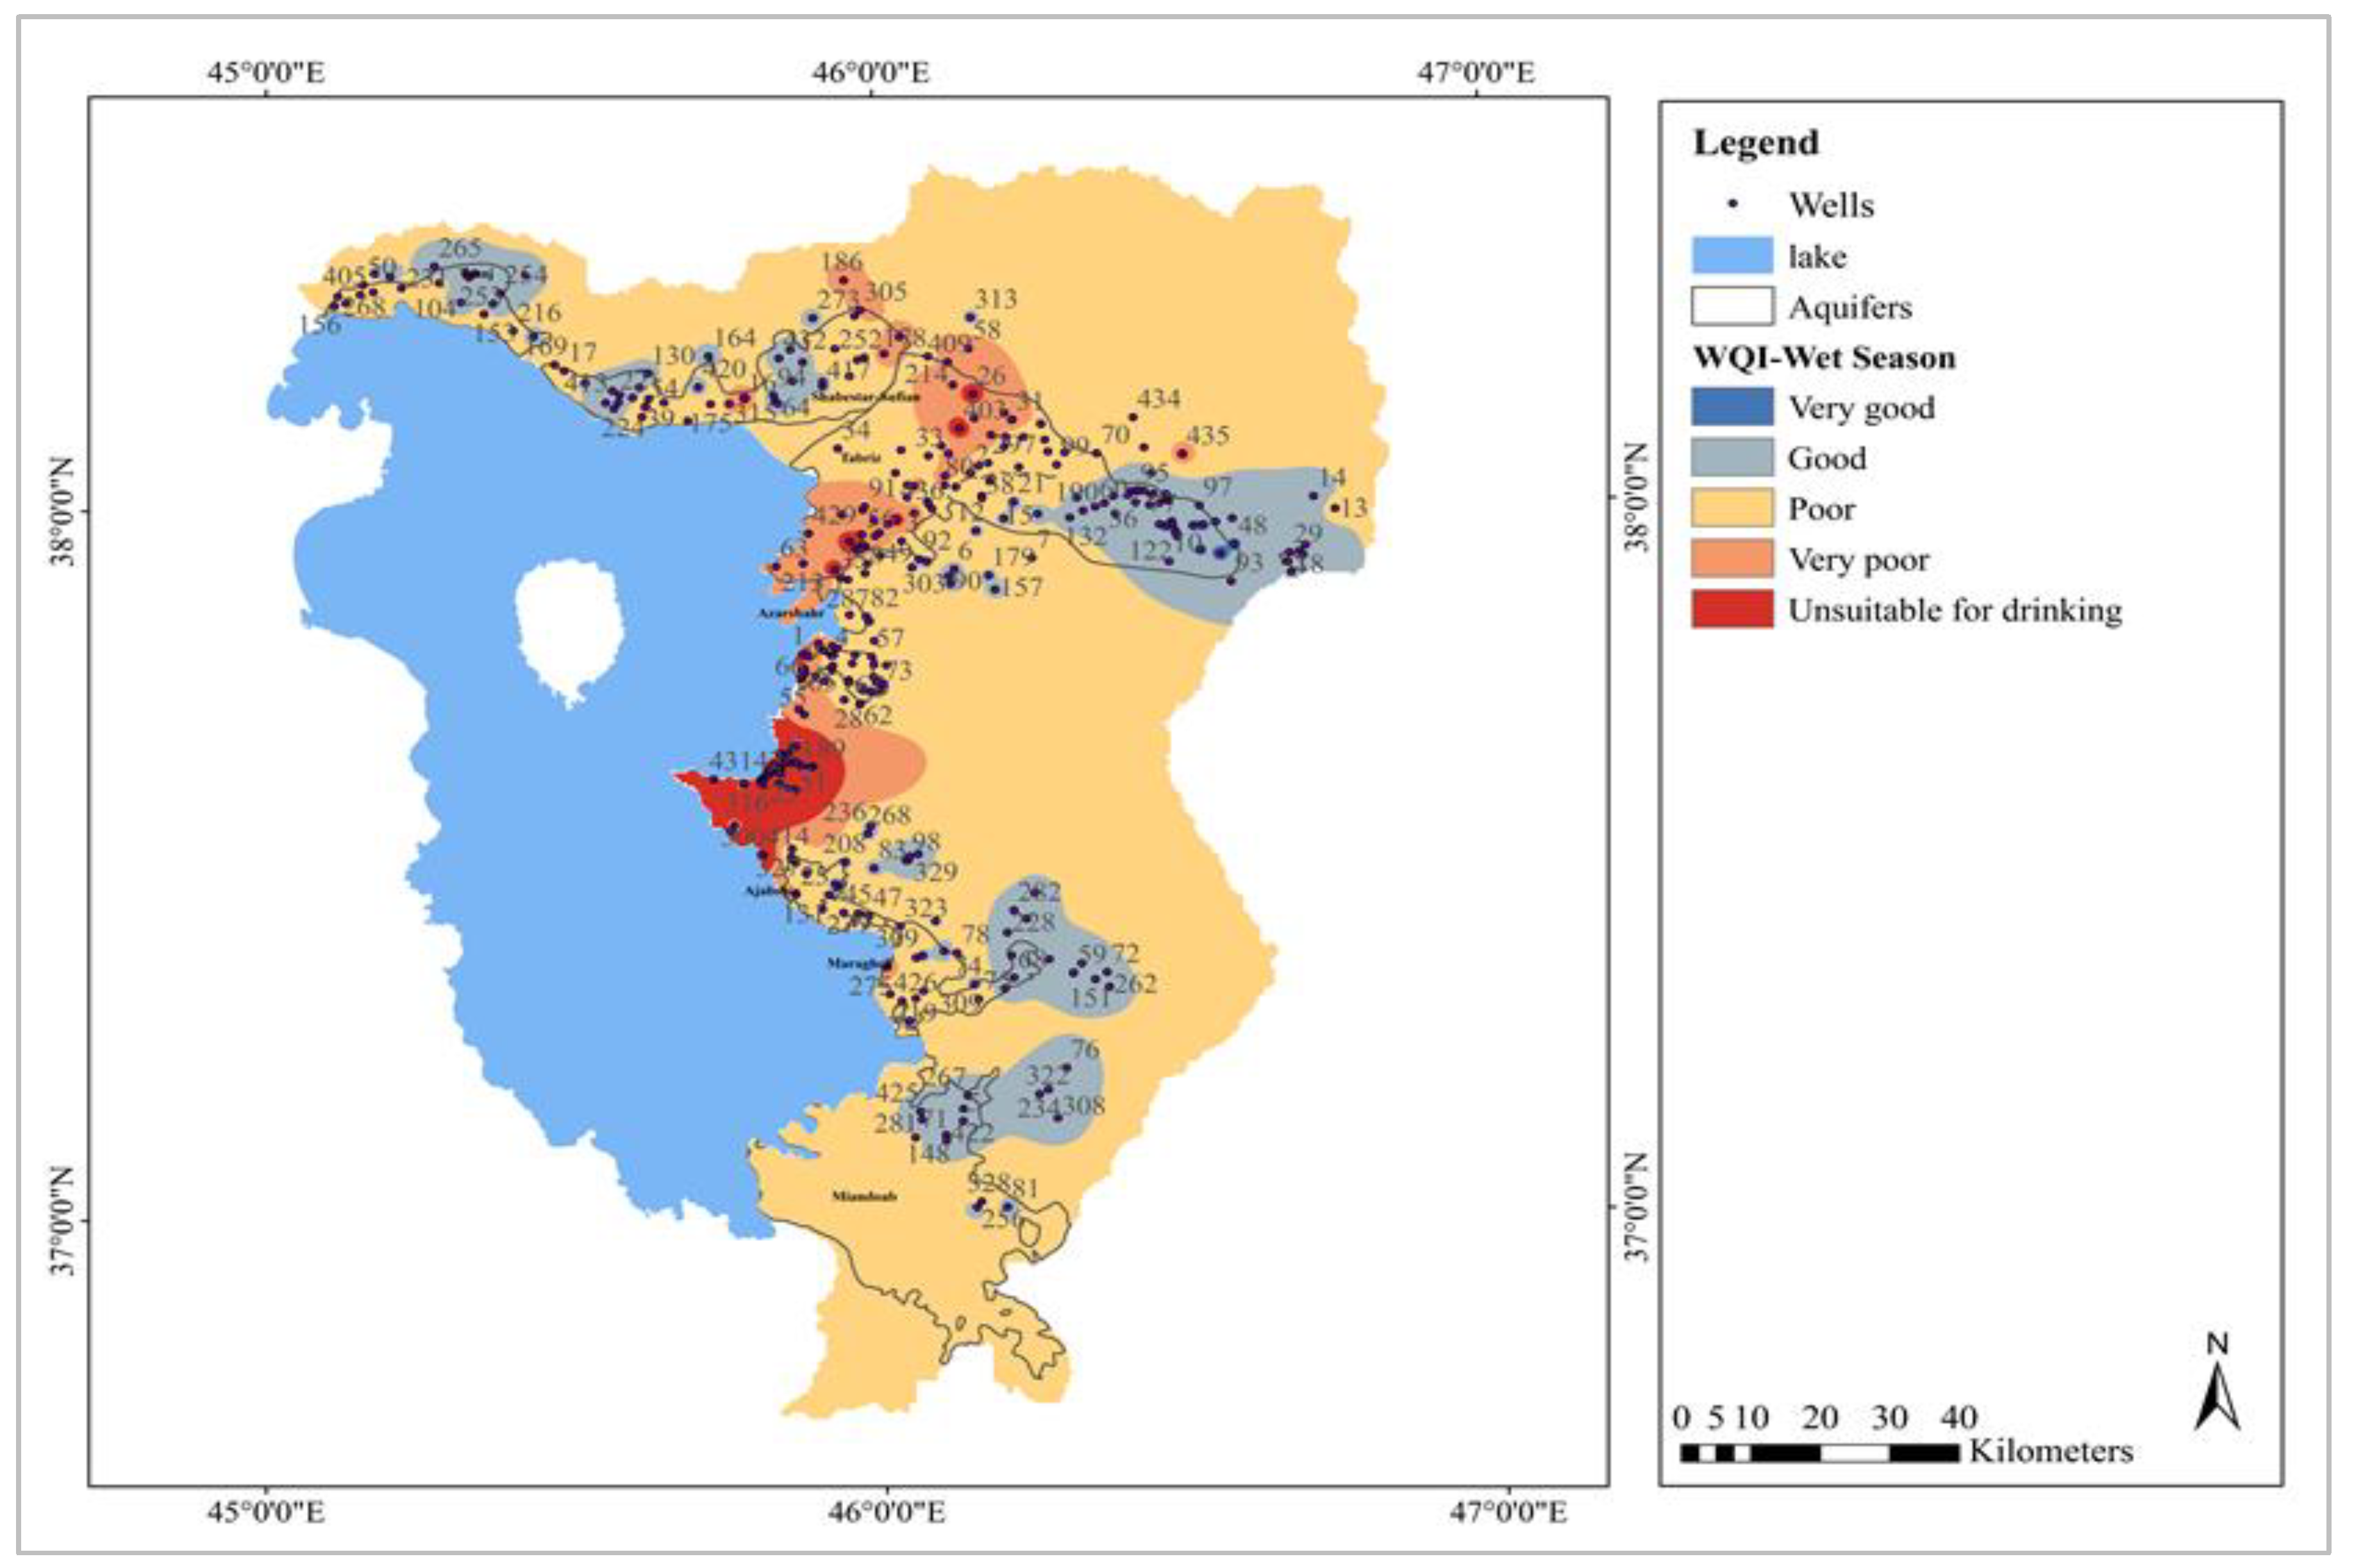
| Aquifer | No. of Observations | |||
|---|---|---|---|---|
| Good to Very Good Quality Classes | Poor to Unsuitable for Drinking Classes | |||
| Dry Season | Rainy Season | Dry Season | Rainy Season | |
| Tasuj | 13 | 12 | 8 | 9 |
| Shabestar | 24 | 24 | 17 | 17 |
| Tabriz (a) | 65 | 59 | 63 | 69 |
| Tabriz (b) | 7 | 7 | 1 | 1 |
| Shiramin | 9 | 1 | 29 | 37 |
| Azarshahr | 12 | 8 | 17 | 21 |
| Maragheh | 19 | 19 | 6 | 6 |
| Ajabshir | 34 | 34 | 14 | 14 |
| MiandoAb | 16 | 14 | 1 | 2 |
| Total | 199 | 178 | 159 | 176 |
| Variables | Tasuj | Shabestar | Tabriz (a) | Tabriz (b) | Shiramin | Azarshahr | Maragheh | Ajabshir | MiandoAb |
|---|---|---|---|---|---|---|---|---|---|
| SO42− | 0.427 | 0.850 | 0.910 | 0.768 | 0.839 | 0.652 | 0.817 | 0.850 | 0.782 |
| Cl− | 0.836 | 0.968 | 0.964 | 0.685 | 0.909 | 0.916 | 0.937 | 0.937 | 0.868 |
| HCO3− | 0.273 | 0.559 | 0.636 | 0.565 | 0.205 | 0.491 | 0.522 | 0.499 | 0.780 |
| CO32− | −0.401 | −0.464 | −0.573 | −0.144 | −0.268 | −0.126 | −0.077 | −0.046 | 0.200 |
| anion | 0.960 | 0.960 | 0.969 | 0.832 | 0.911 | 0.952 | 0.968 | 0.956 | 0.952 |
| pH | −0.384 | −0.620 | −0.459 | −0.402 | −0.465 | −0.362 | 0.193 | 0.048 | 0.150 |
| TDS | 0.971 | 0.958 | 0.977 | 0.803 | 0.912 | 0.955 | 0.960 | 0.948 | 0.946 |
| TH | 0.822 | 0.881 | 0.924 | 0.785 | 0.881 | 0.948 | 0.909 | 0.892 | 0.788 |
| EC | 0.971 | 0.960 | 0.803 | 0.606 | 0.660 | 0.696 | 0.853 | 0.876 | 0.908 |
| SAR | 0.706 | 0.866 | 0.976 | 0.859 | 0.908 | 0.956 | 0.968 | 0.956 | 0.947 |
| K+ | 0.513 | 0.866 | 0.805 | 0.503 | 0.475 | 0.719 | 0.606 | 0.551 | 0.796 |
| Na+ | 0.846 | 0.931 | 0.954 | 0.797 | 0.800 | 0.887 | 0.931 | 0.935 | 0.950 |
| Mg2+ | 0.747 | 0.914 | 0.946 | 0.781 | 0.901 | 0.921 | 0.908 | 0.906 | 0.834 |
| Ca2+ | 0.830 | 0.826 | 0.835 | 0.671 | 0.833 | 0.889 | 0.750 | 0.748 | 0.586 |
| WQI | 1 | 1 | 1 | 1 | 1 | 1 | 1 | 1 | 1 |
Publisher’s Note: MDPI stays neutral with regard to jurisdictional claims in published maps and institutional affiliations. |
© 2022 by the authors. Licensee MDPI, Basel, Switzerland. This article is an open access article distributed under the terms and conditions of the Creative Commons Attribution (CC BY) license (https://creativecommons.org/licenses/by/4.0/).
Share and Cite
Feizizadeh, B.; Abdollahi, Z.; Shokati, B. A GIS-Based Spatiotemporal Impact Assessment of Droughts in the Hyper-Saline Urmia Lake Basin on the Hydro-Geochemical Quality of Nearby Aquifers. Remote Sens. 2022, 14, 2516. https://doi.org/10.3390/rs14112516
Feizizadeh B, Abdollahi Z, Shokati B. A GIS-Based Spatiotemporal Impact Assessment of Droughts in the Hyper-Saline Urmia Lake Basin on the Hydro-Geochemical Quality of Nearby Aquifers. Remote Sensing. 2022; 14(11):2516. https://doi.org/10.3390/rs14112516
Chicago/Turabian StyleFeizizadeh, Bakhtiar, Zahra Abdollahi, and Behzad Shokati. 2022. "A GIS-Based Spatiotemporal Impact Assessment of Droughts in the Hyper-Saline Urmia Lake Basin on the Hydro-Geochemical Quality of Nearby Aquifers" Remote Sensing 14, no. 11: 2516. https://doi.org/10.3390/rs14112516
APA StyleFeizizadeh, B., Abdollahi, Z., & Shokati, B. (2022). A GIS-Based Spatiotemporal Impact Assessment of Droughts in the Hyper-Saline Urmia Lake Basin on the Hydro-Geochemical Quality of Nearby Aquifers. Remote Sensing, 14(11), 2516. https://doi.org/10.3390/rs14112516