Article

A Comparison of Convective and Stratiform Precipitation Microphysics of the Record-breaking Typhoon In-Fa (2021)

1
Department of Atmosphere Science and Engineering, College of Meteorology and Oceanography, National University of Defense Technology, Changsha 410073, China
2
Shanghai Typhoon Institute, China Meteorological Administration, Shanghai 200030, China
*
Author to whom correspondence should be addressed.
Remote Sens. 2022, 14(2), 344; https://doi.org/10.3390/rs14020344
Submission received: 30 November 2021 / Revised: 30 December 2021 / Accepted: 11 January 2022 / Published: 12 January 2022
(This article belongs to the Special Issue Precipitation Retrievals from Satellite and Radar Data)

Abstract

:
In July 2021, Typhoon In-Fa attacked eastern China and broke many records for extreme precipitation over the last century. Such an unrivaled impact results from In-Fa’s slow moving speed and long residence time due to atmospheric circulations. With the supports of 66 networked surface disdrometers over eastern China and collaborative observations from the advanced GPM satellite, we are able to reveal the unique precipitation microphysical properties of the record-breaking Typhoon In-Fa (2021). After separating the typhoon precipitation into convective and stratiform types and comparing the drop size distribution (DSD) properties of Typhoon In-Fa with other typhoons from different climate regimes, it is found that typhoon precipitation shows significant internal differences as well as regional differences in terms of DSD-related parameters, such as mass-weighted mean diameter (Dm), normalized intercept parameter (Nw), radar reflectivity (Z), rain rate (R), and intercept, shape, and slope parameters (N0, µ, Λ). Comparing different rain types inside Typhoon In-Fa, convective rain (Nw ranging from 3.80 to 3.96 mm−1 m−3) shows higher raindrop concentration than stratiform rain (Nw ranging from 3.40 to 3.50 mm−1 m−3) due to more graupels melting into liquid water while falling. Large raindrops occupy most of the region below the melting layer in convective rain due to a dominant coalescence process of small raindrops (featured by larger ZKu, Dm, and smaller N0, µ, Λ), while small raindrops account for a considerable proportion in stratiform rain, reflecting a significant collisional breakup process of large raindrops (featured by smaller ZKu, Dm, and larger N0, µ, Λ). Compared with other typhoons in Hainan and Taiwan, the convective precipitation of Typhoon In-Fa shows a larger (smaller) raindrop concentration than that of Taiwan (Hainan), while smaller raindrop diameter than both Hainan and Taiwan. Moreover, the typhoon convective precipitation measured in In-Fa is more maritime-like than precipitation in Taiwan. Based on a great number of surface disdrometer observational data, the GPM precipitation products were further validated for both rain types, and a series of native quantitative precipitation estimation relations, such as ZR and RDm relations were derived to improve the typhoon rainfall retrieval for both ground-based radar and spaceborne radar.

1. Introduction

China is one of the countries that most suffered from typhoon hazards in the world. Severe Typhoon In-Fa, the sixth typhoon in 2021, broke many historic precipitation records while it made landfall in eastern China. As reported by China Meteorological Administration (CMA), the daily average rainfall accumulation in Zhejiang Province reached 191 mm during In-Fa landfall, posting the record of largest total typhoon rainfall in Zhejiang. Under the continuous influence of the spiral rain belt of Typhoon In-Fa, the maximum accumulated rainfall reached 402.1 mm in Jinshan, Shanghai, which is the largest amount of typhoon rainfall affecting Shanghai in recent decades. As In-Fa moved forward, the daily average rainfall in Jiangsu Province reached 220.9 mm, and the maximum process rainfall was 569.2 mm (reported in Jiangdu District), which broke the record of largest total typhoon rainfall in Jiangsu. These extreme precipitation events brought great challenges to the typhoon disaster prevention and control work of the Chinese government.
Improving radar quantitative precipitation estimation (QPE) and model quantitative precipitation forecast (QPF) for landfalling typhoons is crucially important for disaster prevention and mitigation [1,2,3]. The key to improving typhoon QPE & QPF includes a better understanding of precipitation microphysical process and structure, which needs support from reliable observatory platforms. However, it is difficult to meet the requirements for reliable typhoon observation data by using only a single source of observation. Thus, multi-sources observation and joint observations from multiple aspects and by combining a variety of instruments are urgently needed.
Disdrometers are frequently used to directly measure the basic microphysical information, such as raindrop size distribution (DSD) of typhoon precipitation [3,4,5,6,7]. Recently, Wen et al. [3] investigated the DSD characteristics of seven landfalling typhoons by using two-dimensional video disdrometers (2DVD) and found that typhoon convective precipitation contains higher (lower) raindrop concentration (diameter) than maritime convection. Bao et al. [4,5] revealed the DSD variability among different typhoon rainbands based on observations from several particle size velocity (PARSIVEL) distrometers. Bao et al. [6] further analyzed the microphysical characteristics of Typhoon Lekima (2019) by using a dozen Thies disdrometers, and revealed that the average raindrop concentration (diameter) generally increases (decreases) radially from the typhoon center. With the fast development of radar and satellite techniques, the dual-frequency precipitation radar (DPR) onboard the Global Precipitation Measurement (GPM) satellite has been widely adopted to investigate the vertical structure of typhoon precipitation and indirectly retrieve the relevant microphysical information [8,9,10]. Based on long-term GPM DPR observations, Huang and Chen [8], and Chen et al. [9] conducted statistical research on the precipitation microphysics of tropical cyclones over the Western North Pacific, and found that the coalescence process contributes to the production of precipitation in typhoon clouds, while the breakup of hydrometeors is the dominant process in clouds with less precipitation; when storm top height (STH) is less than 5 km, the coalescence process is dominant in typhoon rainbands, while the influence of the breakup process increases as STH exceeds 5 km. By combining GPM DPR and ground radar, Wu et al. [10] revealed the dominant microphysical processes in different typhoon areas and further found that large radar spectral width occurred in the area with large raindrop diameter and high STH.
Overall, the disdrometer network plays an irreplaceable role in detecting the surface precipitation, while the GPM satellite is capable of retrieving the hydrometeor distribution at different levels of height. Therefore, by combining disdrometers with GPM DPR, one can not only obtain the DSD of near-surface precipitation but also retrieve the microphysical information of high-level precipitation. Meanwhile, disdrometers can also serve as a standard to validate and improve GPM retrieval accuracy [11,12,13,14,15]. Even though, most precipitation microphysical studies concerning typhoons have obtained their results using either disdrometer or GPM satellite as the main analysis data. As far as the authors know, there is still inadequate literature using disdrometer-GPM combinations to investigate the microphysical properties of typhoon precipitation events.
As an early attempt to use disdrometer-GPM combinations for typhoon precipitation microphysics research, this study focuses on the record-breaking Typhoon In-Fa in July 2021 and investigates its unique precipitation microphysical properties based on collaborative observations from surface disdrometer network and GPM DPR. The results would benefit our understanding of typhoon precipitation microphysics and help improve typhoon QPE & QPF, which further contribute to the decision-making of local governments in facing extreme precipitation events.

2. Data and Methods

2.1. PARSIVEL Disdrometer Network

In-situ observational data from a PARSIVEL disdrometer network located across Jiangsu Province, China (116.3–122.0°E, 30.8–35.3°N) were used in this study. The area representing Jiangsu Province is indicated by a red contour in Figure 1a, along with the best track of Typhoon In-Fa (2021) obtained from CMA. In-Fa made landfall in the Zhejiang Province at Typhoon (TY) intensity level but weakened gradually as it headed north-west (Figure 1a). 66 PARSIVEL disdrometers comprising the observatory network functioned simultaneously during the passage of Typhoon In-Fa. The locations of each disdrometer are presented in Figure 1b, and the 1-min DSD data measured by each disdrometer from 25 July 0000UTC to 30 July 0000UTC are summarized in Table S1. It should be noted in Figure 1b that 66 disdrometers cover almost the whole area of Jiangsu Province (about 100,000 km2), with each disdrometer deployed every 200 km on average. The PARSIVEL disdrometers used herein are optical disdrometers manufactured by OTT Hydromet, Germany, which are capable of measuring both raindrop size and falling velocity at the same time [16]. To decrease the measurement error, PARSIVEL data quality control technology was applied following Wu et al. [11,12]. Fallers with diameters greater than 8 mm or falling speeds beyond ±60% of the atlas V-D curve (velocity versus diameter relationship) for rain [17] were discarded. Moreover, 1-min DSD samples with raindrop counts less than 10 or rain rates lower than 0.1 mm h−1 were removed to eliminate the possible instrument noise [18].

2.2. GPM DPR Data

On 27 July 2021 at about 1105 UTC, as Typhoon In-Fa was hitting Jiangsu Province, the GPM satellite also passed and recorded the severe precipitation caused by In-Fa (Figure 2). The DPR onboard GPM satellite instantaneously retrieved a three-dimensional precipitation structure based on a set of advanced precipitation-retrieval algorithms developed by Iguchi et al. [19]. Two precipitation radars (PR) of Ku (13.6 GHZ) and Ka (35.5 GHz) bands constitute the whole DPR instrument. Three types of GPM DPR level-2 products are issued officially due to different wave-band PRs and scan modes, including the Ka-band high-sensitivity product (KaHS), Ku-band normal-scan product (KuNS), and dual-frequency matched-scan product (DPR_MS). KaHS has a swath width of 120 km (24 pixels) and a nominal range bin of 125 m, KuNS has a swath width of 245 km (49 pixels) and a nominal range bin of 125 m, and DPR_MS has a swath width of 125 km (25 pixels) and a nominal range bin of 250 m. Each pixel is approximately 5 × 5 km2 in size. In this study, we chose version 6 (V6) standard products of KuNS (granule No. 42,108) to obtain the attenuation-corrected equivalent radar reflectivity (Ze, unit: dBZ), rain rate (R, unit: mm h−1), mass-weighted diameter (Dm, unit: mm), normalized intercept parameter (Nw, unit: mm−1 m−3), and rainfall type (stratiform, convective, and other) due to its wider observational range, higher vertical resolution, and smaller attenuation than those of KaHS or DPR_MS. Figure 2 shows the rain type and maximum radar reflectivity (i.e., composite reflectivity) obtained from KuNS product during Typhoon In-Fa (2021). A total of 3745 pixels with 379 convective pixels and 2436 stratiform pixels are identified (the rain classification method is particularly introduced in Section 2.4). The convective pixels in Figure 2a correspond well to the strong radar echo areas in Figure 2b. Note that the minimum detectable radar reflectivity is currently 15.46 dBZ for KuNS after four years of calibration of GPM DPR [20].

2.3. Disdrometer Data Processing

Each PARSIVEL disdrometer sample is archived into a 32 × 32 matrix that contains the drop counts corresponding to 32 diameter classes (0–25 mm) and 32 velocity classes (0–22.4 m s−1) [16]. Based on the measured drop size (D) and velocity (V) distribution data from PARSIVEL disdrometers, one can easily calculate the following parameters, including but not limited to, radar reflectivity factor Z (mm6 m−3), rain rate R (mm h−1), rainwater content W (kg m−3), mass-weighted mean diameter Dm (mm), and normalized intercept parameter Nw (mm−1 m−3):
Z = i = 1 32 N ( D i ) D i 6 Δ D i
R = 6 π × 10 4 i = 1 32 j = 1 32 V j D i 3 N ( D i ) Δ D i
W = π 6 × 10 6 i = 1 32 N ( D i ) D i 3 Δ D i
D m = i = 1 32 N ( D i ) D i 4 Δ D i i = 1 32 N ( D i ) D i 3 Δ D i
N w = 4 4 π ρ 0 ( W D m 4 ) , ρ 0 = 1 × 10 3 ( kg / m 3 )
Gamma distribution [21] with three parameters [N0, µ, Λ] has been widely used in plenty of studies for characterization of DSD and can be expressed as:
N ( D ) = N 0 D μ exp ( Λ D )
Where D (mm) is the equivalent-volume raindrop diameter, N(D) (m−3 mm−1) is the raindrop concentration per unit volume in the diameter interval, N0 (mm−1-μ m−3) is the intercept parameter, µ (dimensionless) is the shape parameter, and Λ (mm−1) is the slope parameter. The three control parameters of the gamma DSD model [N0, µ, Λ] were calculated using the truncated moment fitting method adapted from Zhang et al. [22].

2.4. Rain Classification Method

To discriminate and compare the microphysical characteristics of different rain types in Typhoon In-Fa, a frequently used rain classification method proposed by Bringi et al. [23] was employed to divide the typhoon precipitation into convective and stratiform types based on surface disdrometers observation. Specifically, stratiform rain is characterized with σR ≤ 1.5 mm h−1, while convective rain is characterized with σR > 1.5 mm h−1 and R ≥ 5 mm h−1, where σR denotes the standard deviation of R for ten consecutive 1-min DSDs. Figure 3 gave the disdrometer-based rain classification results by taking Gaoyou, Jiangdong, and Dongtai stations as examples. All three stations have detected intense rain exceeding 250 mm during typhoon landfall (Figure 1b). As shown in Figure 3a–c, the first half of the time series (25 July 2021–27 July 2021) is mainly stratiform precipitation (orange stripe) possibly from the spiral rain belt of Typhoon In-Fa, and the second half of the time series (27 July 2021–29 July 2021) is mainly convective precipitation (blue stripe) possibly from the eyewall of Typhoon In-Fa. It is also suggested in Figure 3 that the stratiform rain tends to have smaller R (black line) and σR (magenta line) than that of convective rain.
In the V6 standard products of KuNS, the retrieved rainfall at each pixel is classified into convective, stratiform and other types based on the horizontal and vertical variability of measured radar echo [24]. The convective type defined by GPM official products usually contains shallow rain, whereas shallow rain is observed to have different DSD characteristics from either convective rain or stratiform rain [25]. Thus, in this study, we removed shallow rain from convective rain. Figure 2a showed the identified four types of rain from the GPM DPR overpass. To match the classification thresholds in the disdrometer-based scheme, the samples in the GPM DPR with R < 5 mm h−1 were also excluded from convective samples. More information concerning GPM rainfall classification methods and rainfall retrieval procedures can be found in the lev-2 Algorithm Theoretic Basic Document (ATBD) provided by Iguchi et al. [19].

2.5. Hydrometeor Recognition Method

To further illustrate the GPM-retrieved microphysical characteristics of Typhoon In-Fa, a fuzzy-logic algorithm proposed by Qiao et al. [26] was employed to recognize the hydrometeor types within Typhoon In-Fa by using Ku (Ka) band equivalent radar reflectivity (Ze), temperature (T) thresholds and an asymmetric t-form membership function as given in Table 1 of Qiao et al. [26]. Currently, the recognizable types of hydrometeors include snow, graupel, mixed-phase particles, large raindrops, and small raindrops. In this study, we used the Ku-band attenuation-corrected reflectivity detected from GPM DPR, along with the temperature profile from the fifth generation reanalysis data (ERA5) of the European Centre for Medium-range Weather Forecasts (ECMWF) [27] to identify the hydrometeor types. The hydrometeor with the largest cumulative probability of all parameters (Ze and T) was recognized as the maximum likelihood type at each grid point. Note that the GPM hydrometeor recognition method has been specifically validated for typhoons and is proved to have a reasonable performance with mean recognition rates of the solid-phase (snow and graupel), mixed-phase (mixed-phase particles), and liquid-phase (large and small raindrops) reaching 80.9%, 75.6%, and 86.8% respectively [26].

3. Results

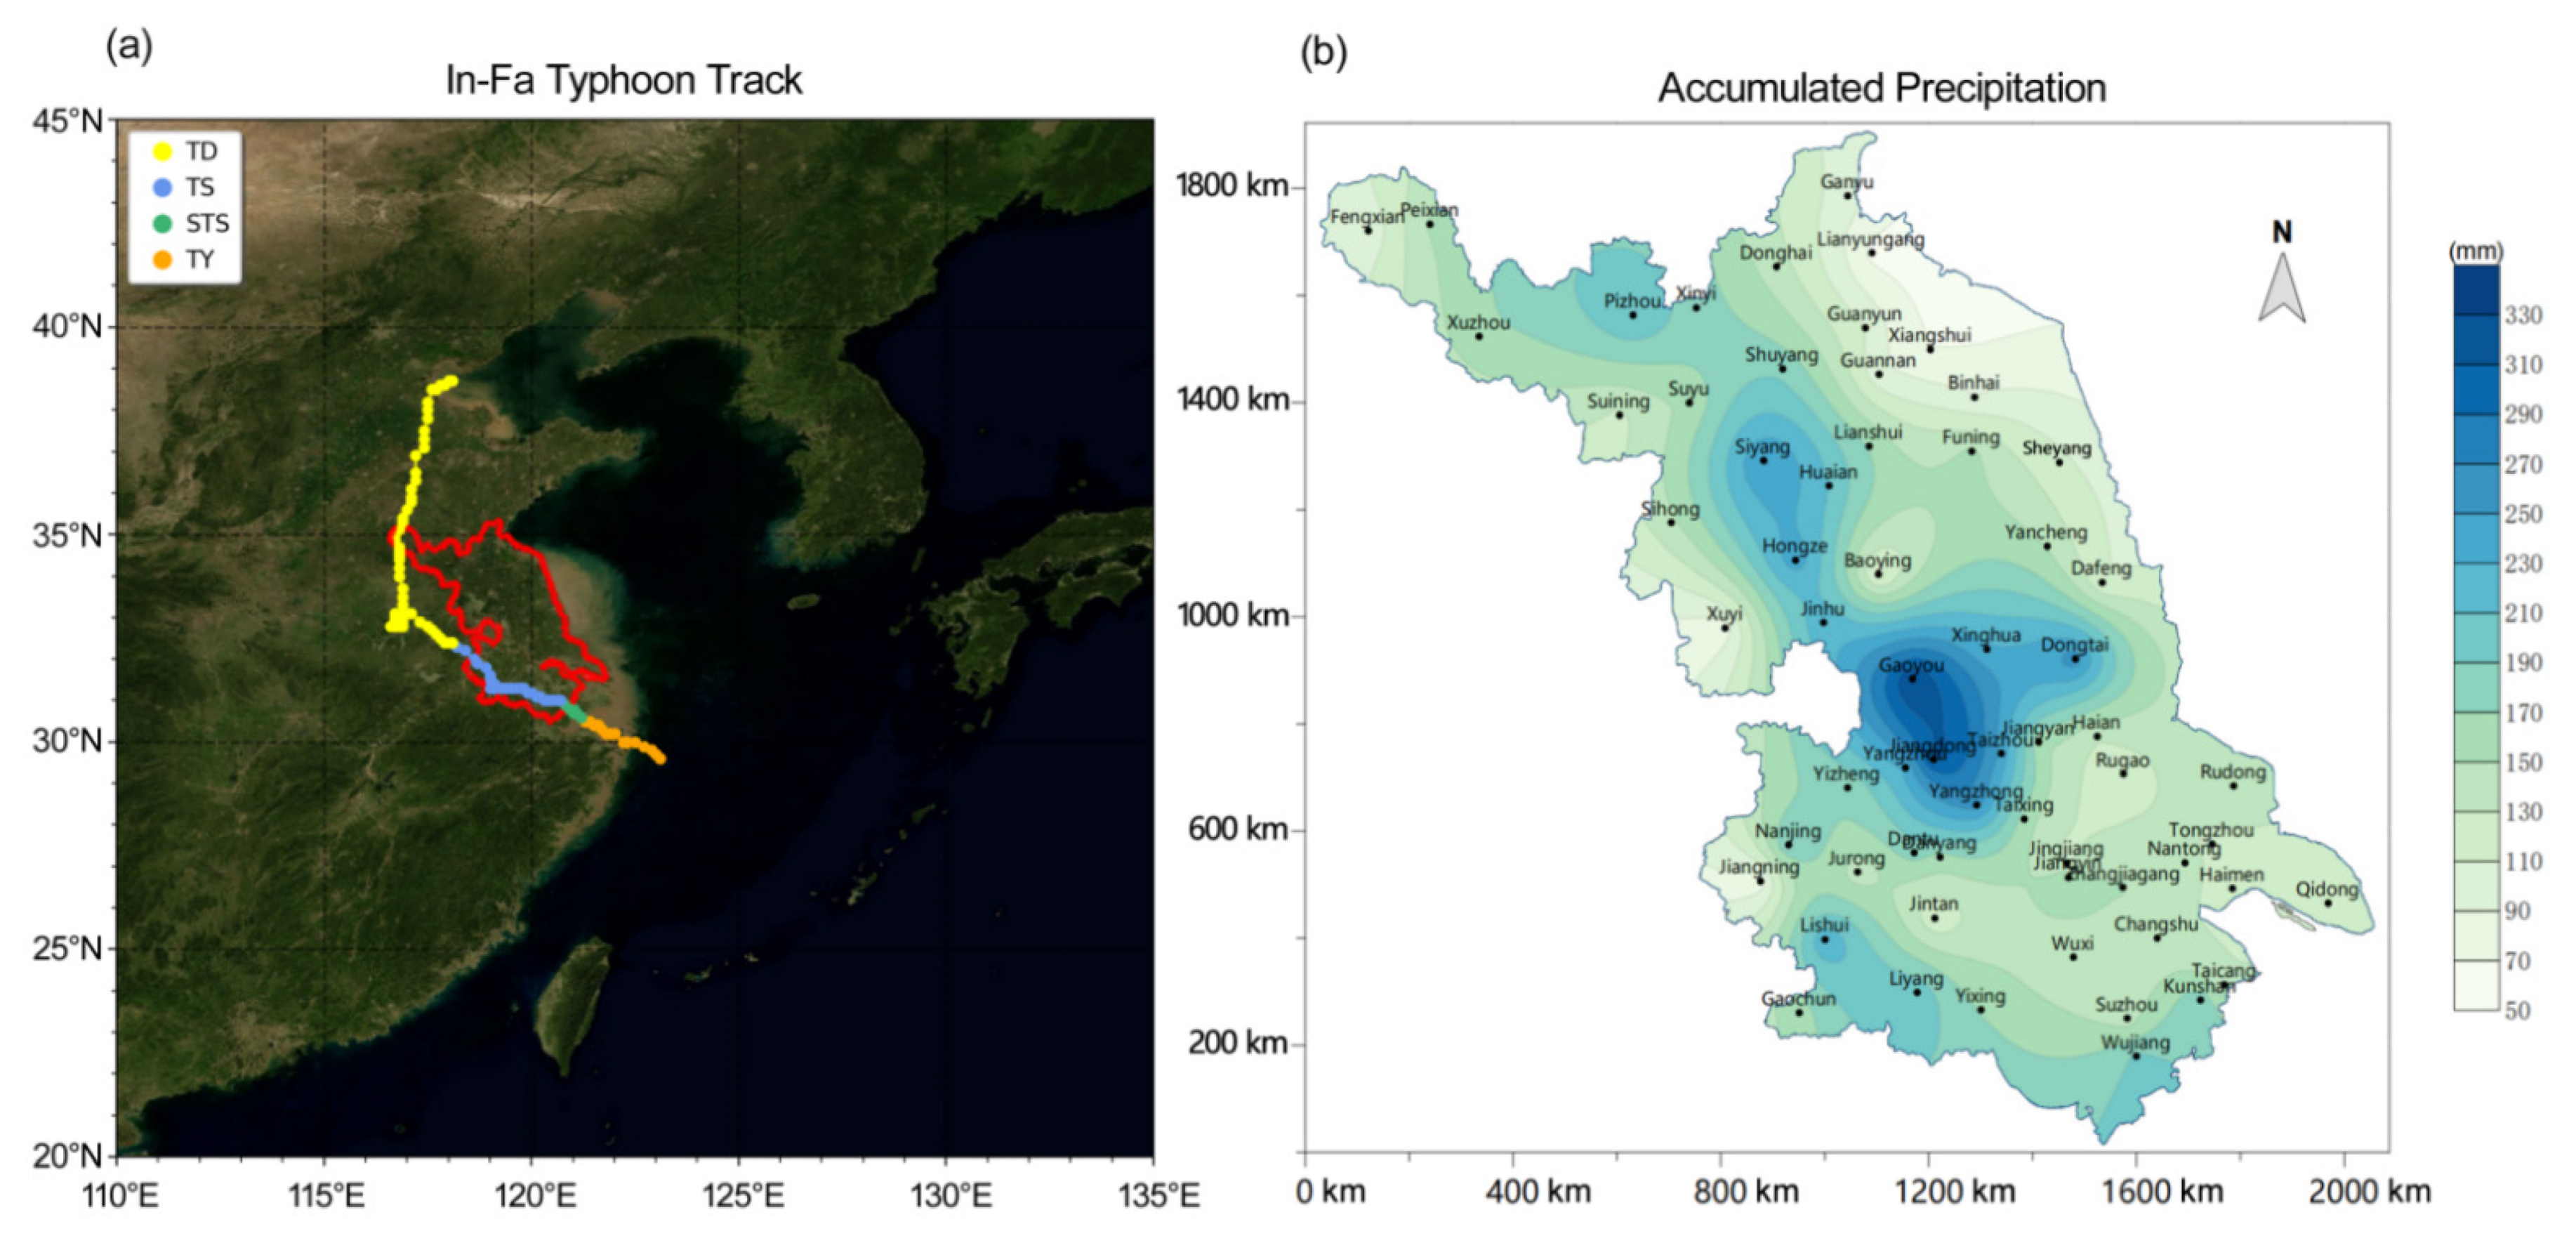
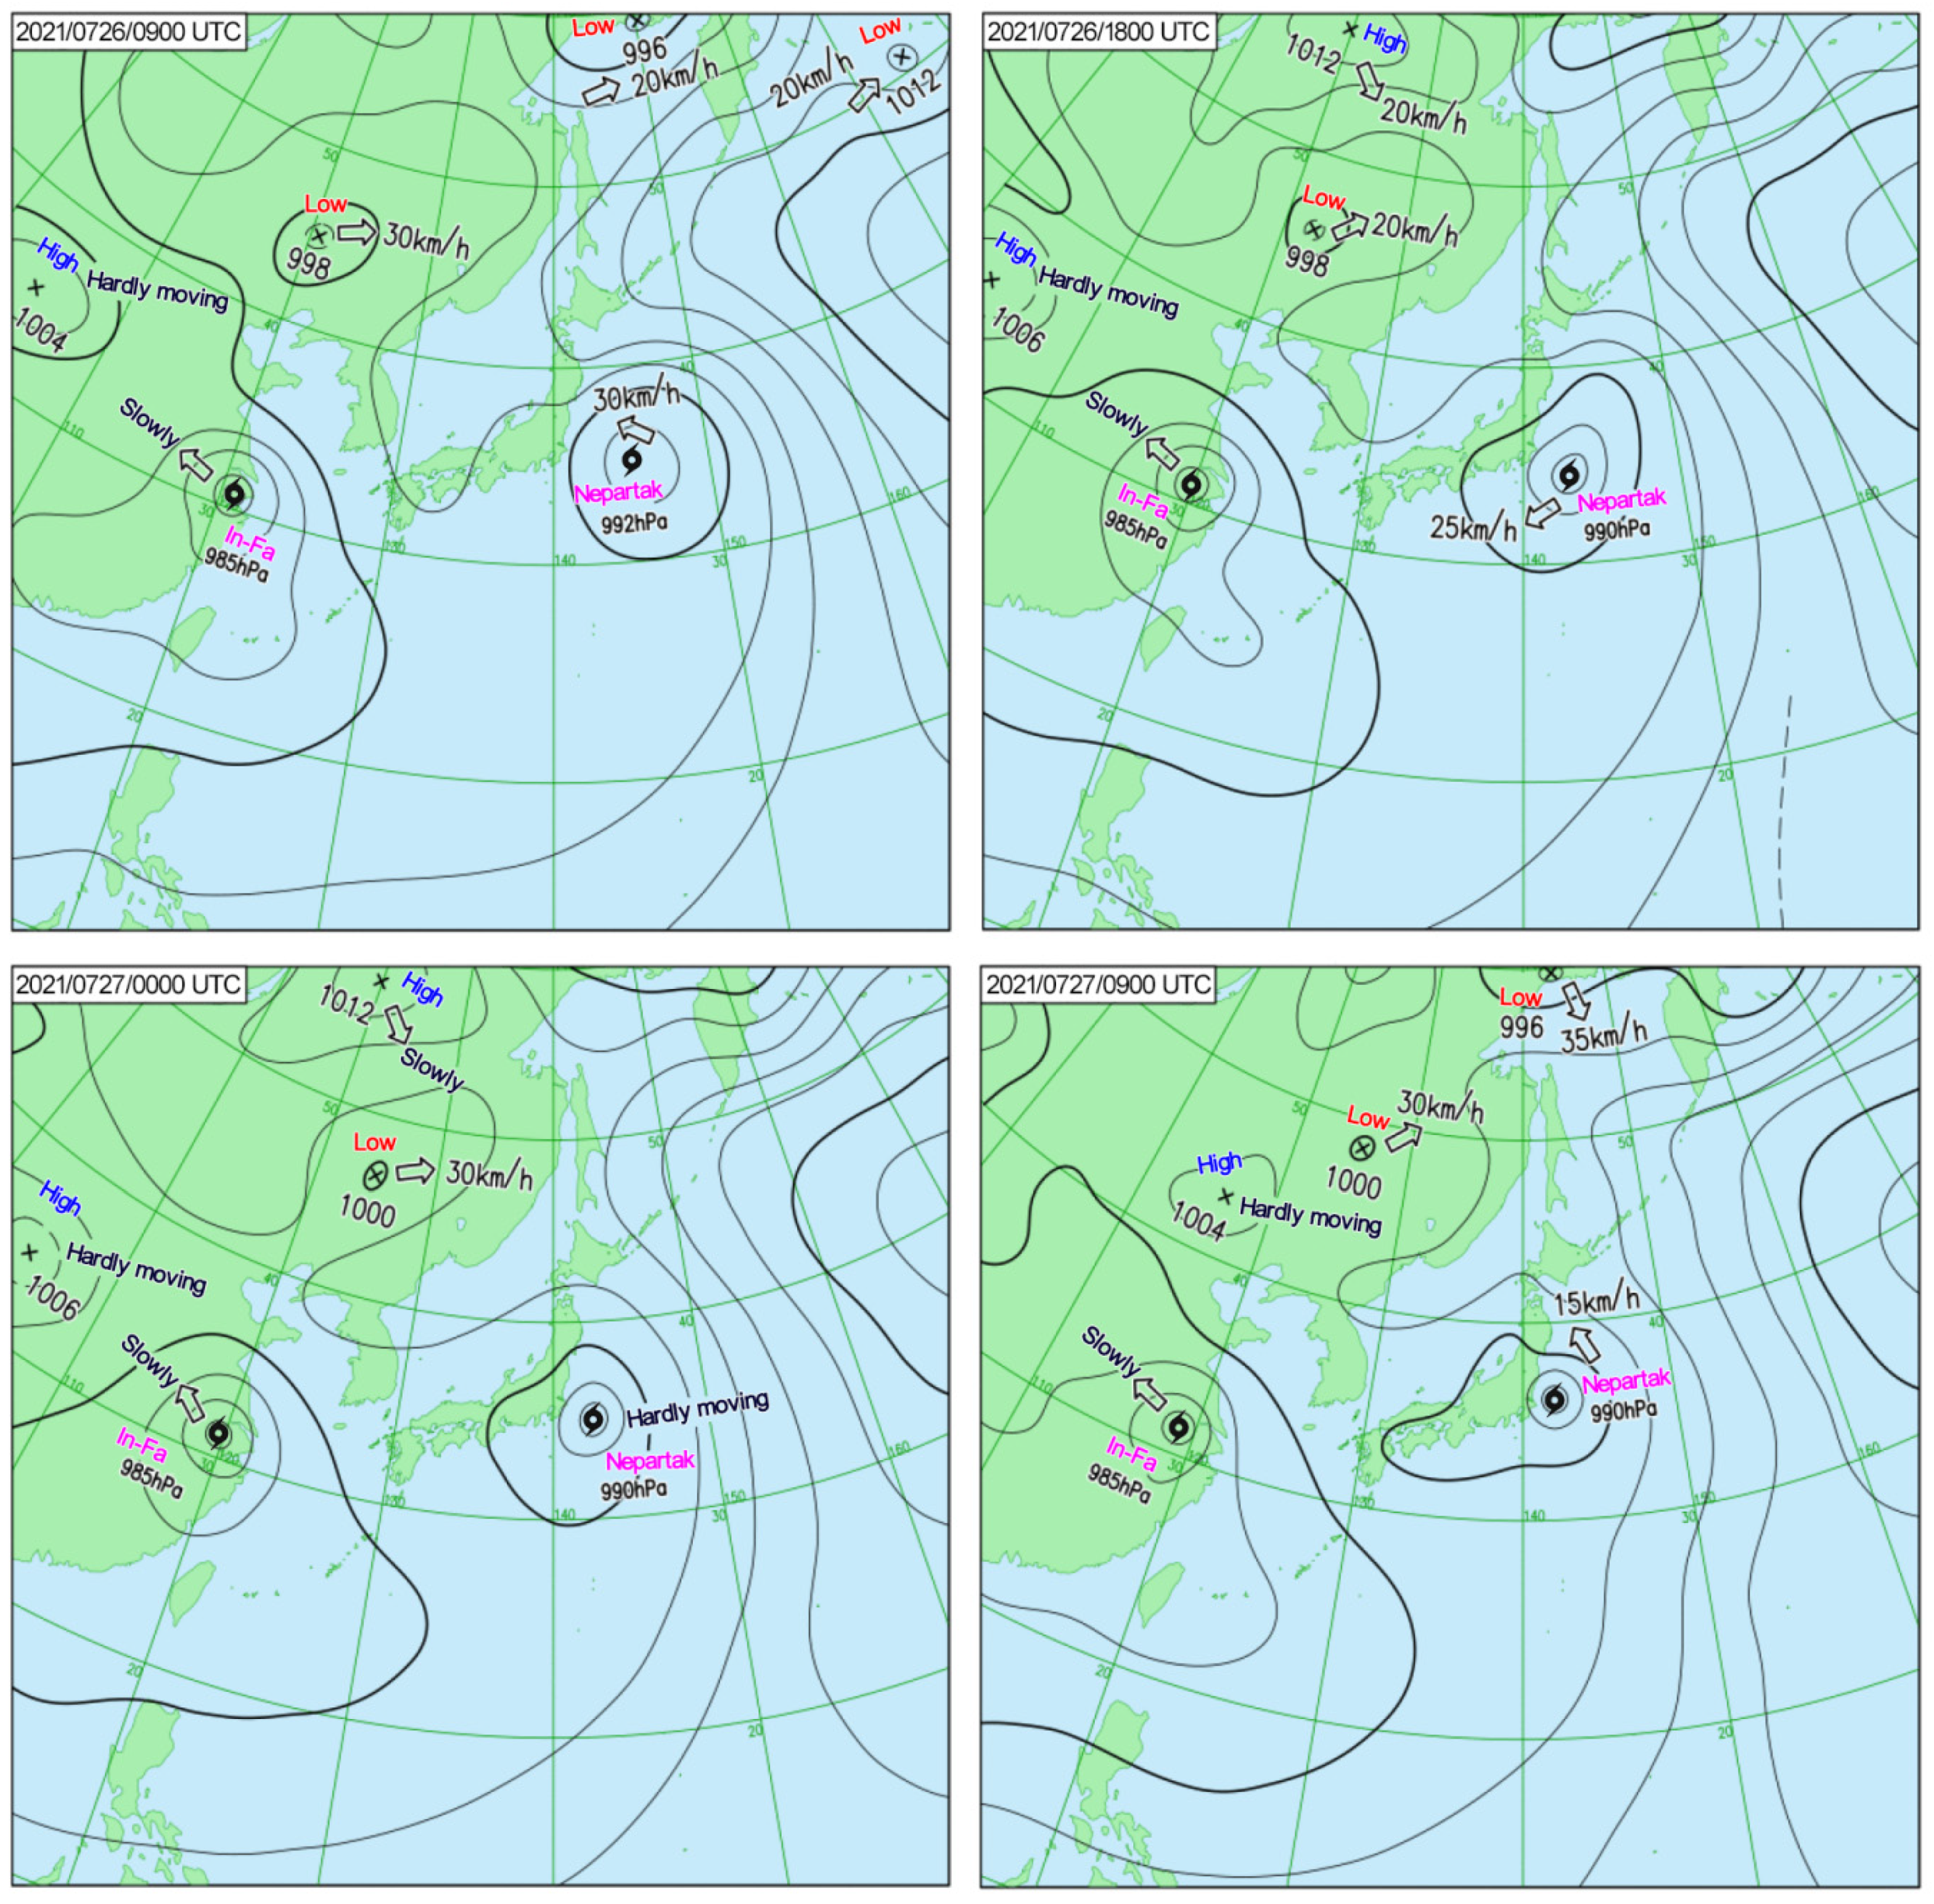
3.1. Analysis of Atmospheric Circulation

As is shown in Figure 1a, Typhoon In-Fa weakened to tropical storm level when entering Jiangsu Province, but still caused extremely severe precipitation in many cities, such as Gaoyou, Jiangdong and other places (Figure 1b and Figure S1). Notably, the cumulative rainfall exceeded 300 mm in both Gaoyou and Jiangdong, and the maximum rain rate in Dongtai reached 237.58 mm per hour at 2021/0728/1003 UTC (Table S1 & Figure 3). According to the atmospheric circulation exhibited in Figure 4, the main reason for the heavy rainfall is that In-Fa was trapped in the saddle field between the range of Western Pacific subtropical high (located around the Korean Peninsula) and the continental high (located around Northern China) during its movement. The guiding airflow that promotes the typhoon’s movement is thereby weakened, resulting in In-Fa’s slow movement speed and long residence time. Figure 1a suggests that Typhoon In-Fa stayed in Jiangsu Province for approximately 37 h (~1.5 days, a new record) and stayed in continental China for up to 95 h (~4 days, also a new record), exerting a serious threat on the safety and property of local residents.

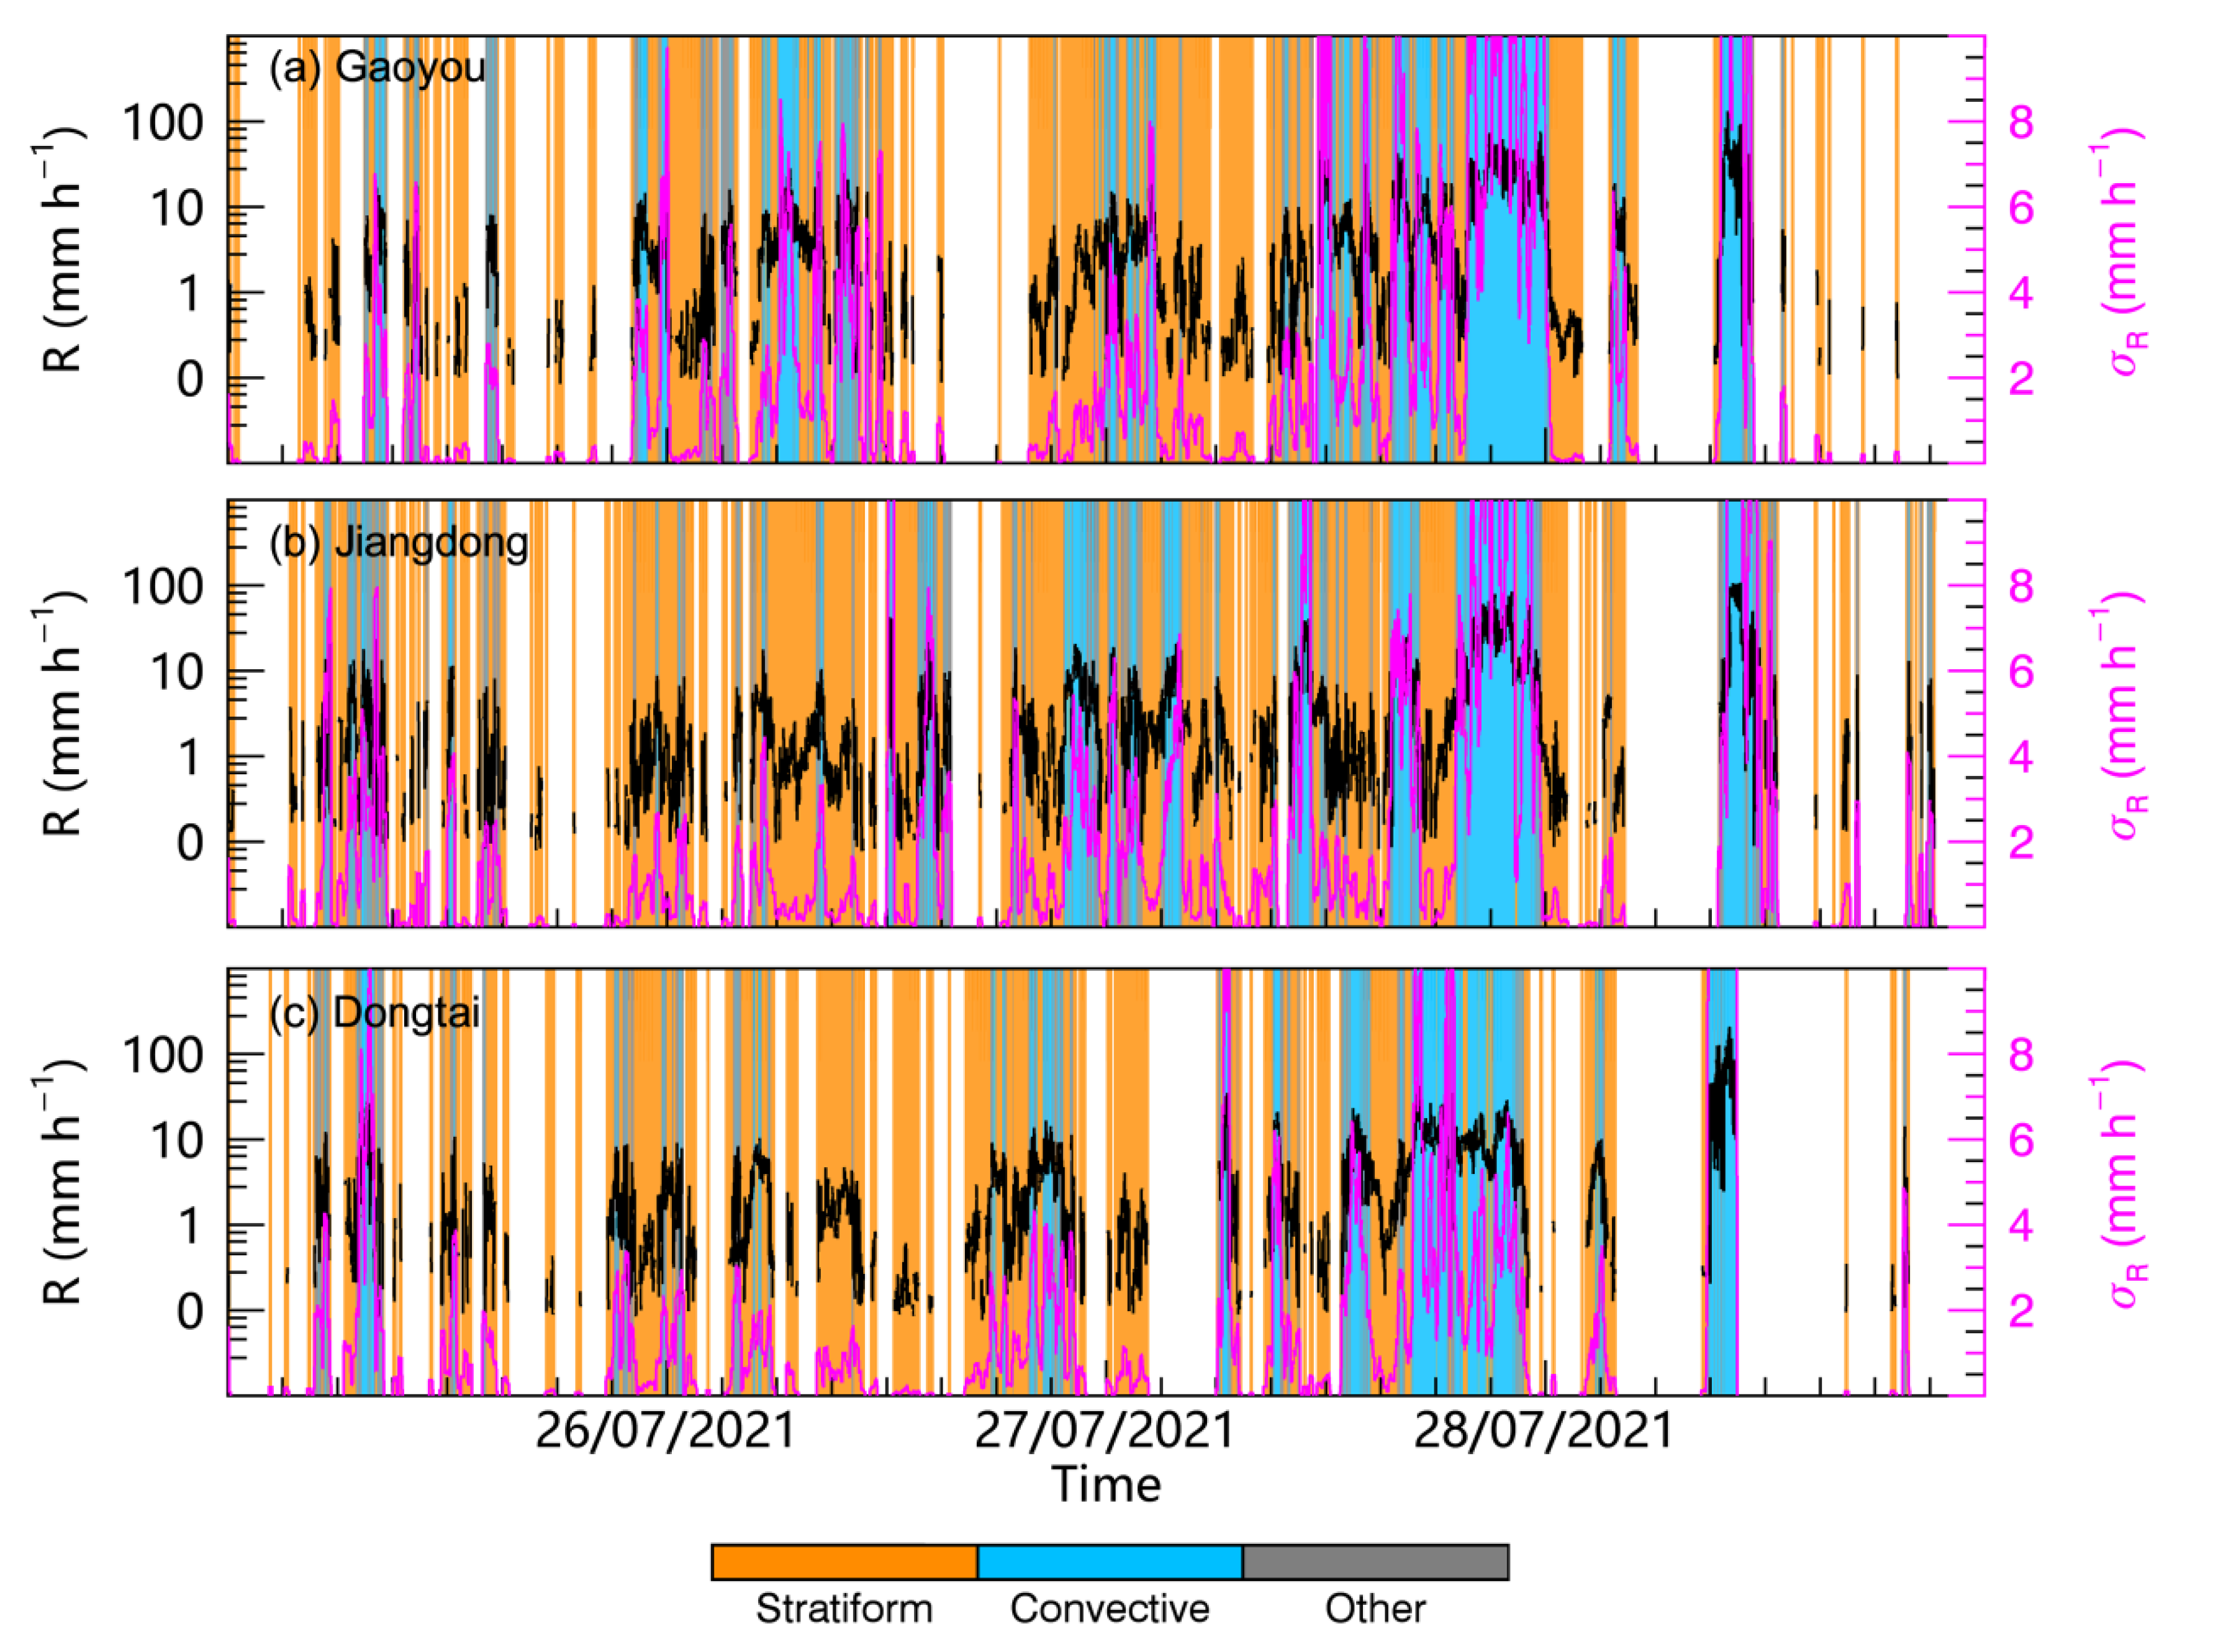
3.2. Precipitation Microphysics from Disdrometer Data

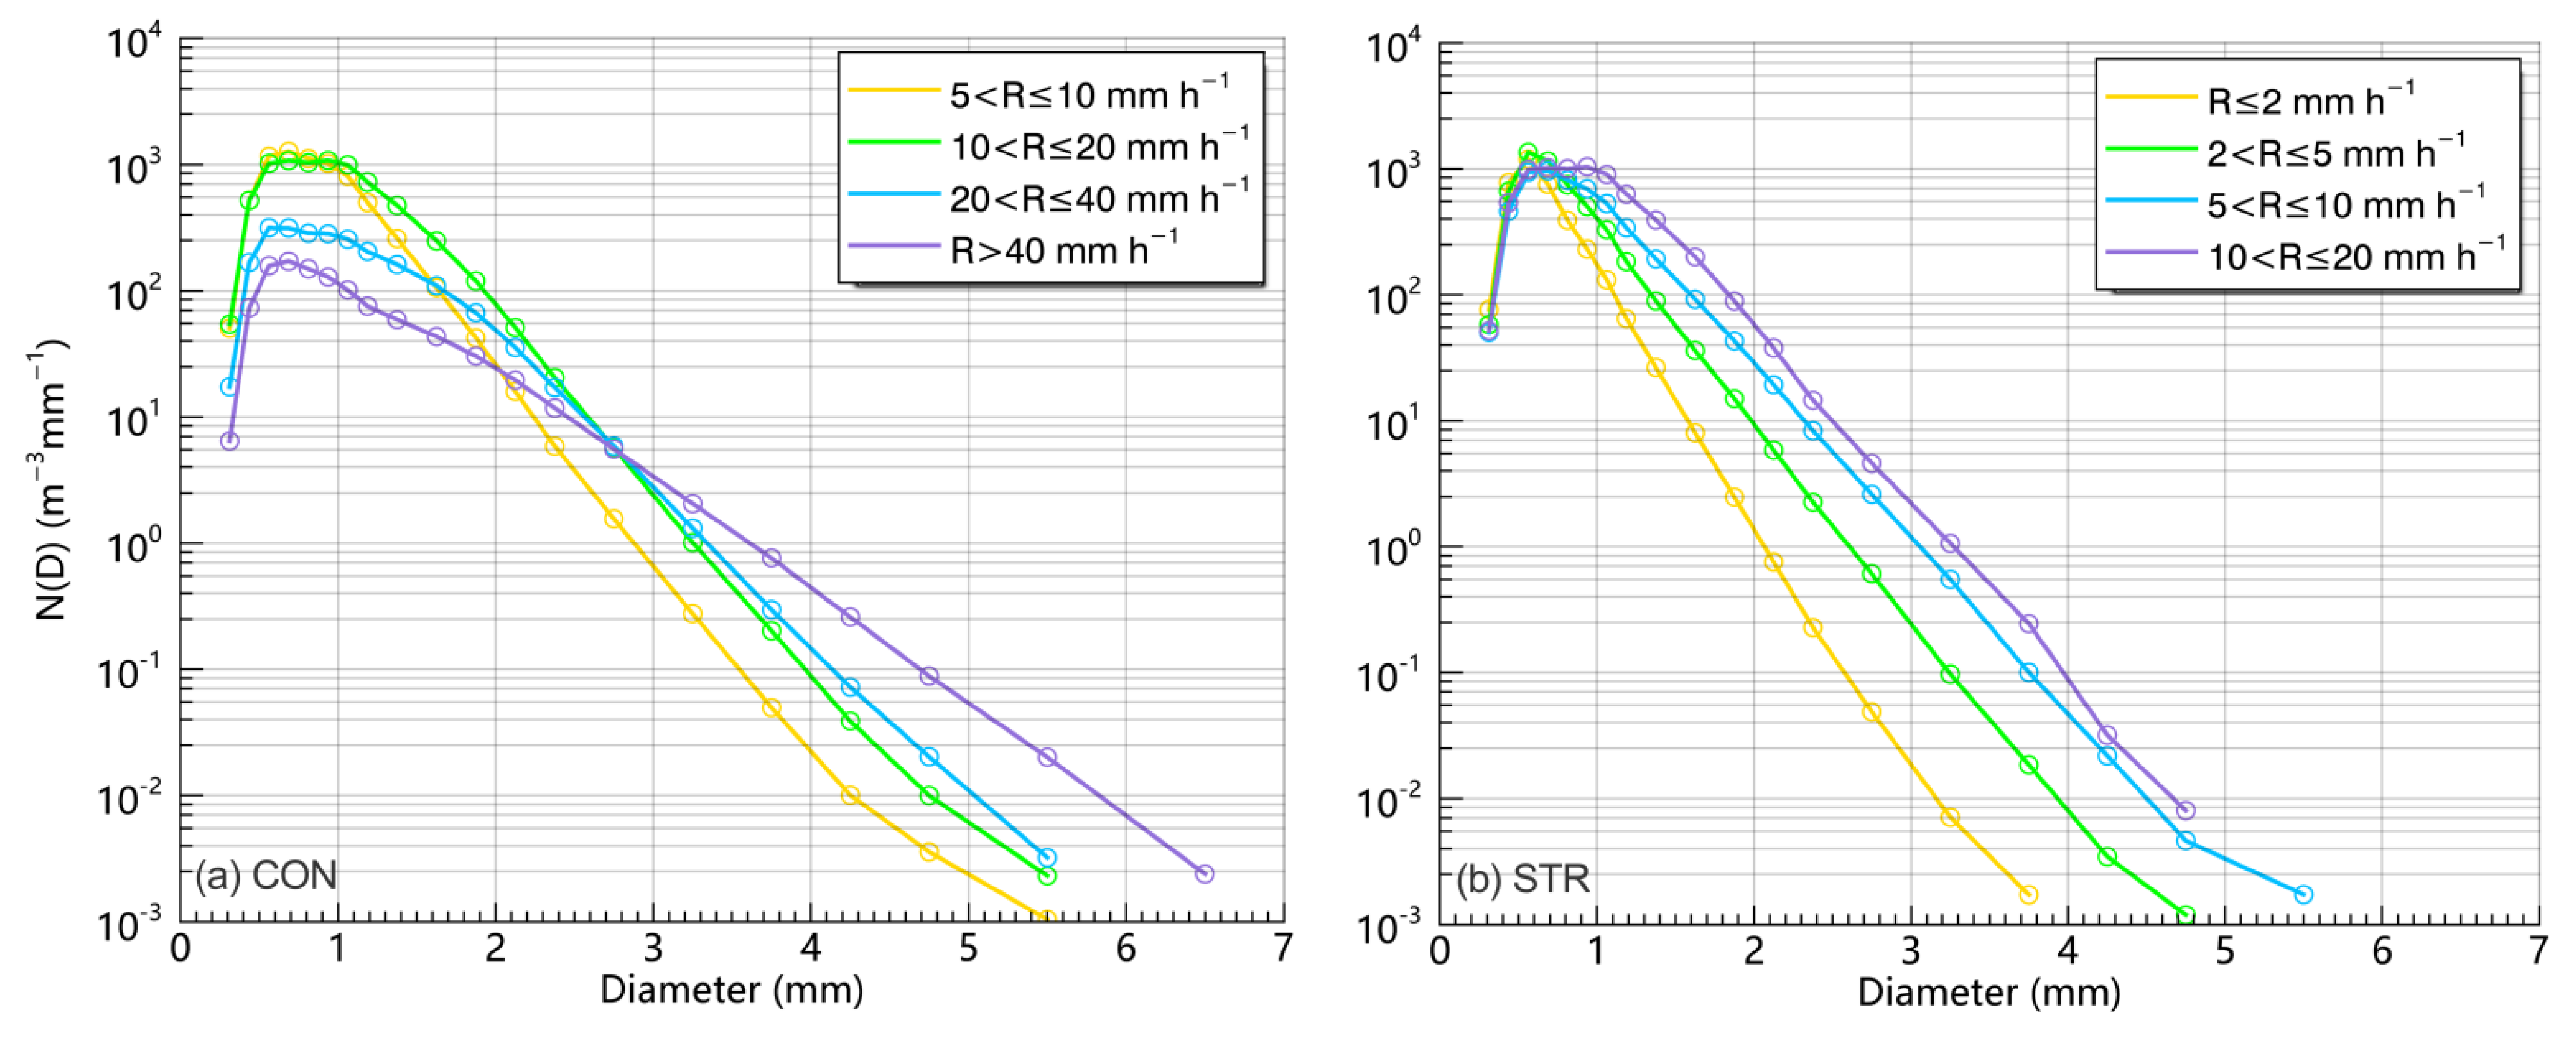
3.2.1. Overall DSD Characteristics

To distinguish the precipitation microphysical differences between two rain types (convective & stratiform), the PARSIVEL measured samples are subdivided into six rain rate (R) ranges, namely R ≤ 2, 2 < R ≤ 5, 5 < R ≤ 10, 10 < R ≤ 20, 20 < R ≤ 40, and R > 40 (unit: mm h−1) [11,12,13]. In addition, large (small) drops are predefined to have diameters larger than 4 mm (smaller than 1 mm), and the diameter of middle-size drops is between 1 mm and 4 mm. The composite raindrop spectrum of two rain types under different rain rates are illustrated in Figure 5. Note that there are barely samples lower than 5 mm h−1 in convective rain, and stratiform rain is basically less than 20 mm h−1.
As the rain rate increases, the evolution of the raindrop spectrum differs significantly from convective rain to stratiform rain (Figure 5). Specifically, for convective rain shown in Figure 5a, the number concentration of large (small) raindrops increases (decreases) remarkably with an increase in rain rate, indicating a dominant collision and coalescence process that increases the number of large raindrops by consuming plenty of small drops. While for stratiform rain shown in Figure 5b, the number concentration of large raindrops increases first as R ≤ 10 mm h−1 and then decreases with rain rates exceeding 10 mm h−1. On the contrary, the variation of small raindrops in stratiform rain is barely noticeable under any rain rates. This reflects a coalescence process at lower rain rates and a collision and breakup process at relatively higher rain rates. Due to that, the middle-size drops show a distinct growth in number concentration (Figure 5b).
Table 1 also gives the statistics of gamma distribution parameters [N0, µ, Λ] for both convective rain and stratiform rain in Typhoon In-Fa. It is obvious that stratiform rain shows a larger mean value of µ than convective rain, indicating a more convex raindrop spectral shape of stratiform rain. This is consistent with the significant increase of middle-size drops shown by the composite spectrum in Figure 5b. Meanwhile, convective rain also shows smaller mean values of N0 and Λ than those of stratiform rain. This is because the coalescence process of raindrops dominates the formation of convective precipitation as analyzed in Figure 5a, which decreases the number concentration and increases the median volume drop diameter (D0), thus leading to smaller N0 and Λ (Λ = 3.67/D0) [28].

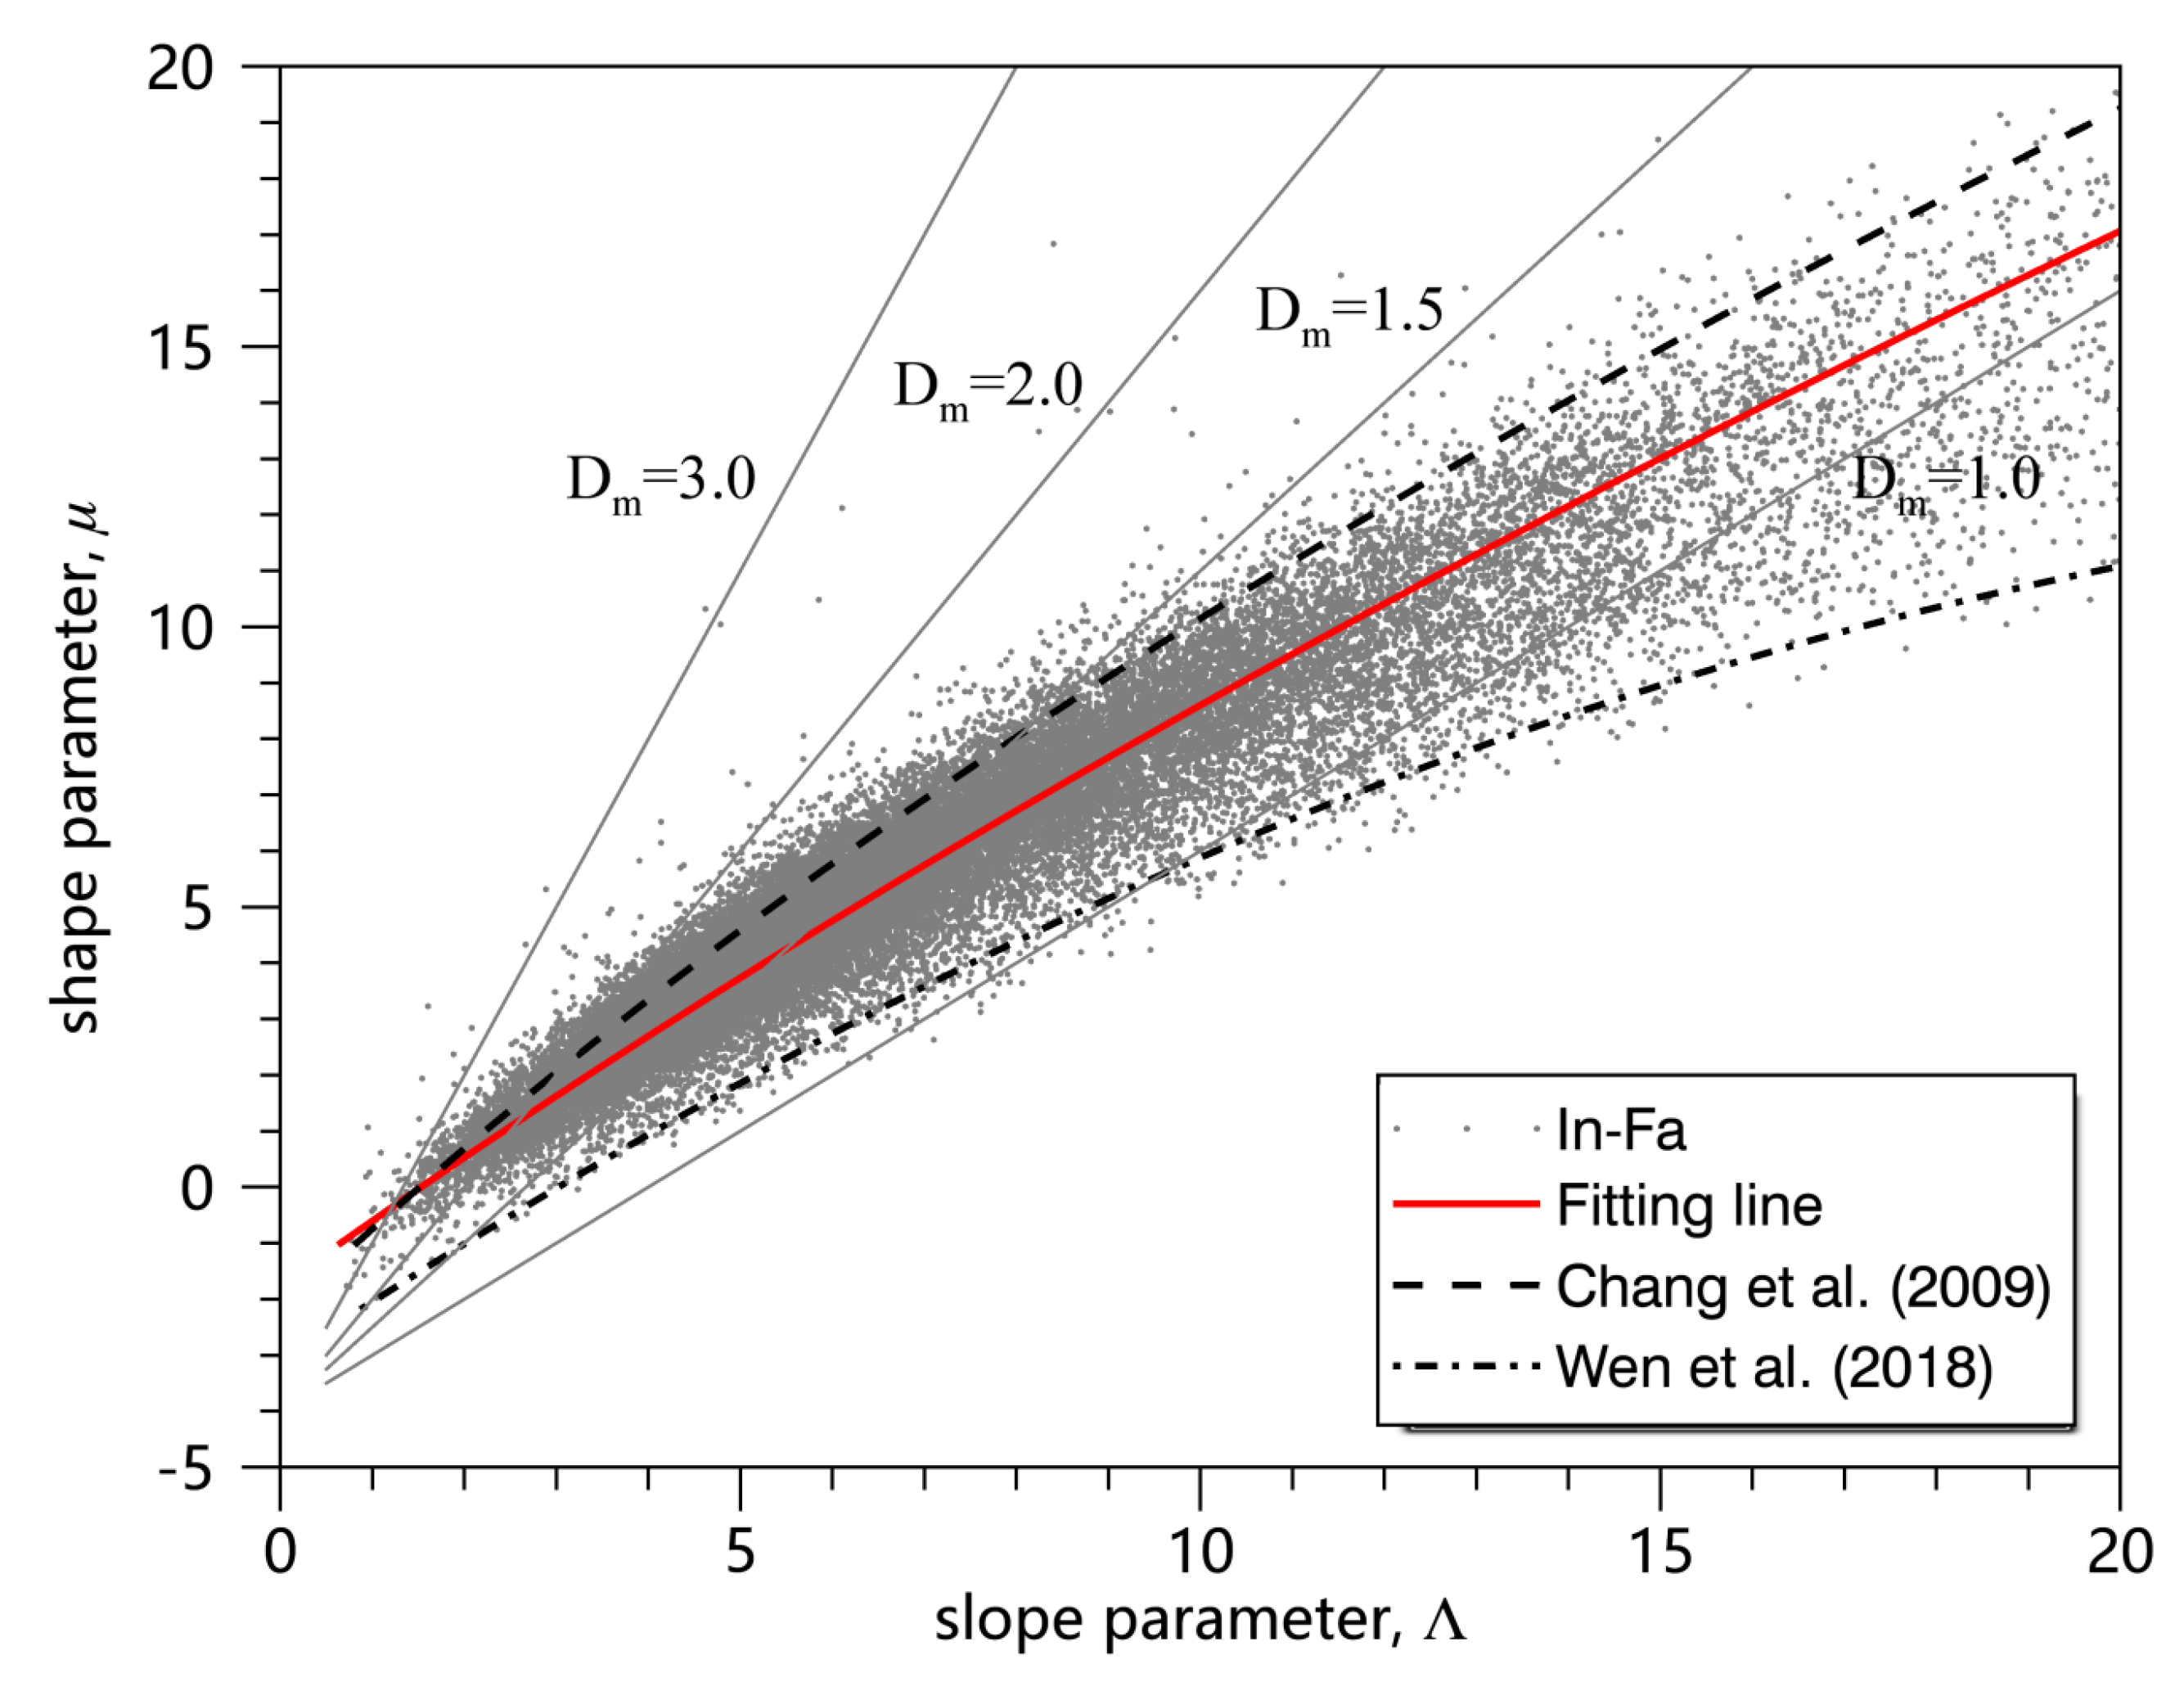
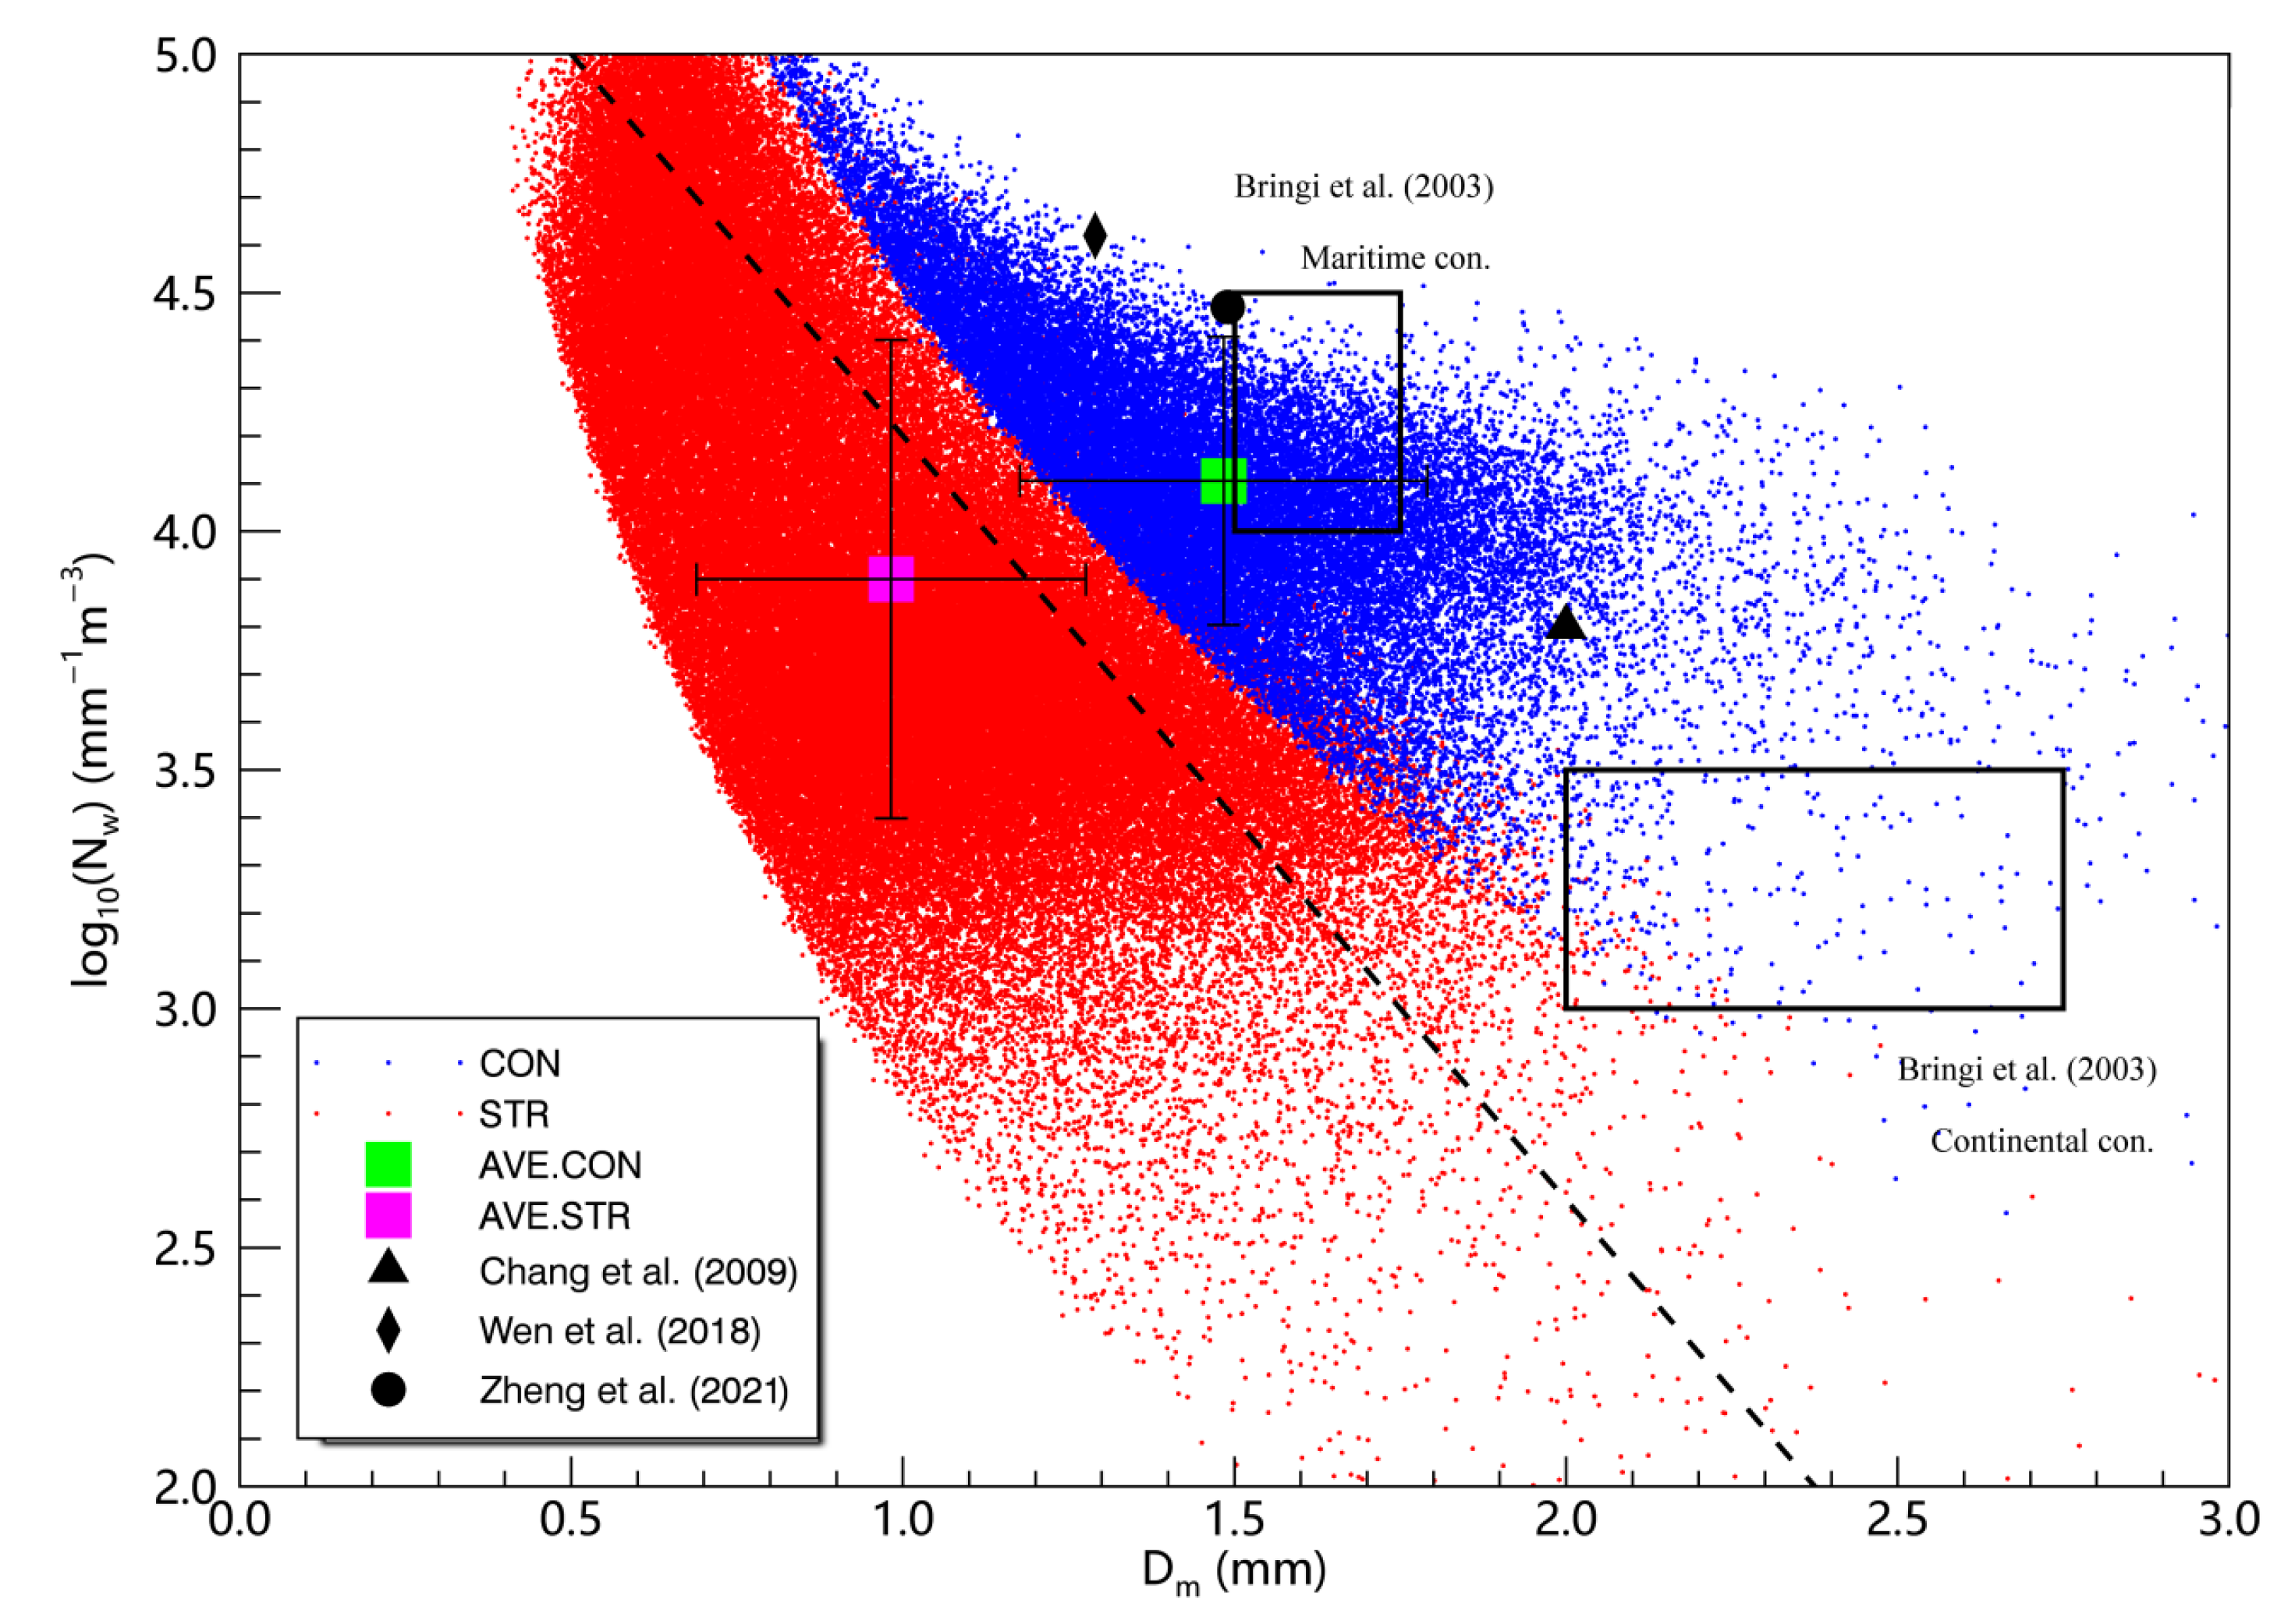
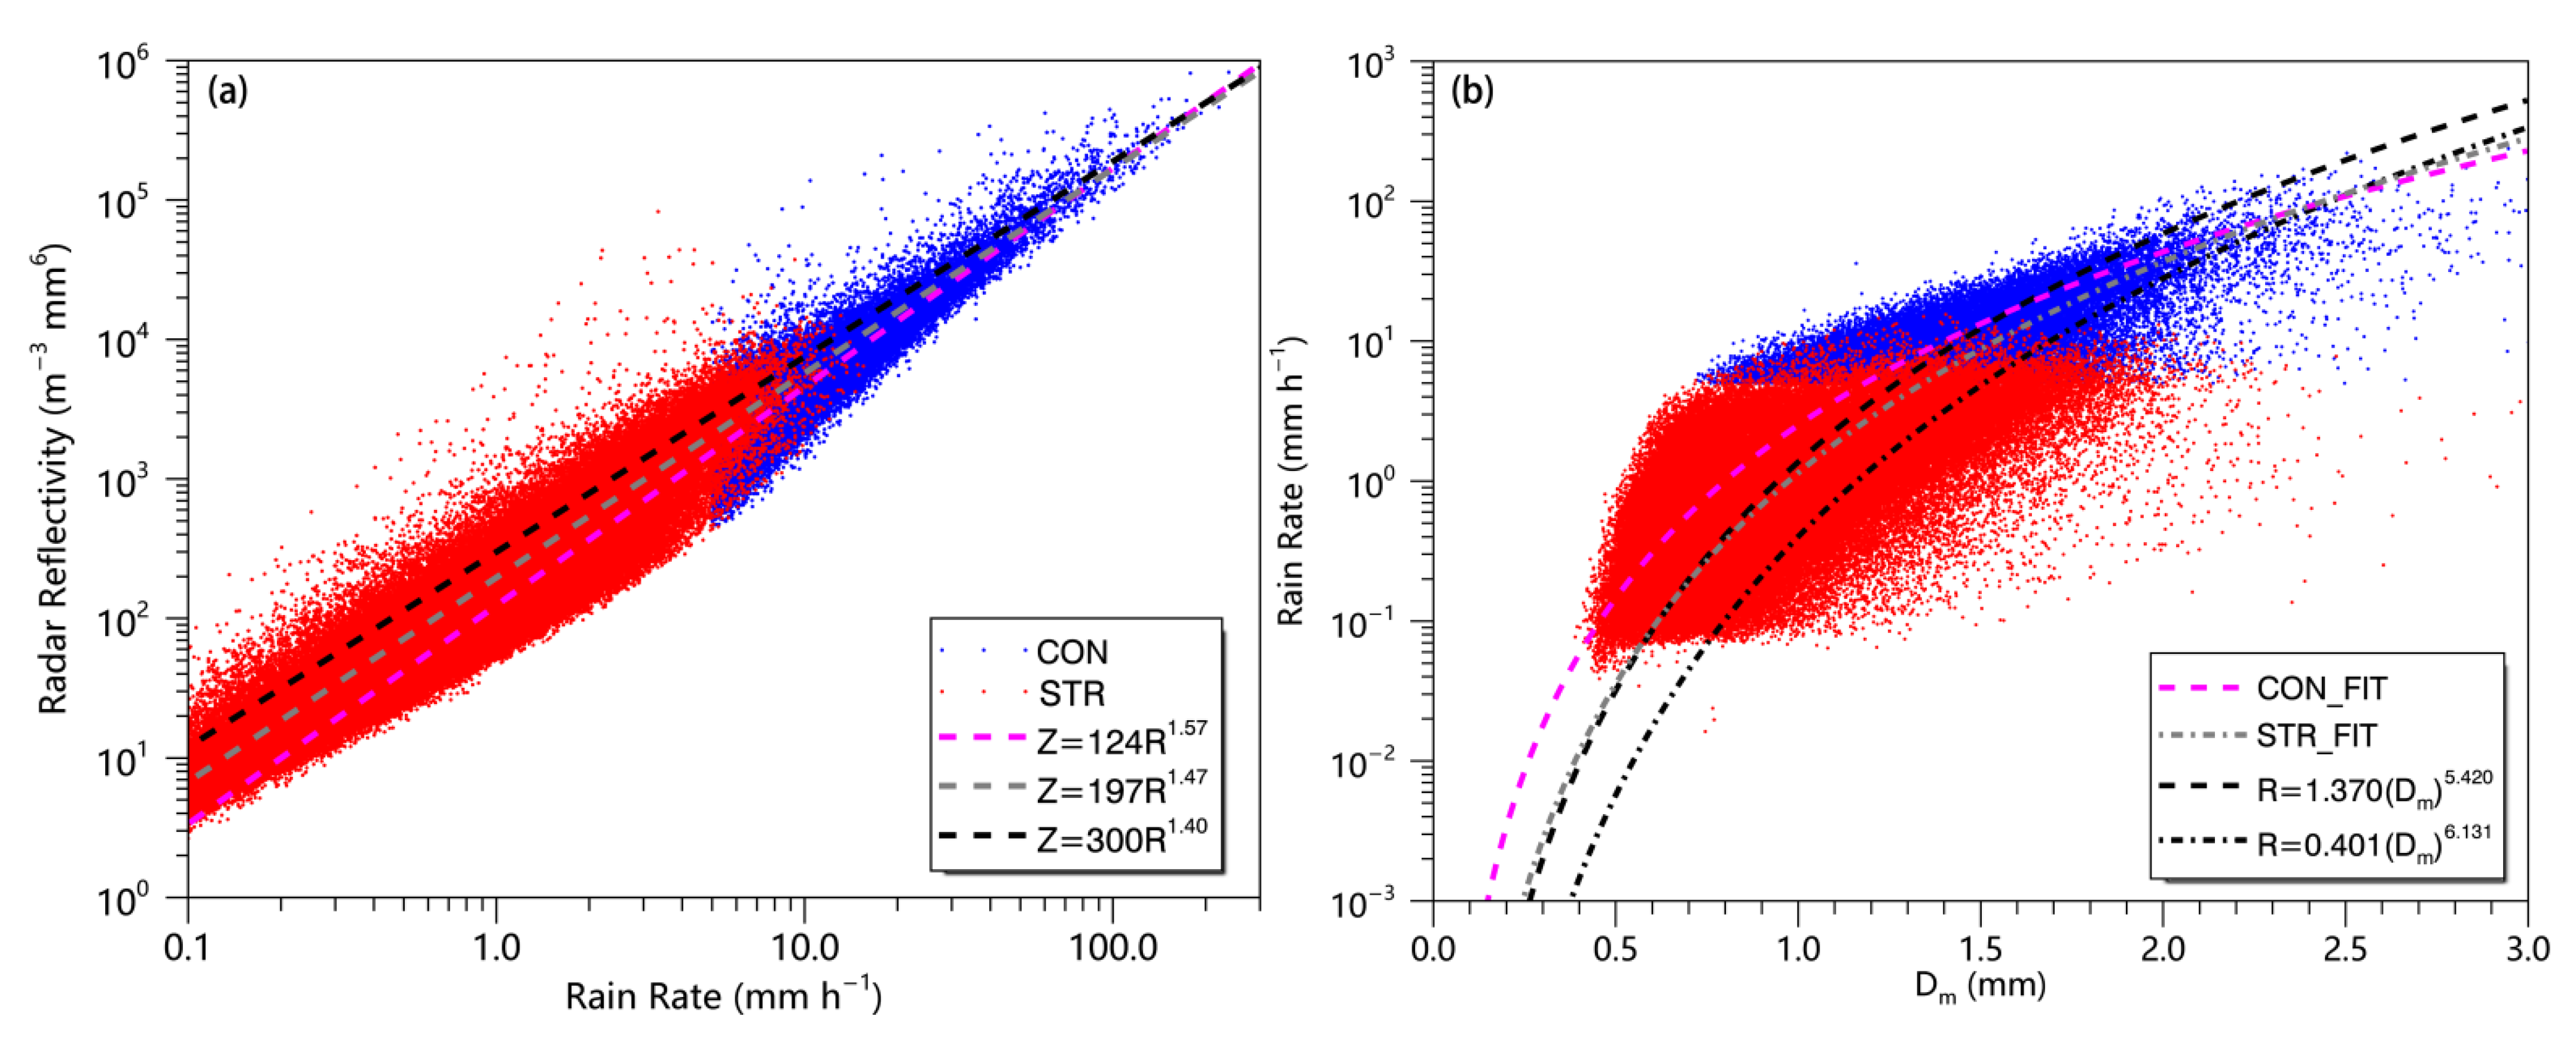
3.2.2. DSD Derived Relationships

Parameters µ and Λ of the gamma distribution (Equation (6)) are inherently correlated and are empirically expressed as a second-degree polynomial µΛ relationship [22]. The µΛ empirical relationship is broadly adopted to depict the DSD features in typhoon precipitation [2,3,4,5,6,7]. It is also reported that µΛ relationship can be utilized to constrain gamma distribution and retrieve DSD from measurements of polarimetric radars [22]. Recent research suggested that the µΛ relationship of typhoon precipitation changes with different climate regimes [2,3,4,5,6,7]. Chang et al. [2] derived the µΛ relationship of typhoons using disdrometer measurements in Taiwan. Wen et al. [3] obtained the µΛ relationship in continental China during typhoons landfall. It is necessary to derive the unique µΛ relationship for precipitation of landfalling typhoon In-Fa (2021).
It is reported by Zhang et al. [29] that µ and Λ exhibited a higher correlation after filtering DSD samples with rain rates larger than 5 mm h−1 and number counts more than 1000. Following the data filtering process in Zhang et al. [29], the scatterplot of µ and Λ in Typhoon In-Fa are obtained using the truncated moment method introduced in Section 2.3. A native µΛ relationship was accordingly derived for Typhoon In-Fa as Λ = 0.012μ2 + 0.886μ + 1.530. The µ and Λ scatter points and their fitting results are illustrated in Figure 6. For gamma distribution, the µΛ relationship can be related to raindrop diameter Dm via the formula of ΛDm = 4 + μ [30]. The larger slope of the µΛ relationship thereby corresponds to higher Dm values. As shown in Figure 6, compared to the fit of typhoon rain from Chang et al. [2], our fits appear in the lower Dm region, which suggests that the DSDs of typhoon systems measured in Jiangsu have lower Dm values than those observed in Taiwan. While compared to the fit of typhoon rain from Wen et al. [3], our fits appear in the higher Dm region, which suggests that the DSDs of typhoon In-Fa have higher Dm values than other typhoons landing in continental China.
To further compare the raindrop size and concentration of Typhoon In-Fa with those of other climatic regimes, Figure 7 gives the scatter diagram of log10(Nw) and Dm for the convective and stratiform rain types of In-Fa based on the PARSIVEL disdrometer network in Jiangsu. The results from other typhoon studies are also included in Figure 7 for comparison. Note the double black rectangles on the scatter diagram are correspondent to the maritime-like and continental-like convective categories proposed by Bringi et al. [23]. As shown in Figure 7, the stratiform rain samples of Typhoon In-Fa are lower than the stratiform line in Bringi et al. [23]. The typhoon convective precipitation of In-Fa can be identified as more maritime-like rather than continental-like, which is possibly influenced by the sufficient water vapor transported from the western Pacific ocean during typhoon landfall. Compared with other typhoons convective precipitation measured by disdrometers in Hainan [7] and Taiwan [2], the precipitation measured in Jiangsu shows significant regional differences. The raindrop concentration seems highest in Hainan (log10(Nw) = 4.47), followed by Jiangsu (log10(Nw) = 4.11), while Taiwan shows the lowest number concentration of raindrops (log10(Nw) = 3.8). The mean diameter seems largest in Taiwan (Dm = 2), followed by Hainan (Dm = 1.49), while Jiangsu shows the smallest drop diameter (Dm = 1.48). The typhoon convective precipitation measured in Jiangsu and Hainan seems more maritime-like than precipitation in Taiwan, which could be related to the topography effect of the Central Range that enhances the convection in Taiwan [2]. Compared with other typhoons’ convective precipitation measured in continental China [3], Typhoon In-Fa has a distinctly larger raindrop diameter but smaller raindrop concentration.

3.3. Radar Quantitative Rain Rate Estimation

One vital assumption used in both single and double frequency rainfall retrieval algorithms for GPM DPR is the relationship between rain rate (R) and Dm [19,31]. R-Dm relationships are derived for stratiform and convective rain respectively to compute specific attenuation and equivalent radar reflectivity for a given rain rate at both Ku and Ka bands. Currently, the R-Dm relationships used in the official algorithm for retrieving convective rain and stratiform rain are R = 1.370Dm5.420 and R = 0.401Dm6.131, respectively [19]. Nevertheless, the GPM relationships are derived according to precipitation measurements in the tropics [31,32,33], which might not suit the rainfall estimation of a typhoon in the mid-latitudes. To improve the quantitative rain rate estimation of both ground radar and spaceborne radar, in this section, we derived the native Z-R and R-Dm relationship of Typhoon In-Fa by employing the measurements of disdrometer network in Jiangsu. Figure 8 gives the scatter diagrams and fitting curves of Z-R and R-Dm for both convective rain and stratiform rain in Typhoon In-Fa. The fitting results are obtained via the least-squares method and are presented in Table 2 as well.
For comparison, the standard Z-R relationship (Z = 300R1.4) used in the Next-Generation Weather Radar of the United States (NEXRAD) [34] is also shown in Figure 8a. It is noted that NEXRAD generally underestimates the rain rate in Typhoon In-Fa given the same radar reflectivity. The difference is expected to be associated with the special DSD features of the typhoon precipitation over eastern China and inspires us to develop the native radar QPE relationship for preventing typhoon disasters. Apart from ground radar, spaceborne radar also contributes to the prevention and mitigation of typhoon disasters. The current R-Dm relationships in the GPM official product are also compared with our fitting results as shown in Figure 8b. It is noted that GPM seems to slightly underestimate the drop diameter in Typhoon In-Fa given the same rain rate. This can be related to the latitudinal variability of DSD, the precipitation measured in Tropics might have a smaller drop diameter than typhoon precipitation in mid-latitudes. Furthermore, the GPM product is evaluated by comparison with PARSIVEL disdrometer observations in the next section.

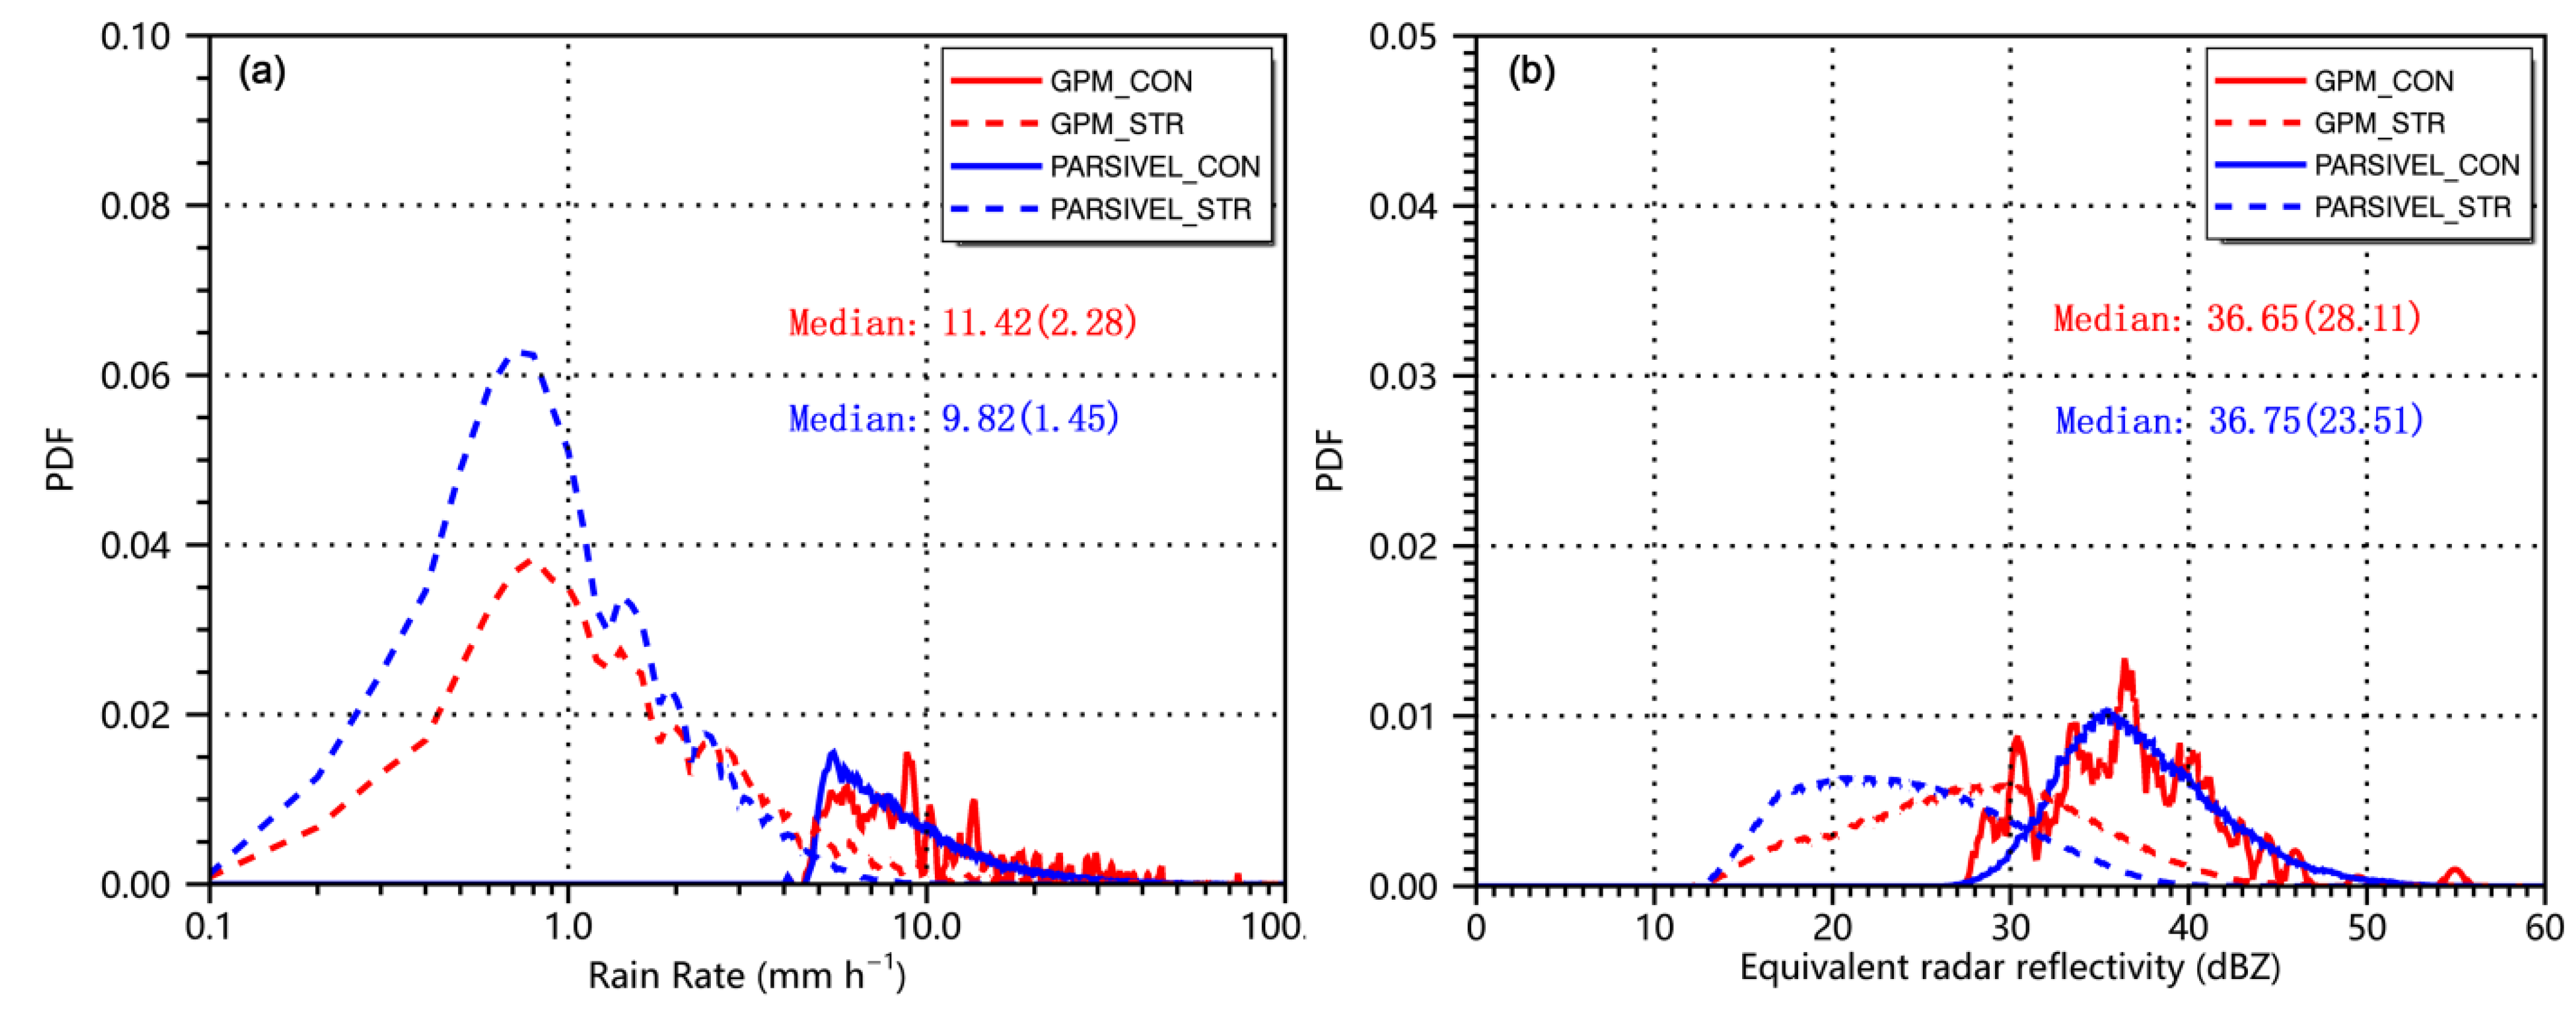
3.4. Statistical Assessment on GPM DPR

Surface disdrometer networks can also be utilized to evaluate the product quality of GPM satellites. One important caveat is that merely a limited amount of GPM pixels are typically available from a single overpass. Besides, the matching between GPM and disdrometer stations is quite difficult. To overcome the “snapshot” view from GPM DPR over a footprint of 5 km × 5 km versus almost continuous DSD measurements from disdrometers, a statistical comparison between GPM and PARSIVEL is performed. Figure 9 shows the comparison results of PARSIVEL disdrometers and GPM DPR measurements for near-surface rain rate (Figure 9a) and equivalent radar reflectivity (Figure 9b) in Typhoon In-Fa. The comparisons are conducted separately for convective rain and stratiform rain by using the rain classification method in Section 2.4. The results are expressed in the form of a probability distribution function (PDF) that provides valuable information when different instruments are compared. As shown in Figure 9a, the PDF curve shapes of PARSIVEL (blue line) and GPM (red line) exhibit high correlations, and both are characterized with four peaks (around 0.8, 1.4, 1.9, 2.4 mm h−1, respectively) in the rain rate of the stratiform region. Similar to the rain rate, there are also strong connections between PARSIVEL and GPM in terms of radar reflectivity (Figure 9b), and both show a single peak in the PDF of radar reflectivity for stratiform rain. The rain rate and radar reflectivity for convective rain also show a plausible consistency between GPM and PARSIVEL, although the PDFs of GPM fluctuate distinctly (Figure 9a,b) due to the relatively smaller sample size of GPM than PARSIVEL (Table 3).
Besides, the probability of lower rain rates or radar reflectivity (i.e., light rain) is higher in the PDFs of PARSIVEL than that of GPM (Figure 9a,b). In addition, the median values of rain rate are smaller in PARSIVEL (9.82 mm h−1 for convective rain and 1.45 mm h−1 for stratiform rain) than GPM (11.42 mm h−1 for convective rain and 2.28 mm h−1 for stratiform rain), and the median values of radar reflectivity are also smaller in PARSIVEL (23.51 dBZ for stratiform rain) than GPM (28.11 dBZ for stratiform rain), except for convective rain area where PARSIVEL (36.75 dBZ for convective rain) shows a slightly larger median value of radar reflectivity than that of GPM (36.65 dBZ for convective rain). Table 3 also presents the GPM–PARSIVEL normalized bias (NB) statistic adapted from Wu et al. [12]. The statistical results indicate that GPM products may overestimate rain rate and radar reflectivity in stratiform rain (NB > 0), while slightly underestimating radar reflectivity in convective rain (NB < 0). Meanwhile, the NB of radar reflectivity (−0.27% for convective rain and 19.6% for stratiform rain) is much smaller than that of rain rate (16.3% for convective rain and 57.2% for stratiform rain), suggesting the GPM rain-retrieval algorithm that converting radar reflectivity into rain rate still needs major improvements. In comparison between different rain types, the NB of convective rain (16.3% for rain rate and −0.27% for radar reflectivity) is much less than that of stratiform rain (57.2% for rain rate and 19.6% for radar reflectivity), indicating that GPM product might have better performance for convective rain than stratiform rain of typhoon over Jiangsu Province.

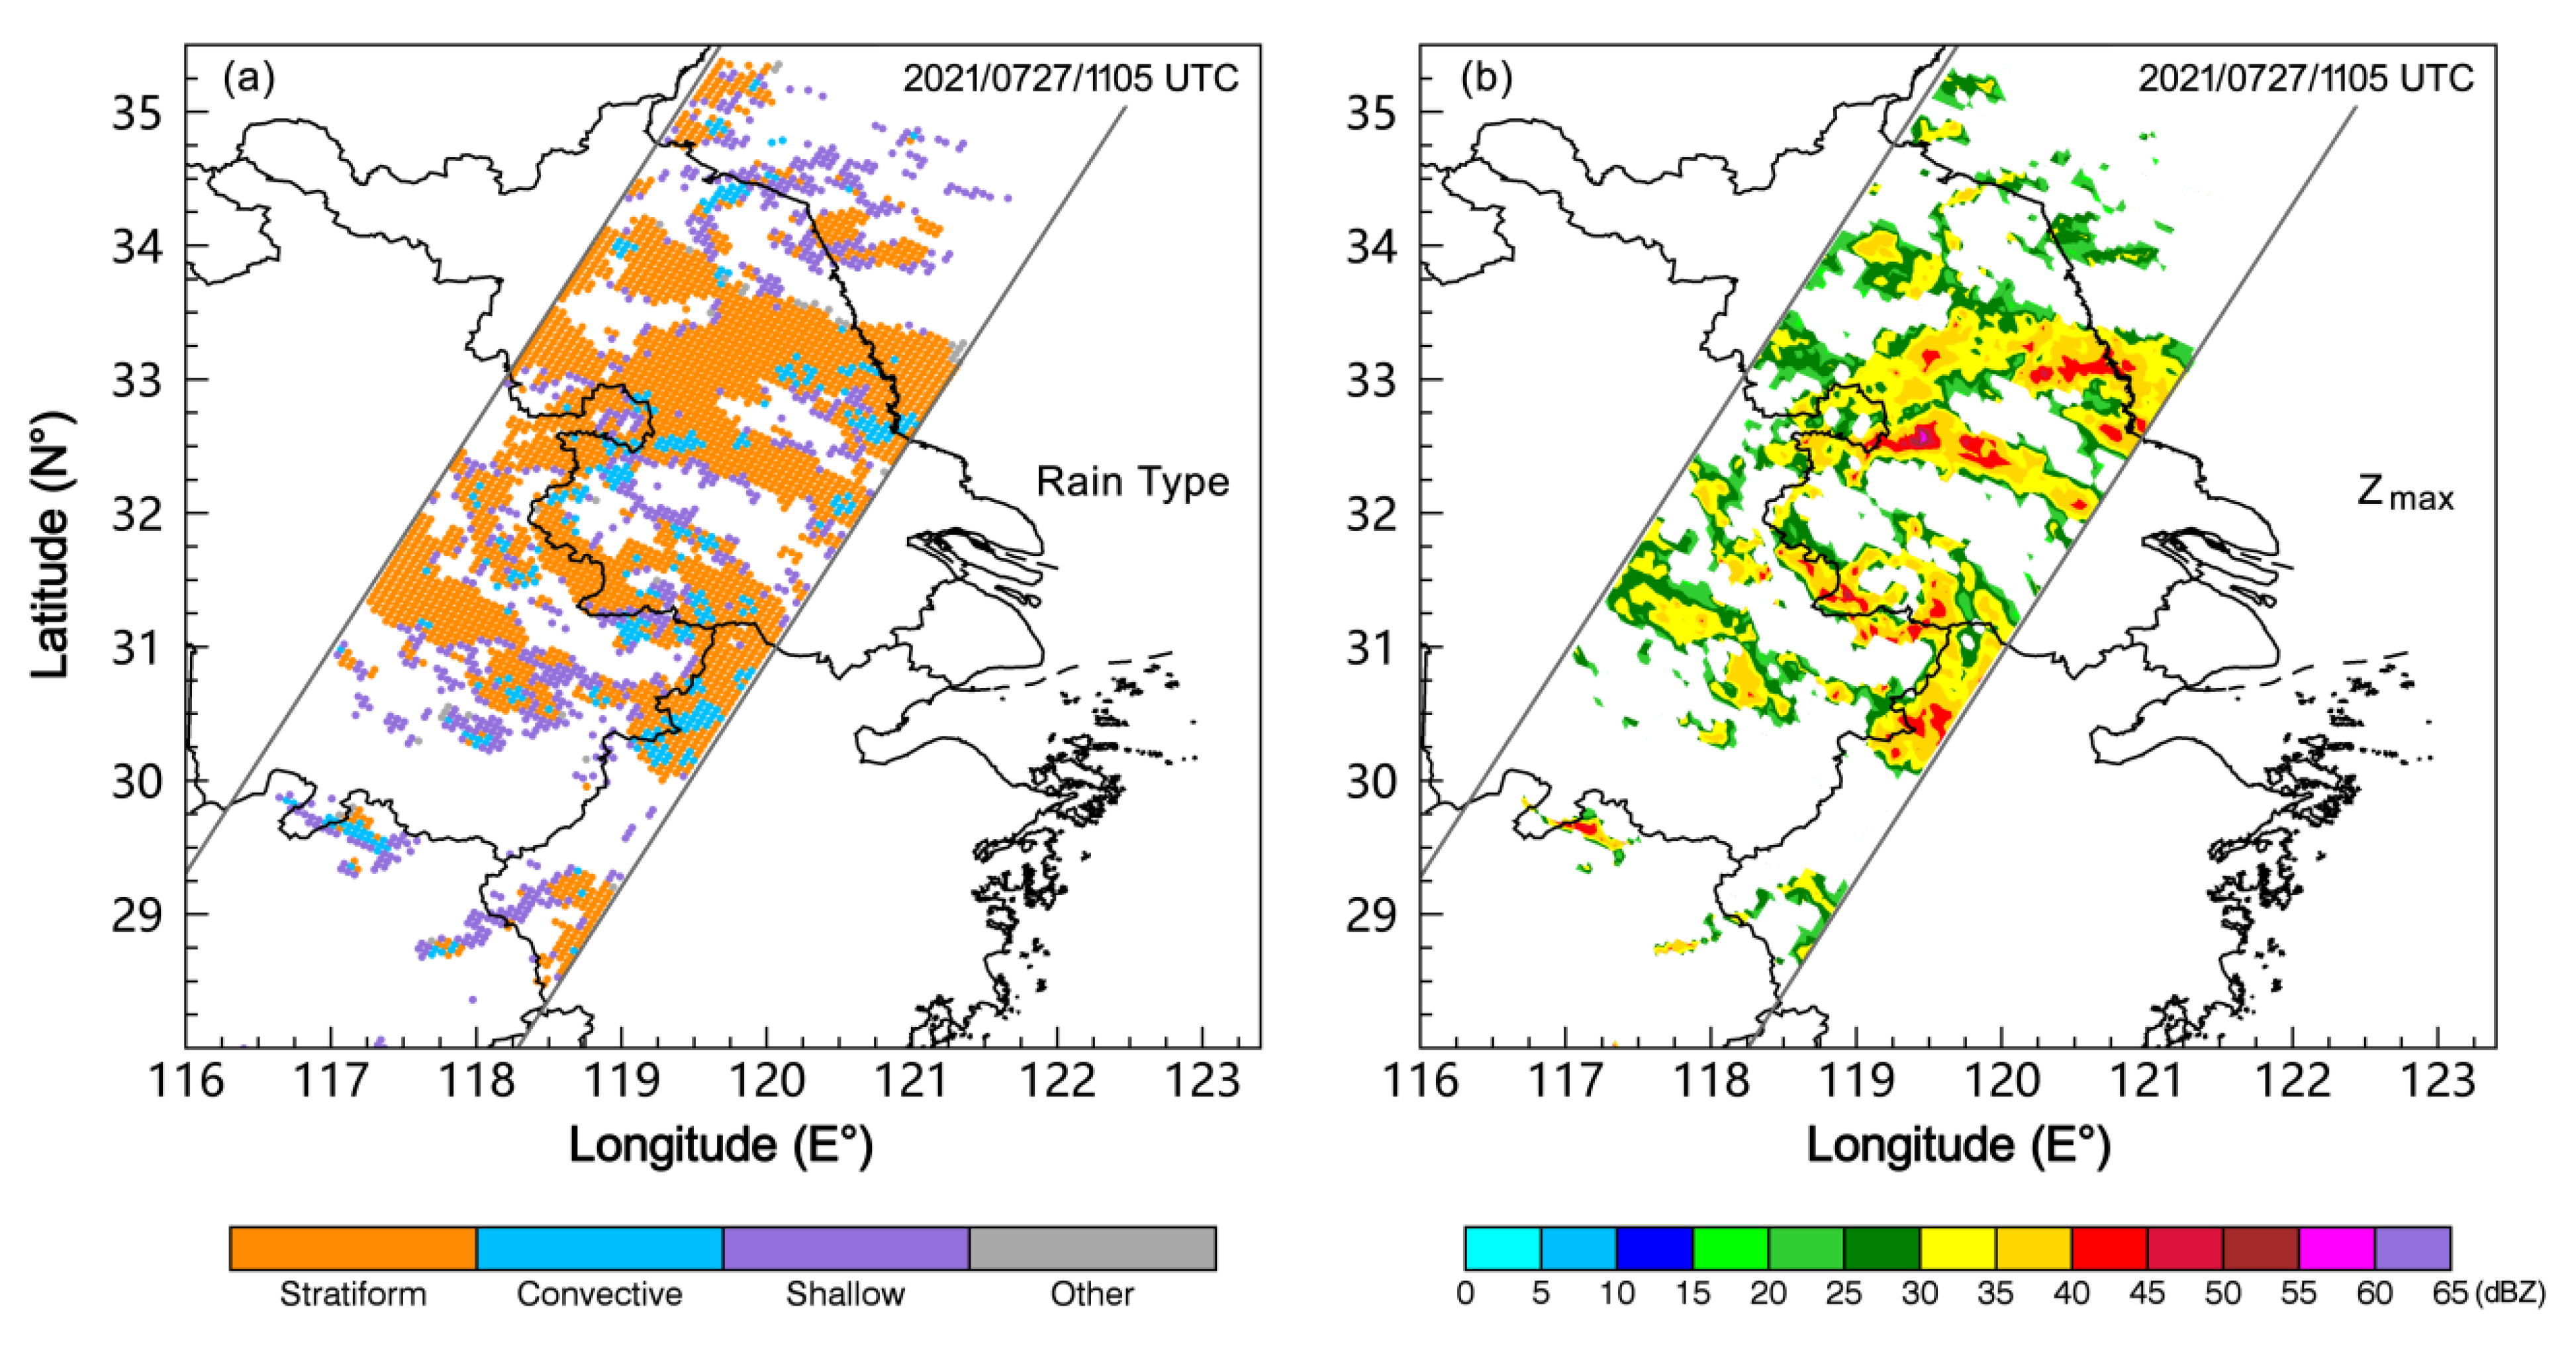
3.5. Precipitation Microphysics from GPM DPR

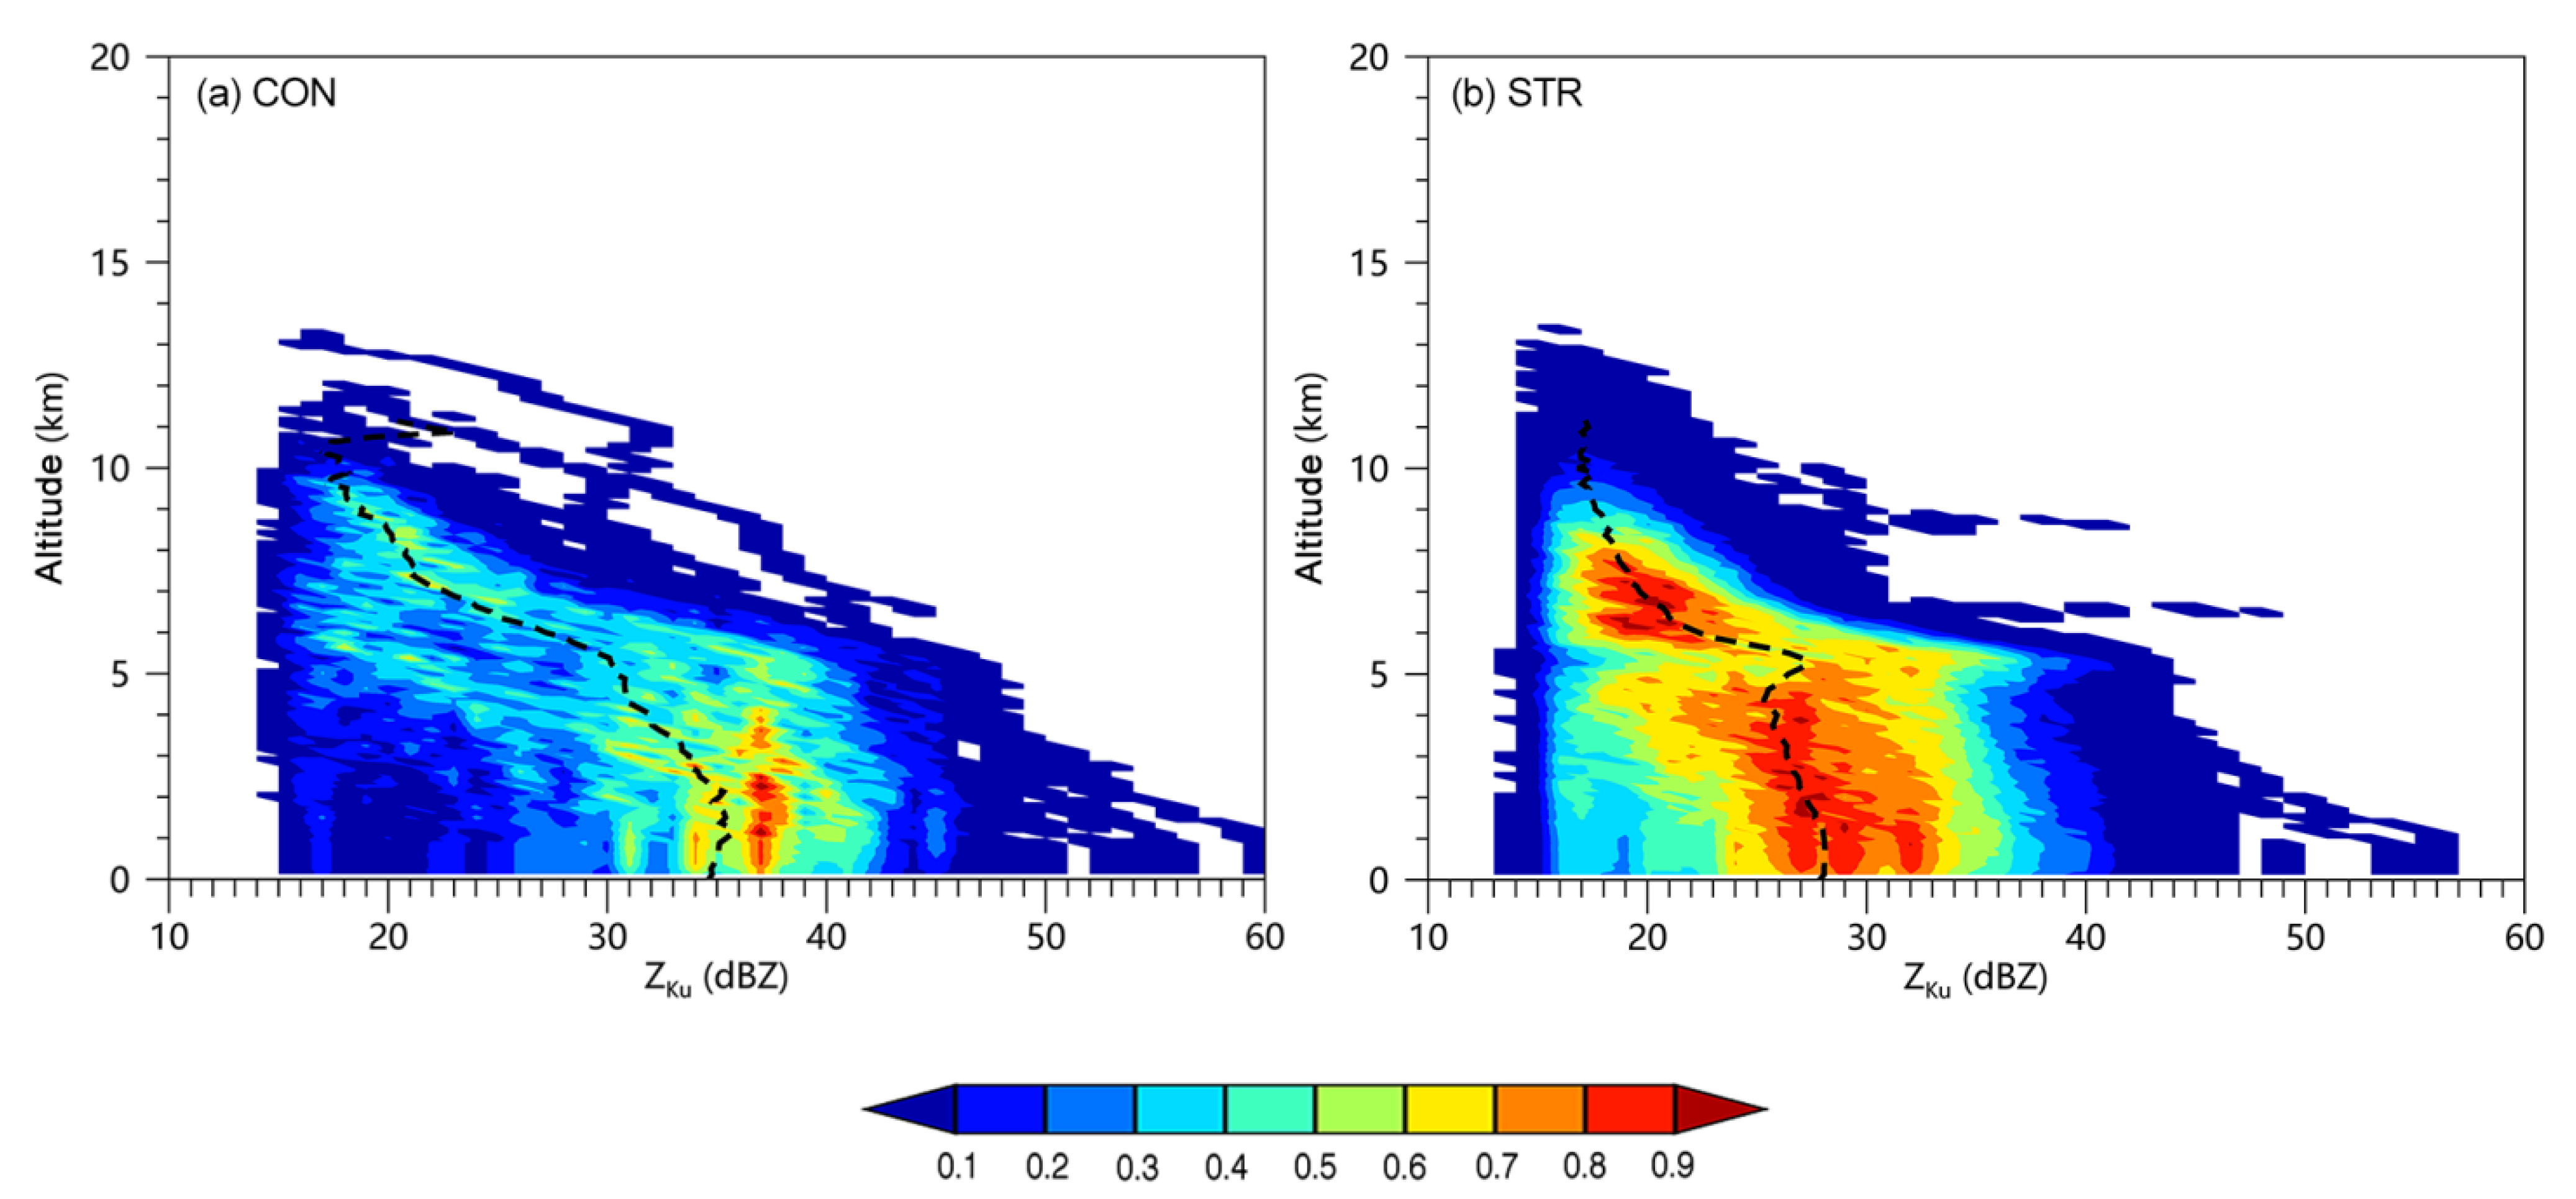
3.5.1. Vertical Precipitation Structure

To examine the vertical precipitation structure of Typhoon In-Fa, the contoured frequency by altitude diagrams (CFADs) [35] for Ku-band equivalent radar reflectivity ZKu (attenuation-corrected) in the convective and stratiform regions are shown in Figure 10. Note that only GPM-observed precipitation data within the 500 km radial area from typhoon center (119.1°E, 31.4°N) is used for the CFADs, and the reflectivity (altitude) bin is set to be 1 dBZ (125 m) following Wu et al. [10]. Several distinct differences between convective rain (Figure 10a) and stratiform rain (Figure 10b) are found as below:
Compared to convective rain, stratiform rain shows obvious characteristics of zero-degree bright band zone (at an altitude of ~5 km) in vertical structure (Figure 10b), which could be partly due to the melting behavior of ice particles, such as graupel and snow that strengthens the scattering ability [36], and partly due to the aggregation of melting snowflakes that producing larger particles [36].
  • Beneath the height of 5 km, ZKu increases rapidly towards the ground (from 30 dBZ to 35 dBZ) in the convective region, which reflects the dominant collision and coalescence process of raindrops. Compared to that, the increase of ZKu is relatively less distinct in the stratiform region (only from 26 dBZ to 28 dBZ), which is related to the collision and breakup process of large raindrops.
  • From 10 km to 12 km, ZKu increases sharply as altitude increases (from 16 dBZ to 23 dBZ) in the convective region, which reflects the active cold-cloud processes (such as aggregation, riming) that contribute to the growth of solid particles. Compared to that, the increase of ZKu is hardly noticeable in the stratiform region (only from 17 dBZ to 17.5 dBZ), which reflects the weak cold-cloud processes in stratiform rain.
  • To confirm the specific microphysical processes occurring at different vertical heights, it is necessary to identify the distribution of specific hydrometeor types. Hence, in the next section, we further retrieved the hydrometeor distribution within Typhoon In-Fa.

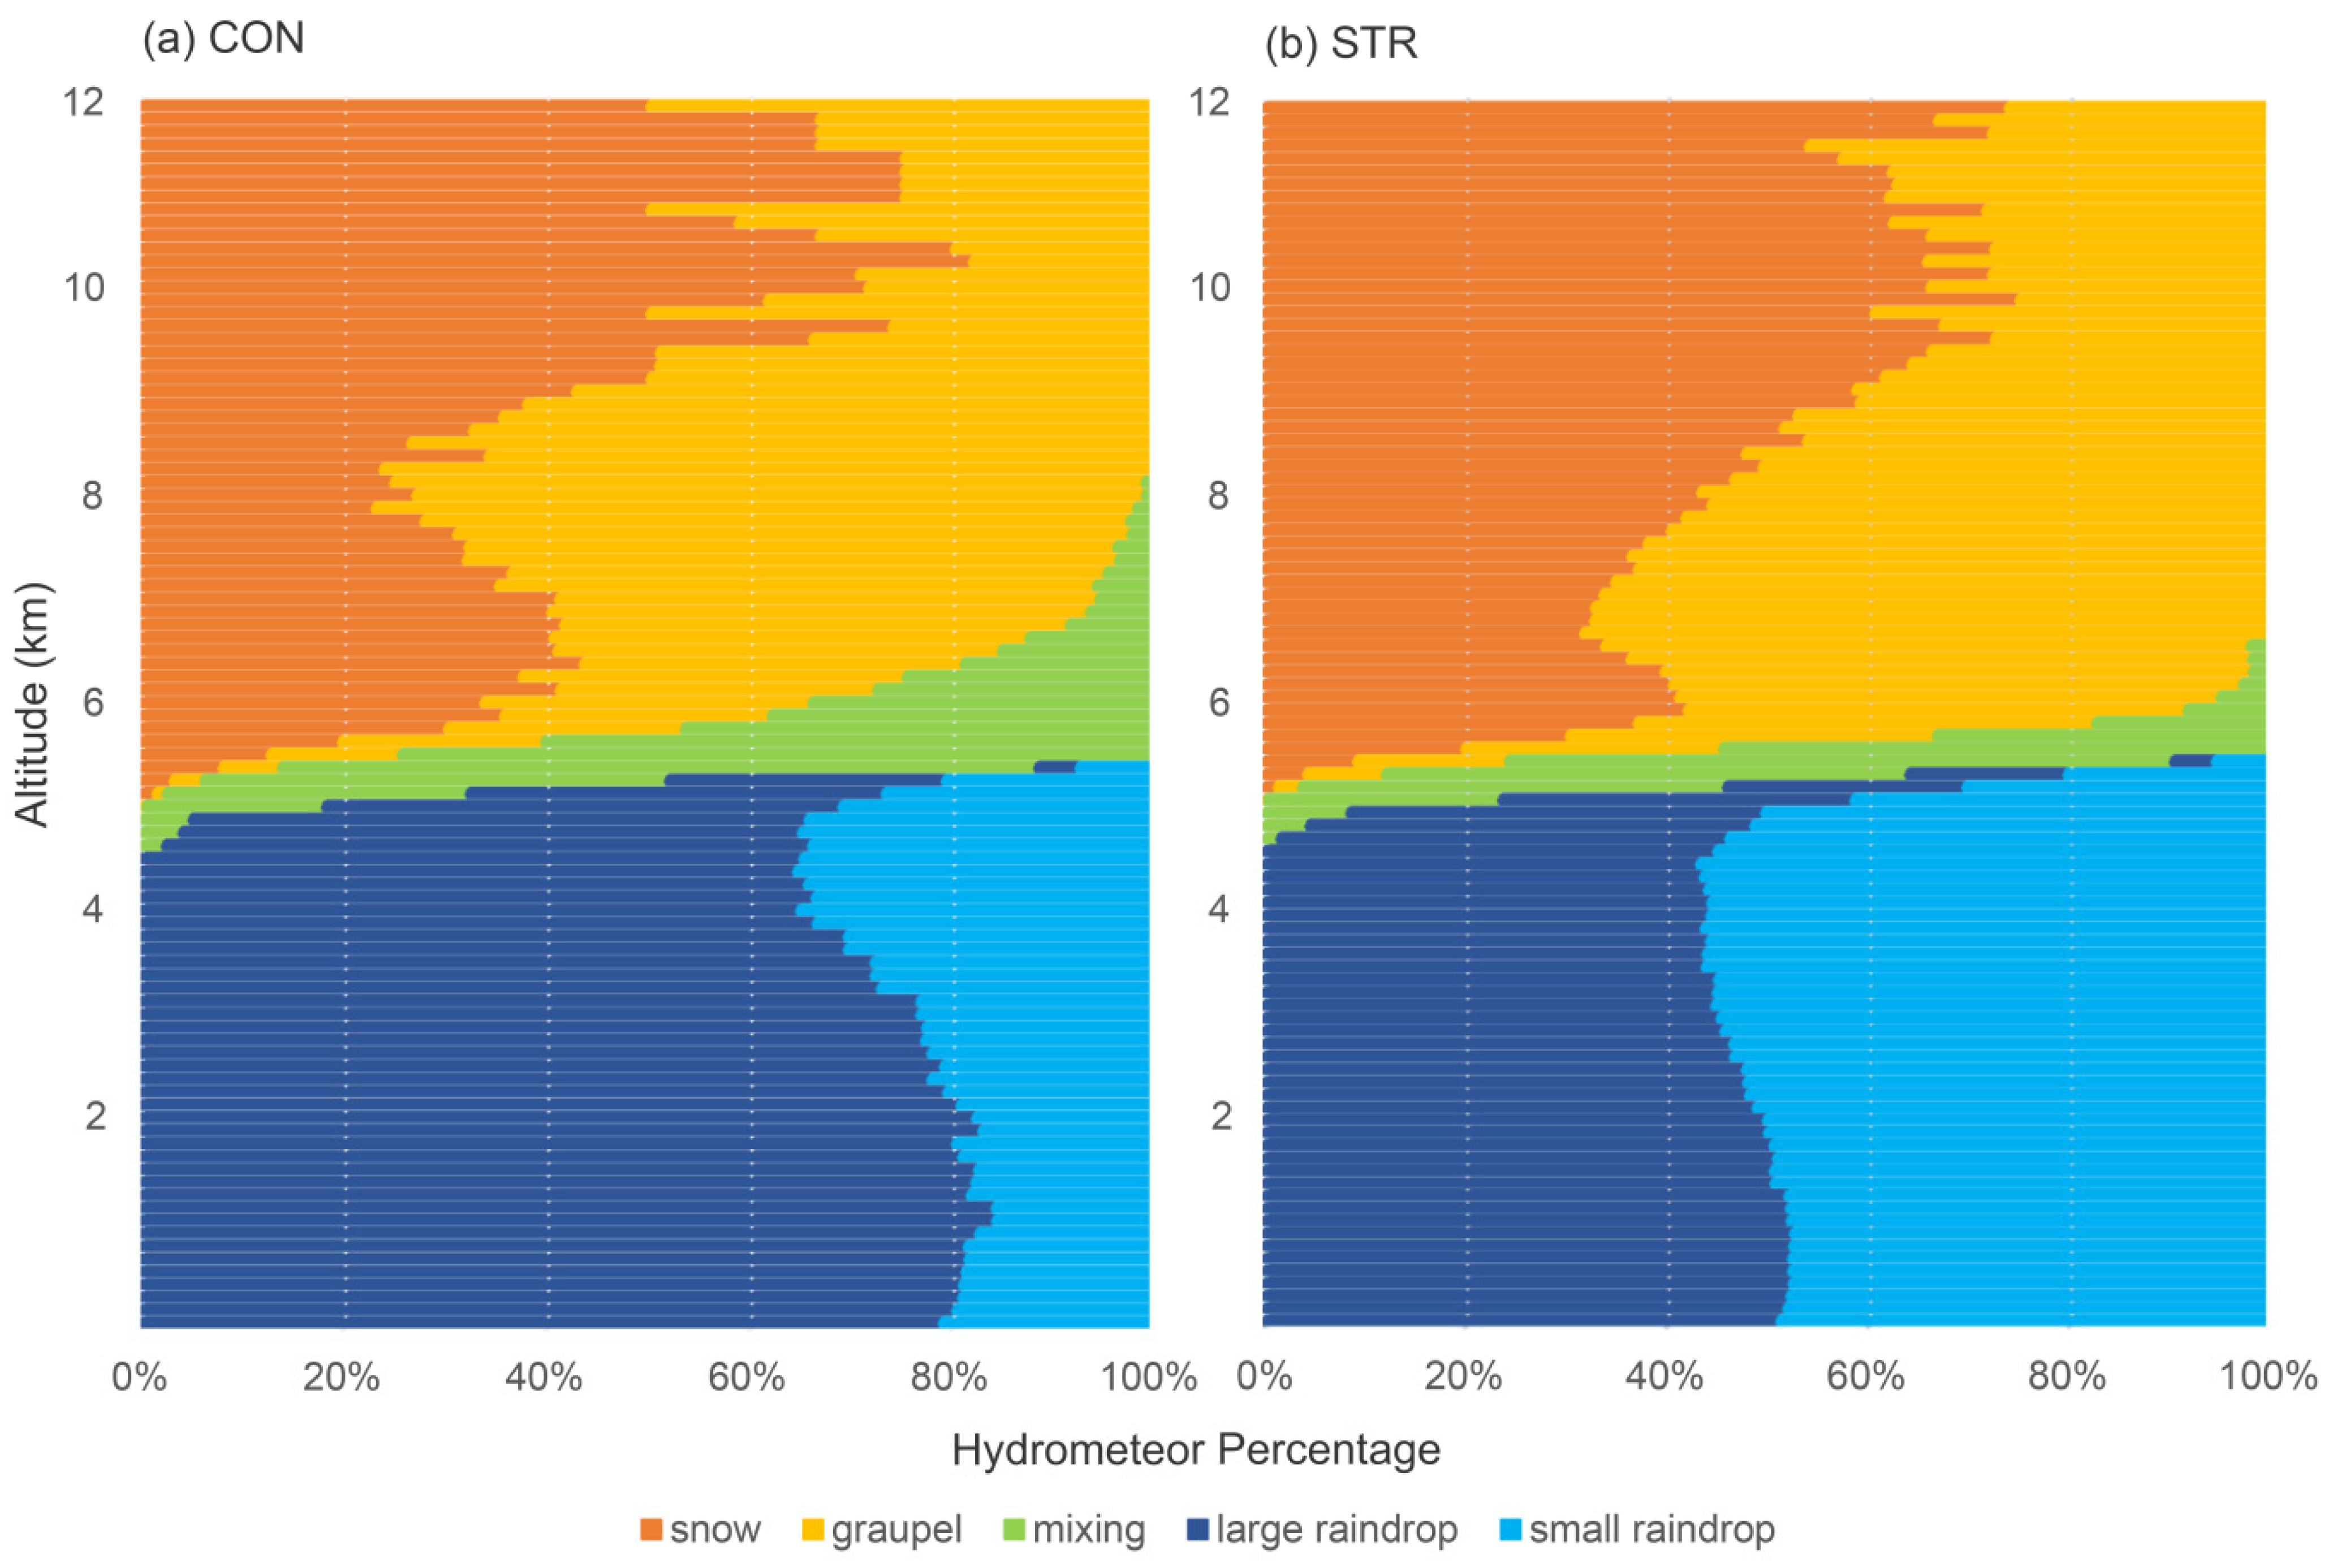
3.5.2. Hydrometeor Distribution

A GPM-based hydrometeor recognition method as described in Section 2.5 is used to obtain the frequency (%) of hydrometeors in convective rain and stratiform rain of Typhoon In-Fa (Figure 11). The recognition result shown in Figure 11 is based on GPM-measured Zku (Figure 10) and ERA5-derived T (Figure S2) and is conducted every 125 m vertically from the near surface up to 12 km. According to the distribution and characteristics of these recognized hydrometeors, we can further confirm the vertical microphysical processes within typhoon precipitation.
As shown in Figure 11, there is a zone of mixed-phase particles at approximately 5 km in both convective rain and stratiform rain. The difference is that the mixed-phase zone extends to a much higher altitude in convective rain (from 5 km to 8 km) than stratiform rain (from 5 km to 6 km), which reflects the strong updrafts in convective rain that transport small particles below the melting layer (~5 km) back to the upper levels. This is why the bright band is more distinct in stratiform rain as demonstrated in Figure 10b. Besides, as further seen from the median profile of particle size and concentration in typhoon precipitation (Figure 12), the median Dm values of stratiform rain increase sharply (from about 1.1 mm to 1.2 mm) with a decrease in altitude from 6 km to 5 km, confirming the fast growth of mixed-phase particles due to coalescence and aggregation processes.
Meanwhile, there is a larger amount of graupels present above the melting level in the convective region (80% at most) than the stratiform region (70% at most). Graupels are important sources of rain, and consequently, the raindrop concentration in the convective region (with Nw ranging from 3.80 to 3.96 mm−1 m−3) is far more abundant than those in the stratiform region (with Nw ranging from 3.40 to 3.50 mm−1 m−3) as shown in Figure 12b. Moreover, large raindrops occupy most of the region below the melting layer in the convective region in comparison with the stratiform region (Figure 11a), indicating a dominant coalescence process in convective rain of Typhoon In-Fa. While the amount of small raindrops is similar to that of large raindrops in the stratiform region (Figure 11b), reflecting a significant collisional breakup process of large raindrops. This further proves the results deduced from the near-surface raindrop spectrum (Figure 5).
Intensive updrafts transport abundant water vapor and liquid drops to higher altitudes in the convective region, the ice crystals aloft would grow faster with more irregular shape and bigger size and smaller density due to more efficient aggregation and riming processes [3,37], which generally results in the increase of the proportion of aggregates that characterized as larger ZKu (Figure 10a). In consistence with that, the vertically aligned ice above 10 km altitude in the convective region also featured with a higher percentage of snow when compared with the stratiform region (Figure 11a), and the median Dm profile also presents significantly large values (up to 1.36 mm) above 10 km altitude in the convective region (Figure 12a).

4. Discussion

Besides PARSIVEL disdrometers, various types of surface disdrometers including Joss-Waldvogel disdrometer (JWD), Thies, and 2DVD are commonly utilized in typhoon studies [1,2,3,4,5,6,7]. Performance differences among diverse disdrometers should also be paid attention to when comparing our results with other typhoon studies. It is realized that PARSIVEL might underestimate small drops in some circumstances [38], which could influence part of the results in this study to some extent, such as a slightly higher mean Dm value might be detected than actual situation (Figure 7). It has also been reported that PARSIVEL shows better performance in raindrop falling speed measurements than 2DVD on occasions with strong wind [18], which could make it a better choice to use PARSIVEL for typhoon research. The performance evaluation of different types of disdrometers during typhoon impact needs further researches, and we leave that in the next work.
Note that the GPM official algorithm uses a rather complex adjustment parameter (ε) to help estimate the DSD and rain rate [31]. For simplification, herein we only derived the basic form of R-Dm relations without taking ε into consideration. Meanwhile, the GPM hydrometeor recognition algorithm proposed by Qiao et al. [26] has several distinct flaws that need to be remedied in future work. For instance, the recognition of smaller particles, such as drizzle and ice crystals is difficult due to the limited sensitivity of DPR measurements [31]; the feature thresholds (Table 1 of Qiao et al. [26]) used for the fuzzy-logic algorithm warrant further adjustment and optimization; it is unable to distinguish hail from graupel and snow, etc. Even though, the current recognition results in Figure 11 still provide important and reliable clues for us to reveal the key microphysical processes in typhoon precipitation.
In addition, only one overpass of GPM observation is validated against the collaborating disdrometer network observation during Typhoon In-Fa landfall. More GPM satellite observational data are needed to support robust validation work. Besides, in addition to the use of disdrometer for GPM validation and calibration, ground radars can also serve to evaluate and improve GPM product quality. In the latest researches, Wu et al. [10] used Wenzhou S-band conventional Doppler radar to evaluate GPM precipitation observations during the typhoon Lekima (2019) landfall and found that GPM showed a large measurement error in the eyewall area, possibly due to excessive compensation caused by multiple-scattering and/or non-uniform beam filling. Huang et al. [39] further evaluated the GPM precipitation observations during the landfall of typhoon Ewiniar (2018) by using Guangzhou S-band dual-polarization radar. It was found that GPM would underestimate the raindrop number concentration, water content and rain rate for intense radar echoes. In the future, mutual calibrations among multiple instruments such as disdrometers, conventional/dual-polarization radars, and GPM satellite will be the hot topic, and the follow-up work will be carried out continuously around this theme.

5. Conclusions

In this research, we investigated the precipitation microphysics of the record-breaking Typhoon In-Fa (2021) over eastern China using collaborative measurements from both the PARSIVEL disdrometer network (a total of 66 disdrometers) and GPM DPR observations. For an in-depth study, the convective and stratiform types of typhoon precipitation were explored separately and the DSD properties of Typhoon In-Fa were compared with other typhoons from different climate regimes. Meanwhile, based on a great number of surface disdrometer observational data, the GPM precipitation products are further validated for both rain types, and a series of native QPE relations are derived to improve the rainfall retrieval for both ground-based radar and spaceborne radar. The following conclusions are ultimately obtained:
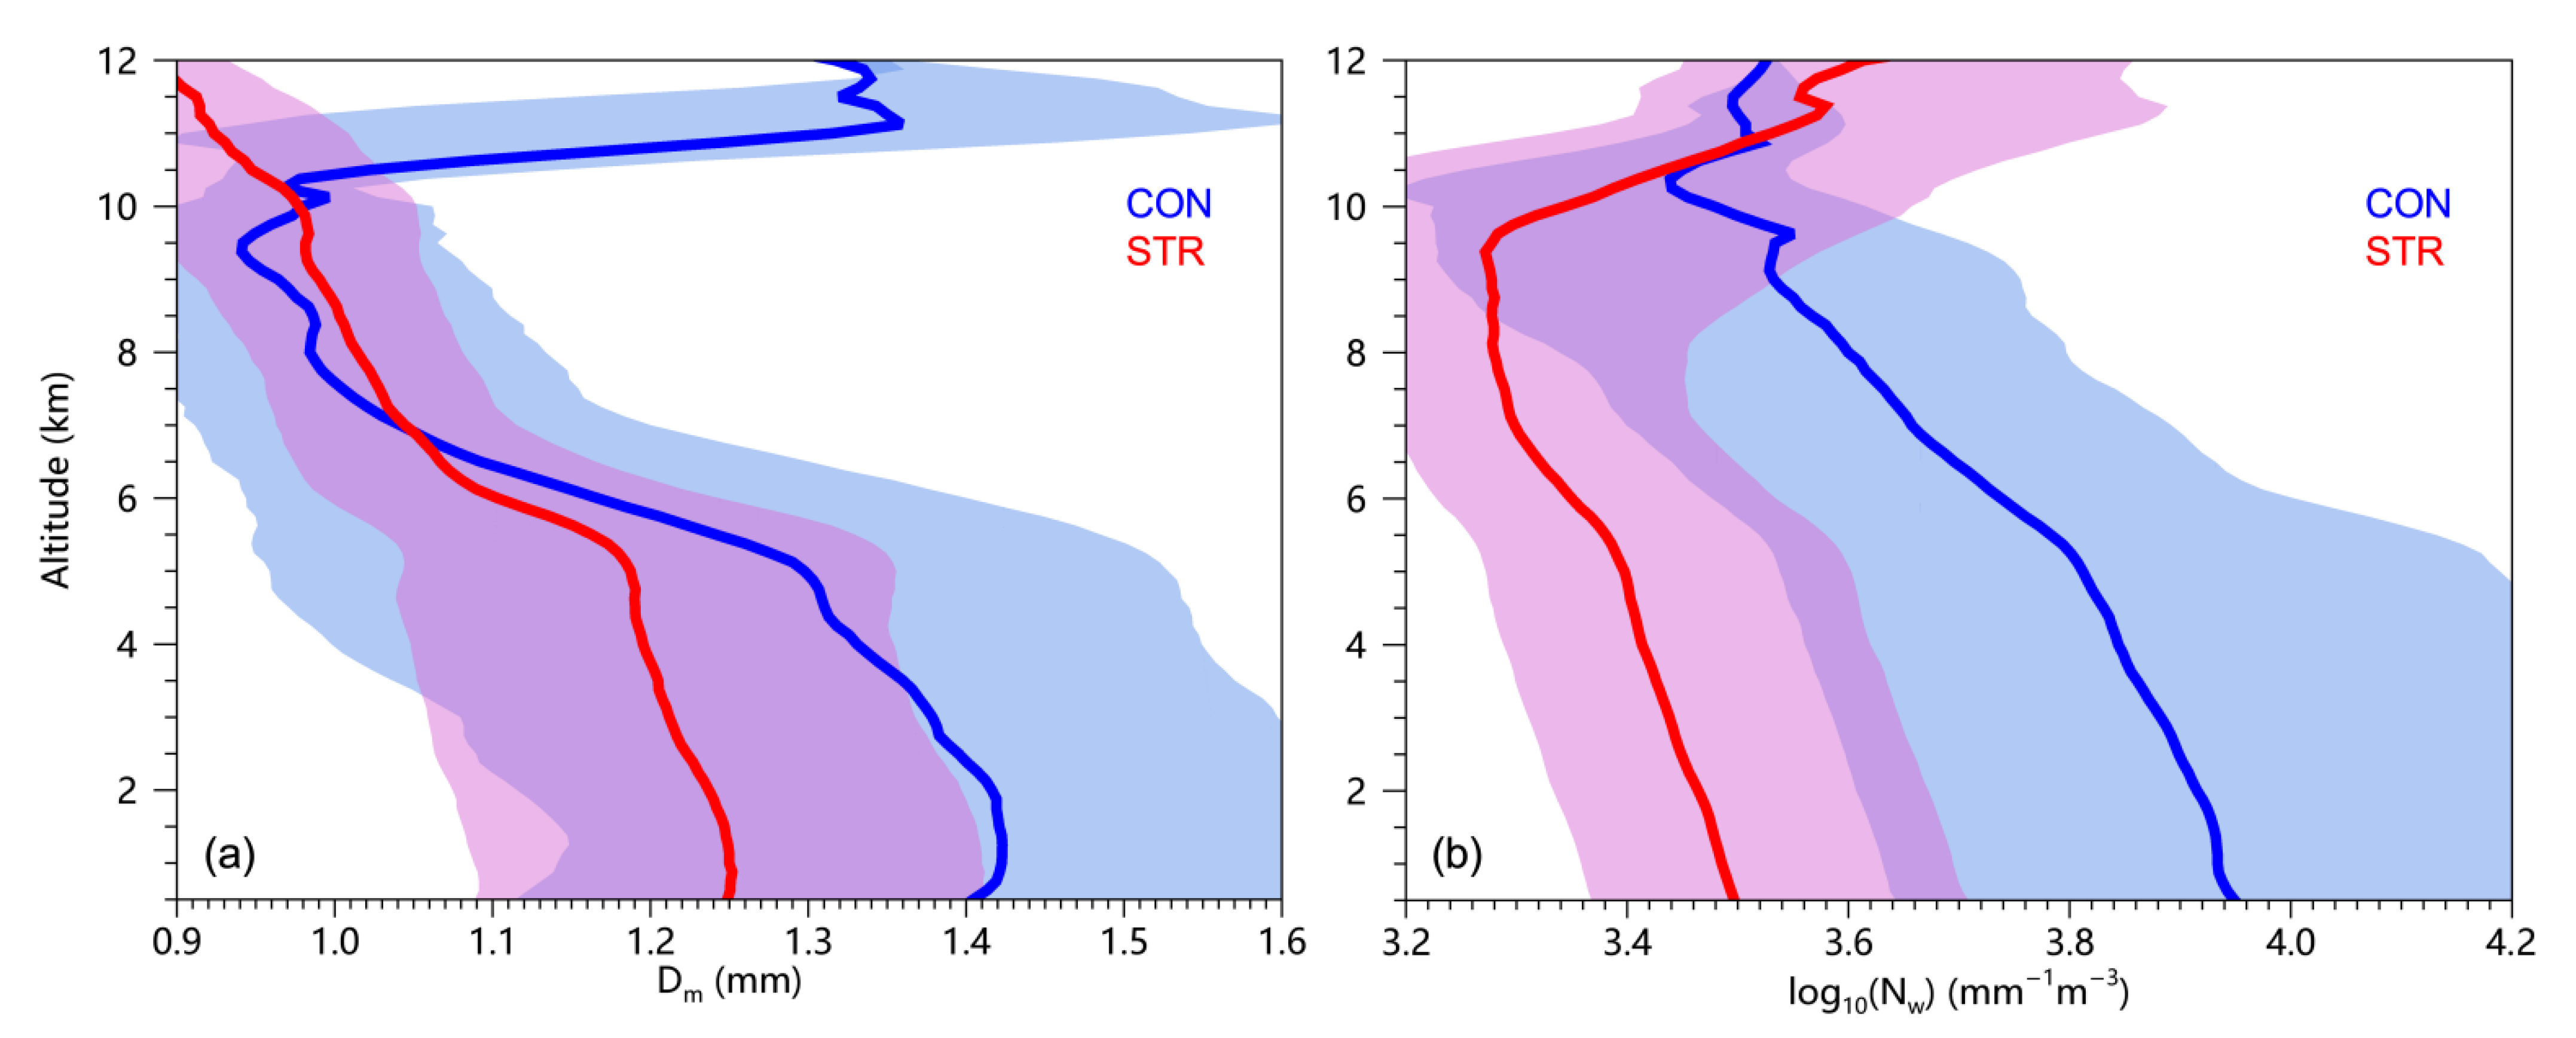
  • Compared with the typhoon convective precipitation in Hainan and Taiwan, the precipitation measurements of Typhoon In-Fa over eastern China show larger (smaller) raindrop concentration (Nw) than that of Taiwan (Hainan), and the raindrop diameter (Dm) is the smallest in eastern China while largest in Taiwan. Moreover, the typhoon convective precipitation measured in eastern China and Hainan is more maritime-like than precipitation in Taiwan possibly due to the difference in topography.
  • Convective rain has a much higher raindrop concentration (larger Nw) than stratiform rain due to more graupels melting into liquid water while falling. Large raindrops occupy most of the region below the melting layer in the convective region due to a dominant coalescence process of small raindrops (featured by larger ZKu, Dm, and smaller N0, µ, Λ), while small raindrops account for a considerable proportion in the stratiform region, reflecting a significant collisional breakup process of large raindrops (featured by smaller ZKu, Dm, and larger N0, µ, Λ).
  • GPM products are validated against networked PARSIVEL observations for both convective rain and stratiform rain in Typhoon In-Fa. It is suggested the normalized bias of convective rain (16.3% for rain rate and −0.27% for radar reflectivity) is much less than that of stratiform rain (57.2% for rain rate and 19.6% for radar reflectivity), indicating that GPM product might have better performance for convective rain than stratiform rain of typhoon over eastern China. Even though, more typhoon case studies are needed for further clarification.
  • The standard Z-R relationship (Z = 300R1.40) used in NEXRAD generally underestimates the rain rate in Typhoon In-Fa. The default R-Dm relationships in the GPM official product slightly underestimate the drop diameter in Typhoon In-Fa. Native ZR (Z = 124R1.57 for convective and Z = 197R1.47 for stratiform) and RDm (R = 2.513Dm4.109 for convective and R = 1.146Dm5.011 for stratiform) relationships are thereby derived to improve the quantitative rain rate estimation in Typhoon In-Fa for both ground-based radar and spaceborne radar.

Supplementary Materials

The following are available online at https://www.mdpi.com/article/10.3390/rs14020344/s1, Figure S1: The time development of DSD, rain rate, raindrop concentration, and intercept/shape parameter detected by 66 disdrometers in Jiangsu during the passage of Typhoon In-Fa (2021) from 25th to 30th July, 2021. Figure S2: ERA5-derived vertical mean profile of temperature (℃) in Typhoon In-Fa (2021). Table S1: The precipitation samples measured by 66 disdrometers in Jiangsu during the passage of Typhoon In-Fa (2021) from 25th to 30th July, 2021.

Author Contributions

conceptualization, Z.W. and Y.Z.; methodology, Z.W.; software, L.Z.; validation, Z.W., Y.Z. and L.Z.; formal analysis, Z.W.; investigation, X.H.; resources, Y.Z.; data curation, X.H.; writing—original draft preparation, Z.W.; writing—review and editing, H.Z.; visualization, H.Z.; supervision, Y.Z.; project administration, L.Z.; funding acquisition, L.Z. All authors have read and agreed to the published version of the manuscript.

Funding

This research was funded jointly by the National Natural Science Foundation of China [grant number 41822504, 42075080, 41975066] and the Shanghai Typhoon Research Foundation [grant number TFJJ202105]. And the article processing charge (APC) was funded by TFJJ202105.

Data Availability Statement

GPM DPR data can be obtained from the Goddard Earth Sciences Data and Information Services Center (GES DISC) via https://disc.gsfc.nasa.gov, accessed on 20 July 2021. ERA5 data can be obtained from the Climate Data Store (CDS) via https://cds.climate.copernicus.eu/cdsapp#!/home, accessed on 17 August 2021. Disdrometer data can be acquired by sending request to the corresponding author ([email protected]).

Acknowledgments

The authors acknowledge JMA for providing weather maps and CMA for providing typhoon best track data.

Conflicts of Interest

The authors declare no conflict of interest.

References

  1. Tokay, A.; Bashor, P.G.; Habib, E.; Kasparis, T. Raindrop Size Distribution Measurements in Tropical Cyclones. Mon. Wea. Rev. 2008, 136, 1669–1685. [Google Scholar] [CrossRef] [Green Version]
  2. Chang, W.-Y.; Wang, T.-C.C.; Lin, P.-L. Characteristics of the raindrop size distribution and drop shape relation in typhoon systems in the western Pacific from the 2D video disdrometer and NCU C-band polarimetric radar. J. Atmos. Ocean. Technol. 2009, 26, 1973–1993. [Google Scholar] [CrossRef]
  3. Wen, L.; Zhao, K.; Chen, G.; Wang, M.; Zhou, B.; Huang, H.; Hu, D.; Lee, W.C.; Hu, H. Drop size distribution characteristics of seven typhoons in China. J. Geophys. Res. Atmos. 2018, 123, 6529–6548. [Google Scholar] [CrossRef]
  4. Bao, X.; Wu, L.; Tang, B.; Ma, L.; Wu, D.; Tang, J.; Chen, H.; Wu, L. Variable Raindrop Size Distributions in Different Rainbands Associated With Typhoon Fitow (2013). J. Geophys. Res. Atmos. 2019, 124, 12262–12281. [Google Scholar] [CrossRef]
  5. Bao, X.; Wu, L.; Zhang, S.; Li, Q.; Lin, L.; Zhao, B.; Wu, D.; Xia, W.; Xu, B. Distinct Raindrop Size Distributions of Convective Inner- and Outer-Rainband Rain in Typhoon Maria (2018). J. Geophys. Res. Atmos. 2020, 125, e2020JD032482. [Google Scholar] [CrossRef]
  6. Bao, X.; Wu, L.; Zhang, S.; Yuan, H.; Wang, H. A comparison of convective raindrop size distributions in the eyewall and spiral rainbands of typhoon Lekima (2019). Geophys. Res. Lett. 2020, 47, e2020GL090729. [Google Scholar] [CrossRef]
  7. Zheng, H.; Zhang, Y.; Zhang, L.; Lei, H.; Wu, Z. Precipitation Microphysical Processes in the Inner Rainband of Tropical Cyclone Kajiki (2019) over the South China Sea Revealed by Polarimetric Radar. Adv. Atmos. Sci. 2021, 38, 65–80. [Google Scholar] [CrossRef]
  8. Huang, H.; Chen, F. Precipitation microphysics of tropical cyclones over the western North Pacific based on GPM DPR observations: A preliminary analysis. J. Geophys. Res. Atmos. 2019, 124, 3124–3142. [Google Scholar] [CrossRef]
  9. Chen, F.; Fu, Y.; Yang, Y. Regional variability of precipitation in tropical cyclones over the western north pacific revealed by the GPM dual-frequency precipitation radar and microwave imager. J. Geophys. Res. Atmos. 2019, 124, 11281–11296. [Google Scholar] [CrossRef]
  10. Wu, Z.; Huang, Y.; Zhang, Y.; Zhang, L.; Lei, H.; Zheng, H. Precipitation characteristics of typhoon Lekima (2019) at landfall revealed by joint observations from GPM satellite and S-band radar. Atmos. Res. 2021, 260, 105714. [Google Scholar] [CrossRef]
  11. Wu, Z.; Zhang, Y.; Zhang, L.; Lei, H.; Xie, Y.; Wen, L.; Yang, J. Characteristics of summer season raindrop size distribution in three typical regions of western Pacific. J. Geophys. Res. Atmos. 2019, 124, 4054–4073. [Google Scholar] [CrossRef] [Green Version]
  12. Wu, Z.; Zhang, Y.; Zhang, L.; Hao, X.; Lei, H.; Zheng, H. Validation of GPM precipitation products by comparison with ground-based Parsivel disdrometers over Jianghuai region. Water 2019, 11, 1260. [Google Scholar] [CrossRef] [Green Version]
  13. Zhang, Y.; Wu, Z.; Zhang, L.; Xie, Y.; Huang, Y.; Zheng, H. Preliminary Study of Land–Sea Microphysics Associated with the East Asian Summer Monsoon Rainband and Its Application to GPM DPR. J. Atmos. Ocean. Technol. 2020, 37, 1231–1249. [Google Scholar] [CrossRef]
  14. Adirosi, E.; Montopoli, M.; Bracci, A.; Porcù, F.; Capozzi, V.; Annella, C.; Budillon, G.; Bucchignani, E.; Zollo, A.L.; Cazzuli, O. Validation of GPM Rainfall and Drop Size Distribution Products through Disdrometers in Italy. Remote Sens. 2021, 13, 2081. [Google Scholar] [CrossRef]
  15. Bringi, V.N.; Grecu, M.; Protat, A.; Thurai, M.; Klepp, C. Measurements of rainfall rate, drop size distribution, and variability at middle and higher latitudes: Application to the combined DPR-GMI algorithm. Remote Sens. 2021, 13, 2412. [Google Scholar] [CrossRef]
  16. Löffler-Mang, J.J. An optical distrometer for measuring size and velocity of hydrometeors. J. Atmos. Oceanic Technol. 2000, 17, 130–139. [Google Scholar] [CrossRef]
  17. Atlas, D.; Srivastava, R.C.; Sekhon, R.S. Doppler radar characteristics of precipitation at vertical incidence. Rev. Geophys. 1973, 11, 1–35. [Google Scholar] [CrossRef]
  18. Tokay, A.; Petersen, W.A.; Gatlin, P.; Wingo, M. Comparison of raindrop size distribution measurements by collocated disdrometers. J. Atmos. Oceanic Technol. 2013, 30, 1672–1690. [Google Scholar] [CrossRef]
  19. Iguchi, T.; Seto, S.; Meneghini, R.; Yoshida, N.; Awaka, J.; Le, M.; Chandrasekar, V.; Brodzik, S.; Kubota, T.; Takahashi, N. GPM/DPR level-2 Algorithm Theoretical Basis Document. 2020. Available online: https://www.eorc.jaxa.jp/GPM/doc/algorithm/ATBD_DPR_202006_with_Appendix_a.pdf (accessed on 15 August 2021).
  20. Masaki, T.; Iguchi, T.; Kanemaru, K.; Furukawa, K.; Yoshida, N.; Kubota, T.; Oki, R. Calibration of the Dual-frequency Precipitation Radar (DPR) onboard the Global Precipitation Measurement (GPM) core observatory. IEEE Trans. Geosci. Remote Sens. 2020, 60, 1–16. [Google Scholar] [CrossRef]
  21. Ulbrich, C.W. Natural variations in the analytical form of the drop size distribution. J. Clim. Appl. Meteorol. 1983, 22, 1764–1775. [Google Scholar] [CrossRef] [Green Version]
  22. Zhang, G.; Vivekanandan, J.; Brandes, E. A method for estimating rain rate and drop size distribution from polarimetric radar measurements. IEEE Trans. Geosci. Remote Sens. 2001, 39, 830–841. [Google Scholar] [CrossRef] [Green Version]
  23. Bringi, V.N.; Chandrasekar, V.; Hubbert, J.; Gorgucci, E.; Randeu, W.L.; Schoenhuber, M. Raindrop size distribution in different climatic regimes from disdrometer and dual-polarized radar analysis. J. Atmos. Sci. 2003, 60, 354–365. [Google Scholar] [CrossRef]
  24. Awaka, J.; Le, M.; Chandrasekar, V.; Yoshida, N.; Higashiuwatoko, T.; Kubota, T.; Iguchi, T. Rain Type Classification Algorithm Module for GPM Dual-Frequency Precipitation Radar. J. Atmos. Oceanic Technol. 2016, 33, 1887–1898. [Google Scholar] [CrossRef]
  25. Wen, L.; Zhao, K.; Zhang, G.; Xue, M.; Zhou, B.; Liu, S.; Chen, X. Statistical characteristics of raindrop size distributions observed in East China during the Asian summer monsoon season using 2-D video disdrometer and Micro Rain Radar data. J. Geophys. Res. Atmos. 2016, 121, 2265–2282. [Google Scholar] [CrossRef] [Green Version]
  26. Qiao, J.; Ai, W.H.; Hu, X.; Hu, S.; Yan, W. A Recognition Method of Hydrometeor in Tropical Cyclones by Using the GPM Dual-Frequency Precipitation Radar. J. Trop. Meteorol. 2021, 27, 161–168. [Google Scholar]
  27. Hersbach, H.; Bell, B.; Berrisford, P.; Hirahara, S.; Thépaut, J. The ERA5 global reanalysis. Quart. J. R. Meteorol. Soc. 2020, 146, 1999–2049. [Google Scholar] [CrossRef]
  28. Rosenfeld, D.; Ulbrich, C.W. Cloud microphysical properties, processes, and rainfall estimation opportunities. In Radar and Atmospheric Science: A Collection of Essays in Honor of David Atlas; American Meteorological Society: Boston, MA, USA, 2003; pp. 237–258. [Google Scholar]
  29. Zhang, G.; Vivekanandan, J.; Brandes, E.A.; Meneghini, R.; Kozu, T. The shape-slope relation in observed gamma raindrop size distributions: Statistical error or useful information? J. Atmos. Ocean. Technol. 2003, 20, 1106–1119. [Google Scholar] [CrossRef] [Green Version]
  30. Testud, J.; Oury, S.; Black, R.A.; Amayenc, P.; Dou, X. The Concept of “Normalized” Distribution to Describe Raindrop Spectra: A Tool for Cloud Physics and Cloud Remote Sensing. J. Appl. Meteor. 2001, 40, 1118–1140. [Google Scholar] [CrossRef]
  31. Seto, S.; Iguchi, T.; Meneghini, R.; Awaka, J.; Kubota, T.; Masaki, T.; Takahashi, N. The Precipitation Rate Retrieval Algorithms for the GPM Dual-frequency Precipitation Radar. J. Meteorol. Soc. Jpn. 2021, 99, 205–237. [Google Scholar] [CrossRef]
  32. Kozu, T.; Iguchi, T.; Kubota, T.; Yoshida, N.; Seto, S.; Kwiatkowski, J.; Takayabu, Y.N. Feasibility of raindrop size distribution parameter estimation with TRMM Precipitation Radar. J. Meteor. Soc. Jpn. 2009, 87A, 53–66. [Google Scholar] [CrossRef] [Green Version]
  33. Kozu, T.; Iguchi, T.; Shimomai, T.; Kashiwagi, N. Raindrop size distribution modeling from a statistical rain parameter relation and its application to the TRMM precipitation radar rain retrieval algorithm. J. Appl. Meteor. Climatol. 2009, 48, 716–724. [Google Scholar] [CrossRef]
  34. Fulton, R.A.; Breidenbach, J.P.; Seo, D.J.; Miller, D.A.; O’ Bannon, T. The WSR-88D rainfall algorithm. Weather Forecast. 1998, 13, 37–395. [Google Scholar] [CrossRef]
  35. Yuter, S.E.; Houze, R.A. Three-dimensional kinematic and microphysical evolution of Florida cumulonimbus. Part II: Frequency distributions of vertical velocity, reflectivity, and differential reflectivity, Mon. Weather Rev. 1995, 123, 1941–1963. [Google Scholar]
  36. Houze, R.A., Jr. Cloud Dynamics, 2nd ed.; Elsevier/Academic Press: Oxford, UK, 2014. [Google Scholar]
  37. Wang, M.; Zhao, K.; Xue, M.; Zhang, G.; Liu, S.; Wen, L.; Chen, G. Precipitation microphysics characteristics of a Typhoon Matmo (2014) Rainband after landfall over eastern China based on polarimetric radar observations. J. Geophys. Res. Atmos. 2016, 121, 12,415–12,433. [Google Scholar] [CrossRef]
  38. Tokay, A.; Wolff, D.B.; Petersen, W.A. Evaluation of the new version of the laser-optical disdrometer, OTT Parsivel2. J. Atmos. Oceanic Technol. 2014, 31, 1276–1288. [Google Scholar] [CrossRef]
  39. Huang, H.; Zhao, K.; Fu, P.; Chen, H.; Chen, G.; Zhang, Y. Validation of Precipitation Measurements From the Dual-Frequency Precipitation Radar Onboard the GPM Core Observatory Using a Polarimetric Radar in South China. IEEE Trans. Geosci. Remote Sens. 2021, 1–16. [Google Scholar] [CrossRef]
Figure 1. (a) Best track for Typhoon In-Fa (2021) based on observations from China Meteorological Administration (CMA), (b) Location of PARSIVEL disdrometer network (altogether 66 disdrometers) and accumulated precipitation (unit: mm) during the passage of Typhoon In-Fa from 25 July 0000UTC to 30 July 0000UTC. The superimposed red contour in panel (a) represents Jiangsu Province. Four categories of typhoon intensity are classified here following CMA, wherein TD represents tropical depression, TS represents tropical storm, STS represent super tropical storm, and TY represent typhoon.
Remotesensing 14 00344 g001
Figure 2. GPM instantaneous observation at 1105 UTC: (a) rain types (convective, stratiform, shallow, and other) and (b) maximum equivalent radar reflectivity (dBZ). The paralleled gray lines represent the boundaries of GPM scanning path.
Remotesensing 14 00344 g002
Figure 3. Time series of rain rate R (mm h−1) and its standard deviation σR (mm h−1) measured by three disdrometers located in (a) Gaoyou, (b) Jiangdong, and (c) Dongtai respectively. The left ordinate (black color) denotes R while the right ordinate (magenta color) denotes σR. The rain types are displayed in stripes of different colors. The precipitation collected by three disdrometers during Typhoon In-Fa landfall basically concentrated between 25 July 2021 and 29 July 2021.
Remotesensing 14 00344 g003
Figure 4. Surface analysis weather maps during Typhoon In-Fa landfall provided by the Japan Meteorological Agency (JMA).
Remotesensing 14 00344 g004
Figure 5. The composite raindrop spectrum from the PARSIVEL disdrometer data at different rain rates for (a) convective rain and (b) stratiform rain.
Remotesensing 14 00344 g005
Figure 6. µ scatter diagram (gray dots) and corresponding fitting curve (red line) based on PARSIVEL disdrometer observations of Typhoon In-Fa (2021). The dashed line represents the empirical μ-Λ relationship of typhoons over Taiwan from Chang et al. [2]. The dash-dot line represents the empirical μ-Λ relationship of typhoons over continental China from Wen et al. [3]. The gray lines correspond to the Dm contour according to ΛDm = 4 + μ [30].
Remotesensing 14 00344 g006
Figure 7. Scatter diagram of log10(Nw) and Dm observed from the PARSIVEL disdrometers for convective (blue dots) and stratiform precipitation (red dots) in Typhoon In-Fa. The green and magenta rectangles represent the average values (along with ± standard deviation) of convective rain (denoted as AVE.CON) and stratiform rain (denoted as AVE.STR), respectively. The black triangle, diamond, and circle represent results from other typhoon studies for comparison. The two outlined rectangles correspond to the maritime and continental convective clusters observed by Bringi et al. [23]. The black dashed line indicates the fitting curve of stratiform rain in Bringi et al. [23].
Remotesensing 14 00344 g007
Figure 8. Scatter diagrams and their fitting curves of (a) R (mm h−1) with Z (dBZ), and (b) Dm (mm) with R (mm h−1) from PARSIVEL disdrometer data for two rain types. The blue and red scatters represent convective and stratiform samples, respectively. The overlaid black line in panel (a) represents the experience relationship Z = 300R1.40 from Fulton et al. [34]. The black dashed (dash-doted) line in panel (b) represents the default relationship R = 1.370Dm5.420 (R = 0.401Dm6.131) used for the retrieval of convective (stratiform) rain in GPM lev-2 ATBD [19].
Remotesensing 14 00344 g008
Figure 9. Statistical comparison of PARSIVEL disdrometers and near-surface GPM DPR measurements in terms of probability distribution functions (PDFs) for (a) rain rate (mm h−1), and (b) equivalent radar reflectivity (dBZ). Convective rain (solid lines) and stratiform rain (dashed lines) are compared separately. GPM observations are shown in red lines while PARSIVEL observations are shown in blue lines. The median values of convective samples (outside bracket) and stratiform samples (inside bracket) are also shown in each panel.
Remotesensing 14 00344 g009
Figure 10. The CFADs of Ku-band equivalent radar reflectivity (ZKu) from GPM observation during Typhoon In-Fa landfall for two indicated rain types: (a) convective rain, (b) stratiform rain. The black dashed lines represent median lines. The time and location of GPM observation are shown in Figure 2.
Remotesensing 14 00344 g010
Figure 11. Variations of hydrometeor percentage with altitude in the (a) convective rain and (b) stratiform rain of Typhoon In-Fa (2021). Hydrometeor percentage represents the proportion of the amount of each type of hydrometeor to the total amount of all hydrometeor types. The hydrometeor types are identified based on GPM observation shown in Figure 2.
Remotesensing 14 00344 g011
Figure 12. GPM-derived median profiles (thick lines) for (a) Dm (mm) and (b) log10(Nw) (mm−1 m−3) of two rain types during Typhoon In-Fa landfall. The interquartile ranges of each parameter are indicated with shaded area. The GPM observation data used here is shown in Figure 2.
Remotesensing 14 00344 g012
Table 1. Mean values of gamma distribution parameters in terms of different rain rates.
Rain TypeR
(mm h−1)
log10N0
(mm1-μ m3)
μ
(Dimensionless)
Λ
(mm1)
Convective5 < R ≤ 106.726.878.83
10 < R ≤ 205.845.666.60
20 < R ≤ 405.054.194.69
R > 404.422.162.96
StratiformR ≤ 210.2411.7718.83
2 < R ≤ 57.357.4911.08
5 < R ≤ 105.675.046.84
10 < R ≤ 205.845.536.72
Table 2. Exponential relationships of ZR and RDm derived from PARSIVEL disdrometer observations for two rain types.
RelationRain Typeab
Z = aRbConvective124.21.567
Stratiform196.61.465
R = aDmbConvective2.5134.109
Stratiform1.1465.011
Table 3. Comparison results of GPM and Parsivel observations for both rain rate and radar reflectivity in Typhoon In-Fa. NB (%) stands for normalized bias adapted from Wu et al. [12].
Rain TypeGPM
Sample Quantity
PARSIVEL Sample QuantityNB (%) of Rain RateNB (%) of Radar Reflectivity
Convective3793051516.3−0.27
Stratiform243610720357.219.6
Publisher’s Note: MDPI stays neutral with regard to jurisdictional claims in published maps and institutional affiliations.

