Article

Aerosols Direct Radiative Effects Combined Ground-Based Lidar and Sun-Photometer Observations: Cases Comparison between Haze and Dust Events in Beijing

1
State Key Laboratory of Severe Weather, Beijing 100081, China
2
Key Laboratory of Atmospheric Chemistry of CMA, Chinese Academy of Meteorological Sciences, Beijing 100081, China
3
Department of Atmospheric and Oceanic Sciences & Institute of Atmospheric Sciences, Fudan University, Shanghai 200433, China
4
Key Laboratory of Radiometric Calibration and Validation for Environmental Satellites (LRCVES), FengYun Meteorological Satellite Innovation Center (FY-MSIC), Beijing 100081, China
5
National Satellite Meteorological Center, Beijing 100081, China
*
Author to whom correspondence should be addressed.
Remote Sens. 2022, 14(2), 266; https://doi.org/10.3390/rs14020266
Submission received: 2 November 2021 / Revised: 11 December 2021 / Accepted: 4 January 2022 / Published: 7 January 2022
(This article belongs to the Special Issue Optical and Laser Remote Sensing of Atmospheric Composition)

Abstract

:
Aerosols can affect vertical thermal structure during heavily polluted episodes (HPEs). Here, we selected four typical HPEs in 2018, which were further subdivided into dust and haze events. The vertical distribution of aerosols extinction coefficient (EC) and variations in columnar optical properties were investigated based on sun-photometer and Lidar observation at an urban site in Beijing. The vertical characteristics in shortwave radiative heating rate (HR) of aerosols were studied using NASA/Goddard radiative transfer model along with observational data. In the haze episode, EC layer is less than 1.5 km and shows strong scattering, with single-scattering albedo (SSA440nm) of ~0.97. The heating effects are observed at the middle and upper atmosphere, and slight heating effects are found at the lower layer. The mean HR within 1.5 km can be up to 16.3 K day−1 with EC of 1.27 km−1, whereas the HR within 0.5 km is only 1.3 K day−1. In the dust episode, dust aerosols present the absorption with SSA440nm of ~0.88, which would heat the lower atmosphere to promote vertical turbulence, and the height of EC layer can be up to 2.0–3.5 km. In addition, the strong heating effects of dust layer produced cooling effects near the surface. Therefore, the accurate measurement of aerosols optical properties in HPEs is of great significance for modeling aerosols direct radiative effects.

1. Introduction

As an important part of the Earth–atmosphere system, aerosols play a vital role in the global climate change and can also influence the efficiency of solar radiation production, eco-environment, and population health [1,2,3,4,5]. On the one hand, aerosols can heat the atmosphere and cool the Earth’s surface by absorbing and scattering solar and terrestrial radiation [6,7]. Indeed, IPCC [8] pointed out that the cooling effect of aerosols can offset some of the radiative forcing from greenhouse gases and is the most uncertain part of the total anthropogenic forcing for climate change. On the other hand, aerosols can act as cloud condensation nuclei to affect the lifetime and microphysical characteristics of clouds and further to influence the precipitation efficiency with a profound impact on the global water cycle [9,10,11]. Large quantities of anthropogenic aerosols attributed to intensive human activities are emitted from the typical mega city, Beijing [12,13]. It is also located in the downwind of sand and dust from northwest China emission sources [14,15]. Numerous studies of chemical elements in PM10 (diameter < 10 μm) and PM2.5 (diameter < 2.5 μm) in Beijing have shown that PM2.5 particles mainly come from soil dust, coal combustion, transportation, marine and steel industry sources, while PM10 particles mainly come from transmitted sandstorms and anthropogenic dust, such as urban fugitive dust and road dust [16,17,18]. Therefore, a mixing of dust and near-surface pollutants is very common, showing significant differences in the composition of particulate matter during the different pollution episodes in Beijing.
Long-term ground-based aerosol remote sensing networks cover Beijing’s metropolitan area, e.g., CARSNET (China Aerosol Remote Sensing Network) and AERONET (Aerosol Robotic Network) [19,20]. Che et al. [21,22] demonstrated that aerosol optical depth (AOD) presents a seasonal variation pattern in which it is high in spring and summer and low in autumn and winter. Xia et al. [23] found that the input of large amounts of dust aerosol in spring cause changes in the physical and radiative characteristics of aerosols in Beijing. Xin et al. [24] showed that the range of variations in aerosol optical parameters conforms to the urban-industrial type of aerosol in Beijing’s urban area. Many studies have investigated the changes in aerosol chemistry, physics, and radiation based on horizontal and regional distribution of aerosols; the results of which consistently show that accurately measuring aerosol optical properties is an important prerequisite for studying aerosol radiative effects [25,26,27]. Moreover, various observational studies have shown that different types of aerosols have significant differences in vertical distributed, which can also increase uncertainties to evaluated aerosol radiative effects [28,29]. The difference in the vertical distribution of aerosol and its impact on solar radiation during HPEs needs further study.
The interaction between aerosols and solar radiation is a crucial part of the Earth–atmosphere system’s energy budget. Zhang et al. [30] proposed that aerosol radiation interaction is conducive to the formation of a feedback effect between worsening weather conditions and particles concentration, which is the reason why heavy haze pollutions can be maintained and aggravated in winter in Beijing. Aerosol radiation interaction is also a crucial component of weather and climate models. In the 1970s, Liou et al. [31,32] developed a radiative transfer model (Fu–Liou radiation model) to evaluate the influence of absorbing gases, aerosols, and clouds in the atmosphere, and reached an important conclusion that aerosols lead to an increase in the atmospheric absorption and a reduction in the solar flux that can be absorbed at the Earth’s surface. Recently, studies have shown that the heating rate (HR) with long-wave radiation is an order of magnitude smaller than that of shortwave radiation due to the weak extinction capacity of black carbon aerosols in the infrared band [33,34,35], which means the study of aerosol shortwave radiative effects in daytime is particularly important. Wang et al. [36] used SBDART (Santa Barbara Disort Atmospheric Radiative Transfer) model along with CALIPSO observations to show that dust aerosols have a warming effect on atmosphere in Tibetan Plateau, and the climatic average dust radiative heating at the near-surface can be up to 16.8 K/month at the Taklimakan Desert. Wang et al. [37] assessed the sensitivity of different radiation schemes in WRF and found that the NASA/Goddard radiative transfer scheme produces better results in terms of simulating net radiation. Moreover, the NASA/Goddard scheme has been widely used in weather and climate models in the field of atmospheric sciences [38,39,40].
Although models can estimate the long-term evolution of aerosol radiative forcing on a global scale, some parameters of aerosol in the model are usually set to theoretical values or climatic means, which bring considerable uncertainties to simulated results [36,41]. Therefore, it is necessary to accurately study the aerosol radiative heating to better understand the effects of aerosol on the Earth–atmosphere system. In the present work, we used ground-based observations, remote sensing and model simulations to investigate the role of aerosol shortwave radiative effects during haze and dust pollution episodes that occurred in spring, summer, and autumn in Beijing. Following this introduction, Section 2 describes the observational site, instruments, data, and radiative transfer model employed in this study. Section 3.1 presents the distributions of PM concentrations and air mass backward trajectories during four HPEs. Section 3.2 analyzes the meteorological conditions. Section 3.3 analyzes in detail the various columnar aerosol optical properties and the vertical distribution of the extinction coefficient (EC) and depolarization ratio (DR) during four HPEs. Then, the evolution of HR profiles and aerosol radiative effects are discussed in Section 3.4. Lastly, Section 4 provides detailed conclusions and further discussions.

2. Data and Methods

2.1. Site

The ground observation site was located at the Chinese Academy of Meteorological Sciences (CAMS) (39.933°N, 116.317°E, 106 m above mean sea level), which is in the urban regions of Beijing and whose main pollution sources are heavy traffic and various types of anthropogenic emissions. In this study, we assumed that the atmosphere over Beijing was horizontally uniform, and therefore, the aerosol optical properties measured at this site could represent the trend of changes in the urban regions of Beijing [23].

2.2. Aerosol Optical Data

2.2.1. Columnar Data

Daily mean data of aerosol optical properties were derived from CARSNET-CAMS site, where it is ensured that data are processed with highly accurate quality control and cloud filtering [42,43]. The instrument used was a CE-318 sun-photometer [44,45], which detects direct-sun and sky radiance in 440, 670, 870, and 1020 nm channels. The aerosol optical parameters measured in the atmospheric column were AOD, absorption aerosol optical depth (AAOD), single-scattering albedo (SSA), and asymmetry factor (ASY) at 440, 670, 870, and 1020 nm; Ångström exponent (AE) and absorption Ångström exponent (AAE) at 440–870 nm; and volume size distributions (dV/dlnr) in ranging from 0.05 to 15 μm.

2.2.2. Vertical Data

Vertical profiles of aerosol EC and DR were measured every 5 min by a Raman–Mie Lidar. The EC characterizing aerosol concentration is obtained by inverting the backscattered signal (1). The DR characterizing different particle shapes is defined as the ratio of the vertical components to the horizontal components of the received echo signals [46].
This Lidar installed at CAMS was produced by Gbo-Qua Technology Corporation in Hefei, China (Anhui Institute of Optical Precision Machinery, Chinese Academy of Sciences) and started detection in September 2017. The transmission unit is a Nd:YaG laser with a 532 nm central wavelength. The echo signal-receiving unit uses a Schmidt–Cassegrain optical telescope receiving system. The signal acquisition unit combines the analog-to-digital conversion and photon counting [47]. The EC is retrieved during four HPEs using the algorithm of Fernald as follows, which considers the atmosphere to be consisted of air molecules and aerosols [48]:
P ( z ) = CE [ β a ( z ) + β m ( z ) ] e 2 z 0 z [ α a ( z ) + α m ( z ) ] dz
where P is the atmospheric backscattering echo power (W) at the height z (km) received by Lidar, C is a Lidar system constant (W·km3·sr), E is the Lidar launch energy (μJ), β(z) is the backscattering coefficient (km−1·sr−1) at height z (km) and α(z) is the extinction coefficient (km−1) at height z (km), a represents aerosols, and m represents air molecules.
In this study, we filtered out missing values and avoided detecting blind zone (~200 m). After quality control, we calculated the mean of EC during the day and night based on sunshine durations [22]. According to previous evaluation and verification studies, aerosol EC and DR profile retrieved by this Lidar are sufficiently reliable [22,46,49,50].

2.3. Meteorological Data

Reanalysis data during January–December 2018 from the ERA-Interim dataset (spatial resolution: 0.25° × 0.25°) produced by European Centre for Medium-Range Weather Forecasts were used in this study [51]. Specifically, the data were gathered daily at 0800, 1400, and 2000 Beijing time (BJT), from 1 hPa (~49 km) to 1000 hPa, and consisted of zonal wind, temperature, and specific humidity.
Hourly particulate matter (PM2.5 and PM10) concentration data were obtained from the China National Environment Monitoring Centre. Moreover, we averaged the PM concentration data from about 30 sites in Beijing to represent the overall urban pollution conditions.
Vertical profiles of temperature, relative humidity (RH), and wind vector and velocity were measured by a L-Band radiosonde radar at 0800 and 2000 BJT and obtained from the China Meteorological Administration. The observation site was located at the southern edge of Beijing’s urban area, which was a prime location to reflect the vertical changes in meteorological parameters in Beijing [52].

2.4. Radiative Transfer Model

In this study, we used a radiative transfer model developed from NASA’s Goddard shortwave radiative transfer scheme [53]. This model includes the absorption due to O2, O3, CO2, aerosols, clouds, and water vapor. The model calculates atmospheric shortwave radiative HR by considering the interaction between the absorption and scattering of clouds, aerosols, molecules, and surfaces [54]. The aerosol EC, SSA, and ASY were used as aerosol parameters as a function of height and spectral band as inputs into model. The EC profiles at 532 nm were directly derived from Lidar, and the SSA and ASY of columnar atmosphere were derived from Sun-photometer. The radiative fluxes were integrated over the entire shortwave spectrum and divided into 11 bands from 0.175 to 10 μm (Table 1). Moreover, in order to analyze the shortwave radiative effects of aerosols, the HR calculated in this study involved turning off the cloud module and subtracting the HR of non-aerosol component, meaning the analysis of the aerosol HR and radiative effect in the following part is an idealized result under clear-sky conditions.

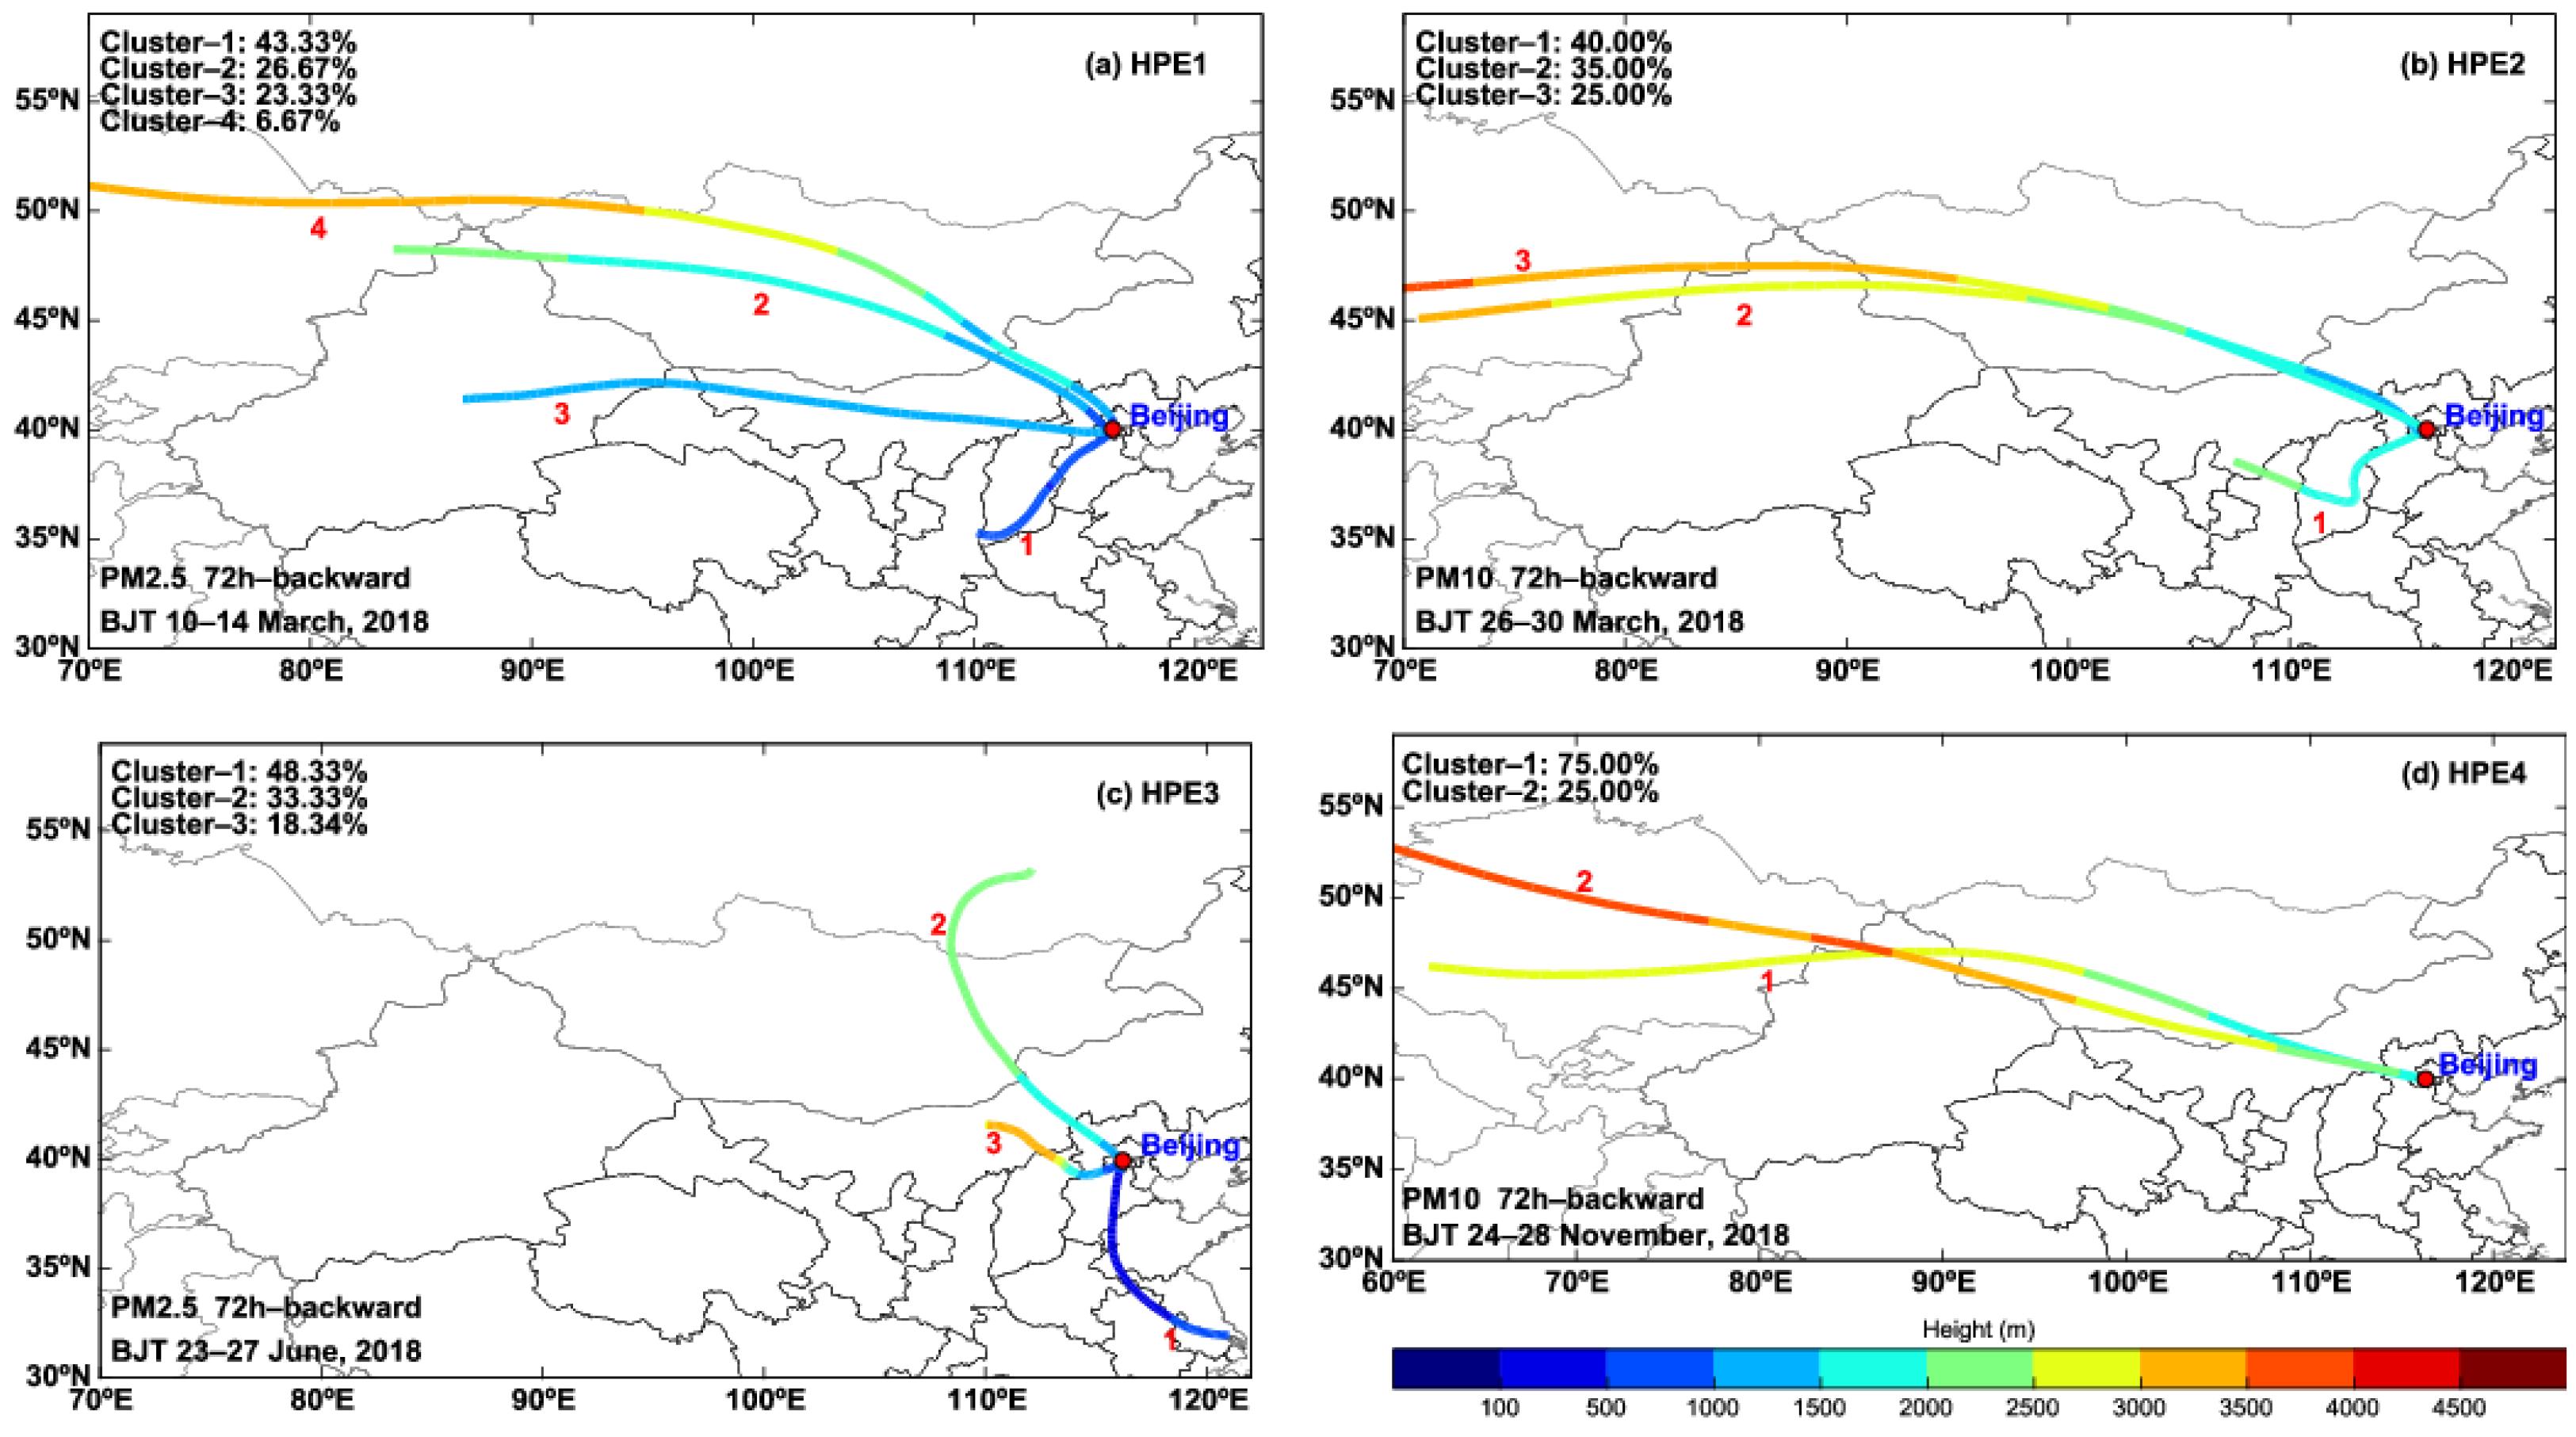
2.5. Backward Trajectory Analysis

Based on PM concentration and meteorological data from the monthly data of the Global Data Assimilation System (GDAS, https://www.ncdc.noaa.gov/ (4 December 2021)), the 72 h air mass backward trajectories were calculated during HPEs at CAMS as the start point. The backward trajectory model used for the simulation is HYSPLIT (Hybrid Single Particle Lagrangian Integrated Trajectory) model provided by National Oceanic and Atmospheric Administration. Details on the model parameters and analysis methods can be found in [55].

3. Results

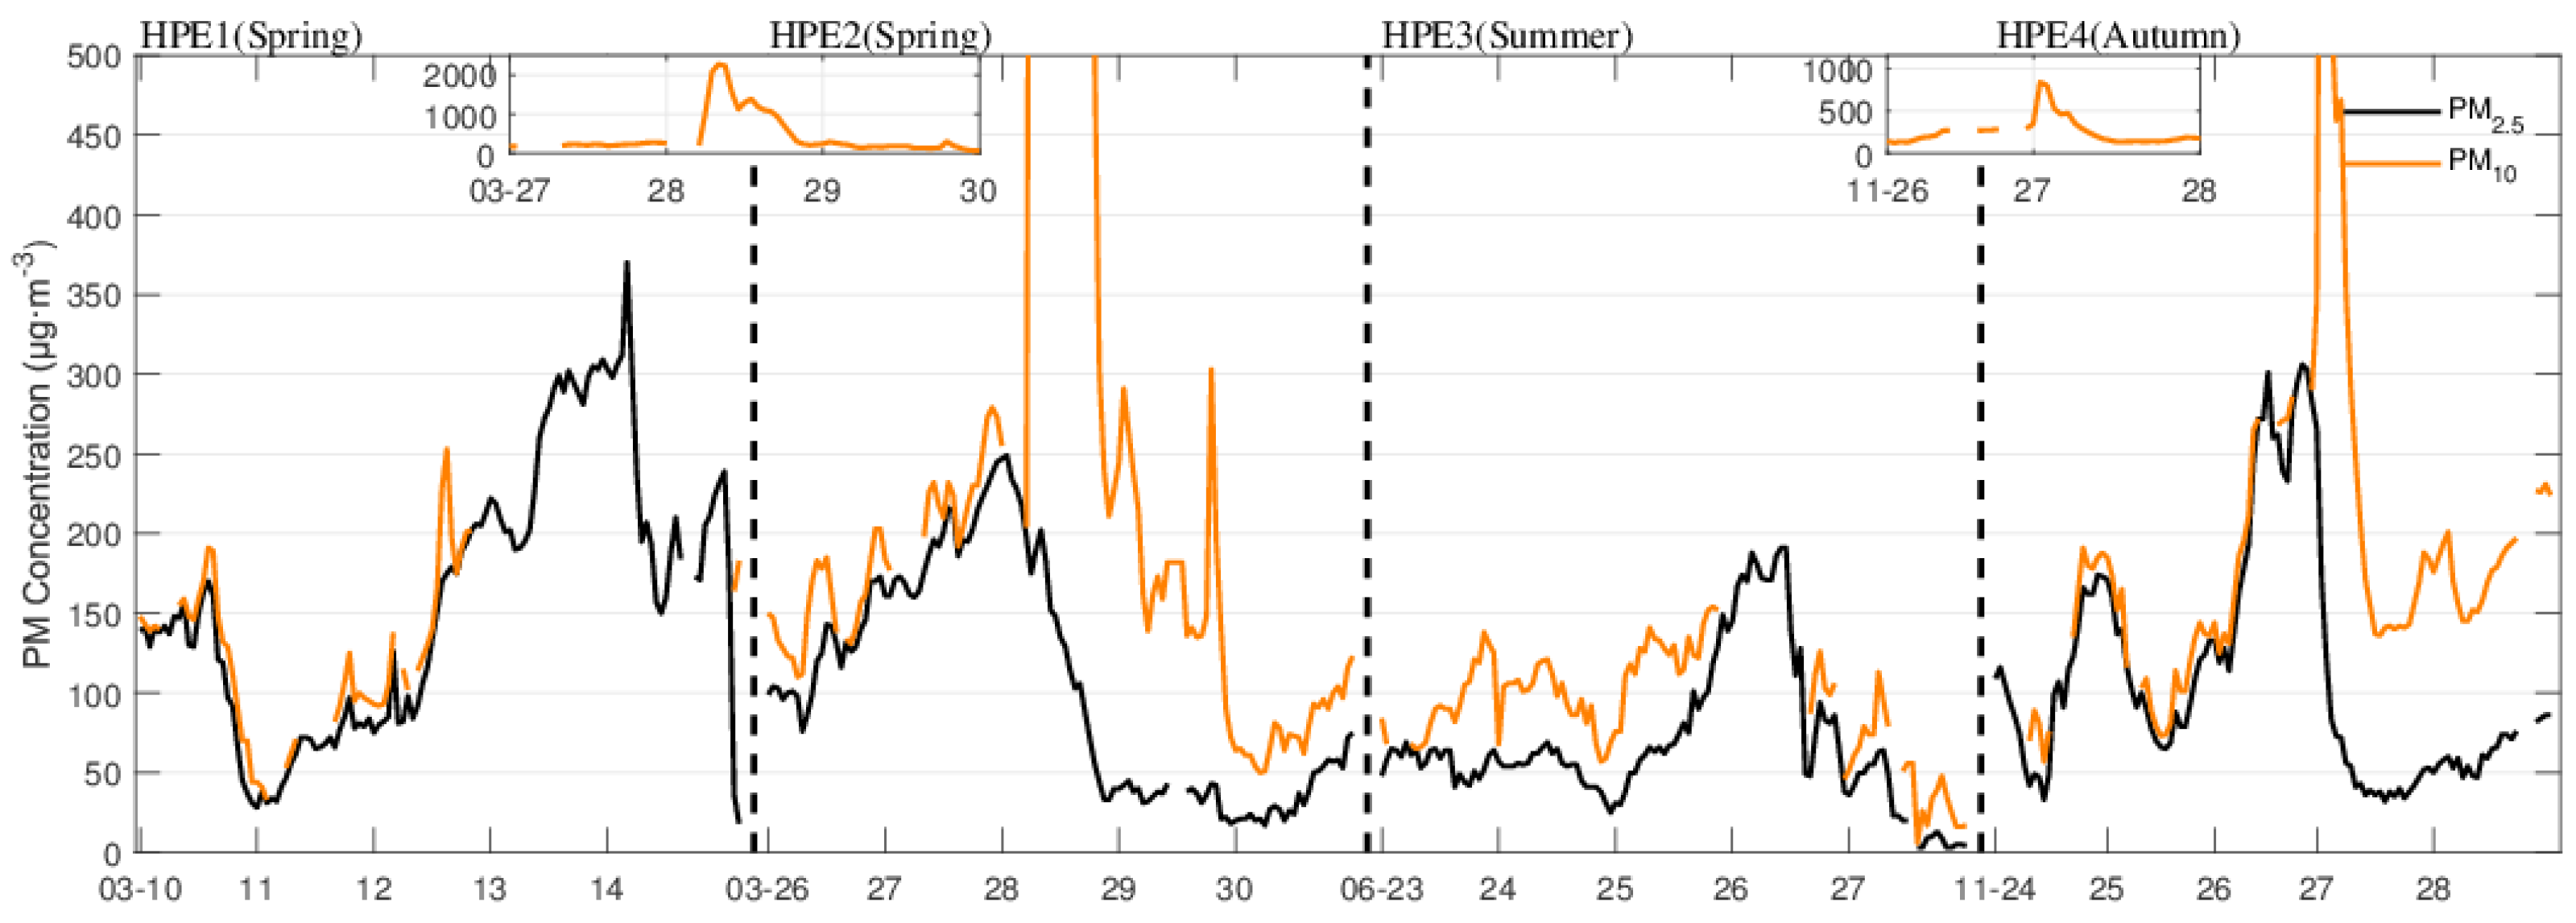
3.1. Selection of Pollution Episodes

Based on the hourly continuous data of PM concentration at Beijing urban sites in 2018, the cases contained highest PM values were selected. In this study, we focused more on the pollution events from spring to autumn, as winter pollution events were analyzed in detailed in a previous study [56]. Considering the effects of aerosols on solar radiation, we selected cases which the maximum values occurred on daytime as much as possible. Moreover, we combined with continuous aerosol observational data to avoid aerosol optical data missing caused by cloud or precipitation [57]. Finally, four typical heavily polluted cases in different seasons were selected and investigated.
Figure 1 shows the hourly PM2.5 and PM10 concentration during four HPEs, and Table 2 lists specific values and pollution levels, which are classified with air quality index provided by China’s national ambient air quality standards [58]. According to the component analysis of air pollutants in Beijing, PM2.5 is the primary pollutant in Haze, while PM10 is mainly composed of dust [59,60]. HPE1 was a haze pollution event that occurred from 10 to 14 March in spring. In the first phase of HPE1 (11–12 March), PM2.5 increased gradually from ~75 to over 200 μg m−3. Lately (13–14 March), PM2.5 on 13 March increased rapidly within ten hours to ~300–350 μg m−3 maintaining a high mass concentration level. Explosive growth in PM2.5 is a typical feature of haze pollution in Beijing, which is defined as PM2.5 concentration rapidly increased by 100–200 μg m−3 within several hours [52]. HPE2 was characterized by a severe dust outbreak that occurred in spring, and the hourly PM10 concentration exceeded 2000 μg m−3 at 1400 BJT 28 March. HPE3 was a moderate haze pollution event that occurred in summer. With respect to HPE1, although the highest hourly PM2.5 concentration in HPE3 was only ~191 μg m−3 (1000 BJT 26 June), there was also a rapid cumulative stage in HPE3. HPE4 was a mix pollution event that occurred during 24–28 November in autumn. In the first phase of HPE4 (24–26 November), PM2.5 content was more than 80% of the total concentration, and then a rapid cumulative process occurred on 26 November in which PM2.5 increased sharply to ~300 μg m−3 within ten hours. In the later period (27–28 November), PM10 was the main pollutants in the atmosphere, with the highest PM10 concentration exceeded 500 μg m−3 and PM2.5 content of about 23% on 27 November.
To identify the source areas and transport pathways of pollutants, 72 h air mass backward trajectories are shown in Figure 2. During HPE1, the first route accounted for 43.33% of the total pollutants, which mainly came from the southwest direction and through the southern Shanxi Province and the southwest Hebei Province. During HPE3, the first route, which accounted for 48.33% of the total pollution, was transported to Beijing along the western Shandong Province and the southern Hebei Province, as far as the Yangtze–Huaihe Region. Whether in HPE1 or HPE3, the PM2.5 was mainly transmitted to Beijing via paths at low altitude and passed through the southern Hebei Province, which were often considered as polluted regions due to heavy industrial emissions [61]. In the HPE2, the midwestern regions of Inner Mongolia, such as the Hunshandake Sand Land, was contributed approximately 40% to this extreme dust event over Beijing. Moreover, the dust aerosols affecting Beijing were mainly transmitted along Inner Mongolia and the border areas of China and Mongolia through long distances at 2.5–4.0 km altitude in these two dust events.
During haze pollution, the increase in PM2.5 concentration featured two stages: original accumulation and explosive growth. As for the source of PM2.5, short-distance and low-altitude transmission from southern Hebei province was the important reason for the high concentration of PM2.5 in Beijing. Then, when the fine pollutants quickly dissipated in the later or end period, the increase in PM10 concentration greatly caused secondary dust pollution. The increase in PM10 concentration over Beijing was mainly along the middle Inner Mongolia and China–Mongolia border regions, through high-altitude and long-distance routes.

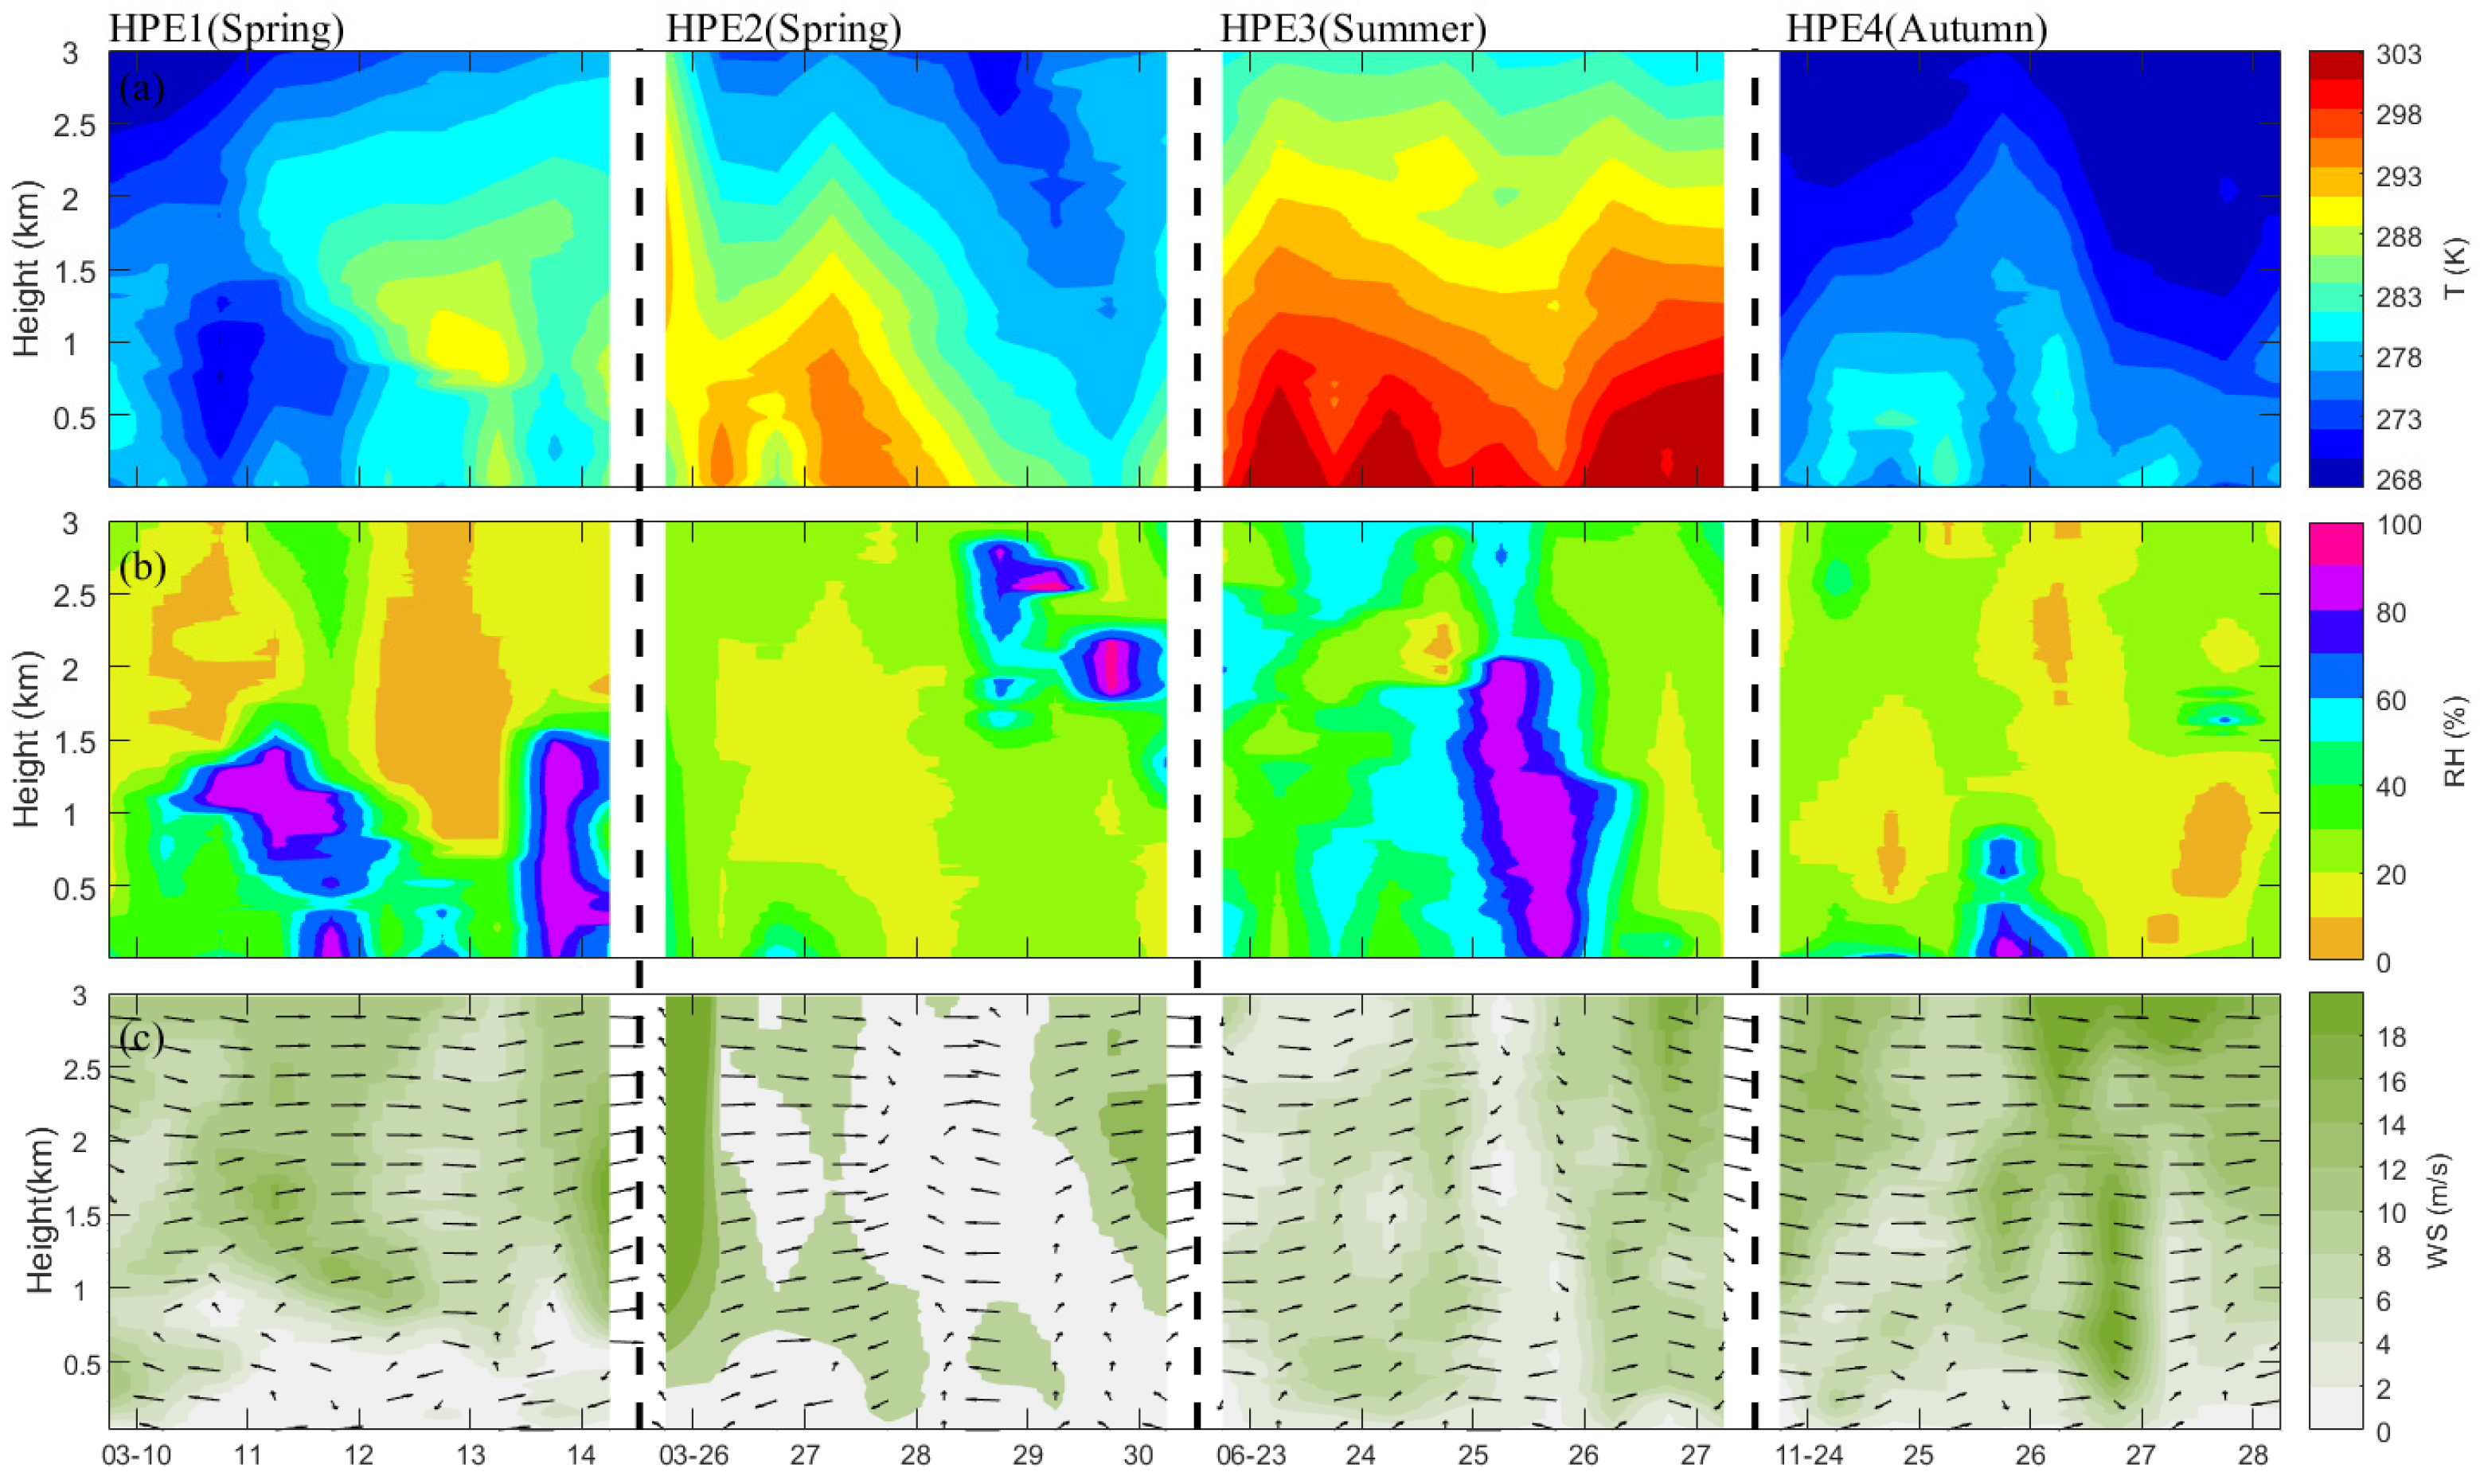
3.2. Vertical Meteorological Conditions

During the HPEs, the rapid accumulation and deposition of PM was largely affected by the meteorological conditions, including temperature, RH, and winds. Figure 3 shows the vertical distribution of these three meteorological factors up to 3 km during HPEs.
In the early phase of the haze pollution periods (10–12 March in HEP1 and 23–25 June in HEP3), southerly winds were dominant with gentle (3.4–5.4 m s−1) or moderate (5.5–7.9 m s−1) wind speeds. RH was concentrated within 40–60% near the ground, indicating that the original accumulation was unlikely caused by vertical changes in temperature and RH. However, warm and humid air masses from the south advected more water vapor and pollutants to Beijing, providing the necessary conditions for the subsequent explosive growth in later periods. In the heaviest period of haze pollution (13–14 March in HEP1, 26 June in HEP3), light wind speeds (0.3–1.5 m s−1) within 1 km were dominant, and the temperature near the ground decreased compared with the original accumulation period. In particular, an anomalous temperature inversion layer would occur, and RH increased to more than 80%, which means that the near-surface layer had a strong and stable atmospheric structure, and was not conducive to the diffusion of local or transported pollutants. For example, on 14 March in HPE1, the vertical temperature increased with altitude within 1.5 km, which was consistent with the explosive growth of PM2.5. Under the condition of sufficient moisture accumulation, large quantities of absorbent fine aerosols experience hygroscopic growth and secondary chemical transformation [62,63]. For these reasons, explosive growth of PM2.5 was promoted and maintained at a high concentration level during the haze pollution. Meanwhile, the appearance of an inversion layer was probably caused by the radiative effect of aerosol under the condition of continuous PM accumulation. In the end periods of haze pollution (27 June in HPE3, 27–28 November in HPE4), strong northwesterly winds broke the stable meteorological conditions to cause the PM2.5 concentration to drop rapidly, but these also carried amounts of dust particles over Beijing, and RH dropped sharply to 20–30%. That was the main reason why PM10 increased in the end periods and even caused secondary dust pollution.
There were various meteorological factors that contributed to HPE2 being a typical dust storm event. On 26 March, the northwesterly wind speed exceeded 18 m s−1, and the vertical wind speed gradient increased quickly; plus, cold and dry air masses from the northwest caused RH to drop to 20%. As the wind speed weakened on 28–29 March, a large amount of dust aerosol descended from the upper levels into the boundary layer, causing PM10 to exceed 2000 μg m−3. The vertical temperature gradient gradually decreased from 29 to 30 March, indicating that the increase in PM10 could also have decreased in near-surface temperature, but no inversion layer appeared.
Overall, during four HPEs, light or calm winds were dominant within the boundary layer. As the concentration of PM increased, the vertical temperature near the ground would reduce. In particular, an anomalous temperature inversion layer greatly occurred in the heavy haze pollution processes, which indicated that the radiative effects of aerosols may have played a crucial role. RH presented the opposite characteristic; the increase in PM10 tended to reduce RH to less than 20%, while the increase in PM2.5 would increase it to more than 80%.

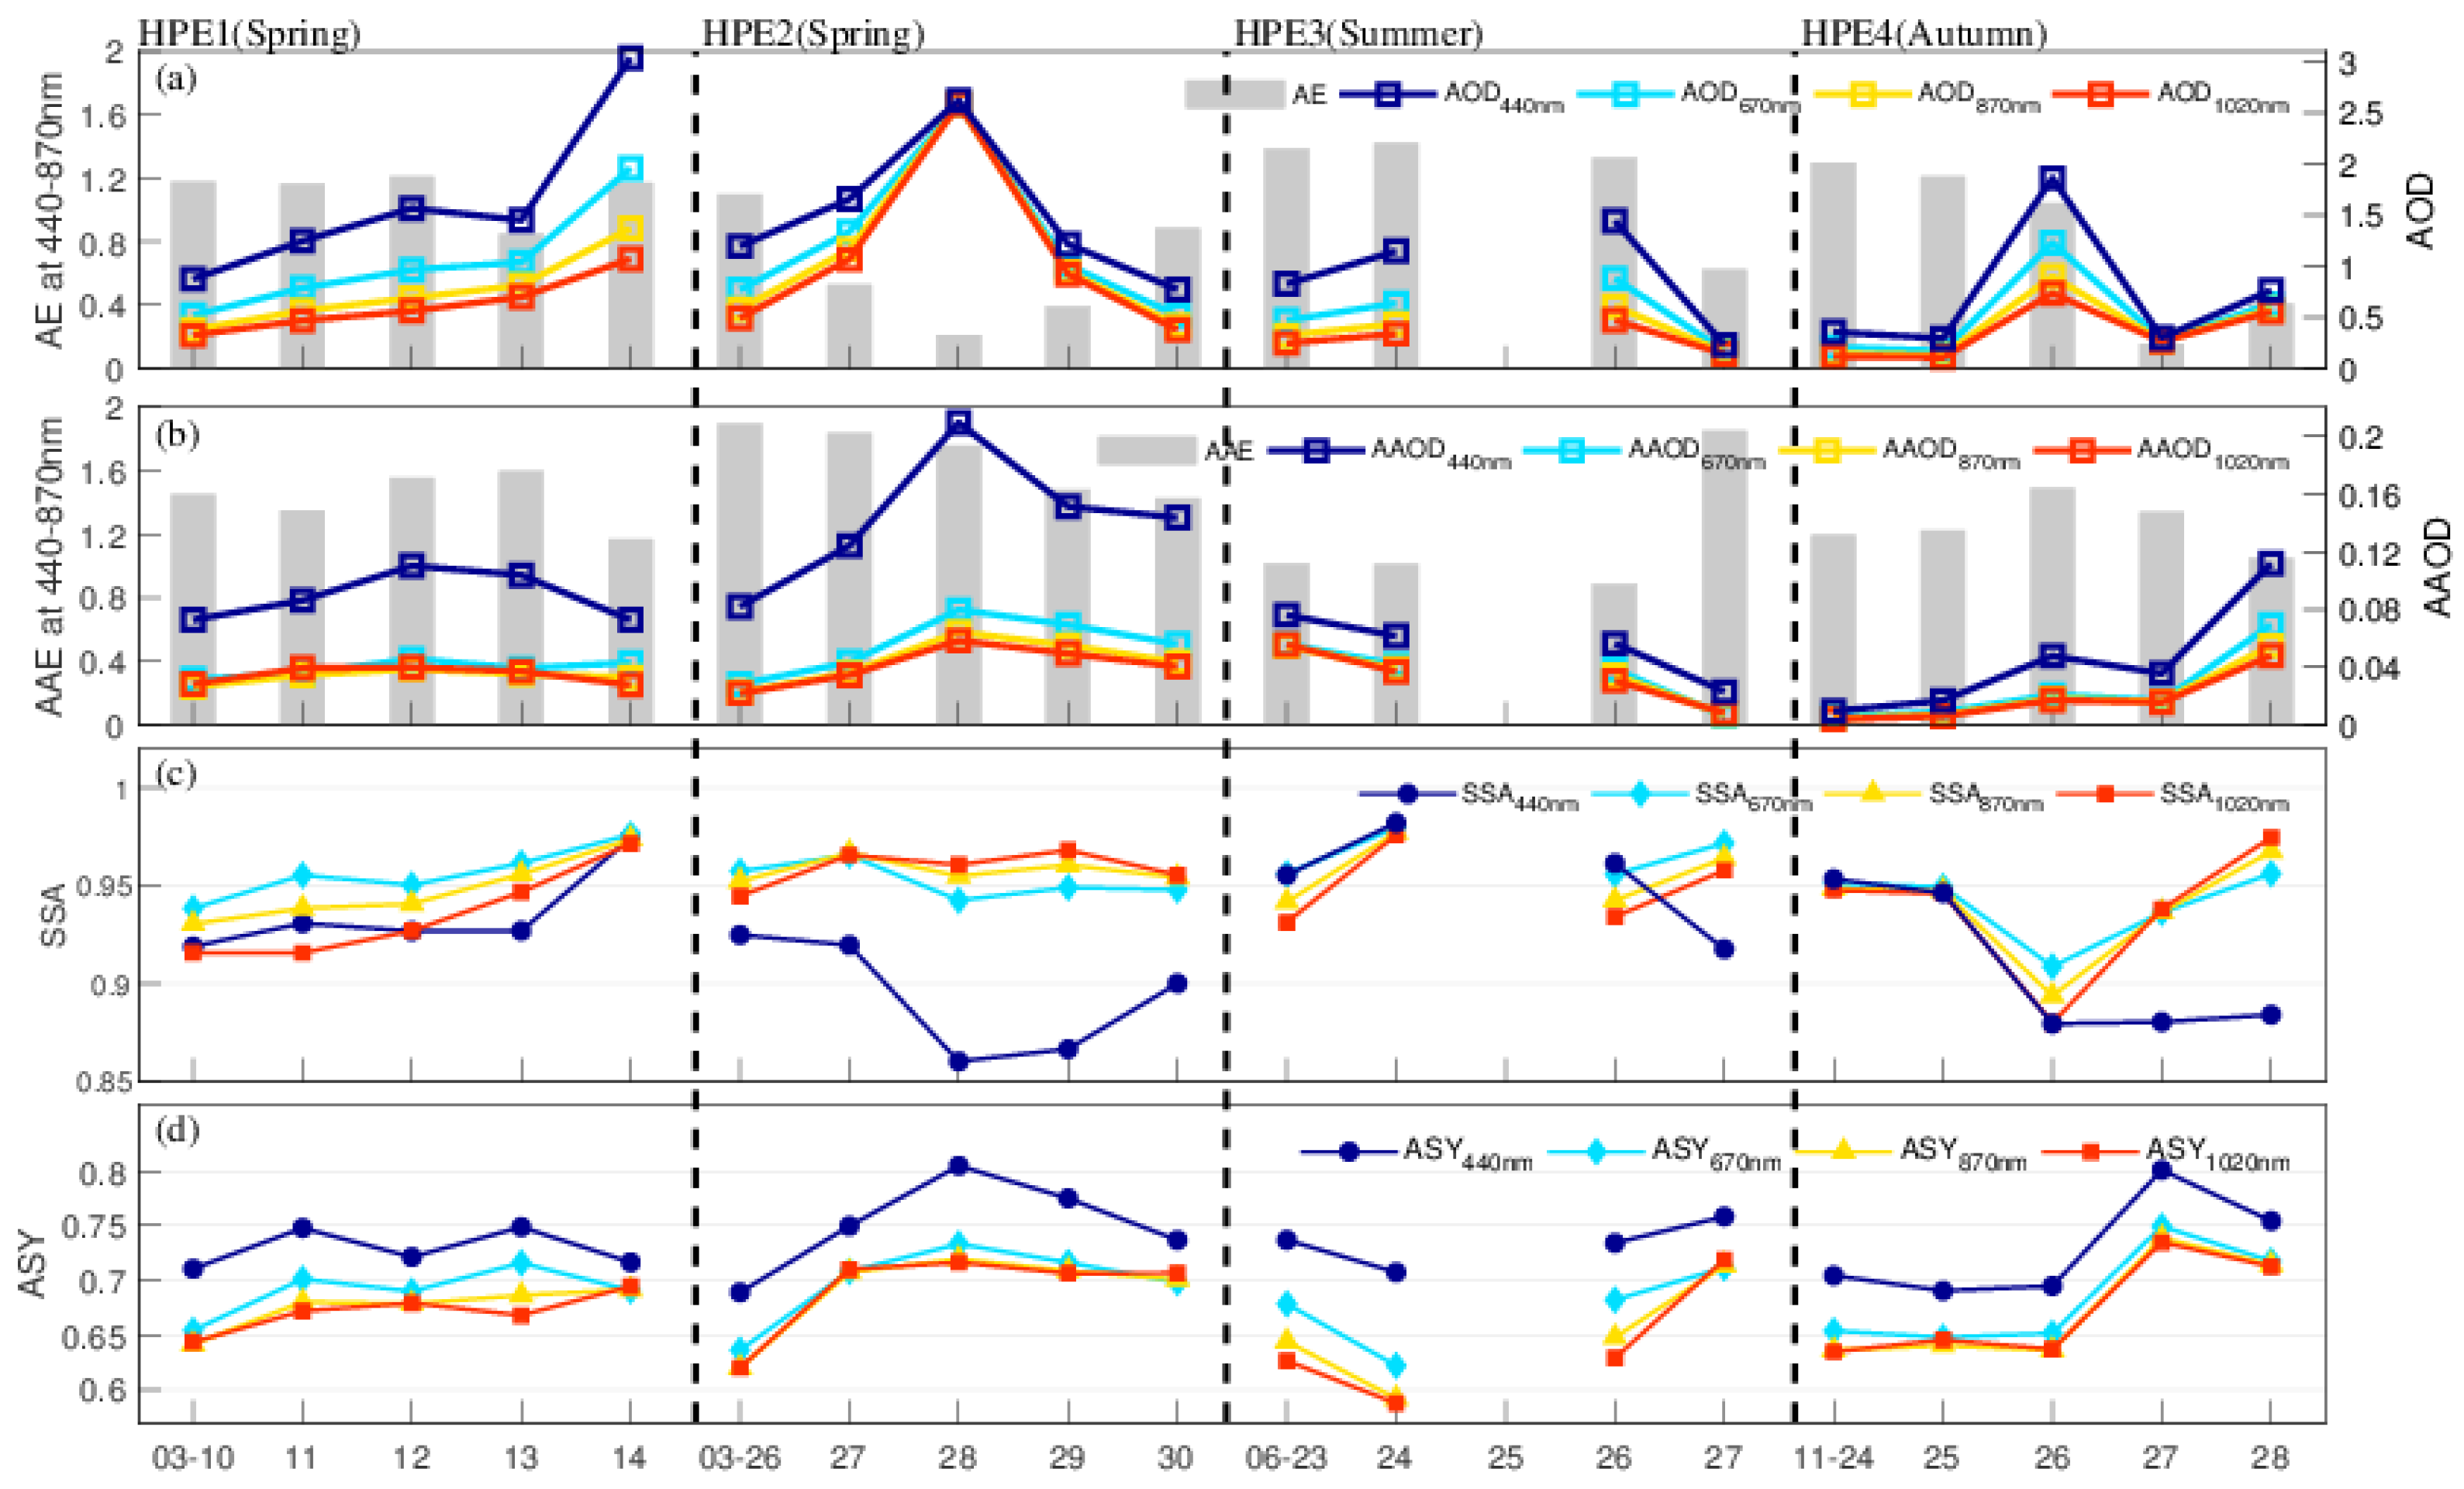
3.3. Aerosol Optical Properties

Aerosols can heat or cool the atmosphere by absorbing or scattering solar energy, thereby affecting the atmospheric thermal structure [64]. Aerosol optical parameters are crucial for evaluating the extinction capacity of aerosols. Figure 4 shows the daily mean variations in aerosol optical properties during four HPEs, and Figure 5 shows the columnar aerosol volume–size distributions. Figure 6 illustrates the spatiotemporal distribution of aerosol EC and DR, and Figure 7 further shows the mean profiles of EC.
During the HPE1, the main extinction layer (MEL, EC > 0.4 km−1) was located at the height of 1.0 to 1.5 km on 11 March, which indicated that was a low-altitude transmission process of pollutants in the early stage. On 12 March, the transported pollutants were gradually deposited and mixed with local pollutants, and the extinction capacity of the aerosol layer was enhanced. AOD440nm was ~1.56, AE was ~1.26, and the MEL was located within 1.2 km. DR in this layer was less than 0.15, and the maximum EC during daytime can be up to ~0.93 km−1 (at ~0.85 km), indicating that the atmosphere was dominated by fine-mode (radius < 0.6 μm) and spherical aerosols, and aerosols gathered near the surface with moderate extinction capacity. The size distribution showed a bimodal lognormal pattern, and the radius of fine-mode aerosol mainly ranged from 0.15 to 0.20 μm, which is highly similar to the distribution characteristics of urban-industrial aerosol [65]. The aerosol layer experienced an uplift process on 13 March, and the MEL first decreased under 0.5 km and then rose up to ~0.7 km, which would have also brought dust from the surface into the atmosphere, causing AE to decrease to ~0.91 and the volume of coarse-mode (radius > 0.6 μm) aerosol (1.30–1.70 μm) to increase. On the most polluted day (14 March), AOD440nm was ~2.98, AE was ~1.41, the MEL rose continually to ~1.4 km from the surface and the maximum EC was ~1.91 km−1 (~0.81 km), indicating that aerosols had their strongest extinction capacity. SSA440nm reached ~0.97, indicating that the aerosols layer also had strong scattering. The maximum volume of ~0.28 μm3 μm−2 corresponded to s radius of 0.25 μm, indicating that the explosive growth of fine-mode aerosol near the ground and the process of hygroscopic growth occurred simultaneously. ASY440nm ranging from 0.70 to 0.75 showed no significant change during the HPE1, indicating that the scattering direction was dominated by forward scattering during haze pollution.
In HPE2, AOD440nm increased from 1.05 to 2.60, while AE dropped sharply from 1.02 to 0.21 due probably to a dust advection that constantly increased from 26 to 28 March. The size distribution gradually showed a unimodal distribution trend dominated by coarse-mode aerosol, and the coarse-mode volume reached the maximum of 1.0 μm3 μm−2 with a radius of 1.70 μm on 28 March. AAOD440nm increased from 0.08 to 0.21, indicating an increase in absorptive aerosol concentration. SSA440nm decreased from 0.92 to 0.86, while there was no obvious downward trend in 670–1020 nm bands, suggesting that the absorption of iron oxide had wavelength-dependence, resulting in mineral dust aerosols having strong shortwave absorption and slight longwave absorption [22]. ASY440nm increased from 0.69 to 0.80, indicating the size of aerosol increased and led to an increase in the forward scattering. After 0300 BJT 17 March, DR was above 0.20 within 4.5 km, indicating large quantities of sand-dust were transported to Beijing, and Lidar was able to observe clear paths of deposition. On the most polluted day (28 March), the MEL rose up to ~2.1 km from the surface, and the maximum EC was ~1.16 km−1 (~0.34 km). The heating effect of near-surface dust aerosols promoted vertical turbulence, resulting in well-mixed dust aerosols entering into the upper atmosphere from the surface. Therefore, the MEL rose to 2.5–3.2 km above the ground with the maximum EC of ~0.42 km−1 (~2.62 km), and the high DR layer (>0.20) was located at 1.5–4.0 km on 29 March. From 29 to 30 March, AOD440nm decreased from 1.21 to 0.77, AE increased from 0.31 to 0.80, and SSA440nm increased from 0.87 to 0.90, indicating that as the dust pollution subsided, the main particles in the atmosphere gradually shifted into fine particles, which were derived from local anthropogenic emissions [66].
During the HPE3, the variational trend of aerosol optical properties was similar to that of HPE1. The increasing trend of EC mainly took place between 1200 on 25 June and 1500 on 26 June, and the MEL was below 1.4 km (Figure 6). Meanwhile, the low DR (<0.05) in this layer indicates that pollutants near the ground were mainly spherical particles. AE was ~1.30–1.40, and AAE was ~0.9–1.0 (Figure 4), which is in accordance with the urban industrial aerosol type [64]. On the most polluted day (26 June), the MEL was below 1.2 km with the maximum EC of ~1.82 km−1 (~0.72 km). Compared with the spring haze event (HPE1), PM2.5 concentration on 26 June was lower than 14 March, whereas the aerosol extinction capacity was equivalent within 1.0 km, probably because of the abundant water vapor in summer promoting the hygroscopic growth of aerosol and ultimately increasing the extinction capacity of single particles. On 27 June, the high DR reached 3.5 km, indicating that the strong northerly winds probably carried dust into the atmosphere in the haze elimination stage. Compared with 26 June, ΔAE was −0.99 (from ~1.40 to ~0.41), ΔAAOD was 0.96 (from 0.89 to 1.85), and ΔSSA was −0.04 (from 0.96 to 0.92). However, EC was less than 0.10 within 3.0 km, and columnar AOD440nm was ~0.23, indicating that aerosol concentration in atmosphere was extremely low.
In the early period of HPE4 (24–26 November), the MEL was below 1.0 km, DR in this layer was mainly between 0.1 and 0.2, AE was ~1.10, and AAE was ~1.21, suggesting that fine-mode aerosol consisted of local emissions and floating dust from surface [61,67]. The most polluted day (26 November) showed an opposite trend with mineral dust pollution (HPE2), in which the maximum EC was ~1.26 km−1 (~0.29 km), AOD440nm was ~1.86, and AAOD440nm was only 0.05, indicating that the strong extinction capacity of aerosol in HPE4 mainly derived from anthropogenic emissions. After 1200 BJT 26 November, DR below 2.5 km increased dramatically to more than 0.3, which means that the atmosphere was dominated by irregular particles, i.e., dust aerosols. On 27 November, under the conditions of an increased PM10 concentration and decreased PM2.5 concentration, the maximum EC dropped to 0.22 km−1, and ΔAOD440nm was −1.56. We found that the extinction capacity of the aerosol layer dominated by dust was weaker than that of anthropogenic pollutants. Meanwhile, the extinction capacity was also related to the thickness of the aerosol layer. The increase in ASY440nm to 0.80 once again proves that the forward scattering is positively correlated with the aerosol size. Affected by vertical turbulence on 28 November, large quantities of fugitive dust entered the upper atmosphere and were well-mixed, causing the MEL to rise to 1.40–1.84 km above the ground with the maximum EC of ~0.54 km−1 (~1.67 km).
In short, the more pollutants contained in the atmosphere, the stronger the extinction capacity of the aerosol layer. During the haze pollution, the aerosol layer was less than 1.5 km and dominated by fine-mode and spherical particles, which have extremely strong scattering, and the forward scattering accounts for 70% of the total scattering. If haze pollution occurs in summer, the aerosol layer could have a stronger extinction capacity due to the hygroscopic growth. During the dust pollution, the high EC layer can rise to the upper atmosphere (~3.0 km), but the overall aerosol layer extinction capacity is weaker than that during haze pollution. Dust aerosols have obvious absorption characteristics in the shortwave band, which was propitious to heat the lower atmosphere to promote vertical turbulence. The large and irregular shapes of dust particles also increase the proportion of forward scattering.

3.4. Aerosol Shortwave Radiative Effect

According to the analysis in previous sections, the increased extinction capacity of aerosols during a pollution process reduces the solar radiation reaching the surface and heat atmosphere. To clearly understand the direct radiative effect of aerosol to atmosphere, we used observational data to calculate the mean vertical distribution of aerosol shortwave radiation HR under clear sky, as shown in Figure 8.
Aerosols mainly heat the atmosphere through absorption, and HR shows that an increasing trend of the aerosol heating effect on the atmosphere corresponds to an increase in aerosol extinction capacity. During the HPE1, the mean HR within 1.5 km was 11.5 K day−1 on 12 March, 11.2 K day−1 on 13 March, and 16.3 K day−1 on 14 March with corresponding EC values of 0.62, 0.50, and 1.27 km−1. The mean EC at a height of 1.5–3.0 km was 0.12 km−1 on 12 March, 0.13 km−1 on 13 March, and 0.05 km−1 on 14 March, which caused corresponding HRs of 12.0, 15.1, and 3.1 K day−1. The vertical distribution of HR showed that the centralized heating layer matched the aerosol extinction layer well, which was mainly caused by the difference in the vertical aerosol distribution. The mean HR within 0.5 km on 13 March reached 8.8 K day−1; therefore, aerosol heating the lower atmosphere facilitated turbulence to cause the height of the aerosol layer to increase on 14 March. On 14 March, the mean HR within 0.5 km was only 1.3 K day−1, indicating that the low aerosol layer showed a slight heating effect, while the middle and upper layer had a strong heating effect, which is comparable to the findings of Liou et al. [68]. The early period of dust pollution in HPE2 (26–27 March) had a similar heating effect; aerosol gathered below 1.0 km, heating the lower atmosphere layer causing the height of the aerosol extinction layer to increase on 28 March. On 28 March, the concentrated heating layer (>10 K day−1) rose to the height of 1.7–3.6 km with a corresponding mean HR of 25.2 K day−1. The strong heating effect of the dust aerosol layer modified the vertical atmospheric thermal structure, drastically accelerating the convective movement of occurring air masses, which may have been responsible for the high EC layer observed in the upper atmosphere at night (Figure 6), and ultimately caused the concentrated heating layer to rise to a height of 2.2–5.0 km on 29 March. Compared with haze pollution (HPE1), the aerosol layer extinction capacity during dust pollution (HPE2) was significantly weaker, thus demonstrating a stronger heating effect due to strong capacity of dust aerosol to absorb solar radiation. Furthermore, the mean HR within 1.0 km is −1.3 K day−1 on 28 March and −0.4 K day−1 on 29 March, which indicated that the dust aerosol layer severely weakened the sunlight reaching the lower atmosphere, resulting in a near-surface radiative cooling effect [69].
The maximum HR occurred in HPE3. On the most polluted day (26 June), the mean HR within 1.5 km was almost 25.0 K day−1 with a corresponding EC of 1.02 km−1. It was almost 1.5 times higher than that on 14 March (HPE1), suggesting that the Northern Hemisphere has the highest solar elevation angle in summer, leading to a higher increase in HR than in other seasons. Therefore, the closer the pollution events occur to summer, the stronger the heating effect of the aerosol layer on the atmosphere. In particular, the mean HR within 1.5 and 3 km was 9.8 and 9.2 K day−1 on 27 June, respectively, indicating that a low aerosol concentration under clean conditions always has a weak heating effect on atmosphere. Likewise, pollution events occurring in autumn and winter have a small HR due to the low solar elevation angle. On the most polluted day in HPE4 (26 November), the HR profile was similar to that of HPE1, the mean HR within 1.5 km was 10.2 K day−1 with an EC of 1.02 km−1, and the mean HR within 0.5 km was 1.3 K day−1. On 28 November with floating dust aerosol as primary pollutant, the HR profile was similar to that of 28 June in HPE2, with the concentrated heating layer at the height of 1.9–3.0 km. The mean HR of this layer was 19.5 K day−1, while the mean HR within 1.0 km is −0.3 K day−1.
Analysis of the direct shortwave radiative effect of aerosol shows that they play a key role in heating the atmosphere. HR profiles largely depend on the vertical distribution of aerosols during pollution processes. Figure 9 illustrates the direct radiative effects of aerosols during haze and dust events. The concentrated heating layer (>10 K day−1) is located in the middle and upper aerosol layer, the slight heating effect (<5 K day−1) occurs in the low aerosol layer, and even a cooling effect (<0 K day−1) can occur in near-surface during dust pollution events. HR value is also affected by aerosol scattering capacity and solar position. The closer to summer the pollution events occur and the more dust the aerosols contained in the pollutant mix, the higher the HR caused by aerosols. Therefore, accurate measurement of the optical properties of aerosols in different pollution processes is of great significance for accurately modeling and evaluating the HR of atmosphere from the radiative heating or cooling effects of aerosols.

4. Conclusions and Discussion

In this study, the variations in the vertical distribution and aerosol optical properties during four HPEs that occurred in different seasons were investigated based on sun-photometer and Lidar observations. Combined with radiosonde data, the evolution of near-surface meteorological factors during the different pollution processes was analyzed. In addition, the vertical characteristics in the shortwave radiative effects of aerosol were examined based on HR simulated by the NASA/Goddard radiative transfer model and observational data.
The composition of pollutants in Beijing is quite complex. We divided the pollution events into two categories: haze pollution, which is mainly composed of fine-mode spherical particles; and dust pollution, which mainly consists of coarse-mode irregular particles. During the pollution events, light or even calm winds are prevailed within 1.0 km, which makes a contribution to the accumulation of pollutants near the ground, and the extinction capacity of the aerosol layer was correspondingly enhanced. Due to large quantities of anthropogenic aerosols that accumulated, the aerosol MEL was less than 1.5 km, AE was ~1.20–1.35, and DR of this layer was less than 0.15, which can therefore be considered as the typical characteristics of haze pollution. Meanwhile, the aerosol layer showed a strong scattering with SSA440nm of ~0.97, and forward scattering accounted for ~70% of total scattering. The southerly winds brought sufficient water vapor, with RH rising rapidly to 80%, thus causing the hygroscopic growth of fine-mode aerosol in the explosive growth stage, and the maximum fine-mode volume for the radius of 0.25–0.30 μm. If haze pollution occurs in summer, the aerosol layer has a stronger extinction capacity than in other seasons because of more water vapor being in atmosphere. In the stage of haze dissipation, strong northerly winds are the dominant meteorological condition, which bring amounts of dust aerosols over Beijing and can even cause secondary dust pollution. During the dust pollution, the height of aerosol MEL can rise to the upper atmosphere (~3.0 km), but the extinction capacity of the whole layer is weaker than that of haze pollution. Due to the shape of dust aerosols, AE shows a minimum value (~0.20), and DR is greater than 0.20. In particular, dust aerosol can show strong absorption characteristics in the shortwave band, with SSA440nm of 0.86–0.88 and an increase in the forward scattering fraction to 80%. The absorption of dust aerosol heats the lower atmosphere, promotes the development of vertical turbulence, and further raises the height of dust aerosol layer.
The aerosol layer mainly shows heating effects on the atmosphere, and these heating effects increase as the extinction capacity enhances. Under clear-sky conditions, the aerosol layer can show a weak heating effect with an HR of less than 10 K·day−1. HR profiles are largely dependent on the vertical distribution of aerosol EC and are also affected by aerosol SSA and solar position. During the haze pollution, the concentrated heating layer (>10 K day−1) is located in the middle and upper aerosol layer, and the heating effect of the low aerosol layer is slight. During the HPE1, the mean HR within 1.5 km reached 16.3 K day−1 with a corresponding EC of 1.27 km−1, while the HR within 0.5 km was only 1.3 K day−1. During the dust pollution, the strong heating effect of dust aerosol layer causes a cooling effect near the surface. During the HPE2, the mean HR in the concentrated heating layer reaches 25.2 K day−1 with an EC of 0.72 km−1, while the HR within 1.0 km was −1.3 K day−1. Meanwhile, the closer a pollution event occurs to summer and the more dust aerosol in pollutants mixed, the stronger the heating effects on the atmosphere. The mean HR within 1.5 km was almost 25.0 K day−1 with an EC of 1.02 km−1 in HPE3. The difference in the distribution of the aerosol heating effect changes the atmospheric thermal structure and promotes the emergence of an inversion layer. Conversely, the occurrence of an inversion layer is more conducive to the accumulation of aerosol pollution near the ground, which then leads to extra deterioration in the meteorological conditions. This feedback loop of the shortwave radiative effects of aerosols and worsening meteorological conditions near-surface during HPEs may ultimately have a profound impact on large-scale climate warming.
In general, the accurate measurement of aerosol optical properties in different HPEs is of great significance for modeling and estimating the aerosol direct radiative effects. Pollution processes also involve the secondary chemical conversion processes from various types of aerosols, but we only studied the vertical distribution of aerosols and the changes in optical properties in this work, which mean the actual situation regarding to the evolution of aerosol needs more ground-based observations to obtain a more detailed explanation. In addition, the physical relationship between aerosol and solar radiation is quite complicated and contains many nonlinear effects, which leads to certain gaps between model simulation and in site observations. The actual situation also needs to consider the indirect effects between aerosols and clouds. Therefore, we need to pay more attention to understanding the conversion of aerosols and their radiative effects during HPEs.

Author Contributions

Conceptualization, Y.L., H.C. and H.W.; methodology, Y.L. and W.Z.; software, Y.L.; validation, Y.L., H.C. and H.W.; formal analysis, Y.L. and Y.Z.; investigation, Y.L.; resources, Y.Z., L.L. and K.G.; data curation, Y.Z.; writing—original draft preparation, Y.L.; writing—review and editing, H.C. and P.Z.; visualization, Y.Z. and K.G.; supervision, P.Z. and X.Z.; project administration, X.Z.; funding acquisition, H.C. All authors have read and agreed to the published version of the manuscript.

Funding

This research was funded by National Natural Science Foundation of China (41825011&41905117), and National key research and development program of China (2019YFC0214601&2019YFC0214603).

Data Availability Statement

Data available on request due to restrictions, e.g., privacy or ethical.

Acknowledgments

We acknowledge the two anonymous reviewers and academic editors for their thoughtful suggestions to help improve this paper substantially.

Conflicts of Interest

The authors declare no conflict of interest.

References

  1. Hansen, J.; Sato, M.; Ruedy, R.; Lacis, A.; Oinas, V. Global warming in the twenty-first century: An alternative scenario. Proc. Natl. Acad. Sci. USA 2000, 97, 9875–9880. [Google Scholar] [CrossRef] [Green Version]
  2. Levy, H.; Schwarzkopf, M.; Horowitz, L.; Ramaswamy, V.; Findell, K.L. Strong sensitivity of late 21st century climate to projected changes in short-lived air pollutants. J. Geophys. Res. Atmos. 2008, 113, D06102. [Google Scholar] [CrossRef] [Green Version]
  3. Carmichael, G.R.; Adhikary, B.; Kulkarni, S.; D’Allura, A.; Tang, Y.; Streets, D.; Zhang, Q.; Bond, T.C.; Ramanathan, V.; Jamroensan, A.; et al. Asian aerosols: Current and year 2030 distributions and implications to human health and regional climate change. Environ. Sci. Technol. 2009, 43, 5811–5817. [Google Scholar] [CrossRef] [PubMed]
  4. Lolli, S. Is the Air Too Polluted for Outdoor Activities? Check by Using Your Photovoltaic System as an Air-Quality Monitoring Device. Sensors 2021, 21, 6342. [Google Scholar] [CrossRef] [PubMed]
  5. Kim, S.; Lee, J.; Oh, S.; Yoon, Y. Assessment of the volcanic hazard of Mt. Paektu explosion to international air traffic using South Korean airspace. Nat. Hazards 2019, 96, 647–667. [Google Scholar] [CrossRef]
  6. Charlson, R.J.; Schwartz, S.; Hales, J.; Cess, R.D.; Coakley, J., Jr.; Hansen, J.; Hofmann, D. Climate forcing by anthropogenic aerosols. Science 1992, 255, 423–430. [Google Scholar] [CrossRef]
  7. Che, H.; Qi, B.; Zhao, H.; Xia, X.; Eck, T.F.; Goloub, P.; Dubovik, O.; Estelles, V.; Cuevas-Agulló, E.; Blarel, L.; et al. Aerosol optical properties and direct radiative forcing based on measurements from the China Aerosol Remote Sensing Network (CARSNET) in eastern China. Atmos. Chem. Phys. 2018, 18, 405–425. [Google Scholar] [CrossRef] [Green Version]
  8. Stocker, T. Climate Change 2013: The Physical Science Basis: Working Group I Contribution to the Fifth Assessment Report of the Intergovernmental Panel on Climate Change; Cambridge University Press: Cambridge, UK, 2014. [Google Scholar]
  9. Twomey, S.A.; Piepgrass, M.; Wolfe, T. An assessment of the impact of pollution on global cloud albedo. Tellus B 1984, 36, 356–366. [Google Scholar] [CrossRef]
  10. Rosenfeld, D. Suppression of rain and snow by urban and industrial air pollution. Science 2000, 287, 1793–1796. [Google Scholar] [CrossRef]
  11. Rosenfeld, D.; Sherwood, S.; Wood, R.; Donner, L. Climate effects of aerosol-cloud interactions. Science 2014, 343, 379–380. [Google Scholar] [CrossRef]
  12. Yang, Y.; Zheng, Z.; Yim, S.; Roth, M.; Ren, G.; Gao, Z.; Wang, T.; Li, Q.; Shi, C.; Ning, G.; et al. PM2. 5 pollution modulates wintertime urban heat island intensity in the Beijing-Tianjin-Hebei Megalopolis, China. Geophys. Res. Lett. 2020, 47, e2019GL084288. [Google Scholar] [CrossRef] [Green Version]
  13. Zhao, X.; Zhou, W.; Han, L. Human activities and urban air pollution in Chinese mega city: An insight of ozone weekend effect in Beijing. Phys. Chem. Earth 2019, 110, 109–116. [Google Scholar] [CrossRef]
  14. An, L.; Che, H.; Xue, M.; Zhang, T.; Wang, H.; Wang, Y.; Zhou, C.; Zhao, H.; Gui, K.; Zheng, Y.; et al. Temporal and spatial variations in sand and dust storm events in East Asia from 2007 to 2016: Relationships with surface conditions and climate change. Sci. Total Environ. 2018, 633, 452–462. [Google Scholar] [CrossRef] [PubMed]
  15. Wang, W.; Shao, L.; Zhang, D.; Li, Y.; Li, W.; Liu, P.; Xing, J. Mineralogical similarities and differences of dust storm particles at Beijing from deserts in the north and northwest. Sci. Total Environ. 2021, 803, 149980. [Google Scholar] [CrossRef]
  16. Zhang, R.; Jing, J.; Tao, J.; Hsu, S.-C.; Wang, G.; Cao, J.; Lee, C.S.L.; Zhu, L.; Chen, Z.; Zhao, Y. Chemical characterization and source apportionment of PM2.5 in Beijing: Seasonal perspective. Atmos. Chem. Phys. 2013, 13, 7053–7074. [Google Scholar] [CrossRef] [Green Version]
  17. Zíková, N.; Wang, Y.; Yang, F.; Li, X.; Tian, M.; Hopke, P.K. On the source contribution to Beijing PM2. 5 concentrations. Atmos. Environ. 2016, 134, 84–95. [Google Scholar] [CrossRef]
  18. Liu, Q.; Liu, Y.; Yin, J.; Zhang, M.; Zhang, T. Chemical characteristics and source apportionment of PM10 during Asian dust storm and non-dust storm days in Beijing. Atmos. Environ. 2014, 91, 85–94. [Google Scholar] [CrossRef]
  19. Che, H.; Zhang, X.; Xia, X.; Goloub, P.; Holben, B.; Zhao, H.; Wang, Y.; Zhang, X.; Wang, H.; Blarel, L.; et al. Ground-based aerosol climatology of China: Aerosol optical depths from the China Aerosol Remote Sensing Network (CARSNET) 2002–2013. Atmos. Chem. Phys. 2015, 15, 12715–12776. [Google Scholar] [CrossRef] [Green Version]
  20. Holben, B.N.; Eck, T.F.; Slutsker, I.; Tanré, D.; Buis, J.P.; Setzer, A.; Vermote, E.; Reagan, J.A.; Kaufman, Y.J.; Nakajima, T. AERONET—A Federated Instrument Network and Data Archive for Aerosol Characterization. Remote Sens. Environ. 1998, 66, 1–16. [Google Scholar] [CrossRef]
  21. Che, H.; Xia, X.; Zhu, J.; Li, Z.; Dubovik, O.; Holben, B.; Goloub, P.; Chen, H.; Estelles, V.; Cuevas-Agulló, E.; et al. Column aerosol optical properties and aerosol radiative forcing during a serious haze-fog month over North China Plain in 2013 based on ground-based sunphotometer measurements. Atmos. Chem. Phys. 2014, 14, 2125–2138. [Google Scholar] [CrossRef] [Green Version]
  22. Zheng, Y.; Che, H.; Xia, X.; Wang, Y.; Wang, H.; Wu, Y.; Tao, J.; Zhao, H.; An, L.; Li, L.; et al. Five-year observation of aerosol optical properties and its radiative effects to planetary boundary layer during air pollution episodes in North China: Intercomparison of a plain site and a mountainous site in Beijing. Sci. Total Environ. 2019, 674, 140–158. [Google Scholar] [CrossRef]
  23. Xia, X.; Wang, P.; Chen, H.; Gouloub, P.; Zhang, W. Ground-based remote sensing of aerosol optical properties over north China in spring. J. Remote Sens. 2005, 9, 429–437. [Google Scholar] [CrossRef] [Green Version]
  24. Xin, J.; Wang, Y.; Li, Z.; Wang, P.; Hao, W.M.; Nordgren, B.L.; Wang, S.; Liu, G.; Wang, L.; Wen, T.; et al. Aerosol optical depth (AOD) and Ångström exponent of aerosols observed by the Chinese Sun Hazemeter Network from August 2004 to September 2005. J. Geophys. Res. Atmos. 2007, 112, D05203. [Google Scholar] [CrossRef]
  25. Zhong, J.; Zhang, X.; Wang, Y.; Liu, C.; Dong, Y. Heavy aerosol pollution episodes in winter Beijing enhanced by radiative cooling effects of aerosols. Atmos. Res. 2018, 209, 59–64. [Google Scholar] [CrossRef]
  26. Xie, C.; Nishizawa, T.; Sugimoto, N.; Matsui, I.; Wang, Z. Characteristics of aerosol optical properties in pollution and Asian dust episodes over Beijing, China. Appl. Optics 2008, 47, 4945–4951. [Google Scholar] [CrossRef]
  27. Sun, J.; Zhang, Q.; Canagaratna, M.R.; Zhang, Y.; Ng, N.L.; Sun, Y.; Jayne, J.T.; Zhang, X.; Zhang, X.; Worsnop, D.R. Highly time-and size-resolved characterization of submicron aerosol particles in Beijing using an Aerodyne Aerosol Mass Spectrometer. Atmos. Environ. 2010, 44, 131–140. [Google Scholar] [CrossRef]
  28. Gui, K.; Che, H.; Zheng, Y.; Zhao, H.; Yao, W.; Li, L.; Zhang, L.; Wang, H.; Wang, Y.; Zhang, X. Three-dimensional climatology, trends, and meteorological drivers of global and regional tropospheric type-dependent aerosols: Insights from 13 years (2007–2019) of CALIOP observations. Atmos. Chem. Phys. 2021, 21, 15309–15336. [Google Scholar] [CrossRef]
  29. Wang, Z.; Liu, C.; Dong, Y.; Hu, Q.; Liu, T.; Zhu, Y.; Xing, C. Profiling of Dust and Urban Haze Mass Concentrations during the 2019 National Day Parade in Beijing by Polarization Raman Lidar. Remote Sens. 2021, 13, 3326. [Google Scholar] [CrossRef]
  30. Zhang, X.; Zhong, J.; Wang, J.; Wang, Y.; Liu, Y. The interdecadal worsening of weather conditions affecting aerosol pollution in the Beijing area in relation to climate warming. Atmos. Chem. Phys. 2018, 18, 5991–5999. [Google Scholar] [CrossRef] [Green Version]
  31. Liou, K.-N.; Sasamori, T. On the Transfer of Solar Radiation in Aerosol Atmospheres. J. Atmos. Sci. 1975, 32, 2166–2177. [Google Scholar] [CrossRef] [Green Version]
  32. Liou, K.-N. An Introduction to Atmospheric Radiation; Elsevier: Amsterdam, The Netherlands, 2002; ISBN 0124514510. [Google Scholar]
  33. Wu, J.; Jiang, W.; Fu, Z.; Su, B.; Liu, H.; Tang, J. Simulation of the Radiative Effect of Black Carbon Aerosols and the Regional Climate Responses over China. Adv. Atmos. Sci. 2004, 21, 637–649. [Google Scholar] [CrossRef]
  34. Zhang, H.; Zhou, C.; Wang, Z.; Zhao, S.; Li, J. The influence of different black carbon and sulfate mixing methods on their optical and radiative properties. J. Quant. Spectrosc. Radiat. Transf. 2015, 161, 105–116. [Google Scholar] [CrossRef]
  35. Bond, T.C.; Doherty, S.J.; Fahey, D.W.; Forster, P.M.; Berntsen, T.; DeAngelo, B.J.; Flanner, M.G.; Ghan, S.; Kärcher, B.; Koch, D.; et al. Bounding the role of black carbon in the climate system: A scientific assessment. J. Geophys. Res. Atmos. 2013, 118, 5380–5552. [Google Scholar] [CrossRef]
  36. Wang, T.; Han, Y.; Huang, J.; Sun, M.; Jian, B.; Huang, Z.; Yan, H. Climatology of Dust-Forced Radiative Heating over the Tibetan Plateau and Its Surroundings. J. Geophys. Res. Atmos. 2020, 125, 7721641. [Google Scholar] [CrossRef]
  37. Wang, Y.; Feng, J.; Zheng, Z.; Jin, S. Sensitivity of the Weather Research and Forecasting Model to Radiation Schemes in China. J. Trop. Meteorol. 2019, 25, 201–210. [Google Scholar] [CrossRef]
  38. Mielikainen, J.; Huang, B.; Huang, H.-L.A.; Goldberg, M.D. GPU acceleration of the updated Goddard shortwave radiation scheme in the weather research and forecasting (WRF) model. J. Sel. Top. App. Remote. Sens. 2012, 5, 555–562. [Google Scholar] [CrossRef]
  39. Zhong, X.; Ruiz-Arias, J.A.; Kleissl, J. Dissecting surface clear sky irradiance bias in numerical weather prediction: Application and corrections to the New Goddard Shortwave Scheme. Sol. Energy 2016, 132, 103–113. [Google Scholar] [CrossRef]
  40. Ruiz-Arias, J.A.; Dudhia, J.; Santos-Alamillos, F.J.; Pozo-Vázquez, D. Surface clear-sky shortwave radiative closure intercomparisons in the Weather Research and Forecasting model. J. Geophys. Res. Atmos. 2013, 118, 9901–9913. [Google Scholar] [CrossRef]
  41. Penner, J.E.; Zhang, S.Y.; Chin, M.; Chuang, C.C.; Feichter, J.; Feng, Y.; Geogdzhayev, I.V.; Ginoux, P.; Herzog, M.; Higurashi, A.; et al. A comparison of model- and satellite-derived aerosol optical depth and reflectivity. J. Atmos. Sci. 2002, 59, 441–460. [Google Scholar] [CrossRef] [Green Version]
  42. Che, H.; Yang, L.; Liu, C.; Xia, X.; Wang, Y.; Wang, H.; Wang, H.; Lu, X.; Zhang, X. Long-term validation of MODIS C6 and C6. 1 Dark Target aerosol products over China using CARSNET and AERONET. Chemosphere 2019, 236, 124268. [Google Scholar] [CrossRef]
  43. Han, X.; Zou, X.; Song, Z.; Fu, D.; Xia, X.; Che, H. Comparison of AVHRR aerosol optical depth production against CARSNET data in China. Atmos. Res. 2019, 218, 12–24. [Google Scholar] [CrossRef]
  44. Eck, T.; Dubovik, O.; Smirnov, A.; Slutsker, I.; Lobert, J. Column-integrated aerosol optical properties over the Maldives during the northeast monsoon for 1998–2000. J. Geophys. Res. Atmos. 2001, 106, 28555–28566. [Google Scholar] [CrossRef]
  45. Zhang, J.; Christopher, S.A.; Holben, B.N. Intercomparison of smoke aerosol optical thickness derived from GOES 8 imager and ground-based Sun photometers. J. Geophys. Res. Atmos. 2001, 106, 7387–7397. [Google Scholar] [CrossRef] [Green Version]
  46. Sheng, Z.; Che, H.; Chen, Q.; Liu, D.; Wang, Z.; Zhao, H.; Gui, K.; Zheng, Y.; Sun, T.; Li, X. Aerosol vertical distribution and optical properties of different pollution events in Beijing in autumn 2017. Atmos. Res. 2019, 215, 193–207. [Google Scholar] [CrossRef]
  47. Cao, N.; Yang, F.; Shi, J.; Wang, F.; Tian, L.; Bu, L. Low altitude fog-haze measurements by Raman-Rayleigh-Mie lidar in Nanjing. J. App. Opt. 2012, 33, 979–984. [Google Scholar] [CrossRef]
  48. Liu, Q.; He, Q.; Fang, S.; Ying, G.; Ma, C.; Chen, Y.; Kang, Y.; Hu, P.; Zhang, H.; Yao, Y. Vertical distribution of ambient aerosol extinctive properties during haze and haze-free periods based on the Micro-Pulse Lidar observation in Shanghai. Sci. Total Environ. 2016, 574, 1502–1511. [Google Scholar] [CrossRef] [PubMed]
  49. Zhang, T.; Che, H.; Gong, Z.; Wang, Y.; Wang, J.; Yang, Y.; Gui, K.; Guo, B. The two-way feedback effect between aerosol pollution and planetary boundary layer structure on the explosive rise of PM2.5 after the "Ten Statements of Atmosphere" in Beijing. Sci. Total Environ. 2019, 709, 136259. [Google Scholar] [CrossRef] [PubMed]
  50. Zhang, T.; Che, H.; Gong, Z.; Wang, Y.; Yang, Y. The dominant mechanism of the explosive rise of PM2.5 after significant pollution emissions reduction in Beijing from 2017 to the COVID-19 pandemic in 2020. Atmos. Pollut. Res. 2020, 12, 272–281. [Google Scholar] [CrossRef]
  51. Dee, D.; Uppala, S.; Simmons, A.; Berrisford, P.; Poli, P.; Kobayashi, S.; Andrae, U.; Balmaseda, M.; Balsamo, G.; Bauer, P.; et al. The ERA-Interim reanalysis: Configuration and performance of the data assimilation system. Q. J. R. Meteorol. Soc. 2011, 137, 553–597. [Google Scholar] [CrossRef]
  52. Zhong, J.; Zhang, X.; Wang, Y.; Sun, J.; Zhang, Y.; Wang, J.; Tan, K.; Shen, X.; Che, H.; Zhang, L.; et al. Relative contributions of boundary-layer meteorological factors to the explosive growth of PM2.5 during the red-alert heavy pollution episodes in Beijing in December 2016. J. Meteorol. Res. 2017, 31, 809–819. [Google Scholar] [CrossRef]
  53. Chou, M.; Suarez, M.J. A Solar Radiation Parameterization (CLIRAD–SW) for Atmospheric Studies; Technical Report NASA/TM 104606; NASA Goddard Space Flight Center: Greenbelt, MD, USA, 1999; Volume 15.
  54. Wang, H.; Zhang, X.; Gong, S.; Chen, Y.; Shi, G.; Li, W. Radiative feedback of dust aerosols on the East Asian dust storms. J. Geophys. Res. Atmos. 2010, 115, D23214. [Google Scholar] [CrossRef]
  55. Wang, Y.; Zhang, X.; Arimoto, R. The contribution from distant dust sources to the atmospheric particulate matter loadings at XiAn, China during spring. Sci. Total Environ. 2006, 368, 875–883. [Google Scholar] [CrossRef] [PubMed]
  56. Liang, Y.; Che, H.; Wang, H. Aerosol Optical Properties and Radiative Effects During a Pollution Episode in Beijing. J. Appl. Meteorol. Sci. 2020, 31, 583–594. [Google Scholar] [CrossRef]
  57. Zheng, Z.; Zhao, C.; Lolli, S.; Wang, X.; Wang, Y.; Ma, X.; Li, Q.; Yang, Y. Diurnal variation of summer precipitation modulated by air pollution: Observational evidences in the Beijing metropolitan area. Environ. Res. Lett. 2020, 15, 094053. [Google Scholar] [CrossRef]
  58. Wang, K.; Yin, H.; Chen, Y. The effect of environmental regulation on air quality: A study of new ambient air quality standards in China. J. Clean. Product. 2019, 215, 268–279. [Google Scholar] [CrossRef]
  59. Tian, S.; Pan, Y.; Wang, Y. Size-resolved source apportionment of particulate matter in urban Beijing during haze and non-haze episodes. Atmos. Chem. Phys. 2016, 16, 1–19. [Google Scholar] [CrossRef] [Green Version]
  60. Liu, S.; Xing, J.; Sahu, S.; Liu, X.; Liu, S.; Jiang, Y.; Zhang, H.; Li, S.; Ding, D.; Chang, X. Wind-blown dust and its impacts on particulate matter pollution in Northern China: Current and future scenarios. Environ. Res. Lett. 2021, 16, 114041. [Google Scholar] [CrossRef]
  61. Zhang, X.; Wang, J.; Wang, Y.; Liu, H.; Sun, J.; Zhang, Y. Changes in chemical components of aerosol particles in different haze regions in China from 2006 to 2013 and contribution of meteorological factors. Atmos. Chem. Phys. 2015, 15, 12935–12952. [Google Scholar] [CrossRef] [Green Version]
  62. Pan, X.; Yan, P.; Tang, J.; Ma, J.; Wang, Z.; Gbaguidi, A.; Sun, Y. Observational study of influence of aerosol hygroscopic growth on scattering coefficient over rural area near Beijing mega-city. Atmos. Chem. Phys. 2009, 9, 7519–7530. [Google Scholar] [CrossRef] [Green Version]
  63. Che, H.; Xia, X.; Zhu, J.; Wang, H.; Wang, Y.; Sun, J.; Zhang, X.; Shi, G. Aerosol optical properties under the condition of heavy haze over an urban site of Beijing, China. Environ. Sci. Pollut. Res. 2015, 22, 1043–1053. [Google Scholar] [CrossRef]
  64. Zhang, G.; Ma, Y. Clear-Sky Surface Solar Radiation and the Radiative Effect of Aerosol and Water Vapor Based on Simulations and Satellite Observations over Northern China. Remote Sens. Environ. 2020, 12, 1931. [Google Scholar] [CrossRef]
  65. Dubovik, O.; Holben, B.N.; Eck, T.F.; Smirnov, A.; Slutsker, I. Variability of Absorption and Optical Properties of Key Aerosol Types Observed in Worldwide Locations. J. Atmos. Sci. 2002, 59, 590–608. [Google Scholar] [CrossRef]
  66. Sun, T.; Che, H.; Qi, B.; Wang, Y.; Dong, Y.; Xia, X.; Wang, H.; Gui, K.; Zheng, Y.; Zhao, H. Aerosol optical characteristics and their vertical distributions under enhanced haze pollution events: Effect of the regional transport of different aerosol types over eastern China. Atmos. Chem. Phys. 2018, 18, 2949–2971. [Google Scholar] [CrossRef] [Green Version]
  67. Huang, J.; Wang, T.; Wang, W.; Li, Z.; Yan, H. Climate effects of dust aerosols over East Asian arid and semiarid regions. J. Geophys. Res. Atmos. 2014, 119, 398–416. [Google Scholar] [CrossRef]
  68. Liou, K.N.; Freeman, K.P.; Sasamori, T. Cloud and aerosol effects on the solar heating rate of the atmosphere. Tellus B 1978, 30, 62–70. [Google Scholar] [CrossRef] [Green Version]
  69. Haywood, J.; Francis, P.; Osborne, S.; Glew, M.; Loeb, N.; Highwood, E.; Tanré, D.; Myhre, G.; Formenti, P.; Hirst, E. Radiative properties and direct radiative effect of Saharan dust measured by the C-130 aircraft during SHADE: 1. Solar spectrum. J. Geophys. Res. Atmos. 2003, 108, 8. [Google Scholar] [CrossRef] [Green Version]
Figure 1. Diurnal distributions of PM2.5 and PM10 concentration during heavy pollution episodes (HPE1, 2, 3, and 4) in Beijing in 2018.
Remotesensing 14 00266 g001
Figure 2. Mean 72 h backward trajectories of trajectory clusters in Beijing during heavy pollution episodes (HPE1, 2, 3, and 4) in 2018.
Remotesensing 14 00266 g002
Figure 3. (a) Spatiotemporal distribution of temperature (shading; unit: K); (b) RH (shading; unit: %) and (c) wind vector and velocity (shading; unit: m s−1) during heavy pollution episodes (HPE1, 2, 3, and 4) in Beijing in 2018.
Remotesensing 14 00266 g003
Figure 4. Daily variation in (a) AOD; (b) AAOD; (c) SSA; and (d) ASY at 440, 670, 870, and 1020 nm, as well as (a) AE and (b) AAE for the whole column, during four heavy pollution episodes (HPE1, 2, 3, and 4) in Beijing in 2018.
Remotesensing 14 00266 g004
Figure 5. Daily variation in aerosol volume–size distributions for the whole column during heavy pollution episodes (HPE1, 2, 3, and 4) in Beijing in 2018.
Remotesensing 14 00266 g005
Figure 6. Spatiotemporal distribution of aerosol EC (a) and DR (b) retrievals from the Lidar for four heavy pollution episodes (HPE1, 2, 3, and 4) in Beijing in 2018.
Remotesensing 14 00266 g006
Figure 7. Time series of aerosol EC profiles retrieved by Lidar during four heavy pollution episodes (HPE1, 2, 3, and 4) in Beijing in 2018.
Remotesensing 14 00266 g007
Figure 8. Vertical profiles of HR due to aerosol, calculated from ground-based observations during heavy pollution episodes (HPE1, 2, 3, and 4) in Beijing in 2018.
Remotesensing 14 00266 g008
Figure 9. Diagram of the aerosol direct radiation during different HPEs proposed in this study.
Remotesensing 14 00266 g009
Table 1. Wavelength distribution in the radiative transfer model.
Solar Wavelength (μm)Application Wavelength (μm)
1(0.175–0.225]0.225
2(0.225–0.245]0.245
3(0.245–0.260]0.260
4(0.280–0.295]0.295
5(0.295–0.310]0.310
6(0.310–0.320]0.320
7(0.320–0.400]0.400
8(0.400–0.700]0.532
9(0.700–1.220]1.220
10(1.220–2.270]2.270
11(2.270–10.000]5.000
Table 2. Statistical summary of PM concentration in four polluted events (HPE1, 2, 3, and 4).
Case
(Type)
DateMean
PM2.5
(μg m−3)
Max
PM2.5
(μg m−3)
Mean
PM10
(μg m−3)
Max
PM10
(μg m−3)
Ratio
(PM2.5/
PM10)
General
Characteristics
HPE1
(Haze)
Mar-10122.08170134.521910.91Moderately polluted
Mar-1162.589777.871250.80Lightly polluted
Mar-12137.50213150.422530.91Moderately polluted
Mar-13255.38302///Heavily polluted
Mar-14226.82370///Heavily polluted
HPE2
(Dust)
Mar-26121.88173152.262030.80Moderately polluted
Mar-27193.08245225.062730.86Heavily polluted
Mar-28140.752021001.1022730.14Heavily polluted
Mar-2935.6743177.962910.20Lightly polluted
Mar-3035.637276.711160.46Clean
HPE3
(Haze)
Jun-2356.886992.861380.61Clean or Lightly polluted
Jun-2452.256994.291210.55Clean or Lightly polluted
Jun-2577.71149124.821540.62Lightly polluted
Jun-26129.17191///Moderately polluted
Jun-2726.656350.821130.53Clean
HPE4
(Mixed)
Nov-24103.04174128.861880.80Lightly polluted
Nov-25103.68171119.351850.87Lightly polluted
Nov-26224.52306///Heavily polluted
Nov-2764.08170277.968340.23Moderately polluted
Nov-2863.2986181.432310.35Lightly polluted
/: missing value.
Publisher’s Note: MDPI stays neutral with regard to jurisdictional claims in published maps and institutional affiliations.

