1. Introduction
With the continuous development of satellite technology, the resolution and imaging quality of remote sensing optical images have also been greatly improved [
1]. Compared with traditional synthetic aperture radar (SAR) imaging, it contains a great deal of color information, ship shape features, and texture structure features, which enables us to obtain more abundant sea surface information [
2]. The recognition and monitoring of ship targets on the sea based on optical remote sensing images have important application prospects in the management of maritime traffic, fishing, maritime search and rescue, border surveillance, and other civil and military aspects [
3].
At present, traditional methods based on segmentation and feature and depth learning methods based on convolutional neural networks are often used in ship target detection [
4].
Many traditional detection methods detect ship targets through handcrafted feature extraction, such as methods based on gray-level features [
5,
6], template-based matching methods [
7,
8], methods based on shape features [
9,
10], and so on. Most of the traditional algorithms have achieved success in fixed-scene applications. However, when ships are in a complex environment, they may encounter bottlenecks. Moreover, the establishment of handmade features relies too much on expert experience, which makes its generalization ability weak.
Compared with traditional feature extraction methods, a neural network has more deep and complex feature expression ability. After nonlinear transformation, the extracted feature semantic information is more abundant, and the robustness is stronger in the face of a complex sea and air environment [
11]. Xue et al. proposed a rotation dense feature pyramid network (R-DFPN) framework, aiming to effectively detect ships in different scenes, including ocean and port. Through comparative experiments, it was verified that R-DFPN has excellent performance in multiscale and high-density objects. However, there are still many false alarms and errors in model detection [
12]. Chen et al. proposed an improved YOLOv3 (ImYOLOv3) based on an attention mechanism. They designed a new light attention module (DAM) to extract the identification features of ship targets. This method can accurately detect ships of different scales in different backgrounds in real time. However, this method has difficulty accurately expressing a ship based on a horizontal detection frame [
13]. Zhang et al. first used a support vector machine (SVM) to divide an image into small regions of interest (ROIs) that may contain ships and then used an improved target detection framework, a fast region-based convolutional neural network (Faster RCNN), to detect ROIs. The model was able to detect both large ships and small ships, but it also had the problem of inaccurate positioning [
14].
The above ship detection algorithms have achieved good detection results, but there is still much room for improvement in dealing with complex scene interference, ship-scale differences, and other issues. Therefore, in order to improve the detection effect of ship targets in remote sensing images, this paper uses R3Det as the benchmark model and improves the above problems.
This paper makes the following contributions:
Atmospheric correction of remote sensing images is performed by the dark channel prior method, and ship targets are detected and recognized based on the R3Det model.
Aiming at the problem of large-scale differences in ship targets in remote sensing images and easy interference of complex backgrounds, an improved method based on NAS FPN and channel attention ECA is proposed.
Deformation convolution and dilated convolution to enrich the context information of small ship targets are introduced.
2. Materials and Methods
2.1. FAIR1M Dataset
FAIR1M is the world’s largest satellite optical remote sensing image target recognition data set released by the China Aerospace Research Institute [
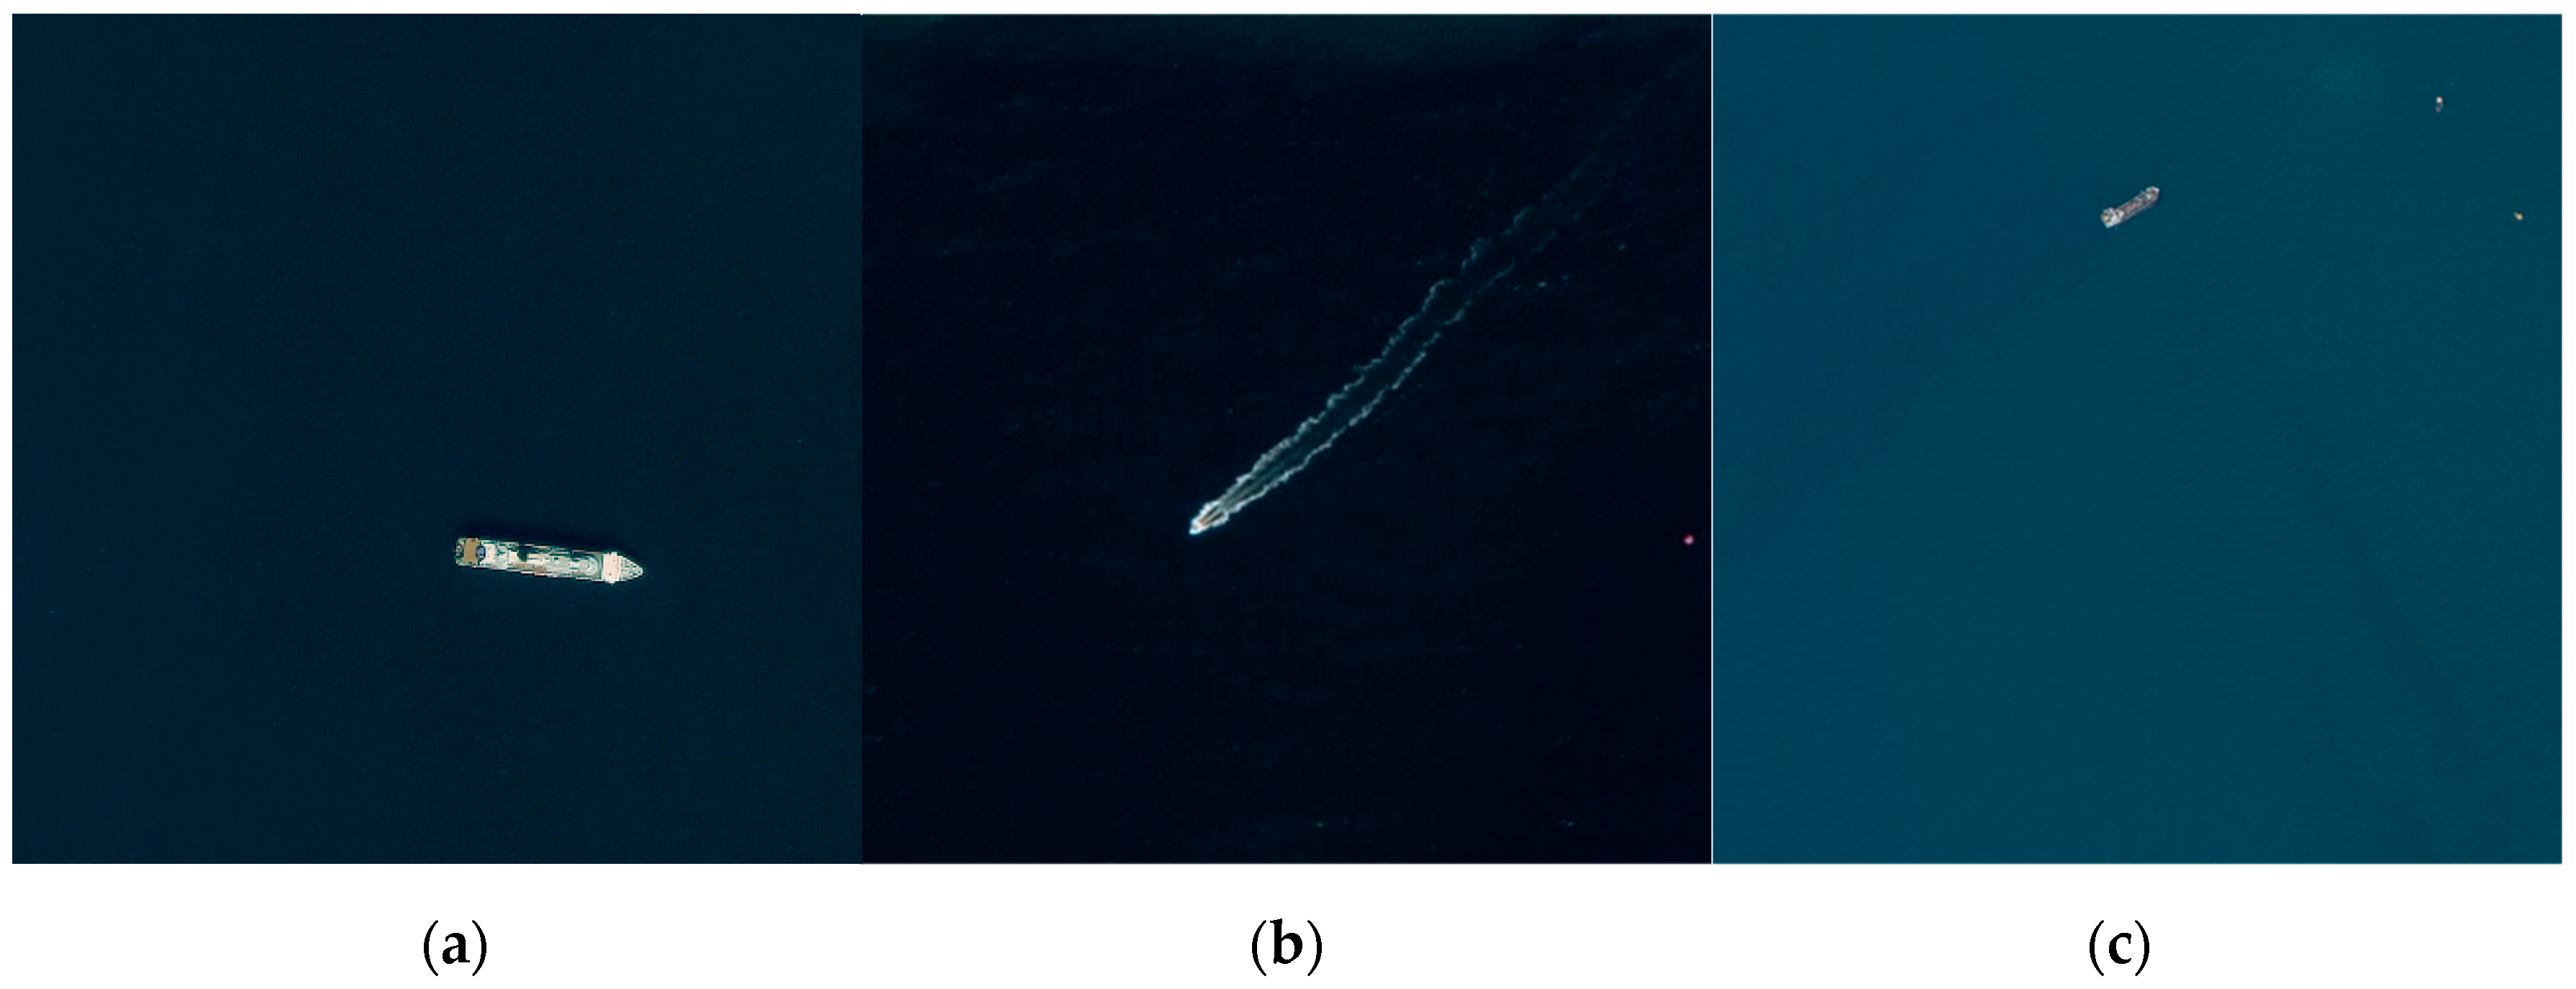
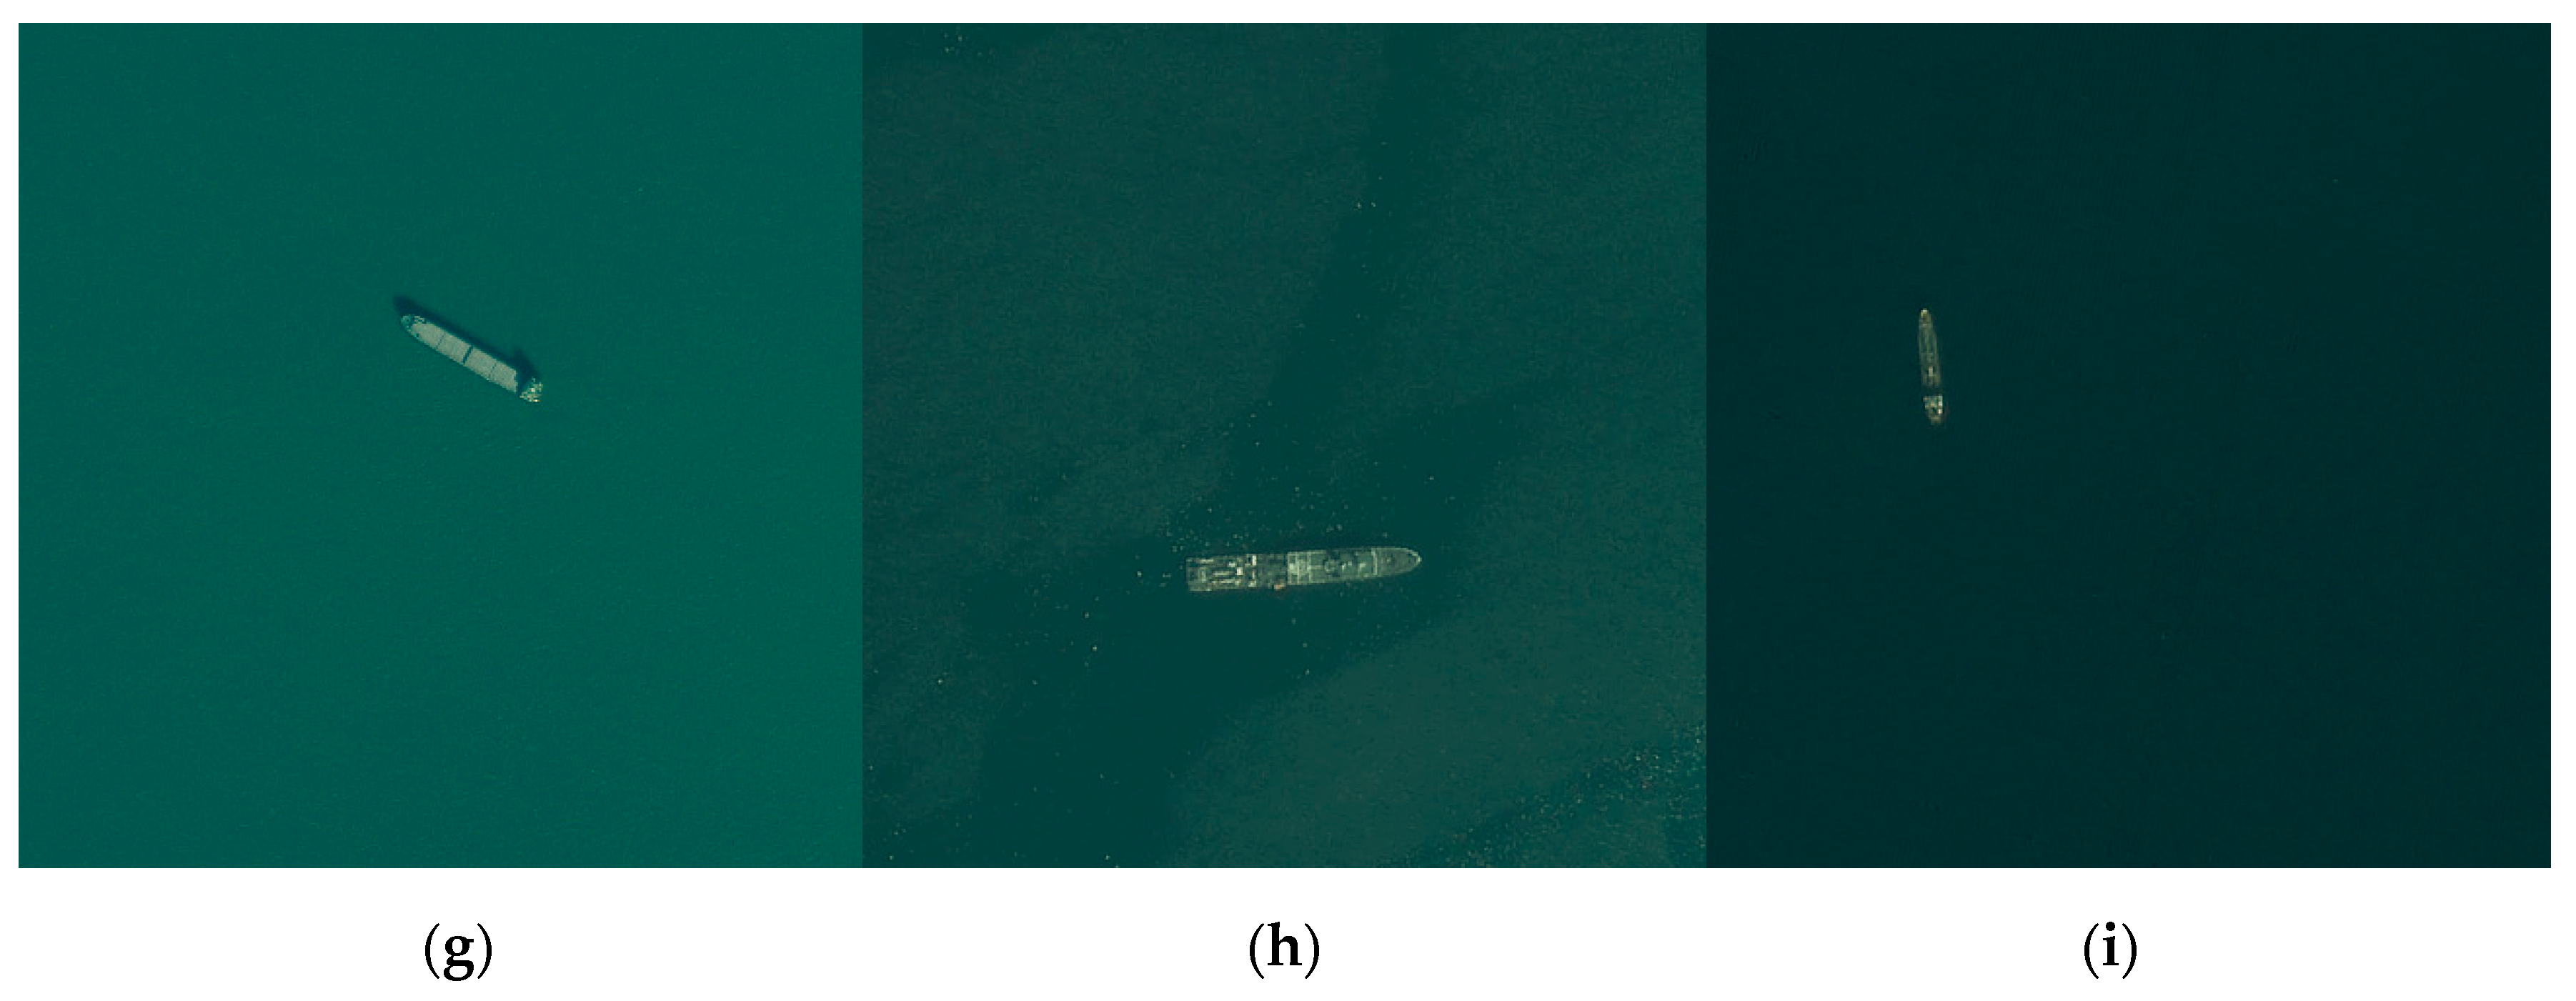
15]. Its content includes image target annotation of various surfaces. Based on the needs of the subject, this paper selects the ship data. As shown in
Figure 1 below, 9 types of ship targets are marked in the data set.
2.2. Atmospheric Correction
Satellite-based remote sensing images need long-distance atmospheric transmission, and the radiance received by a satellite is attenuated by atmospheric absorption. In addition, particles in the atmosphere are also reflected into the imaging light path, thus reducing the contrast of the remote sensing image, resulting in a layer of water mist in the image visually [
16]. In this paper, dark channel prior theory [
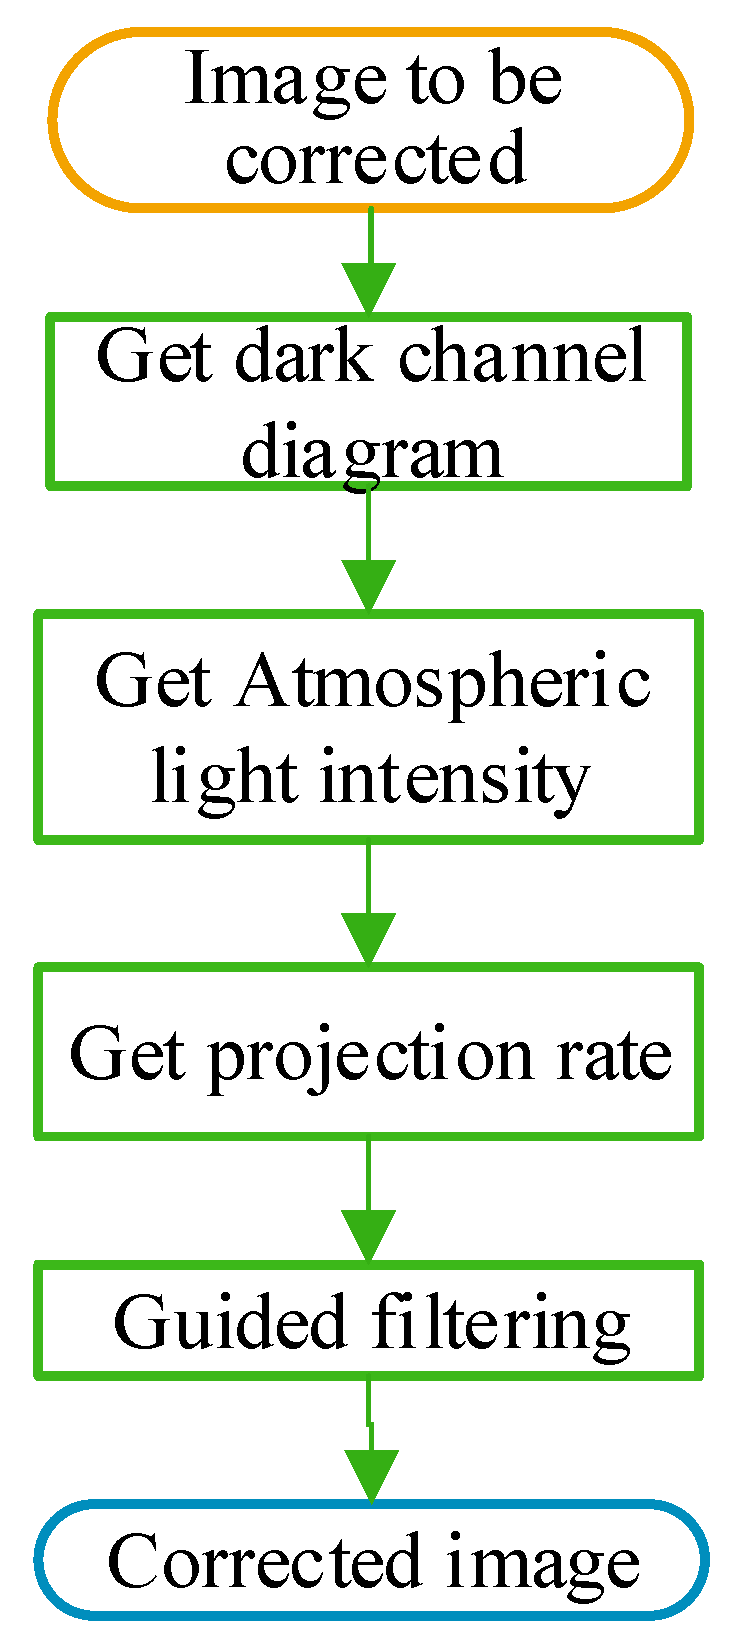
17] is used for atmospheric correction of remote sensing images. The algorithm flow of atmospheric correction is shown in
Figure 2.
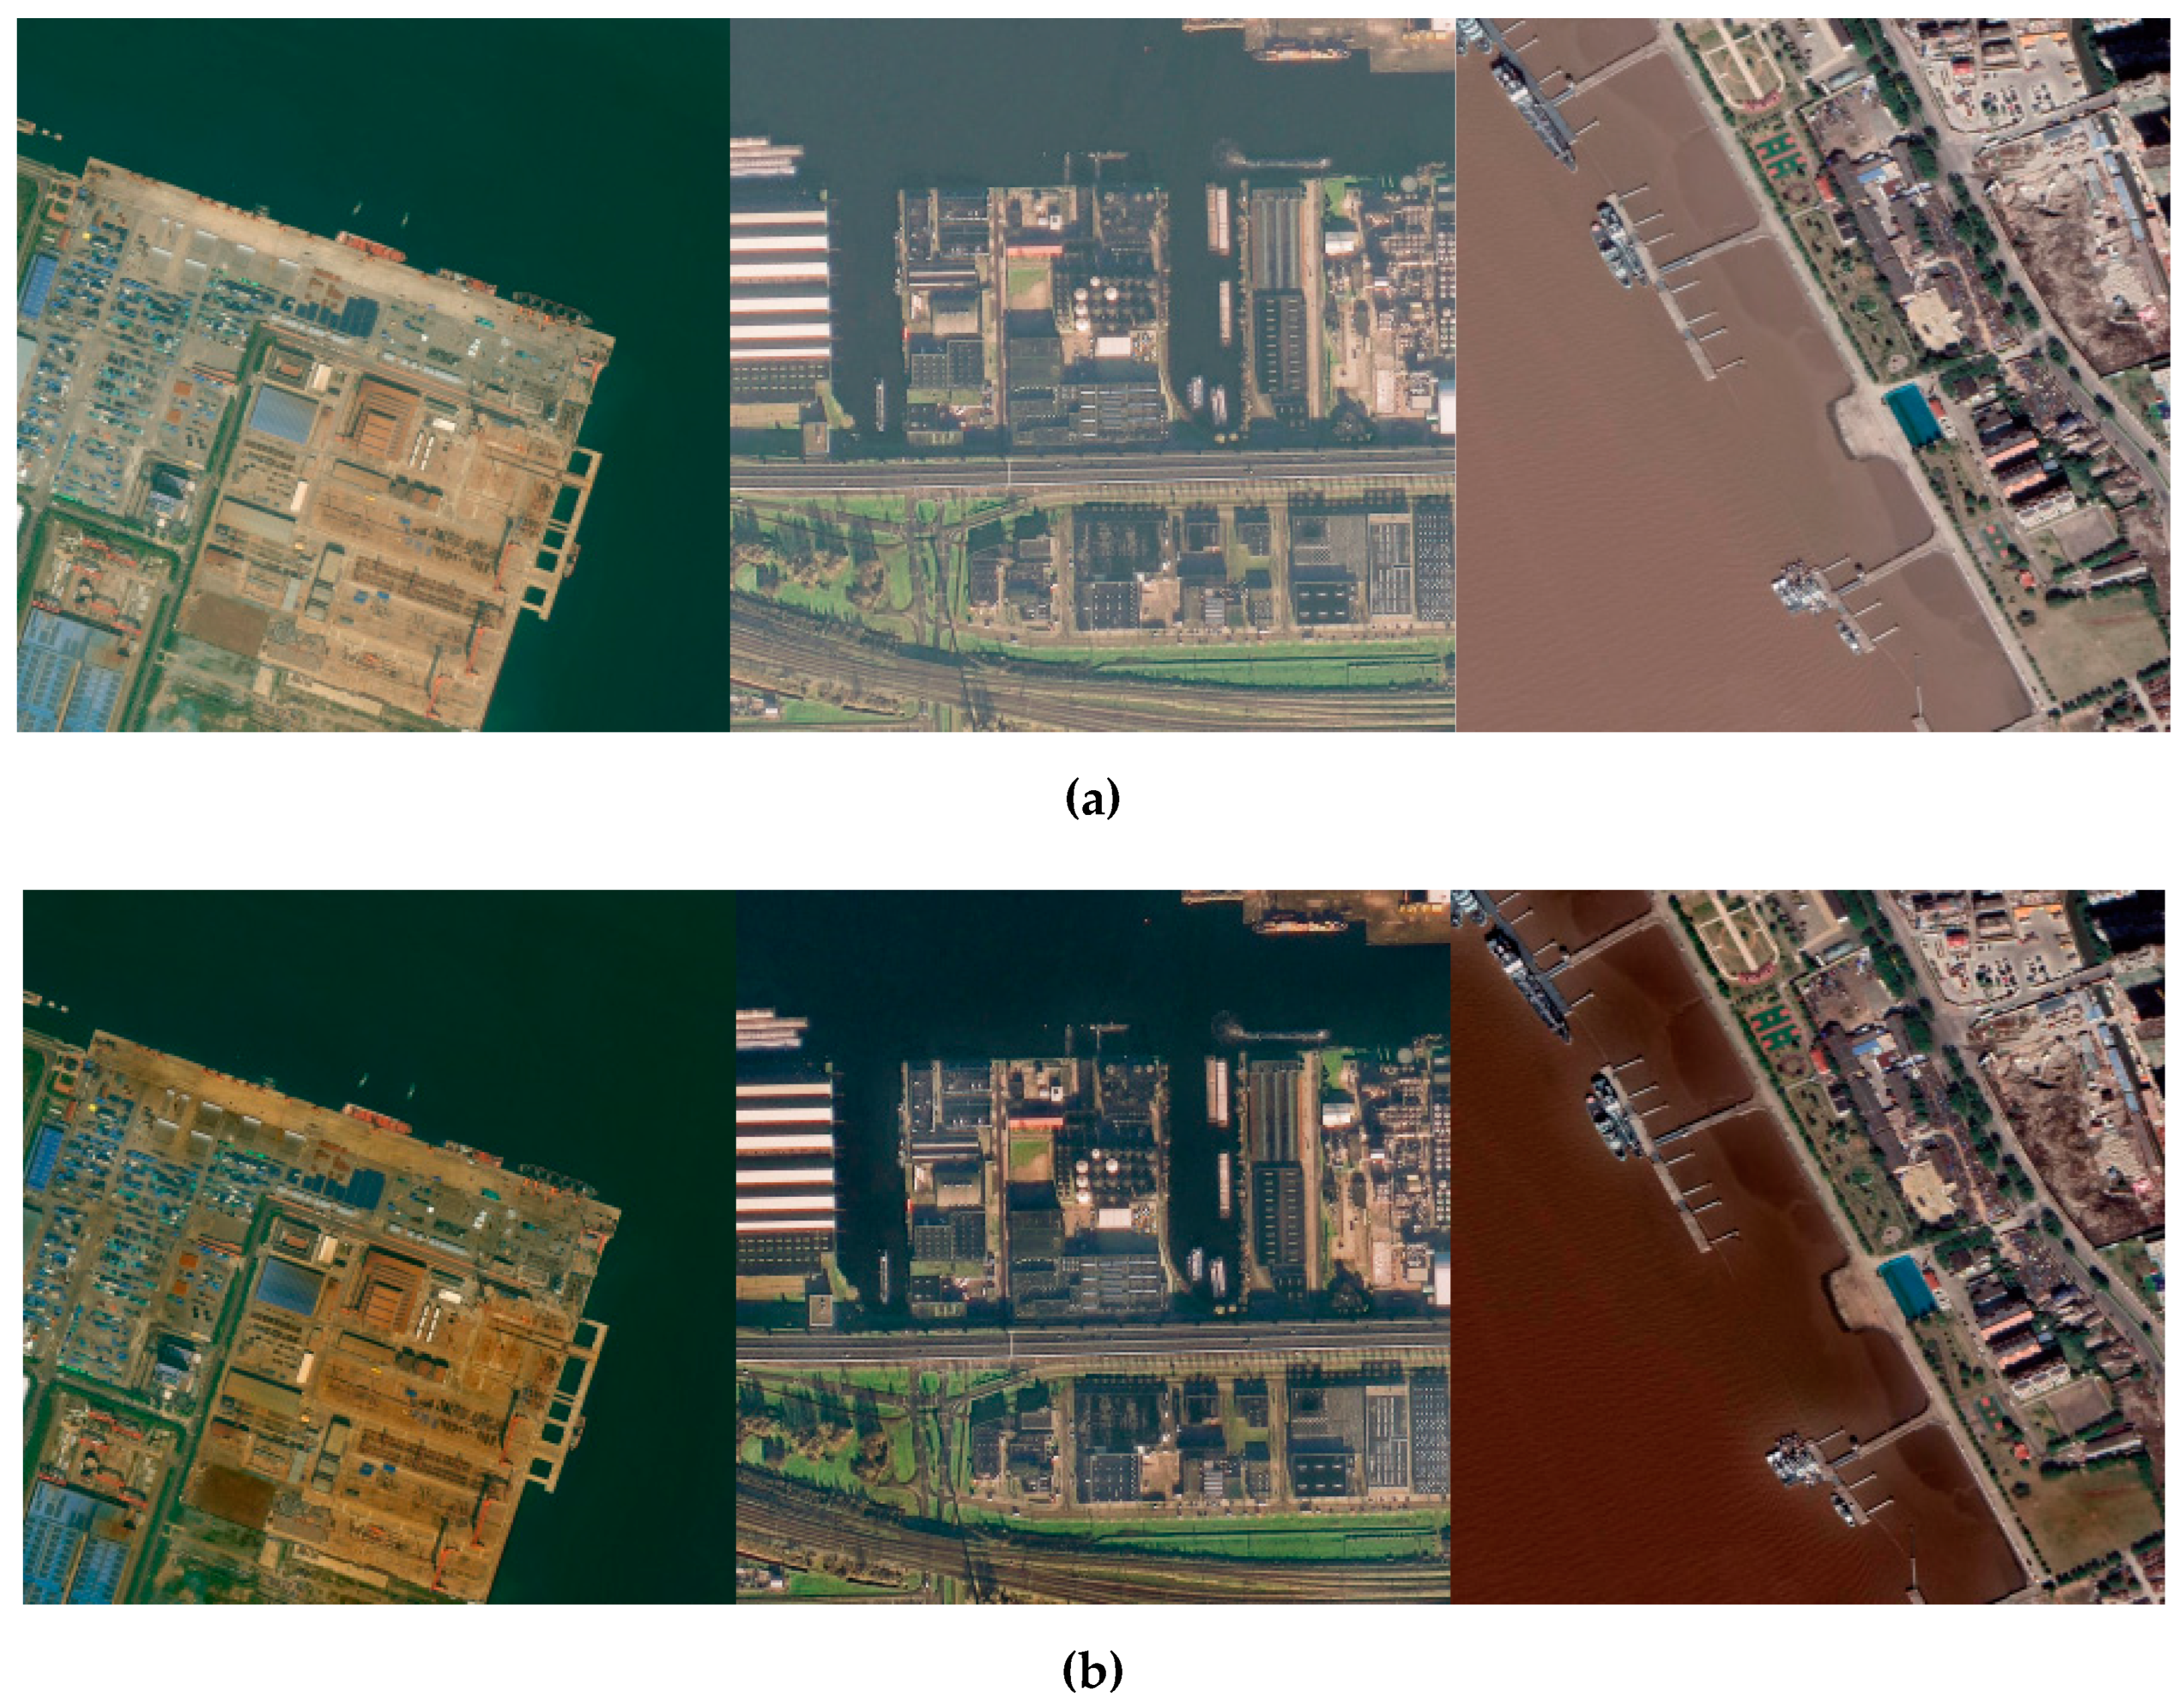
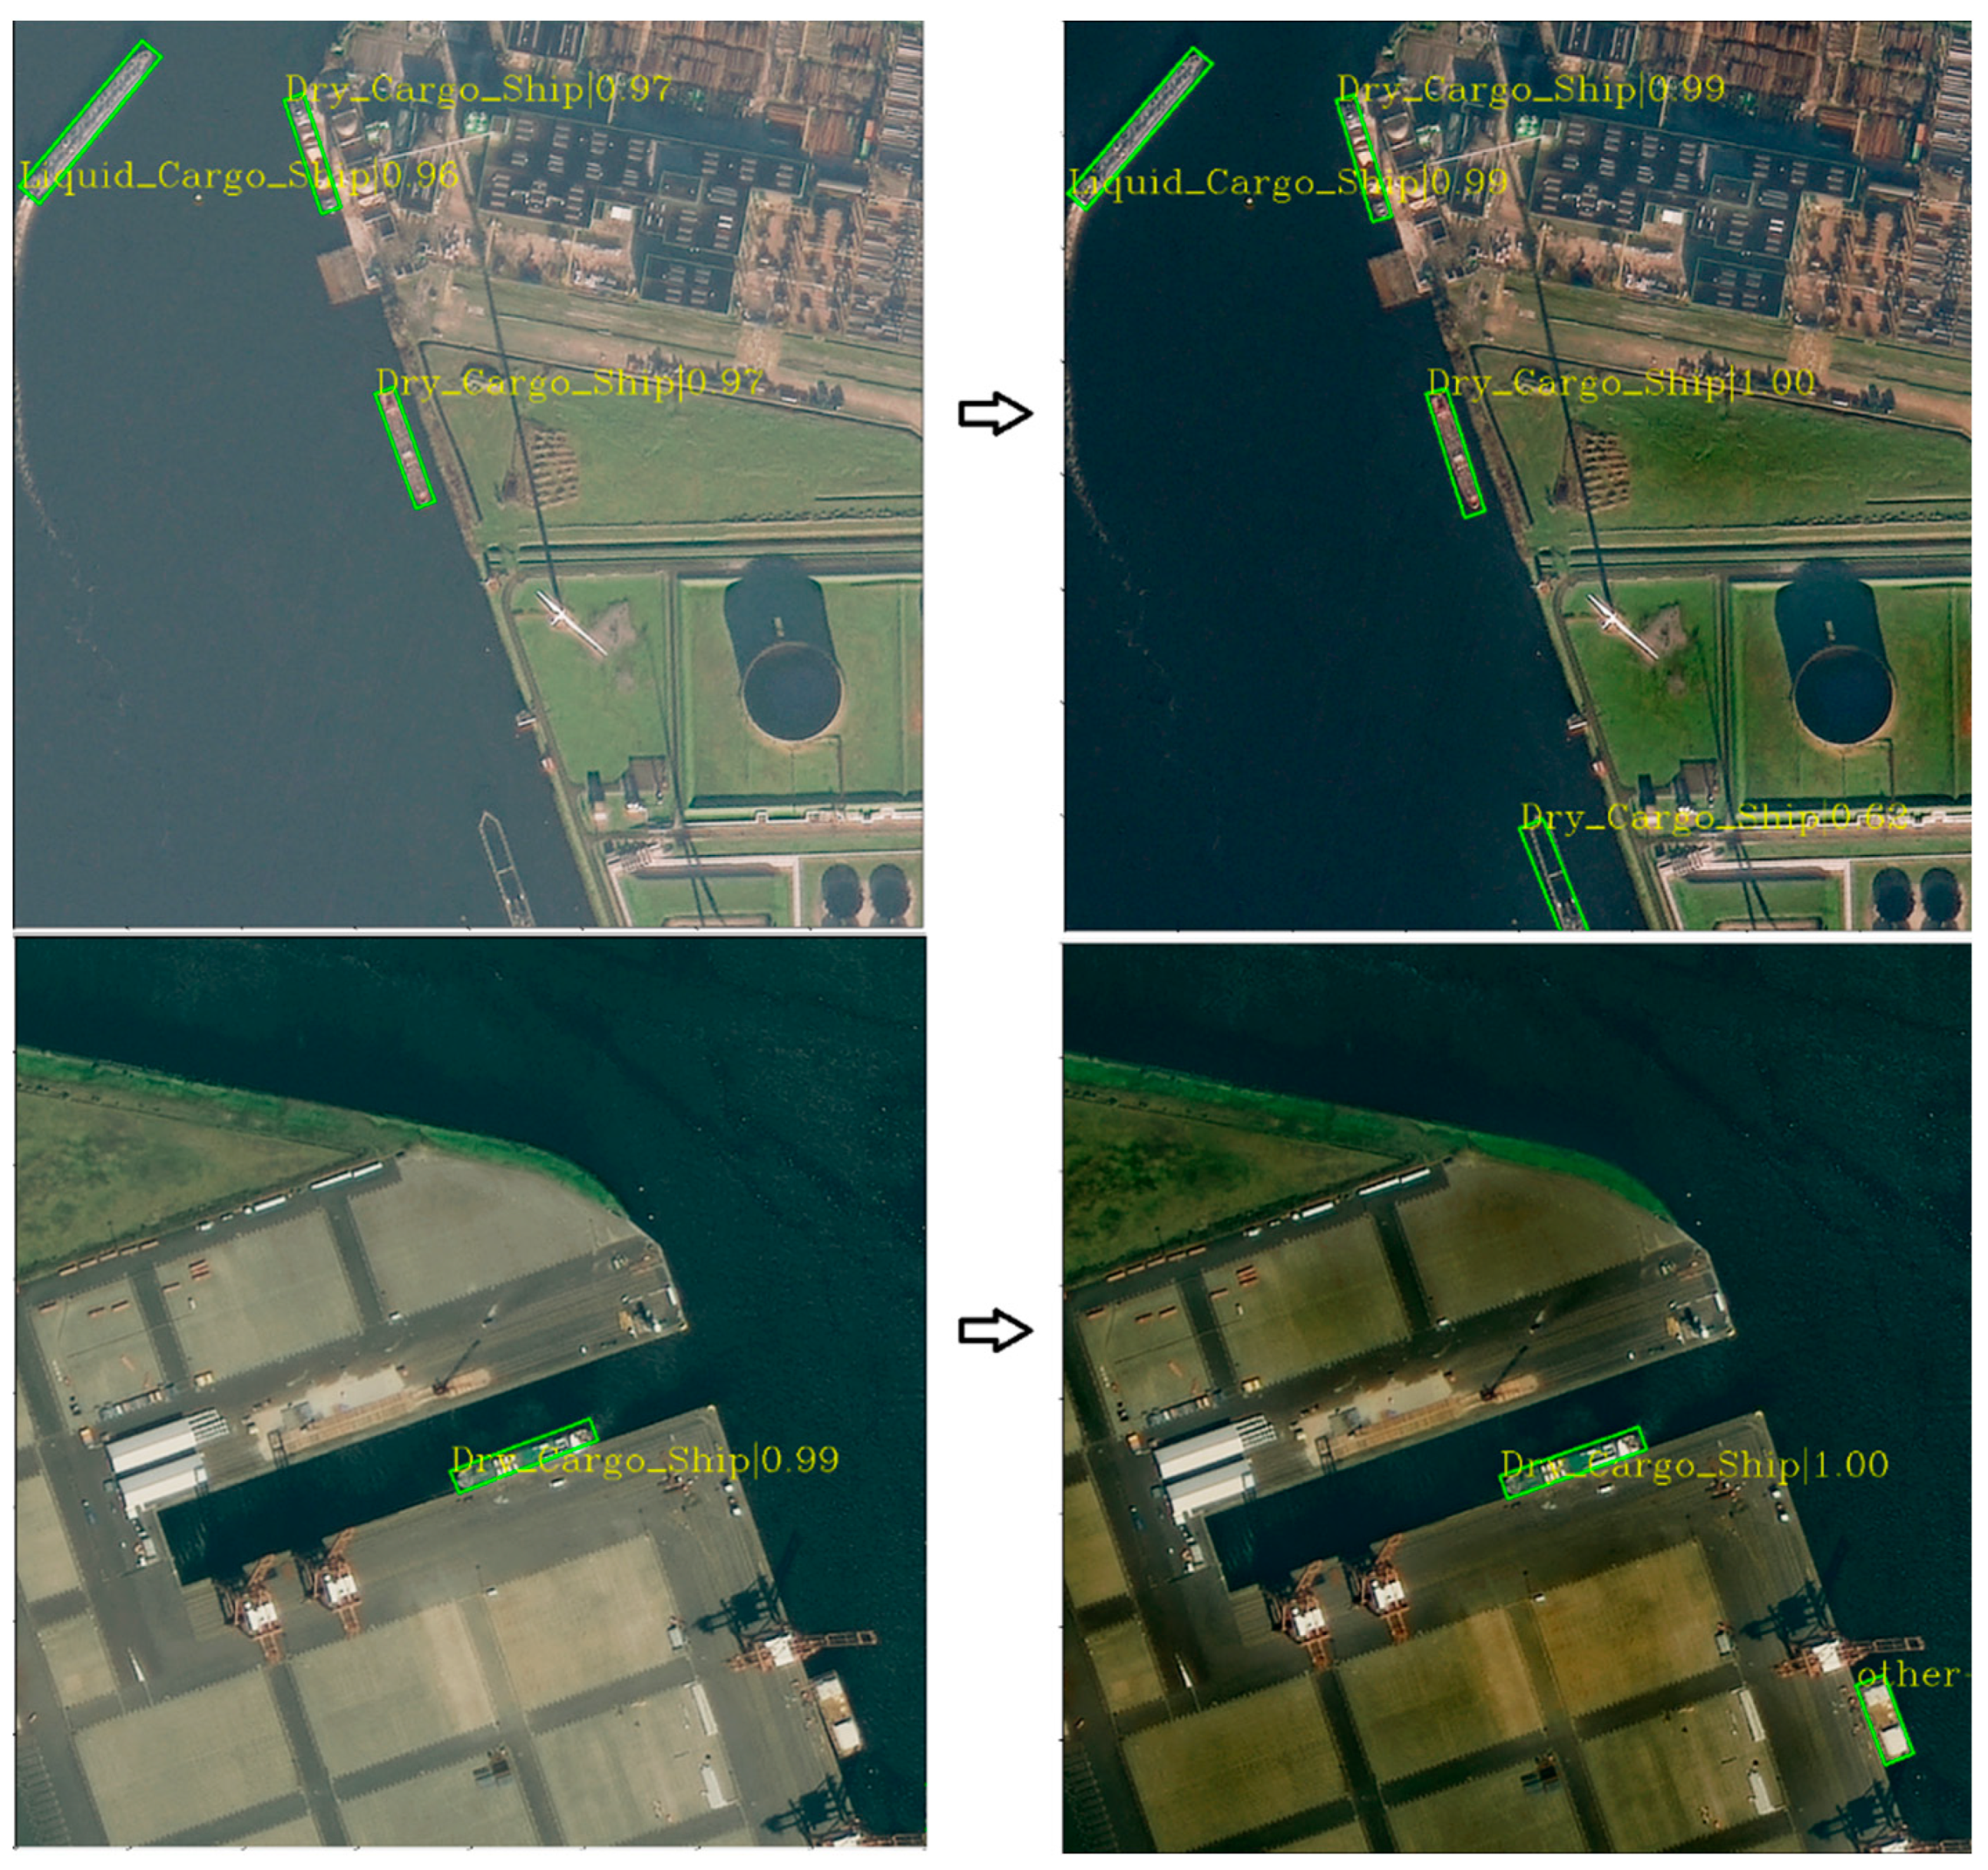
The images before and after atmospheric correction are shown in
Figure 3. It can be seen from the figure that the ship target and background in the corrected image are clearer, which is conducive to improving the detection accuracy of ships.
2.3. Training Set and Test Set
The size of the remote sensing images in the data set is different and generally large, but due to the limitation of computing hardware, current object detection networks generally allow input images of small size [
18]. Van Etten [
19] demonstrated that directly scaling remote sensing images to sizes allowed by a network would lose many image details. Therefore, this section cuts the training image to 800 × 800, overlaps 100 pixels, and generates 6622 training images and 1126 testing images in total.
Table 1 shows the number of various ship targets in the training set and the test set.
3. Methods
In this paper, a single-stage rotating target detector R
3Det [
20] is selected to detect ship targets in remote sensing images. R
3Det is an improvement based on the Retinanet algorithm [
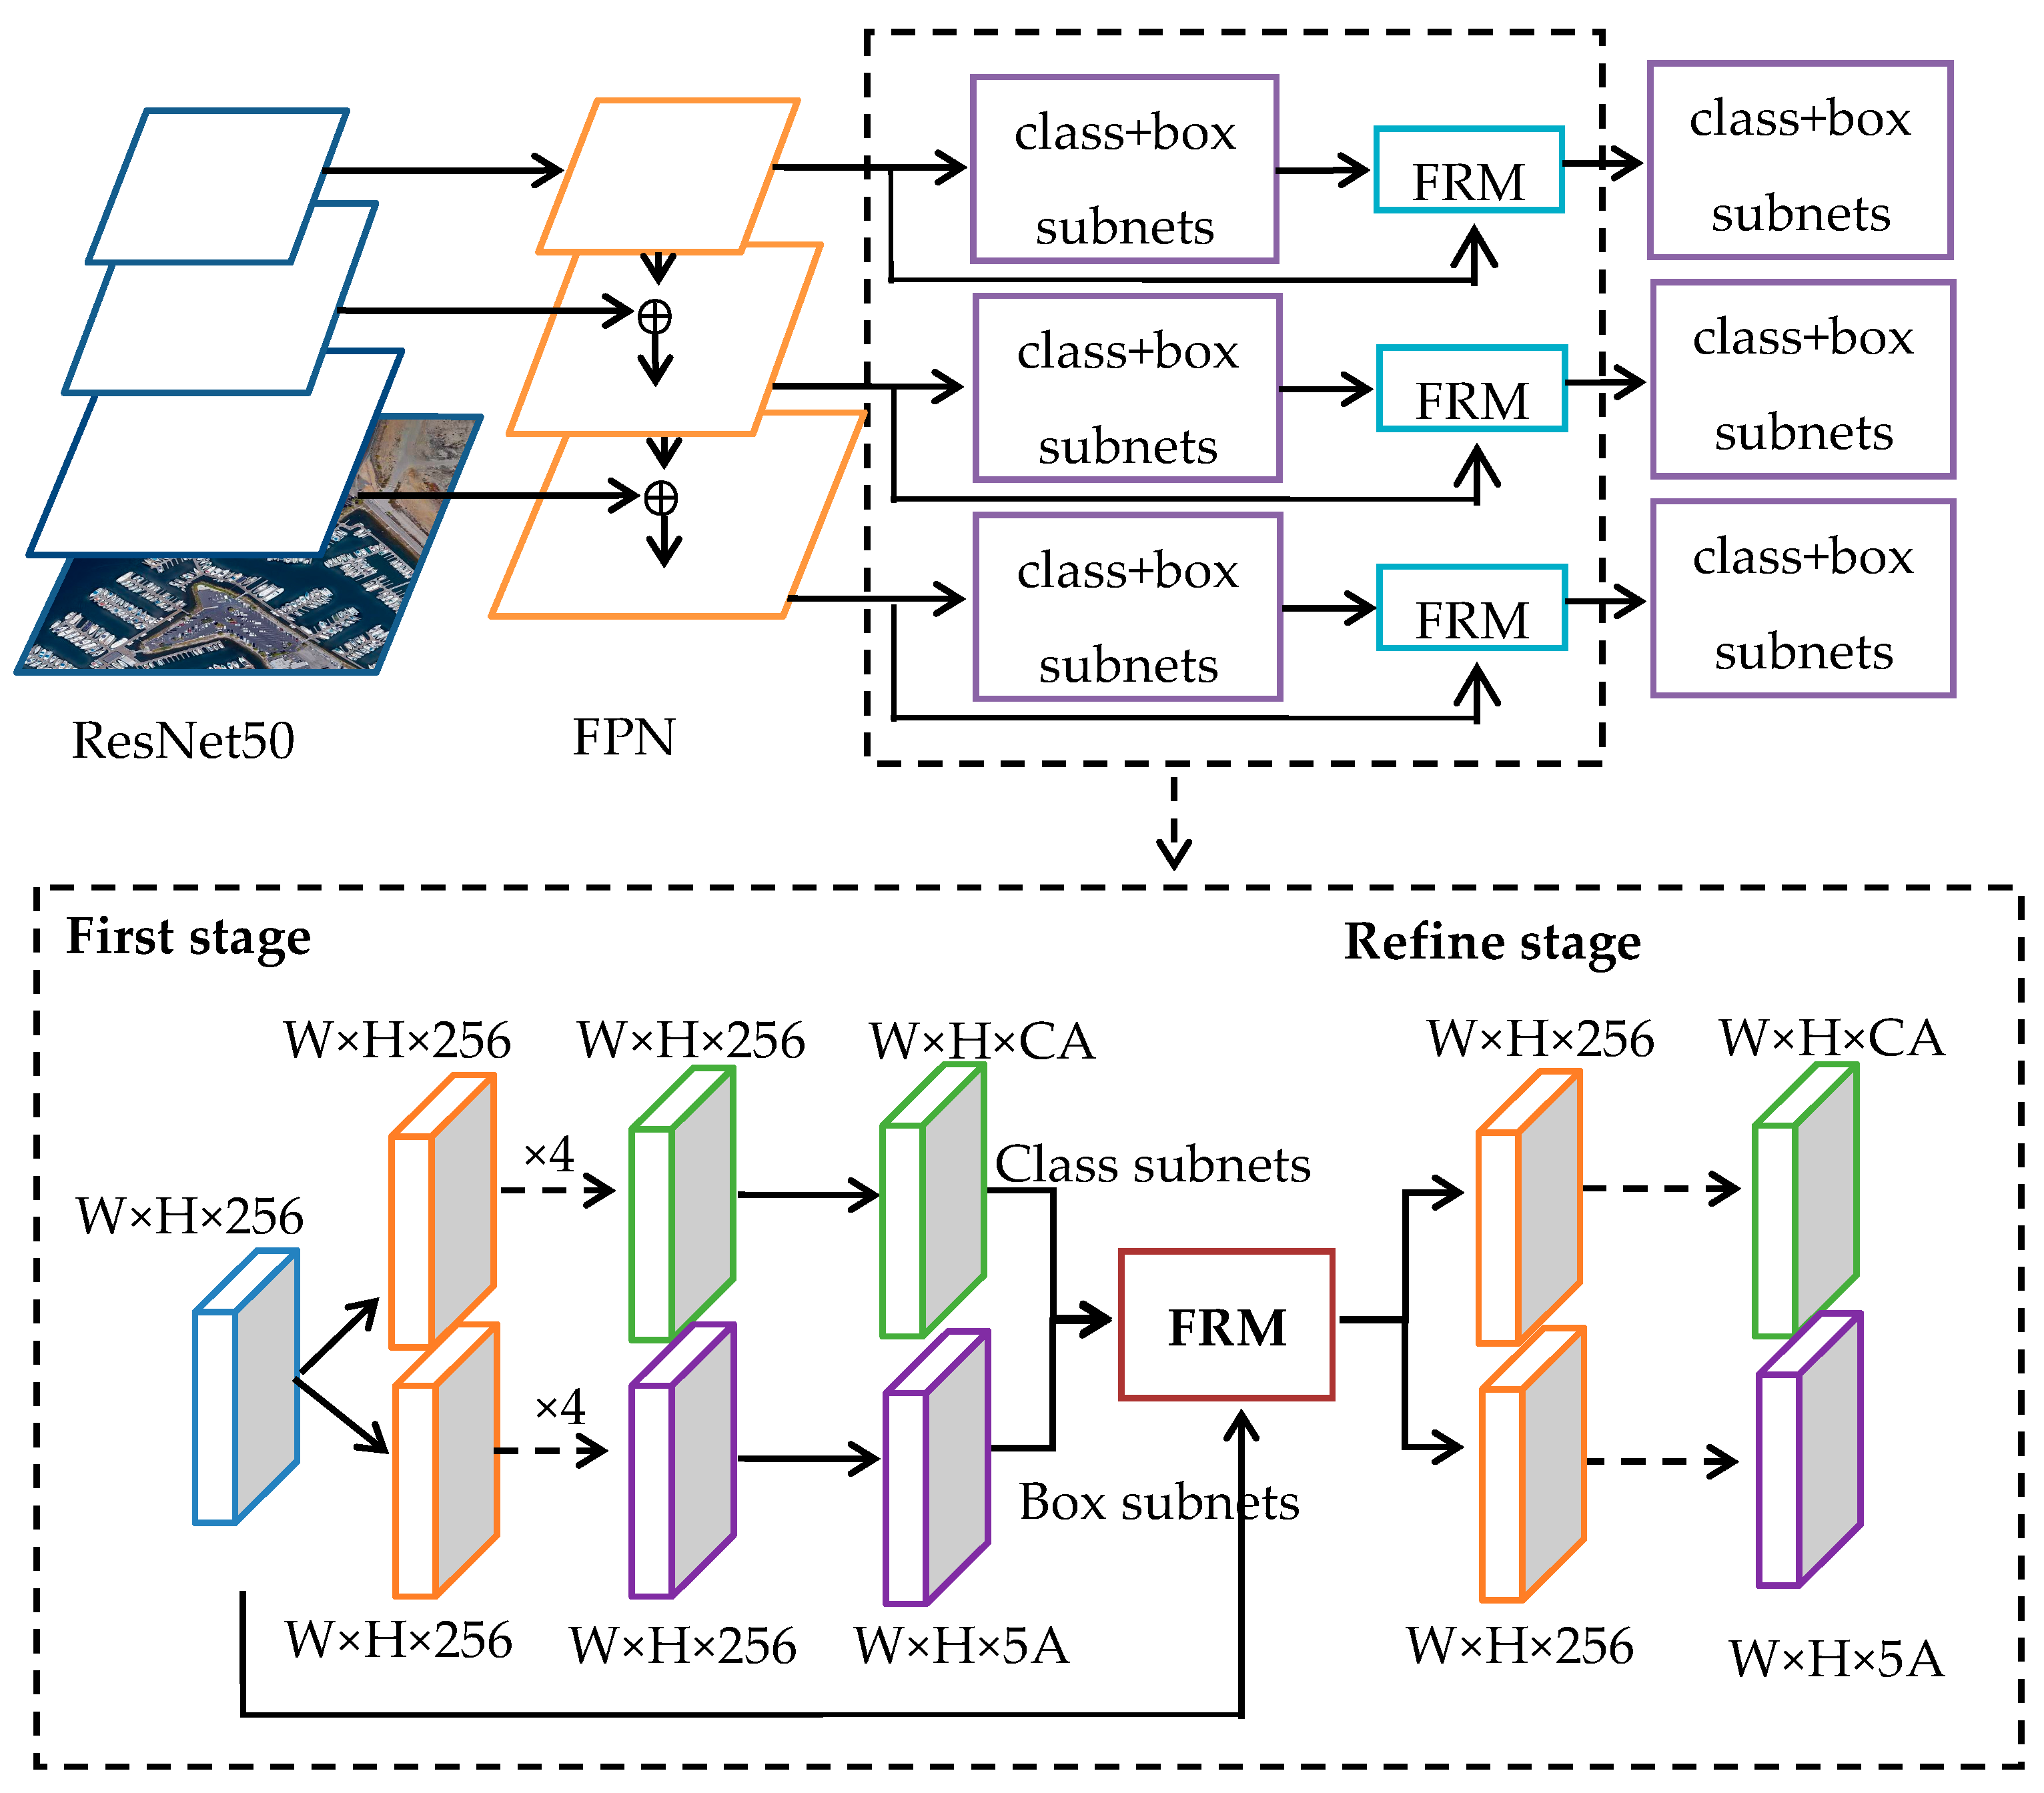
21], adding an FRM (feature refinement module) and designing a loss function of the approximate skew bound intersection (SkewIOU) to enhance the detection effect of rotating targets. The structure of R
3Det is shown in
Figure 4.
The R
3Det algorithm takes ResNet50 as the feature extraction network and performs feature multiscale fusion expression through FPN (feature pyramid network) to enhance the detection ability of multiscale targets. The predictor is divided into two convolution networks with shared weights to realize category regression and prediction frame parameter regression, respectively, and the FRM is designed. Its structure is shown in
Figure 5, which solves the problem of feature misalignment in rotating box regression.
R3Det combines the advantages of high recall of horizontal anchors and dense adaptability of rotating anchors. In the first stage, horizontal anchors are generated to improve detection accuracy. In the refinement stage, the bounding box is filtered, and only the bounding box with the highest score of each feature point is retained to improve detection speed. In the FRM, the five coordinates (center and four vertices) of the feature point bounding box are bilinearly interpolated to obtain the corresponding position information, and the entire feature map is reconstructed pixel by pixel to achieve alignment between the rotation box and the target feature.
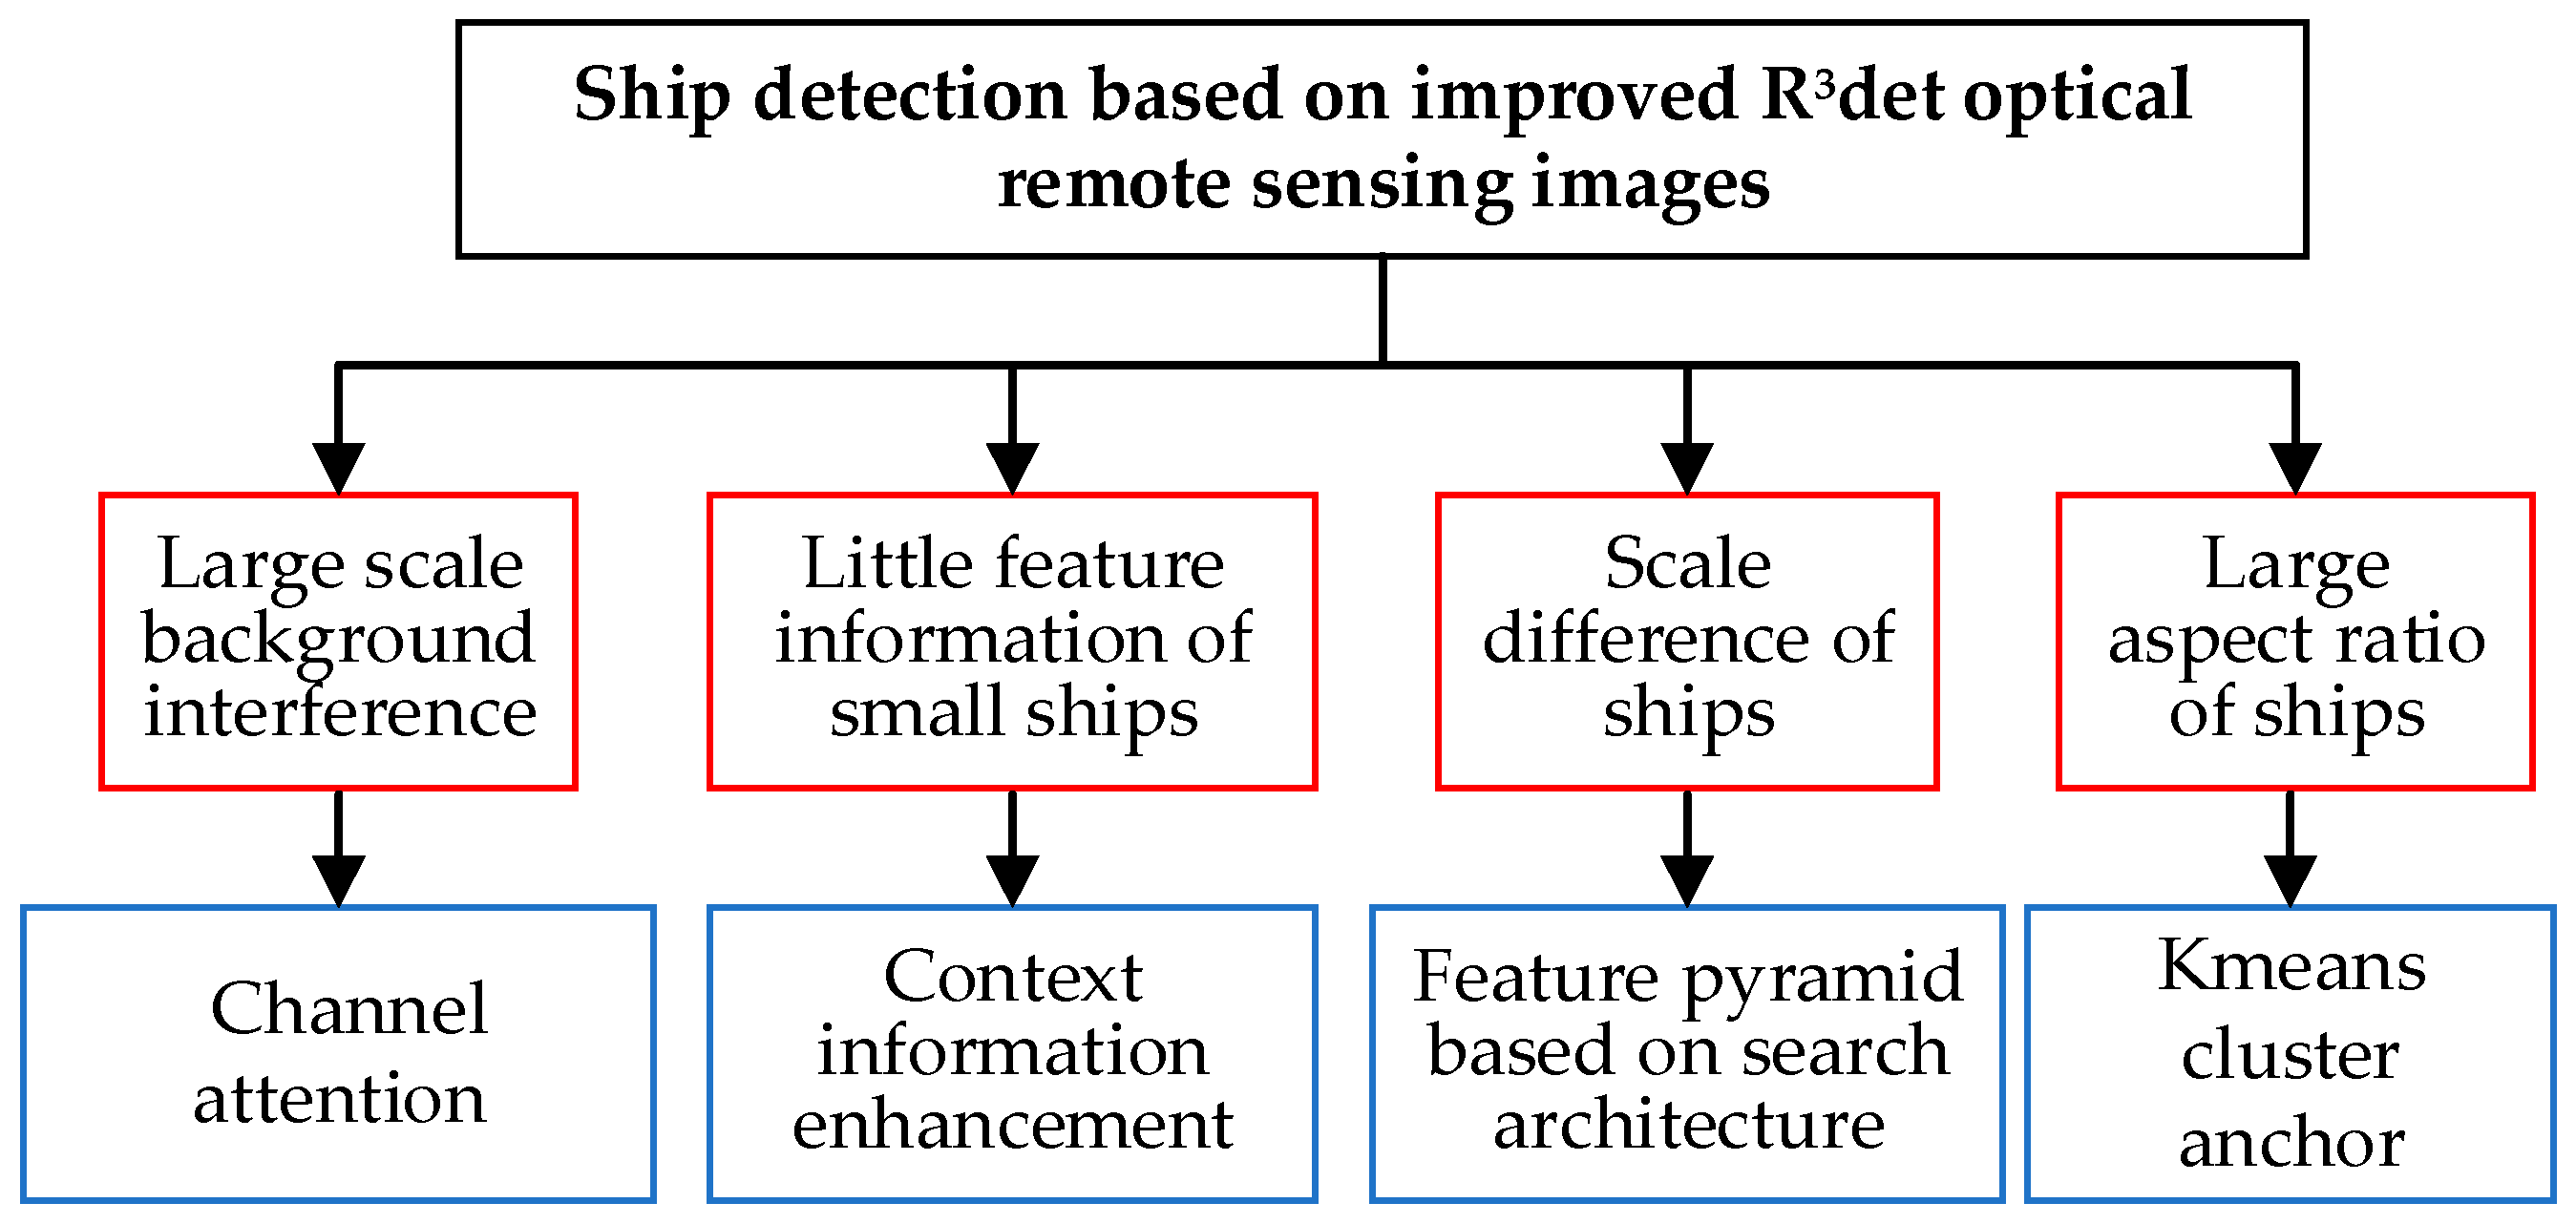
Due to the large-scale differences in each ship target, the artificially designed top–down feature fusion path in FPN has difficulty accurately expressing multiscale features. In this paper, the feature pyramid structure of FPN in R
3Det is replaced by the feature search fusion network structure, NAS FPN. The network updates and combines multiscale features through reinforcement learning to enrich multiscale feature information. Considering the background interference caused by the wide imaging range of remote sensing images, adding an attention mechanism can improve the significance of target features and improve the positioning accuracy of ship targets. This paper adds a lightweight channel attention module, ECA, to make the model focus on the target region. In order to solve the problem of detection difficulty caused by the less available features of small ship targets, a context information enhancement module COT, based on deformation convolution and dilated convolution, is designed to enrich the features of small ship targets by using the context information around small targets. The size of anchors in the original R
3Det algorithm is not suitable for ship targets with large aspect ratios. This paper modifies the size of anchors based on the model and uses k-means clustering analysis to design the prior frame aspect ratio to improve the detection and positioning effect. The problems and improved methods of ship detection based on R
3Det are shown in
Figure 6.
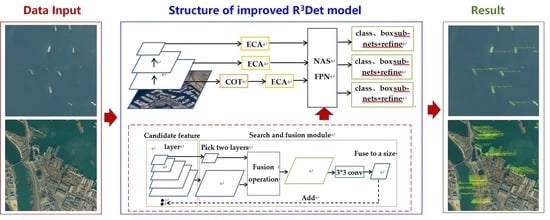
The improved model structure is shown in
Figure 7. The ECA modules are added to the input feature layers of FPN, and COT is added to the shallow feature layer.
3.1. Search Architecture-Based Feature Pyramid Network (NAS FPN)
The network architecture search algorithm (NAS) is a popular algorithm in the field of deep learning that can adaptively learn and modify the neural network structure based on the characteristics of the data [
22]. Wang et al. improved the FPN structure by using the NAS algorithm and designed a frame-adaptive search-based FPN model [
23]. In FPN, only the path from the top feature to the bottom feature is simply adopted, while NAS FPN selects the appropriate feature fusion path through reinforcement learning. The fusion process is shown in
Figure 8. NAS FPN is composed of an RNN controller and fusion module. Firstly, the feature map extracted from the backbone network is put into the candidate feature layer. The RNN controller controls the fusion module to select two feature maps as inputs in the candidate feature pool. Select the output size and fusion operation output features as new features, put them into the candidate feature layer, or output them until each layer of the feature pyramid is output, replacing the manually designed fusion path to realize multiscale feature cross fusion. The RNN controller adopts the reinforcement learning method, and its parameter learning takes the AP value detected by the model as the update excitation.
3.2. Channel Attention Module (ECA)
In recent years, attention mechanism models inspired by human visual attention have been developing continuously. Implementing attention techniques in neural networks helps the network focus on the essential parts of a problem, maximizing accuracy and efficiency [
24]. The large-scale background interference in remote sensing images brings great challenges to target detection [
25]. Adding an attention model can improve the robustness of the model against interference and the positioning accuracy of ship targets.
In this paper, a lightweight channel attention mechanism module ECA [
26] without dimensionality reduction is added to the model. The structure of the ECA module is shown in
Figure 9. The input feature map through global average pooling and the size
k of the convolution kernel is determined by the adaptive method to carry out the one-dimensional convolution operation so as to realize the cross-channel interaction of information. After the sigmoid activation function, the weight of each channel is obtained. Finally, the weight is multiplied by the original feature map to improve the saliency of the target feature.
There is a mapping relationship between the size
k of the one-dimensional convolution kernel and the input channel
C:
Therefore, given the dimension
C of the input channel, the size of the convolution kernel can be obtained:
3.3. Context Information Enhancement Module (COT)
The difficult problem of detecting small targets has always been an important task to be solved in the task of target recognition. Usually, the pixels of small targets in an image are low, and the features available for mining are limited, which makes the model insensitive to small targets and difficult to locate accurately [
27]. To solve this problem, expanding the feature receptive field and taking the background information of small targets as a supplement can effectively improve the positioning accuracy of the model for small targets [
28].
Inspired by the ac-fpn [
29] structure proposed by Cao et al., this paper introduces deformable convolution and dilated convolution and designs the COT context information enhancement module. Its structure is shown in
Figure 10. At the same time, considering the feature volatility and model complexity of small targets in the deep network [
30], just add the COT module to the shallow feature map extracted by the ResNet50 network to realize the supplement and enhancement of the context information of small targets.
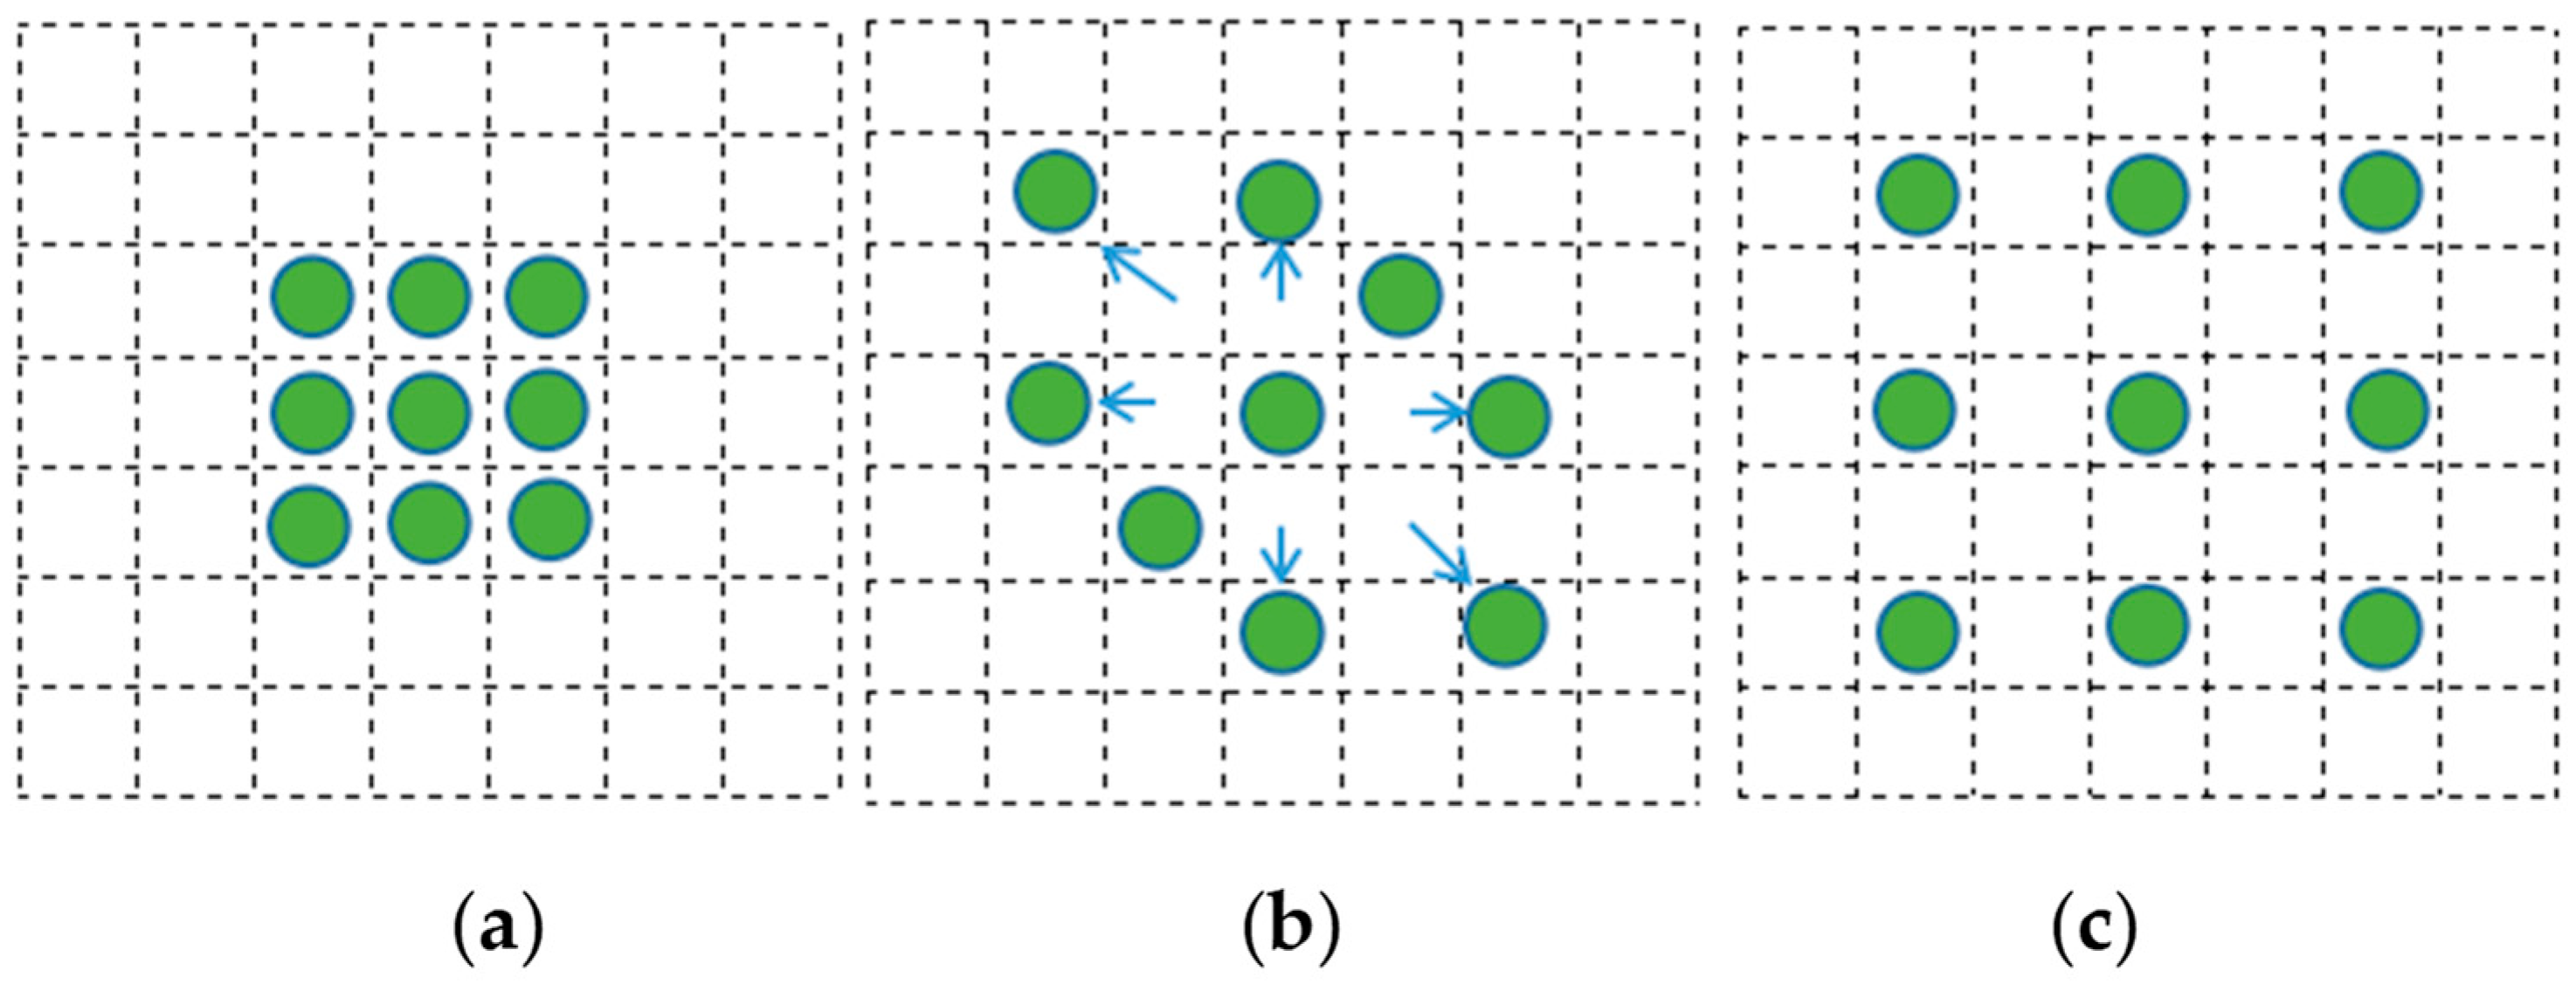
Compared with ordinary convolution, deformable convolution adds an adaptive learning offset [
31] to the receptive field of convolution so that the receptive field is no longer a simple rectangle but changes with the shape of the target object to adapt to the geometric deformation of various objects, as shown in
Figure 11b. Considering that the ship target has obvious length and width differences and is distributed at any angle in a remote sensing image [
32], the rectangular receptive field of ordinary convolution will introduce too much background interference, and the deformation convolution will make the receptive field concentrate around the ship target to improve the feature significance.
Dilated convolution [
33] is based on ordinary convolution; the void rate is set, and the characteristic sampling points of the original convolution are expanded externally, which expands the target perception field, but the convolution kernel size is not changed [
34].
Figure 11c shows the 3 × 3 hole convolution receptive field with a hole rate of 1. The dilated convolution is used to supplement the context information of the ship target to enrich the semantic features [
35], such as near shore information, sea surface information, the position information of the ship berthing side by side, and other hidden information associated with the ship target. The feature information of a small ship target is used to improve detection accuracy.
In the COT module shown in
Figure 11, the features are first convoluted through deformation to significantly enhance the features of the ship target, and then the compact context information around the target is extracted through dilated convolution to avoid more background interference caused by the holes in the receptive field.
3.4. Anchor Improvement
In view of the inaccurate positioning of the target detection above, this section modifies the scale of the anchors. The R3Det model performs regression prediction on the rotating target based on the horizontal anchors. The sizes of the anchors are manually set, and they need to be adapted for the actual detection task. The base anchors for the multiscale feature outputs by the FPN in the original model are (32, 64, 128, 256, 512). However, the size of 512 × 512 is not suitable for ship targets in remote sensing images. Considering that the size of small ship targets is generally below 20 × 20, this paper modifies the sizes of the basic anchors to (16, 32, 64, 128, 256). At the same time, the aspect ratio of the original anchors (1:1, 2:1, 1:2) does not have a good pertinence for the ship target. In this paper, the k-means clustering method is used to cluster the length–width ratio of the data. Class analysis is performed to obtain the optimized aspect ratio.
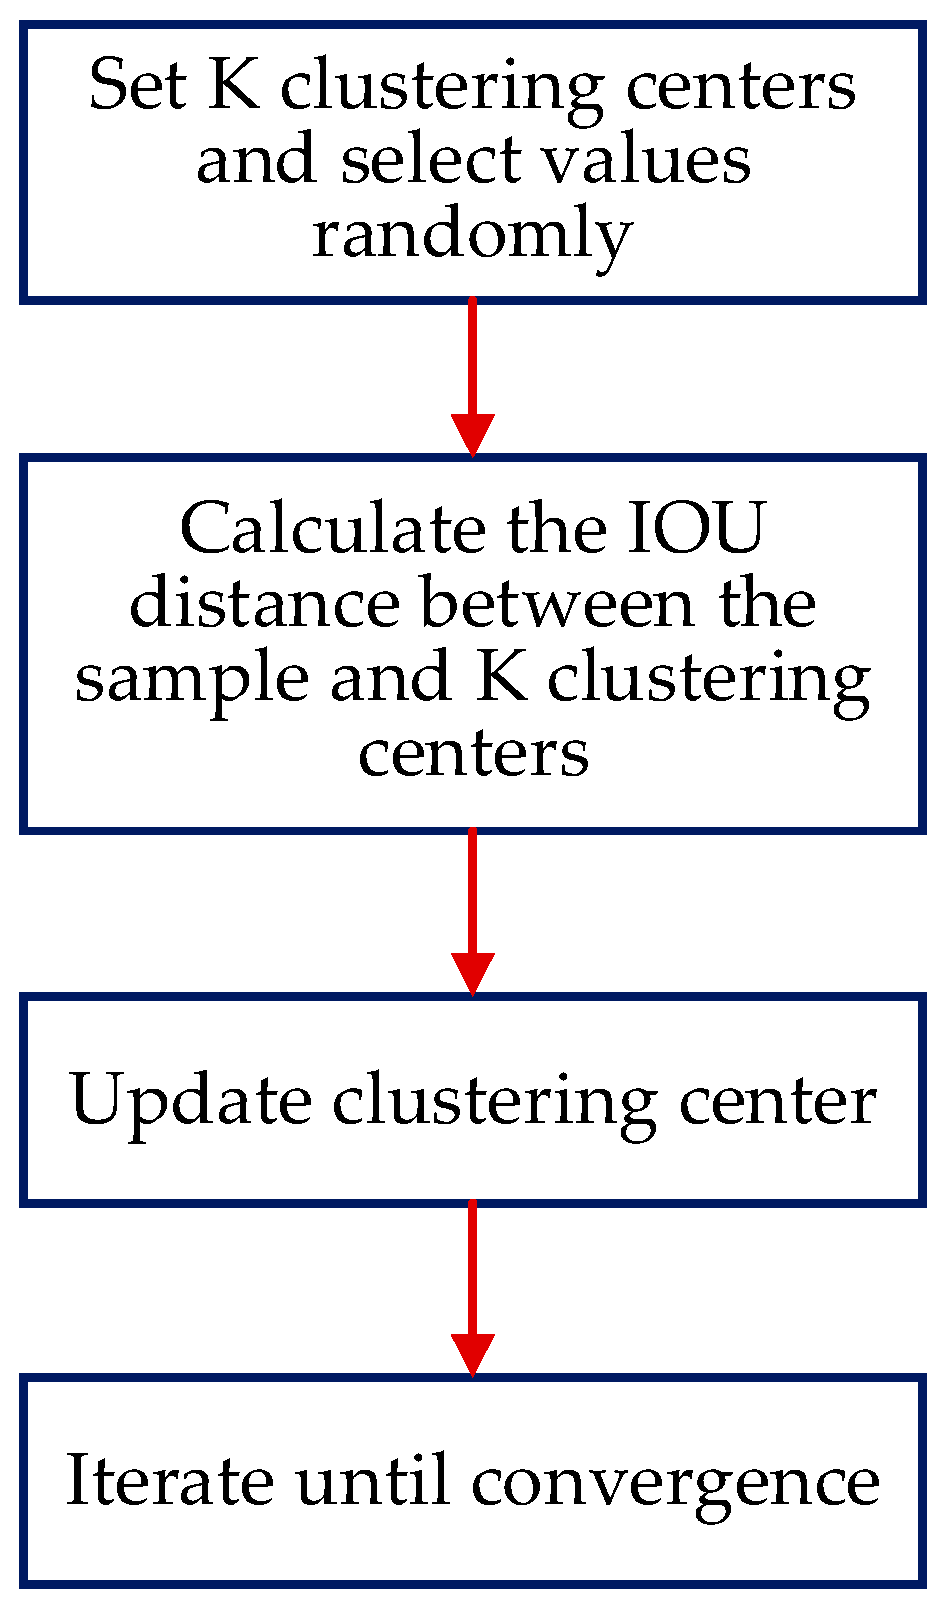
The process of adopting the k-means clustering method is shown in
Figure 12. First, K clustering centers are set, their values are randomly selected in the data, and the distances between each sample and the K clustering centers are respectively calculated. In this paper, the intersection union ratio IOU of the bounding box is used to calculate the distance between the sample and the K clustering centers, and all the boxes are divided into K regions according to the distance. The average value of each region is calculated to replace the original clustering center, and the iterative cycle is carried out until the value of the cluster center does not change.
The results after clustering are shown in
Table 2. Three anchors with different aspect ratios are used in the original model, so K is set to 3. Since the results of 3 cluster centers are similar, this paper uses the analysis results of 5 cluster centers to set the aspect ratio as (0.63, 1, 2.49).
4. Results
4.1. Training Process
In this paper, the R3Det model is trained in the windows system. The software environment is pytorch1.3 and python3.7, and the hardware environment is an Intel (R) core (TM) i7-8750h, NVIDIA GTX 1070 (8 GB), and 16 GB memory. The initial learning rate is set to 0.004, the IOU threshold is set to 0.4, the number of training data is 6621, and the number of testing data is 1126. When inputting the model, random flipping is performed.
4.2. Evaluation Index
In this paper, average precision AP (average precision) is used as the performance evaluation index of the ship detection model, and the calculation formula is:
TP is the number of targets correctly classified, FP is the number of backgrounds recognized as targets, and FN is the number of objects recognized as the background. The accuracy rate p (precision) represents the ratio of the correct target detected in all detection results. The recall rate r (recall) indicates the ratio of the detected correct target to the true value of all targets. The area enclosed by the curve with p as the vertical axis and r as the horizontal axis and the coordinate axis is the AP value. AP is used to measure the detection accuracy of single-class targets. The closer the AP value is to 1, the higher the detection accuracy. Map is the AP mean of object detection in multiclassification tasks.
4.3. Improvement Effect
The R
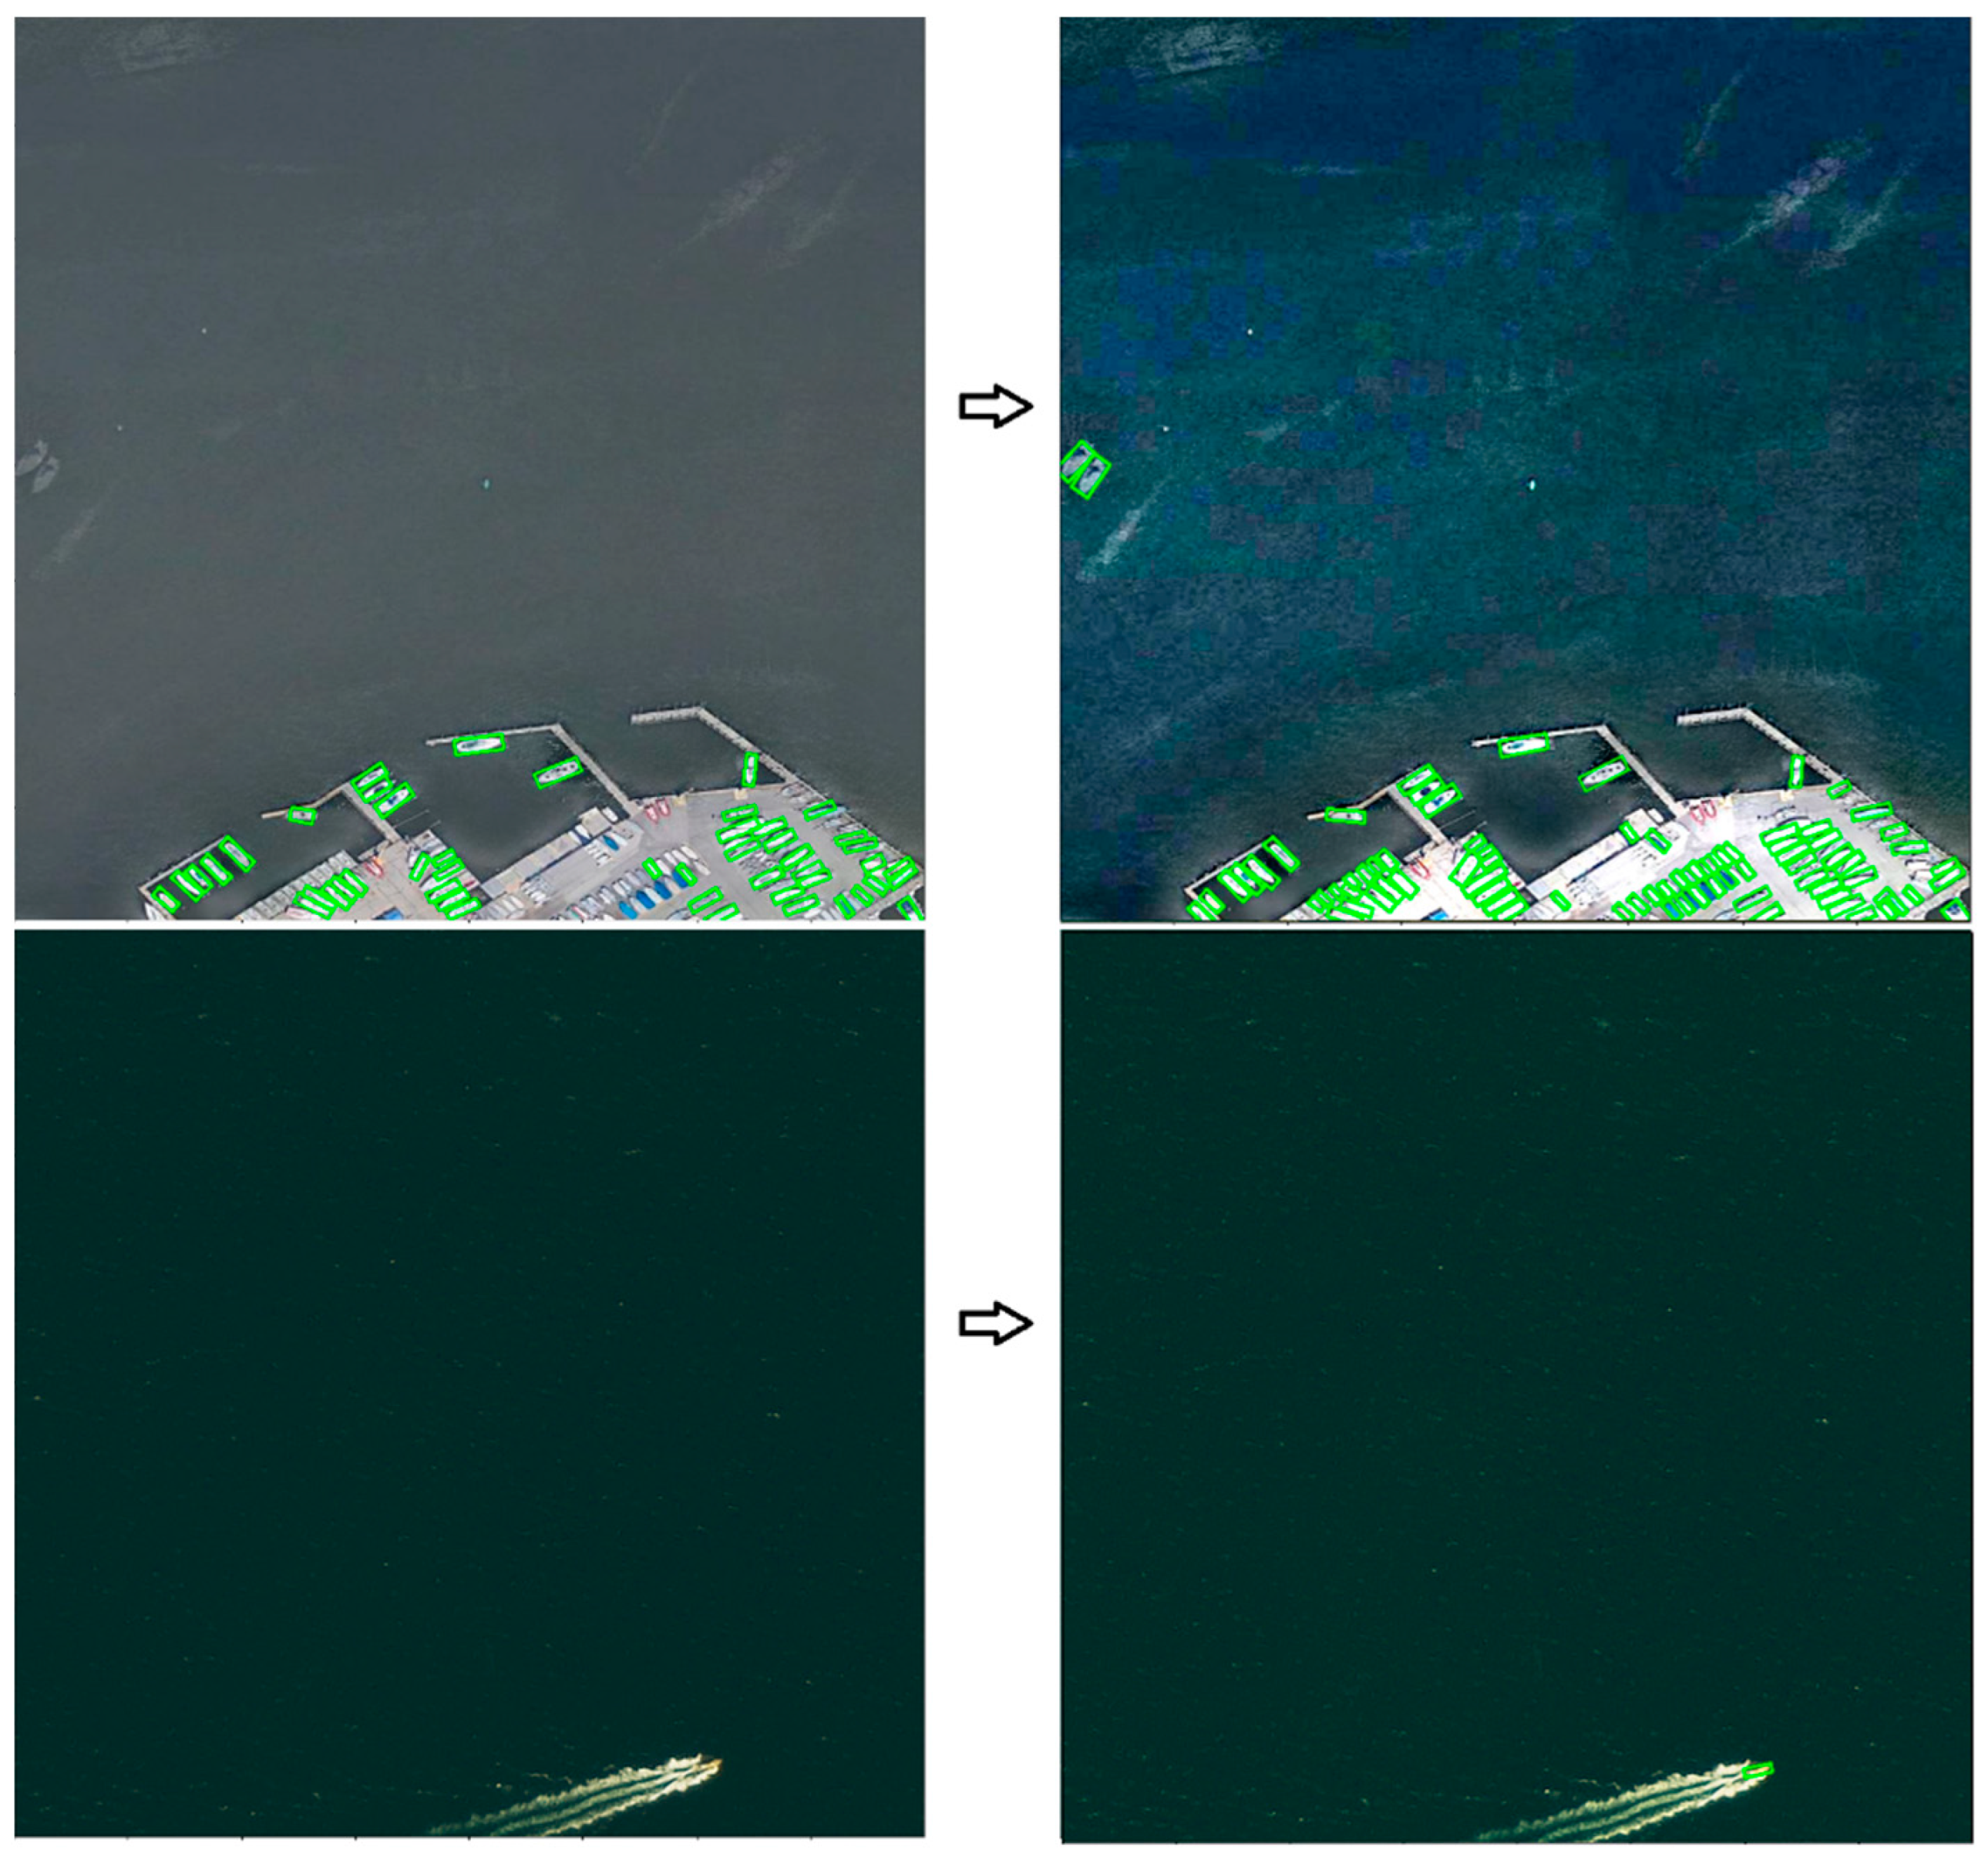
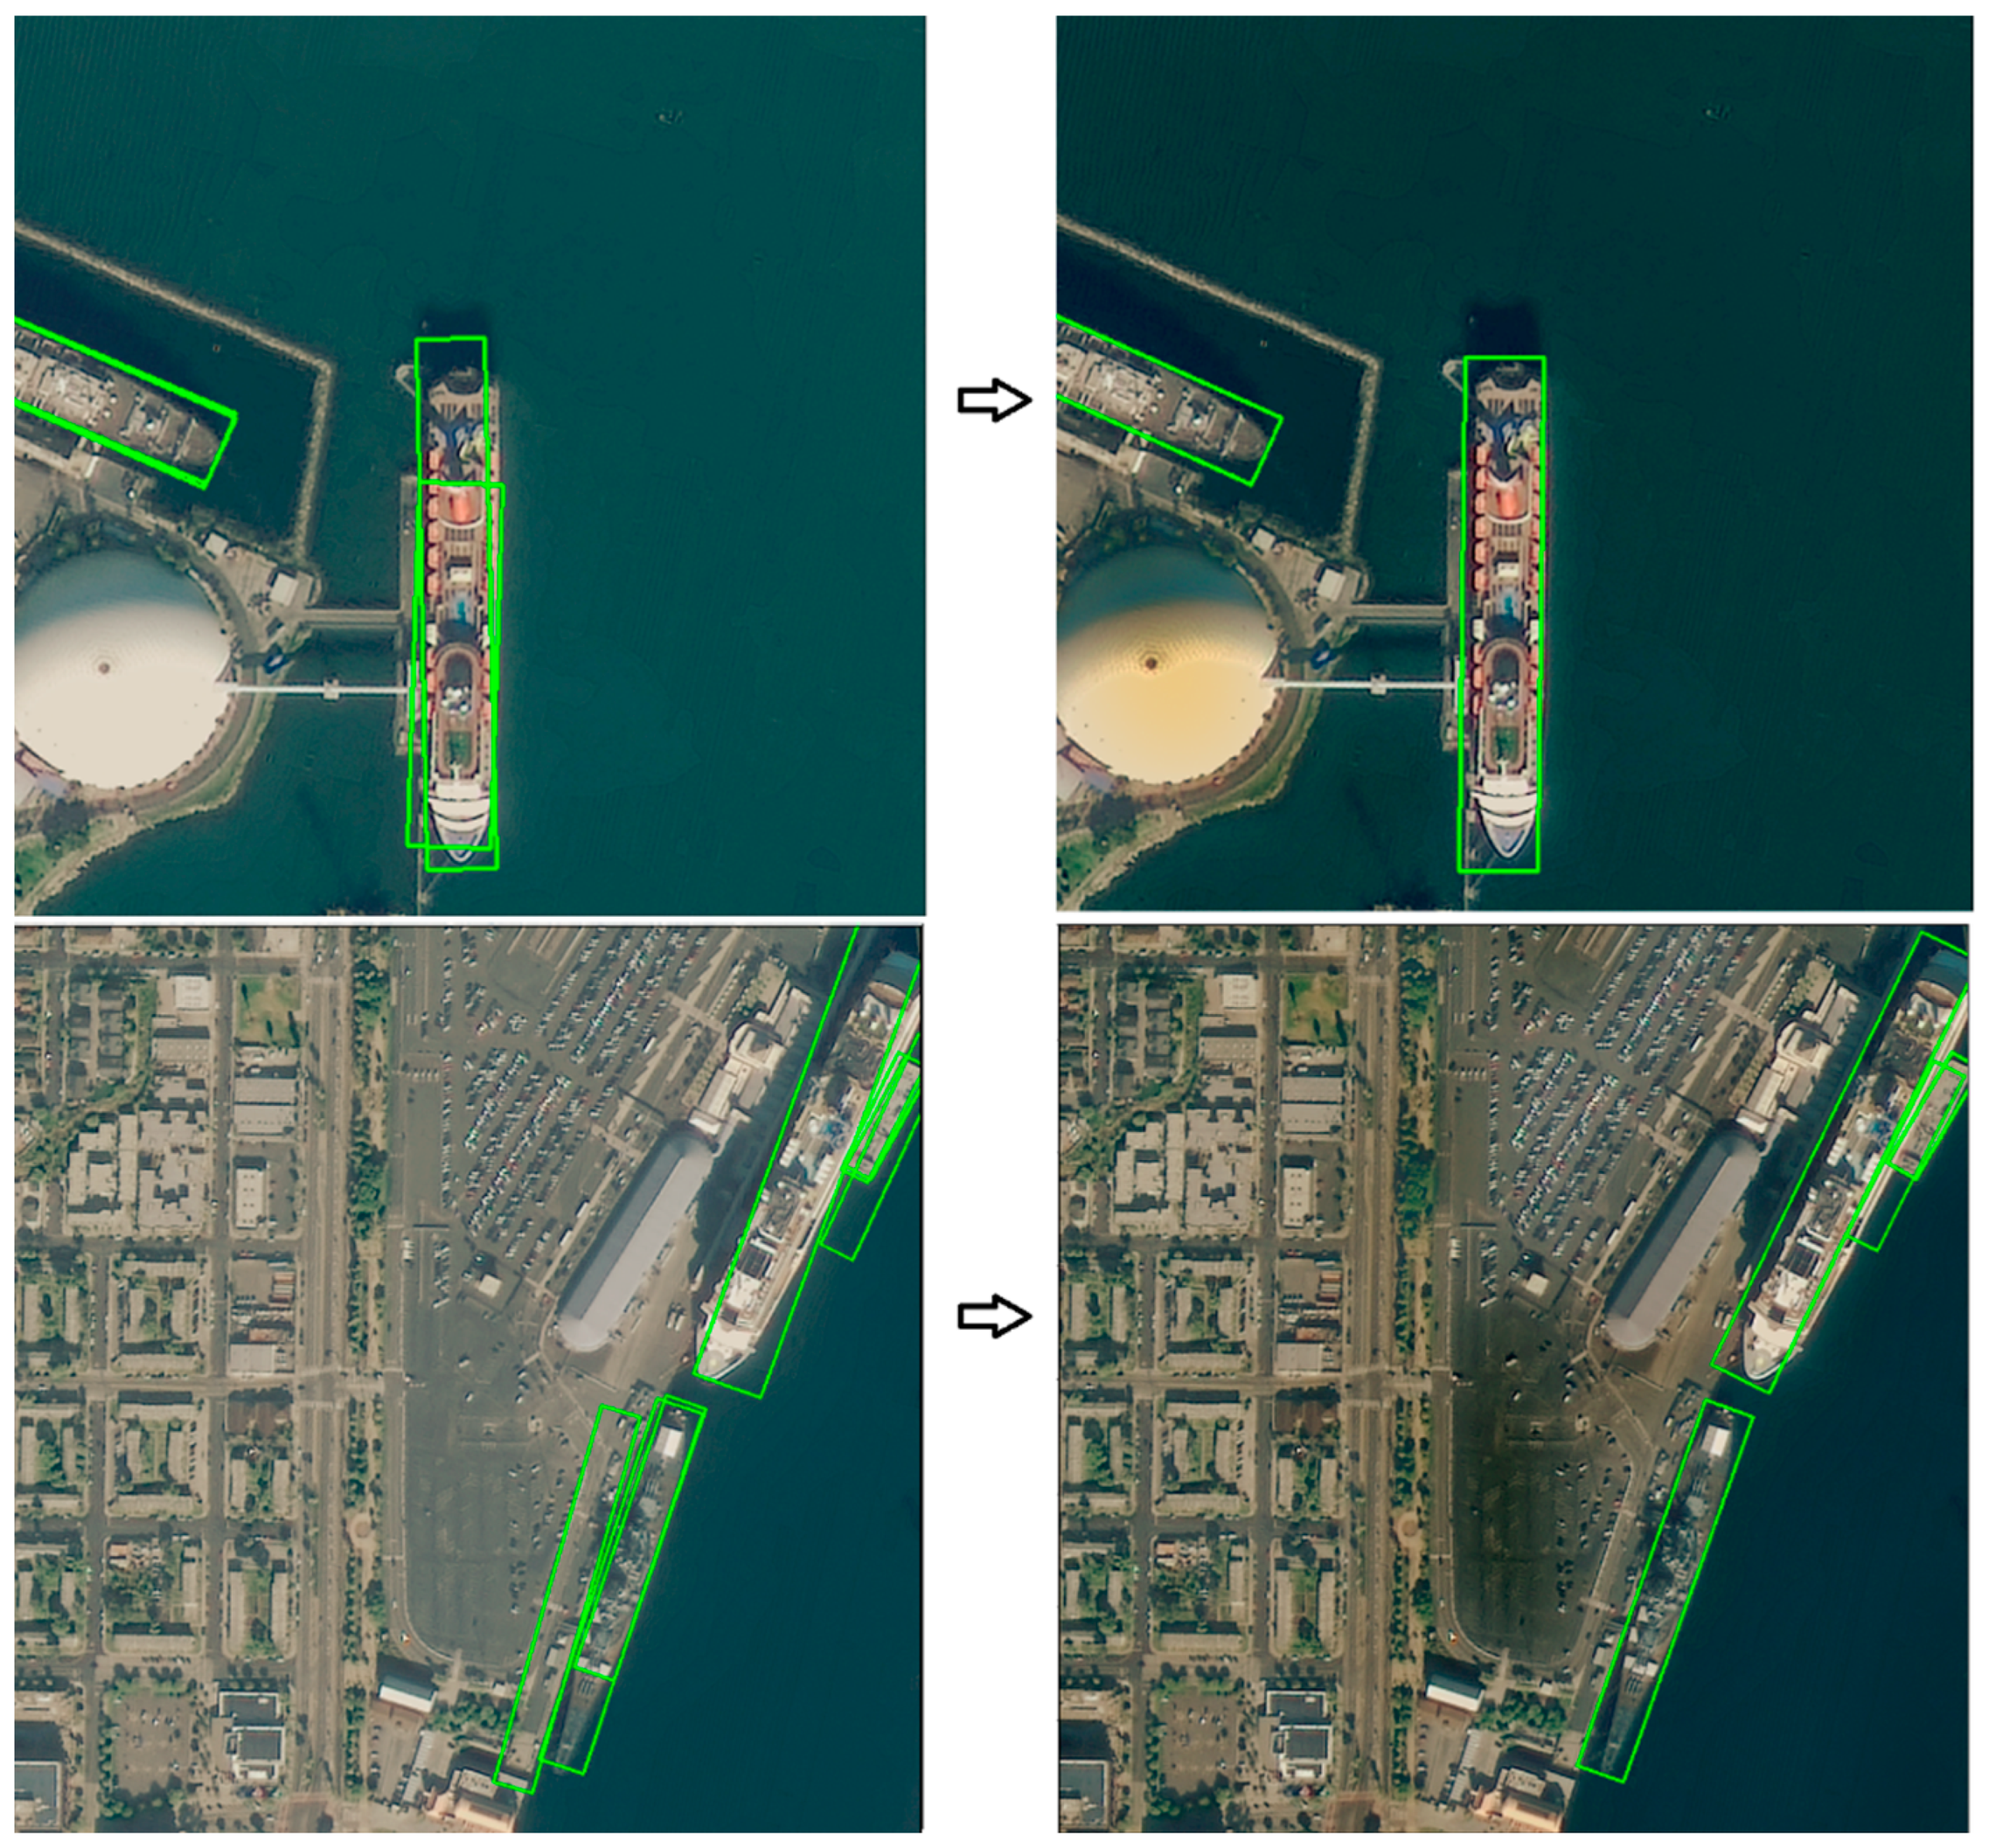
3Det model can detect ship targets in remote sensing images accurately. However, the detection effect of the model for small ship targets is poor, there are many missed detections when the small ships are densely arranged, and the positioning of the ships is inaccurate. Based on the above improvements, the two types of problems have been effectively improved, as shown in
Figure 13 and
Figure 14.
Ablation experiments were carried out for each improvement. The recognition effect of some ship targets that are difficult to detect is shown in
Table 3. Through a comparison of experiments one and two, the use of NAS FPN as a multiscale fusion network has better advantages than FPN in the expression of multiscale target features because NAS FPN searches for an optimized feature fusion path through reinforcement learning, and the feature expression is rich, which makes the model perform better. Through experiments two and three, it can be observed that the improvement in the anchor and the addition of the attention mechanism can significantly improve the detection performance of the model, and the attention mechanism can filter the background interference to obtain more significant characteristics of the ship. The recognition accuracy of the model for small ship targets has been greatly improved, and the sensitivity of the model to small ship targets has been improved. Comparative experiments four and five show that the introduced context information enhancement structure enriches the feature information of small target ships and enhances the sensitivity of the model to target ships.
As shown in
Table 3, the addition of each module can effectively improve the recognition rate. In order to more accurately illustrate the effect of the model improvement, experiment four and experiment five are taken as examples (the experimental results are close), and the model is trained three times, respectively. The average value is taken as the final result, and the mean and standard deviation of the detection accuracy is calculated. The result is shown in
Table 4 and
Table 5.
The results of the above experiments show that the addition of each module can effectively improve the detection accuracy of the model.
Due to the large difference between the scales of different ships, the multiscale feature information of the model before the improvement is limited.
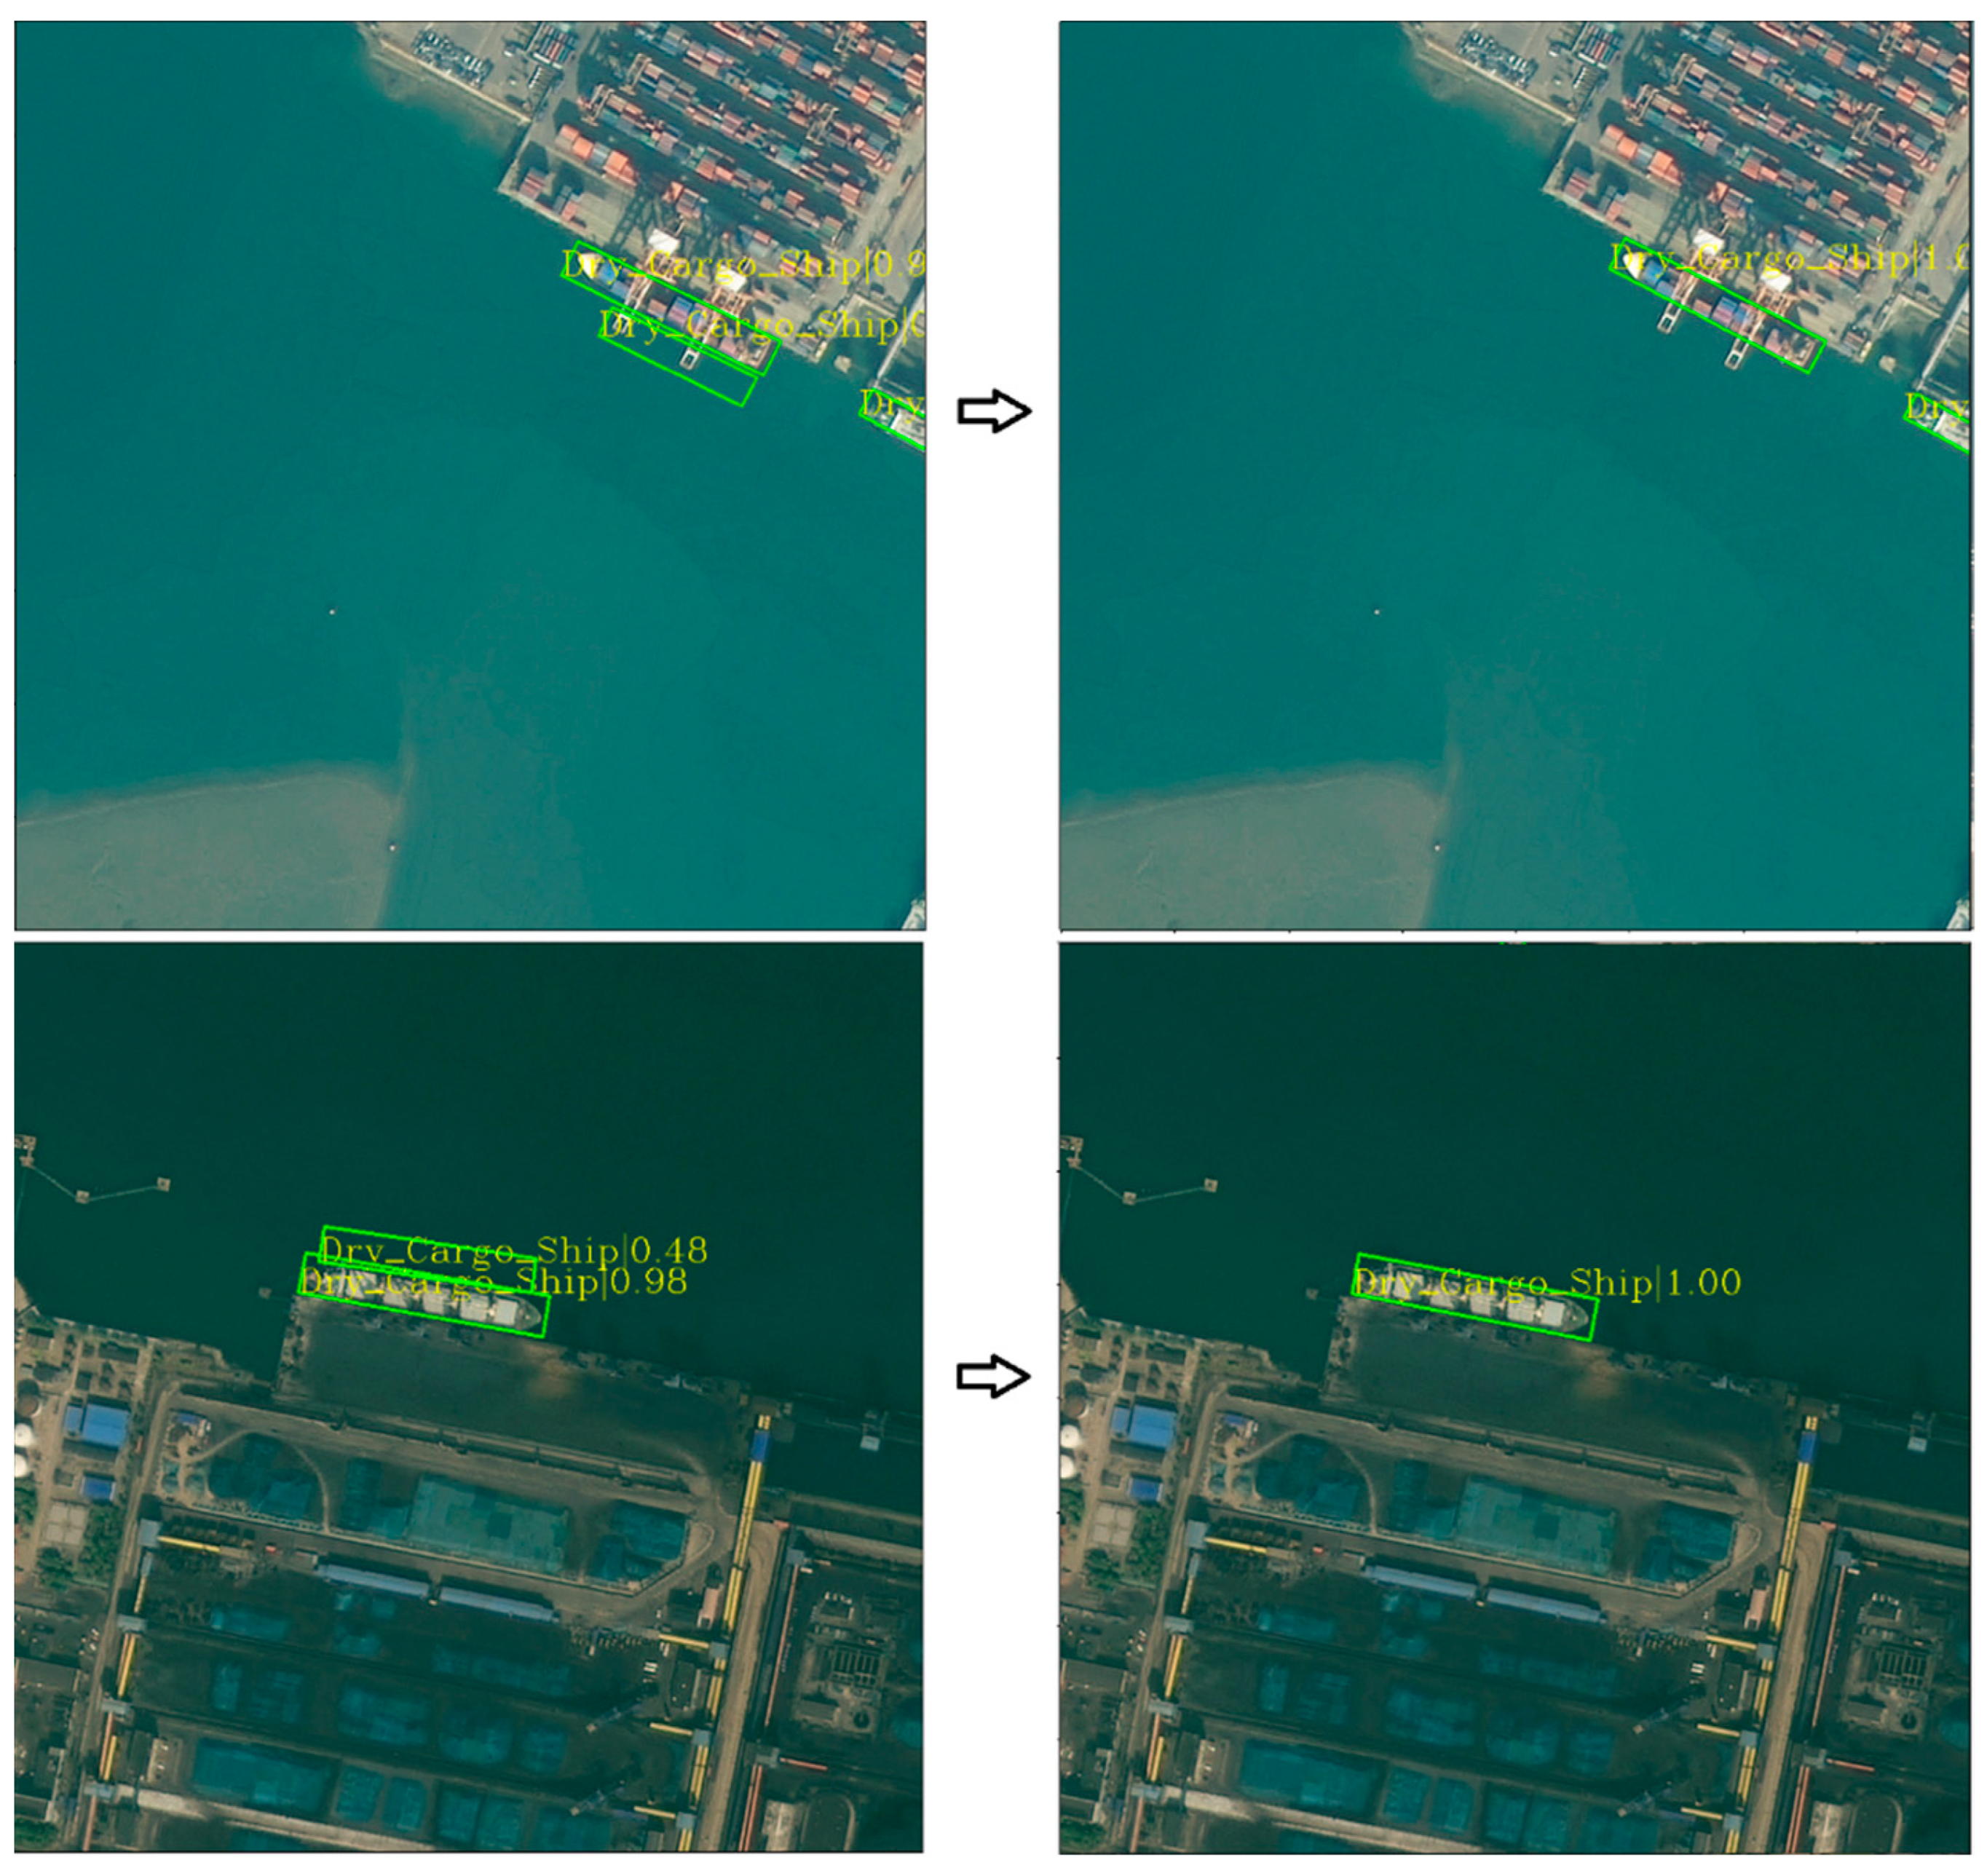
Figure 15 shows the detection and comparison results of the model before and after replacement with NAS FPN. It can be observed that the improved model improves sensitivity to the targets of ships of various scales and performs a deeper expression of the feature information.
The large-scale background in the remote sensing image has strong interference with the detection task.
Figure 16 shows the detection effect before and after adding ECA. Adding the channel attention mechanism ECA to the model can preserve the effective feature information of the region, effectively overcoming the interference caused by the complex land background in the port environment and, thus, improving feature saliency.
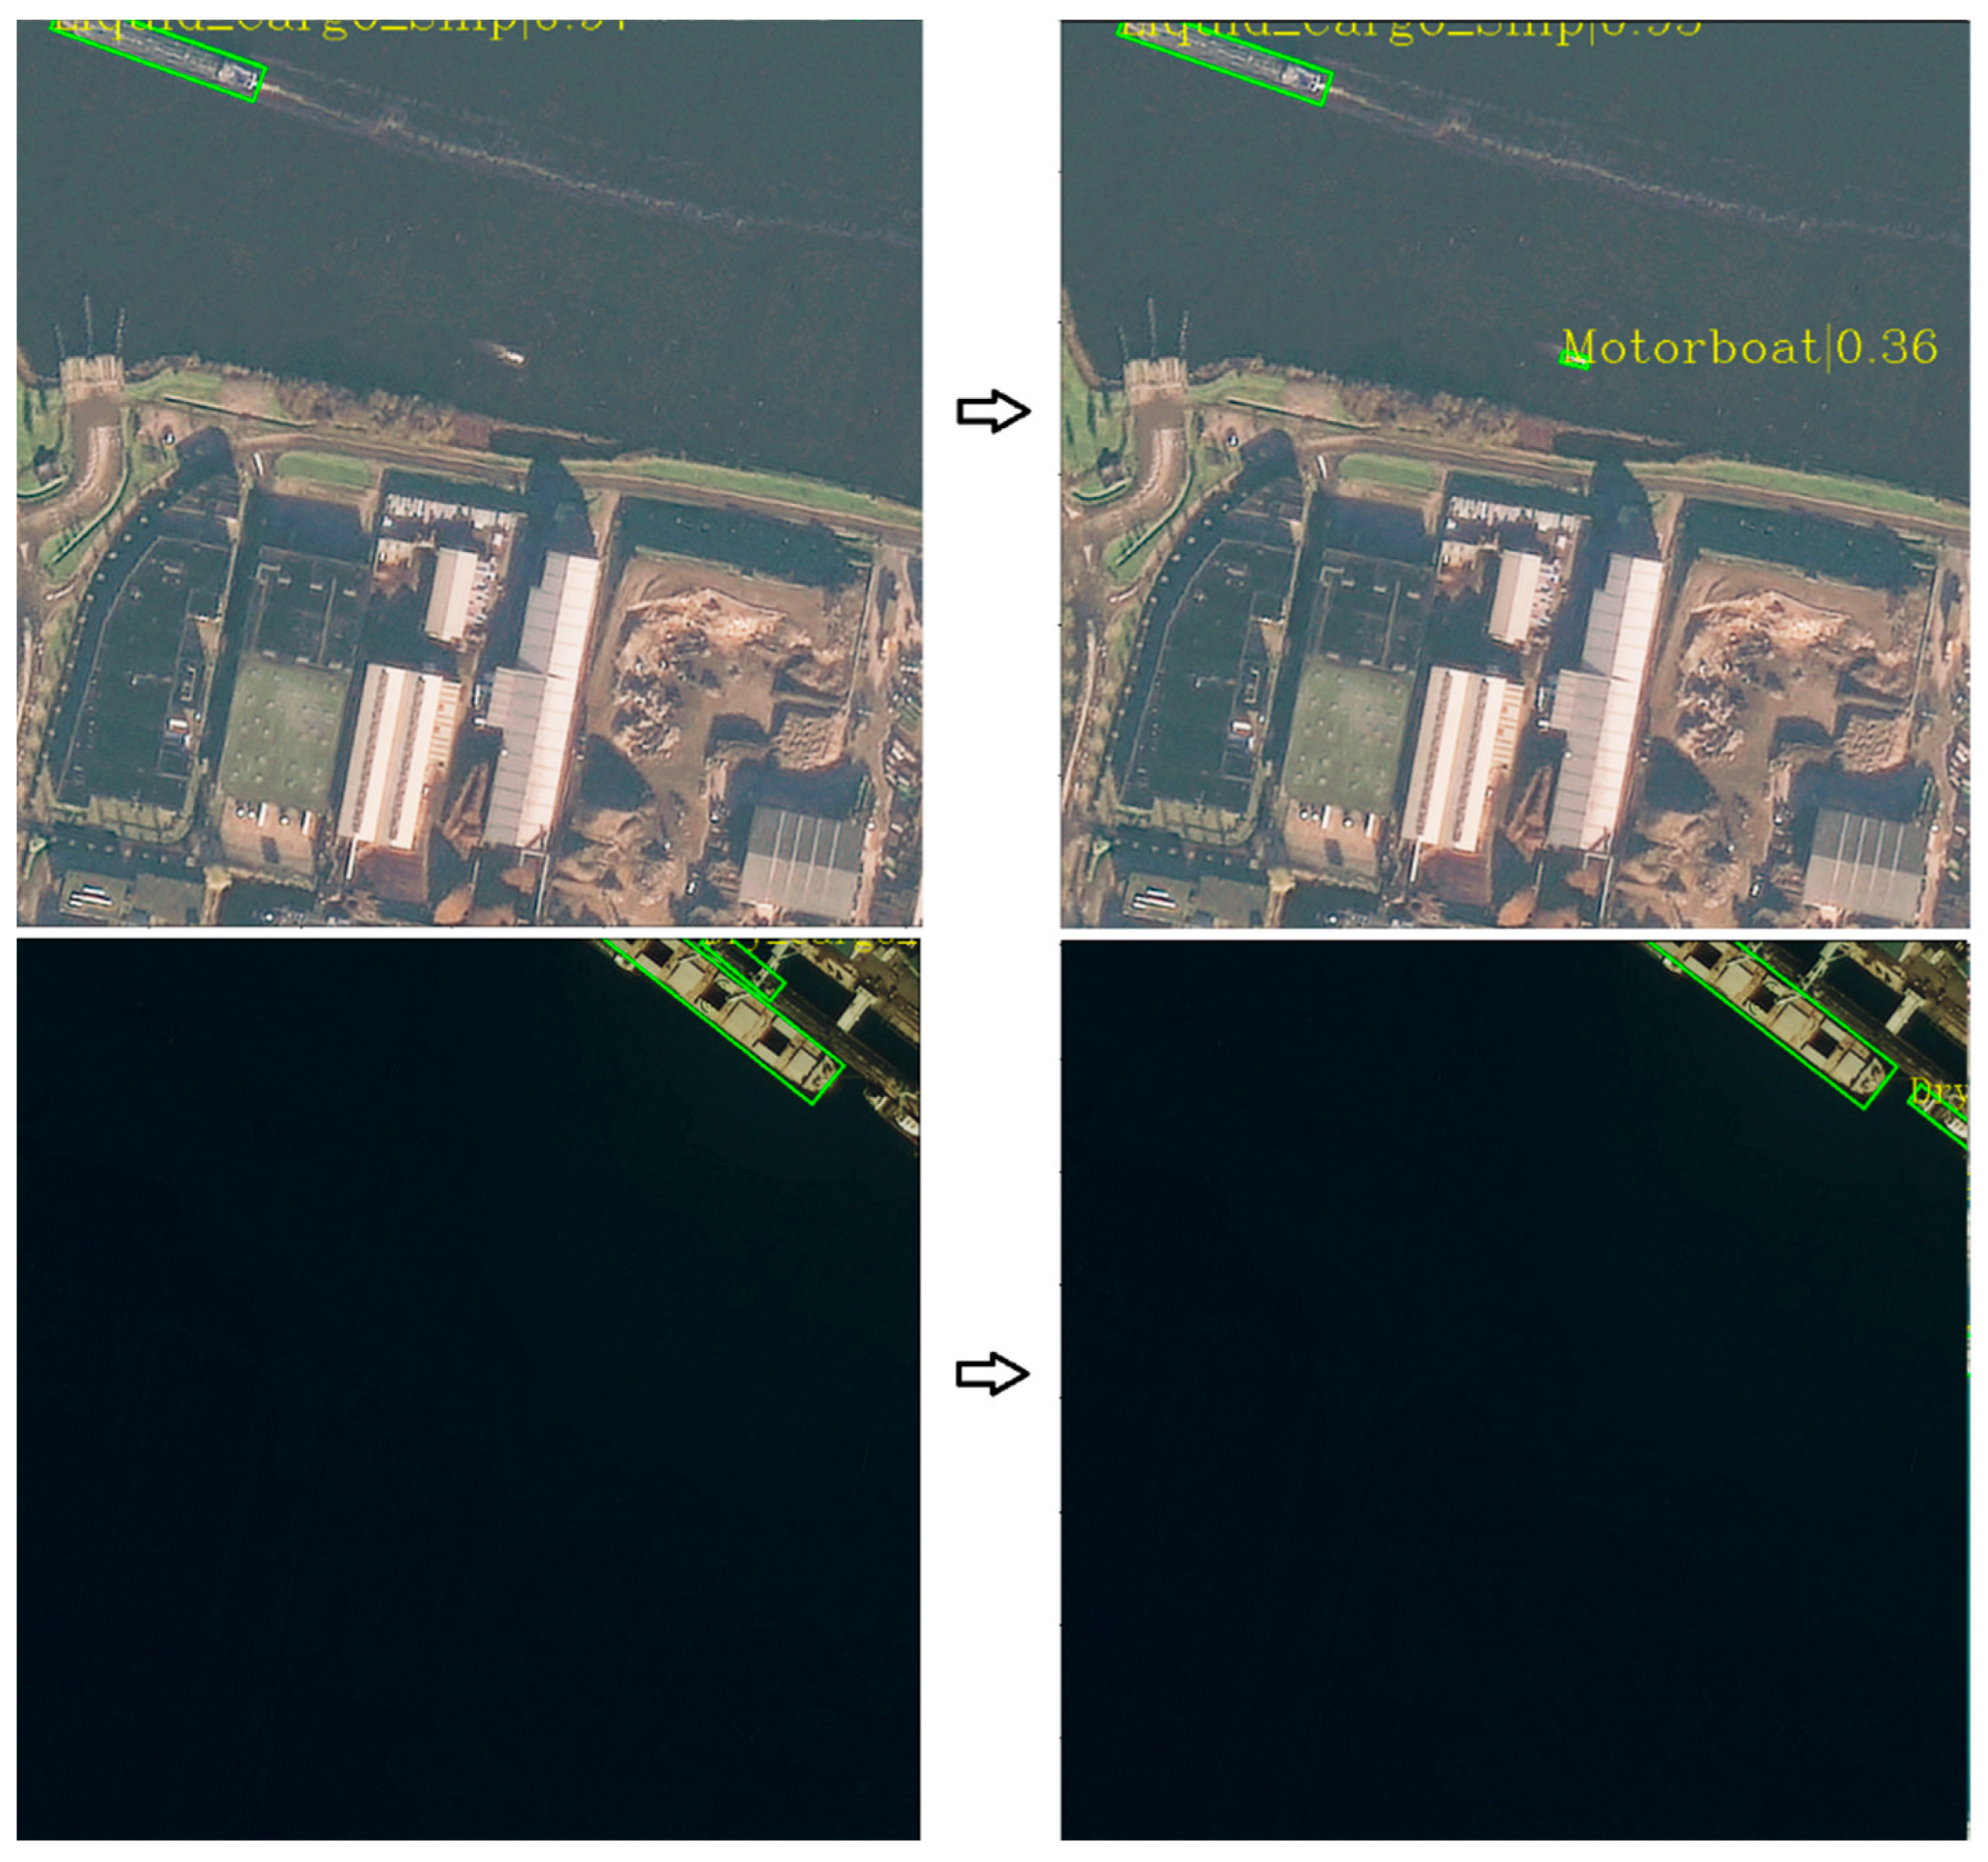
By comparing the detection effects before and after adding COT in
Figure 17, it is shown that this structure can improve detection performance by mining the hidden context relevance of the dense arrangement of ship targets. The deformation convolution can effectively deal with the direction rotation, and the dilated convolution is rich in feature information, thus enhancing the significance of shallow features.
4.4. Influence of Deformation Convolution Size in COT
In order to verify the effect of deformation convolution size on detection accuracy, the deformation convolution size of 3 × 3 and 5 × 5 in COT are used in the experiments. The experimental results are shown in
Table 6.
The results show that after the deformation convolution size is changed from 3 × 3 to 5 × 5, the model parameters are increased, but the detection accuracy is not improved. Therefore, the deformation convolution size of 3 × 3 is used in the improved model.
Table 7 shows the AP values of various targets detected by the improved model. It can be observed that the improved model can achieve more accurate detection of various ship targets.
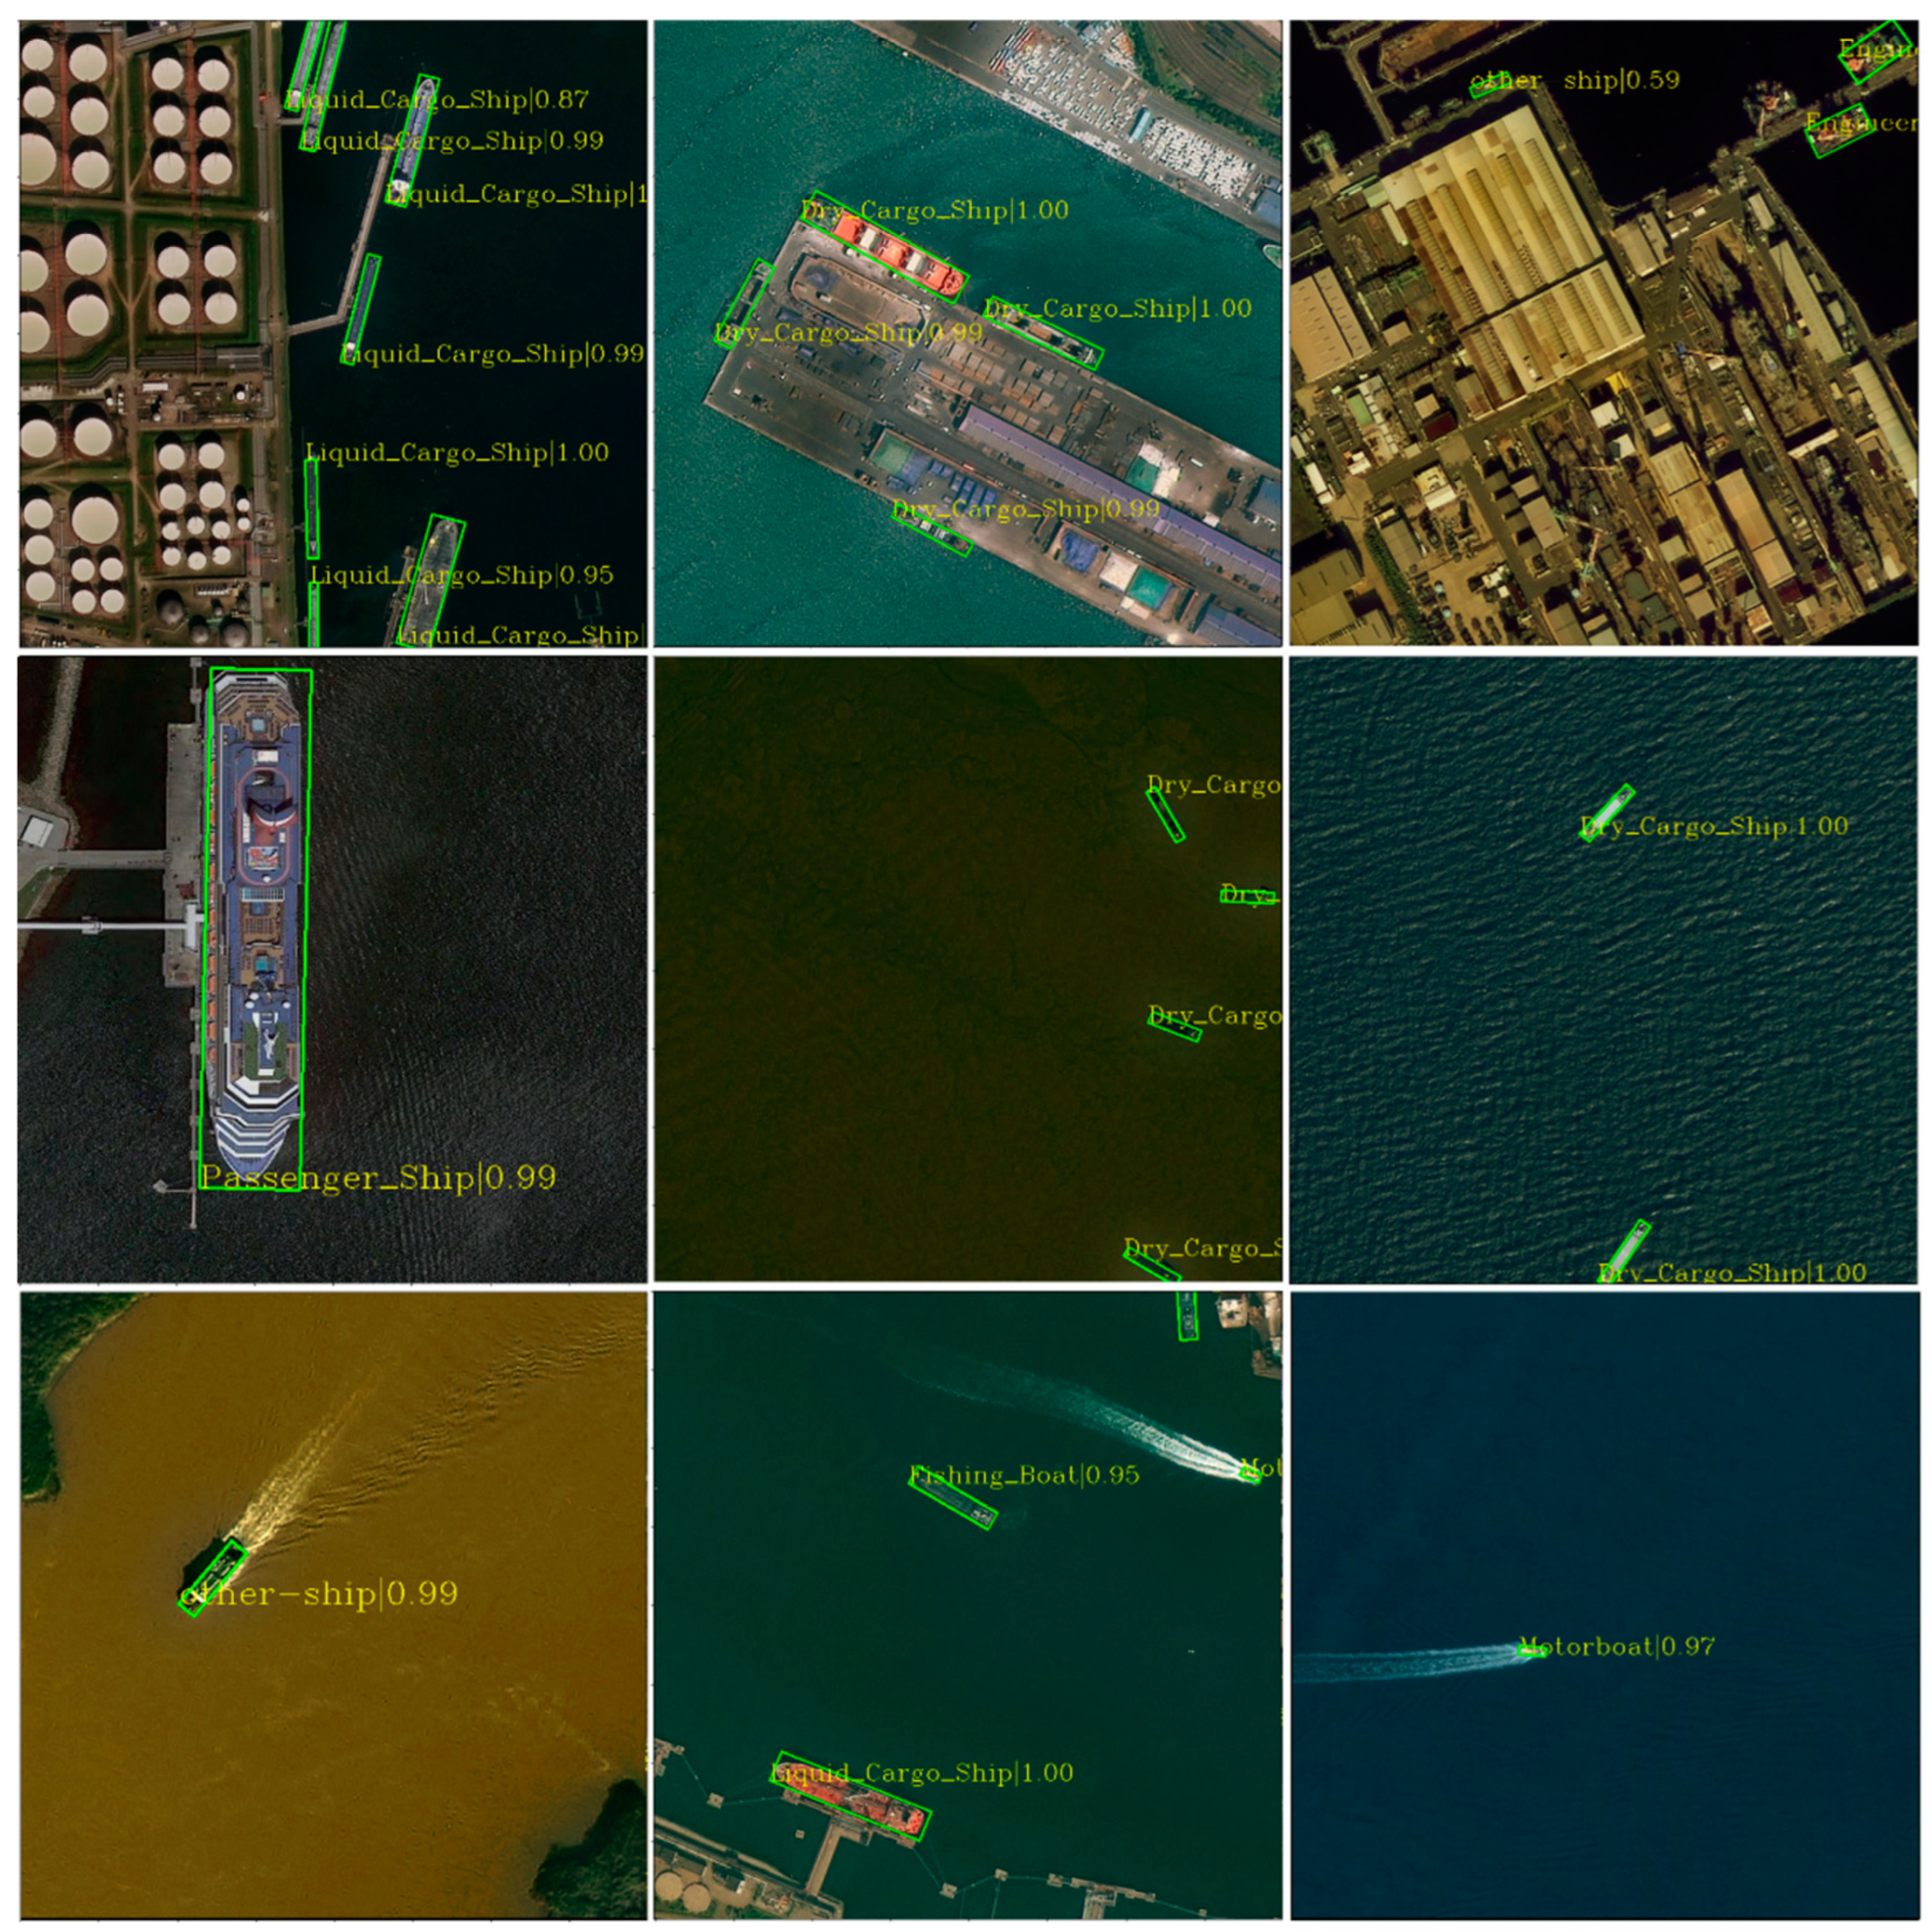
Figure 18 shows the detection results of the improved model in various scenarios.
In the complex nearshore scene, the model can still overcome the large-scale background interference and achieve good detection results.
4.5. Comparison of Other Target Detection Methods
In order to further verify the effect of the improved model, the commonly used detection models in remote sensing target detection are selected and tested on the training set and test set constructed in this paper. The AP and mAP values of different models are shown in
Table 8.
It can be seen from
Table 8 that compared with other models, the improved R
3Det model improves the accuracy of ship detection.
5. Discussion
Firstly, according to the differences between different ship scales, the reinforcement learning method was used to optimize the fusion effect of multistage features to better detect targets of different scales. Secondly, starting from the channel dimension, the channel weighting mechanism was introduced to self-learn the importance of the semantic representation of each channel, improve the significance of effective features, and improve the model’s ability to distinguish between ships and the background. In addition, to solve the problem of the difficult positioning of small ships, context correlation between the target and surrounding objects was explored from the spatial dimension: the deep semantic significance and spatial information representation were enhanced, and the detection ability of the model for small ships was optimized. The ablation experiments show the effectiveness of the above methods in ship detection.
There is still a certain gap between the ship target detection model constructed in this paper and the actual application scenario. The actual remote sensing images acquired by satellites usually contain a large number of sea surface and land backgrounds. It is inefficient to directly detect ship targets in the images, and it has high requirements for data storage space and data transmission [
40]. Therefore, in order to meet the needs of the on orbit engineering practice of ship target detection, a further optimization direction of the detection method is to conduct relevant sea–land separation processing on large-scale remote sensing images.
6. Conclusions
In this paper, an improved R3Det model based on attention and context information enhancement is proposed, which can handle different complex scenes and detect multiscale ship targets. For example, the attention model ECA was used to enhance the characteristics of the target and reduce interference, and NAS FPN was used to enhance the ability to detect multiscale targets. Finally, in order to improve the detection accuracy of small target ships, COT was designed. Under the effect of deformation convolution and dilated convolution, the context information around small targets was enhanced. The effectiveness of the improved model in a complex environment and for small target detection was verified through comparison experiments with R3Det and other models. The future work is to further improve detection speed and accuracy by performing relevant sea–land separation processing on large-scale remote sensing images.
Author Contributions
Conceptualization, J.L. and Z.L.; methodology, J.L.; software, Z.L. and M.C.; validation, J.L., Z.L. and M.C.; formal analysis, Z.L. and M.C.; investigation, J.L. and Y.W.; resources, J.L. and Q.L.; data curation, Z.L. and M.C.; writing—original draft preparation, Z.L.; writing—review and editing, J.L. and Y.W.; visualization, Z.L. and Y.W.; supervision, J.L.; project administration, J.L. and Y.W.; funding acquisition, Q.L. All authors have read and agreed to the published version of the manuscript.
Funding
This work is supported in part by the Major Scientific and Technological Innovation Project of Shandong Province of China (2020CXGC010705, 2021ZLGX05).
Institutional Review Board Statement
Not applicable.
Informed Consent Statement
Not applicable.
Data Availability Statement
All data included in this study are available upon request by contact with the corresponding author.
Conflicts of Interest
The authors declare no conflict of interest.
References
- Zhang, K.; Shen, H. Multi-Stage Feature Enhancement Pyramid Network for Detecting Objects in Optical Remote Sensing Images. Remote Sens. 2022, 14, 579. [Google Scholar] [CrossRef]
- Yi, Y. Research on Ship Detection and Identification Algorithm in High-resolution Remote Sensing Images. Ph.D. Thesis, Shanghai Jiao Tong University, Shanghai, China, 2017. [Google Scholar]
- Wu, Q.; Shi, H.; Cao, X.; Guo, P. Study on Chinese Ocean Strategy Implementation Way from the Maintenance of Maritime Rights Perspective. Chin. Fish. Econ. 2017, 35, 47–53. [Google Scholar] [CrossRef]
- Liu, R. Research on Convolutional Neural Network Based Object Detection for Remote Sensing Image. Ph.D. Thesis, Harbin Institute of Technology, Harbin, China, 2017. [Google Scholar]
- Zhu, C.; Zhou, H.; Wang, R.; Guo, J. A Novel Hierarchical Method of Ship Detection from Spaceborne Optical Image Based on Shape and Texture Features. IEEE Trans. Geosci. Remote Sens. 2010, 48, 3446–3456. [Google Scholar] [CrossRef]
- Shuai, T.; Sun, K.; Wu, X.; Zhang, X.; Shi, B. A Ship Target Automatic Detection Method for High-resolution Remote Sensing. In Proceedings of the 36th IEEE International Geoscience and Remote Sensing Symposium, Beijing, China, 10–15 July 2016. [Google Scholar] [CrossRef]
- Xu, J.; Sun, X.; Fu, K. Shape-based Inshore Ships Detection. Foreign Electron. Meas. Technol. 2012, 31, 63–66. [Google Scholar] [CrossRef]
- Song, P.; Qi, L.; Qian, X.; Lu, X. Detection of Ships in Inland River Using High-resolution Optical Satellite Imagery Based on Mixture of Deformable Part Models. J. Parallel Distrib. Comput 2019, 132, 1–7. [Google Scholar] [CrossRef]
- Li, S.; Zhou, Z.; Wang, B.; Wu, F. A Novel Inshore Ship Detection via Ship Head Classification and Body Boundary Determi-nation. IEEE Geosci. Remote Sens. Lett. 2016, 13, 1920–1924. [Google Scholar] [CrossRef]
- Yang, F.; Xu, Q.; Li, B. Ship Detection from Optical Satellite Images Based on Saliency Segmentation and Structure-LBP Feature. IEEE Geosci. Remote Sens. Lett. 2017, 14, 3446–3456. [Google Scholar] [CrossRef]
- Cheng, G.; Zhou, P.; Han, J. Learning Rotation-Invariant Convolutional Neural Networks for Object Detection in VHR Optical Remote Sensing Images. IEEE Trans. Geosci. Remote Sensing. 2016, 54, 7405–7415. [Google Scholar] [CrossRef]
- Yang, X.; Sun, H.; Fu, K.; Yang, J.; Sun, X.; Yan, M.; Guo, Z. Automatic Ship Detection in Remote Sensing Images from Google Earth of Complex Scenes Based on Multiscale Rotation Dense Feature Pyramid Networks. Remote Sens. 2018, 10, 132. [Google Scholar] [CrossRef]
- Chen, L.; Shi, W.; Deng, D. Improved YOLOv3 Based on Attention Mechanism for Fast and Accurate Ship Detection in Optical Remote Sensing Images. Remote Sens. 2021, 13, 660. [Google Scholar] [CrossRef]
- Zhang, S.; Wu, R.; Xu, K.; Wang, J.; Sun, W. R-CNN-Based Ship Detection from High Resolution Remote Sensing Imagery. Remote Sens. 2019, 11, 631. [Google Scholar] [CrossRef]
- Sun, X.; Wang, P.; Yan, Z.; Xu, F.; Wang, R.; Diao, W.; Chen, J.; Li, J.; Feng, Y.; Xu, T. FAIR1M: A Benchmark Dataset for Fine-grained Object Recognition in High-Resolution Remote Sensing Imagery. ISPRS-J. Photogramm. Remote Sens. 2022, 184, 116–130. [Google Scholar] [CrossRef]
- Zhang, Y. Researh on Intelligent Detection and Recognition Methods of Ship Targets on the Sea Surface in Optical Images. Ph.D. Thesis, University of Chines Academy of Sciences, Beijing, China, 2021. [Google Scholar] [CrossRef]
- He, K.; Sun, J.; Tang, X. Single Image Haze Removal Using Dark Channel Prior. IEEE Trans. Pattern Anal. Mach. Intell. 2011, 33, 2341–2353. [Google Scholar] [CrossRef] [PubMed]
- Shen, Y.; Liu, D.; Zhang, F.; Zhang, Q. Fast and Accurate Multi-class Geospatial Object Detection with Large-size Remote Sensing Imagery Using CNN and Truncated NMS. ISPRS-J. Photogramm. Remote Sens. 2022, 191, 235–249. [Google Scholar] [CrossRef]
- Van Etten, A. You Only Look Twice: Rapid Multi-Scale Object Detection In Satellite Imagery. arXiv 2018, arXiv:1805.09512. [Google Scholar]
- Yang, X.; Yan, J.; Feng, Z.; He, T. R3Det: Refined Single-Stage Detector with Feature Refinement for Rotating Object. arXiv 2019, arXiv:1908.05612. [Google Scholar] [CrossRef]
- Lin, T.; Goyal, P.; Girshick, R.; He, K.; Dollar, P. Focal Loss for Dense Object Detection. In Proceedings of the 16th IEEE International Conference on Computer Vision, Venice, Italy, 22–20 October 2017. [Google Scholar] [CrossRef]
- Bian, W.; Qiu, X.; Shen, Y. A Target Recognition Method Based on Neural Network Structure. J. Air Force Eng. Univ. Nat. Sci. Ed. 2020, 11, 88–92. [Google Scholar] [CrossRef]
- Wang, N.; Gao, Y.; Chen, H.; Wang, P.; Tian, Z.; Shen, C.; Zhang, Y. NAS-FCOS: Fast Neural Architecture Search for Object Detection. arXiv 2019, arXiv:1906.04423. [Google Scholar]
- Baffour, A.A.; Qin, Z.; Wang, Y.; Qin, Z.; Choo, K.K. Spatial Self-attention Network with Self-attention Distillation for Fine-grained Image Recognition. J. Vis. Commun. Image Represent. 2021, 81, 103368. [Google Scholar] [CrossRef]
- Hua, X.; Wang, X.; Rui, T.; Zhang, H.; Wang, D. A Fast Self-attention Cascaded Network for Object Detection in Large Scene Remote Sensing Images. Appl. Soft. Comput. 2020, 94, 106495. [Google Scholar] [CrossRef]
- Wang, Q.; Wu, B.; Zhu, P.; Li, P.; Zuo, W.; Hu, Q. ECA-Net: Efficient Channel Attention for Deep Convolutional Neural Networks. In Proceedings of the 2020 IEEE/CVF Conference on Computer Vision and Pattern Recognition, Seattle, WA, USA, 13–19 June 2020. [Google Scholar] [CrossRef]
- Zuo, Z.; Tong, X.; Wei, J.; Su, S.; Wu, P.; Guo, R.; Sun, B. AFFPN: Attention Fusion Feature Pyramid Network for Small Infrared Target Detection. Remote Sens. 2022, 14, 3412. [Google Scholar] [CrossRef]
- Zhou, Q. Researh on Ship Detection Technology in Marine Optical Remote Sensing Images. Master’s Thesis, University of Chines Academy of Sciences, Beijing, China, 2021. [Google Scholar] [CrossRef]
- Cao, J.; Chen, Q.; Guo, J.; Shi, R. Attention-guided Context Feature Pyramid Network for Object Detection. arXiv 2020, arXiv:2005.11475. [Google Scholar]
- Tong, K.; Wu, Y. Deep Learning-based Detection from the Perspective of Small or Tiny objects: A Survey. Image Vis. Comput. 2022, 123, 104471. [Google Scholar] [CrossRef]
- Dai, J.; Qi, H.; Xiong, Y.; Li, Y.; Zhang, G.; Hu, H.; Wei, Y. Deformable Convolutional Networks. In Proceedings of the 2017 IEEE International Conference on Computer Vision, Venice, Italy, 22–29 October 2017. [Google Scholar] [CrossRef]
- Huang, Z.; Xiang, T.; Chen, H.; Dai, H. Scribble-based Boundary-aware Network for Weakly Supervised Salient Object Detection in Remote Sensing Images. ISPRS-J. Photogramm. Remote Sens. 2022, 191, 290–301. [Google Scholar] [CrossRef]
- Yu, F.; Koltun, V. Multi-Scale Context Aggregation by Dilated Convolutions. arXiv 2015, arXiv:1511.07122. [Google Scholar]
- You, G.; Shiue, Y.; Su, C.; Huang, Q. Enhancing Ensemble Diversity Based on Multiscale Dilated Convolution in Image Classification. Inf. Sci. 2022, 606, 292–312. [Google Scholar] [CrossRef]
- Kang, M.; Ji, K.; Leng, X.; Lin, Z. Contextual Region-Based Convolutional Neural Network with Multilayer Fusion for SAR Ship Detection. Remote Sens. 2017, 9, 860. [Google Scholar] [CrossRef]
- Jiang, Y.; Zhu, X.; Wang, X.; Yang, S.; Li, W.; Wang, H.; Fu, P.; Luo, Z. R2CNN: Rotational Region CNN for Orientation Robust Scene Text Detection. arXiv 2017, arXiv:1706.09579. [Google Scholar]
- Redmon, J.; Farhahi, A. YOLOv3: An Incremental Improvement. arXiv 2018, arXiv:1804.02767. [Google Scholar]
- Liu, W.; Anguelov, D.; Erhan, D.; Szegedy, C.; Reed, S.; Fu, C.Y.; Berg, A.C. SSD: Single Shot MultiBox Detector. arXiv 2015, arXiv:1512.02325. [Google Scholar]
- Girshick, R. Fast R-CNN. arXiv 2015, arXiv:1504.08083. [Google Scholar]
- Zha, J.; Chen, H.; Bai, C.; Ren, C. Sea-Land Segmentation of Remote Sensing Image Based on Spatial Constraint Model Superpixel Method. In Proceedings of the 2021 IEEE International Geoscience and Remote Sensing Symposium IGARSS, Brussels, Belgium, 11–16 July 2021. [Google Scholar] [CrossRef]
Figure 1.
Class 9 ship targets in FAIR1M: (a) passenger ship (Ps); (b) motorboat (Mb); (c) fishing boat (Fb); (d) tugboat (Tb); (e) engineering ship (Es); (f) liquid cargo ship (Lc); (g) dry cargo ship (Dc); (h) war ship (Ws); (i) other ship (Os).
Figure 1.
Class 9 ship targets in FAIR1M: (a) passenger ship (Ps); (b) motorboat (Mb); (c) fishing boat (Fb); (d) tugboat (Tb); (e) engineering ship (Es); (f) liquid cargo ship (Lc); (g) dry cargo ship (Dc); (h) war ship (Ws); (i) other ship (Os).
Figure 2.
Atmospheric correction process based on dark channel prior theory.
Figure 2.
Atmospheric correction process based on dark channel prior theory.
Figure 3.
Images before and after atmospheric correction: (a) images before correction; (b) corrected images.
Figure 3.
Images before and after atmospheric correction: (a) images before correction; (b) corrected images.
Figure 4.
R3Det model structure.
Figure 4.
R3Det model structure.
Figure 6.
Problems and improved methods of ship detection based on R3Det.
Figure 6.
Problems and improved methods of ship detection based on R3Det.
Figure 7.
Structure of improved R3Det model.
Figure 7.
Structure of improved R3Det model.
Figure 8.
NAS FPN fusion process.
Figure 8.
NAS FPN fusion process.
Figure 9.
ECA module structure.
Figure 9.
ECA module structure.
Figure 10.
COT module structure.
Figure 10.
COT module structure.
Figure 11.
Various convolution receptive fields: (a) receptive field of common convolution; (b) receptive field of deformation convolution; (c) receptive field of dilated convolution.
Figure 11.
Various convolution receptive fields: (a) receptive field of common convolution; (b) receptive field of deformation convolution; (c) receptive field of dilated convolution.
Figure 12.
Algorithm flow of k-means clustering anchors.
Figure 12.
Algorithm flow of k-means clustering anchors.
Figure 13.
Display of test results before and after model improvement—small target missed detection improvement.
Figure 13.
Display of test results before and after model improvement—small target missed detection improvement.
Figure 14.
Display of test results before and after model improvement—inaccurate positioning improvement.
Figure 14.
Display of test results before and after model improvement—inaccurate positioning improvement.
Figure 15.
Model detection effect before and after replacing with NAS FPN.
Figure 15.
Model detection effect before and after replacing with NAS FPN.
Figure 16.
Detection effect of model before and after adding ECA.
Figure 16.
Detection effect of model before and after adding ECA.
Figure 17.
Detection effect of model before and after adding COT.
Figure 17.
Detection effect of model before and after adding COT.
Figure 18.
Improved model detection effect.
Figure 18.
Improved model detection effect.
Table 1.
Number of ships in training set and test set.
Table 1.
Number of ships in training set and test set.
| Category | Ps | Mb | Fb | Tb | Es | Lc | Dc | Ws | Os |
|---|
| Training Set | 792 | 7434 | 4791 | 1472 | 1485 | 3428 | 10627 | 761 | 2314 |
| Testing Set | 121 | 1393 | 1061 | 250 | 300 | 602 | 1962 | 101 | 601 |
Table 2.
Clustering results of data.
Table 2.
Clustering results of data.
| Cluster Center | Aspect Ratio | IoU |
|---|
| 2 | (1.11 1.15) | 44.8 |
| 3 | (1.06 1.11 1.12) | 50.2 |
| 4 | (0.92 1.0 1.11 1.23) | 53.8 |
| 5 | (0.63 1.05 1.08 1.15 2.49) | 56.7 |
Table 3.
Test results of improved ablation experiments.
Table 3.
Test results of improved ablation experiments.
| | R3Det | NAS
FPN | ECA | Improve
Anchor | Atmospheric Correction | COT | Mb
(AP) | Fb
(AP) | Os
(AP) | mAP |
|---|
| 1 | √ 1 | | | | | | 0.341 | 0.308 | 0.166 | 0.535 |
| 2 | √ | √ | | | | | 0.394 | 0.401 | 0.222 | 0.586 |
| 3 | √ | √ | √ | √ | | | 0.527 | 0.497 | 0.301 | 0.621 |
| 4 | √ | √ | √ | √ | √ | | 0.546 | 0.522 | 0.382 | 0.651 |
| 5 | √ | √ | √ | √ | √ | √ | 0.648 | 0.547 | 0.402 | 0.661 |
Table 4.
AP values of various targets detected in experiment four.
Table 4.
AP values of various targets detected in experiment four.
| Category | Ps | Mb | Fb | Tb | Es | Lc | Dc | Ws | Os | mAP |
|---|
| First | 0.680 | 0.546 | 0.522 | 0.715 | 0.720 | 0.769 | 0.769 | 0.754 | 0.382 | 0.651 |
| Second | 0.646 | 0.549 | 0.518 | 0.725 | 0.734 | 0.772 | 0.763 | 0.721 | 0.356 | 0.643 |
| Third | 0.647 | 0.555 | 0.515 | 0.727 | 0.735 | 0.761 | 0.763 | 0.724 | 0.367 | 0.644 |
Mean
value | 0.658 | 0.550 | 0.518 | 0.722 | 0.730 | 0.767 | 0.765 | 0.733 | 0.368 | 0.646 |
| Standard deviation | 0.016 | 0.004 | 0.003 | 0.005 | 0.007 | 0.005 | 0.003 | 0.015 | 0.011 | 0.004 |
Table 5.
AP values of various targets detected in experiment five.
Table 5.
AP values of various targets detected in experiment five.
| Category | Ps | Mb | Fb | Tb | Es | Lc | Dc | Ws | Os | mAP |
|---|
| First | 0.640 | 0.648 | 0.547 | 0.728 | 0.742 | 0.771 | 0.771 | 0.703 | 0.402 | 0.661 |
| Second | 0.671 | 0.633 | 0.526 | 0.727 | 0.734 | 0.775 | 0.769 | 0.743 | 0.393 | 0.664 |
| Third | 0.697 | 0.650 | 0.525 | 0.710 | 0.743 | 0.774 | 0.772 | 0.742 | 0.405 | 0.669 |
Mean
value | 0.669 | 0.644 | 0.533 | 0.722 | 0.740 | 0.773 | 0.771 | 0.729 | 0.400 | 0.665 |
| Standard deviation | 0.023 | 0.008 | 0.010 | 0.008 | 0.004 | 0.002 | 0.001 | 0.019 | 0.005 | 0.003 |
Table 6.
AP values of various targets detected using different deformation convolution sizes.
Table 6.
AP values of various targets detected using different deformation convolution sizes.
| Category | Ps | Mb | Fb | Tb | Es | Lc | Dc | Ws | Os | mAP |
|---|
| 3 × 3 | 0.669 | 0.644 | 0.533 | 0.722 | 0.740 | 0.773 | 0.771 | 0.729 | 0.400 | 0.665 |
| 5 × 5 | 0.630 | 0.630 | 0.533 | 0.730 | 0.753 | 0.776 | 0.767 | 0.736 | 0.363 | 0.658 |
Table 7.
AP values of various targets detected in the model before and after improvement.
Table 7.
AP values of various targets detected in the model before and after improvement.
| Category | Ps | Mb | Fb | Tb | Es | Lc | Dc | Ws | Os |
|---|
| Before | 0.522 | 0.341 | 0.308 | 0.568 | 0.677 | 0.727 | 0.718 | 0.785 | 0.166 |
| After | 0.669 | 0.644 | 0.533 | 0.722 | 0.740 | 0.773 | 0.771 | 0.729 | 0.400 |
Table 8.
AP values of various targets detected in some models.
Table 8.
AP values of various targets detected in some models.
| Category | Ps | Mb | Fb | Tb | Es | Lc | Dc | Ws | Os | mAP |
|---|
| R-Fast Rcnn [36] | 0.54 | 0.43 | 0.34 | 0.58 | 0.71 | 0.73 | 0.65 | 0.50 | 0.21 | 0.52 |
| Yolov3 [37] | 0.45 | 0.59 | 0.59 | 0.51 | 0.68 | 0.84 | 0.83 | 0.79 | 0.15 | 0.60 |
| SSD [38] | 0.39 | 0.10 | 0.18 | 0.25 | 0.52 | 0.80 | 0.68 | 0.71 | 0.05 | 0.41 |
| Fast Rcnn [39] | 0.41 | 0.09 | 0.18 | 0.17 | 0.60 | 0.82 | 0.67 | 0.68 | 0.05 | 0.41 |
| Our model | 0.67 | 0.64 | 0.53 | 0.72 | 0.74 | 0.77 | 0.77 | 0.73 | 0.40 | 0.66 |
| Publisher’s Note: MDPI stays neutral with regard to jurisdictional claims in published maps and institutional affiliations. |
© 2022 by the authors. Licensee MDPI, Basel, Switzerland. This article is an open access article distributed under the terms and conditions of the Creative Commons Attribution (CC BY) license (https://creativecommons.org/licenses/by/4.0/).
