

Updating Inventory, Deformation, and Development Characteristics of Landslides in Hunza Valley, NW Karakoram, Pakistan by SBAS-InSAR

 ,
, 
 ,
,  , and
, and 
Abstract
1. Introduction
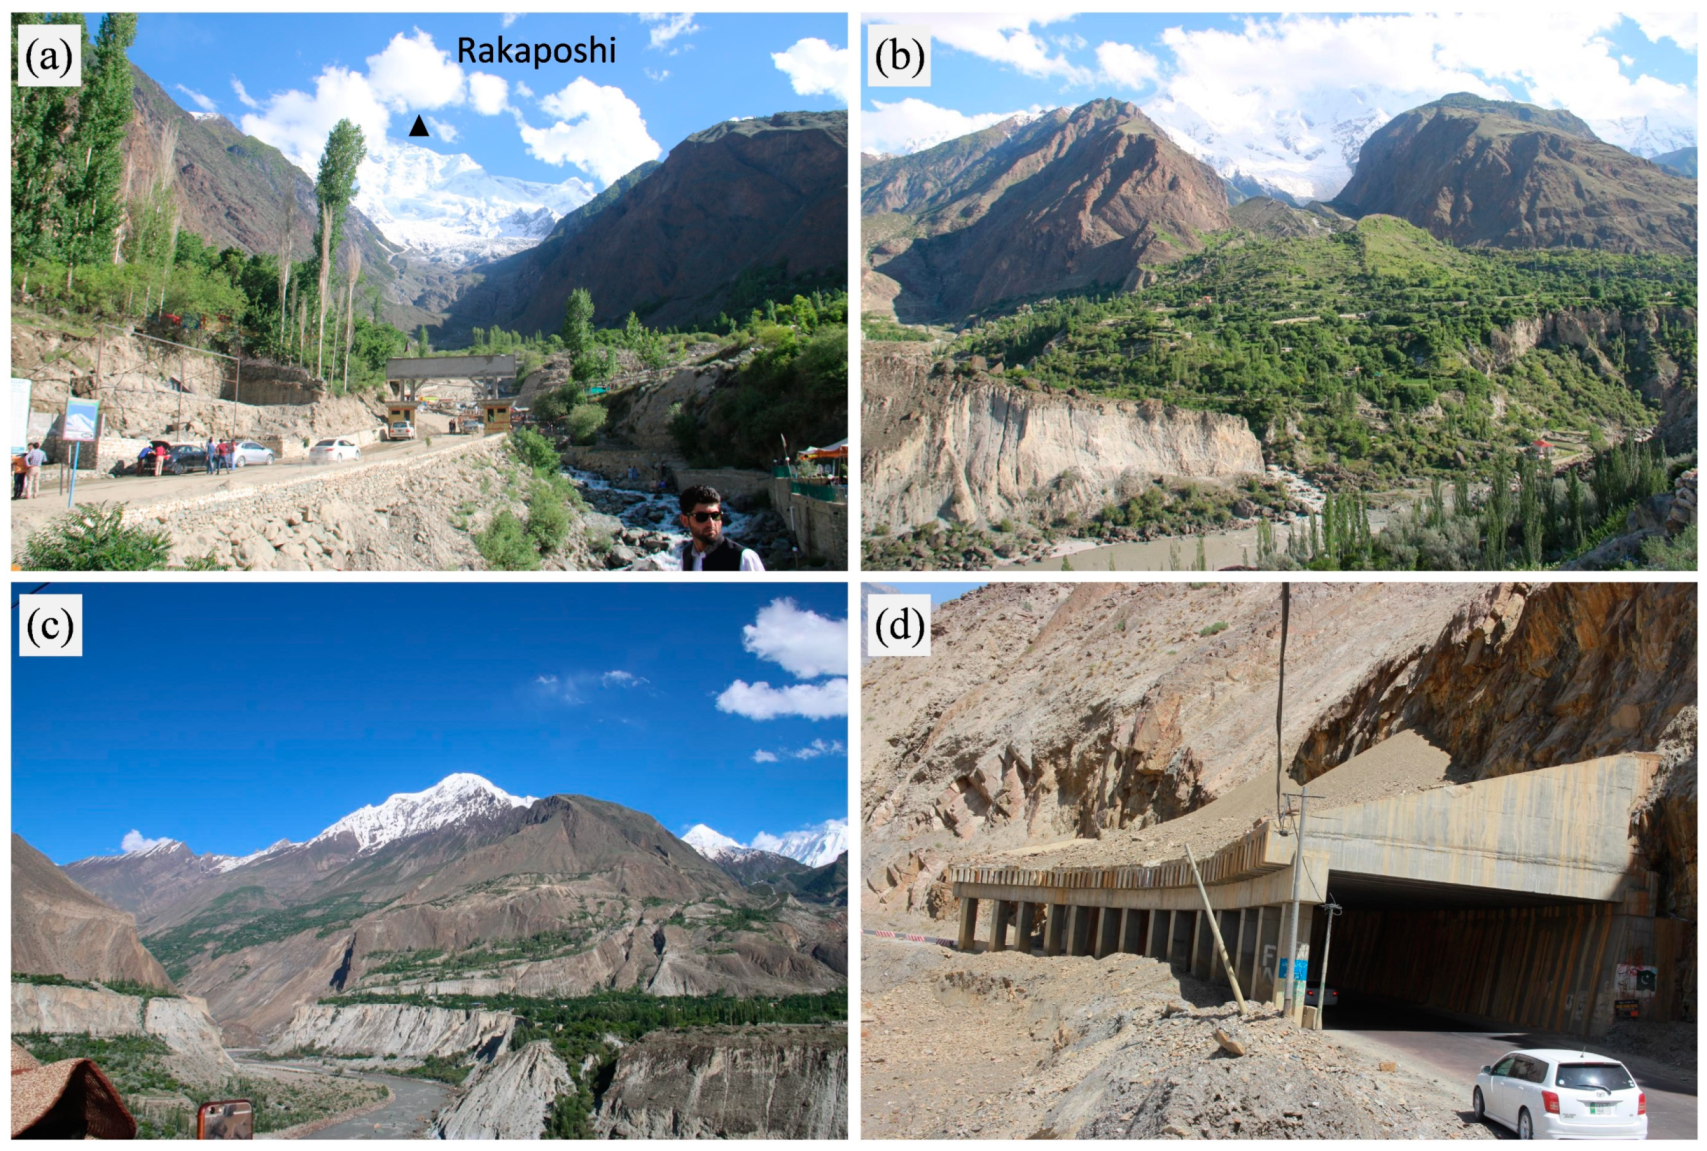
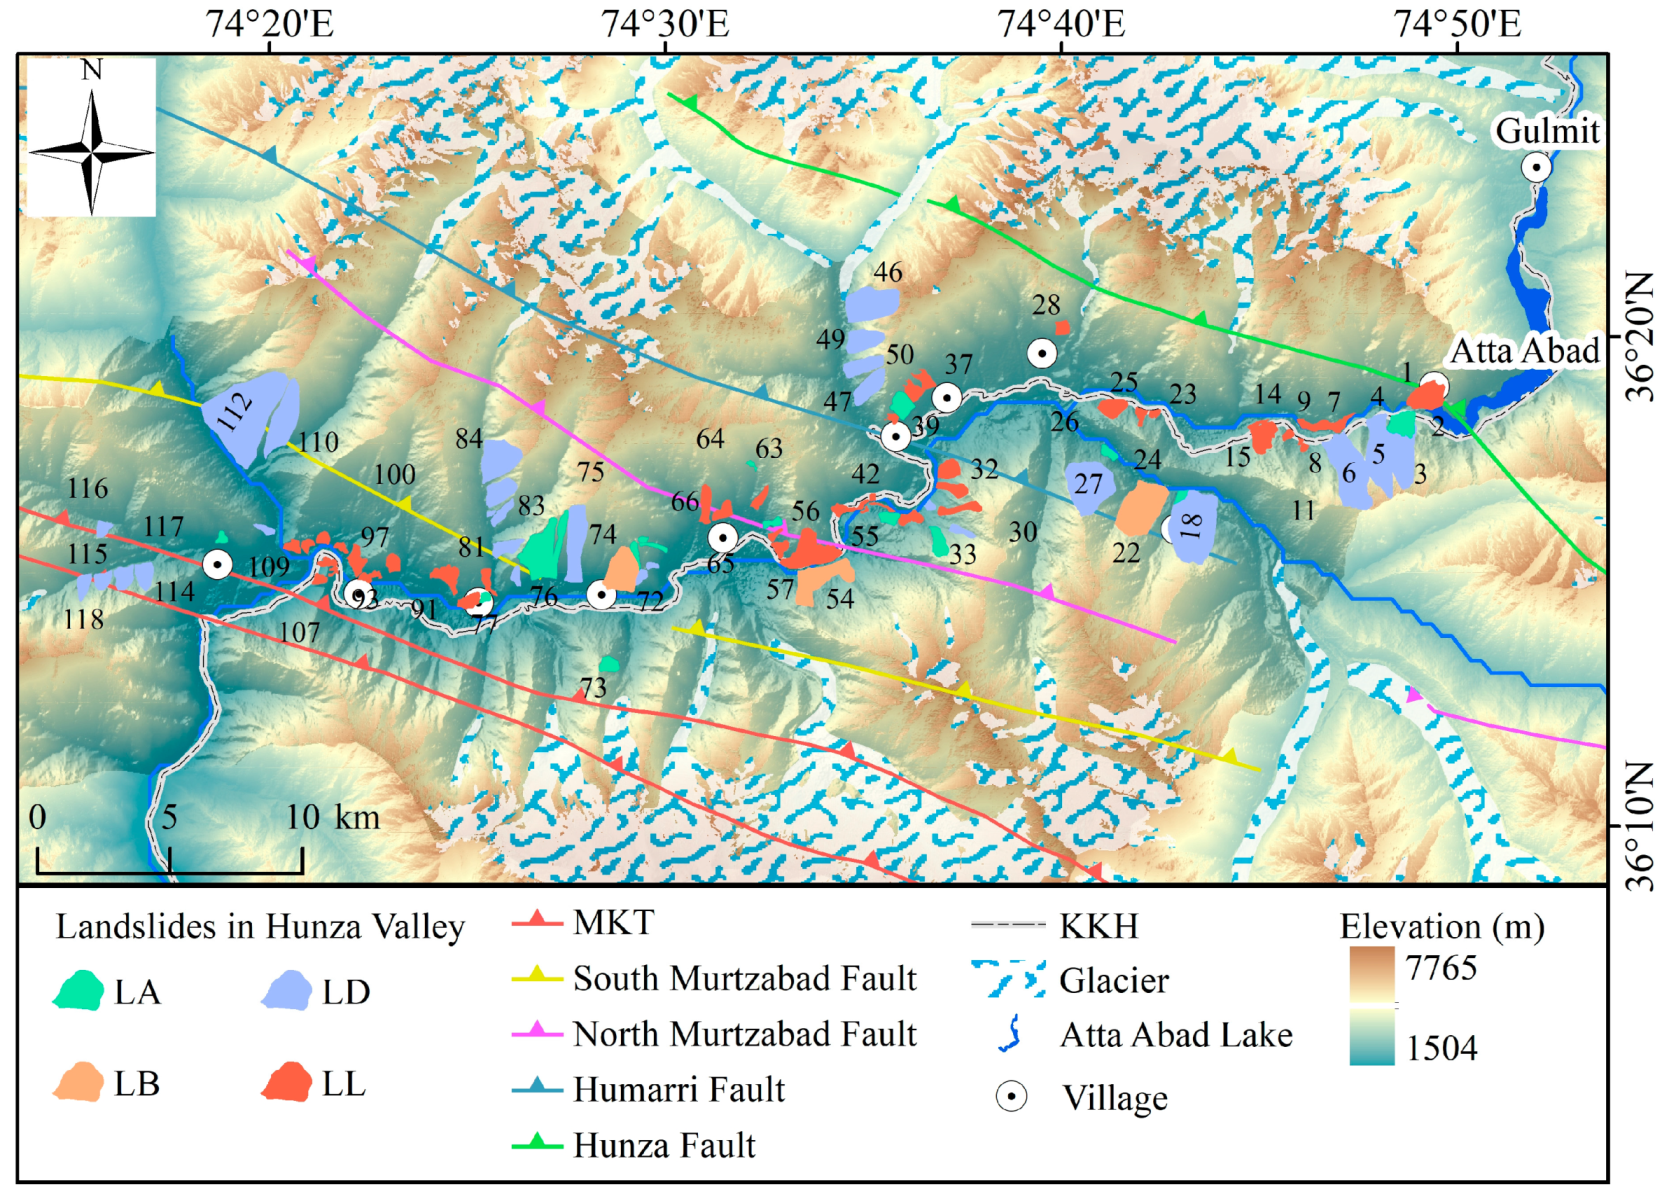
2. Study Area
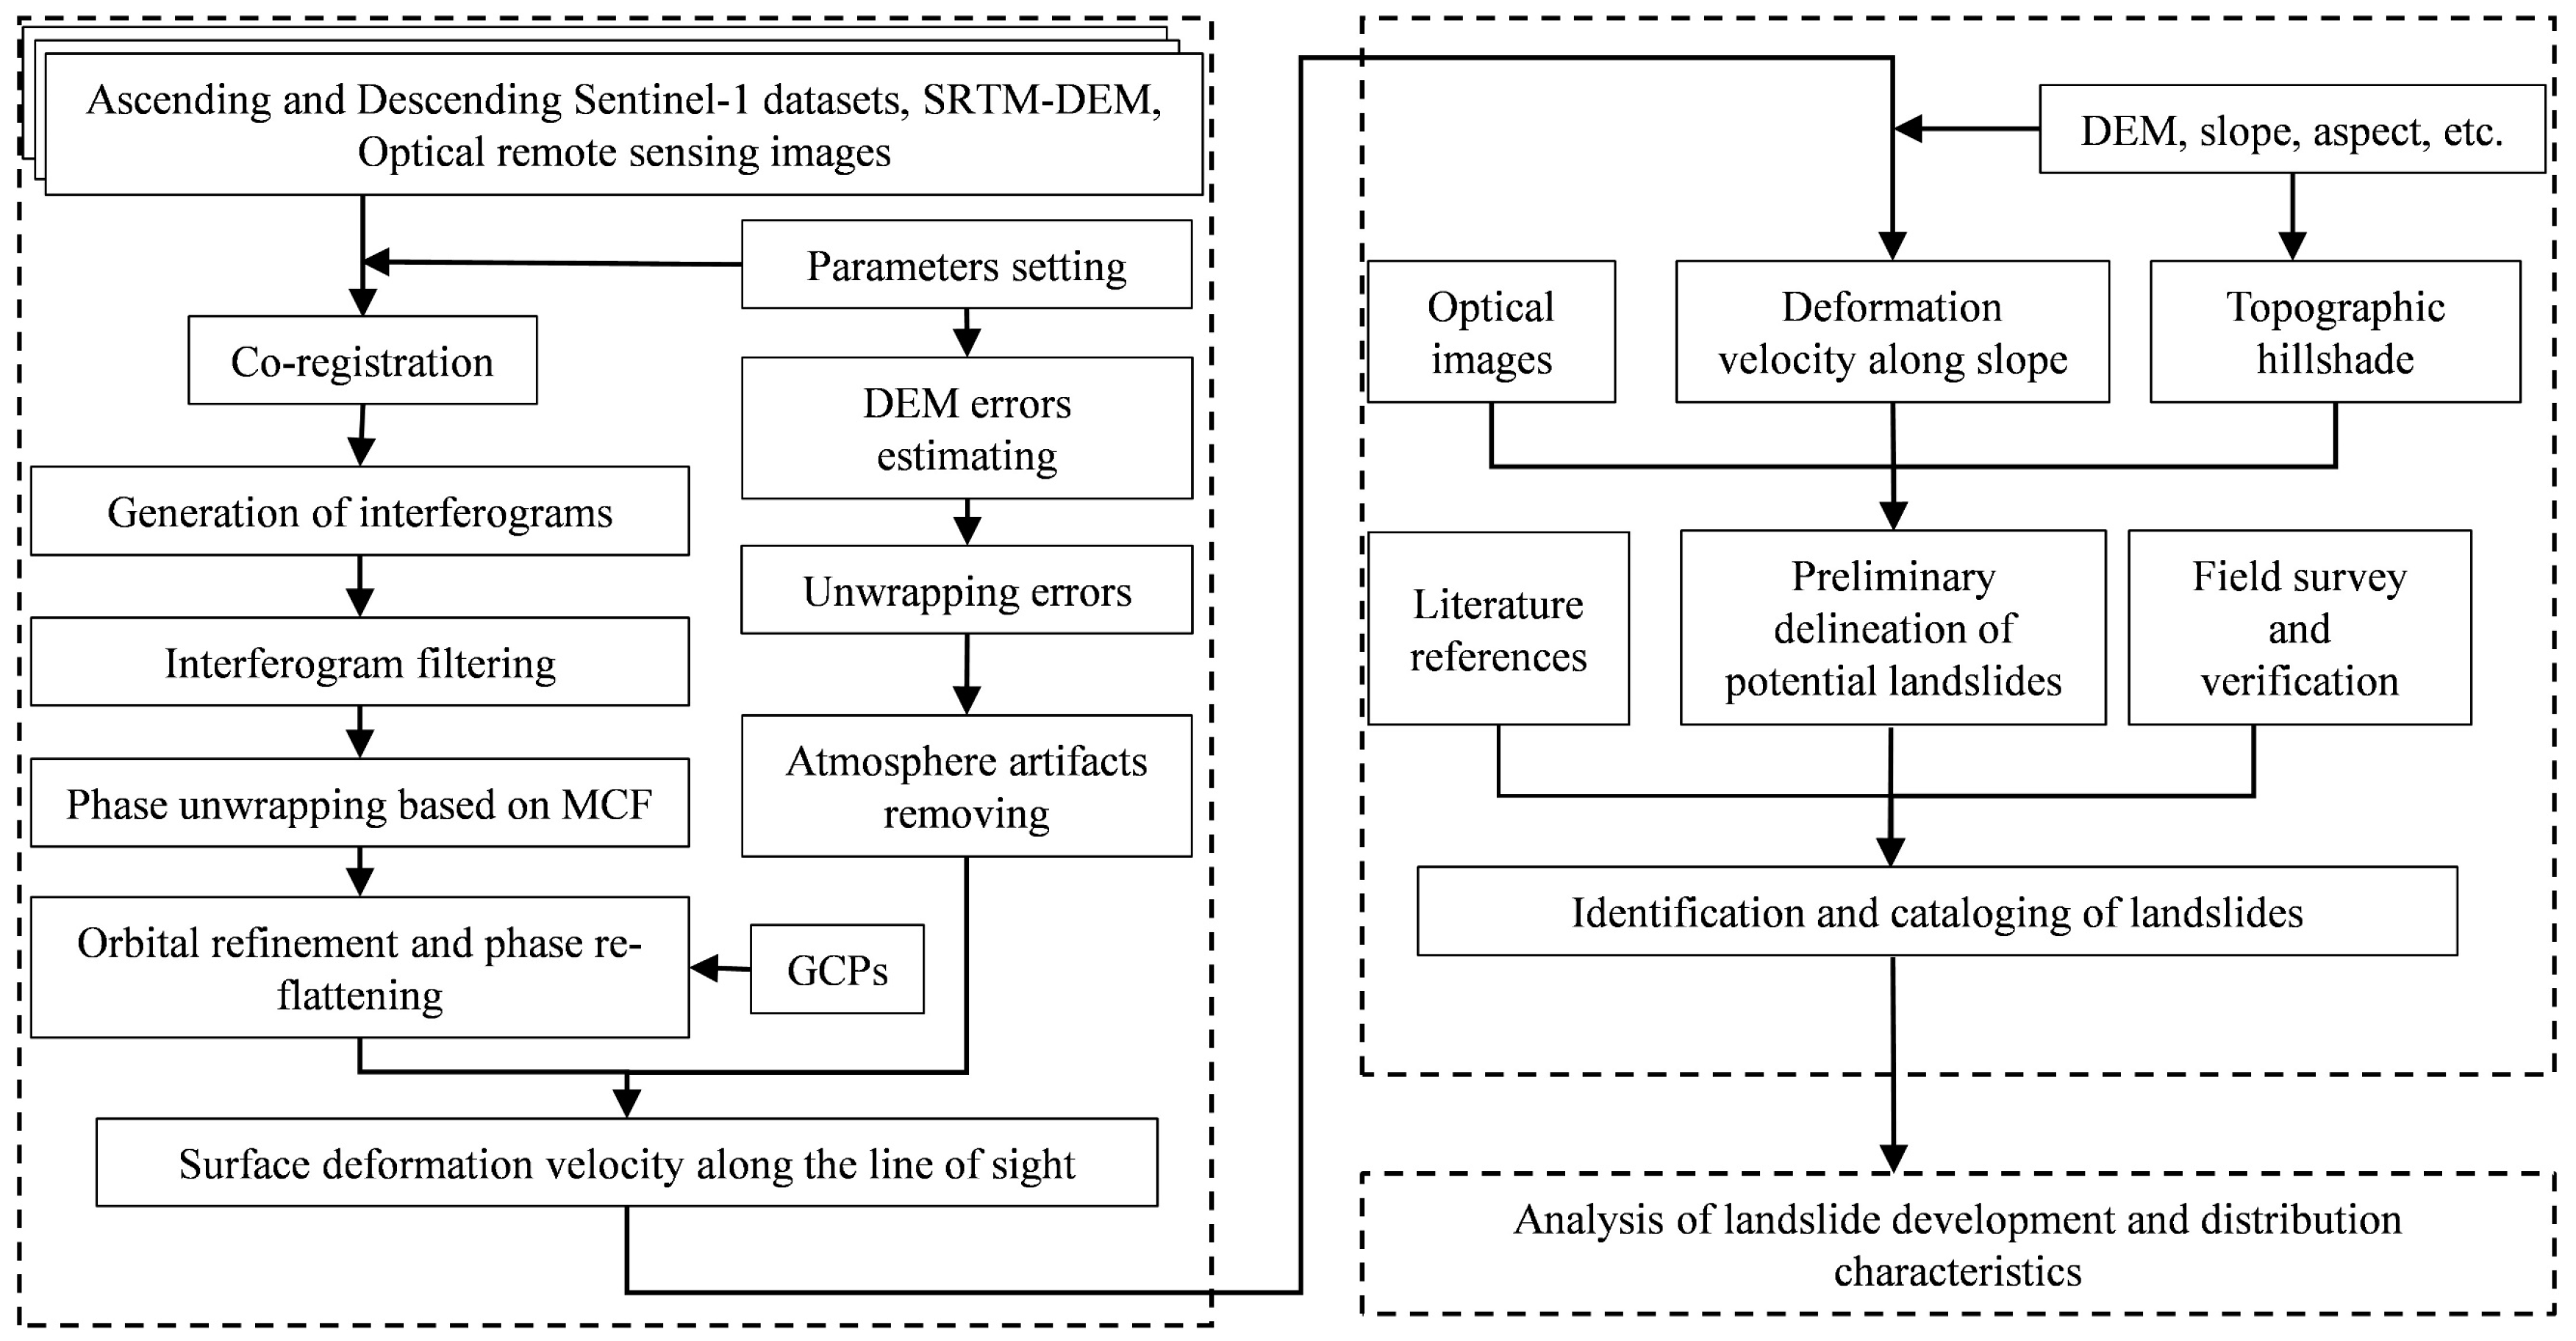
3. Methodologies and Datasets
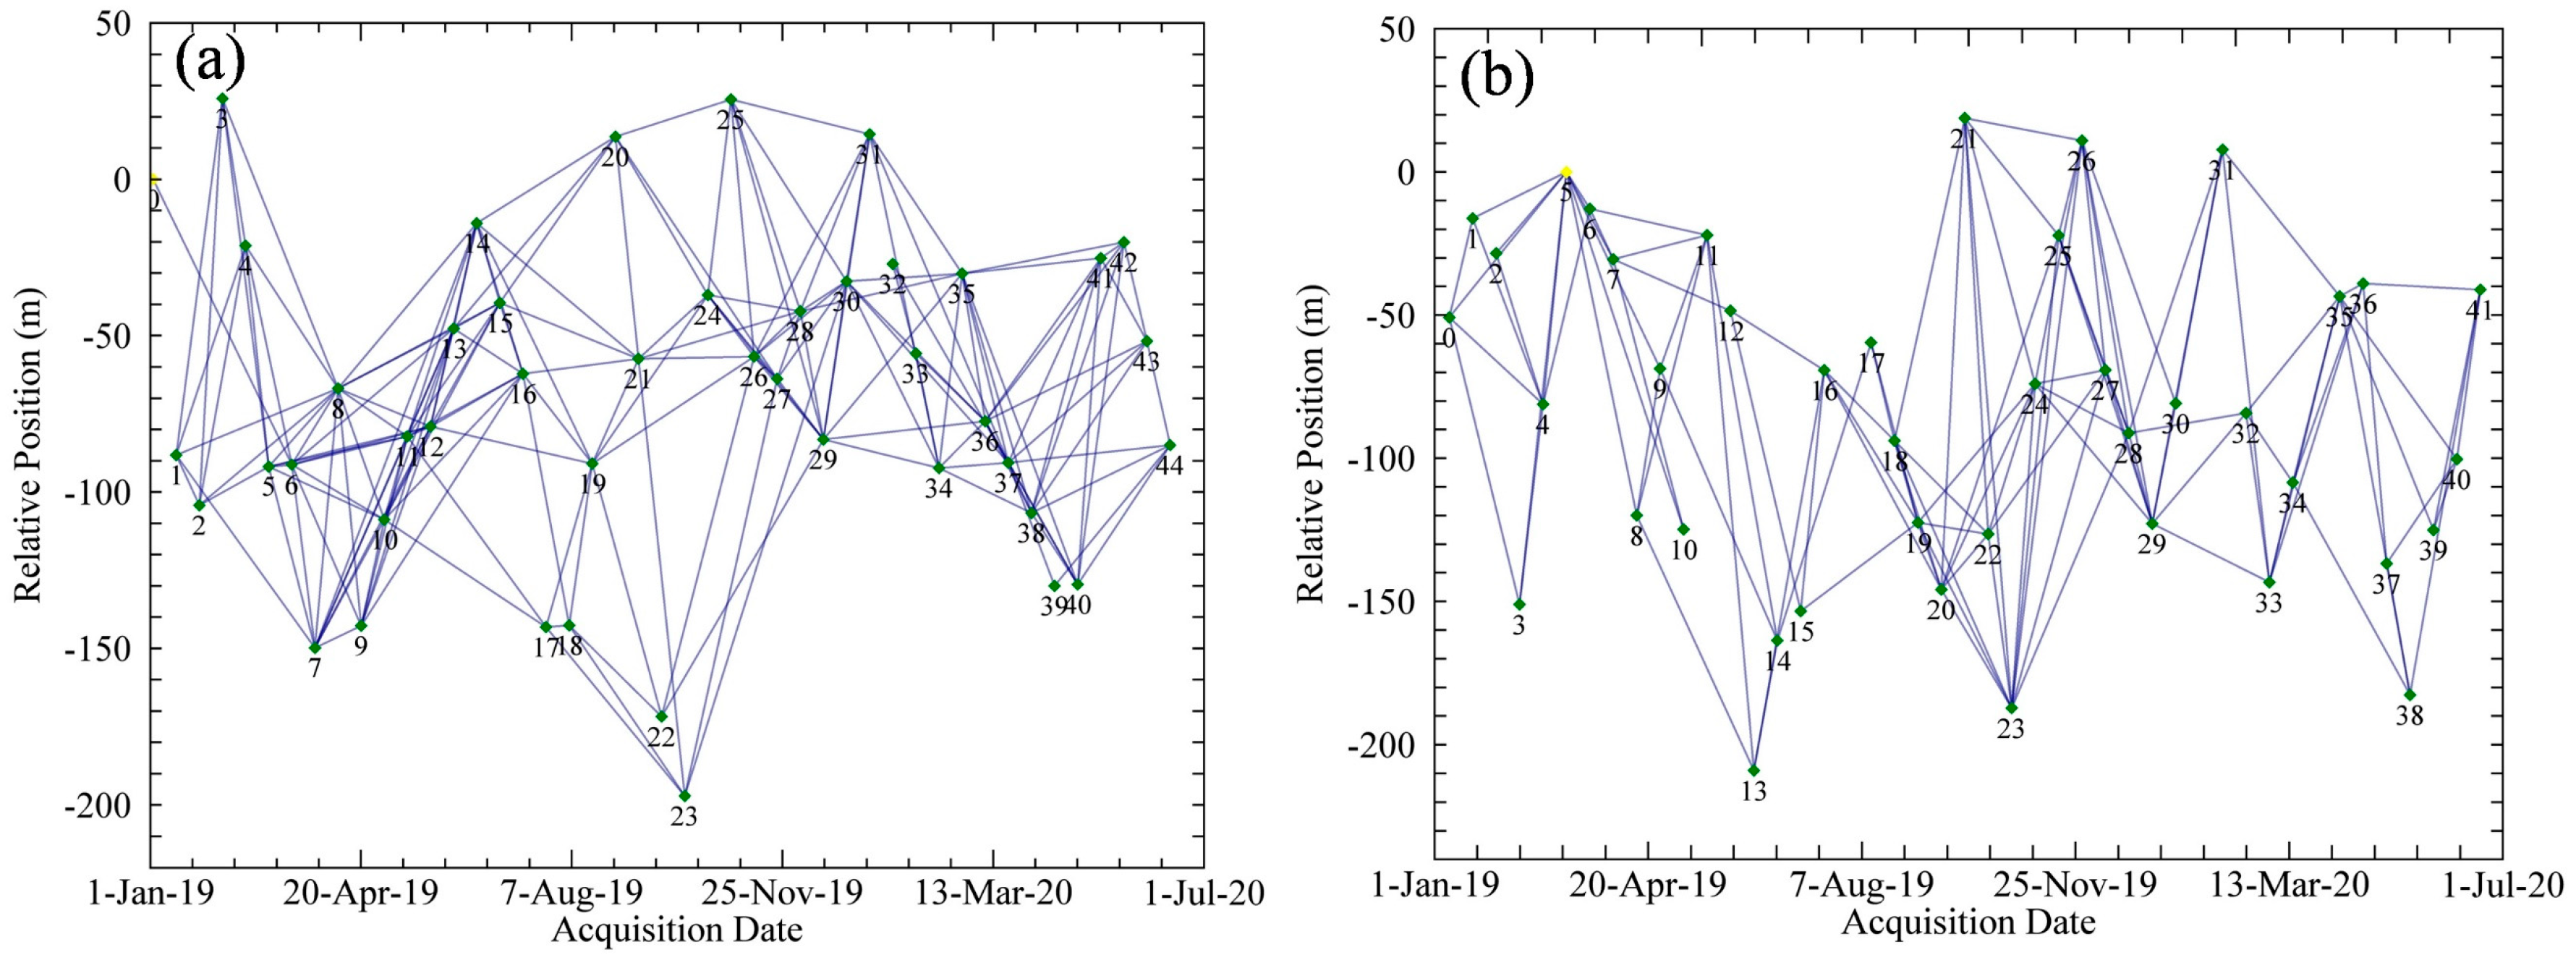
3.1. SBAS-InSAR Techniques and SAR Data
3.2. Interpretation of Displacement Velocity and Landslides Inventory
3.3. Analysis of the Landslides’ Development Characteristics
4. Results and Analysis
4.1. Ground Surface Deformations and Landslides Inventory in Hunza Valley
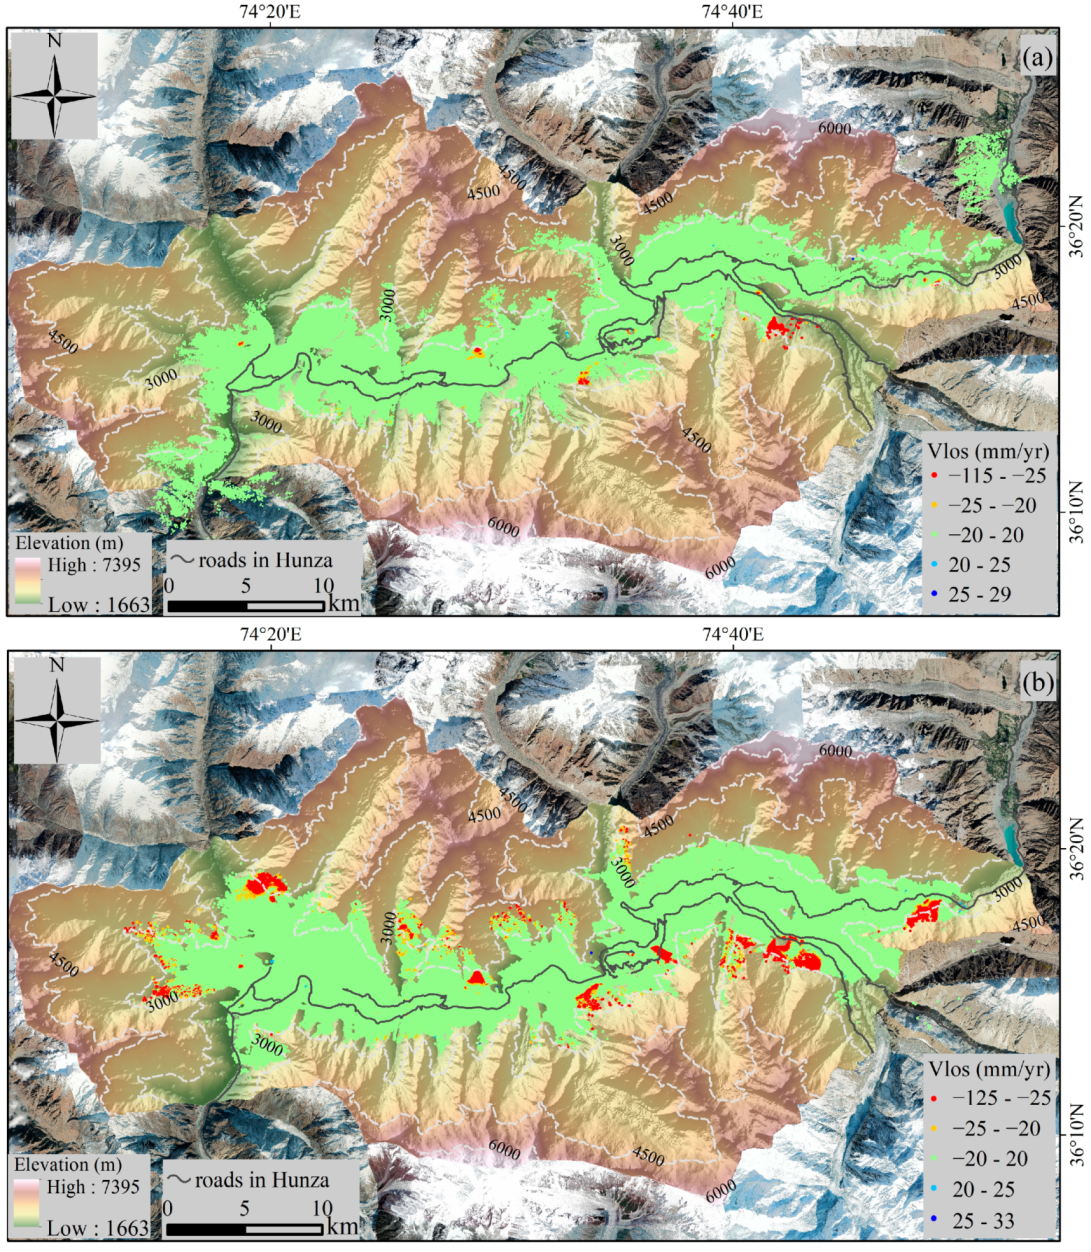
4.1.1. Displacement Velocity along the Line of Sight
4.1.2. Displacement Velocity along the Direction of Slope
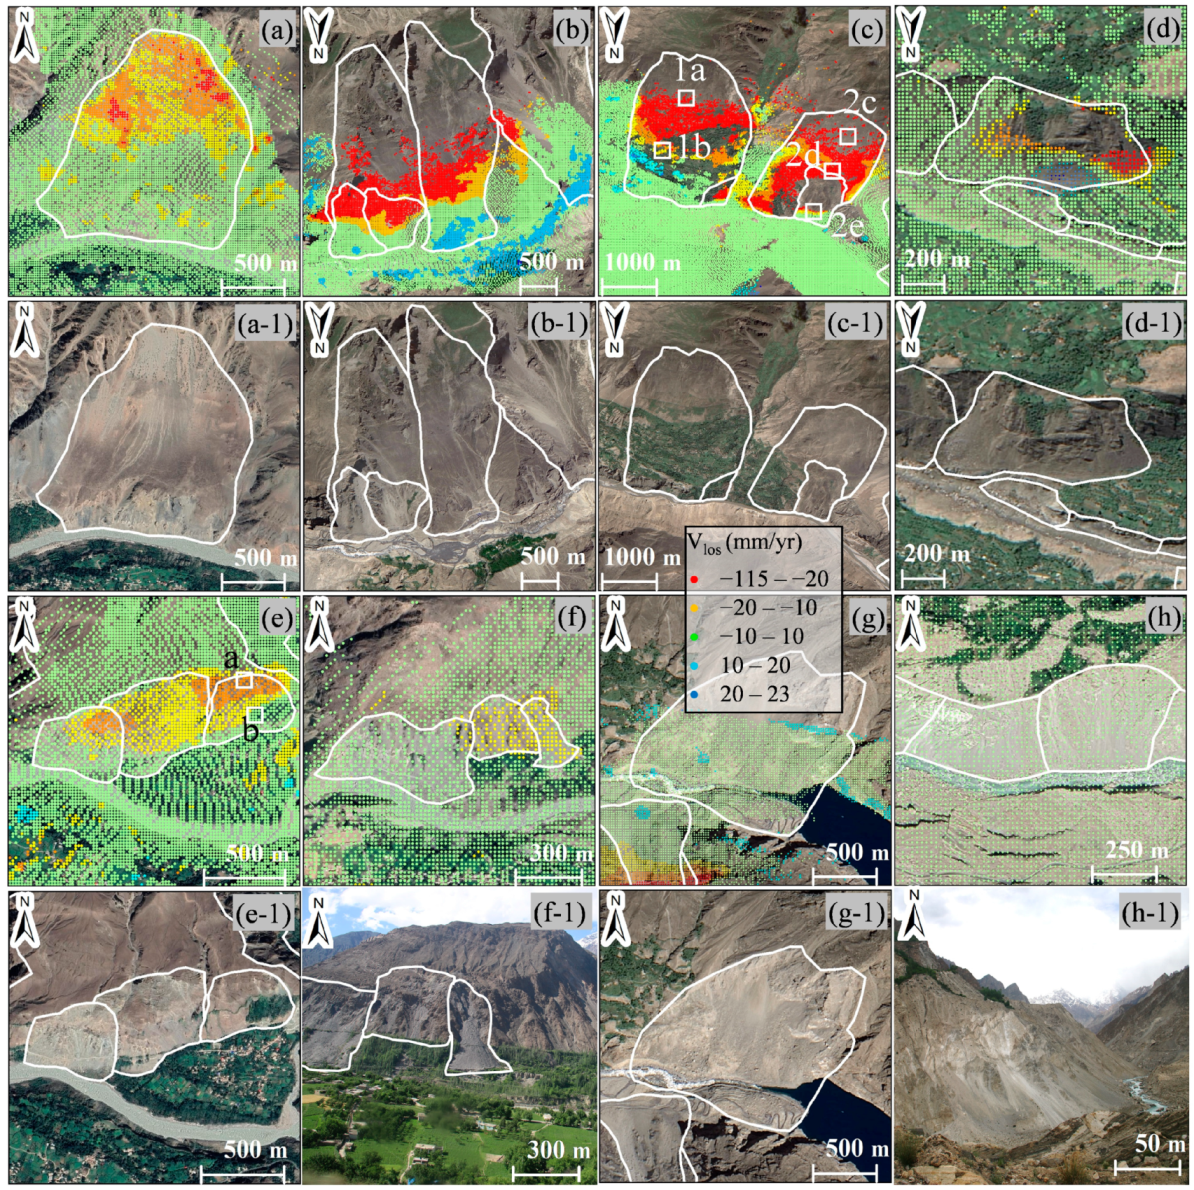
4.1.3. Landslides Inventory
4.2. Spatiotemporal Characteristics of Landslides in Hunza Valley
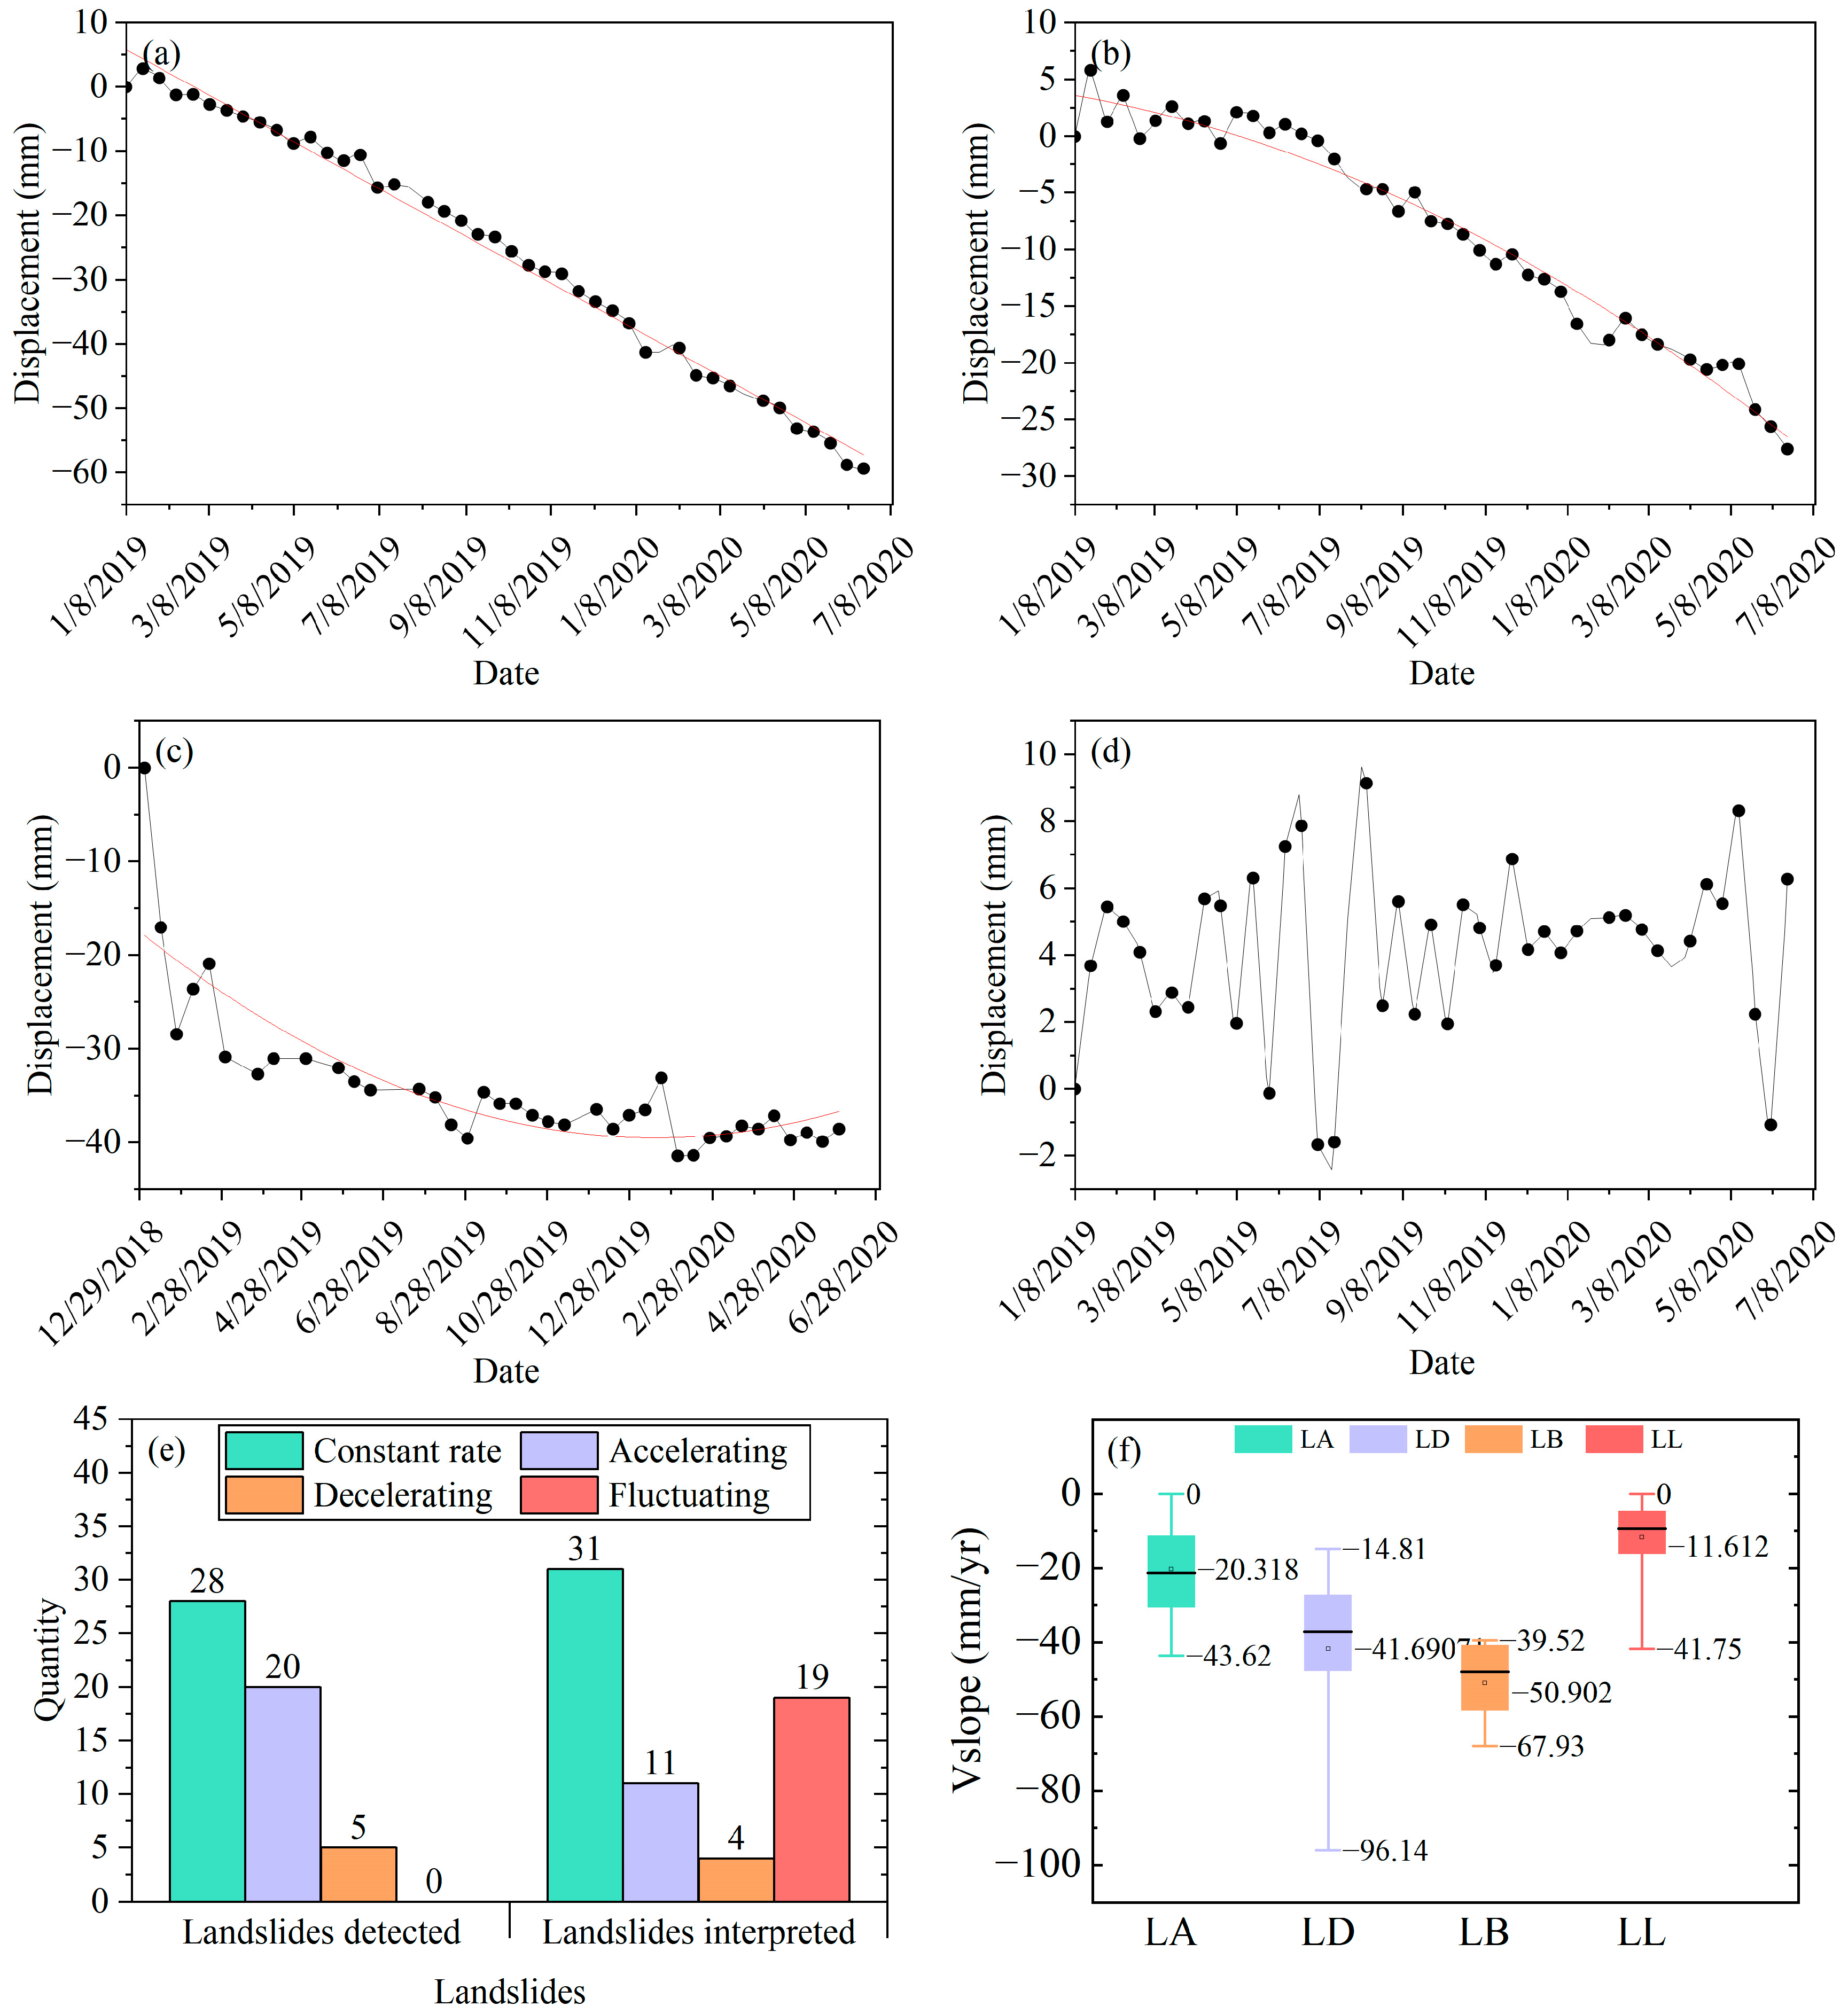
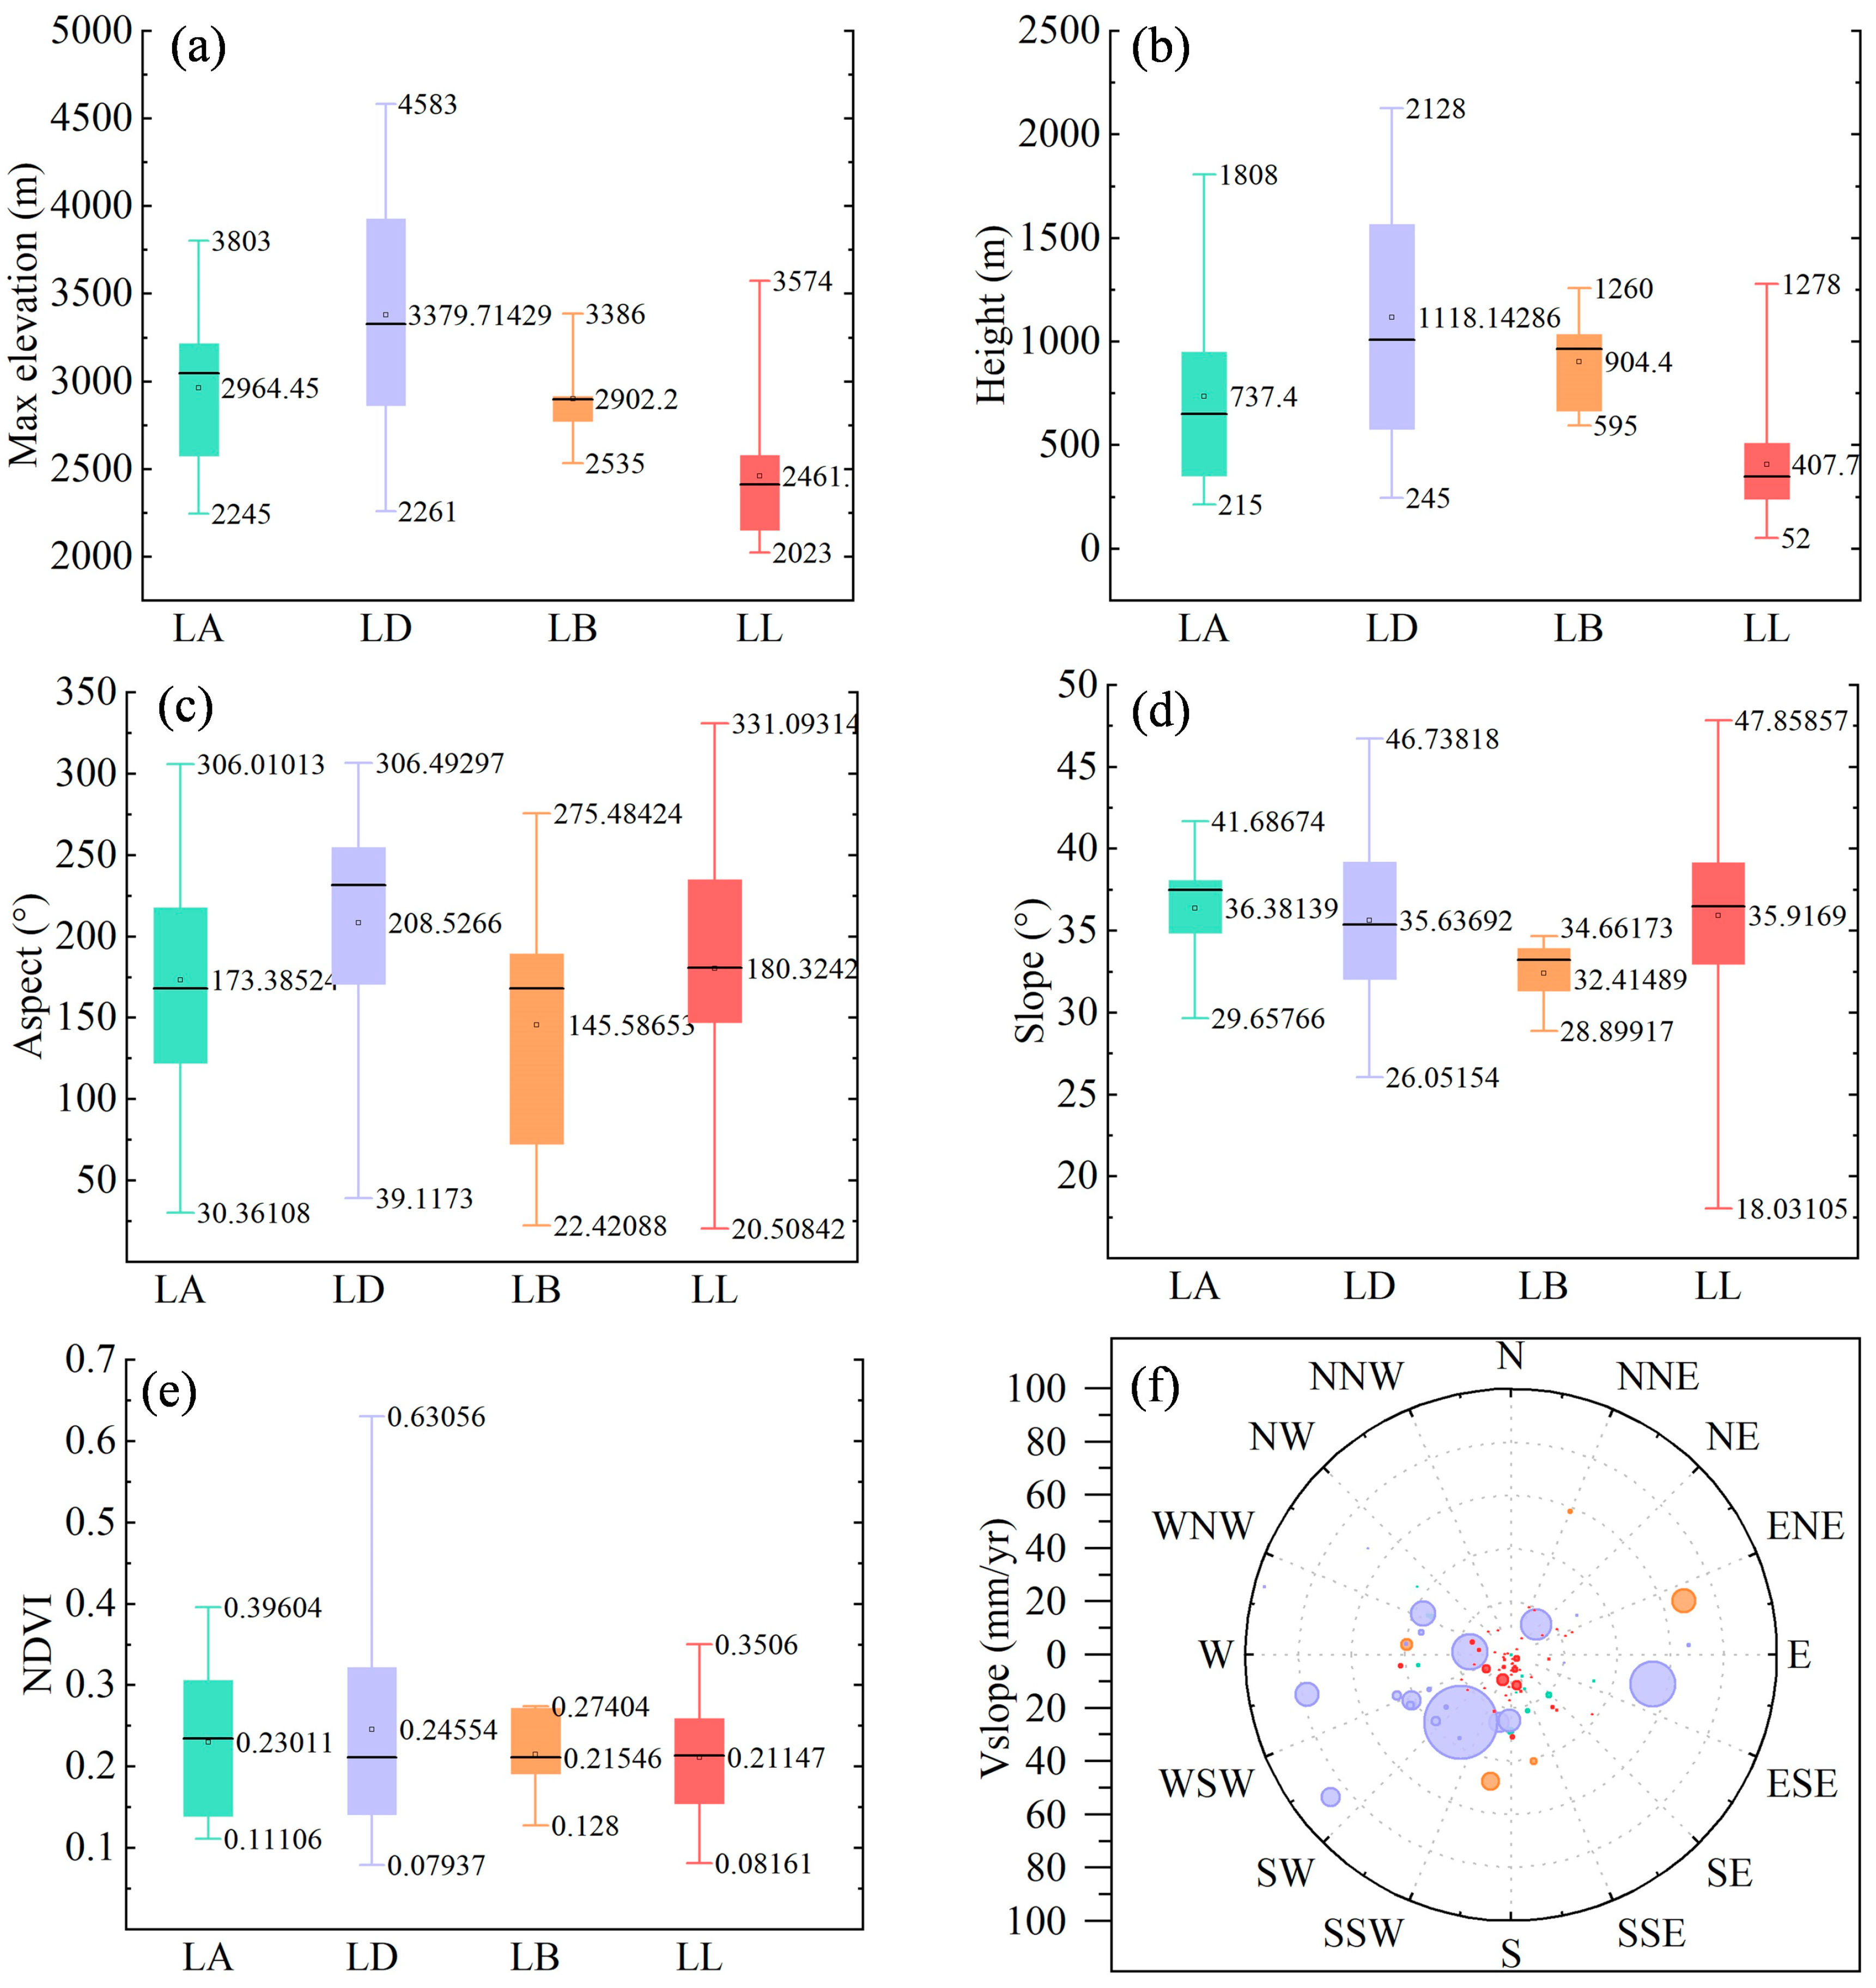
4.2.1. Development Characteristics of Landslides
- (1)
- Deformation pattern and velocity
- (2)
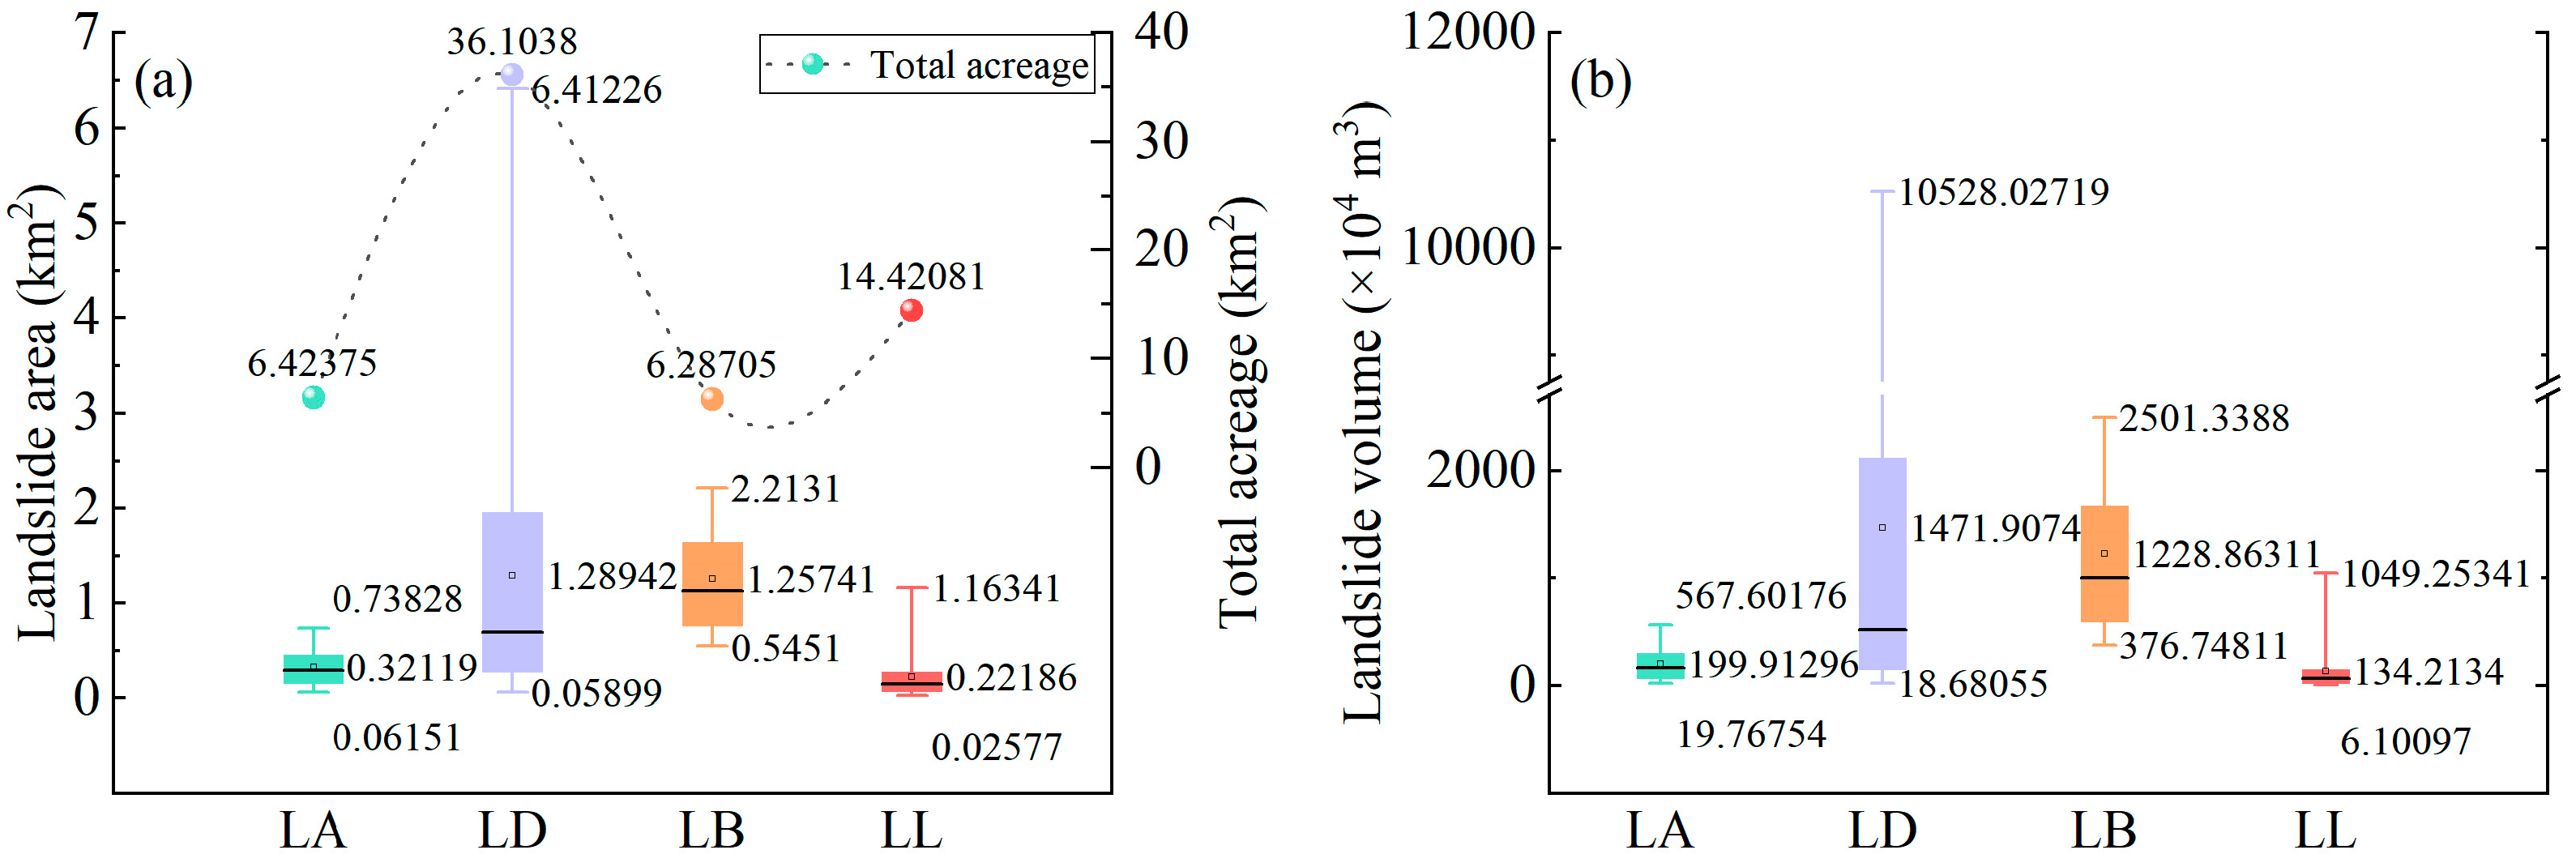
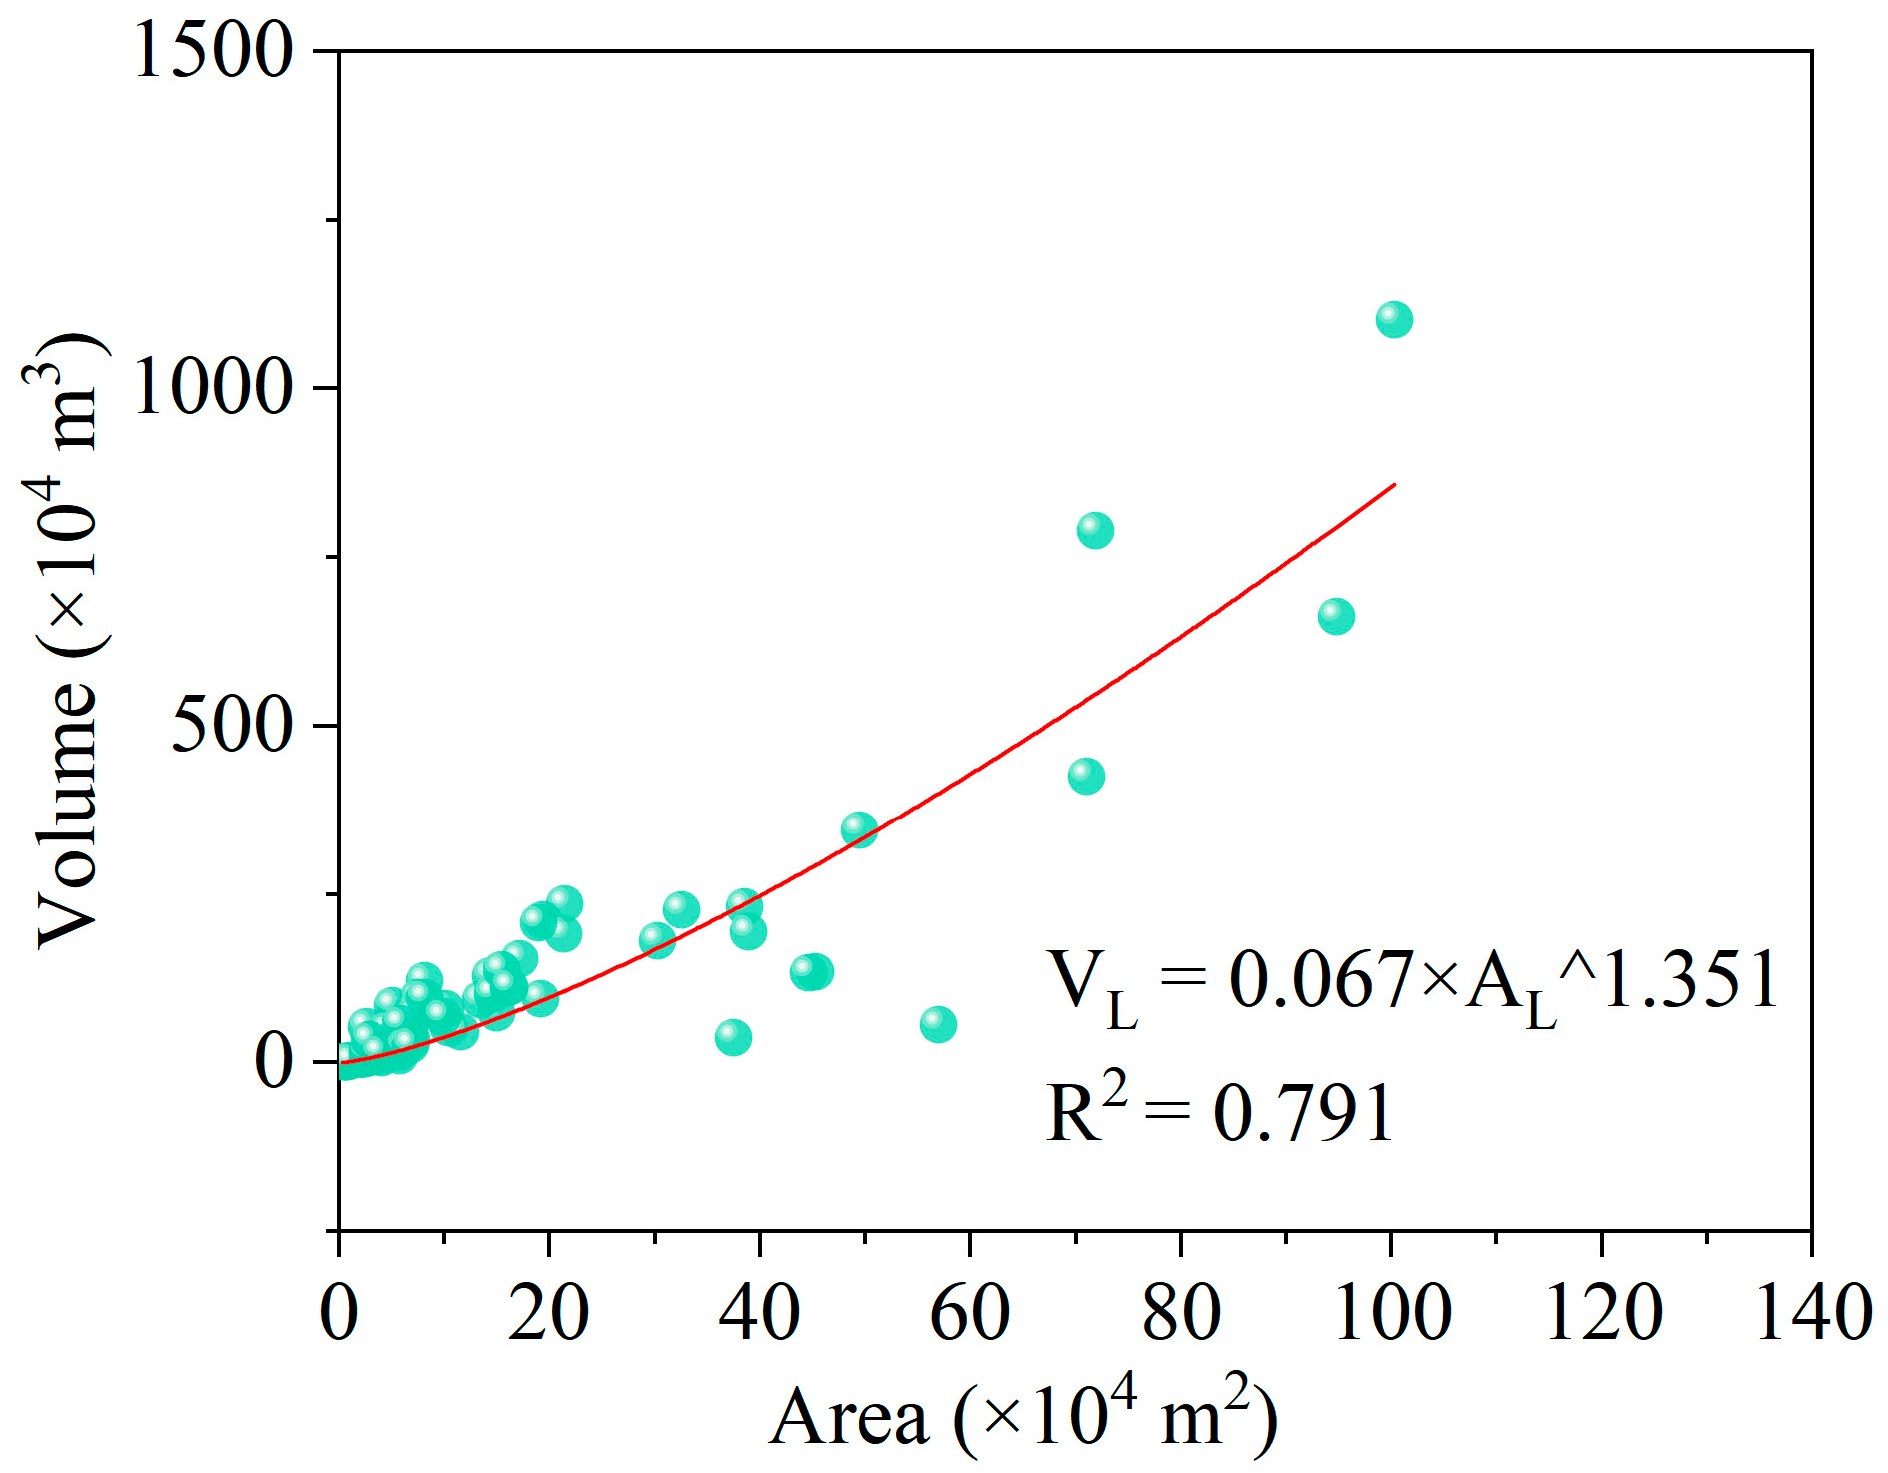
- Magnitude: area and volume


- (3)
- Topography
- (4)
- NDVI
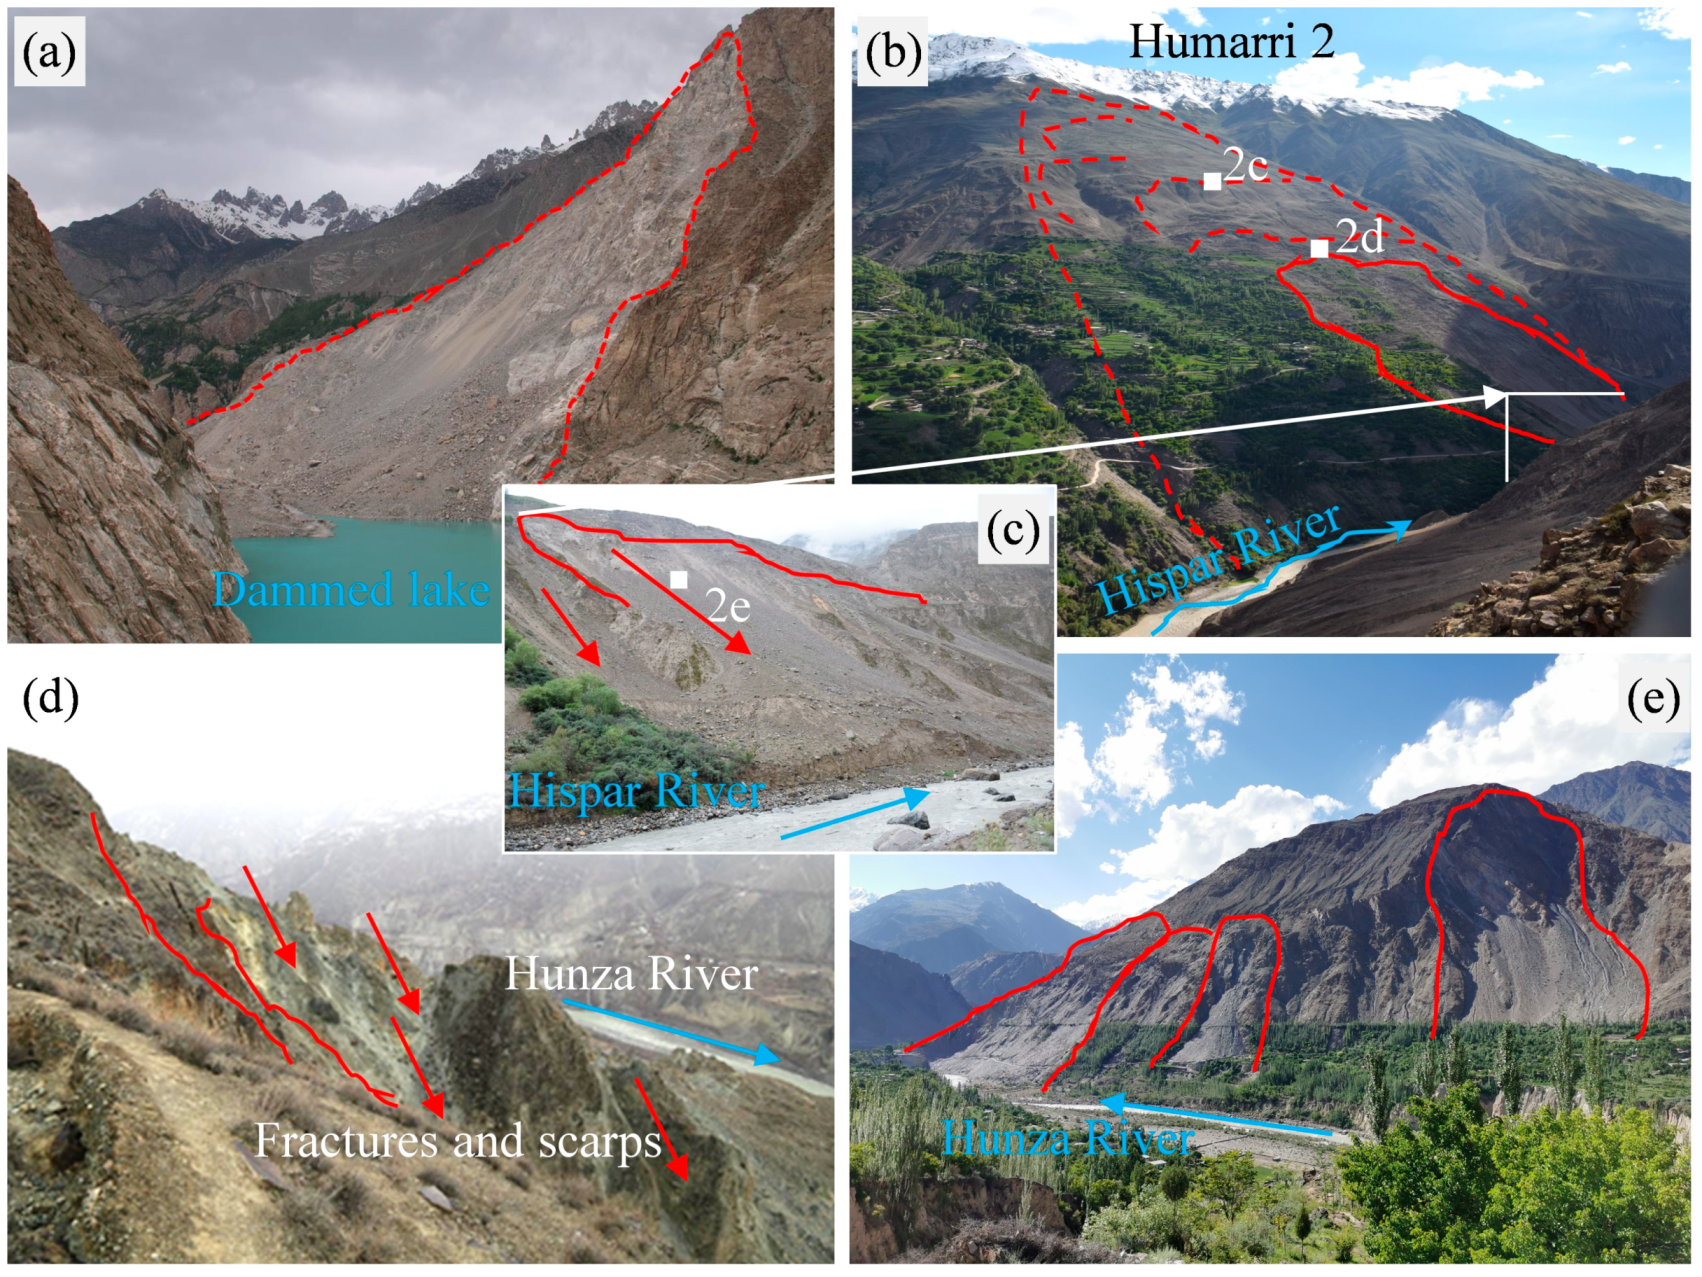
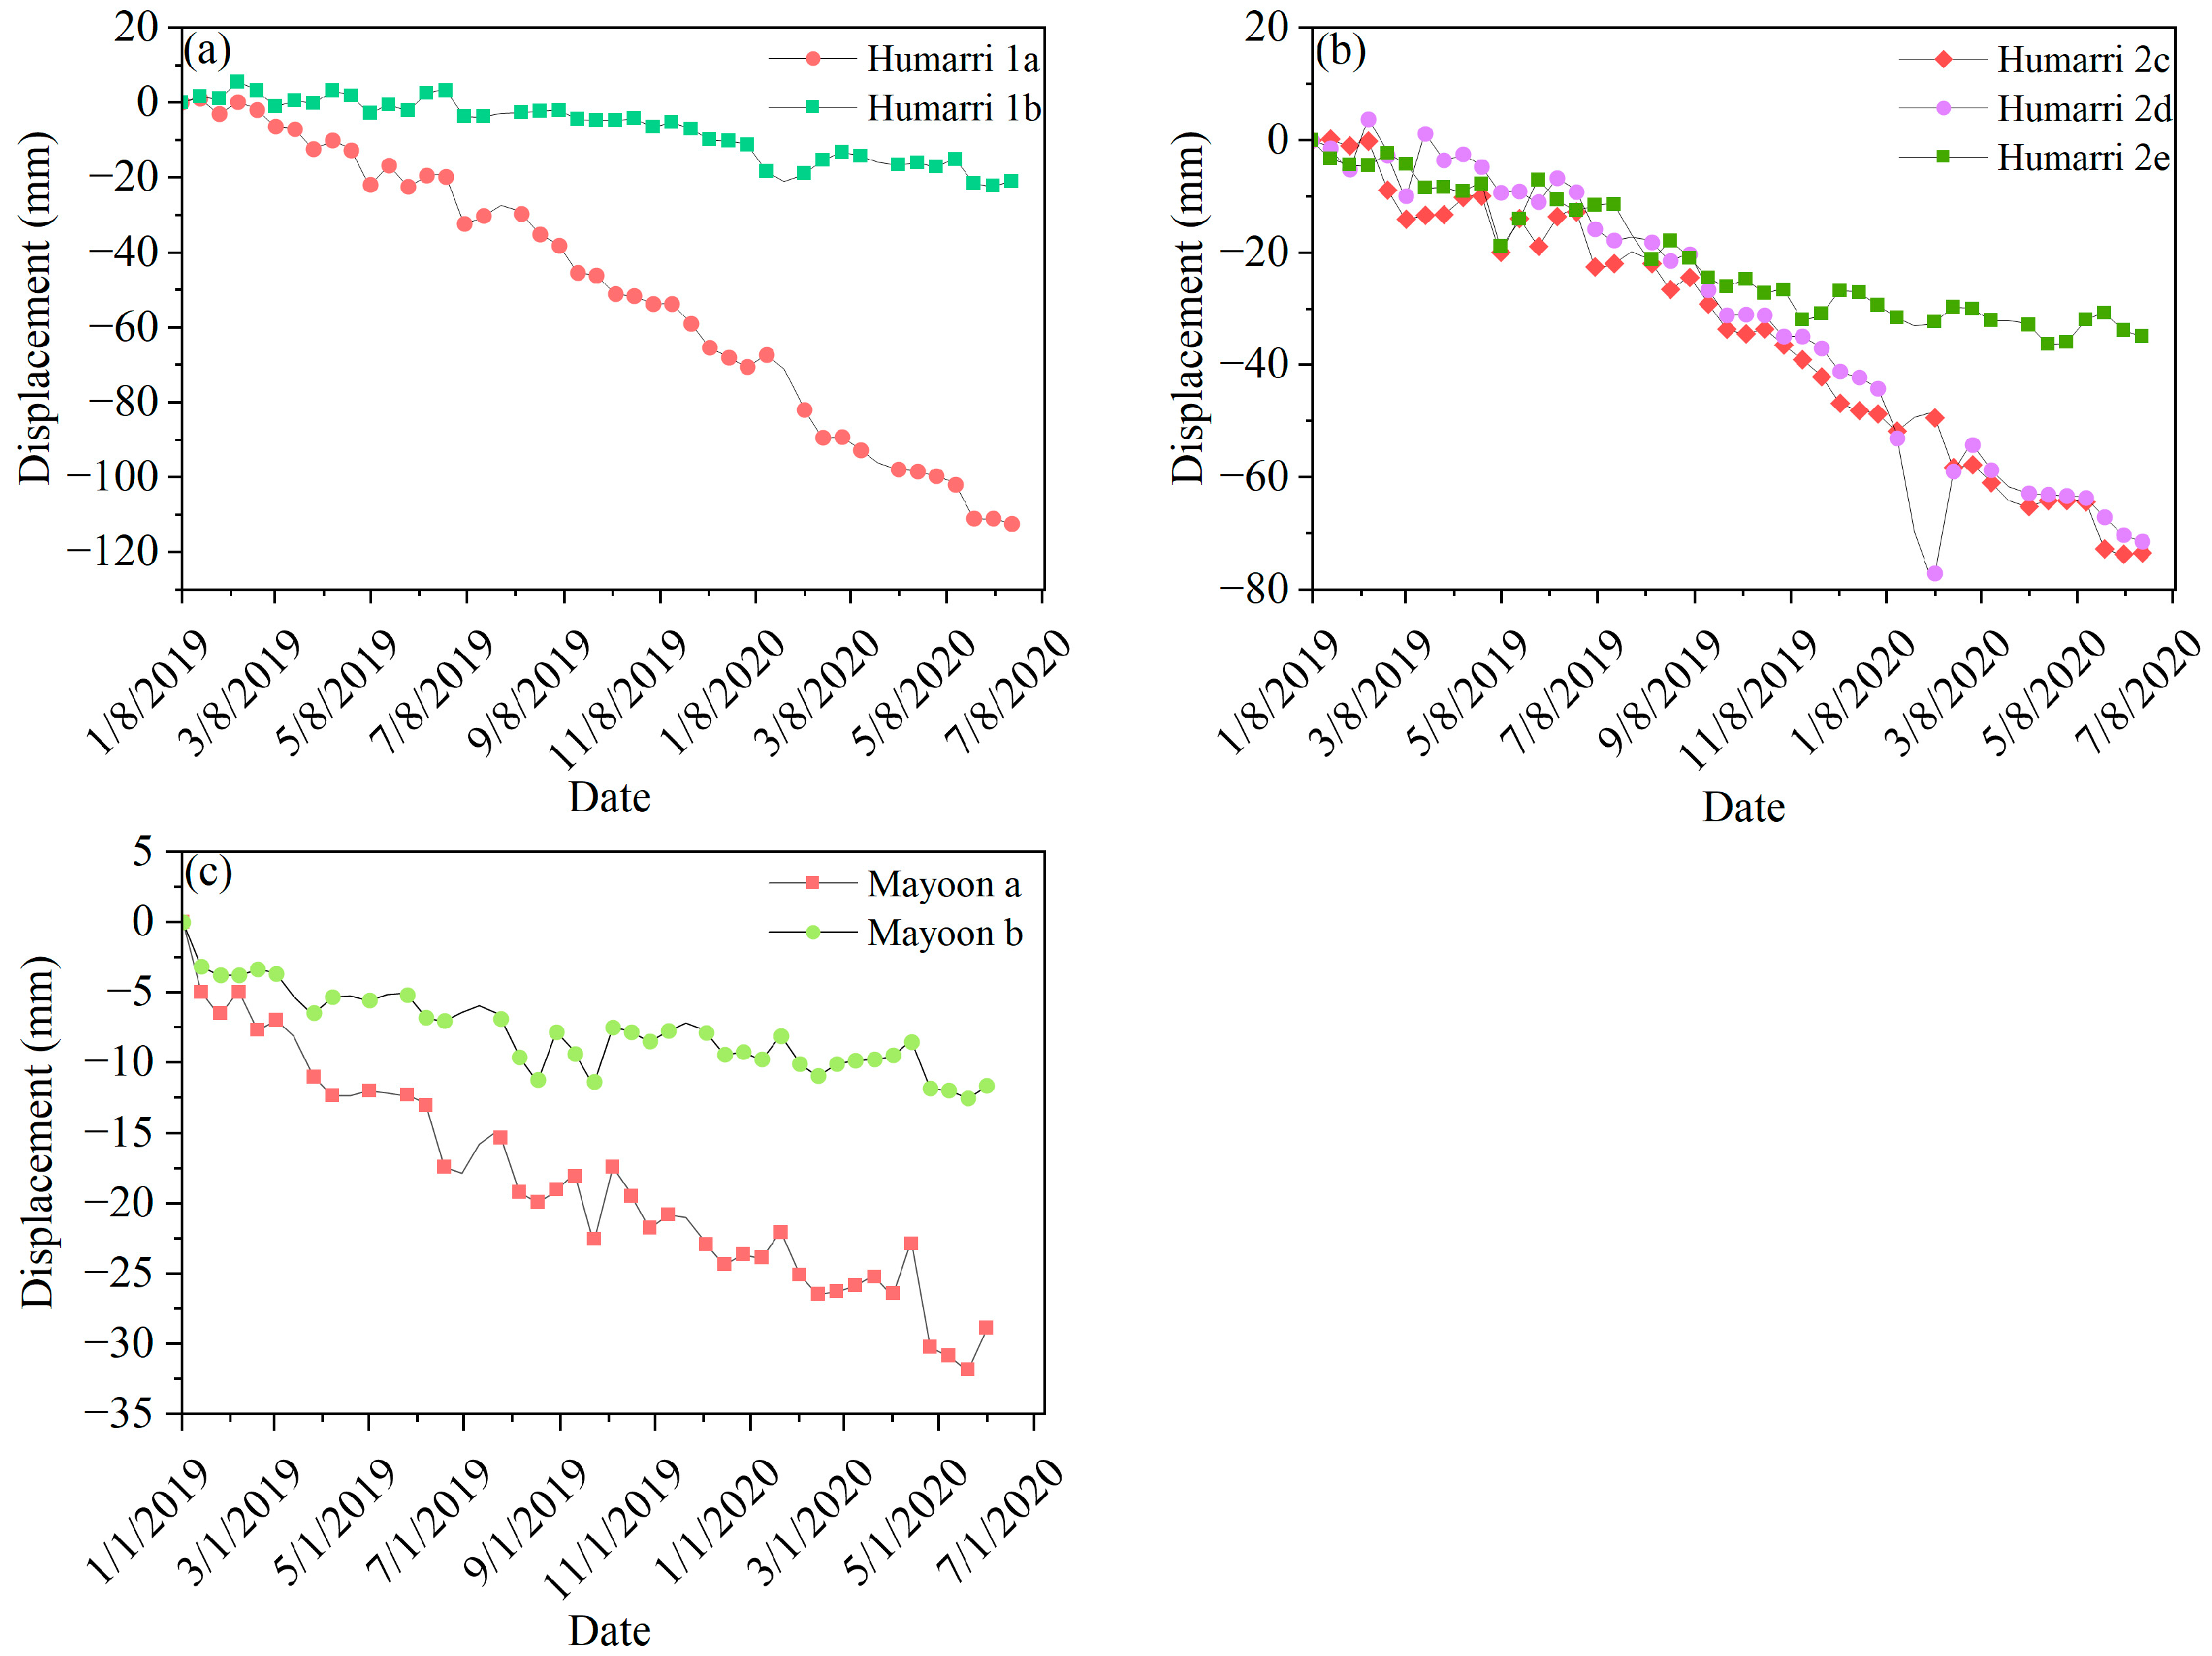
4.2.2. Development of Active Large Landslides
4.3. Distribution Pattern and Causes of Landslides in Hunza Valley
5. Discussion
6. Conclusions
Author Contributions
Funding
Informed Consent Statement
Acknowledgments
Conflicts of Interest
References
- Froude, M.J.; Petley, D.N. Global fatal landslide occurrence from 2004 to 2016. Nat. Hazards Earth Syst. Sci. 2018, 18, 2161–2181. [Google Scholar] [CrossRef]
- Intrieri, E.; Carlà, T.; Gigli, G. Forecasting the time of failure of landslides at slope-scale: A literature review. Earth-Sci. Rev. 2019, 193, 333–349. [Google Scholar] [CrossRef]
- Haque, U.; Blum, P.; da Silva, P.F.; Andersen, P.; Pilz, J.; Chalov, S.R.; Malet, J.-P.; Auflič, M.J.; Andres, N.; Poyiadji, E.; et al. Fatal landslides in Europe. Landslides 2016, 13, 1545–1554. [Google Scholar] [CrossRef]
- Calligaris, C.; Tariq, S.; Khan, H.; Poretti, G. Landslide Susceptibility Analysis in Arandu Area Shigar Valley, CKNP (Gilgit-Baltistan-Pakistan). In Proceedings of the 4th World Landslide Forum, Ljubljana, SLOVENIA, 29 May–2 June 2017; pp. 909–916. [Google Scholar]
- Rehman, Q.U.; Ahmed, W.; Waseem, M.; Khan, S.; Farid, A.; Shah, S.H.A. Geophysical investigations of a potential landslide area in Mayoon, Hunza District, Gilgit-Baltistan, Pakistan. Rudarsko-Geolosko-Naftni Zbornik 2021, 36, 127–141. [Google Scholar] [CrossRef]
- Bacha, A.S.; Shafique, M.; van der Werff, H. Landslide inventory and susceptibility modelling using geospatial tools, in Hunza-Nagar valley, northern Pakistan. J. Mt. Sci. 2018, 15, 1354–1370. [Google Scholar] [CrossRef]
- Cook, N.; Butz, D. The Atta Abad Landslide and Everyday Mobility in Gojal, Northern Pakistan. Mt. Res. Dev. 2013, 33, 372–380. [Google Scholar] [CrossRef]
- Ahmed, M.F.; Rogers, J.D.; Bakar, M.Z.A. Hunza river watershed landslide and related features inventory mapping. Environ. Earth Sci. 2016, 75, 523. [Google Scholar] [CrossRef]
- Pandey, V.K.; Kumar, R.; Singh, R.; Kumar, R.; Rai, S.C.; Singh, R.P.; Tripathi, A.K.; Soni, V.K.; Ali, S.N.; Tamang, D.; et al. Catastrophic ice-debris flow in the Rishiganga River, Chamoli, Uttarakhand (India). Geomat. Nat. Hazards Risk 2022, 13, 289–309. [Google Scholar] [CrossRef]
- Hewitt, K. Catastrophic landslides and their effects on the Upper Indus streams, Karakoram Himalaya, northern Pakistan. Geomorphology 1998, 26, 47–80. [Google Scholar] [CrossRef]
- Hewitt, K.; Evans, S.G.; Degraff, J.V. Styles of rock-avalanche depositional complexes conditioned by very rugged terrain, Karakoram Himalaya, Pakistan. In Catastrophic Landslides; Geological Society of America: Boulder, CO, USA, 2002; Volume XV, pp. 345–377. [Google Scholar]
- Guzzetti, F.; Cardinali, M.; Reichenbach, P.; Carrara, A. Comparing Landslide Maps: A Case Study in the Upper Tiber River Basin, Central Italy. Environ. Manag. 2000, 25, 247–263. [Google Scholar] [CrossRef]
- Perrone, A.; Canora, F.; Calamita, G.; Bellanova, J.; Serlenga, V.; Panebianco, S.; Tragni, N.; Piscitelli, S.; Vignola, L.; Doglioni, A.; et al. A multidisciplinary approach for landslide residual risk assessment: The Pomarico landslide (Basilicata Region, Southern Italy) case study. Landslides 2020, 18, 353–365. [Google Scholar] [CrossRef]
- Segoni, S.; Piciullo, L.; Gariano, S.L. A review of the recent literature on rainfall thresholds for landslide occurrence. Landslides 2018, 15, 1483–1501. [Google Scholar] [CrossRef]
- Pecoraro, G.; Calvello, M.; Piciullo, L. Monitoring strategies for local landslide early warning systems. Landslides 2018, 16, 213–231. [Google Scholar] [CrossRef]
- Yao, J.; Yao, X.; Liu, X. Landslide Detection and Mapping Based on SBAS-InSAR and PS-InSAR: A Case Study in Gongjue County, Tibet, China. Remote Sens. 2022, 14, 4728. [Google Scholar] [CrossRef]
- Rodriguez, J.; Macciotta, R.; Hendry, M.T.; Roustaei, M.; Gräpel, C.; Skirrow, R. UAVs for monitoring, investigation, and mitigation design of a rock slope with multiple failure mechanisms—A case study. Landslides 2020, 17, 2027–2040. [Google Scholar] [CrossRef]
- Fan, X.; Xu, Q.; Alonso-Rodriguez, A.; Subramanian, S.S.; Li, W.; Zheng, G.; Dong, X.; Huang, R. Successive landsliding and damming of the Jinsha River in eastern Tibet, China: Prime investigation, early warning, and emergency response. Landslides 2019, 16, 1003–1020. [Google Scholar] [CrossRef]
- Meusburger, K.; Alewell, C. On the influence of temporal change on the validity of landslide susceptibility maps. Nat. Hazards Earth Syst. Sci. 2009, 9, 1495–1507. [Google Scholar] [CrossRef]
- Kamp, U.; Growley, B.J.; Khattak, G.A.; Owen, L.A. GIS-based landslide susceptibility mapping for the 2005 Kashmir earthquake region. Geomorphology 2008, 101, 631–642. [Google Scholar] [CrossRef]
- Ardizzone, F.; Cardinali, M.; Carrara, A.; Guzzetti, F.; Reichenbach, P. Impact of mapping errors on the reliability of landslide hazard maps. Nat. Hazards Earth Syst. Sci. 2002, 2, 3–14. [Google Scholar] [CrossRef]
- Martha, T.R.; van Westen, C.J.; Kerle, N.; Jetten, V.; Vinod Kumar, K. Landslide hazard and risk assessment using semi-automatically created landslide inventories. Geomorphology 2013, 184, 139–150. [Google Scholar] [CrossRef]
- Kang, Y.; Zhao, C.; Zhang, Q.; Lu, Z.; Li, B. Application of InSAR Techniques to an Analysis of the Guanling Landslide. Remote Sens. 2017, 9, 1046. [Google Scholar] [CrossRef]
- Zhang, Y.; Meng, X.; Jordan, C.; Novellino, A.; Dijkstra, T.; Chen, G. Investigating slow-moving landslides in the Zhouqu region of China using InSAR time series. Landslides 2018, 15, 1299–1315. [Google Scholar] [CrossRef]
- Rehman, M.U.; Zhang, Y.; Meng, X.; Su, X.; Catani, F.; Rehman, G.; Yue, D.; Khalid, Z.; Ahmad, S.; Ahmad, I. Analysis of Landslide Movements Using Interferometric Synthetic Aperture Radar: A Case Study in Hunza-Nagar Valley, Pakistan. Remote Sens. 2020, 12, 2054. [Google Scholar] [CrossRef]
- Zhao, F.; Meng, X.; Zhang, Y.; Chen, G.; Su, X.; Yue, D. Landslide susceptibility mapping of Karakorum Highway combined with the application of SBAS-InSAR technology. Sensors 2019, 19, 2685. [Google Scholar] [CrossRef] [PubMed]
- Hungr, O.; Leroueil, S.; Picarelli, L. The Varnes classification of landslide types, an update. Landslides 2014, 11, 167–194. [Google Scholar] [CrossRef]
- Rostan, F.; Riegger, S.; Pitz, W.; Torre, A.; Torres, R. The C-SAR instrument for the GMES sentinel-1 mission. In Proceedings of the Geoscience and Remote Sensing Symposium, Barcelona, Spain, 23–27 July 2007; pp. 1–4. [Google Scholar]
- Torres, R.; Snoeij, P.; Geudtner, D.; Bibby, D.; Davidson, M.; Attema, E.; Potin, P.; Rommen, B.; Floury, N.; Brown, M. GMES Sentinel-1 mission. Remote Sens. Environ. 2012, 120, 9–24. [Google Scholar] [CrossRef]
- Torres, R.; Snoeij, P.; Davidson, M.; Bibby, D.; Lokas, S. The Sentinel-1 mission and its application capabilities. In Proceedings of the Geoscience and Remote Sensing Symposium, Munich, Germany, 22–27 July 2012; pp. 1703–1706. [Google Scholar]
- Shafique, M.; van der Meijde, M.; Khan, M.A. A review of the 2005 Kashmir earthquake-induced landslides; from a remote sensing prospective. J. Asian Earth Sci. 2016, 118, 68–80. [Google Scholar] [CrossRef]
- Ali, S.; Schneiderwind, S.; Reicherter, K. Structural and climatic control of mass movements along the Karakoram Highway. In Proceedings of the 4th World Landslide Forum, Ljubljana, Slovenia, 29 May–2 June 2017; pp. 509–516. [Google Scholar]
- Derbyshire, E.; Fort, M.; et Owen, L. Geomorphological hazards along the Karakoram Highway: Khunjerab Pass to the Gilgit River, Northernmost Pakistan. Erdkunde 2001, 55, 49–71. [Google Scholar] [CrossRef]
- Baig, S.U.; Rehman, M.U.; Janjua, N.N. District-level disaster risk and vulnerability in the Northern mountains of Pakistan. Geomat. Nat. Hazards Risk 2021, 12, 2002–2022. [Google Scholar] [CrossRef]
- Su, X.; Zhang, Y.; Meng, X.; Yue, D.; Ma, J.; Guo, F.; Zhou, Z.; Rehman, M.U.; Khalid, Z.; Chen, G.; et al. Landslide mapping and analysis along the China-Pakistan Karakoram Highway based on SBAS-InSAR detection in 2017. J. Mt. Sci. 2021, 18, 2540–2564. [Google Scholar] [CrossRef]
- Hassan, J.; Chen, X.; Muhammad, S.; Bazai, N.A. Rock glacier inventory, permafrost probability distribution modeling and associated hazards in the Hunza River Basin, Western Karakoram, Pakistan. Sci. Total Environ. 2021, 782, 146833. [Google Scholar] [CrossRef] [PubMed]
- Owen, L.A. Quaternary lacustrine deposits in high-energy semi-arid mountain environment, Karakoram mountains, northern Pakistan. J. Quat. Sci. 1996, 11, 461–483. [Google Scholar] [CrossRef]
- Verma, R.K.; Sekhar, C.C. Focal mechanism solutions and nature of plate movements in Pakistan. J. Geodyn. 1986, 5, 331–351. [Google Scholar] [CrossRef]
- Ali, S.; Biermanns, P.; Haider, R.; Reicherter, K. Landslide susceptibility mapping by using a geographic information system (GIS) along the China-Pakistan Economic Corridor (Karakoram Highway), Pakistan. Nat. Hazards Earth Syst. Sci. 2019, 19, 999–1022. [Google Scholar] [CrossRef]
- Searle, M.P.; Owen, L.A. The evolution of the Indus River in relation to topographic uplift, erosion, climate and geology of Western Tibet, the Trans-Himalayan and High Himalayan ranges. In Proceedings of the Symposium on the Indus River - Biodiversity, Resources, Humankind, London, UK, 13–15 July 1994; pp. 210–230. [Google Scholar]
- Searle, M.P.; Khan, M.A.; Fraser, J.E.; Gough, S.J.; Jan, M.Q. The tectonic evolution of the Kohistan-Karakoram collision belt along the Karakoram Highway transect, north Pakistan. Tectonics 1999, 18, 929–949. [Google Scholar] [CrossRef]
- Berardino, P.; Fornaro, G.; Lanari, R.; Sansosti, E. A new algorithm for surface deformation monitoring based on small baseline differential SAR interferograms. IEEE Trans. Geosci. Remote Sens. 2002, 40, 2375–2383. [Google Scholar] [CrossRef]
- Berardino, P.; Costantini, M.; Franceschetti, G.; Iodice, A.; Pietranera, L.; Rizzo, V. Use of differential SAR interferometry in monitoring and modelling large slope instability at Maratea (Basilicata, Italy). Eng. Geol. 2003, 68, 31–51. [Google Scholar] [CrossRef]
- Lanari, R.; Casu, F.; Manzo, M.; Zeni, G.; Berardino, P.; Manunta, M.; Pepe, A. An Overview of the Small BAseline Subset Algorithm: A DInSAR Technique for Surface Deformation Analysis. Pure Appl. Geophys. 2007, 164, 637–661. [Google Scholar] [CrossRef]
- Dong, S.; Samsonov, S.; Yin, H.; Ye, S.; Cao, Y. Time-series analysis of subsidence associated with rapid urbanization in Shanghai, China measured with SBAS InSAR method. Environ. Earth Sci. 2014, 72, 677–691. [Google Scholar] [CrossRef]
- Du, Y.; Feng, G.; Liu, L.; Fu, H.; Peng, X.; Wen, D. Understanding Land Subsidence Along the Coastal Areas of Guangdong, China, by Analyzing Multi-Track MTInSAR Data. Remote Sens. 2020, 12, 299. [Google Scholar] [CrossRef]
- Du, W.; Ji, W.; Xu, L.; Wang, S. Deformation Time Series and Driving-Force Analysis of Glaciers in the Eastern Tienshan Mountains Using the SBAS InSAR Method. Int. J. Environ. Res. Public Health 2020, 17, 2836. [Google Scholar] [CrossRef] [PubMed]
- Wasowski, J.; Bovenga, F. Investigating landslides and unstable slopes with satellite Multi Temporal Interferometry: Current issues and future perspectives. Eng. Geol. 2014, 174, 103–138. [Google Scholar] [CrossRef]
- Crippa, C.; Valbuzzi, E.; Frattini, P.; Crosta, G.B.; Spreafico, M.C.; Agliardi, F. Semi-automated regional classification of the style of activity of slow rock-slope deformations using PS InSAR and SqueeSAR velocity data. Landslides 2021, 18, 2445–2463. [Google Scholar] [CrossRef]
- Guo, C.; Yan, Y.; Zhang, Y.; Zhang, X.; Zheng, Y.; Li, X.; Yang, Z.; Wu, R. Study on the Creep-Sliding Mechanism of the Giant Xiongba Ancient Landslide Based on the SBAS-InSAR Method, Tibetan Plateau, China. Remote Sens. 2021, 13, 3365. [Google Scholar] [CrossRef]
- Ferretti, A.; Prati, C.; Rocca, F. Nonlinear subsidence rate estimation using permanent scatterers in differential SAR interferometry. IEEE Trans. Geosci. Remote Sens. 2000, 38, 2202–2212. [Google Scholar] [CrossRef]
- Lauknes, T.R.; Zebker, H.A.; Larsen, Y. InSAR Deformation Time Series Using an L_1 -Norm Small-Baseline Approach. IEEE Trans. Geosci. Remote Sens. 2011, 49, 536–546. [Google Scholar] [CrossRef]
- Gabriel, A.K.; Goldstein, R.M.; Zebker, H.A. Mapping Small Elevation Changes Over Large Areas: Differential Radar Interferometry. J. Geophys. Res. Solid Earth 1989, 94, 9183–9191. [Google Scholar] [CrossRef]
- Goldstein, R.M.; Werner, C.L. Radar interferogram filtering for geophysical applications. Geophys. Res. Lett. 1998, 25, 4035–4038. [Google Scholar] [CrossRef]
- Costantini, M.; Farina, A.; Zirilli, F. A fast phase unwrapping algorithm for SAR interferometry. IEEE Trans. Geosci. Remote Sens. 1999, 37, 452–460. [Google Scholar] [CrossRef]
- Zhao, C.; Kang, Y.; Zhang, Q.; Lu, Z.; Li, B. Landslide Identification and Monitoring along the Jinsha River Catchment (Wudongde Reservoir Area), China, Using the InSAR Method. Remote Sens. 2018, 10, 993. [Google Scholar] [CrossRef]
- Zhao, C.; Lu, Z.; Zhang, Q.; Fuente, J.D.L. Large-area landslide detection and monitoring with ALOS/PALSAR imagery data over Northern California and Southern Oregon, USA. Remote Sens. Environ. 2012, 124, 348–359. [Google Scholar] [CrossRef]
- Hooper, A. A multi-temporal InSAR method incorporating both persistent scatterer and small baseline approaches. Geophys. Res. Lett. 2008, 35, 96–106. [Google Scholar] [CrossRef]
- Zhao, C.; Zhang, Q.; Yin, Y.; Lu, Z.; Yang, C.; Zhu, W.; Li, B. Pre-, co-, and post- rockslide analysis with ALOS/PALSAR imagery: A case study of the Jiweishan rockslide, China. Nat. Hazards Earth Syst. Sci. 2013, 13, 2851–2861. [Google Scholar] [CrossRef]
- Schlögel, R.; Doubre, C.; Malet, J.P.; Masson, F. Landslide deformation monitoring with ALOS/PALSAR imagery: A D-InSAR geomorphological interpretation method. Geomorphology 2015, 231, 314–330. [Google Scholar] [CrossRef]
- Liu, X.; Zhao, C.; Zhang, Q.; Peng, J.; Zhu, W.; Lu, Z. Multi-Temporal Loess Landslide Inventory Mapping with C-, X- and L-Band SAR Datasets-A Case Study of Heifangtai Loess Landslides, China. Remote Sens. 2018, 10, 1756. [Google Scholar] [CrossRef]
- Liu, X.; Zhao, C.; Zhang, Q.; Lu, Z.; Li, Z.; Yang, C.; Zhu, W.; Liu-Zeng, J.; Chen, L.; Liu, C. Integration of Sentinel-1 and ALOS/PALSAR-2 SAR datasets for mapping active landslides along the Jinsha River corridor, China. Eng. Geol. 2021, 284, 106033. [Google Scholar] [CrossRef]
- Yi, Z.; Xingmin, M.; Allesandro, N.; Tom, D.; Guan, C.; Colm, J.; Yuanxi, L.; Xiaojun, S. Characterization of pre-failure deformation and evolution of a large earthflow using InSAR monitoring and optical image interpretation. Landslides 2022, 19, 35–50. [Google Scholar] [CrossRef]
- Rose, N.D.; Hungr, O. Forecasting potential rock slope failure in open pit mines using the inverse-velocity method. Int. J. Rock Mech. Min. Sci. 2006, 44, 308–320. [Google Scholar] [CrossRef]
- Li, M.; Zhang, L.; Ding, C.; Li, W.; Luo, H.; Liao, M.; Xu, Q. Retrieval of historical surface displacements of the Baige landslide from time-series SAR observations for retrospective analysis of the collapse event. Remote Sens. Environ. 2020, 240, 111695. [Google Scholar] [CrossRef]
- Yi, X.; Shang, Y.; Shao, P.; Meng, H. A dataset of spatial distributions and attributes of typical rockfalls and landslides in the China-Pakistan Economic Corridor from 1970 to 2020. Sci. Data Bank 2021, 6, 5–14. [Google Scholar] [CrossRef]
- Guzzetti, F.; Ardizzone, F.; Cardinali, M.; Rossi, M.; Valigi, D. Landslide volumes and landslide mobilization rates in Umbria, central Italy. Earth Planet. Sci. Lett. 2009, 279, 222–229. [Google Scholar] [CrossRef]
- Qiu, H.; Cui, P.; Regmi, A.D.; Hu, S.; Wang, X.; Zhang, Y.; He, Y. Influence of topography and volume on mobility of loess slides within different slip surfaces. CATENA 2017, 157, 180–188. [Google Scholar] [CrossRef]
- Zhang, Y.; Meng, X.M.; Dijkstra, T.A.; Jordan, C.J.; Chen, G.; Zeng, R.Q.; Novellino, A. Forecasting the magnitude of potential landslides based on InSAR techniques. Remote Sens. Environ. 2020, 241, 111738. [Google Scholar] [CrossRef]
- Su, X.; Zhang, Y.; Meng, X.; Rehman Ur, M.; Khalid, Z.; Zhao, F.; Yue, D.; Guo, F.; Zhou, Z. Potential Landslides Identification and Development Characteristics Analysis in Hunza valley along China-Pakistan Economic Corridor based on SBAS-InSAR (in Chinese). Natl. Remote Sens. Bull. 2022, 26, 1–19. [Google Scholar] [CrossRef]
- Rana, I.A.; Routray, J.K. Multidimensional Model for Vulnerability Assessment of Urban Flooding: An Empirical Study in Pakistan. Int. J. Disaster Risk Sci. 2018, 9, 359–375. [Google Scholar] [CrossRef]
- Khalid, Z.; Meng, X.; Rana, I.A.; Rehman, M.u.; Su, X. Holistic multidimensional vulnerability assessment: An empirical investigation on rural communities of the Hindu Kush Himalayan region, Northern Pakistan. Int. J. Disaster Risk Reduct. 2021, 62, 102413. [Google Scholar] [CrossRef]
- Hasson, S.; Lucarini, V.; Khan, M.R.; Petitta, M.; Bolch, T.; Gioli, G. Early 21st century snow cover state over the western river basins of the Indus River system. Hydrol. Earth Syst. Sci. 2014, 18, 4077–4100. [Google Scholar] [CrossRef]
- Jones, D.B.; Harrison, S.; Anderson, K. Mountain glacier-to-rock glacier transition. Glob. Planet. Change 2019, 181, 102999. [Google Scholar] [CrossRef]
- Schmid, M.O.; Baral, P.; Gruber, S.; Shahi, S.; Shrestha, T.; Stumm, D.; Wester, P. Assessment of permafrost distribution maps in the Hindu Kush Himalayan region using rock glaciers mapped in Google Earth. Cryosphere 2015, 9, 2089–2099. [Google Scholar] [CrossRef]
- Wester, P.; Mishra, A.; Mukherji, A.; Shrestha, A. The Hindu Kush Himalaya. Mountains, Climate Change, Sustainability and People, Assessment; Springer Nature: Cham, Switzerland, 2019. [Google Scholar]
- Owen, L.A.; Englandb, J. Observations on rock glaciers in the Himalayas and Karakoram Mountains of northern Pakistan and India. Geomorphology 1998, 26, 199–213. [Google Scholar] [CrossRef]
- Arenson, L.U.; Springman, S.M. Mathematical descriptions for the behaviour of ice-rich frozen soils at temperatures close to 0 °C. Can. Geotech. J. 2005, 42, 431–442. [Google Scholar] [CrossRef]
- Kääb, A. Remote sensing of permafrost-related problems and hazards. Permafr. Periglac. Process. 2008, 19, 107–136. [Google Scholar] [CrossRef]
- Blöthe, J.H.; Rosenwinkel, S.; Höser, T.; Korup, O. Rock-glacier dams in High Asia. Earth Surf. Process. Landf. 2019, 44, 808–824. [Google Scholar] [CrossRef]
- Hussain, M.A.; Chen, Z.; Wang, R.; Shoaib, M. PS-InSAR-Based validated landslide susceptibility mapping along Karakorum Highway, Pakistan. Remote Sens. 2021, 13, 4129. [Google Scholar] [CrossRef]


| Satellite Mission (Source) | Sentinel-1A | Sentinel-1A | Google Earth Data |
|---|---|---|---|
| Purpose | Time-series displacement analysis | Spatial pattern analysis of displacement | Evolution precession |
| Band | C | C | Optical |
| Wavelength (cm) | 5.6 | 5.6 | - |
| Incidence of LOS (°) | 32.3–36.3 | 34.5–38.1 | - |
| Average Incidence of LOS (°) | 34.02 | 36.35 | - |
| The azimuth of LOS (°) | 83.94 | −83.94 | - |
| Path | Ascending (27) | Descending (107) | - |
| Frame | 117 | 473 | - |
| Resolution in azimuth (m) and range (m) | ~20 × 5 | ~20 × 5 | <2 |
| Minimum temporal baseline (days) | 12 | 12 | - |
| Number of images | 45 | 42 | - |
| Temporal span | 2 January 2019–13 June 2020 | 8 January 2019–19 June 2020 | 2017–2020 |
| Multi-looking (azimuth × range) | 1 × 4 | 1 × 4 | - |
| Forecast in This Study | Published Data | |||
|---|---|---|---|---|
| Landslide Name | Area (104 m2) | Volume (104 m3) | Area (104 m2) | Volume (104 m3) |
| Karimabad-4 | 61.801 | 446.384 | 45.225 | 135.675 |
| Karimabad-3 | 20.383 | 99.747 | 17.105 | 153.948 |
| Miachar-3 | 43.888 | 281.117 | 38.851 | 194.257 |
| Karimabad | 25.476 | 134.821 | 38.492 | 230.956 |
| Humarri-1 | 353.527 | 4709.713 | 340 | 4100 |
Publisher’s Note: MDPI stays neutral with regard to jurisdictional claims in published maps and institutional affiliations. |
© 2022 by the authors. Licensee MDPI, Basel, Switzerland. This article is an open access article distributed under the terms and conditions of the Creative Commons Attribution (CC BY) license (https://creativecommons.org/licenses/by/4.0/).
Share and Cite
Su, X.; Zhang, Y.; Meng, X.; Rehman, M.U.; Khalid, Z.; Yue, D. Updating Inventory, Deformation, and Development Characteristics of Landslides in Hunza Valley, NW Karakoram, Pakistan by SBAS-InSAR. Remote Sens. 2022, 14, 4907. https://doi.org/10.3390/rs14194907
Su X, Zhang Y, Meng X, Rehman MU, Khalid Z, Yue D. Updating Inventory, Deformation, and Development Characteristics of Landslides in Hunza Valley, NW Karakoram, Pakistan by SBAS-InSAR. Remote Sensing. 2022; 14(19):4907. https://doi.org/10.3390/rs14194907
Chicago/Turabian StyleSu, Xiaojun, Yi Zhang, Xingmin Meng, Mohib Ur Rehman, Zainab Khalid, and Dongxia Yue. 2022. "Updating Inventory, Deformation, and Development Characteristics of Landslides in Hunza Valley, NW Karakoram, Pakistan by SBAS-InSAR" Remote Sensing 14, no. 19: 4907. https://doi.org/10.3390/rs14194907
APA StyleSu, X., Zhang, Y., Meng, X., Rehman, M. U., Khalid, Z., & Yue, D. (2022). Updating Inventory, Deformation, and Development Characteristics of Landslides in Hunza Valley, NW Karakoram, Pakistan by SBAS-InSAR. Remote Sensing, 14(19), 4907. https://doi.org/10.3390/rs14194907