
Power Pylon Reconstruction from Airborne LiDAR Data Based on Component Segmentation and Model Matching


Abstract
1. Introduction
1.1. Related Works
1.2. Contributions
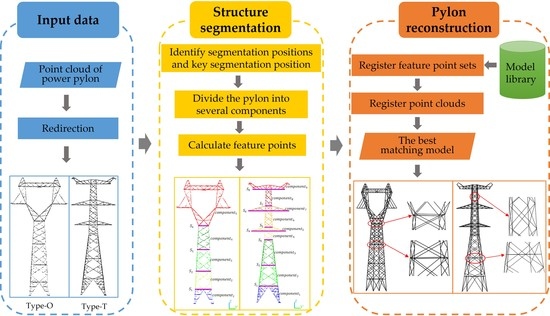
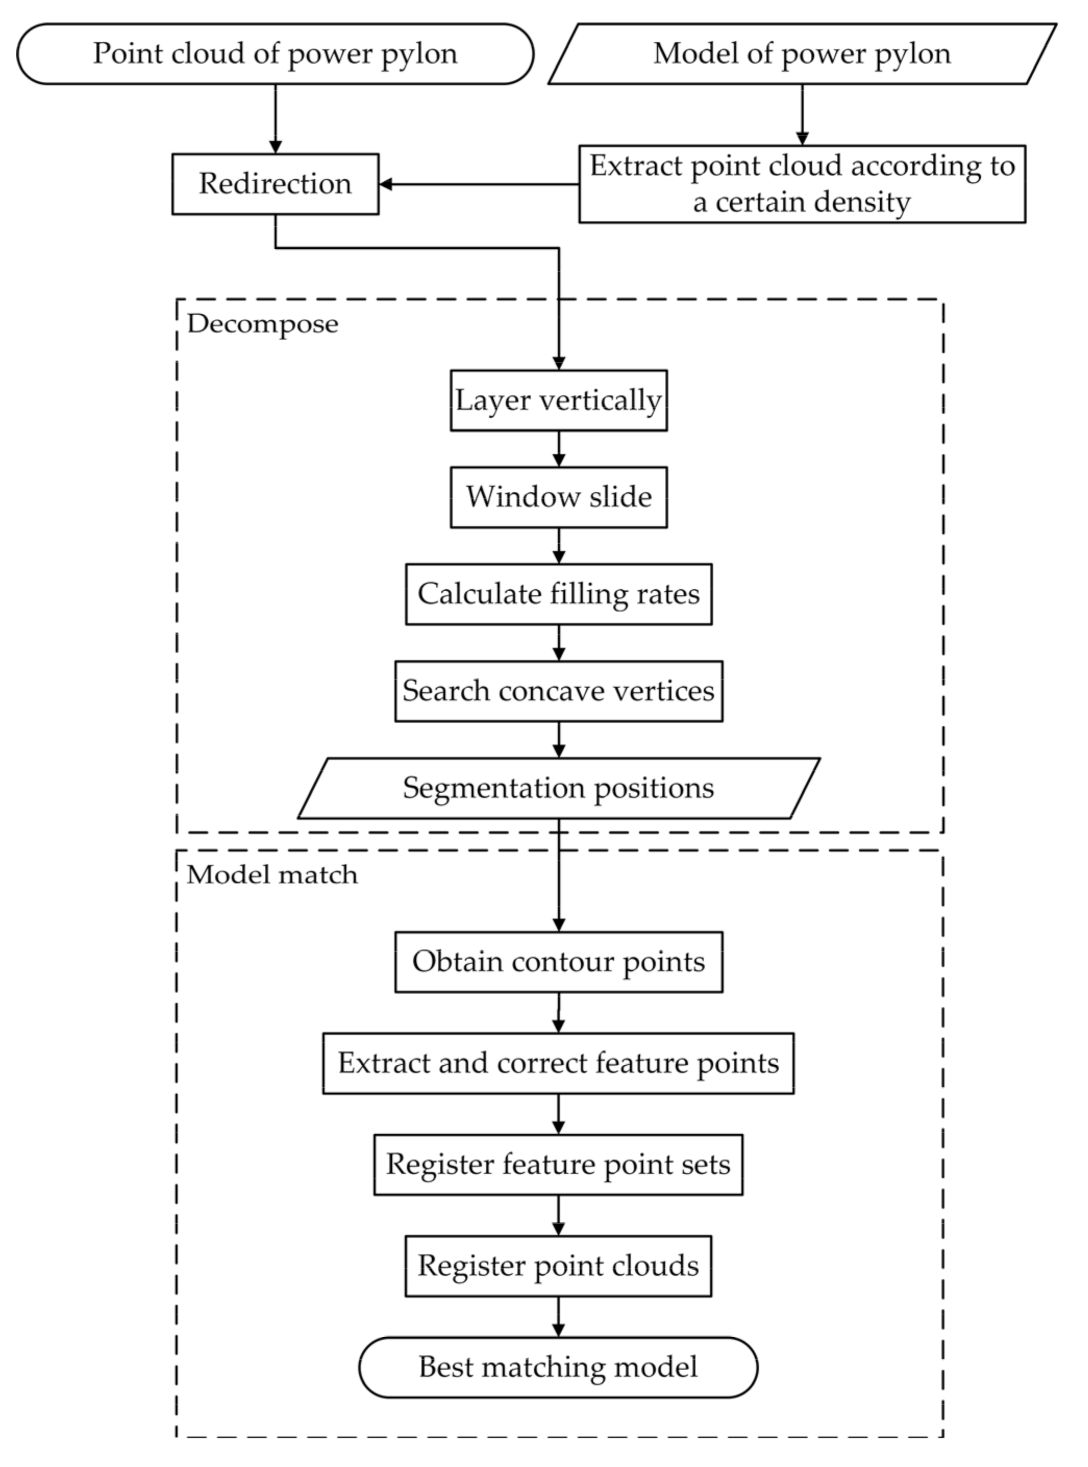
1.3. Overview
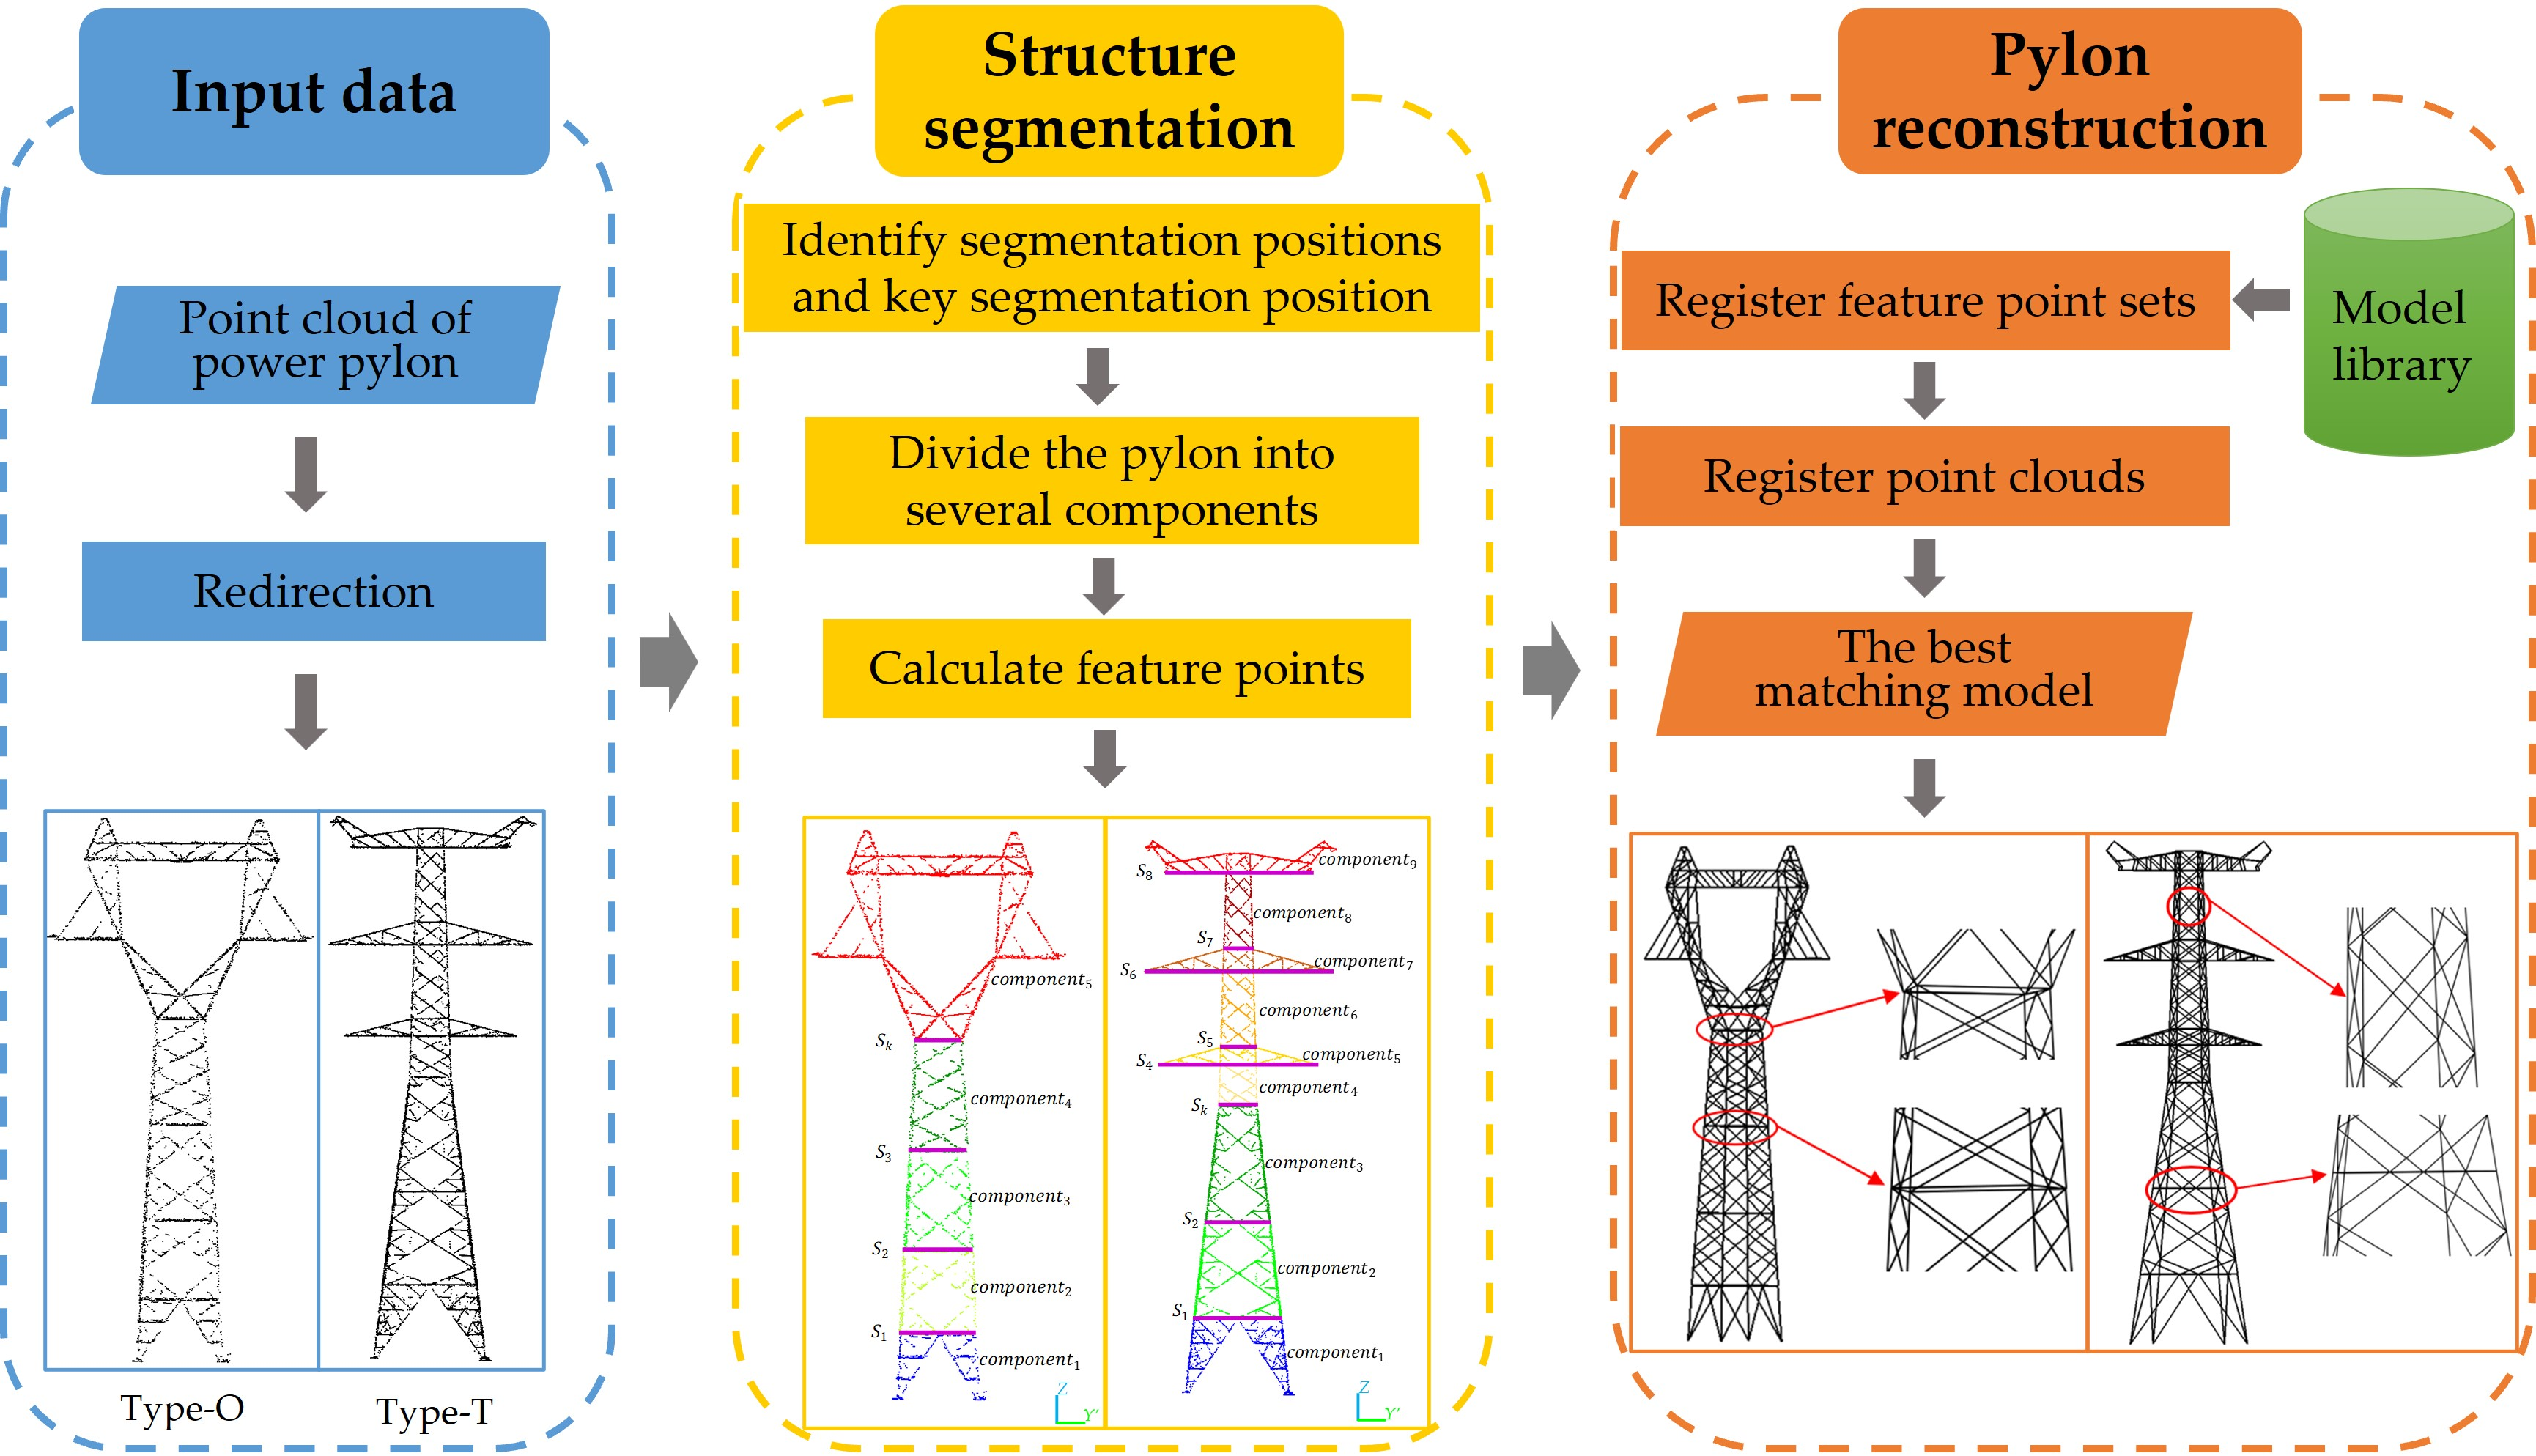
2. Experimental Data
3. Methodology
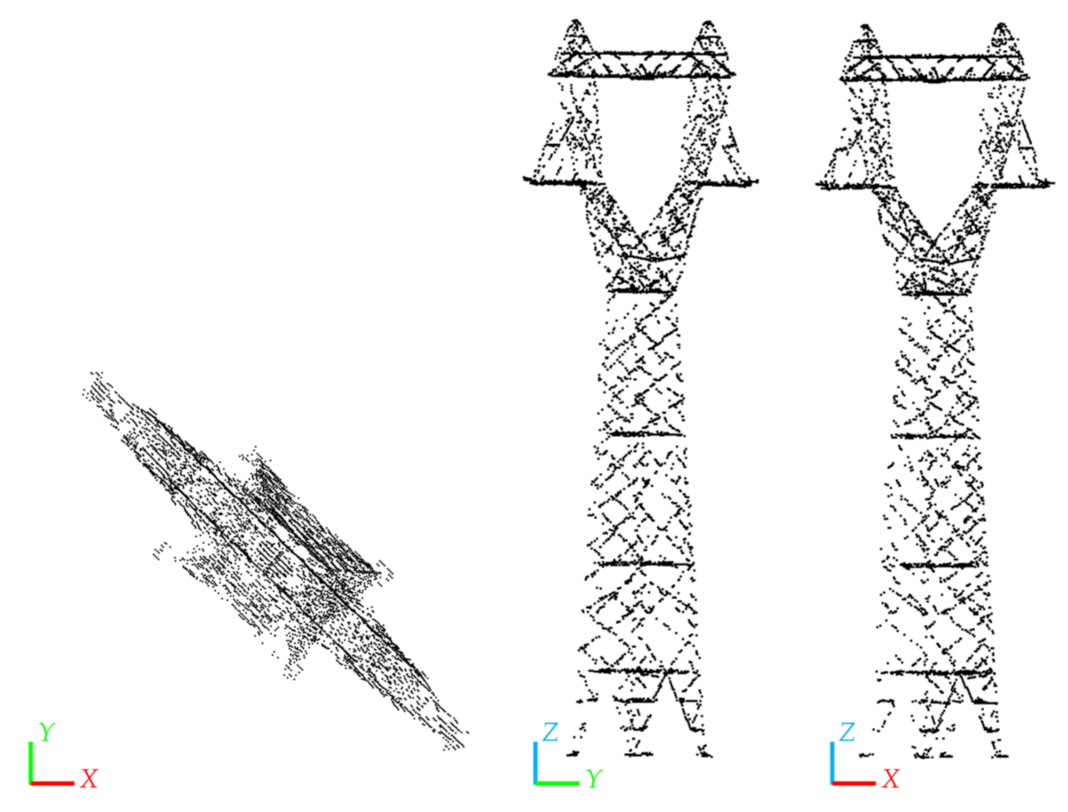
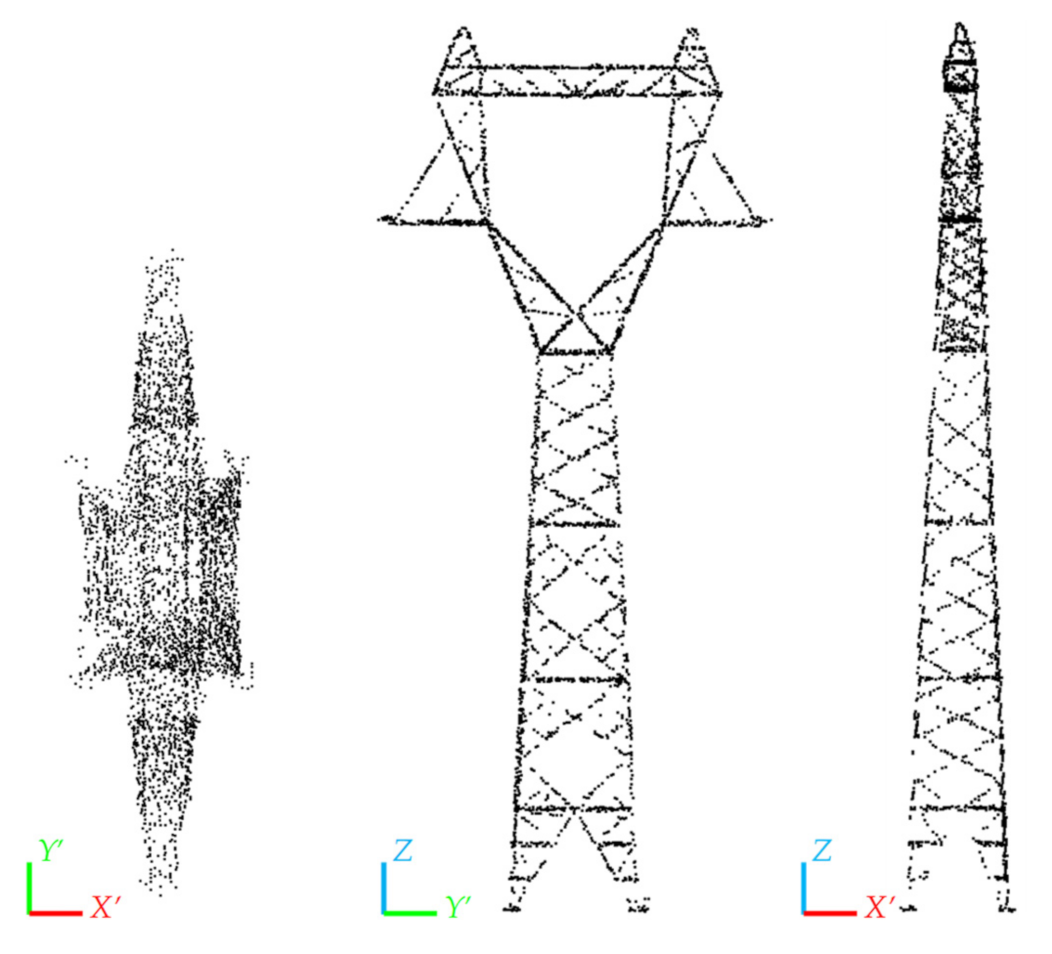
3.1. Pylon Redirection
- (1)
- The orientation of the power pylon on the XY plane is mainly related to its superstructure, here select the point cloud with the Z value above H and project the selected point cloud onto the XY plane;
- (2)
- The PCA algorithm is used to calculate the eigenvalues and eigenvectors of the point cloud after projection, where the eigenvector (,) that corresponds to the smallest eigenvalue is perpendicular to the principal direction of the point cloud at this time;
- (3)
- Equation (1) is used to calculate the rotation angle :
- (4)
- Equation (2) is used to calculate and coordinates after rotation:
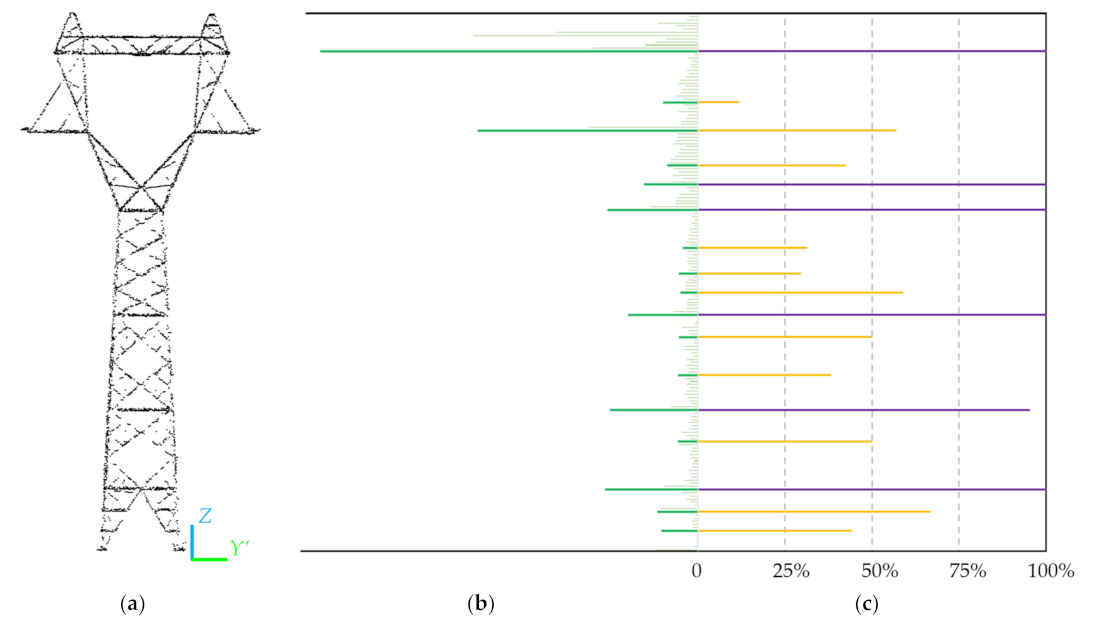
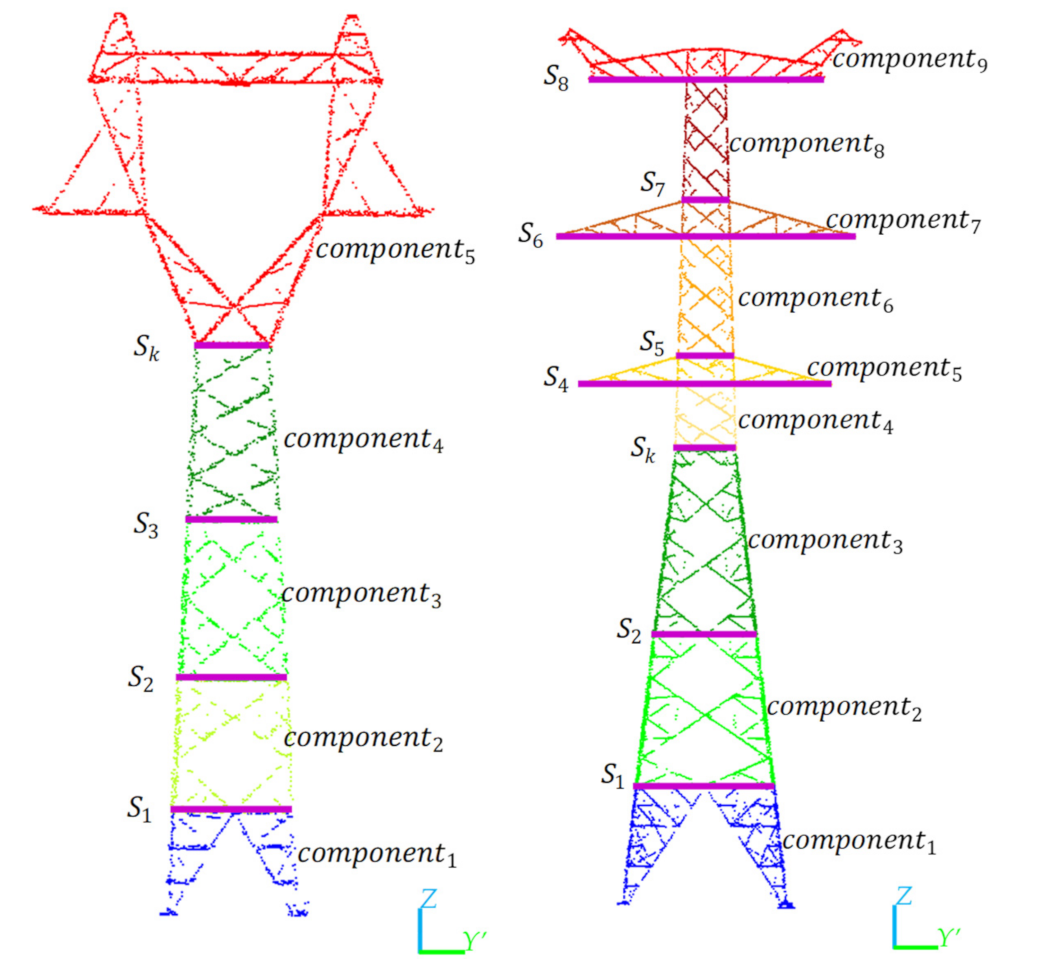
3.2. Pylon Structure Segmentation
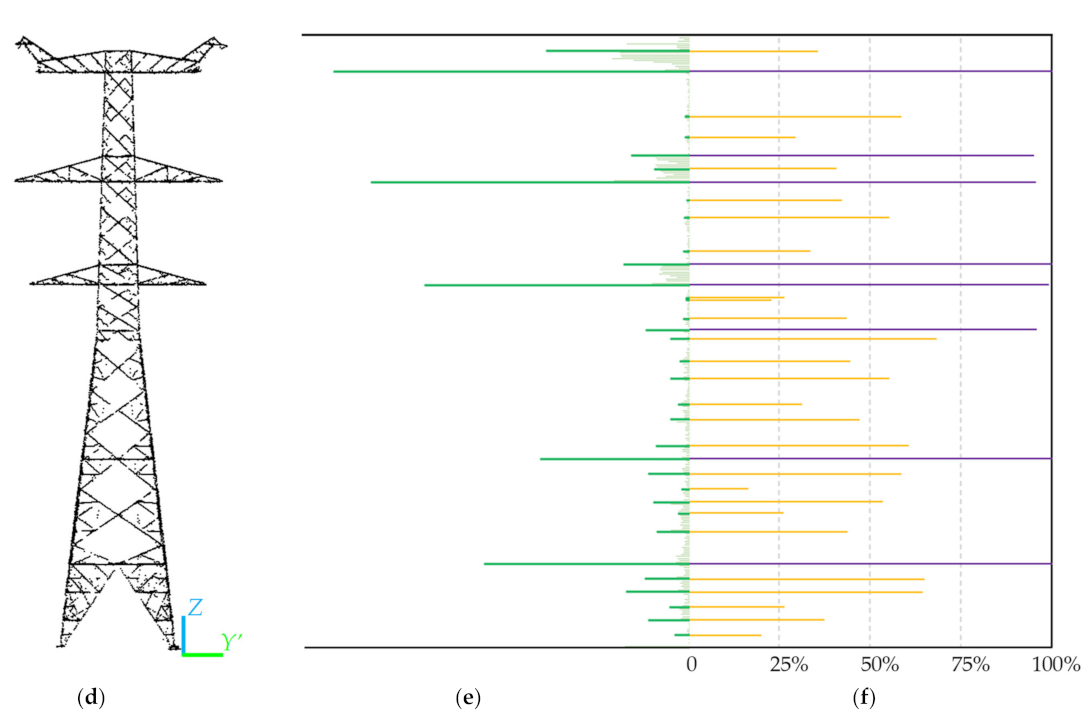
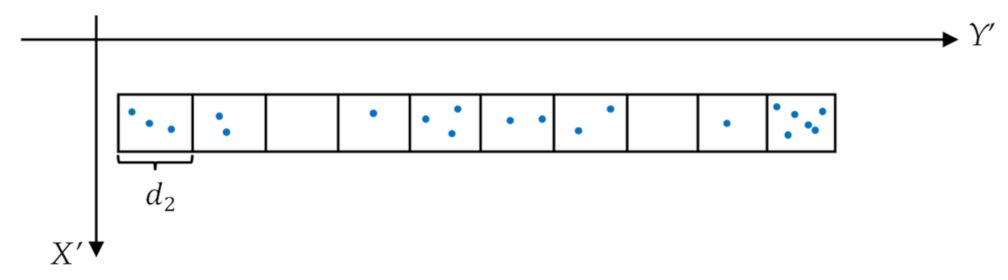
3.2.1. Identification of Segmentation Positions
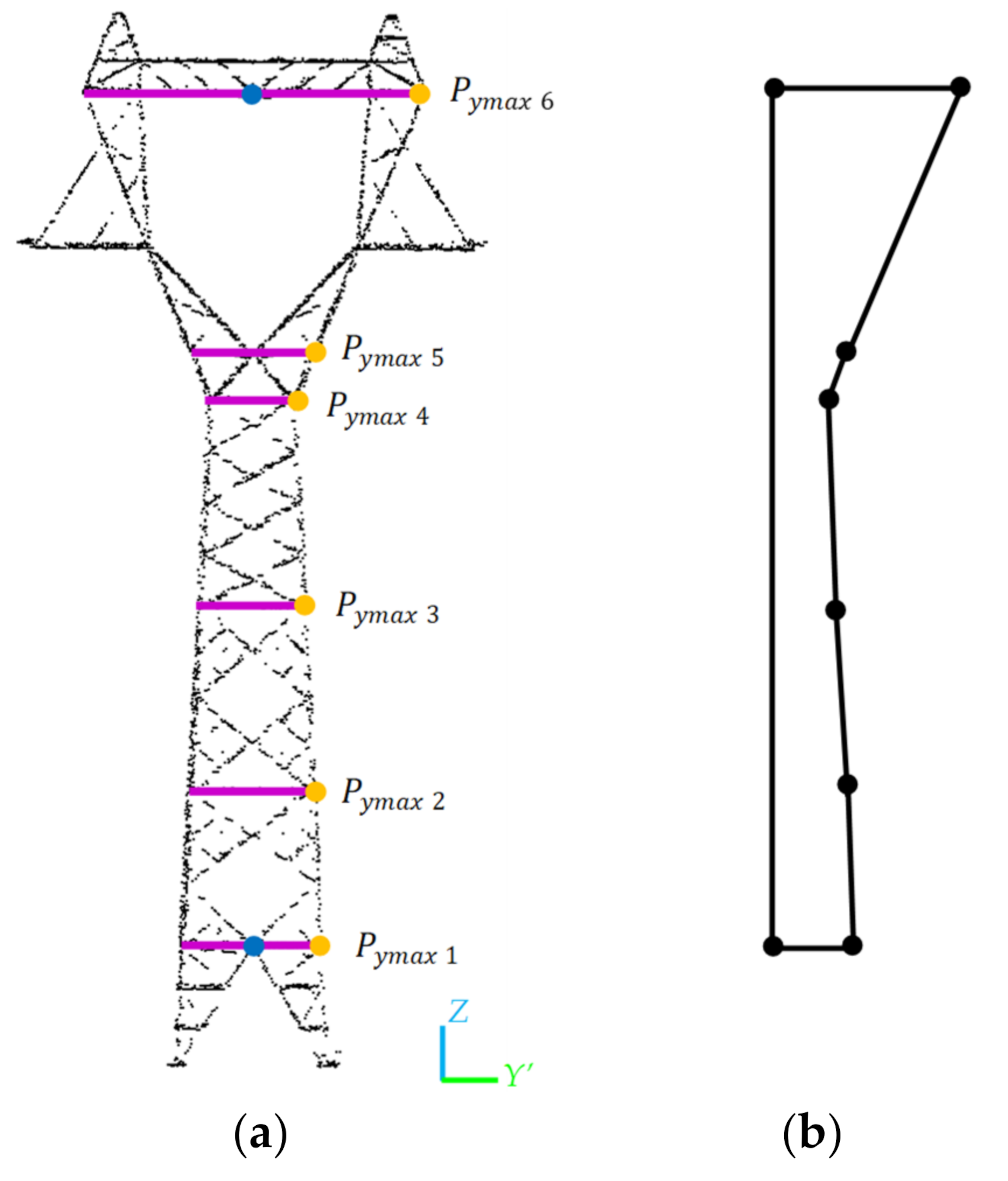
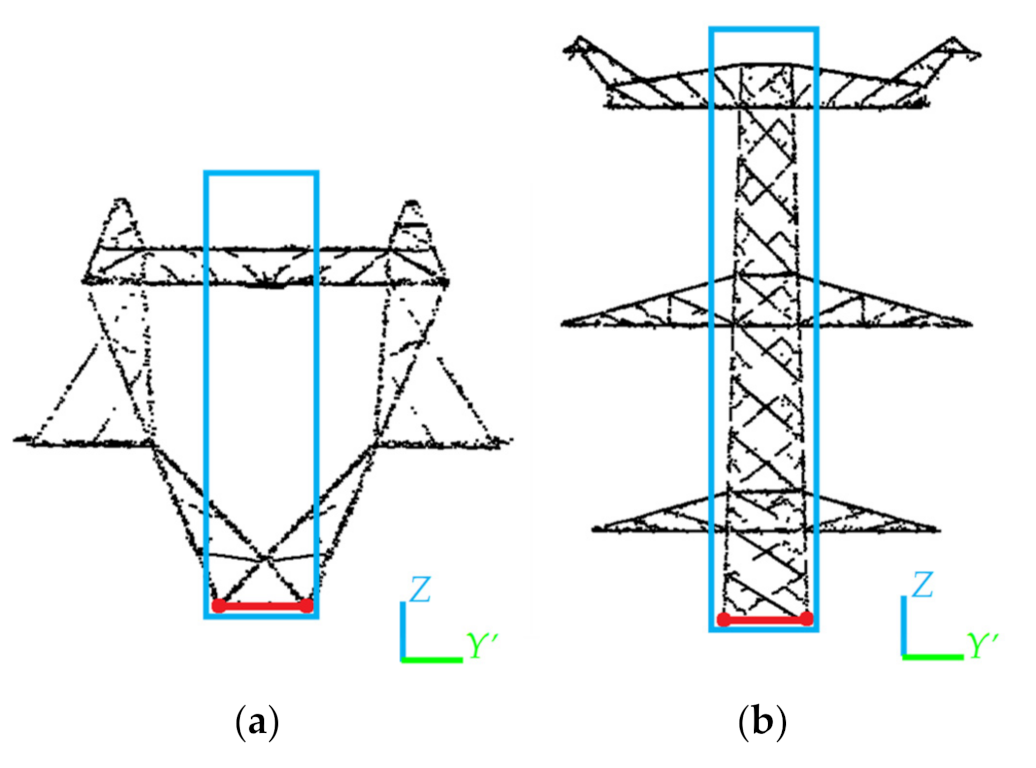
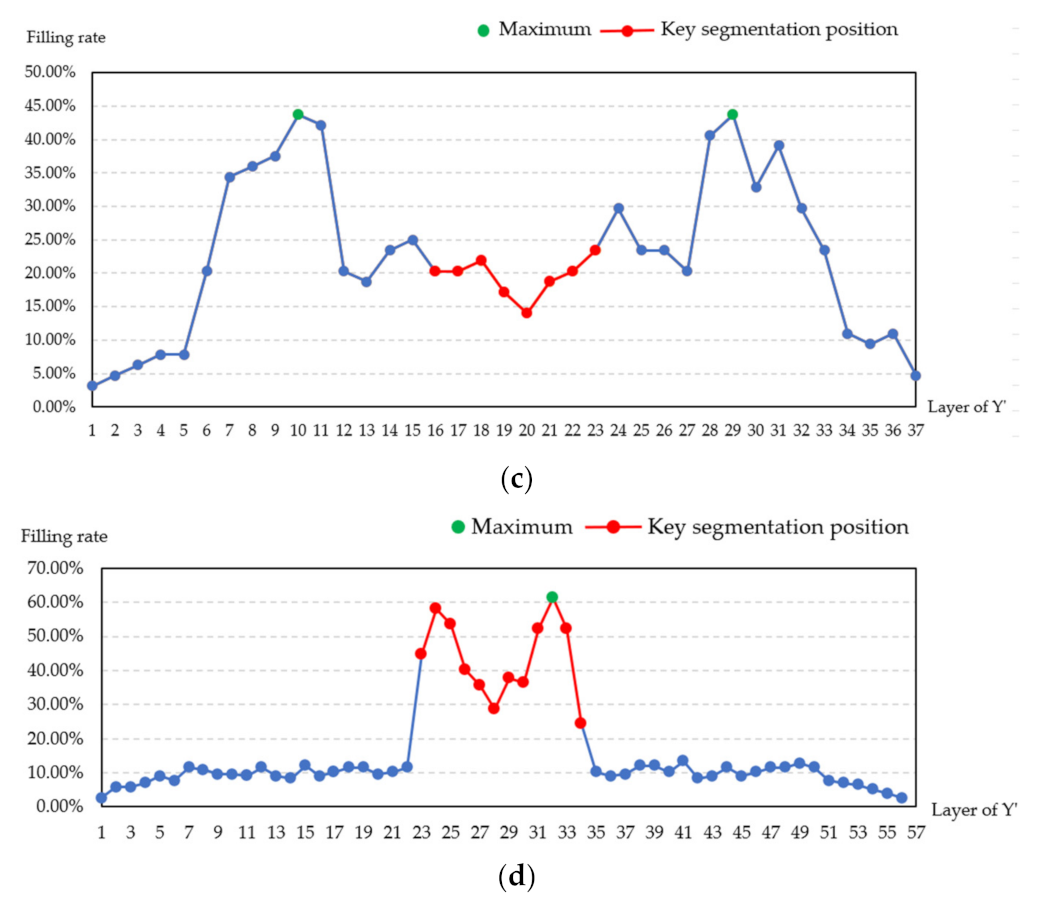
3.2.2. Key Segmentation Position Identification
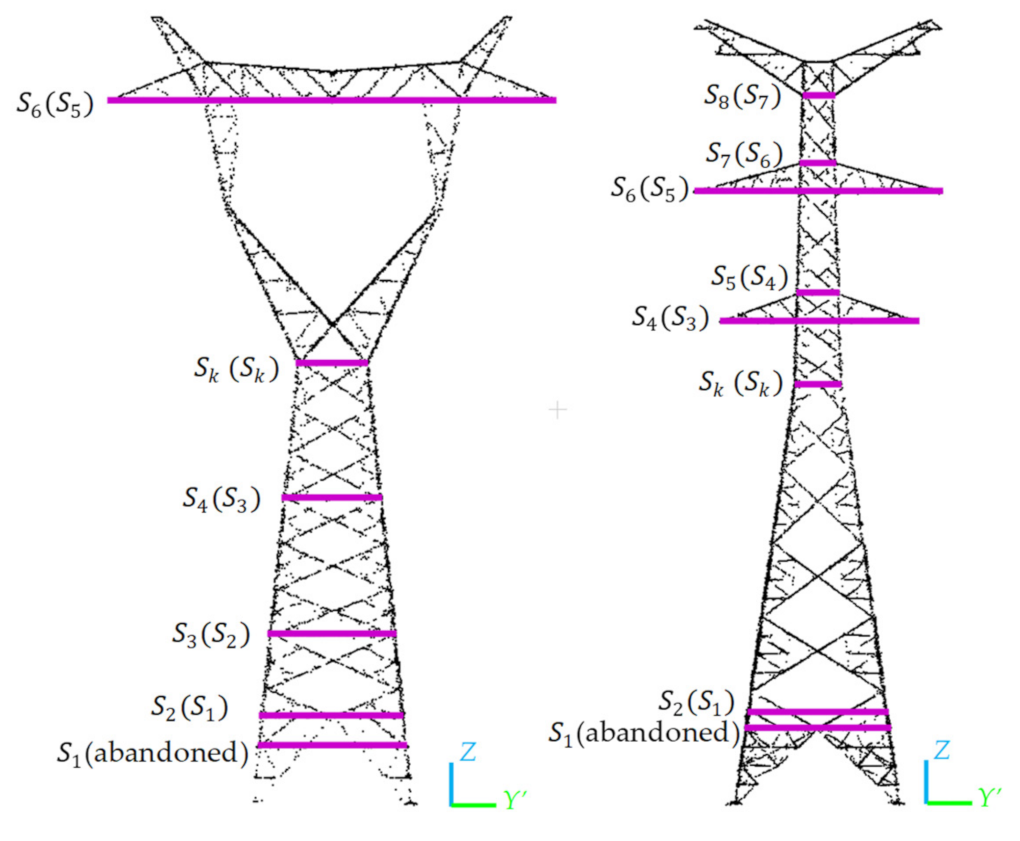
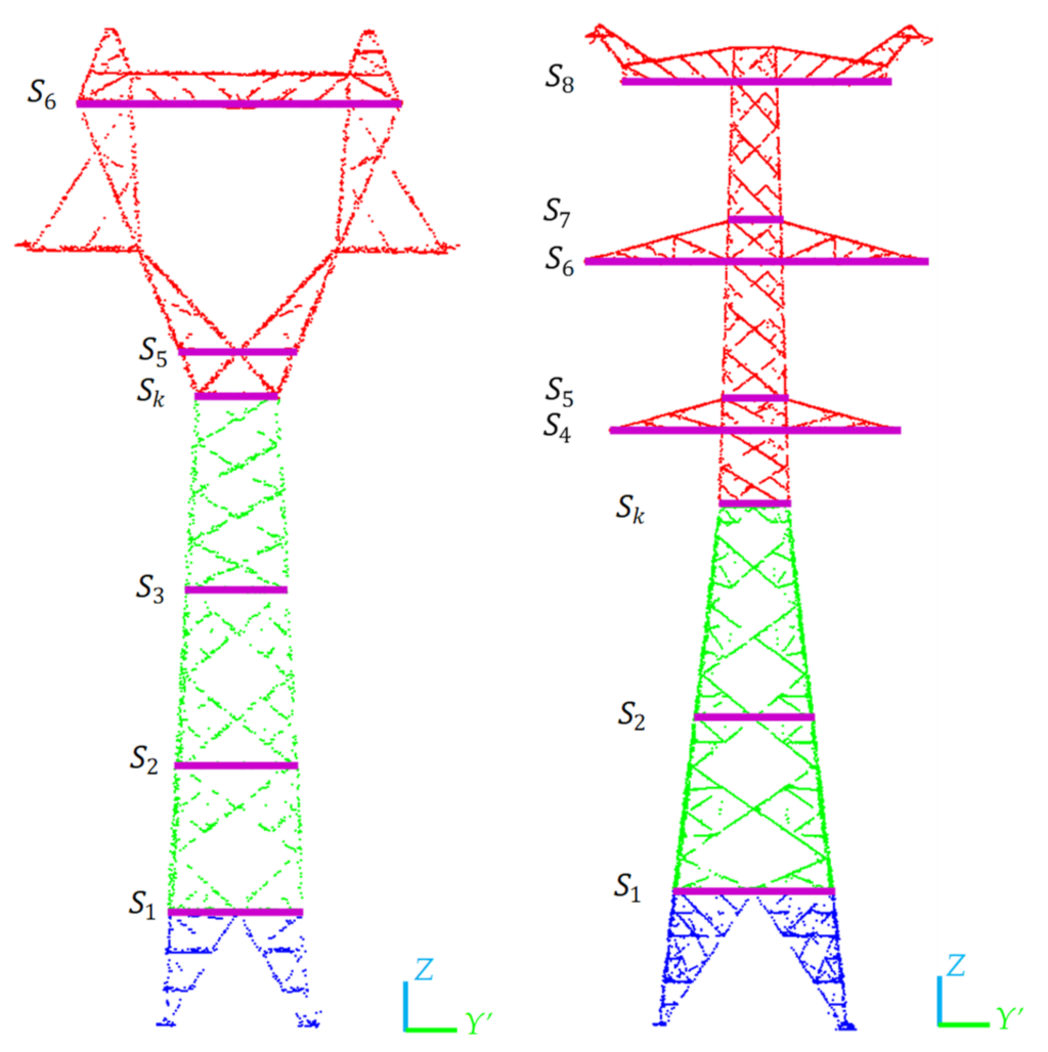
3.2.3. Type Identification and Structure Segmentation
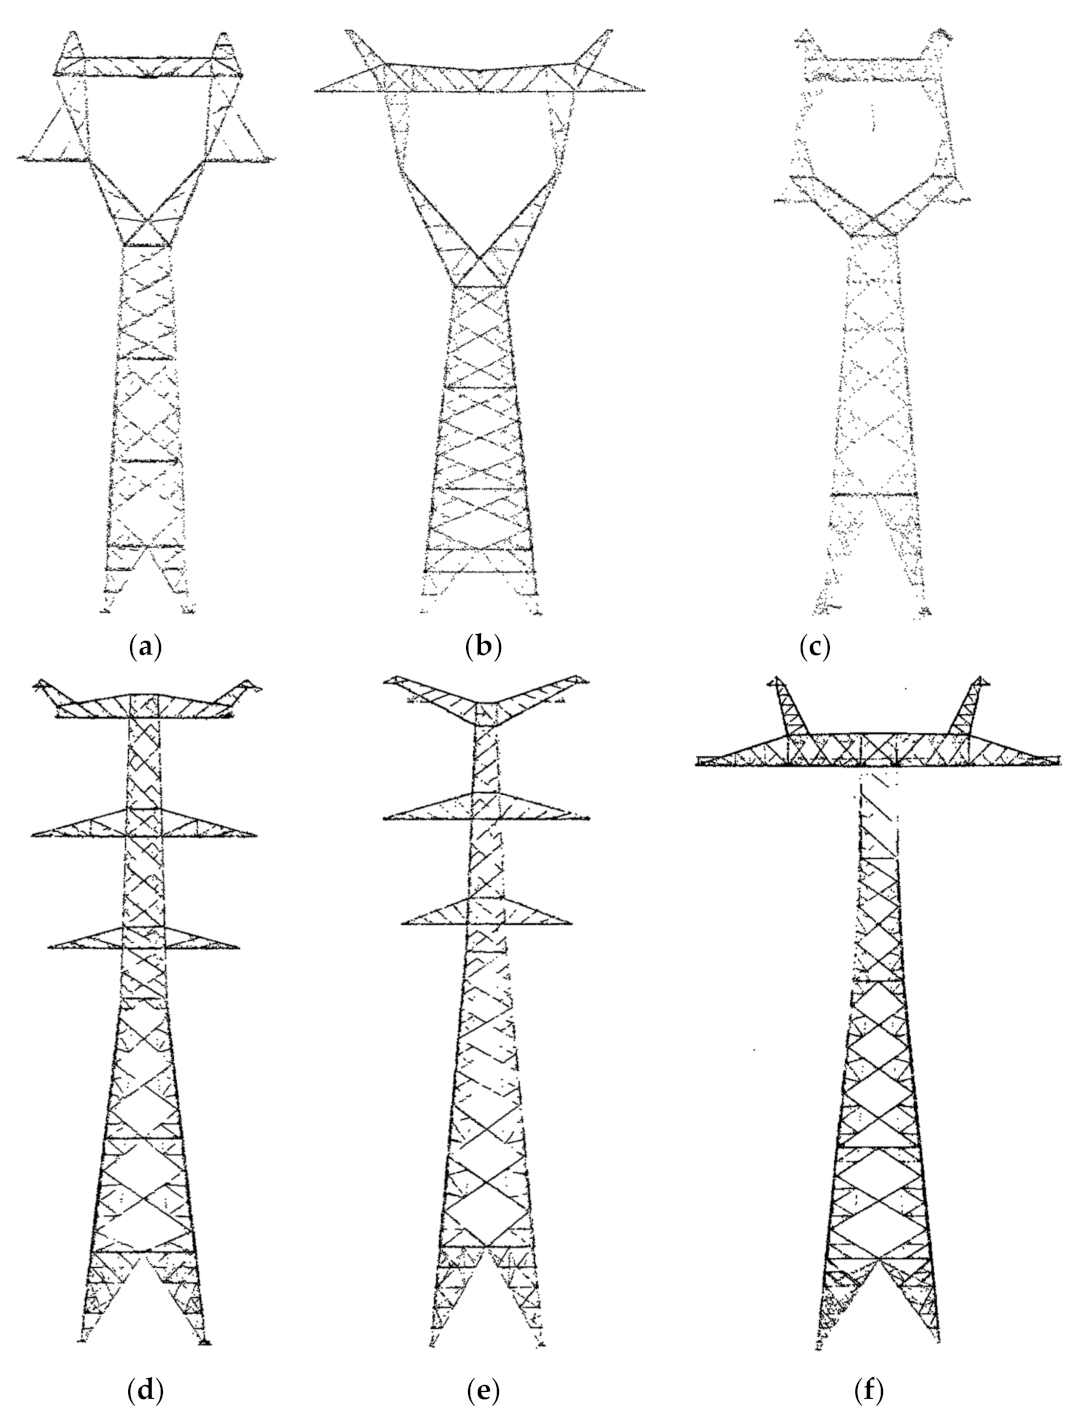
3.3. Pylon Reconstruction
3.3.1. Extract the Point Cloud Data from the Model
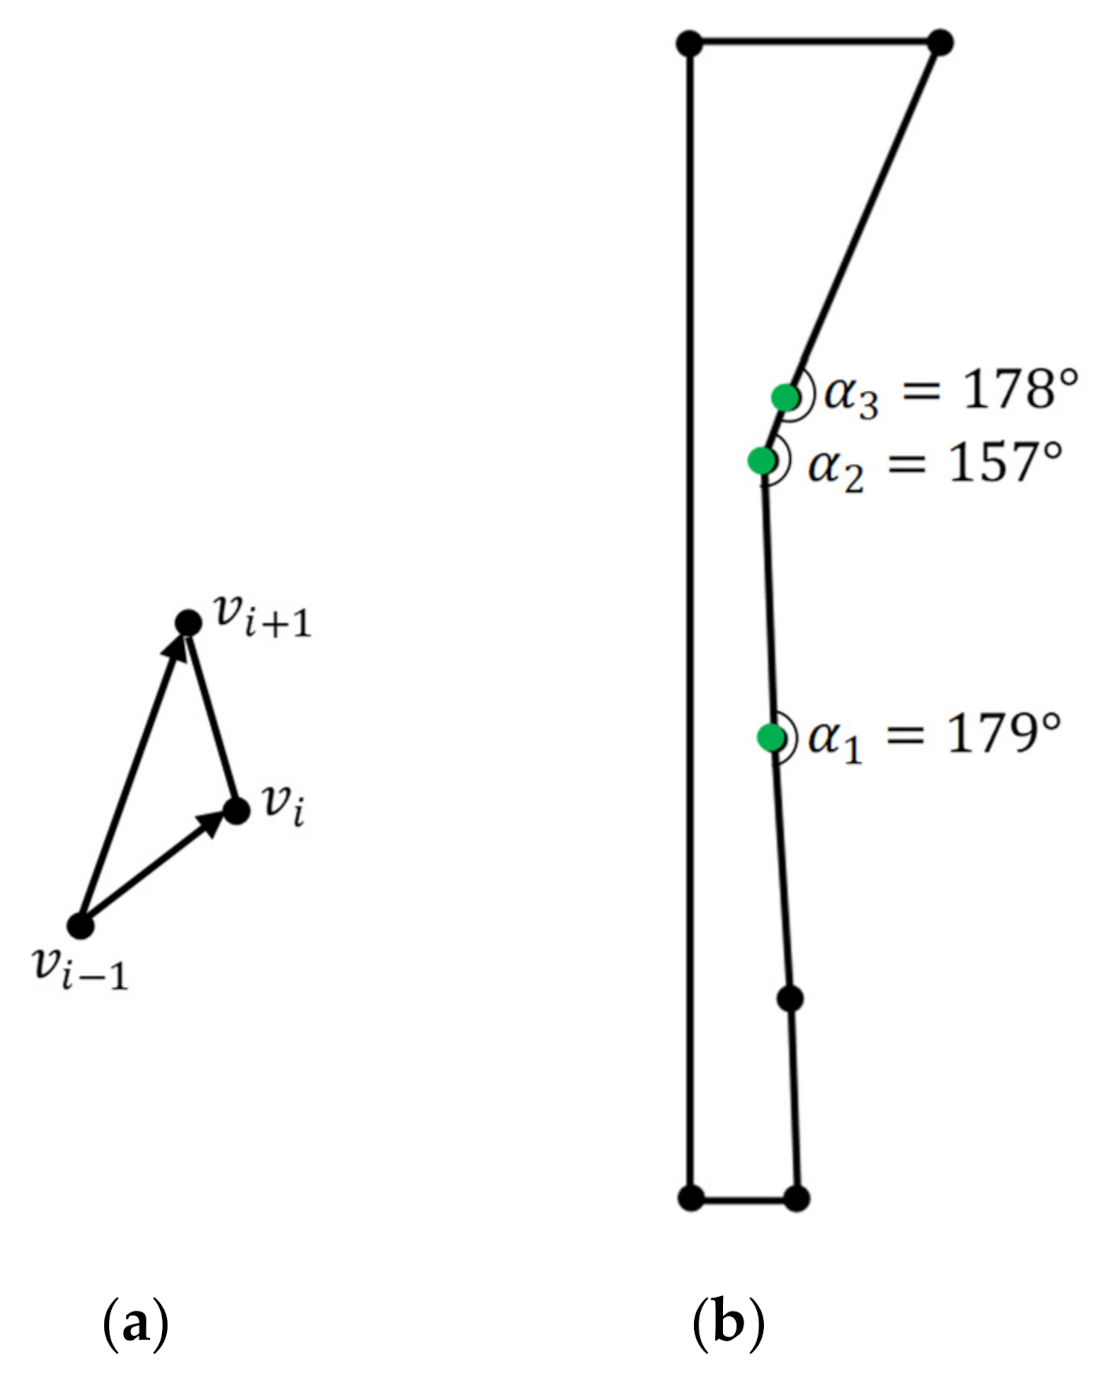
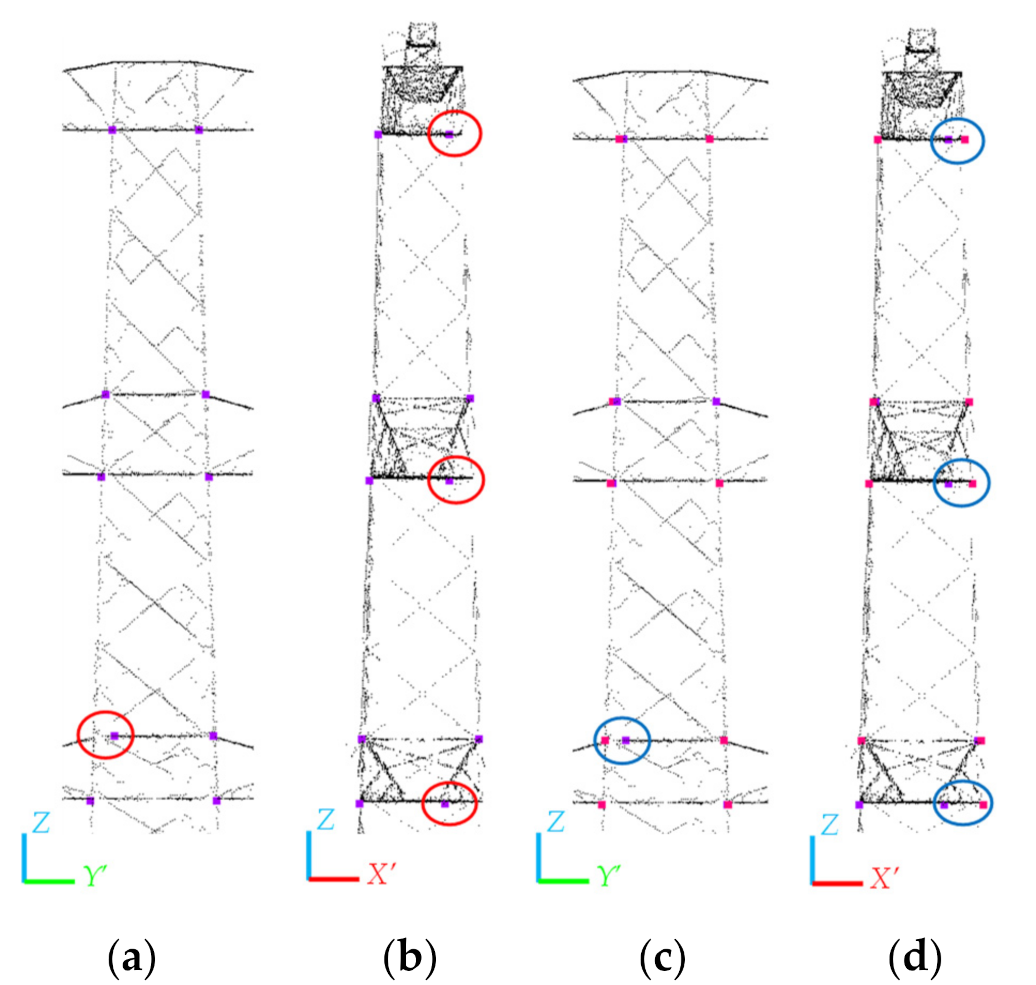
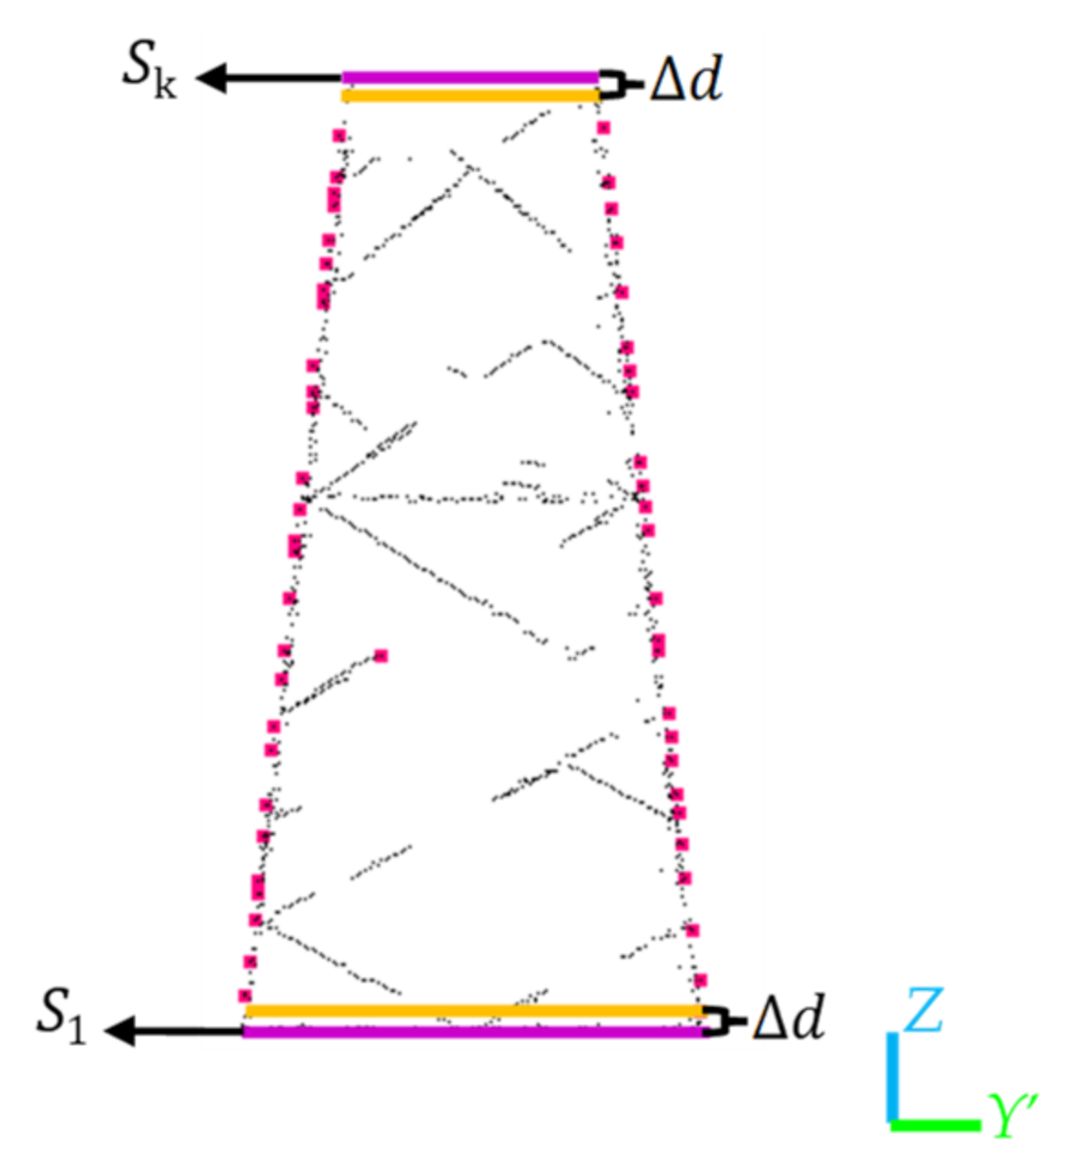
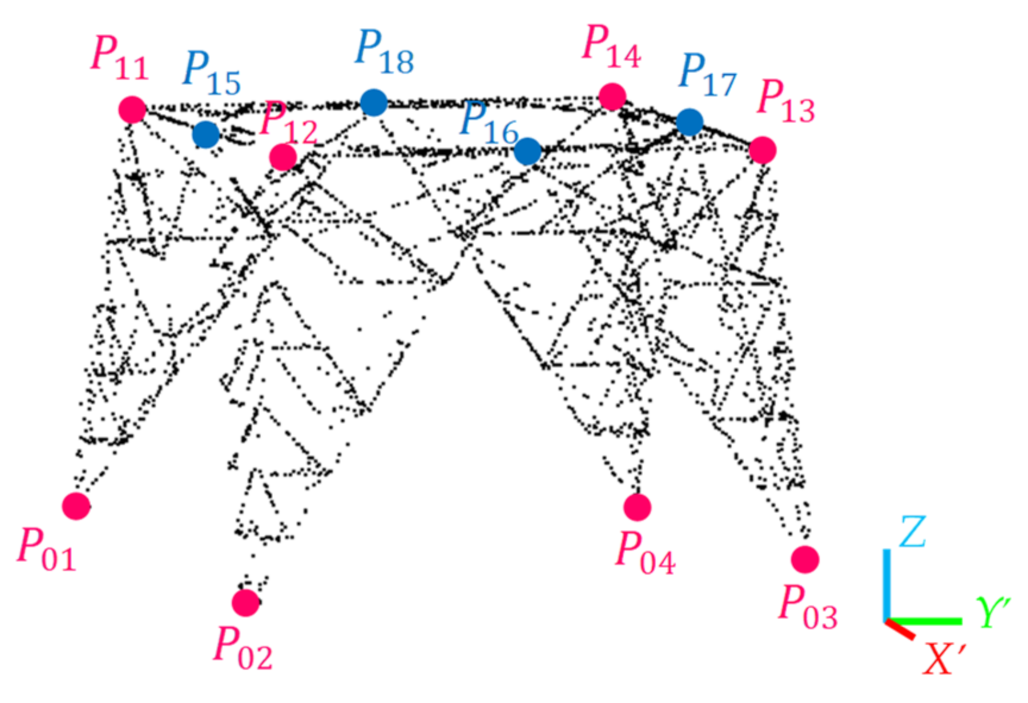
3.3.2. Extract and Correct Feature Points
3.3.3. Register Feature Point Sets
3.3.4. Pylon Reconstruction
4. Results
4.1. Accuracy of Feature Points
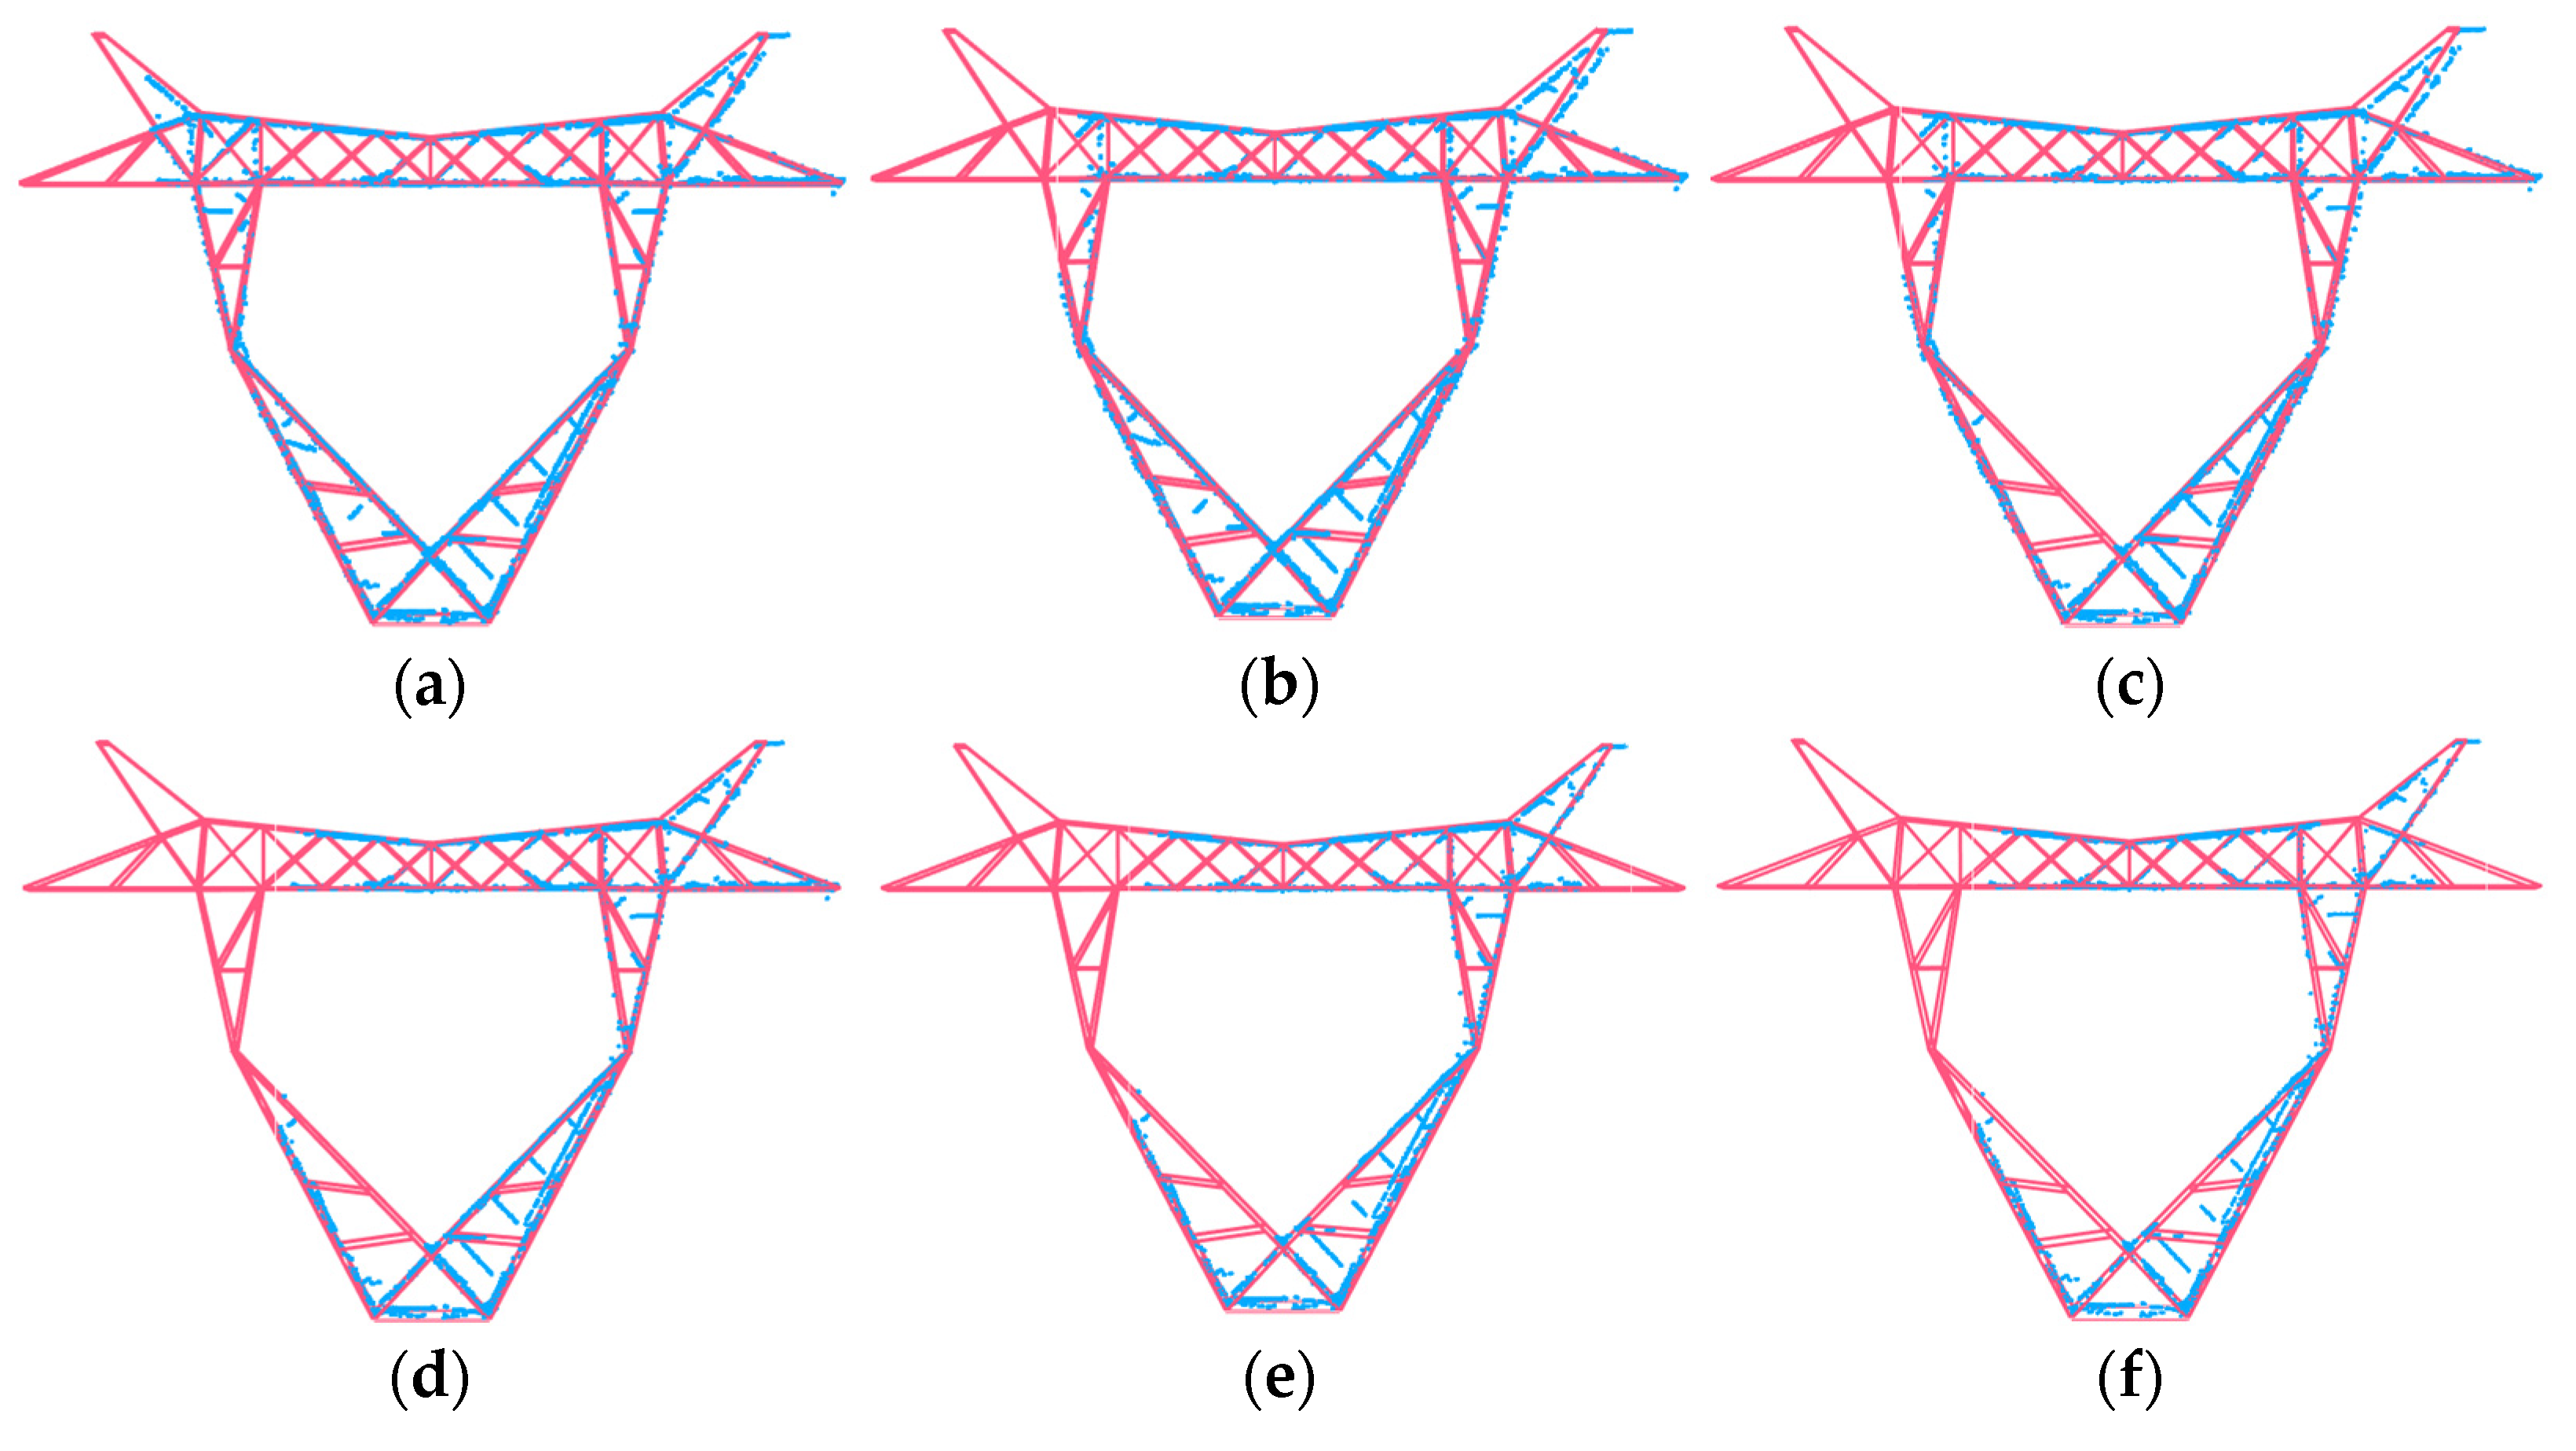
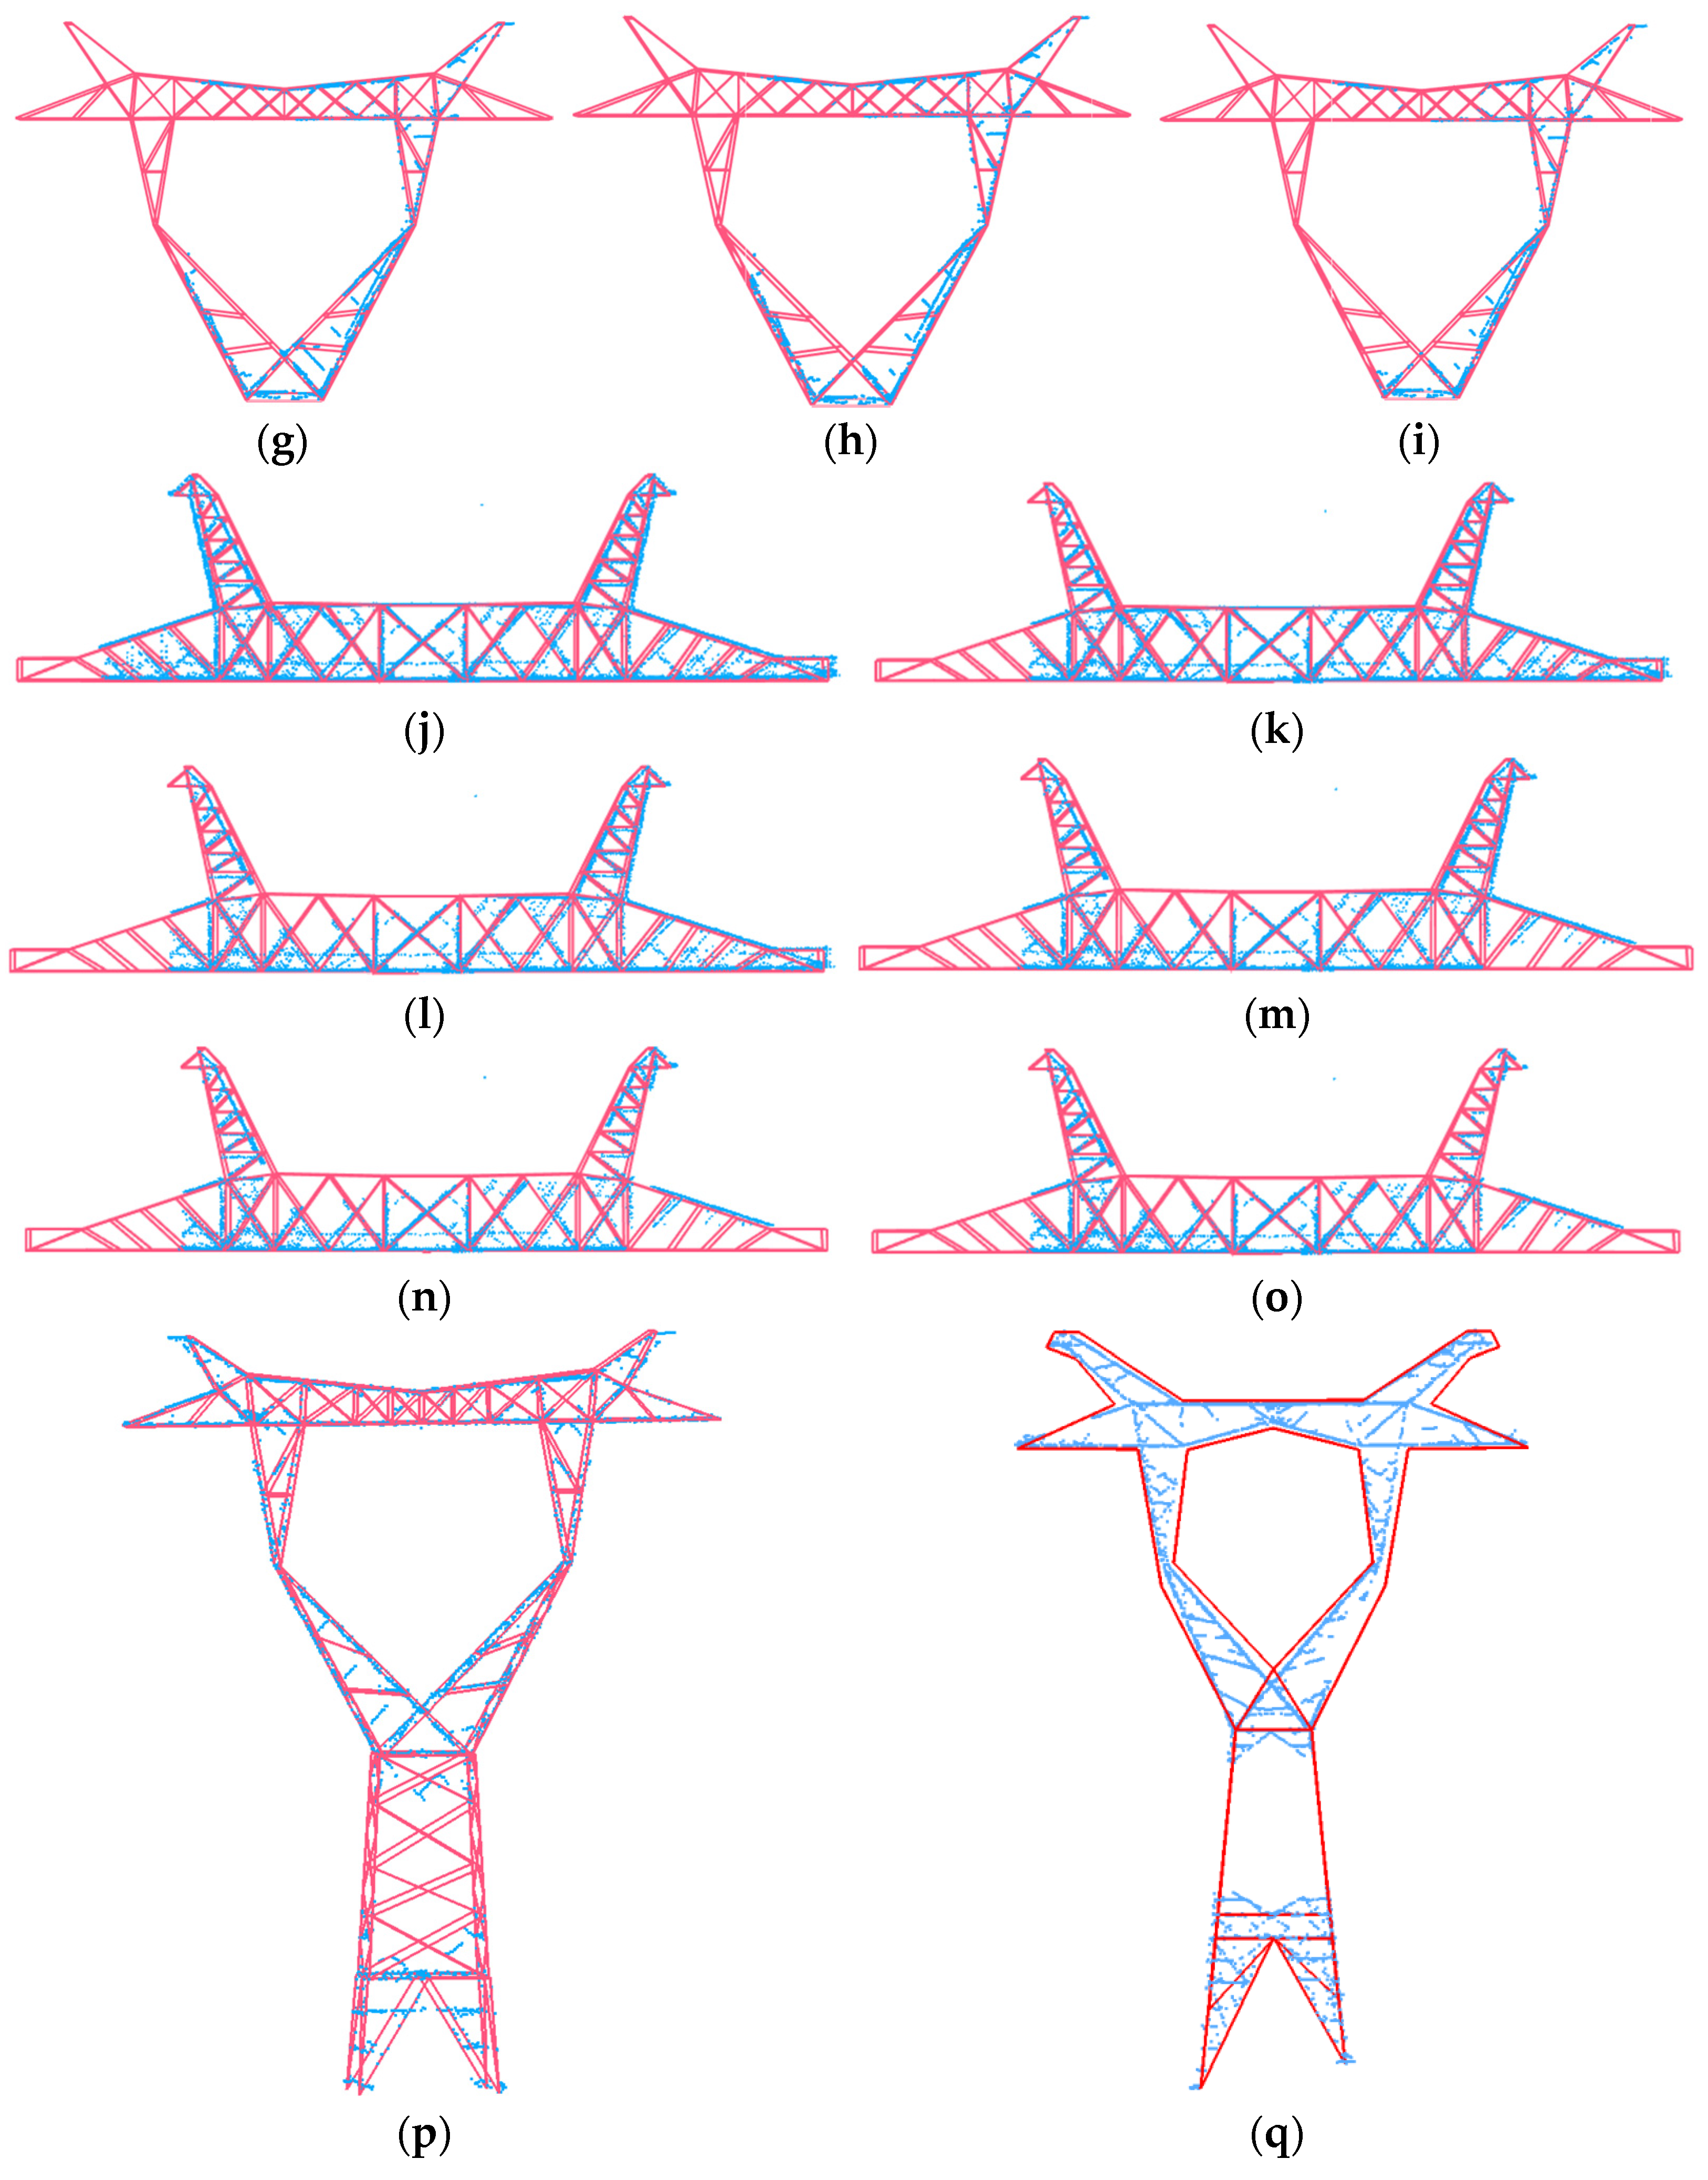
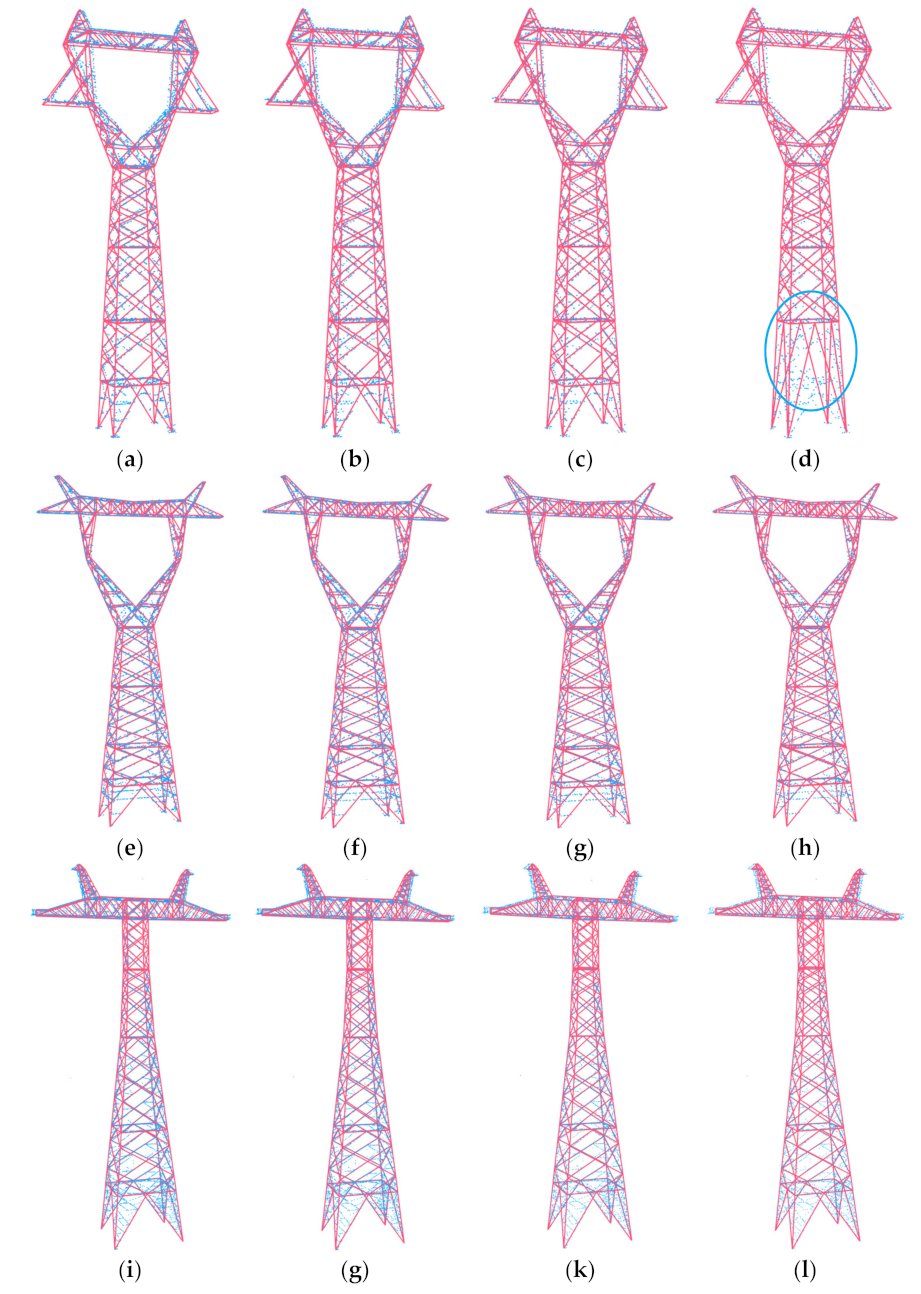
4.2. Accuracy of Pylon Reconstruction
5. Discussion
5.1. Noise Impact
5.2. Data Loss
5.3. Data Sparsity
6. Conclusions
Author Contributions
Funding
Acknowledgments
Conflicts of Interest
References
- Zhou, R.; Jiang, W.; Jiang, S. A novel method for high-voltage bundle conductor reconstruction from airborne LiDAR data. Remote Sens. 2018, 10, 2051. [Google Scholar] [CrossRef]
- Qiao, S.; Sun, Y.; Zhang, H. Deep learning based electric pylon detection in remote sensing images. Remote Sens. 2020, 12, 1857. [Google Scholar] [CrossRef]
- Peng, X.; Song, S.; Qian, J.; Chen, C.; Wang, K.; Yang, Y.; Zheng, X. Research on automatic positioning algorithm of power transmission towers based on UAV LiDAR. Power Syst. Technol. 2017, 41, 3670–3677. [Google Scholar] [CrossRef]
- Yu, B.; Chen, F.; Xu, C. Landslide detection based on contour-based deep learning framework in case of national scale of Nepal in 2015. Comput. Geosci. 2020, 135, 10438. [Google Scholar] [CrossRef]
- Chen, L. Analysis of transmission line real-time monitoring technology in power system. Electron. Compon. Inf. Technol. 2020, 4, 82–83. [Google Scholar] [CrossRef]
- Ma, W.; Wang, J.; Wang, C.; Xi, X.; Wang, P. Precise extraction and reconstruction of power line by using model residual. Sci. Surv. Mapp. 2020, 45, 60–66. [Google Scholar] [CrossRef]
- Guo, B.; Huang, X.; Li, Q.; Zhang, F.; Zhu, J.; Wang, C. A stochastic geometry method for pylon reconstruction from airborne LiDAR data. Remote Sens. 2016, 8, 243. [Google Scholar] [CrossRef]
- Zhou, R.; Jiang, W.; Huang, W.; Xu, B.; Jiang, S. A heuristic method for power pylon reconstruction from airborne LiDAR data. Remote Sens. 2017, 9, 1172. [Google Scholar] [CrossRef]
- Chen, Z.; Lan, Z.; Long, H.; Hu, Q. 3D modeling of pylon from airborne LiDAR data. In Proceedings of the 18th China National Symposium on Remote Sensing-Remote Sensing of the Environment, Wuhan, China, 20–23 October 2012. [Google Scholar] [CrossRef]
- Huang, W.; Jiang, S.; Jiang, W. A model-driven method for pylon reconstruction from oblique UAV images. Remote Sens. 2020, 20, 824. [Google Scholar] [CrossRef] [PubMed]
- Xiao, Y.; Wang, C.; Xi, X.; Wang, F. 3D building model reconstruction from airborne LiDAR data. Sci. Surv. Mapp. 2014, 39, 37–41. [Google Scholar] [CrossRef]
- Lin, X.; Duan, M.; Zhang, J.; Zang, Y. A method of reconstructing 3D powerlines from airborne LiDAR point clouds. Sci. Surv. Mapp. 2016, 41, 109–114+64. [Google Scholar] [CrossRef]
- Chen, J.; Wang, X.; Lu, X.; Zhang, C.; Wang, W.; Wang, R.; Shen, X. The overviews of application of three-dimensional LiDAR technology in operation and maintenance of overhead transmission lines in China. In Proceeding of the 2013 3rd International Conference on Advanced Measurement and Test (AMT 2013), Xiamen, China, 13 March 2013. [Google Scholar] [CrossRef]
- Chen, S.; Wang, C.; Dai, H.; Zhang, H.; Pan, F.; Xi, X.; Yan, Y.; Wang, P.; Yang, X.; Zhu, X.; et al. Power pylon reconstruction based on abstract template structures using airborne LiDAR data. Remote Sens. 2019, 11, 1579. [Google Scholar] [CrossRef]
- Han, W. Three-dimensional power tower modeling with airborne LiDAR data. J. Yangtze River Sci. Res. Inst. 2012, 29, 122–126. [Google Scholar] [CrossRef]
- Liu, C.; Sun, S.; Zhao, L. A lightweight network for power tower extraction from laser point cloud. Laser Technol. 2021, 45, 367–372. [Google Scholar] [CrossRef]
- Yu, W.; Xi, J.; Lei, W.; Wu, Z.; Wang, H.; Zhu, C.; Zhong, H.; Tang, T. A model-driven 3D modeling of power transmission towers. Geomat. World 2020, 27, 127–132. [Google Scholar]
- Li, Q.; Chen, Z.; Hu, Q. A model-driven approach for 3D modeling of pylon from airborne LiDAR data. Remote Sens. 2015, 7, 11501–11524. [Google Scholar] [CrossRef]
- Peng, Z.; Lü, Y.; Qu, C.; Zhu, D. Accurate registration of 3D point clouds based on keypoint extraction and improved iterative closest point algorithm. Laser Optoelectron. Prog. 2020, 57, 68–79. [Google Scholar] [CrossRef]
- Zinßer, T.; Schmidt, J.; Niemann, H. Point set registration with integrated scale estimation. In Proceeding of the International conference on pattern recognition and image processing, Minsk, Belarus, 18–20 May 2005. [Google Scholar]
- He, Y.; Liang, B.; Yang, J.; Li, S.; He, J. An iterative closest points algorithm for registration of 3D laser scanner point clouds with geometric features. Remote Sens. 2017, 17, 1862. [Google Scholar] [CrossRef] [PubMed]


| Parameter | Index |
|---|---|
| Field of view | 330° |
| Pulse repetition frequency | 550 kHz |
| Maximum scan speed | 200 scans/s |
| Beam divergence | 0.5 mrad |
| Accuracy/precision | 10 mm/5 mm |
| Max. range: target reflectivity 60% | 920 m |
| Max. range: target reflectivity 20% | 550 m |
| Average point density | 100 pts/m2 |
| Pylon Number | Number of Points | Length of the Pylon (m) | Width of the Pylon (m) | Height of the Pylon (m) |
|---|---|---|---|---|
| a | 6163 | 15.155 | 4.376 | 34.134 |
| b | 7489 | 24.464 | 7.011 | 43.352 |
| c | 3033 | 9.954 | 5.865 | 30.012 |
| d | 16,423 | 22.695 | 13.219 | 65.552 |
| e | 10,922 | 20.424 | 11.446 | 66.502 |
| f | 25,775 | 47.590 | 16.351 | 87.702 |
| Laptop | CPU | GPU | RAM |
|---|---|---|---|
| Lenovo XiaoXin Pro 16ACH 2021 | AMD Ryzen 7 5800H | NVIDIA GTX 1650 | 16 GB |
| Parameter | Meaning | Value |
|---|---|---|
| H(m) | Minimum height of point cloud for redirection | (3/4) × height of the pylon |
| (m) | The layer interval along the Z-axis direction | 0.2 |
| (m) | The height of the sliding window | 2.0 |
| (m) | The grid interval when calculating horizontal fill rate | 0.2 |
| The threshold of horizontal fill rate | 75% | |
| (°) | The angle threshold for identifying the key segmentation position | 165 |
| The proportional threshold for determining the segmentation position | 0.5 | |
| (m) | The layer interval along the Y’-axis direction | 0.2 |
| (m) | The sampling interval of the model | 0.05 |
| (m) | The height parameter when extracting pylon body boundary points | 0.2 |
| (m) | The distance threshold between corresponding point pairs | 0.3 |
| The proportional threshold of the amount of corresponding point pairs | 90% |
| Pylon Number | cm | cm | cm | cm | cm | cm | cm | cm | Average (cm) | |
|---|---|---|---|---|---|---|---|---|---|---|
| a | 4.2 | 9.9 | 0.6 | 1.2 | 4.0 | |||||
| 2.4 | 6.1 | 3.8 | 5.2 | 4.4 | ||||||
| 6.1 | 0.8 | 1.1 | 1.3 | 2.3 | ||||||
| 0.4 | 1.8 | 9.1 | 4.1 | 3.8 | ||||||
| 7.9 | 2.7 | 5.0 | 9.3 | 6.5 | ||||||
| b | 3.8 | 9.5 | 1.7 | 2.2 | 4.3 | |||||
| 1.8 | 4.4 | 5.0 | 0.7 | 3.0 | ||||||
| 3.6 | 0.7 | 7.2 | 3.1 | 3.6 | ||||||
| 6.3 | 3.2 | 3.7 | 2.7 | 4.0 | ||||||
| 9.5 | 3.0 | 6.5 | 7.0 | 6.5 | ||||||
| c | 2.2 | 0.9 | 0.7 | 6.4 | 2.5 | |||||
| 3.7 | 0.6 | 2.1 | 5.2 | 2.9 | ||||||
| 4.0 | 0.3 | 0.5 | 0.9 | 1.4 | ||||||
| 0.4 | 3.0 | 0.6 | 2.9 | 1.7 | ||||||
| 6.5 | 6.5 | 2.0 | 7.0 | 5.5 | ||||||
| d | 7.1 | 5.0 | 2.5 | 4.1 | 1.7 | 1.4 | 4.4 | 13.3 | 4.9 | |
| 9.7 | 9.2 | 7.9 | 8.8 | 4.3 | 3.8 | 4.3 | 13.1 | 7.6 | ||
| 2.0 | 3.7 | 1.6 | 2.0 | 1.8 | 7.9 | 9.8 | 13.1 | 5.2 | ||
| 1.2 | 0.9 | 2.5 | 5.1 | 1.2 | 1.7 | 0.9 | 0.5 | 1.8 | ||
| 0.0 | 2.5 | 5.0 | 6.5 | 2.0 | 8.5 | 0.5 | 1.5 | 3.3 | ||
| e | 10.6 | 5.3 | 9.4 | 17.2 | 15.0 | 6.9 | 14.0 | 11.2 | ||
| 3.4 | 8.3 | 0.8 | 5.1 | 13.0 | 1.1 | 1.4 | 4.7 | |||
| 2.1 | 6.5 | 5.0 | 9.6 | 2.6 | 1.4 | 0.8 | 4.0 | |||
| 0.7 | 12.0 | 11.7 | 1.6 | 15.1 | 18.7 | 13.1 | 10.4 | |||
| 6.0 | 1.0 | 0.5 | 5.5 | 3.0 | 2.5 | 0.5 | 2.7 | |||
| f | 5.6 | 0.0 | 1.0 | 7.6 | 11.6 | 5.2 | ||||
| 5.3 | 2.8 | 5.2 | 6.8 | 15.9 | 7.2 | |||||
| 6.4 | 1.0 | 3.8 | 6.5 | 0.0 | 3.6 | |||||
| 1.5 | 0.9 | 0.9 | 9.1 | 1.0 | 2.7 | |||||
| 1.3 | 3.7 | 5.4 | 6.5 | 3.1 | 4.0 |
| Pylon Number | * (cm) | * (cm) | * (cm) | * (cm) | * (cm) | * (cm) | * (cm) | * (cm) | * (cm) | Average (cm) |
|---|---|---|---|---|---|---|---|---|---|---|
| a | - | 13.8 | 11.8 | 9.5 | 16.4 | 12.9 | ||||
| b | - | 18.7 | 15.5 | 17.9 | 15.8 | 17.0 | ||||
| c | - | 14.5 | 11.0 | 10.5 | 16.1 | 13.0 | ||||
| d | - | 17.6 | 15.5 | 10.5 | 18.7 | 11.8 | 17.0 | 14.8 | 20.7 | 15.8 |
| e | - | 15.5 | 13.8 | 13.8 | 14.1 | 12.6 | 15.2 | 18.4 | 14.8 | |
| f | - | 18.2 | 17.9 | 17.6 | 17.9 | 18.7 | 18.1 |
| Pylon Number | Point Cloud | The Number of Points | |
|---|---|---|---|
| a | Original Point Cloud | 6163 | |
| Sample distance | 0.1 m | 5069 | |
| 0.2 m | 3590 | ||
| 0.3 m | 2573 | ||
| 0.4 m | 1955 | ||
| b | Original Point Cloud | 7489 | |
| Sample distance | 0.1 m | 6565 | |
| 0.2 m | 5318 | ||
| 0.3 m | 4173 | ||
| 0.4 m | 3288 | ||
| f | Original Point Cloud | 25,775 | |
| Sample distance | 0.1 m | 23,106 | |
| 0.2 m | 15,923 | ||
| 0.3 m | 11,528 | ||
| 0.4 m | 8663 | ||
Publisher’s Note: MDPI stays neutral with regard to jurisdictional claims in published maps and institutional affiliations. |
© 2022 by the authors. Licensee MDPI, Basel, Switzerland. This article is an open access article distributed under the terms and conditions of the Creative Commons Attribution (CC BY) license (https://creativecommons.org/licenses/by/4.0/).
Share and Cite
Qiao, Y.; Xi, X.; Nie, S.; Wang, P.; Guo, H.; Wang, C. Power Pylon Reconstruction from Airborne LiDAR Data Based on Component Segmentation and Model Matching. Remote Sens. 2022, 14, 4905. https://doi.org/10.3390/rs14194905
Qiao Y, Xi X, Nie S, Wang P, Guo H, Wang C. Power Pylon Reconstruction from Airborne LiDAR Data Based on Component Segmentation and Model Matching. Remote Sensing. 2022; 14(19):4905. https://doi.org/10.3390/rs14194905
Chicago/Turabian StyleQiao, Yiya, Xiaohuan Xi, Sheng Nie, Pu Wang, Hao Guo, and Cheng Wang. 2022. "Power Pylon Reconstruction from Airborne LiDAR Data Based on Component Segmentation and Model Matching" Remote Sensing 14, no. 19: 4905. https://doi.org/10.3390/rs14194905
APA StyleQiao, Y., Xi, X., Nie, S., Wang, P., Guo, H., & Wang, C. (2022). Power Pylon Reconstruction from Airborne LiDAR Data Based on Component Segmentation and Model Matching. Remote Sensing, 14(19), 4905. https://doi.org/10.3390/rs14194905