Article

High-Resolution Daily Emission Inventory of Biomass Burning in the Amur-Heilong River Basin Based on MODIS Fire Radiative Energy Data

1
Heilongjiang Province Key Laboratory of Geographical Environment Monitoring and Spatial Information Service in Cold Regions, Harbin Normal University, Harbin 150025, China
2
Heilongjiang Province Collaborative Innovation Center of Cold Region Ecological Safety, Harbin Normal University, Harbin 150025, China
3
State Environmental Protection Key Laboratory of Satellite Remote Sensing, Aerospace Information Research Institute, Chinese Academy of Sciences, Beijing 100101, China
*
Author to whom correspondence should be addressed.
Remote Sens. 2022, 14(16), 4087; https://doi.org/10.3390/rs14164087
Submission received: 19 May 2022 / Revised: 5 August 2022 / Accepted: 17 August 2022 / Published: 21 August 2022
(This article belongs to the Special Issue Remote Sensing of the Russian Boreal Forest)

Abstract

:
Open biomass burning (OBB) is one of the major factors that influences the regional climate environment and surface vegetation landscape, and it significantly affects the regional carbon cycle process and atmospheric environment. The Amur-Heilong River Basin (ARB) is a fire-prone region in high-latitude boreal forests. In this study, we used fire radiative power (FRP) obtained from a Moderate-resolution Imaging Spectroradiometer (MODIS) to estimate OBB emissions from the ARB and established a long-term series (2003–2020) with a high spatiotemporal resolution and a daily 1 km emissions inventory. The results show that the annual average emissions of CO2, CO, CH4, NMHCs, NOx, NH3, SO2, BC, OC, PM2.5, and PM10 were estimated to be 153.57, 6.16, 0.21, 0.78, 0.28, 0.08, 0.06, 0.04, 0.39, 0.66, and 0.85 Tg/a, respectively. Taking CO2 as an example, grassland fire in the dry season (mainly in April and October) was the largest contributor (87.18 Tg/a), accounting for 56.77% of the total CO2 emissions from the ARB, followed by forest fire prone to occur in April–May (56.53 Tg/a, 36.81%) and crop fire during harvest season (9.86 Tg/a, 6.42%). Among the three countries in the ARB, Russia released the most total CO2 emissions (2227.04 Tg), much higher than those of China (338.41 Tg) and Mongolia (198.83 Tg). The major fire types were crop fires (40.73%) on the Chinese side and grass fires on the Russian (56.67%) and Mongolian (97.56%) sides. Over the past decade, OBB CO2 emissions have trended downward (−0.79 Tg/a) but crop burning has increased significantly (+0.81 Tg/a). Up to 83.7% of crop fires occurred in China (2010–2020), with a concentrated and southward trend. Comparisons with the Global Fire Emission Dataset (GFED4.1s), the Fire INventory from NCAR (FINNv2.2), and the Global Fire Assimilation System (GFASv1.2) showed that our newly established emission inventory was in good agreement with these three datasets in the ARB. However, this multi-year, daily 1 km high-resolution emission inventory has the advantages of detecting more small fire emissions that were overlooked by coarse-grid datasets. The methods described here can be used as an effective means of estimating greenhouse gas and aerosol emissions from biomass combustion.

1. Introduction

Open biomass burning (OBB), which includes forest, shrubland, grassland and crop residue fire burning, is an important factor that affects ecosystem processes and dynamics and a major cause of disturbance and change in a wide range of biomes at regional and global scales [1,2,3,4]. OBB releases significant amounts of trace gases, aerosols, and greenhouse gases (GHGs) (e.g., CO2, CH4, and N2O) into the atmosphere [2,5]. According to the Global Fire Emissions Database v4.1s (GFED4.1s), the global mean carbon emission from OBB was 2.2 PgC a−1 during the period of 1997–2016 [6]. During the 2000–2010 period, fires associated with deforestation emitted approximately 1.0 PgC a−1 worldwide [7,8]. Due to numerous peat and tropical deforestation/degradation fires, global CO2 emissions from land use changes in 2019 were 1.8 ± 0.7 PgC, slightly higher than in the previous decade [9]. While a significant fraction of the emitted CO2 is taken up again by vegetation regrowth, much of it remains in the atmosphere for years and potentially even centuries, such as in the case of tropical deforestation fires or burning of peat soil [6]. Therefore, OBB emissions have become a major source of uncertainty and are an important input parameter in terrestrial ecosystem cycle and atmospheric transport simulations [10]. Furthermore, OBB is an important source of chemically reactive gases for some important atmospheric pollutants such as nitric oxide, carbon monoxide, volatile organic compounds (VOCs), black carbon (BC), and primary organic aerosol (POA) [11,12]. Among them, nonmethane organic gases (NMOGs, also referred to as VOCs) produced by OBB are considered to be the second largest source in the world [13,14]. Based on the estimates of Bond et al. (2013), they account for 59% of BC emissions and 85% of POA emissions worldwide [15]. Open vegetation fires alone represent about one-third to one-half of global carbon monoxide (CO) emissions [3,16] and 20% of nitrogen oxide (NOx) emissions [3,16]. These observations make it important to quantify OBB emissions at global and regional scales.
Satellite inversion with medium and high spatial and temporal resolution proves to be reliable for quantifying OBB emissions [17,18,19]. The traditional method of estimating emissions from biomass burning is based on the burned area proposed by Seiler and Crutzen in 1980 [20,21]. Pollutant inventory can be estimated by using burned area (km2), combustible biomass (kg dry matter m−2), combustion efficiency (%), and emission factor (g kg−1) for each emitted species [17,20,22]. This is exemplified by the GFED derived with the Carnegie–Ames–Stanford Approach (CASA) biogeochemical model. The GFED quantifies trace gas and aerosol emissions from global biomass combustion with the burned area retrieved by satellites, the fuel load simulated by the biogeochemical model, the combustion factor for humidity adjustment, and the emission factor based on land cover [23]. It provides monthly global OBB emissions from different vegetation fires since 1997 at a spatial resolution of 0.25° × 0.25° (unit: g/m2/month) [19,24]. However, van der Werf et al. (2017) showed that the GFED simulation result differs by about 14% from field observations of available biomass fuel [6]. This is due to uncertainty in the parameters involved in the approach. For example, most crop fires burn in a small area; however, this may be overestimated with satellite imagery [18,25]. The combustible biomass load and its combustion coefficient vary significantly with vegetation type, and thus introduce errors in the estimation [25,26], especially for areas with alternate vegetation. Alternatively, the Fire INventory from NCAR (FINN) data provide estimates of OBB with high spatial and temporal resolution (1 km2 per day), but the FINN results are mainly based on fire count data [18]. The burned area in each active fire pixel is assumed to be 1 km2, except for grasslands and savannas where a value of 0.75 km2 is assigned [27]. However, the actual burned area for each fire count can vary to a large extent, and using fire counts as a proxy for fire-affected areas may lead to a large error in emission estimates [28]. This can result in local or regional differences that may be two-fold or greater.
A new method based on fire radiant power (FRP) has been proposed to estimate OBB emissions at global or regional scales [18,25,29,30,31,32,33,34]. FRP is the rate of fire radiative energy (FRE) per unit time, which is calculated as the difference between measured apparent fire temperature at the 4 µm band and background temperature [35]. Freeborn et al. (2008) showed that the relationship between biomass combustion and FRP will not be significantly affected by the type of surface vegetation cover [36]. This results in a strong linear relationship between the time integral of FRP and the biomass burned [37]. Therefore, the fuel mass consumed by the OBB can be converted by the conversion rate constant, thereby avoiding errors caused by inaccurate combustion area inversion and inaccurate fire number statistics. This approach improves the accommodation of small fires with a burn area of less than 1 km2. Giglio et al. (2016) pointed out that, under ideal conditions, the FRP method can detect small fires with an area of 50 m2 [38]. The Global Fire Assimilation System (GFAS) data based on the FRP method can provide daily 0.1° spatiotemporal resolution emission inventory products [39,40]. However, a detailed comparison of multiple inventories by Liu et al. (2020) found that the GFAS method is based on GFED3 (using GFED3 dominant fire-prone LULC at 0.5° resolution) and FRP-GFEDv3 DM conversion factors by LULC [41]. However, OBB emissions inventories have large uncertainties about the variation of spatially and temporally resolved distinctions [42], especially over small-scale regions with frequent fires. Therefore, it is necessary to use emission inventories with high spatial and temporal resolution to estimate regional fire pollutant emissions.
The main objective of this study is to establish daily 1 km2 OBB emissions of 11 pollutants (CO2, CO, CH4, NMOCs, NOx, NH3, SO2, BC, OC, PM2.5, and PM10) in the Amur-Heilong River Basin (ARB) by using the Moderate Resolution Imaging Spectroradiometer (MODIS) Thermal Anomalies and Fire Daily Products (MOD14A1/MYD14A1) from 2003 to 2020. The secondary objectives are to study the spatial and temporal changes of OBB from 2003 to 2020 and to explore the emission characteristics of different countries and different fire types in the ARB region. The inventory results will provide accurate information for the atmospheric transport model and the community land model and aid in global and regional air quality simulations, which are important for tracking cross-border transmission of pollutants such as trace gases or aerosols and for controlling greenhouse gas carbon emissions. Furthermore, establishing a long-term biomass burning emission inventory model on a grid of 1 km2 per day has important implications in the context of carbon peaking and carbon neutrality proposed by China. This method is of great value for formulating OBB-related carbon emission control policies, as well as achieving regional carbon peaking and carbon neutrality.

2. Data and Methods

2.1. Study Area

The Amur-Heilong River Basin (ARB), located in northeastern Asia, is the 10th largest river basin in the world, covering Mongolia (9%), China (43%), and Russia (48%) (Figure 1), with a basin area of at least 2.08 million km2 (41.72–55.90°N, 108.5–141.13°E) [43,44,45,46]. The ARB is located in the high-latitude boreal forest ecosystem on the southeastern edge of the Eurasian permafrost, with abundant natural vegetation coverage. The ARB area is also one of the key areas with high fire emissions in the northern high latitudes (Figure 1a). More than 60% of the entire basin is covered by permafrost, which is sensitive to changes in the external environment [46]. The degradation of frozen soil will accelerate the release of combustible gases such as CH4, further increasing the risk of fire. Meanwhile, the ARB also includes the main grain-producing areas in Northeast China (Figure 1b), where straw burning of large-scale and varying degree occurs in spring and autumn every year. With the economic development of recent years, the area of agricultural fires in Northeast China has shown a significant growth trend [19]. Therefore, it is very important to accurately quantify biomass burning in the ARB area. Hereafter, Russia, China, and Mongolia will refer specifically to the territories of the three countries that lie within the Amur-Heilong River Basin. The land use classification in this study adopts the reclassification results produced by Guo et al. (2021) [47].

2.2. Datasets

Active Fire (AF) data (2003–2020) obtained by MODIS (MOD14A1/MYD14A1) on the Terra and Aqua satellites were used to evaluate fires in this study. The MODIS Thermal Anomalies and Fire Daily (MOD14A1/MYD14A1) Version 6 data are primarily derived from MODIS 4 and 11 µm radiances. As a MODIS L3 product, MOD/MYD14A1 is generated every 8 days to facilitate data storage and organization, including daily pixel-by-pixel fire point information data for 8 consecutive days (https://modis.gsfc.nasa.gov/data/dataprod/mod14.php (accessed on 16 June 2021)). The improved MOD14A1 Collection 6 products reduced global commission errors to 1.2%, compared to 2.4% in Collection 5 [35]. MODIS can routinely detect both flaming and smoldering fires ~1000 m2 in size. Under very good observational conditions (near nadir, little or no smoke, relatively homogeneous land surface, etc.) flaming fires one tenth this size can be detected. Under pristine (and extremely rare) observational conditions, even smaller flaming fires ~50 m2 can be detected [38]. Therefore, to investigate the small fires in more detail, we extracted fires from the low-confidence fire, nominal-confidence fire, and high-confidence fire data under “MOD/MYD14A1, FireMask” (DN ≥ 7). Extract information, such as pixel quality index, maximum fire radiation power (MaxFRP, unit is MW/pixel) corresponds to the fire point position in the product. In this study, we use high spatiotemporal resolution data of 1 km per day to calculate FRP and estimate emissions over an 18-year period (2003–2020).
We also combined active fire data with Land Use/Land Cover (LULC) types from the MODIS Land Cover Type product (MCD12Q1, Collection 6, https://modis.gsfc.nasa.gov/data/dataprod/mod12.php (accessed on 16 June 2021)). The MODIS land cover type was collected to determine the ecosystem types of the fire occurrences. The primary land cover classification scheme in the MODIS land cover product (MCD12Q1) is provided by the International Geosphere-Biosphere Program. MCD12Q1 contains 17 categories (Table 1). However, based on the actual situation of the ARB and the main research objectives of this study, we reclassified the land use data from 2003 to 2020 (Figure 1) using the framework of Guo et al. [47]. We used the latest version of the MODIS land cover type product at a spatial resolution of 500 m. Subsequently, in order to be consistent with the FRP data type, we resampled to 1 km to explore the association between the fire point information and the actual land use type.

2.3. Methods

2.3.1. Estimation of Fire Radiation Power (FRP)

Pollutant emissions were calculated as the product of the dry matter burned (kg) and a corresponding Emission Factor (EF, g kg−1) [18]. Compared with the traditional bottom-up estimation method based on burned area, the FRP-based method has better monitoring for small fires and avoids the accumulation of errors from multiple elements. At the same time, burned dry matter can be calculated by multiplying FRE by a Conversion Ratio (CR, kg MJ−1), which has the characteristic of not being significantly affected by the type of surface vegetation [33]. Therefore, in this paper, we selected the FRP-based method to estimate the emissions of each pollution.
E = F R E × C R × E F
where E is the emissions of a particular substance in a fire grid cell, FRE is the total radiative energy during the fire lifespan for one grid cell, and CR is the conversion ratio used to convert FRE to burned biomass [18,33].
Wooster et al. (2005) stated that the conversion ratio was 0.368 ± 0.015 kg MJ−1 and that CR was not significantly affected by vegetation type [33]. Freeborn et al. (2008) evaluated this as 0.453 ± 0.068 kg MJ−1 [36]. However, Zhang et al. (2020) pointed out a CR value of 0.368 ± 0.015 kg MJ−1 from a series of outdoor experimental straw fires that were very similar to Chinese agricultural residue fires [34,48]. Therefore, in this study, we chose the CR value derived by Wooster et al. (2005) for agricultural fire. For other land use types, the CR value was selected as the average value (0.411 kg MJ−1) [18].
The MODIS active fire products provide fire detection at satellite overpass times [35]. The MODIS sensors are on board the polar-orbiting satellites Terra and Aqua. MODIS crosses the equator at approximately 01:30 (Aqua, descending orbit), 10:30 (Terra, descending orbit), 13:30 (Aqua, ascending orbit), and 22:30 (Terra, ascending orbit) local time, which provides near-global coverage four times a day [49]. Therefore, to calculate FRE and correct for omission errors, we used a modified Gaussian function [50] to optimize the FRP diurnal cycle. This parameter describes the discrete observations as a continuous function and simplifies the integral process to calculate total fire power released. The modified Gaussian function is
F R E =   F R P = 0 24 F R P p e a k ( b + e ( t     h ) 2 2 σ 2 ) d t
where FRPpeak represents the peak of the diurnal cycle, b represents background FRP, σ represents the standard deviation of the curve, t is time, and h represents the hour of peak FRP.
The monthly average Terra and Aqua FRP (x) ratio and the required parameters for the calculation are as follows:
b = 0.86 x 2 0.52 x + 0.08 σ = 3.89 x + 1.03 h = 1.23 x + 14.57 + ε F R P p e a k = F R P A q u a   D a y [ ( b + e ( 13.5     h ) 2 2 σ 2 ) + ( b + e ( 1.5     h ) 2 2 σ 2 ) ]
where x represents the daily FRP of each pixel [51]. A local time parameter ( ε = 4 ) is used to adjust the difference of the F R P p e a k hour (h) to fit the diurnal curve in different regions. If Terra and Aqua detected the same fire events, we used information from Aqua for the estimates, as there were almost no differences when using Terra or Aqua data in this situation. Therefore, choosing Aqua can also satisfy the F R P p e a k calculation method [18,51].

2.3.2. Standard Deviation Ellipse Analysis

Standard deviation ellipse (SDE) analysis is commonly used to analyze the directional characteristics of a spatial distribution with time. The size of the ellipse reflects the concentration of the overall elements of the spatial pattern, and the declination (long semi-axis) reflects the dominant direction of the spatial pattern. Using years of standard deviation statistics enables us to understand the average center, major/minor axes, and azimuth trends of the discrete point set in a time series [52,53]. Therefore, the standard deviation ellipse can express the main distribution direction of a set of points and the degree of dispersion in all directions. These two factors are usually used to describe the overall characteristics of a geospatial distribution [5,53].
S D E x = i = 1 n ( x i X ¯ ) 2 n   S D E y = i = 1 n ( y i Y ¯ ) 2 n
where n is the total number of elements, x i and y i represent the spatial position coordinates of each element, and X ¯ and Y ¯ represent the arithmetic mean center. S D E x and S D E y are the calculated ellipse centers. The direction of the ellipse is then determined while taking the X-axis as the standard, then setting true north (12 o’clock direction) to 0 degrees and rotating clockwise. The calculation formula is as follows:
tan θ = A + B C A = ( i = 1 n x ¯ i 2 i = 1 n y ¯ i 2 ) B = ( i = 1 n x ¯ i 2 i = 1 n y ¯ i 2 ) 2 + 4 ( i = 1 n x ¯ i y ¯ i ) 2 C = 2 i = 1 n x ¯ i y ¯ i
where x ¯ i and y ¯ i represent the difference between the average center and the xy coordinates. The length of the XY-axis is then calculated by the following formula:
σ x = 2 i = 1 n ( x ¯ i cos θ y ¯ i sin θ ) 2 n σ y = 2 i = 1 n ( x ¯ i sin θ y ¯ i cos θ ) 2 n

3. Results and Discussion

A total of 1,231,909 burned pixels were detected by Terra and 1,347,646 by Aqua in the ARB from 2003 to 2020. In order to avoid duplicated calculations of Terra/Aqua fire emissions, we combined Terra/Aqua fire distributions from the same dates and locations. Freeborn and Wooster et al. (2014) stated that since the MODIS sensor is the same on Aqua and Terra, results are very similar for the inversion of fire pixel information [4]. Therefore, if two satellites observed the same pixel of fire information on the same day, the Terra pixels were removed and the Aqua pixels were selected for calculation. There was then a total of 1,931,160 fire pixel counts in the ARB. The grassland fires in the study area accounted for the largest proportion, 43.5% (840,095 fire spots) of the total amount, followed by forest fires (626,466, 32.4%), cropland fires (438,788, 22.7%), and others (25,811, 1.3%).
Based on the emission factors for each land use type (Table 2), the average annual emissions of 11 air pollutants in the ARB are listed in Table 3. Over the 18-year study period, the average emissions of CO2, CO, CH4, NMHCs, NOx, NH3, SO2, BC, OC, PM2.5, and PM10 were estimated to be 153.57, 6.16, 0.21, 0.78, 0.28, 0.08, 0.06, 0.04, 0.39, 0.66, and 0.85 Tg/a, respectively. Taking CO2 emissions as an example, the maximum emission occurred in 2003 (429.68 Tg), followed by 2008 (309.82 Tg), and the minimum emission occurred in 2010 (54.17 Tg). These results will be discussed in detail in Section 3.2.

3.1. Spatial Distribution of CO2 Emissions

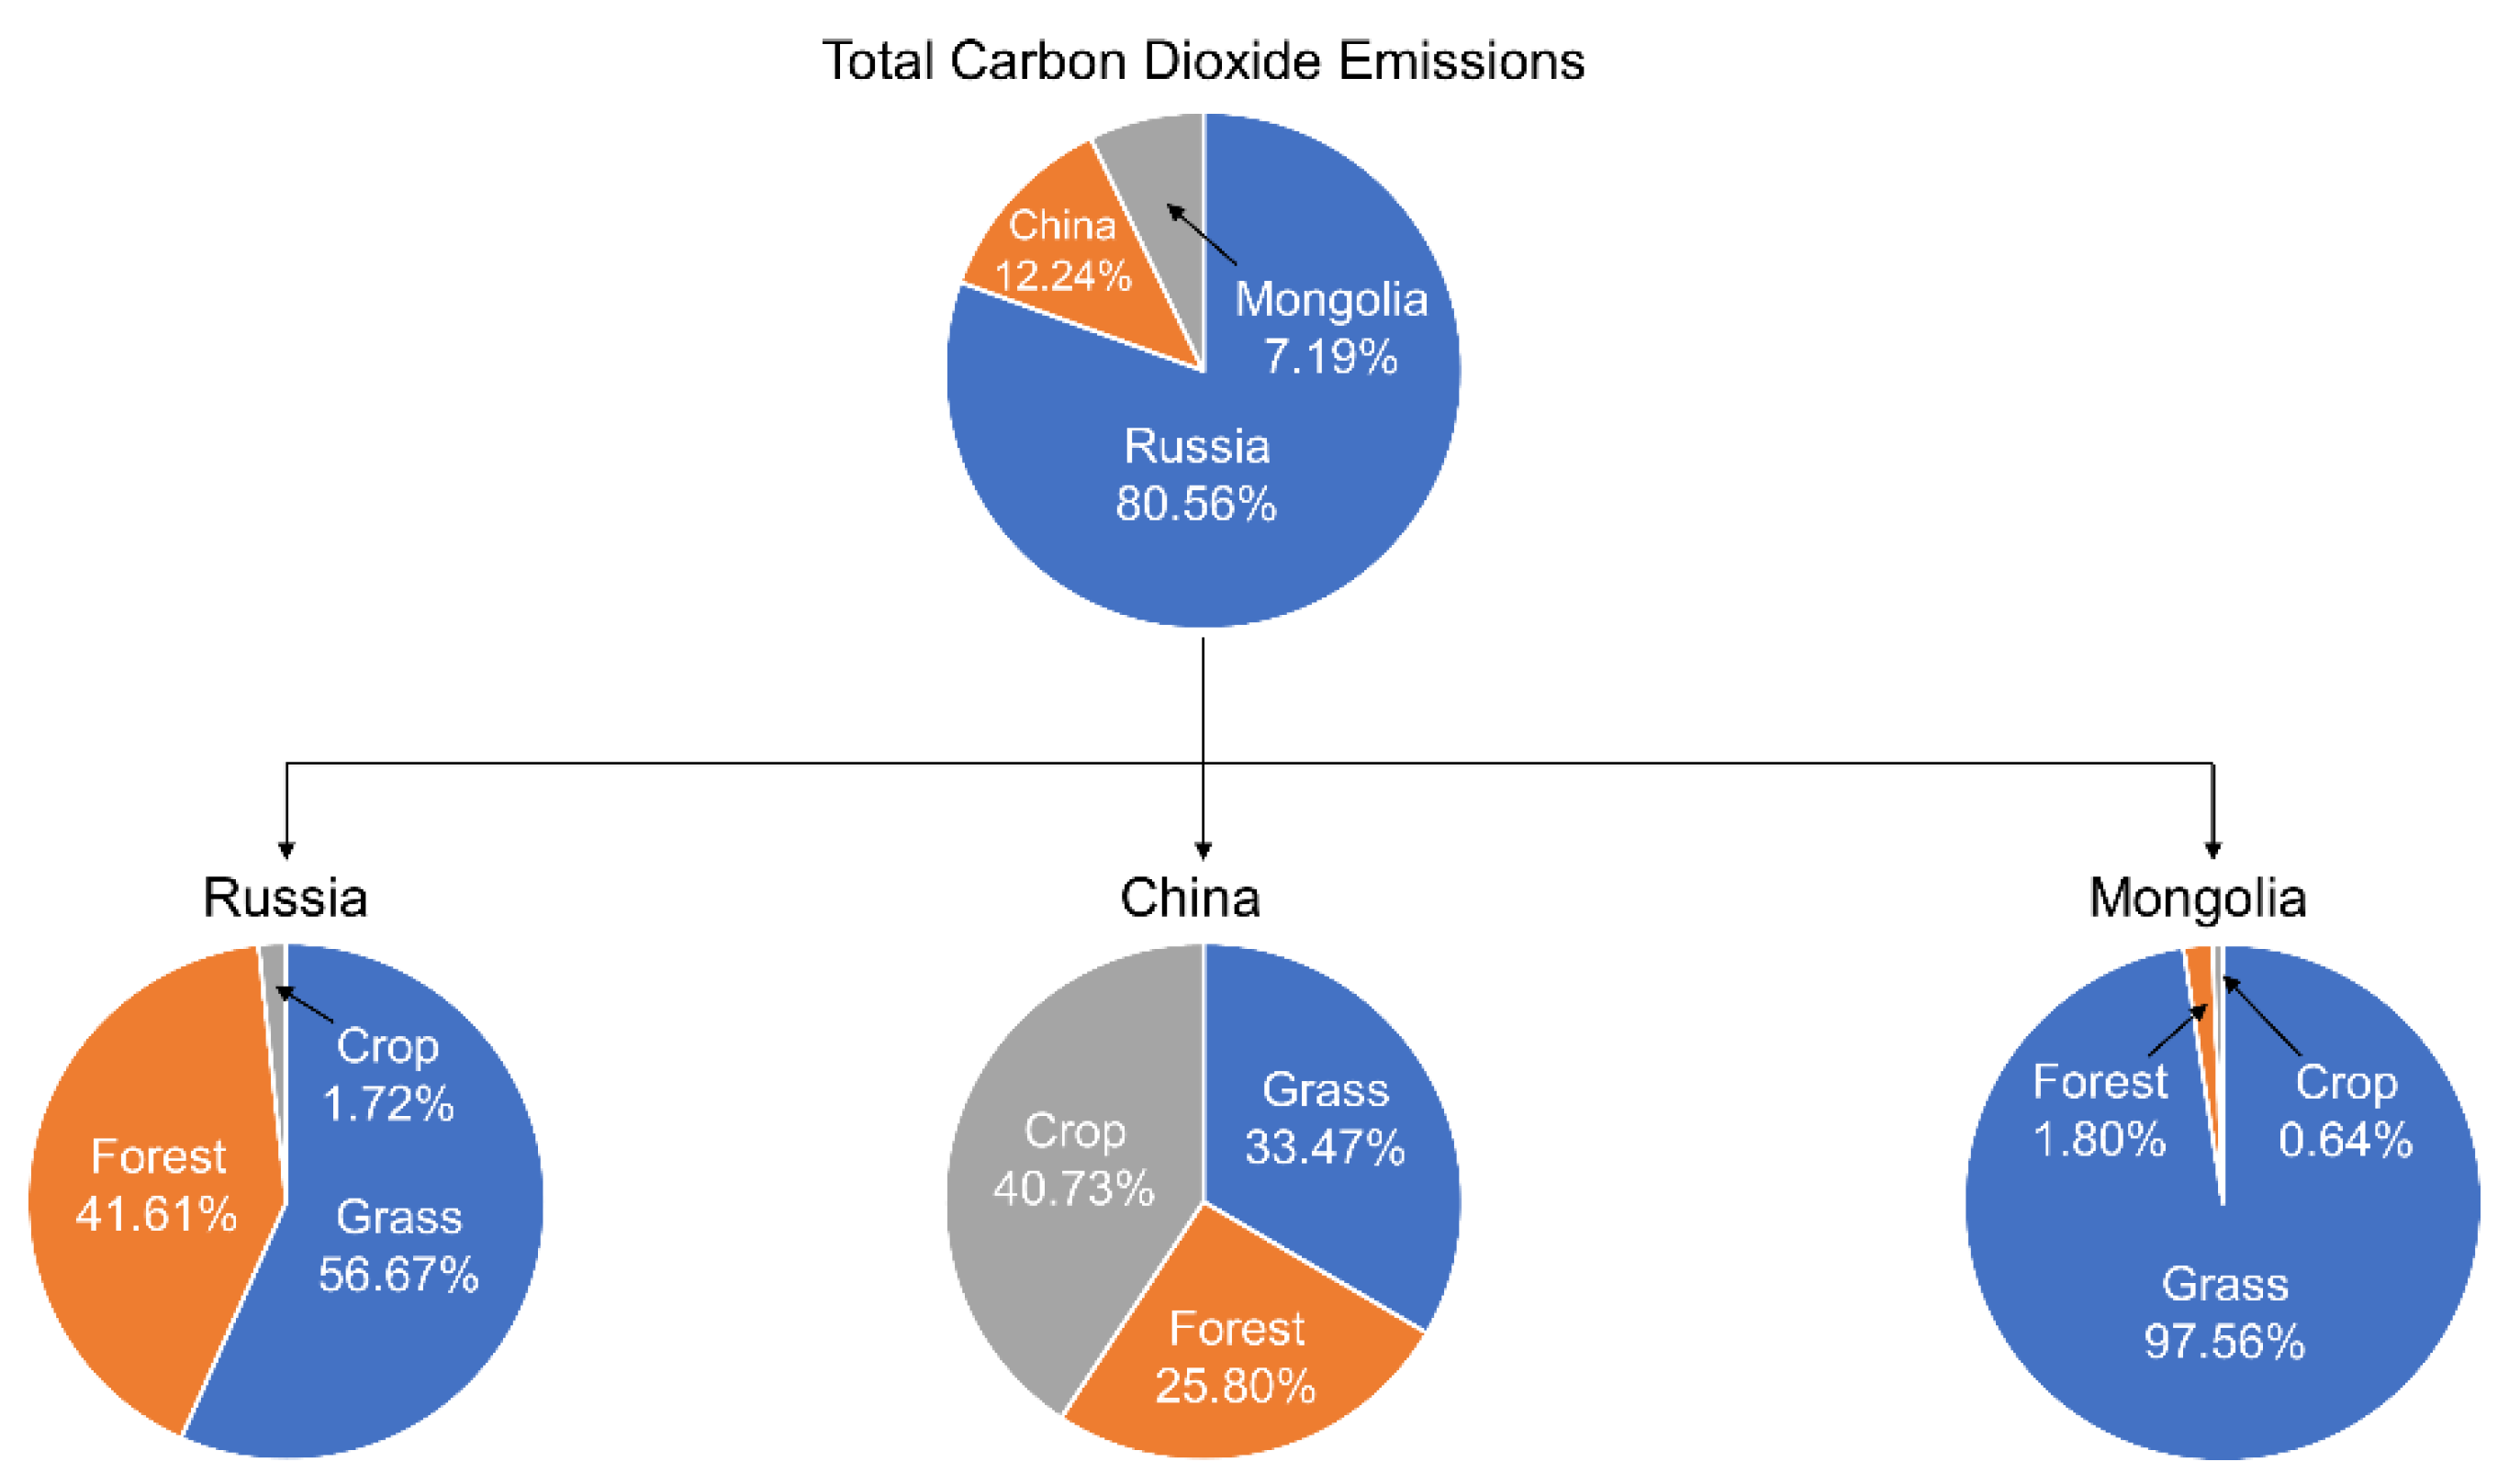
Overall, average annual CO2 emissions showed significant spatial variation (Figure 2), with the vast majority of fires occurring in parts of Russia, especially forest grassland fires in Chita Oblast and Amur Oblast. China was dominated by large-scale continuous agricultural fires in the Songnen Plain and Sanjiang Plain, which were inseparable from agricultural production activities in Northeast China. It was evident that the border between China and Russia or Mongolia manifests the differentiated CO2 emissions among the three countries in this area. With the Amur River as a border, it has played an important role in interrupting and suppressing the spread of fire. High fire occurrence is observed in southern Russia. Shvidenko et al. (2011) stated that 90–95% of the burned area was in the Asian part of Russia, mainly in its southern half [57]. The high-intensity fires (0.5–20 Gg/a) occurred in Russia, especially in Chita Oblast and Amur Oblast. In China, human intervention has had an important effect on fire occurrence, particularly in controlling the occurrence and spread of high-emission fires (5–20 Gg/a). On the one hand, it can be ascribed to the Chinese government’s policies on forest protection and restricted burning of agricultural waste [58,59]. On the other hand, although most of the agricultural fire areas observed during the study period were characterized by large spatial continuity, most regional agricultural fires are significantly affected by human activities and large-scale agricultural fires are more common in the days before planting in spring and after harvesting in autumn, resulting in a limited number of crop fires and low total crop emissions (below 0.1 Gg/a). In addition, the burning of agricultural waste (straw) in Northeast China was mainly controlled by human activity [60], the burn time was short, and the burn area was limited; the burning of straw therefore produced low carbon dioxide emissions compared with forest or bush fires in Russia. In Mongolia, the number of fire points was significantly fewer than in China, but there were more high-emission fire points than in China. An example is the border between Mongolia and Russia in northern Mongolia, especially Khentii Province and eastern Mongolian Dornod. As shown in Figure 3, at the national scale, Russia was the major CO2 emitter in the ARB, contributing 80.56% of the total CO2 emissions for 2003–2020. Although there were large areas of continuous fire emissions in China (Heilongjiang and Jilin provinces), CO2 emissions from China accounted for only 12.24% of the total emissions from the ARB. Mongolia produced the lowest emissions, contributing 7.19% of the total CO2 fire emissions in the ARB area.
In terms of land cover types, grassland fires contributed an average of 59.41% of the region’s total CO2 emissions each year (Figure 2), and 56.67%, 33.47%, and 97.56% of the total CO2 emissions (2003–2020) in Russia, China, and Mongolia, respectively (Figure 3). Most of the CO2 emissions caused by grassland fires were distributed in the Chita Oblast and Amur Oblast regions of Russia, outside of the eastern and western parts of northern China. In the central and western part of the Russian Jewish Autonomous Oblast, grassland fires showed a clear trend of concentrated high emissions, and they extended to the central grassland areas of Khabarovsk Krai. At the same time, the Sino–Russian border in the western part of Primorsky Krai was also more obvious. In China, large-scale scattered grassland fires appeared at the junction of Heilongjiang, Jilin, and Inner Mongolia, with an average annual CO2 emission of 0–0.1 Gg/a. However, two distinct grassland fire distribution bands appeared in the areas of the Greater Khingan Mountains and Lesser Khingan Mountains, especially in northern Heilongjiang, where there were several significant high-emission areas (1–5 Gg/a) at the junction of the Greater Khingan Mountains and Lesser Khingan Mountains. The dominance of CO2 emissions by grassland fires is expected. Most of the Mongolian territory is characterized by an arid and semi-arid climate, and over 70% of Mongolia is covered by high-quality steppe grasslands [61]. However, due to factors such as climate change, increased livestock grazing, and natural disasters, as well as socioeconomic changes and overexploitation of natural resources, the area of meadow steppe, desert steppe, bare land, and desert is increasing. In addition, the dry and windy climate of the region favors fire spreading [62].
Forest fire CO2 emissions are relatively distributed in the entire ARB study area with an average annual emission as high as 51.48 Tg/a (~2423 spots/year), contributing an average of 32.25% of the region’s total CO2 emissions each year (Figure 2) and 41.61%, 25.80%, and 1.80% of total CO2 emissions (2003–2020) in Russia, China, and Mongolia, respectively (Figure 3). Most forest fires occurred in the Russian region outside of the northernmost part of China. At the same time, large-scale scattered fire areas also appeared in eastern Russia, but the average annual emissions remained at a low level. Although there was a large area of continuous forest cover in the ARB in China (Figure 1b), forest fires in China occurred mainly in the middle and high latitudes of the Lesser Khingan Mountains in Heilongjiang Province and the Greater Khingan Mountains in eastern Inner Mongolia. Despite the fact large areas of scattered forest fires also appeared in China, there were few fire spots with emissions higher than 0.5 Gg/a, mainly benefiting from effective forest fire prevention measures. Forest fires made the lowest contribution to CO2 emissions in China (Figure 3). In Mongolia, except for the northwestern region of Khentii, almost no forest fires occurred.
The characteristics of agricultural fires were the most obvious in the whole region, contributing an average of 8.35% of the region’s total CO2 emissions each year (Figure 2) and 1.72%, 40.73%, and 0.64% of total CO2 emissions (2003–2020) in Russia, China, and Mongolia, respectively (Figure 3). This was largely caused by human factors. Poor control, poor fire management policies, and new socio-economic conditions have contributed to the frequent occurrence of fires in Siberia, especially in years with abnormal weather, and more than 87% of fires in northern Russia were caused by humans [58]. Almost all agricultural fires in the ARB area occurred in China, accounting for as much as 77.68% of total agricultural fires. China was a large agricultural country, especially in the Northeast Plain where Heilongjiang Province is located, and the burning of agricultural waste is more serious. As a result, agricultural fires occur in a significant proportion of the China area and have become the main source of CO2 emissions. Combined with the land use distribution map in Figure 1, it can be seen that almost all agricultural land in China experienced agricultural waste incineration from 2003 to 2020. Nonetheless, China has formulated many policies and measures related to forests and grasslands and has achieved good results in fire prevention, grain production in Northeast China has been increasing because of socio-economic demands, and many agricultural wastes that are not treated in time are burned on the spot [60].

3.2. Temporal Pattern of CO2 Emissions

3.2.1. Annual Variations

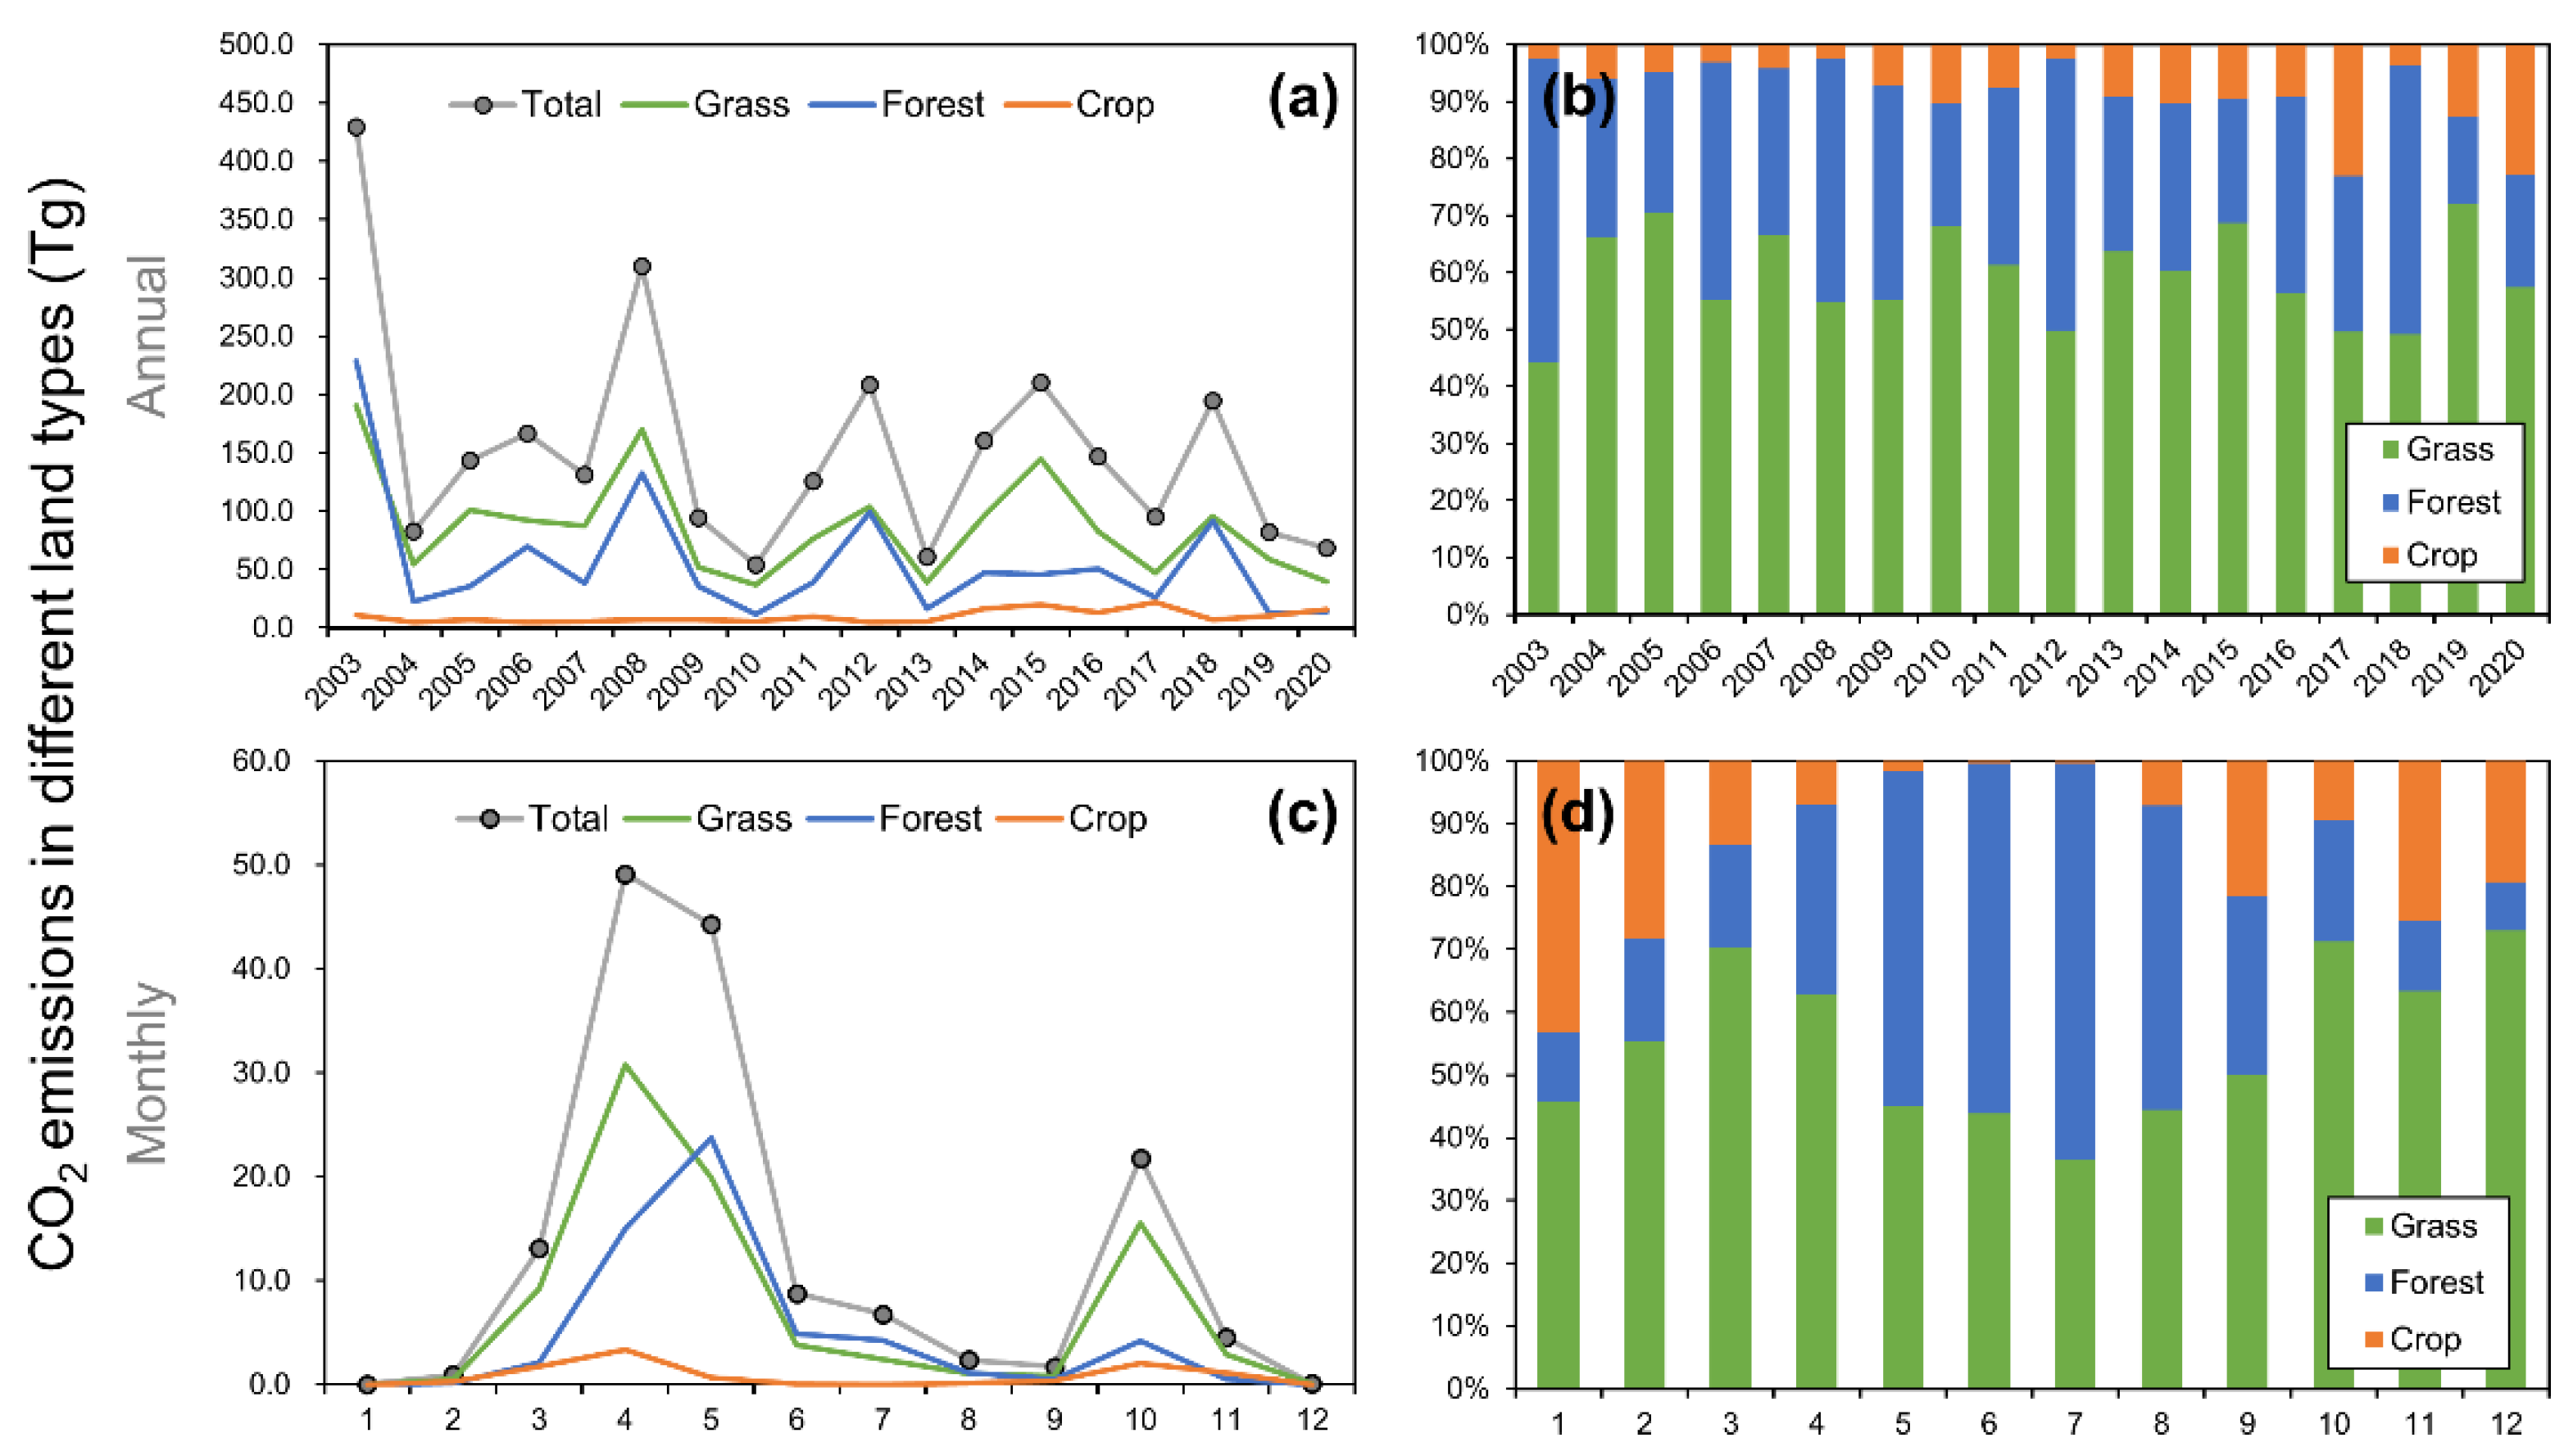
From 2003 to 2020 (Table 4), CO2 emissions from OBB showed a significant decreasing temporal trend (−6.6 Tg/a). However, except for extreme fire events in 2003 and 2008, the CO2 emissions from the ARB region were relatively stable (+0.1 Tg/a). Nevertheless, the average annual fire CO2 emissions from 2004 to 2017 (excluding 2008) still reached 129.2 Tg /a, which was 1.46 times higher than those from all of China on average during the same period, as shown by comparison with the results of Yin et al. [18]. Overall, from 2003 to 2020 in the ARB region, Russia’s CO2 emissions were greatly affected by two extreme fire events, with an average annual change of −5.39 Tg/a (standard deviation [Std] = 81.4), whereas China and Mongolia’s annual average changes were only −0.72 Tg/a (Std = 12.9) and −0.49 Tg/a (Std = 11.08). This result shows that, despite the decreasing trend of CO2 emissions, the fluctuations in CO2 from biomass burning in Russia were significantly larger than those in China and Mongolia (Table 4). In more detail, except for China’s agricultural fire CO2 emissions, which showed a clear upward trend, the rest of the regions showed a downward trend, especially in Russia’s forest fires (−3.25 Tg/a) and grassland fires (−2.08 Tg/a). The rapid changes in the Russian region were mainly affected by the multi-year extreme fires in the early 2000s, while the increase in agricultural fires in China was caused by the increased burning of agricultural waste and straw (Table 4).
As far as the fluctuations in total CO2 emissions in the ARB are concerned, obvious peaks occurred in 2003, 2008, 2012, 2015, and 2018. Total CO2 emissions were highest in 2003, when they reached 429.68 Tg (Figure 4a). In May 2003, severe forest fires in the southeast of Russia resulted in smoke plumes that extended widely across the Northern Hemisphere. As the fire situation escalated in southern Russia, tens of thousands of fires had destroyed more than 15 × 106 ha of land in the Russian Federation at the end of May, including most of the ARB region [63]. In Northeast China, the burned area from forest fires was very large in 2003 (9.2 × 10³ km2) and 2008 (5.3 × 10³ km2) compared with the corresponding average area (1.2 × 10³ km2). The burned areas of grasslands and shrublands also peaked in 2003 and 2008, particularly those of grasslands at 5.0 × 10³ km2 (2003) and 4.1 × 10³ km2 (2008) [19]. In contrast, low values were observed in the ARB in 2004, 2010, 2013, and 2020, with the lowest value occurring in 2010 (54.17 Tg CO2).

3.2.2. Monthly Variations

The monthly average CO2 emissions showed clear seasonal differences in the ARB area with the highest emissions in spring (March to May), followed by autumn (October). There were two main seasonal fire periods: spring fires and late summer fires [57]. In spring, grassland fires and forest fires occur frequently and spread rapidly [58]. In addition, recent studies of large-scale fires in southeastern Siberia (45–55°N, 100–150°E) have also shed light on the relationship between spring fire activity and the Arctic Oscillation [64]. In autumn, owing to a lack of rain, the vegetation dries up, especially in the grassland areas, and fire spreads rapidly, resulting in an increase in CO2 emissions [58,65]. There were almost no burning emissions in winter (December–February). In summer (June–August), CO2 emissions showed a significant decreasing trend (Figure 4c).
When examined monthly, grassland fires had two peaks each year, one in April and one in October. The average emissions in April reached 30.8 Tg, almost twice the peak in October (15.55 Tg). High CO2 emissions from grassland fires also occurred in March (9.23 Tg) and May (19.9 Tg). As a result, throughout the spring, CO2 emissions from grassland fires accounted for 68.75% of annual grassland fire emissions. Spring was also a period of high forest fire incidence and the highest peak for forest fires occurred in May, reaching 23.71 Tg, followed by April (14.98 Tg). CO2 emissions from spring forest fires accounted for 72.21% of annual forest fire emissions. There was a small emission peak in October, only 4.22 Tg, which was 89.52% of the monthly average and 17.79% of the peak in May. Cropland fires showed a pattern similar to that of grassland fires. They also had two peaks in spring and autumn, 3.35 Tg in April and 2.05 Tg in October. The average monthly CO2 emissions from crop fires were only 6.42% of the annual average monthly emissions. The first relatively concentrated fires occurred in burned areas after the spring snowmelt and before greening, and the second fire period was due mainly to dryness in autumn [63,65]. The main reason for this phenomenon is that the autumn crop harvest results in a large amount of agricultural waste, especially in Northeast China. However, the low temperatures in Northeast China in the winter (6 months) seriously inhibit straw decomposition, and agricultural wastes in high northern latitudes do not have the advantage of natural degradation in landfills [66] and are mostly treated by incineration. As Stankowski et al. [67] reported, ashes from biomass burning are a natural soil amendment that can be used as a valuable soil and/or plant fertilizer to provide nutrients for a new round of planting. Therefore, with increasing crop yields in the ARB region, emissions from agricultural fires in spring and autumn are becoming more and more significant (Figure 4).

3.2.3. Spatiotemporal Variation

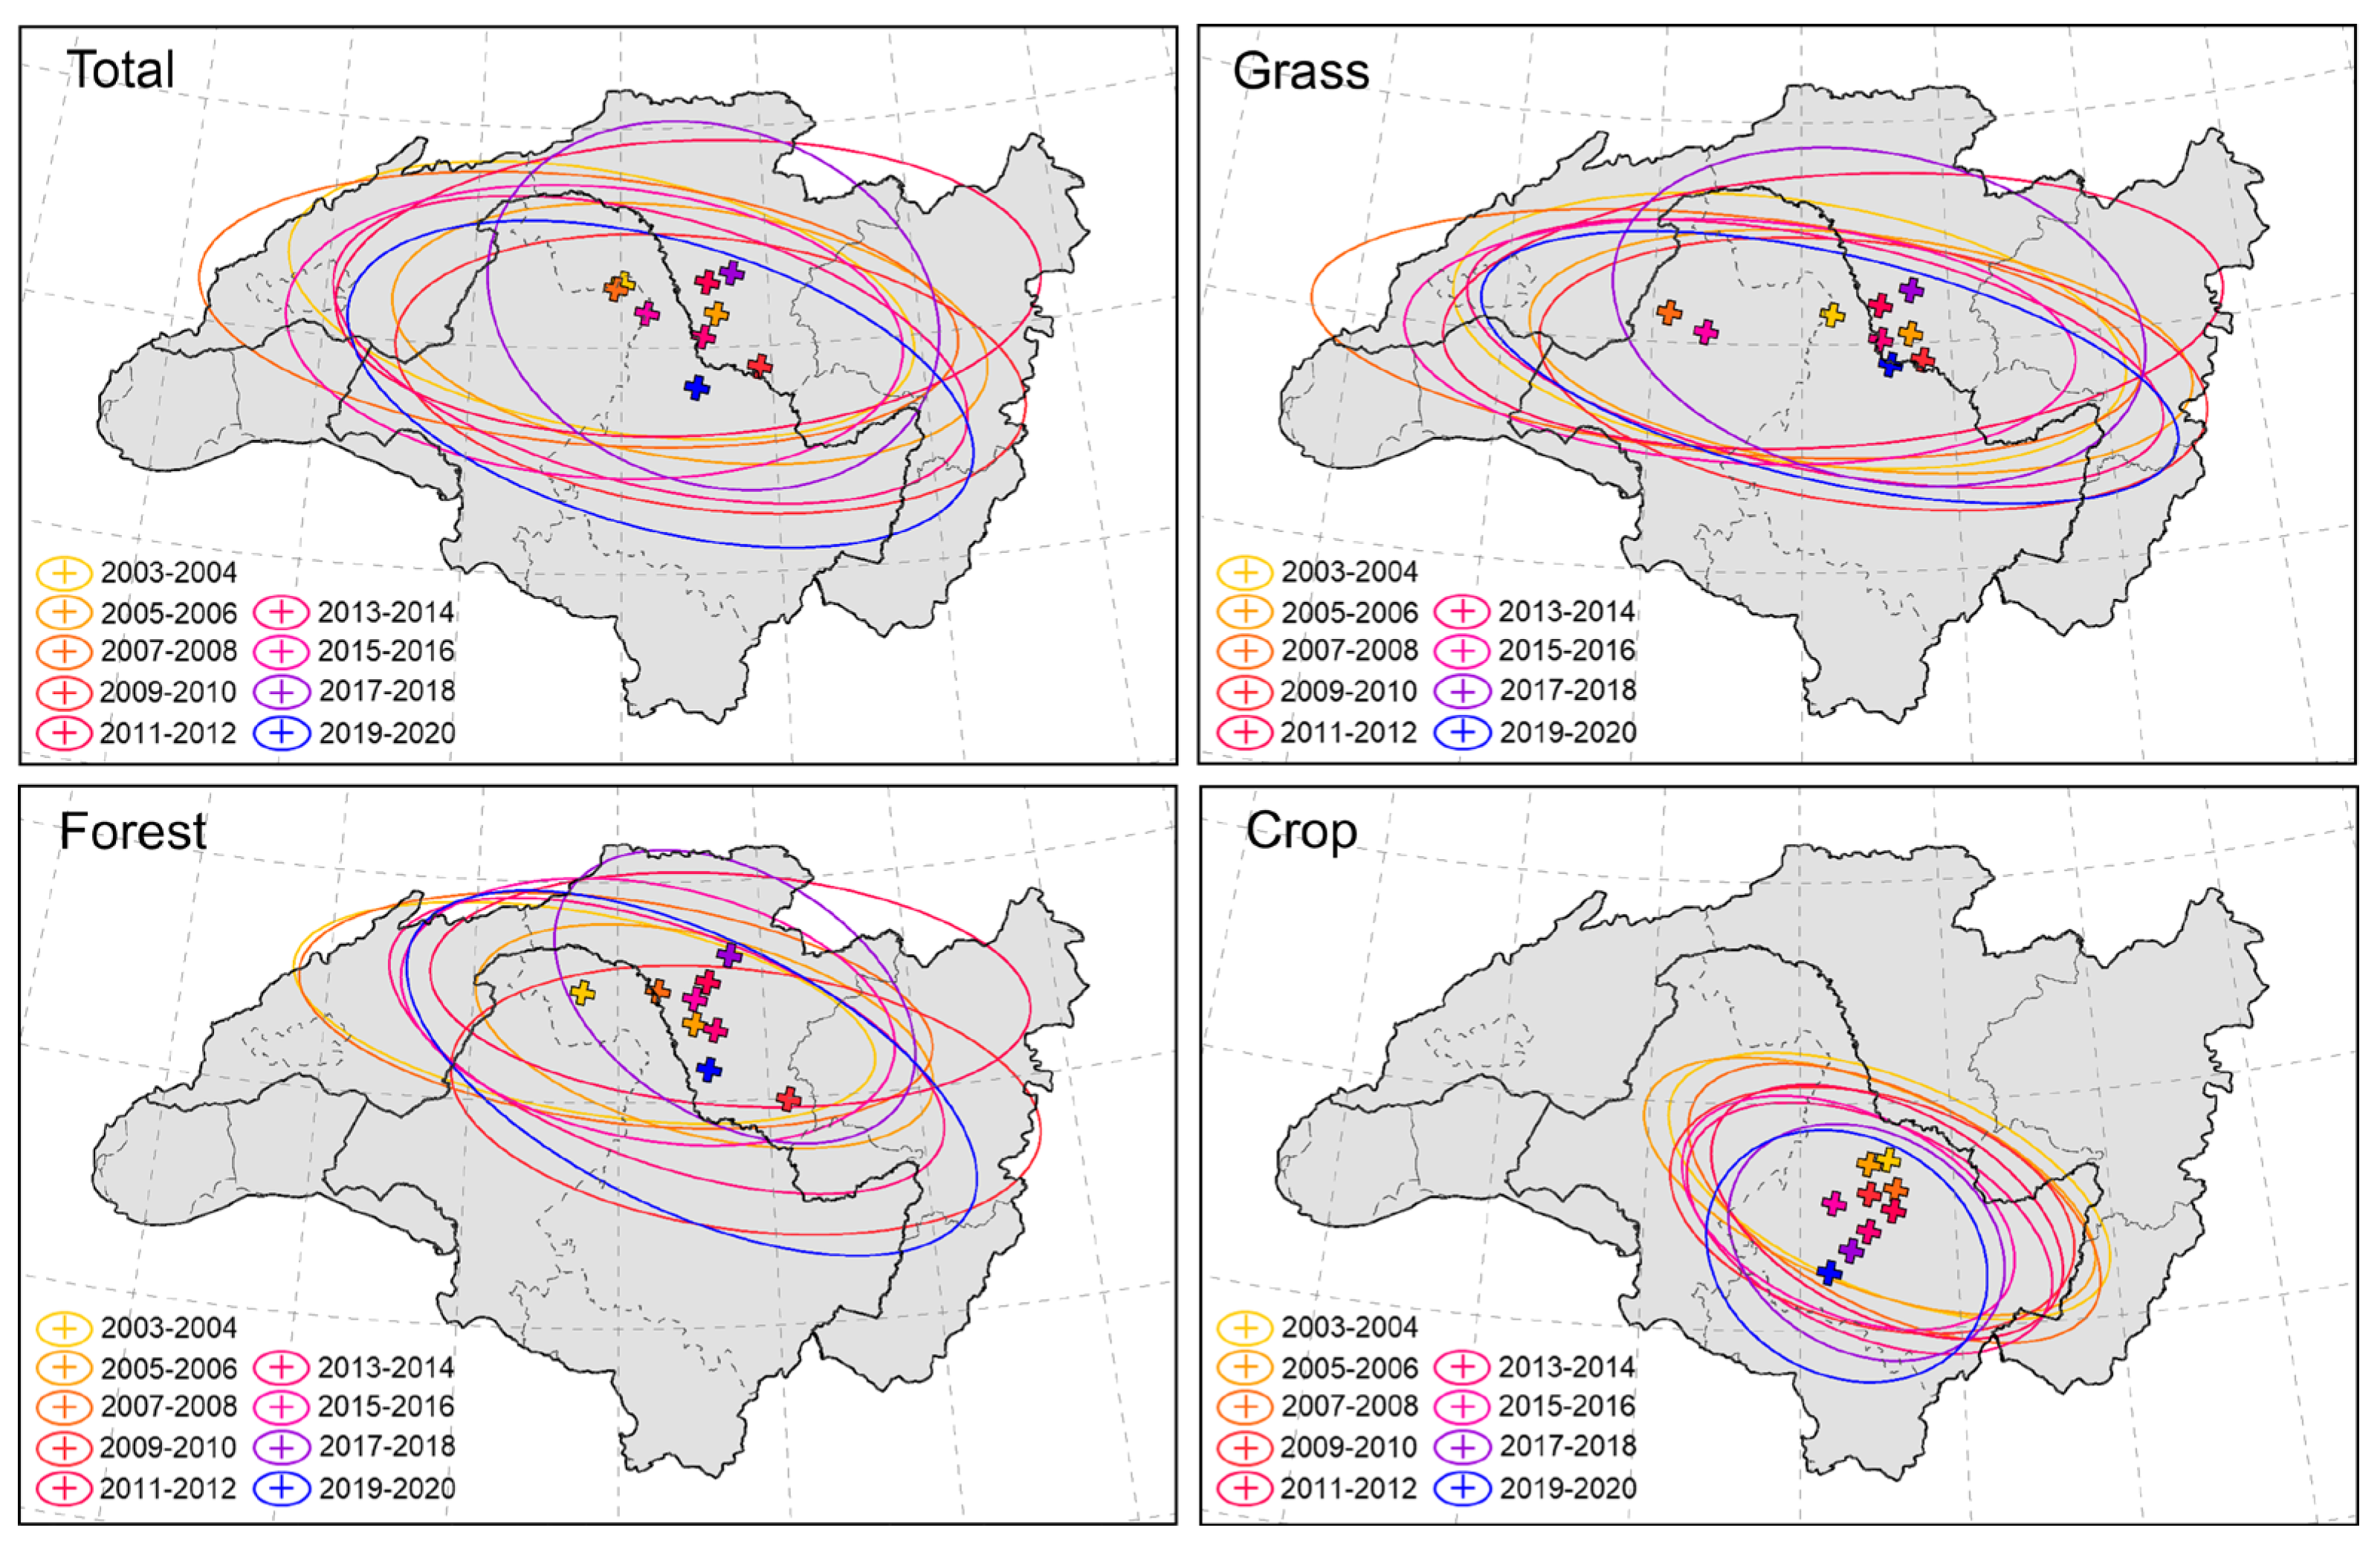
We used standard deviation ellipse analysis to assess the overall change in annual fire CO2 emissions (Figure 5). The standard deviation ellipse describes the distribution of elements in a dominant area and reveals the direction and degree of dispersion of the distribution of CO2 emission sources in the study area. As can be seen from the total emissions from 2003 to 2020 (Figure 5, Total), the inclination angle of the ellipse has rotated from 89.31° to 94.37°, indicating that CO2 emissions in this study area have undergone significant changes and that the proportion of CO2 emissions from the southeast of the ARB has increased through time. At the same time, the long axis and short axis increased from 315.21 to 353.10 km and from 770.38 to 782.16 km, respectively, reflecting an increase in sources of biomass combustion emissions in this region over time. Meanwhile, the long-to-short-axis ratio decreased from 2.44 to 2.22, indicating that the directional trend weakened during the study period. Combined with Table 4, these results show that the increase in agricultural waste combustion emissions in China and the significant southward shift of the emission trend (Figure 5, Crop) were the main reasons for obvious changes in the CO2 emission pattern of the entire region. Especially in the past decade, emissions from Russia (−0.87 Tg/a) and Mongolia (−0.58 Tg/a) decreased, whereas some of the overall emissions from China increased significantly (+0.66 Tg/a), mainly owing to agricultural wastes (+0.81 Tg/a) as further detailed in the last paragraph of this subsection.
For grassland fire emissions (except for 2011–2012 and 2017–2018), the main direction of emissions has not changed significantly, but the long and short axes have shown significant changes (Figure 5, Grass). Over the years, the long axis has decreased but the short axis has remained relatively stable. At the same time, the ratio of the long axis to the short axis has also decreased, indicating that the CO2 emissions from grassland fires are gradually becoming more concentrated. It can be seen from the median centers that, in recent years, grassland fires have tended to migrate to the southeast. The CO2 emissions from forest burning are more complex and have changed significantly over the years, although the forest fires occur mainly in Russia (Figure 5, Forest). The median center only fell in China from 2003 to 2004, and the rest of the median centers appeared in the Russian region east of China at high latitudes in the study area. These irregular and large-scale changes mainly reflect the randomness of forest fires and the strong human interference factor. At the same time, after a forest area has been burned, fires are unlikely to recur in a short time owing to a lack of vegetation restoration.
The CO2 emissions from crop fires are most significantly affected by human activities (Figure 5, Crop). Almost all CO2 emissions from crop fires occur in China (77.68%). In addition, the long and short semi-axes have changed significantly, the long axis has been reduced from 570.46 km to 354.76 km, the short axis has increased from 258.90 km to 291.08 km, and the ratio of the long to short axis has declined significantly, from 2.20 to 1.22. At the same time, the median center of crop fires has moved significantly southward by 2.45° and westward by 1.95°. These results show that, in the past 18 years, crop fires have gradually become concentrated and their degree of dispersion has been significantly reduced. According to Shi et al. [19] who conducted a study on biomass burning in Northeast China from 2001 to 2017, it can also be seen that the trend of agricultural fire in Northeast China has increased, especially after 2010, and the proportion of belonging to Heilongjiang and Jilin provinces has increased significantly. This is in high agreement with our study, thus enhanced crop fire causes the center of gravity to show a clear southwestward shift.

3.3. Daily CO2 Emissions from Biomass Burning

A long-term series of daily fire emissions was documented in the present study. From the perspective of daily emissions, most CO2 emissions from biomass burning in the study area were less than 5 Tg per day for 2003–2020 (Figure 6a,b). However, 54 days of CO2 emissions had higher values than this; 66.7% of these days occurred before 2010, predominantly in 2003 and 2008 when 15 and 11 such days were observed, respectively. It can be seen from Figure 6a that these high CO2 emissions were mostly dominated by forest fires and most of them occurred in the Russian part of the ARB area (Figure 6b). For example, in May 2003, extensive forest fire activity occurred in the ARB region on the Siberian border, resulting in the release of large amounts of particulate matter and gases into the atmosphere [68]. In 2008, forest fires (62.09%) and grassland fires (37.59%) were dominant, similar to the results of Vivchar (2011) relating to the distribution of fires in the Russian Far East [69]. However, the 2008 fire season started earlier than usual in Siberia [70], especially in the Russian (ARB) region which started about three weeks earlier than usual. According to our results, this large-scale fire, which lasted about 6 days (67–72 days), was dominated by grassland fire, especially in the area bordering the Jewish Autonomous Oblast and Khabarovsk Krai. This may be related to the extreme special weather that year, especially the low-pressure system under strong winds in this region [58].
There were two extreme fire events, one on 10 May 2016 and one on 9 May 2018. CO2 emissions in a single day exceeded 35 Tg (Figure 6a,b). Combined with our daily emissions results, both extreme fire events occurred in Russia’s Amur Oblast. Among them, on 10 May 2016, grassland fires dominated and most of them showed a large-scale strip-like spreading trend. On the contrary, the fires on 9 May 2018 were dominated by forest fires which were more concentrated near the Zeya Reservoir and accompanied by a spatial pattern of multiple points of high emissions. It is worth noting that, on 14 October 2004, China contributed 84.56% of CO2 emissions, which was the largest single-day emission in China and was mainly concentrated in the central area of the Lesser Khingan Mountains. As a report, forest fires broke out in Heihe and Yichun areas in Heilongjiang Province from 13 October 2004 and it took a week to put out the fires. This is consistent with the anomalous fluctuation in OBB CO2 emissions for Heilongjiang Province in October 2004 as observed by Shi et al. [19].
From the daily average results of CO2 emissions in the ARB area for 2003–2020 (Figure 6c,d), grassland fires made the largest contribution to CO2 emissions, especially on days 68–157 and 274–312 of each year. The average contribution of grassland fire CO2 emissions in these two intervals reached 58.40%, whereas that of forest fires was 34.61% and that of cultivated land was only 6.99%. May 10 was the peak emission date in the spring, with an average emission of up to 2.33 Tg CO2, while the summer peak was around 30 June with an average emission of 4.78 Tg CO2 and the autumn peak was on 18 October (1.23 Tg CO2). The average daily emissions from crop fires were also high throughout the spring and autumn. However, compared with grassland fires and forest fires, crop fires accounted for only 6.99% of total annual emissions (Figure 4b). Although the number of agricultural fire spots increased significantly after 2010 and peaked in 2017, the total emissions from crop fires were still very low (10%).
Overall, the annual average daily emissions data show that Russia has always been the main source of CO2 emissions in the ARB region (70.49%), especially in the summer (Figure 6d) where its average contribution reaches 93.46% (DOY 181–225). In the ARB area of Northeast China, spring fire emissions lasted for the longest time (DOY 54–149). There were 32 days of high-intensity emissions in autumn (DOY 281–312). On ordinal day 288, the average daily emission from China was the highest, reaching 0.4 Tg CO2. Trends in high CO2 emissions for Mongolia were similar to those in China, with high emissions concentrated at 97–180 days in spring and 277–302 days in autumn.

3.4. Comparison with Other Studies

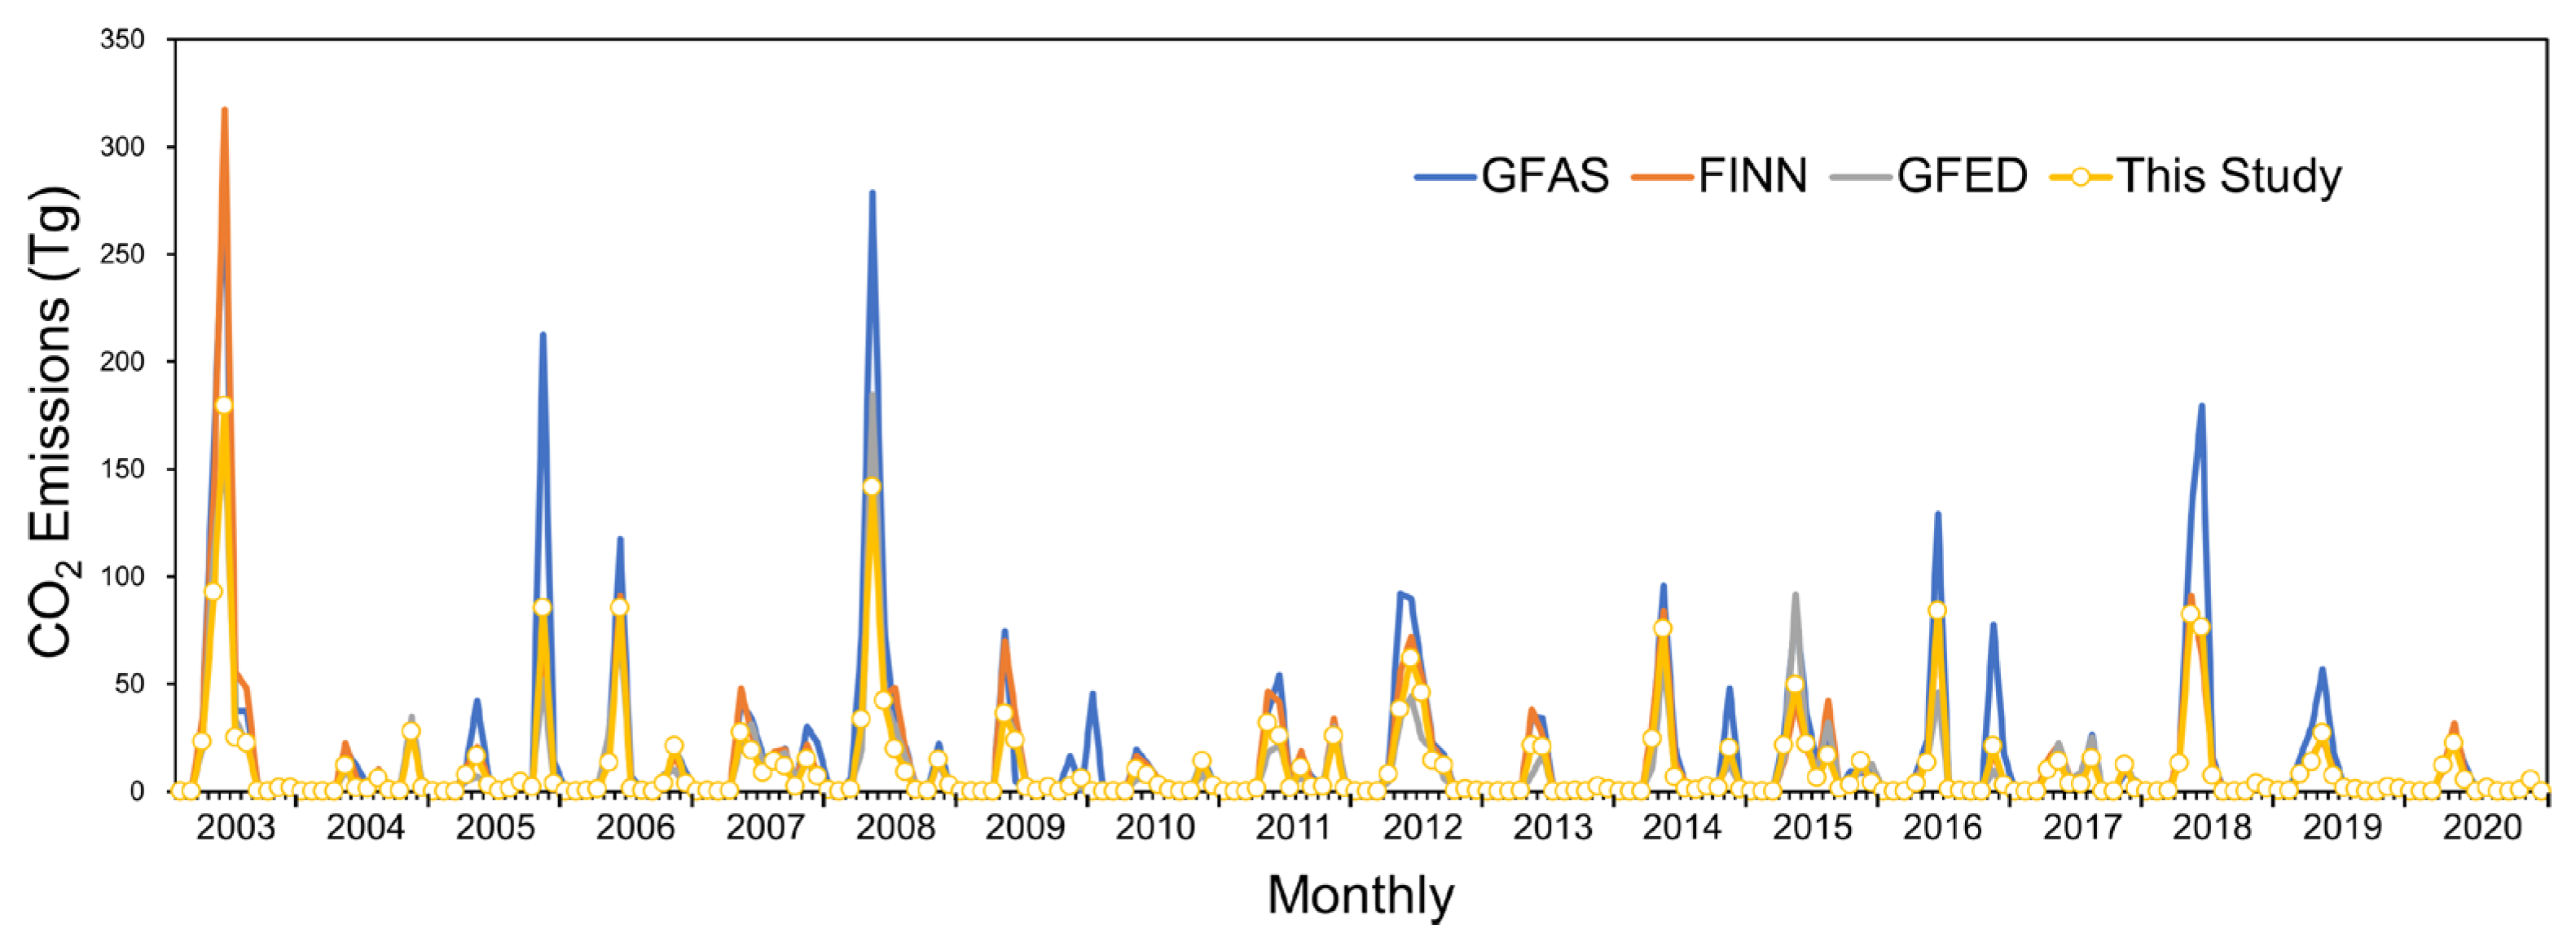
We compared our results with the Global Fire Emissions Database data (GFED, 2003–2016, monthly, 0.25 × 0.25°), the Fire INventory from NCAR (FINN, 2003–2019, daily, 1 km2), and the Global Fire Assimilation System emissions (GFAS, 2003–2020, daily, 0.1 × 0.1°). In general, this study was comparable to the above three data inventories and there was strong agreement on a monthly scale (Figure 7). Among them, compared with GFAS, our results have the strongest correlation with GFAS (r2 = 0.94, n = 216), though the average error of GFAS was largest, reaching 7.5 Tg/m. Especially in the case of high emissions, the GFAS results were significantly higher than our results, GFED data, and FINN data. Meanwhile, compared with other results, there was an obvious anomaly in December 2009. Therefore, GFAS may overestimate CO2 emissions in the ARB area. Compared with the FINN, the average deviation was reduced to 3.2 Tg/m and r2 reached 0.92 (n = 210). Although the FINN results differed significantly from ours in May 2003, our results were very consistent with the FINN results at other times. The GFED product CO2 emission results based on burned area were the lowest, 2.92 Tg/m lower than our results (r2 = 0.89, n = 168). The main difference appeared between April and May in spring and October in autumn. More specifically, as agricultural fires increased significantly after 2010, the difference in CO2 emissions between GFED and our study widened from an average of 1.1 Tg (2003–2010) to an average of 4.6 Tg (2011–2016) in April in Heilongjiang Province in China. GFED will underestimate CO2 emissions in the ARB region, especially in Northeast China after 2010.
In the 2003–2016 period, for which all the datasets have CO2 emission estimates, this study yielded annual biomass burning CO2 emissions from the ARB (165.99 Tg/a), this is higher than the value reported in GFED4.1s (130.98 Tg/a) but lower than the value of FINNv2.2 (214.70 Tg/a) and GFAS (267.53 Tg/a). This difference is mainly due to the fact that FINN’s estimation of emission inventories is based on the fire spots statistical method [18], which overestimates the area burned by small fires. At the same time, the specific discrimination of grasslands and shrubs causes uncertainties in the emission inventory due to the types of surface combustibles [27]. The difference in biomass burning emissions between FINN and GFAS is due to their use of different dry matter combustion and emission factors. Specifically, GFAS also uses the FRP method for estimation and has shown good performance in estimating fire emissions and timing, but GFAS uses biome-specific conversion factors derived from multi-annual fits between dry matter burning efficiencies for each biome in GFED3.1 [27]. Uncertainty typically appears to be about 30%, especially for exotic species [71]. Consequently, the monthly CO2 emission ratios obtained by FINN/GFAS ranged from 0.01 to 6.95. Differences between the FINN and GFAS estimates occur mainly in regions with high biomass burning intensity. Our results were consistent with the CO2 emission results of Yin et al. (2019) in Heilongjiang Province, China from 2003 to 2017 (Table 5). Therefore, under the same trend, our experimental results for high-resolution daily emissions are more stable (Figure 8). The estimated results of this study have greater reference value for the ARB region.
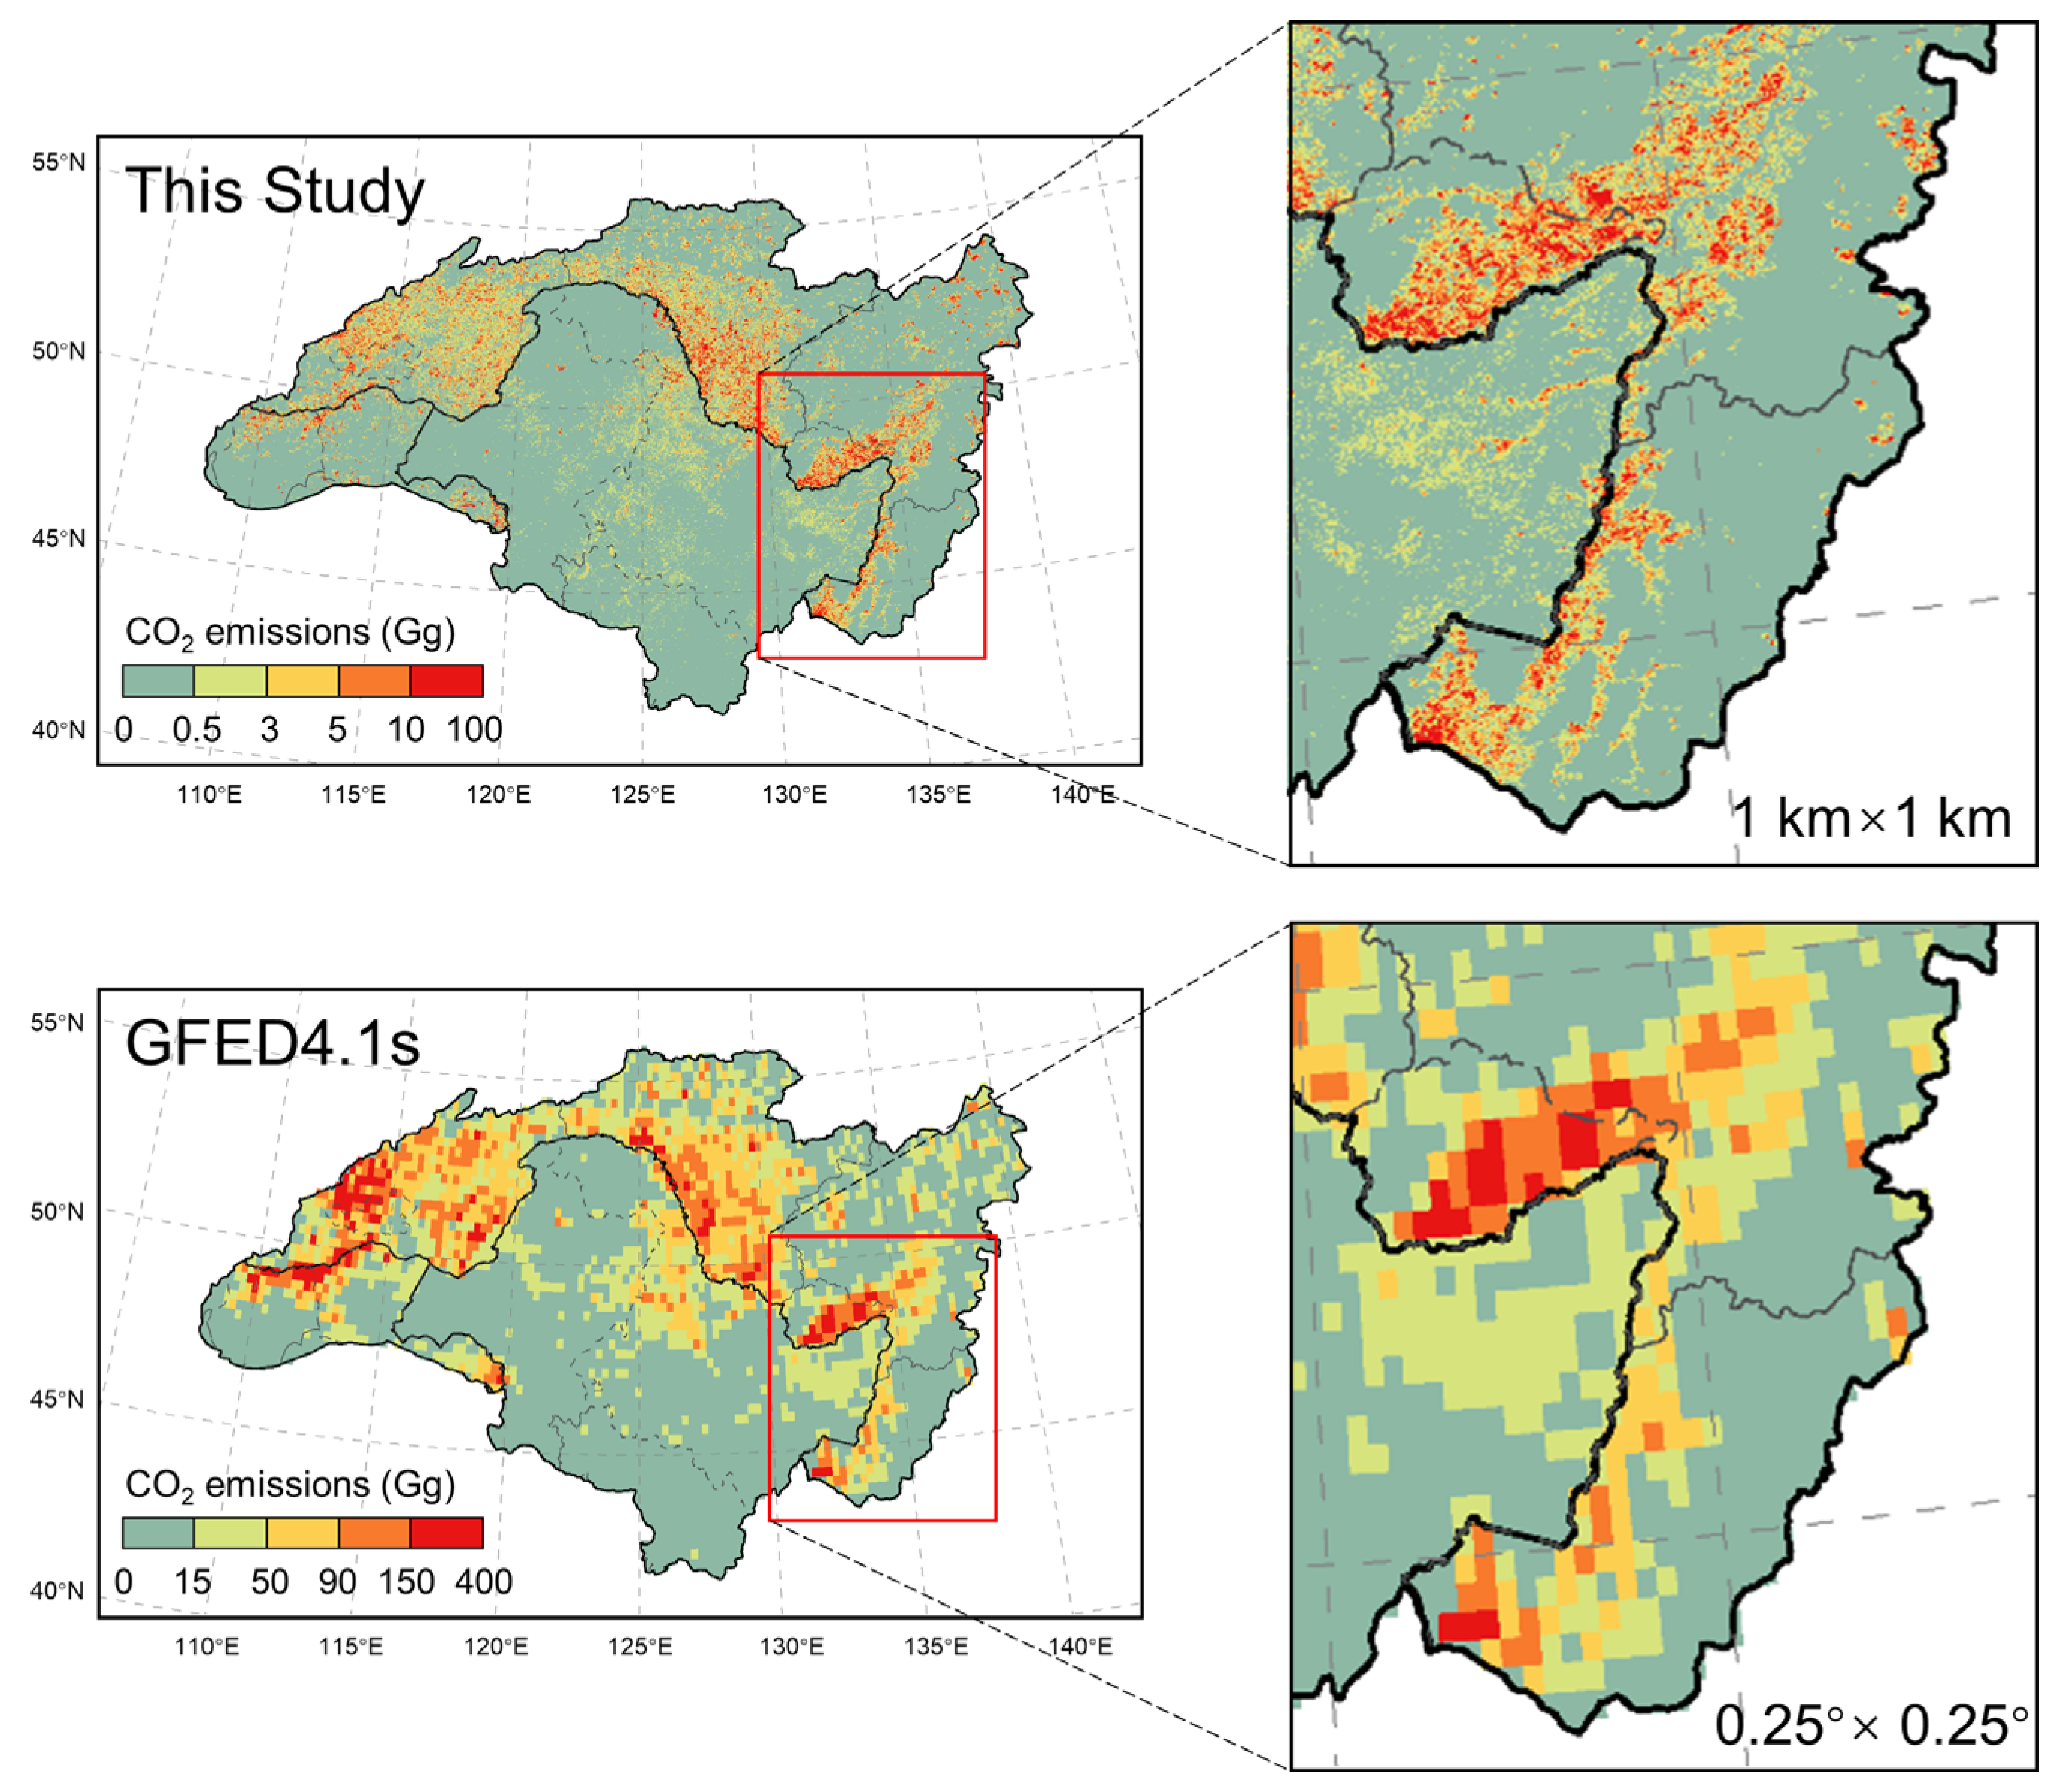
It is worth noting that this study increased spatiotemporal resolution to the daily 1 km grid level in order to minimize the effects of differences in the spatial distribution of surface biomass on estimates of FRE (Figure 8). However, the vegetation types in each grid are diverse and were determined by land-use classification; differences in vegetation cover are one of the key factors contributing to large differences between emission inventories. Therefore, mixed pixels and classification errors are inevitable, which is one of the key reasons for the significant difference between the FINN and GFAS models. Compared with GFED, FINN, and GFAS, the emission inventory results estimated by the FRE method in this study were stable and reasonable in boreal forest areas such as the ARB. In this study, the estimated results of other trace gases or aerosol particles in the Amur-Heilongjiang River Basin from 2003 to 2020 were closer to the real situation. In future research, the method of fusion for the difference in surface albedo and vegetation types can be used to further optimize the results of land use classification and the area of fire pixels to improve estimation accuracy.

4. Conclusions

We used FRE data from MODIS to estimate a long-term (2003–2020) inventory of daily emissions from OBB with high spatial resolution (1 km × 1 km grid). First, the fire points in the Amur-Heilong River Basin were screened according to fire point confidence (FireMask, DN ≥ 7) and land use data. By integrating the daily maximum radiant energy in the study area and combining it with the conversion ratio (CR) and emission factor (EF), we ultimately obtained pollutant emission inventory estimates. We estimated the emissions of 11 kinds of pollutants produced by biomass combustion and found that the annual average emissions of CO2, CO, CH4, NMOCs, NOx, NH3, SO2, BC, OC, PM2.5, and PM10 were 153.57, 6.16, 0.21, 0.78, 0.28, 0.08, 0.06, 0.04, 0.39, 0.66, and 0.85 Tg/a, respectively.
Taking CO2 as an example for detailed description, the following important observations have been made. The Russian Far East was the main source of CO2 contribution from fires in the ARB, accounting for about 80.56% of the entire region, with grassland fires accounting for the largest proportion at 57% and agricultural fires contributing 1.72% of total CO2 emissions. China contributed 12.24% of CO2 emissions and crop fires dominated these emissions (40.73%), followed by grassland fires (33.47%). Mongolia contributed the least with grassland fires being the predominant source of CO2 emissions. Among the total CO2 emissions (2764.3 TgCO2) of OBB in the ARB from 2003 to 2020, grassland fires accounted for the largest proportion, reaching 56.77% (1569.3 TgCO2), followed by forest fires and crop fires, accounting for 36.81% and 6.42%, respectively. In the study area, the spatial distribution of grassland fires was relatively stable and most of the high emissions occurred in eastern Russia. Most of the high emissions from forest fires occurred in the northeastern part of the ARB but, due to the impact of many fires in 2003, 2008, and 2012, the spatial distribution of emissions has changed significantly. High CO2 emissions from agricultural fires occurred mainly in China (77.68%) and were significantly affected by human disturbance. From 2003 to 2020, the center of gravity of CO2 emissions from agricultural fires moved southward by 2.45°, indicating that the burning of agricultural waste showed a significant southward trend. There were clear seasonal differences in emissions, which were highest in spring and autumn and lowest in summer and winter.
This study provides a daily inventory of biomass burning emissions at a resolution of 1 km2. Considering the existence of large areas of permafrost in boreal forest areas, frequent surface fires accelerate their degradation and release large amounts of greenhouse gases. Especially in the context of carbon peaking and carbon neutrality, these results help to monitor and evaluate the progress and effectiveness of emission control regulations. Future work on estimating changes in soil greenhouse gases caused by fire disturbances in permafrost regions will focus on accurate accommodation of complex vegetation types in the Amur-Heilong River Basin.

Author Contributions

Funding acquisition, S.Z.; Methodology, Z.L., Y.Z. (Yue Zhu) and Y.Z. (Yang Zhang); Project administration, S.Z.; Resources, Z.L.; Software, D.G.; Visualization, Z.L., D.G., H.M. and Y.Z. (Yang Zhang); Writing—original draft, Z.L.; Writing—review and editing, Y.S. and S.Z. All authors have read and agreed to the published version of the manuscript.

Funding

This research was funded by the Key Joint Program of National Natural Science Foundation of China (NSFC) and Heilongjiang Province for Regional Development [No. U20A2082]; National Natural Science Foundation of China (NSFC) [No. 41971151]; Natural Science Foundation of Heilongjiang Province of China [No.TD2019D002]; Doctor Innovation Foundation of China Normal University [No. HSDBSCX2021-06].

Data Availability Statement

All the data given in this paper are available at corresponding websites. For other results and data, a request for sharing may be sent to the corresponding author.

Acknowledgments

The authors would like to thank the NASA team for providing the MODIS data, we would like to thank the GFED, FINN, GFAS organizations for their data support. Special thanks to Lilin for writing guidance, as well as editors and reviewers for helpful comments to improve this manuscript.

Conflicts of Interest

The authors declare no conflict of interest.

References

  1. Kasischke, E.S.; Hoy, E.E. Controls on carbon consumption during Alaskan wildland fires. Glob. Chang. Biol. 2012, 18, 685–699. [Google Scholar] [CrossRef]
  2. Shi, Y.; Matsunaga, T.; Yamaguchi, Y. High-Resolution Mapping of Biomass Burning Emissions in Three Tropical Regions. Environ. Sci. Technol. 2015, 49, 10806–10814. [Google Scholar] [CrossRef]
  3. Wiedinmyer, C.; Akagi, S.K.; Yokelson, R.J.; Emmons, L.K.; Al-Saadi, J.A.; Orlando, J.J.; Soja, A.J. The Fire INventory from NCAR (FINN): A high resolution global model to estimate the emissions from open burning. Geosci. Model. Dev. 2011, 4, 625–641. [Google Scholar] [CrossRef] [Green Version]
  4. Freeborn, P.H.; Wooster, M.J.; Roy, D.P.; Cochrane, M.A. Quantification of MODIS fire radiative power (FRP) measurement uncertainty for use in satellite-based active fire characterization and biomass burning estimation. Geophys. Res. Lett. 2014, 41, 1988–1994. [Google Scholar] [CrossRef]
  5. Lv, Z.; Shi, Y.; Zang, S.; Sun, L. Spatial and Temporal Variations of Atmospheric CO2 Concentration in China and Its Influencing Factors. Atmosphere 2020, 11, 231. [Google Scholar] [CrossRef] [Green Version]
  6. Van der Werf, G.R.; Randerson, J.T.; Giglio, L.; van Leeuwen, T.T.; Chen, Y.; Rogers, B.M.; Mu, M.; van Marle, M.J.E.; Morton, D.C.; Collatz, G.J.; et al. Global fire emissions estimates during 1997–2016. Earth Syst. Sci. Data 2017, 9, 697–720. [Google Scholar] [CrossRef] [Green Version]
  7. Baccini, A.; Goetz, S.J.; Walker, W.S.; Laporte, N.T.; Sun, M.; Sulla-Menashe, D.; Hackler, J.; Beck, P.S.A.; Dubayah, R.; Friedl, M.A.; et al. Estimated carbon dioxide emissions from tropical deforestation improved by carbon-density maps. Nat. Clim. Chang. 2012, 2, 182–185. [Google Scholar] [CrossRef]
  8. Shi, Y.; Sasai, T.; Yamaguchi, Y. Spatio-temporal evaluation of carbon emissions from biomass burning in Southeast Asia during the period 2001–2010. Ecol. Model. 2014, 272, 98–115. [Google Scholar] [CrossRef]
  9. Friedlingstein, P.; O’Sullivan, M.; Jones, M.W.; Andrew, R.M.; Hauck, J.; Olsen, A.; Peters, G.P.; Peters, W.; Pongratz, J.; Sitch, S.; et al. Global Carbon Budget 2020. Earth Syst. Sci. Data 2020, 12, 3269–3340. [Google Scholar] [CrossRef]
  10. Chen, Y.; Morton, D.C.; Andela, N.; van der Werf, G.R.; Giglio, L.; Randerson, J.T. A pan-tropical cascade of fire driven by El Niño/Southern Oscillation. Nat. Clim. Chang. 2017, 7, 906–911. [Google Scholar] [CrossRef]
  11. Tian, J.; Wang, Q.; Ni, H.; Wang, M.; Zhou, Y.; Han, Y.; Shen, Z.; Pongpiachan, S.; Zhang, N.; Zhao, Z.; et al. Emission Characteristics of Primary Brown Carbon Absorption From Biomass and Coal Burning: Development of an Optical Emission Inventory for China. J. Geophys. Res. Atmos. 2019, 124, 1879–1893. [Google Scholar] [CrossRef]
  12. Le Quéré, C.; Andrew, R.M.; Friedlingstein, P.; Sitch, S.; Hauck, J.; Pongratz, J.; Pickers, P.A.; Korsbakken, J.I.; Peters, G.P.; Canadell, J.G.; et al. Global Carbon Budget 2018. Earth Syst. Sci. Data 2018, 10, 2141–2194. [Google Scholar] [CrossRef] [Green Version]
  13. Yokelson, R.J.; Christian, T.J.; Karl, T.G.; Guenther, A. Corrigendum to “The tropical forest and fire emissions experiment: Laboratory fire measurements and synthesis of campaign data“ published in Atmos. Chem. Phys., 8, 3509–3527, 2008. Atmos. Chem. Phys. 2008, 8, 4497. [Google Scholar] [CrossRef] [Green Version]
  14. Akagi, S.K.; Yokelson, R.J.; Wiedinmyer, C.; Alvarado, M.J.; Reid, J.S.; Karl, T.; Crounse, J.D.; Wennberg, P.O. Emission factors for open and domestic biomass burning for use in atmospheric models. Atmos. Chem. Phys. 2011, 11, 4039–4072. [Google Scholar] [CrossRef] [Green Version]
  15. Bond, T.C.; Doherty, S.J.; Fahey, D.W.; Forster, P.M.; Berntsen, T.; DeAngelo, B.J.; Flanner, M.G.; Ghan, S.; Kärcher, B.; Koch, D.; et al. Bounding the role of black carbon in the climate system: A scientific assessment. J. Geophys. Res. Atmos. 2013, 118, 5380–5552. [Google Scholar] [CrossRef]
  16. Olivier, J.G.J.; Van Aardenne, J.A.; Dentener, F.J.; Pagliari, V.; Ganzeveld, L.N.; Peters, J.A.H.W. Recent trends in global greenhouse gas emissions:regional trends 1970–2000 and spatial distributionof key sources in 2000. Environ. Sci. 2007, 2, 81–99. [Google Scholar] [CrossRef] [Green Version]
  17. Shi, Y.; Zhao, A.; Matsunaga, T.; Yamaguchi, Y.; Zang, S.; Li, Z.; Yu, T.; Gu, X. High-resolution inventory of mercury emissions from biomass burning in tropical continents during 2001–2017. Sci. Total Environ. 2019, 653, 638–648. [Google Scholar] [CrossRef]
  18. Yin, L.; Du, P.; Zhang, M.; Liu, M.; Xu, T.; Song, Y. Estimation of emissions from biomass burning in China (2003–2017) based on MODIS fire radiative energy data. Biogeosciences 2019, 16, 1629–1640. [Google Scholar] [CrossRef] [Green Version]
  19. Shi, Y.; Gong, S.; Zang, S.; Zhao, Y.; Wang, W.; Lv, Z.; Matsunaga, T.; Yamaguchi, Y.; Bai, Y. High-resolution and multi-year estimation of emissions from open biomass burning in Northeast China during 2001–2017. J. Clean. Prod. 2021, 310, 127496. [Google Scholar] [CrossRef]
  20. Shi, Y.; Yamaguchi, Y. A high-resolution and multi-year emissions inventory for biomass burning in Southeast Asia during 2001–2010. Atmos. Environ. 2014, 98, 8–16. [Google Scholar] [CrossRef]
  21. Seiler, W.; Crutzen, P.J. Estimates of gross and net fluxes of carbon between the biosphere and the atmosphere from biomass burning. Clim. Chang. 1980, 2, 207–247. [Google Scholar] [CrossRef]
  22. Shi, Y.; Zang, S.; Matsunaga, T.; Yamaguchi, Y. A multi-year and high-resolution inventory of biomass burning emissions in tropical continents from 2001–2017 based on satellite observations. J. Clean. Prod. 2020, 270, 122511. [Google Scholar] [CrossRef]
  23. Qiu, X.; Duan, L.; Chai, F.; Wang, S.; Yu, Q.; Wang, S. Deriving High-Resolution Emission Inventory of Open Biomass Burning in China based on Satellite Observations. Environ. Sci. Technol. 2016, 50, 11779–11786. [Google Scholar] [CrossRef] [PubMed]
  24. Giglio, L.; Randerson, J.T.; van der Werf, G.R. Analysis of daily, monthly, and annual burned area using the fourth-generation global fire emissions database (GFED4). J. Geophys. Res. Biogeosci. 2013, 118, 317–328. [Google Scholar] [CrossRef] [Green Version]
  25. Liu, M.; Song, Y.; Yao, H.; Kang, Y.; Li, M.; Huang, X.; Hu, M. Estimating emissions from agricultural fires in the North China Plain based on MODIS fire radiative power. Atmos. Environ. 2015, 112, 326–334. [Google Scholar] [CrossRef]
  26. Song, Y.; Di, C.; Bing, L.; Miao, W.; Zhang, Y.; Zhu, L. A new emission inventory for nonagricultural open fires in Asia from 2000 to 2009. Environ. Res. Lett. 2010, 5, 14014–14016. [Google Scholar] [CrossRef]
  27. Pan, X.; Ichoku, C.; Chin, M.; Bian, H.; Darmenov, A.; Colarco, P.; Ellison, L.; Kucsera, T.; da Silva, A.; Wang, J.; et al. Six global biomass burning emission datasets: Intercomparison and application in one global aerosol model. Atmos. Chem. Phys. 2020, 20, 969–994. [Google Scholar] [CrossRef] [Green Version]
  28. Song, Y.; Liu, B.; Miao, W.; Chang, D.; Zhang, Y. Spatiotemporal variation in nonagricultural open fire emissions in China from 2000 to 2007. Glob. Biogeochem. Cycles 2009, 23. [Google Scholar] [CrossRef]
  29. Xu, W.; Wooster, M.J.; Kaneko, T.; He, J.; Zhang, T.; Fisher, D. Major advances in geostationary fire radiative power (FRP) retrieval over Asia and Australia stemming from use of Himarawi-8 AHI. Remote Sens. Environ. 2017, 193, 138–149. [Google Scholar] [CrossRef] [Green Version]
  30. Li, F.; Zhang, X.; Roy, D.P.; Kondragunta, S. Estimation of biomass-burning emissions by fusing the fire radiative power retrievals from polar-orbiting and geostationary satellites across the conterminous United States. Atmos. Environ. 2019, 211, 274–287. [Google Scholar] [CrossRef]
  31. Li, F.; Zhang, X.; Kondragunta, S.; Csiszar, I. Comparison of Fire Radiative Power Estimates From VIIRS and MODIS Observations. J. Geophys. Res. Atmos. 2018, 123, 4545–4563. [Google Scholar] [CrossRef]
  32. Yin, S. Biomass burning spatiotemporal variations over South and Southeast Asia. Environ. Int. 2020, 145, 106153. [Google Scholar] [CrossRef] [PubMed]
  33. Wooster, M.J.; Roberts, G.; Perry, G.L.W.; Kaufman, Y.J. Retrieval of biomass combustion rates and totals from fire radiative power observations: FRP derivation and calibration relationships between biomass consumption and fire radiative energy release. J. Geophys. Res. 2005, 110, 1–24. [Google Scholar] [CrossRef]
  34. Zhang, T.; Wooster, M.J.; Green, D.C.; Main, B. New field-based agricultural biomass burning trace gas, PM 2.5, and black carbon emission ratios and factors measured in situ at crop residue fires in Eastern China. Atmos. Environ. 2015, 121, 22–34. [Google Scholar] [CrossRef] [Green Version]
  35. Giglio, L.; Schroeder, W.; Justice, C.O. The collection 6 MODIS active fire detection algorithm and fire products. Remote Sens. Environ. 2016, 178, 31–41. [Google Scholar] [CrossRef] [Green Version]
  36. Freeborn, P.H.; Wooster, M.J.; Hao, W.M.; Ryan, C.A.; Nordgren, B.L.; Baker, S.P.; Ichoku, C. Relationships between energy release, fuel mass loss, and trace gas and aerosol emissions during laboratory biomass fires. J. Geophys. Res. 2008, 113, 16. [Google Scholar] [CrossRef]
  37. Wooster, M.J. Small-scale experimental testing of fire radiative energy for quantifying mass combusted in natural vegetation fires. Geophys. Res. Lett. 2002, 29, 23. [Google Scholar] [CrossRef]
  38. Giglio, L. MODIS Collection 6 Active Fire Product User’s Guide Revision A. Environ. Sci. 2015. [Google Scholar]
  39. Kaiser, J.; Suttie, M.; Flemming, J.; Morcrette, J.J.; Boucher, O.; Schultz, M. Global real-time fire emission estimates based on space-borne fire radiative power observations. In AIP Conference Proceedings; American Institute of Physics: College Park, MD, USA, 2009; pp. 645–648. [Google Scholar] [CrossRef]
  40. Kaiser, J.; Heil, A.; Andreae, M.; Benedetti, A.; Chubarova, N.; Jones, L.; Morcrette, J.-J.; Razinger, M.; Schultz, M.; Suttie, M. Biomass burning emissions estimated with a global fire assimilation system based on observed fire radiative power. Biogeosciences 2012, 9, 527–554. [Google Scholar] [CrossRef] [Green Version]
  41. Liu, T.; Mickley, L.J.; Marlier, M.E.; DeFries, R.S.; Khan, M.F.; Latif, M.T.; Karambelas, A. Diagnosing spatial biases and uncertainties in global fire emissions inventories: Indonesia as regional case study. Remote Sens. Environ. 2020, 237, 111557. [Google Scholar] [CrossRef]
  42. Takami, K.; Shimadera, H.; Uranishi, K.; Kondo, A. Impacts of Biomass Burning Emission Inventories and Atmospheric Reanalyses on Simulated PM10 over Indochina. Atmosphere 2020, 11, 160. [Google Scholar] [CrossRef] [Green Version]
  43. Zhou, S.; Zhang, W.; Guo, Y. Impacts of Climate and Land-Use Changes on the Hydrological Processes in the Amur River Basin. Water 2019, 12, 76. [Google Scholar] [CrossRef] [Green Version]
  44. Yan, B.; Xia, Z.; Huang, F.; Guo, L.; Zhang, X. Climate Change Detection and Annual Extreme Temperature Analysis of the Amur River Basin. Adv. Meteorol. 2016, 2016, 1–14. [Google Scholar] [CrossRef]
  45. Zou, Y.; Wang, L.; Xue, Z.; E, M.; Jiang, M.; Lu, X.; Yang, S.; Shen, X.; Liu, Z.; Sun, G.; et al. Impacts of Agricultural and Reclamation Practices on Wetlands in the Amur River Basin, Northeastern China. Wetlands 2017, 38, 383–389. [Google Scholar] [CrossRef]
  46. Mao, D.; Tian, Y.; Wang, Z.; Jia, M.; Du, J.; Song, C. Wetland changes in the Amur River Basin: Differing trends and proximate causes on the Chinese and Russian sides. J. Environ. Manag. 2021, 280, 111670. [Google Scholar] [CrossRef] [PubMed]
  47. Guo, D.; Wang, C.; Zang, S.; Hua, J.; Lv, Z.; Lin, Y. Gap-Filling of 8-Day Terra MODIS Daytime Land Surface Temperature in High-Latitude Cold Region with Generalized Additive Models (GAM). Remote Sens. 2021, 13, 3667. [Google Scholar] [CrossRef]
  48. Zhang, T.; de Jong, M.C.; Wooster, M.J.; Xu, W.; Wang, L. Trends in eastern China agricultural fire emissions derived from a combination of geostationary (Himawari) and polar (VIIRS) orbiter fire radiative power products. Atmos. Chem. Phys. 2020, 20, 10687–10705. [Google Scholar] [CrossRef]
  49. Li, F.; Zhang, X.; Kondragunta, S. Biomass Burning in Africa: An Investigation of Fire Radiative Power Missed by MODIS Using the 375 m VIIRS Active Fire Product. Remote Sens. 2020, 12, 1561. [Google Scholar] [CrossRef]
  50. Vermote, E.; Ellicott, E.; Dubovik, O.; Lapyonok, T.; Chin, M.; Giglio, L.; Roberts, G.J. An approach to estimate global biomass burning emissions of organic and black carbon from MODIS fire radiative power. J. Geophys. Res. Atmos. 2009, 114, D18205. [Google Scholar] [CrossRef]
  51. Shen, Y.; Jiang, C.; Chan, K.L.; Hu, C.; Yao, L. Estimation of Field-Level NOx Emissions from Crop Residue Burning Using Remote Sensing Data: A Case Study in Hubei, China. Remote Sens. 2021, 13, 404. [Google Scholar] [CrossRef]
  52. He, Q.; Gu, Y.; Zhang, M. Spatiotemporal patterns of aerosol optical depth throughout China from 2003 to 2016. Sci. Total Environ. 2019, 653, 23–35. [Google Scholar] [CrossRef] [PubMed]
  53. Shi, Y.; Zhao, A.; Matsunaga, T.; Yamaguchi, Y.; Zang, S.; Li, Z.; Yu, T.; Gu, X. Underlying causes of PM2.5-induced premature mortality and potential health benefits of air pollution control in South and Southeast Asia from 1999 to 2014. Environ. Int. 2018, 121, 814–823. [Google Scholar] [CrossRef] [PubMed]
  54. Andreae, M.O.; Rosenfeld, D. Aerosol cloud precipitation interactions. Part 1. The nature and sources of cloud-active aerosols. Earth Sci. Rev. 2008, 89, 13–41. [Google Scholar] [CrossRef]
  55. Mcmeeking, G.R. The Optical, Chemical, and Physical Properties of Aerosols and Gases Emitted by the Laboratory Combustion of Wildland Fuels. Ph.D. Thesis, Department of Atmospheric Sciences, Colorado State University, Fort Collins, CO, USA, 2008. [Google Scholar]
  56. Cao, G.L.; Zhang, X.Y.; Zheng, F.C.; Wang, Y.Q. Estimating the quantity of crop residues burnt in open field in China. Resour. Sci. 2006, 16, 502–508. [Google Scholar] [CrossRef]
  57. Shvidenko, A.Z.; Shchepashchenko, D.G.; Vaganov, E.A.; Sukhinin, A.I.; Maksyutov, S.S.; McCallum, I.; Lakyda, I.P. Impact of wildfire in Russia between 1998–2010 on ecosystems and the global carbon budget. Dokl. Earth Sci. 2012, 441, 1678–1682. [Google Scholar] [CrossRef]
  58. Hayasaka, H.; Sokolova, G.V.; Ostroukhov, A.; Naito, D. Classification of Active Fires and Weather Conditions in the Lower Amur River Basin. Remote Sens. 2020, 12, 3204. [Google Scholar] [CrossRef]
  59. Mollicone, D.; Eva, H.D.; Achard, F.J.N. Human role in Russian wild fires. Nature 2006, 440, 436–437. [Google Scholar] [CrossRef]
  60. Shi, T.T.; Liu, Y.Q.; Zhang, L.B.; Hao, L.; Gao, Z.Q. Burning in agricultural landscapes: An emerging natural and human issue in China. Landsc. Ecol. 2014, 29, 1785–1798. [Google Scholar] [CrossRef]
  61. Jargalsaikhan, D.; Darhijav, B.; Rentsen, T. Estimation of crop suitability using NDVI in The Kherlen Basin Dornod province Mongolia. Int. J. Sci. Environ. Technol. 2021, 10, 19–21. [Google Scholar]
  62. Wang, J.; Cheng, K.; Liu, Q.; Zhu, J.; Ochir, A.; Davaasuren, D.; Li, G.; Wei, H.; Chonokhuu, S.; Namsrai, O. Land cover patterns in Mongolia and their spatiotemporal changes from 1990 to 2010. Arab. J. Geosci. 2019, 12, 1–13. [Google Scholar] [CrossRef]
  63. Damoah, R.; Spichtinger, N.; Forster, C.; James, P.; Mattis, I.; Wandinger, U.; Beirle, S.; Wagner, T.; Stohl, A. Around the world in 17 days—hemispheric-scale transport of forest fire smoke from Russia in May 2003. Atmos. Chem. Phys. 2004, 4, 1311–1321. [Google Scholar] [CrossRef] [Green Version]
  64. Kim, J.S.; Kug, J.S.; Jeong, S.J.; Park, H.; Schaepman-Strub, G. Extensive fires in southeastern Siberian permafrost linked to preceding Arctic Oscillation. Sci. Adv. 2020, 6, eaax3308. [Google Scholar] [CrossRef] [PubMed] [Green Version]
  65. Sukhomlinov, N.R.; Sukhomlinova, V.V. Fire damage to plants in coniferous-deciduous forests in the Middle Amur region and their indicator significance. Contemp. Probl. Ecol. 2011, 4, 303–309. [Google Scholar] [CrossRef]
  66. Yan, C.; Yan, S.S.; Jia, T.Y.; Dong, S.K.; Gong, Z.P. Decomposition characteristics of rice straw returned to the soil in northeast China. Nutr. Cycl. Agroecosyst. 2019, 114, 211–224. [Google Scholar] [CrossRef]
  67. Stankowski, S.; Chajduk, E.; Osińska, B.; Gibczyńska, M. Biomass ash as a potential raw material for the production of mineral fertilisers. Agron. Res. 2021, 19, 1999–2012. [Google Scholar] [CrossRef]
  68. Lee, K.H.; Kim, J.E.; Kim, Y.J.; Kim, J.; Hoyningen-Huene, W.V. Impact of the Smoke Aerosol from Russian Forest Fires on the Atmospheric Environment over Korea during May 2003. Atmos. Environ. 2005, 39, 85–99. [Google Scholar] [CrossRef]
  69. Vivchar, A. Wildfires in Russia in 2000–2008: Estimates of burnt areas using the satellite MODIS MCD45 data. Remote Sens. Lett. 2011, 2, 81–90. [Google Scholar] [CrossRef]
  70. Warneke, C.; Bahreini, R.; Brioude, J.; Brock, C.A.; De Gouw, J.A.; Fahey, D.W.; Froyd, K.D.; Holloway, J.S.; Middlebrook, A.; Miller, L. Biomass burning in Siberia and Kazakhstan as an important source for haze over the Alaskan Arctic in April 2008. Geophys. Res. Lett. 2009, 36, L02813. [Google Scholar] [CrossRef] [Green Version]
  71. Andela, N.; Kaiser, J.W.; Heil, A.; Leeuwen, T.V.; Van, D.; Wooster, M.J.; Remy, S.; Schultz, M. Assessment of the Global Fire Assimilation System (GFASv1); Deliverable D_31.2; MACC-II: Amsterdam, The Netherlands, 2013. [Google Scholar] [CrossRef]
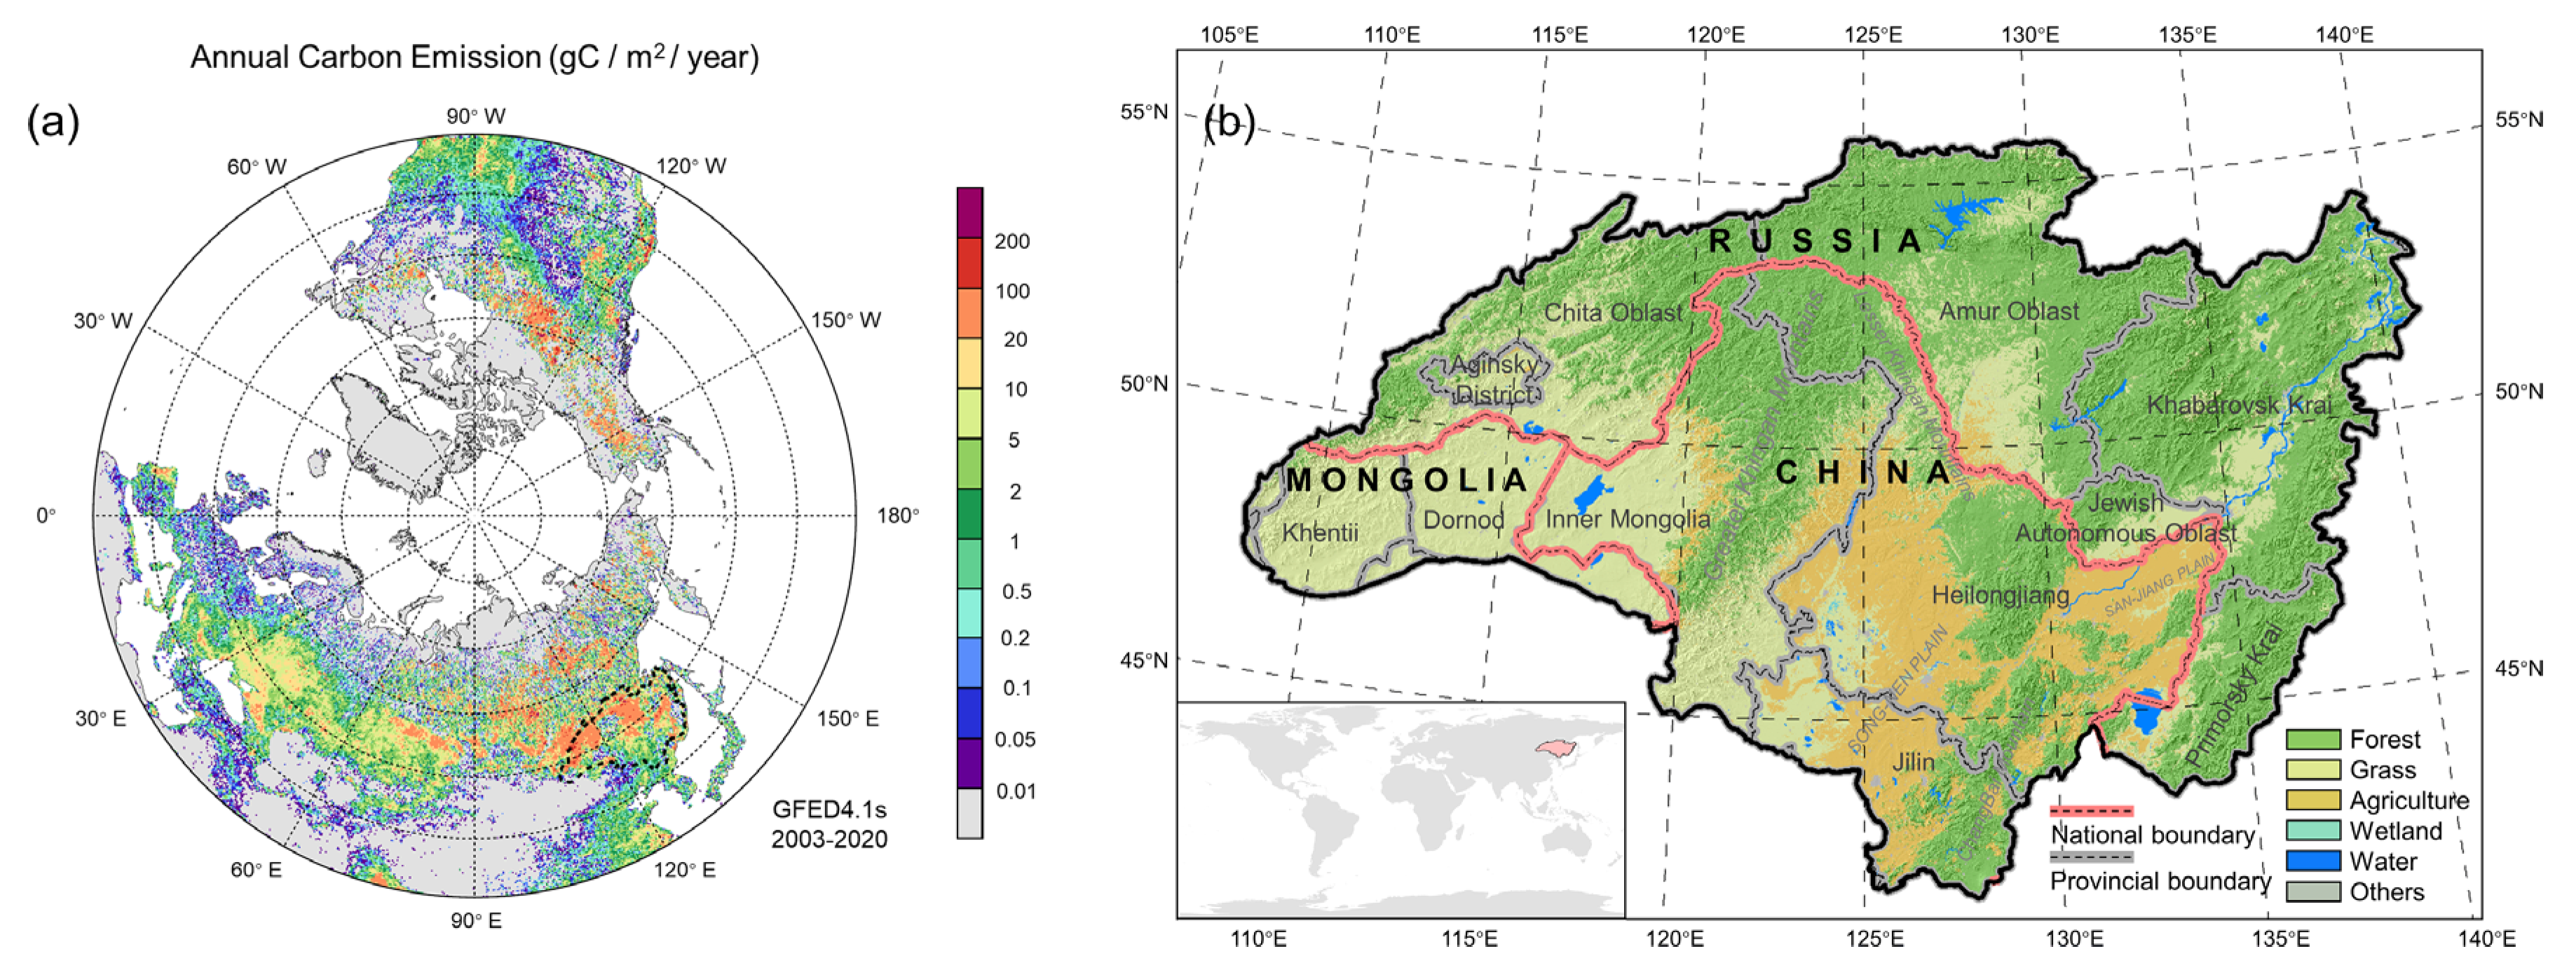
Figure 1. (a) Carbon emissions from biomass burning in the northern hemisphere (GFEDv4.1s); (b) land use and cover reclassification data in the Amur-Heilong River Basin in this study (MCD12Q1_IGBP, 2010).
Remotesensing 14 04087 g001
Figure 2. The average annual CO2 emissions from biomass burning in the Amur River Basin for 2003–2020 (unit: Gg).
Remotesensing 14 04087 g002
Figure 3. Total CO2 emissions from biomass burning in the Amur River Basin for 2003–2020.
Remotesensing 14 04087 g003
Figure 4. Annual and monthly CO2 emissions from biomass burning in the Amur River Basin for 2003–2020 (unit: Tg). (a,b) Annual CO2 emissions and contribution ratios to total emissions of different types of fires; (c,d) Monthly CO2 emissions and contribution rates to total emissions of different types of fires.
Remotesensing 14 04087 g004
Figure 5. The spatial changes in the median center and standard deviation ellipse of annual CO2 emissions between 2003 and 2020.
Remotesensing 14 04087 g005
Figure 6. (a,b): Daily CO2 emissions from biomass burning in the Amur-Heilong River Basin from 2003 to 2020. (c,d): Average daily CO2 emissions during this period.
Remotesensing 14 04087 g006
Figure 7. Monthly mean CO2 emissions (Tg) from OBB in this study compared with GFED, FINN and GFAS data for 2003–2020.
Remotesensing 14 04087 g007
Figure 8. Comparison of annual CO2 emissions from OBB between this study with a 1 km grid and GFED4.1s with a 0.25° grid in the Amur-Heilong River Basin during the 2003–2016 period.
Remotesensing 14 04087 g008
Table 1. Reclassification of Land Cover and Land Use Data in the Amur-Heilong River Basin (ARB).
IGBPThis StudyIGBPThis Study
1. Evergreen Needleleaf ForestsForest10. GrasslandsGrassland
2. Evergreen Broadleaf Forests-11. Permanent WetlandsWetland
3. Deciduous Needleleaf ForestsForest12. CroplandsAgriculture
4. Deciduous Broadleaf ForestsForest13. Urban and Built-up LandsOthers
5. Mixed ForestsForest14. Cropland/Natural Vegetation MosaicsAgriculture
6. Closed ShrublandsForest15. Permanent Snow and IceOthers
7. Open ShrublandsForest16. BarrenOthers
8. Woody SavannasForest17. Water BodiesWater
9. SavannasGrassland
(-) Indicates that there is no relevant classification result in the study area [47].
Table 2. Selected emission factors for each kind of land use type in g gas species per kg dry matter burned. (Unit: g kg−1).
CategoryLand Use TypeCO2COCH4NMOCsNOxNH3SO2BCOCPM2.5PM10
(IGBP)Unit: g kg−1
ForestEvergreen Needleleaf Forest1514.0 a118.0 a6.0 a28.0 a1.8 c2.5 a1.0 c0.8 d7.8 f12.7 e13.1 e
Evergreen Broadleaf Forest-----------
Deciduous Needleleaf Forest1514.0 a118.0 a6.0 a28.0 a3.0 c3.5 a1.0 c0.8 d7.8 f12.7 e13.1 e
Deciduous Broadleaf Forest1630.0 a102.0 a5.0 a11.0 a1.3 a1.5 a1.0 c0.8 d9.2 a12.3 e12.8 e
Mixed Forest1630.0 a102.0 a5.0 a14.0 a1.3 a1.5 a1.0 c0.8 d9.2 a12.3 e12.8 e
Closed Shrublands1716.0 a68.0 a2.6 a4.8 a3.9 a1.2 a0.7 a0.5 d6.6 f7.9 e8.5 e
Open Shrublands1716.0 a68.0 a2.6 a4.8 a3.9 a1.2 a0.7 a0.5 d6.6 f7.9 e8.5 e
Woody Savannas1716.0 a68.0 a2.6 a4.8 a3.9 a1.2 a0.7 a0.4 d6.6 f7.9 e8.5 e
GrassSavannas1692.0 a59.0 a1.5 a9.3 a2.8 a0.5 a0.7 a0.4 d2.6 d6.3 e9.9 e
Grasslands1692.0 a59.0 a1.5 a9.3 a2.8 a0.5 a0.7 a0.5 d2.6 d6.3 e9.9 e
CropCropland1353.5 b76.1 b2.8 b9.8 b2.9 b1.4 b0.4 b0.6 d2.0 d5.0 b6.3 b
Cropland/Natural Vegetation Mosaics1669.4 b84.7 b3.4 b5.8 b3.5 b0.9 b0.5 b0.5 d6.3 d7.9 b8.5 b
Note: superscript letters indicate the data source. a (Akagi et al., 2011 [14]); b (Yin et al., 2019 [18]); c (Andreae et al., 2008 [54]); d (Akagi et al., 2011 [14]; Yin et al., 2019 [18]; McMeekin et al., 2008 [55]; Cao et al., 2006 [56]); e (Song et al., 2010 [26]); f (McMeekin et al., 2008 [55]).
Table 3. Annual biomass burning emissions for each species (Unit: Tg).
CO2COCH4NMOCsNOxNH3SO2BCOCPM2.5PM10
2003430.0017.000.592.000.820.240.180.121.201.902.30
200482.003.400.110.450.130.040.040.030.200.370.47
2005140.005.600.180.760.250.070.060.040.320.600.80
2006170.006.600.220.810.300.090.070.050.440.730.92
2007130.005.100.160.680.230.060.060.040.310.550.74
2008310.0012.000.401.500.570.160.130.080.821.301.70
200994.003.900.130.490.160.050.040.030.250.420.53
201054.002.200.070.290.090.030.020.020.120.220.30
2011130.005.100.170.660.220.060.050.040.300.540.70
2012210.008.300.281.000.390.110.090.060.580.911.10
201361.002.500.080.330.100.030.030.020.150.260.35
2014160.006.500.210.850.290.080.070.050.380.680.88
2015210.008.200.261.100.370.100.090.060.450.851.20
2016150.006.100.210.780.250.080.060.040.380.650.82
201795.004.100.140.540.170.060.040.030.220.400.52
2018190.008.100.291.000.350.120.090.060.550.891.10
201982.003.300.100.460.140.040.030.020.160.330.46
202069.002.900.100.390.120.040.030.020.140.280.37
Mean153.726.160.210.780.280.080.060.040.390.660.85
Table 4. Annual CO2 emissions of different fire types in the Amur-Heilong River Basin (Unit: Tg).
RussiaChinaMongolia
GrassForestCropTotalGrassForestCropTotalGrassForestCropTotal
2003148.0195.04.3347.324.633.56.064.117.90.00.418.3
200435.714.41.751.911.88.33.123.37.00.20.17.3
200587.934.02.7124.66.31.34.011.66.90.00.27.1
200669.458.62.1130.210.111.02.924.012.70.00.012.7
200767.737.02.1106.83.01.43.37.816.70.00.016.7
2008135.3127.72.7265.76.74.24.515.428.00.70.028.7
200942.429.11.673.14.44.04.613.05.42.40.58.3
201029.58.01.839.34.33.83.711.83.10.00.03.1
201165.036.72.1103.85.62.47.315.36.40.00.06.4
201282.798.41.4182.42.70.83.67.218.40.00.018.5
201331.214.50.946.63.02.04.79.84.80.00.04.8
201485.945.82.7134.35.51.613.821.05.00.00.05.0
201594.142.22.7139.06.43.517.227.144.30.10.044.5
201675.349.21.8126.43.71.511.516.73.50.00.03.5
201735.223.81.961.04.32.219.926.47.40.00.07.4
201893.388.82.6184.72.23.04.79.80.30.00.00.3
201949.610.91.962.44.91.68.615.14.60.00.04.6
202033.812.51.347.73.81.114.319.21.80.00.01.8
Table 5. Comparison of annual mean CO2 emissions from biomass burning (Tg) calculated in our study with estimates made by other methods. (Unit: Tg).
RegionAmurRussiaMongoliaChinaHeilongjiang (China)
Period2003–20162003–20162003–20162003–20162003–2017
This study165.99133.6613.2019.1413.80
GFED4.1s130.9898.4112.2920.2915.22 *
FINNv2.2214.70178.755.6530.3023.75
GFAS267.53231.4015.0721.0612.43
Yin et al. (2019)----13.81
*: Since 2017, GFED4.1s data are only available in beta version.
Publisher’s Note: MDPI stays neutral with regard to jurisdictional claims in published maps and institutional affiliations.