Abstract
Rain-fed agriculture is easily affected by meteorological disasters, especially drought. As an important factor of risk formation, actively carrying out agricultural drought vulnerability assessments is conducive to improving food security and reducing economic losses. In this study, an SE-DEA model with regional exposure and drought risk as input factors and the maize yield reduction rate and drought-affected area as output factors is established. The aim is to evaluate and zone the drought vulnerability of the maize belt in the Songliao Plain. The results show the following: (1) From 2000 to 2019, the drought vulnerability of maize showed a fluctuating increasing trend. The vulnerability in Harbin and central Jilin Province is high, which is extremely unfavorable for maize production. (2) Comparing the historical disaster data with the drought vulnerability map generated using the SE-DEA model, it could be found that the results obtained using the SE-DEA model are reliable. (3) The Tobit model shows that the proportion of the effective irrigated area is more important to alleviate vulnerability. For drought vulnerability zoning using a cluster analysis, we suggest that regulated deficit irrigation should be actively developed in high-vulnerability areas to ensure maize yield while improving water efficiency. The results of this study can provide a basis for the development of drought mitigation and loss reduction strategies, and they provide new ideas for future research.
1. Introduction
Climate change has a widespread and significant impact on agricultural production, and it increases the instability of agricultural production, changes the planting structure and layout, and even increases the frequency of regional agrometeorological disasters [1,2,3,4,5,6]. Northeast China is located in the middle and high latitudes, and it has a complex geographical environment and geomorphological features, and a great spatial variability of heat resources [7,8]. Under the control of the monsoon climate in East Asia, the spatial and temporal distribution of precipitation is uneven, with high inter-annual variability and frequent drought disasters [9,10,11,12]. Over the past 20 years, more than one-quarter of the crops in Northeast China have been affected by drought each year [13]. Among them, maize yields were reduced by 20–30% due to drought, and the economic loss was as high as about 8.9 × 10⁸ yuan [14]. The crop water resources in Northeast China are very scarce, and the risk of drought in the region will be exacerbated by sustained global temperature increases in the future [15,16]. Determining how to address the adverse effects of drought on maize production and identifying how to stabilize or improve maize yield are urgent problems for maize production in Northeast China.
Drought is a necessary condition for the formation of disasters, and vulnerability is the fundamental reason for the transformation of a “drought” into a “disaster”. Vulnerability is a state of the disaster-bearing body, which is related to its own attributes and the effect of disaster-causing factors on the disaster-bearing body [17,18]. As the key and linking factor of risk assessments, seeking ways to reduce vulnerability can achieve the ultimate goal of disaster reduction. Currently, the research on vulnerability is mainly divided into qualitative research and quantitative research. Qualitative research focuses on the causes of vulnerability, but regional vulnerability assessments often lack a systematic approach and scientific validity. Therefore, on the basis of qualitative research, many scholars have established vulnerability assessment models and classified vulnerability levels using mathematical methods [19,20,21,22].
Guo et al. used the Environmental Policy Integrated Climate (EPIC) model to simulate the drought intensity and vulnerability curves of rice in different future periods so as to evaluate the impact of drought on global rice yield [23]. Zhu et al. used the AquaCrop model to examine the drought vulnerability of major maize-producing areas in China, simulating water stress and corresponding yield changes in maize under different irrigation scenarios [24]. Farhangfar et al. quantified the drought vulnerability of crops in Iran in current and future periods by establishing the United Nations Environmental Program (UNEP) Aridity Index (AIU) [25]. Yildirim et al. used graphic superimposition to assess the vulnerability of agricultural floods in Iowa by using flood-inundated maps and crop grid data [26]. Hoque et al. proposed a spatial multi-criteria integrated approach, which combines geospatial techniques and an analytical hierarchy process (AHP), to draw a comprehensive drought vulnerability map of Bangladesh [27].
In previous studies, most vulnerability assessments have needed to assign weights to each factor [28,29]. However, the acquisition of weight often has great subjectivity. It is difficult to demonstrate the importance of one factor relative to another. This highlights the advantages of the data envelopment analysis (DEA) model, namely, the absence of subjective judgement and the improved fault tolerance [30]. The DEA model was first proposed in 1957 and has since been continuously developed [31,32]. DEA is an effective method used to evaluate the efficiency of decision-making units (DMUs) with multiple inputs and outputs. Based on the concept of relative efficiency, it evaluates the relative effectiveness of DMUs using mathematical programming and statistical data. Essentially, DEA is an evaluation model of the ‘‘input–output’’ operational efficiency of a system [33,34]. The occurrence of natural disasters is the result of the operation of regional disaster systems, and it can also be regarded as an ‘‘input–output’’ system. The occurrence of disasters is the result of the comprehensive action of disaster-causing factors, hazard pregnant environment, and disaster-bearing bodies. Therefore, vulnerability can be regarded as a reflection of the ‘‘efficiency’’ level of disaster generation (Figure 1). The greater the vulnerability, the higher the ‘‘efficiency’’ of regional disasters, and the easier it is for a serious disaster situation to develop.
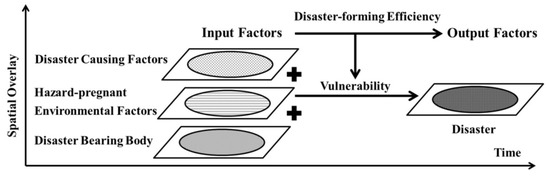
Figure 1.
The process of regional natural disaster vulnerability assessment based on DEA model.
Some studies have applied the DEA model to evaluate disaster vulnerability, and they have obtained reliable results [35,36,37,38,39]. However, the application of DEA, the super-efficiency data envelopment analysis (SE-DEA), and the network data envelopment analysis (NDEA) in natural disaster analyses is still in the exploratory stage [40,41,42]. Therefore, this study proposed the inputs and outputs of an SE-DEA system to assess maize drought vulnerability. Furthermore, the rationality of the evaluation results was verified and drought vulnerability zoning was carried out. The Tobit model was used to determine the main factors affecting disaster prevention and mitigation in various regions, providing a reference for improving the efficiency factors of drought resistance in the Songliao Plain. At the same time, it can provide methodology for the application in other regions of China (and other countries).
2. Materials
2.1. Study Area
The main maize-producing areas of the Songliao Plain are located in Northeast China, at 40°12′–46°18′N, 120°42′–127°36′E, with a total area of 1.74 × 10⁵ km2. The altitude is low in the south, high in the northwest, and higher in the southeast and eastern margins. The area belongs to a temperate continental monsoon climate, with a high temperature, a rainy summer, and a cold and dry winter. The land is fertile, and it is one of only three regions of black soil in the world. The grain output in Northeast China accounts for one-third of China’s total output, and it is an important production base of maize, soybean, and animal husbandry (Figure 2).
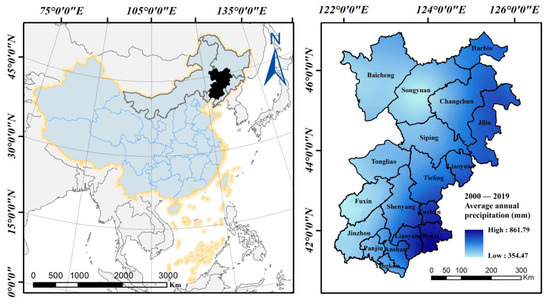
Figure 2.
Location of the study area.
2.2. Data Sources
2.2.1. Daily Meteorological Data
The daily meteorological data of the Songliao Plain from 2000 to 2019 were collected from the National Meteorological Information Center (http://data.cma.cn/, accessed on 4 January 2020), and the data included the maximum temperature, minimum temperature, rainfall, relative humidity, solar radiation, and wind speed. Data were obtained from 17 Chinese national ground observation stations in the study area, and the accuracy rate was nearly 100% after quality control. In this study, the required meteorological data were gridded to 4 km × 4 km.
2.2.2. Agricultural, Social, Economic, and Drought Disaster Data
This data were mainly from the Liaoning Provincial Statistical Yearbook (http://tjj.ln.gov.cn/, accessed on 4 January 2020), the Jilin Provincial Statistical Yearbook (http://tjj.jl.gov.cn/, accessed on 4 January 2020), the Harbin City Statistical Yearbook (http://www.harbin.gov.cn/, accessed on 4 January 2020), the Tongliao City Statistical Yearbook (http://tjj.tongliao.gov.cn/, accessed on 4 January 2020), and the China Regional Economic Statistical Yearbook (http://www.stats.gov.cn/, accessed on 4 January 2020) for the years 2000–2019. By collecting and collating relevant data, we obtained the total power of agricultural machinery, the proportion of effective irrigated area, the fiscal fund for assisting agriculture, the per capita income of rural households, the consumption of chemical fertilizer, and the proportion of the agricultural population. Data on the maize drought-affected area from 2000 to 2019 were collected from the China Meteorological Disasters Dictionary (https://xueshu.baidu.com/, accessed on 4 January 2020) and the Resource Discipline Innovation Platform (http://www.data.ac.cn/, accessed on 4 January 2020) for the years 2000–2019. In this study, the 4 km × 4 km grid was used as the basic evaluation unit, and the vector plane data were converted into grids of the same size so as to achieve the unification of scale.
2.2.3. Maize Production Data
Data on the maize development period were obtained from the Academy of Agricultural Sciences, and the data mainly include the date of sowing, jointing, tasseling, milk-ripe, and maturity from 2000 to 2019. In this study, we counted the historical development period data of each county and city within the study area and calculated the annual average value for each growth period of maize.
2.2.4. Soil Data
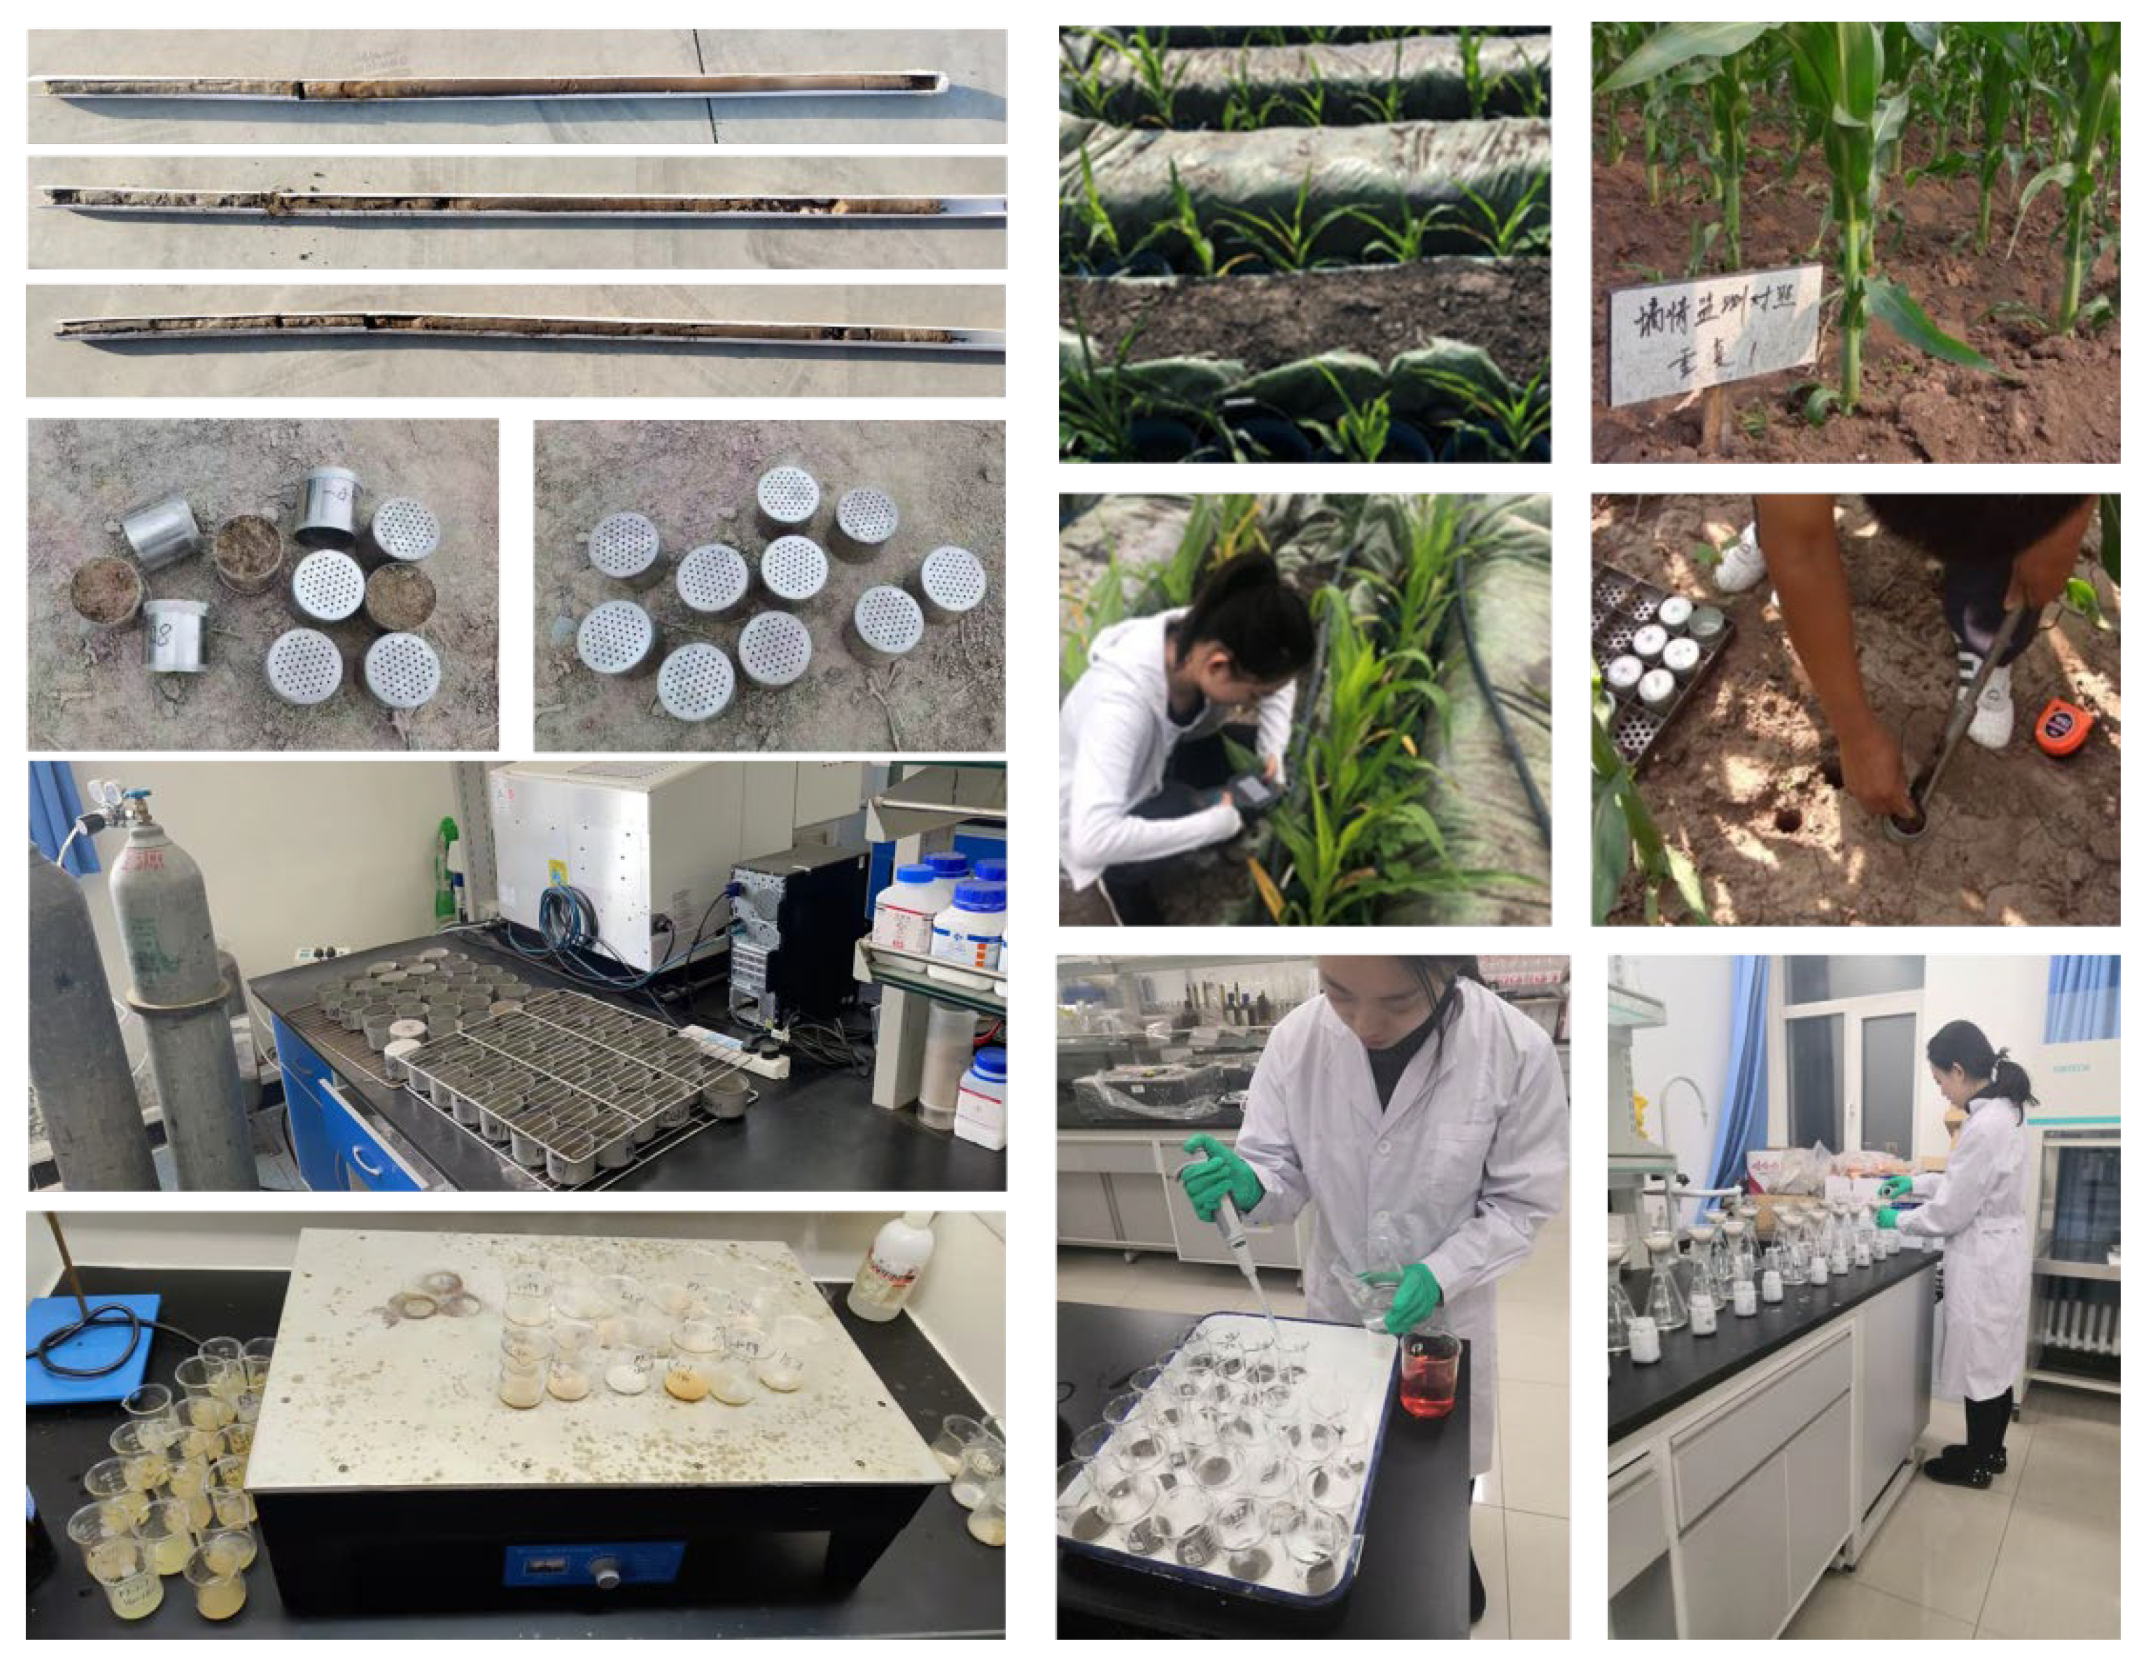
Soil data were obtained by conducting field tests for many years, and each soil parameter was treated with a 4 km × 4 km grid (Figure 3). The soil parameters measured in this study were soil bulk density, soil wilting moisture, and soil gravimetric water content. The depth of measurement was 1 m, with one layer for every 10 cm and four replicates for each layer. Following the method used by Zhou [43,44], soil was collected layer by layer, weighed, and recorded. The sample soil was boxed and brought back for baking, and the soil bulk density was calculated. Subsequently, the gravimetric water content of the soil was determined. The maize seedlings were then planted into measuring cups closed on the soil surface. When all leaves wilted, the air humidity was close to saturation. At the same time, when the leaves could not recover under the condition of minimum transpiration, the soil moisture in the container was determined as the wilting moisture.

Figure 3.
Soil parameter determination test.
- (1)
- Soil bulk density ()
- (2)
- Soil wilting moisture ()
The maize was cultivated in containers until it began to wilt permanently due to the lack of water; then, the maize and 2 cm of soil were removed from the surface. The remaining soil moisture content was the soil wilting moisture, and it was determined using the drying method.
- (3)
- Gravimetric water content of soil ()
3. Methodology
3.1. Super-Efficiency DEA Model
DEA is a linear programming method; it uses the observed valid sample data, takes each evaluation object as a DMU, and ultimately evaluates the effectiveness of the DMU [45]. Suppose there are n DMUs, each of which has m types of inputs and s types of outputs. The input is , and the output is .
where represents the input quantity of the ith (i = 1,2, …, m) type of the input of the j (j = 1,2,) . represents the output quantity of the rth (r = 1,2,) type of the output of the j . The C2R model used to evaluate the effectiveness of the th is as follows:
where and denote the input and output indicators, respectively, and is the weight variable for the jth indicator. and are slack variables, and is the criterion for judging whether is effective. If , then this means that the input effect of the DMU is the best.
However, when the Charnes–Cooper–Rhodes model (C2R model) is used for evaluation, there will be multiple effective DEA cases. The DMU with the highest efficiency value of “1” cannot be distinguished, and the superiority among the DMUs cannot be judged [45,46]. The SE-DEA effectively distinguishes the situation of multiple high-efficiency DMUs by comparing the evaluated DMU with the linear combinations of all other DMUs in the sample and then ranking them [47]; the formula is as follows:
where is the super-efficiency value; the other symbols have the same meaning as those in Equation (4).
3.2. Tobit Model
In this study, the Tobit model was introduced to analyze the vulnerability values of each DMU calculated using the SE-DEA model in order to determine the correlation between the vulnerability and vulnerability explanatory variables [48,49]. The Tobit linear regression model is expressed as follows:
where is the observed dependent variable, and is the latent variable selected by the state. When , is satisfied. is the explanatory independent variable, is the parameter vector, and is the random error vector. The maximum likelihood (ML) was used to obtain and .
3.3. Construction of Drought Vulnerability Evaluation Index System of Maize
3.3.1. Input Index
- (1)
- Regional exposure
Maize is a disaster-bearing body in the Songliao Plain, and the maize-planted area of each city can represent the regional exposure degree. The larger the maize-planted area, the greater the exposure and the higher the drought vulnerability. The larger the proportion of the agricultural population in the whole region, the more widespread the impact of a drought and the more people who suffer losses. Moreover, the lower the economic value created by the agricultural population, the less the capital that can be invested after a disaster. Therefore, the greater the proportion of the agricultural population, the higher the exposure and the vulnerability of the drought.
- (2)
- Drought hazard
The Songliao Plain is a rain-fed, maize-growing area, and drought is mainly caused by a lack of natural precipitation, failing to meet the demand for water of maize. Therefore, establishing an index of the crop water demand satisfaction degree of external available water can determine the occurrence of agricultural drought and the degree of disaster. The crop water deficit index (CWDI) as an index used to characterize agricultural drought, and it is recognized by many scholars [50,51,52].
where is the crop water deficit index, is the effective soil moisture at 20 cm at maize seedling emergence (mm), is the sum of daily effective precipitation from the beginning of seedling emergence (mm), and is the sum of crop water requirements from emergence (mm). is the sum of the daily irrigation amounts from seedling emergence (mm). The Songliao Plain area is dominated by rain-fed agriculture, and irrigation amounts are ignored. is the crop coefficient: sowing–jointing = 0.378, jointing–tasseling = 0.689, tasseling-milk-ripe = 1.185, and milk-ripe–maturity = 0.759 [50,53]. n is the number of days from seedling emergence to maturity, h is the soil thickness (cm), and is the soil bulk density (g/cm3). is the gravimetric water content of the soil (%), and is the wilting moisture (%). is the reference evapotranspiration (mm), and it was calculated using the Penman–Monteith equation recommended by the Food and Agriculture Organization of the United Nations (FAO); the calculation formula is detailed in [54,55,56].
where is the total amount of precipitation (mm) for a given precipitation event, and is the effective use factor. < 5 mm, = 0; 5 mm < ≤ 50 mm, = 0.9; > 50 mm, = 0.75.
3.3.2. Output Index
In this study, the drought-affected area and maize yield reduction rate were used as disaster loss indicators [57,58]. The yield reduction rate is the percentage of rain-fed yield deviating from the potential yield, which can be calculated using the following formula:
where is the yield reduction rate; is the potential yield (kg/hm2) (the yield of a given variety in a certain area without water and fertilizer restriction during the entire growth period); and is the yield under rain-fed conditions at full fertility (kg/hm2) (the yield of a given variety of fertilizer in a certain area), the whole growth period of which is rain-fed without restriction.
3.3.3. Disaster Prevention and Mitigation Capacity
- (1)
- The total power of agricultural machinery (kW): this refers to the total power of all kinds of power machinery, which mainly includes all kinds of machinery used in agriculture, forestry, animal husbandry, and fishery.
- (2)
- The proportion of effective irrigated area (%): this refers to the ratio of the effective irrigation area to the total cultivated land area.
- (3)
- The fiscal fund for assisting agriculture (yuan): this refers to all levels of government budget arrangements for the support of agriculture and rural production expenditure, agriculture, forestry and water, and other departments, and it is used to determine the special expenditure funds.
- (4)
- The per capita income of rural households (yuan): this refers to the total income of rural residents in the year from various sources and is used to deduct the sum of consumer spending and savings.
- (5)
- The consumption of chemical fertilizer (tons): this refers to the actual amount of fertilizer used in agricultural production per year.
3.4. Ward Clustering Method
The Ward clustering method was proposed by Ward [59], and its main idea originates from the analysis of variance. Assume that the n samples are divided into k classes , , , , with denoting the vector of variable indicators for the ith sample in . denotes the number of samples in class , and denotes the centre of gravity of ; then, the sum of squares of the deviations of the samples in is
If and are merged into a new class , the sums of the squares of the intra-class deviations are as follows:
If the distance between and is closer, the deviation square and the increase after merging will be smaller and vice versa. In the Ward clustering method, the distance between samples is obtained using the Euclidean distance.
4. Result
4.1. Temporal and Spatial Distribution of Maize Drought Vulnerability in Songliao Plain
Figure 4 shows the change in the drought vulnerability index in the Songliao Plain from 2000 to 2019. Overall, except for 2011 and 2013, the drought vulnerability index of all provinces showed an increasing trend year by year. The drought vulnerability of Liaoning Province reached the maximum value (0.521) in 2019. The maximum value in Jilin Province was in 2016 (0.508). Harbin, Heilongjiang Province, reached the maximum value (0.754) in 2017. The maximum value of Tongliao in Inner Mongolia was in 2014 (0.721). The drought vulnerability index of Tongliao fluctuated the most. Drought vulnerability in the Songliao Plain reached the maximum value (0.733) in 2017, and the minimum value was 0.35, which occurred in 2000. The drought vulnerability in the Songliao Plain was serious in 2000, 2012, and 2017.
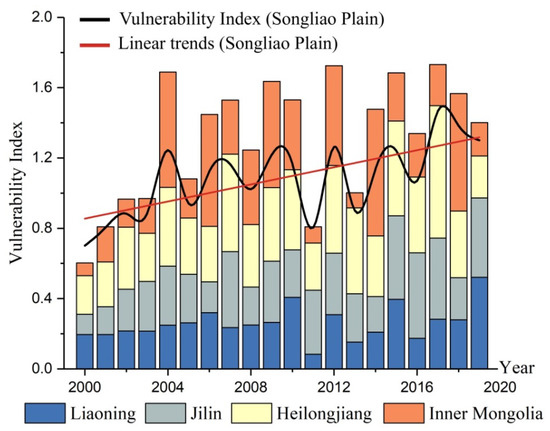
Figure 4.
Change trend of drought vulnerability index of maize in Songliao Plain from 2000 to 2019.
We aimed to understand the spatial distribution of maize drought vulnerability in the Songliao Plain. In this study, the inverse-distance-weighted interpolation (IDW) method in ArcGIS 10.2 was used to obtain the spatial distribution of the drought vulnerability index of maize year by year. Then, the natural breaks (Jenks) were used to classify drought vulnerability into four classes, namely, high, higher, moderate, and low, and to count the area of each class (Figure 5).
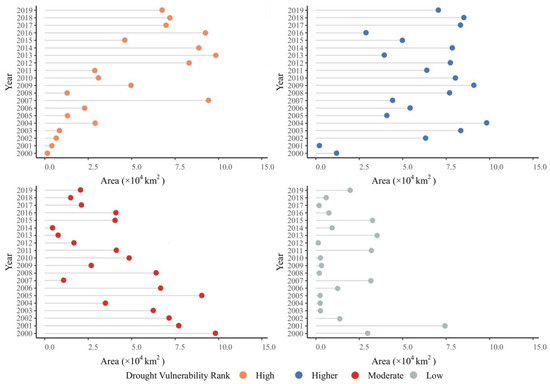
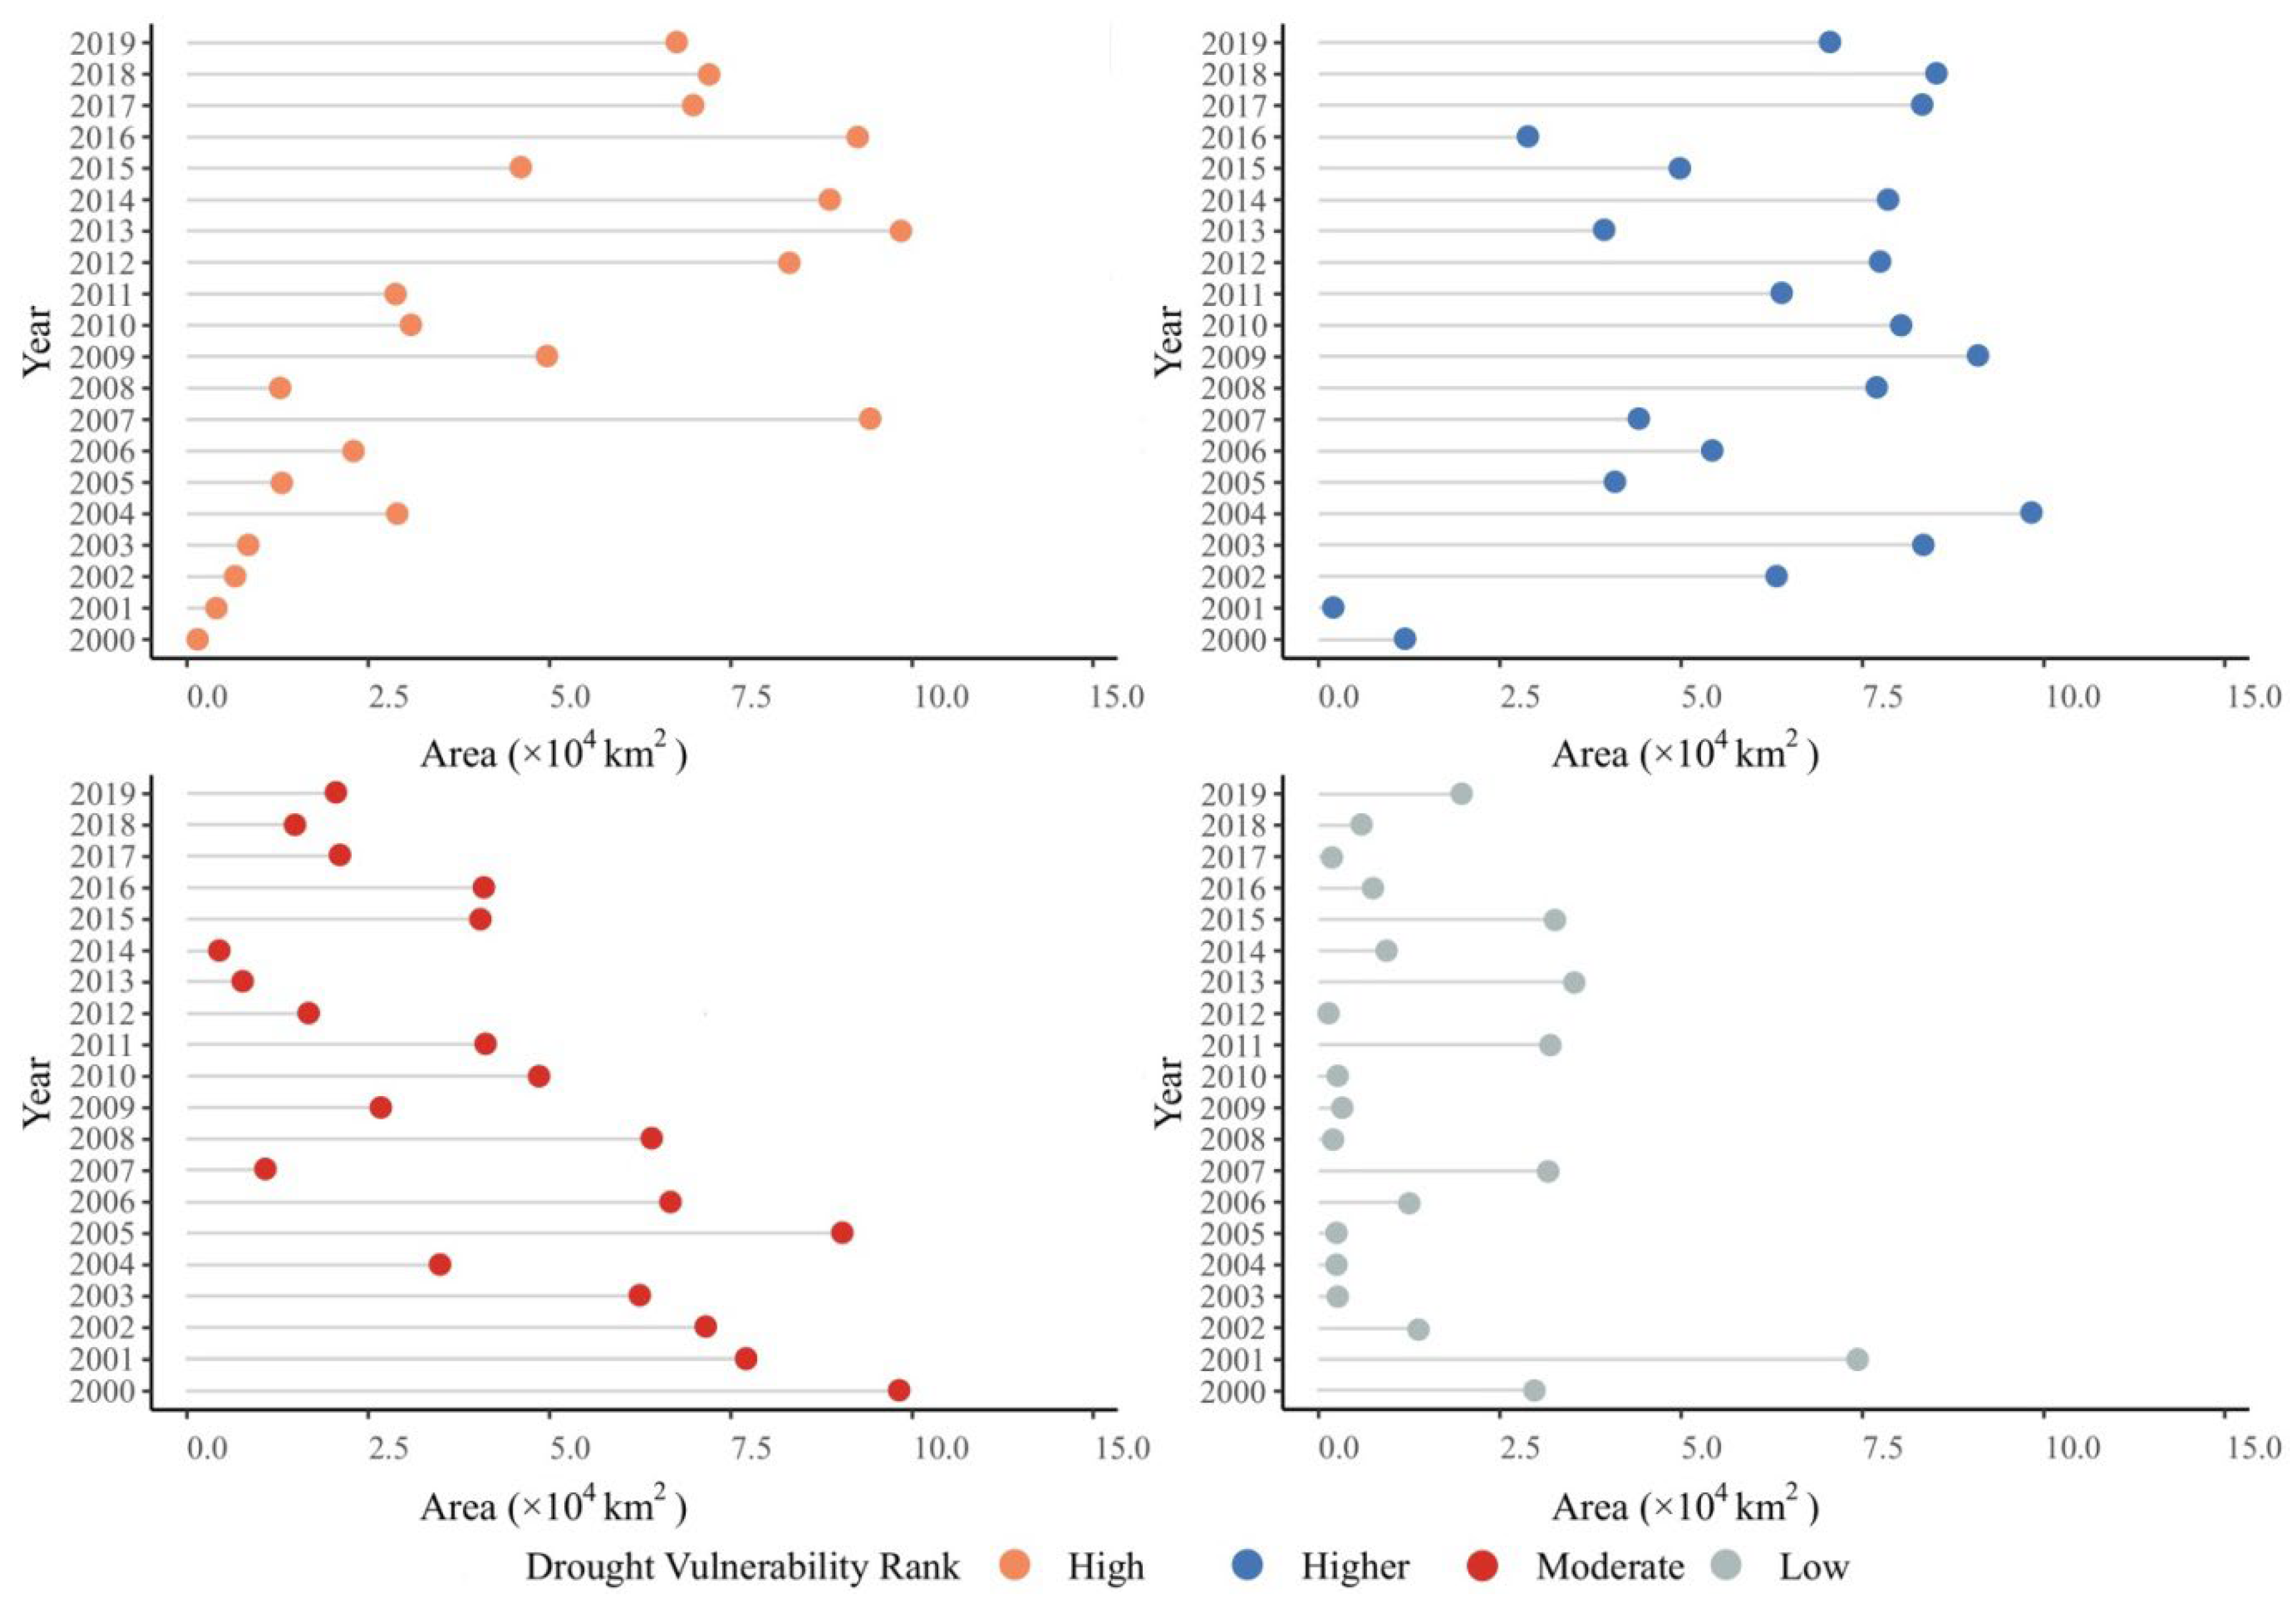
Figure 5.
Trends in area variation for different drought vulnerability classes.
The area of the high-drought-vulnerability area increased year by year, reaching 9.84 × 10⁴ km2 in 2013. The area of the higher grade region fluctuated and reached the maximum value (10.29 × 10⁴ km2) in 2004. With the aggravation of drought vulnerability, the area of moderate drought vulnerability decreased year by year, especially in 2008, when the area was 9.14 × 10⁴ km2. The reduction was more pronounced in areas of low vulnerability. In most years, the area of low vulnerability was less than 4 × 10⁴ km2. Overall, the drought vulnerability of maize in the Songliao Plain is becoming more and more serious, along with the continuous reduction of moderate and low areas, which is very detrimental to the development of the maize industry.
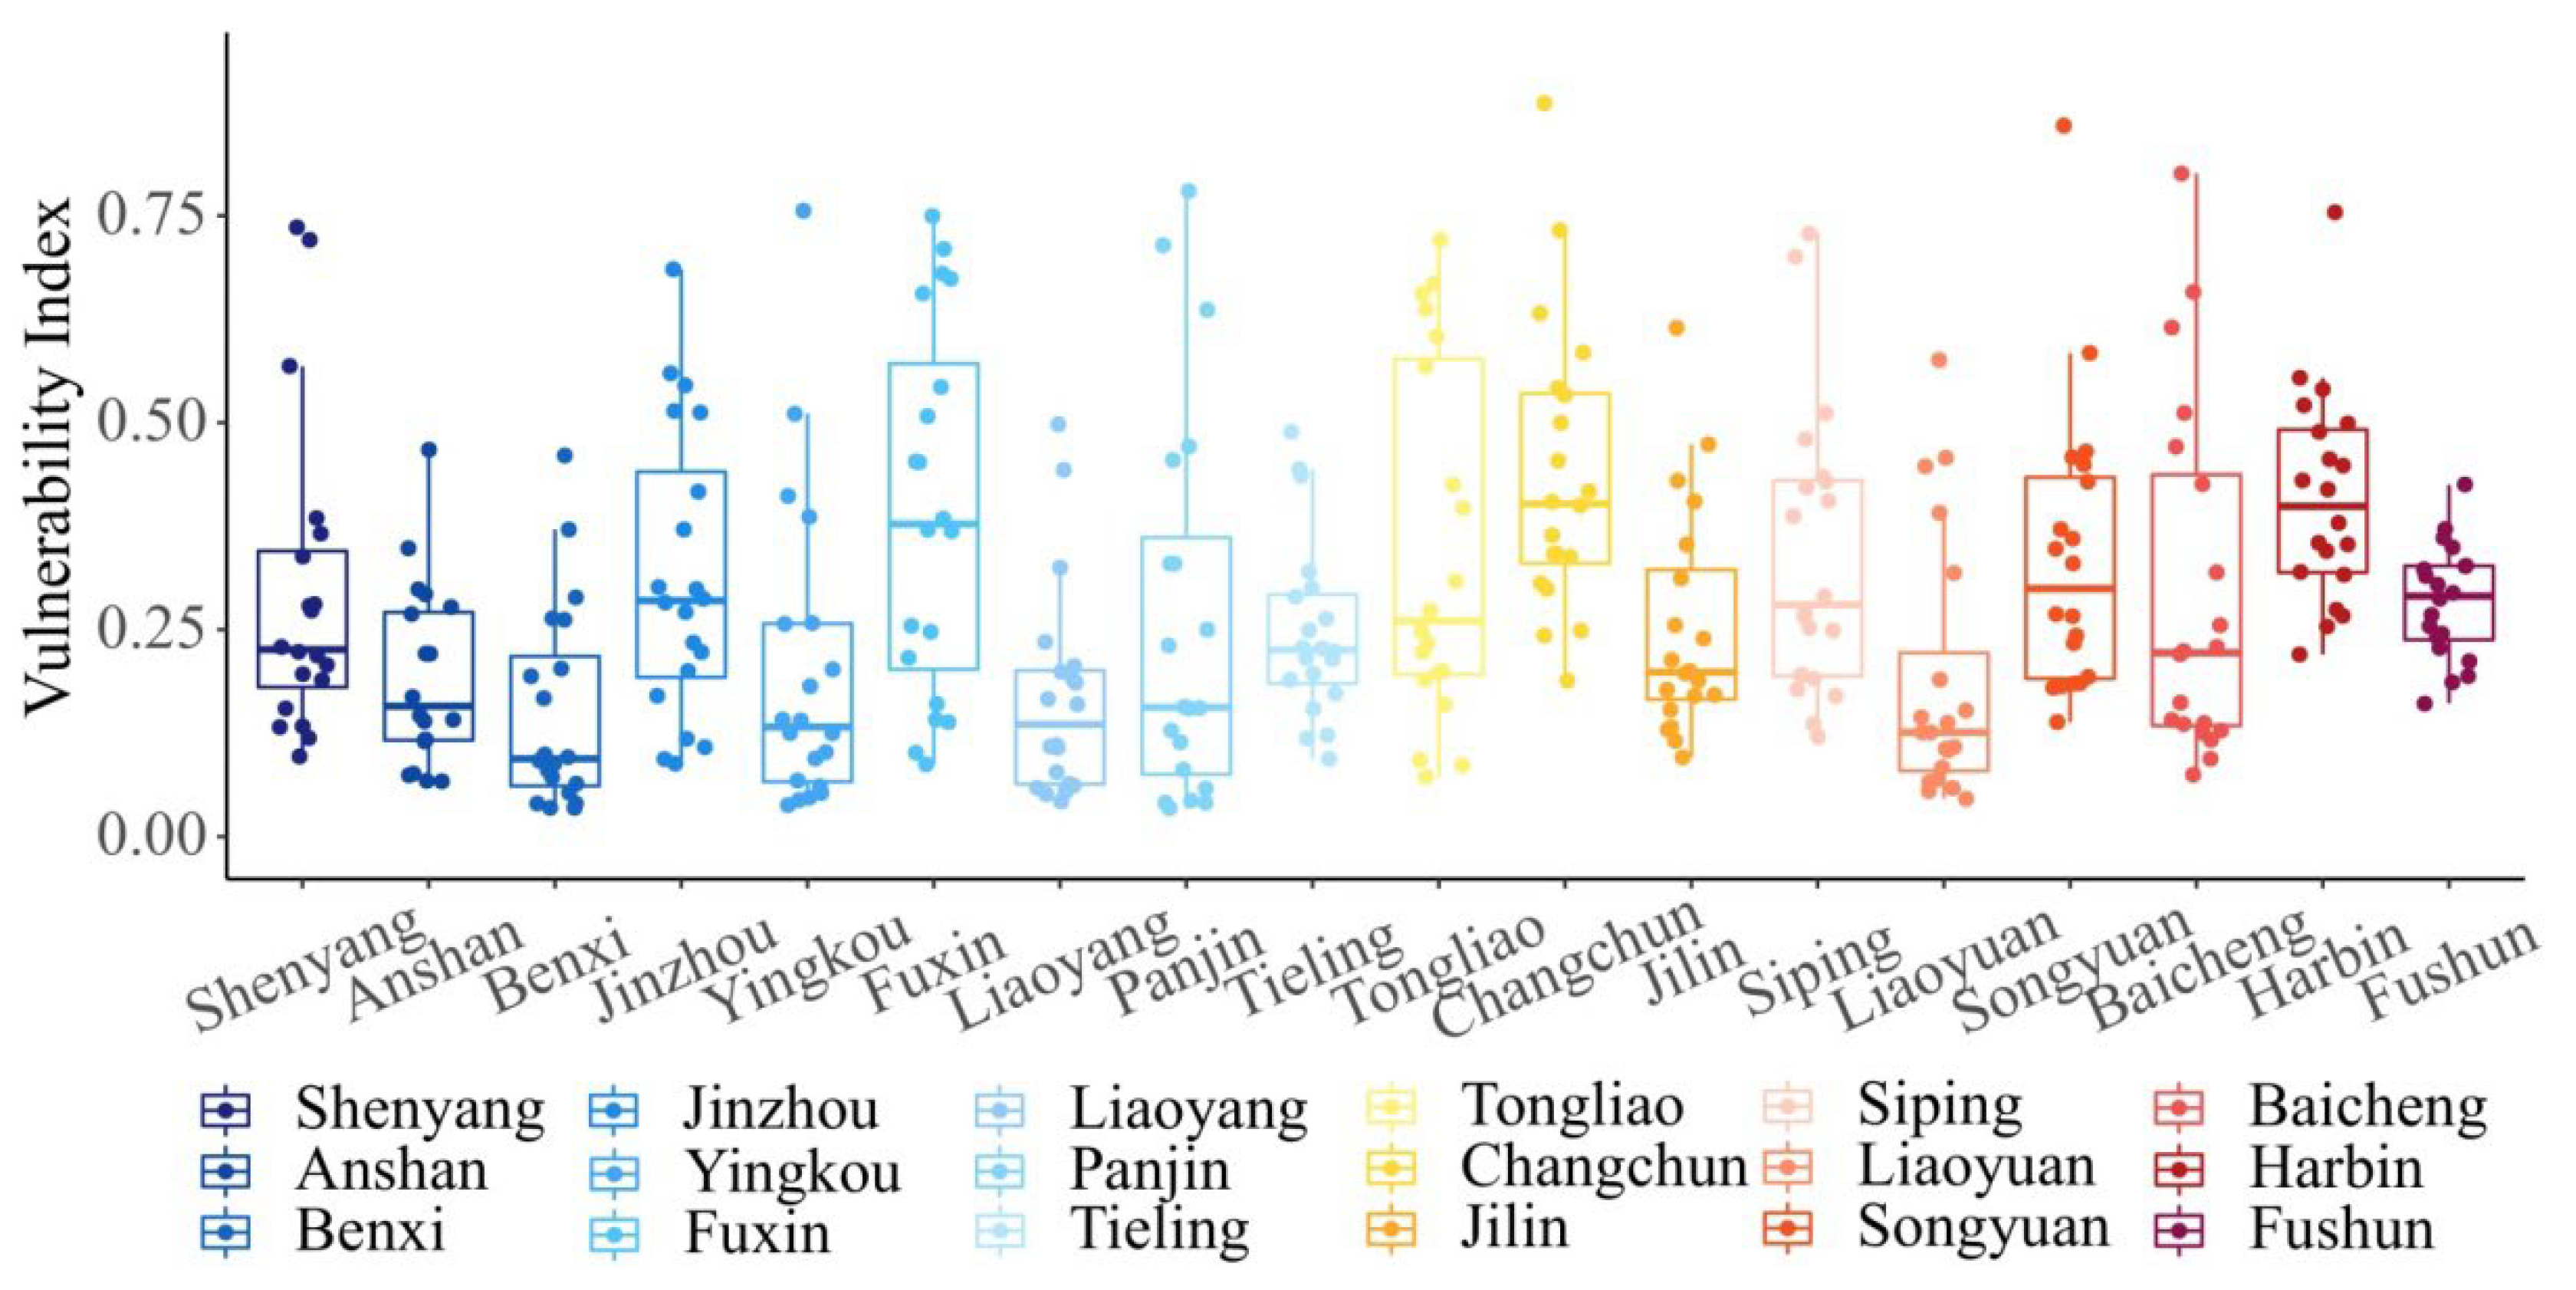
Figure 6 shows the maximum, minimum, median, and probability distribution of the maize drought vulnerability index in cities in the Songliao Plain from 2000 to 2019. The drought vulnerability of Changchun and Harbin was more serious, with average values of 0.457 and 0.429, respectively. The median values were 0.402 and 0.399, respectively. The areas with lower median values were Benxi (0.104), Liaoyuan (0.126), Yingkou (0.132), Liaoyang (0.135), and Panjin (0.156). The regions with low drought vulnerability were mainly concentrated in the southeast of Liaoning Province. The drought vulnerability of Harbin and the central part of Jilin Province was more serious.

Figure 6.
Boxplot of drought vulnerability index of cities in Songliao Plain.
4.2. Validation of Evaluation Results
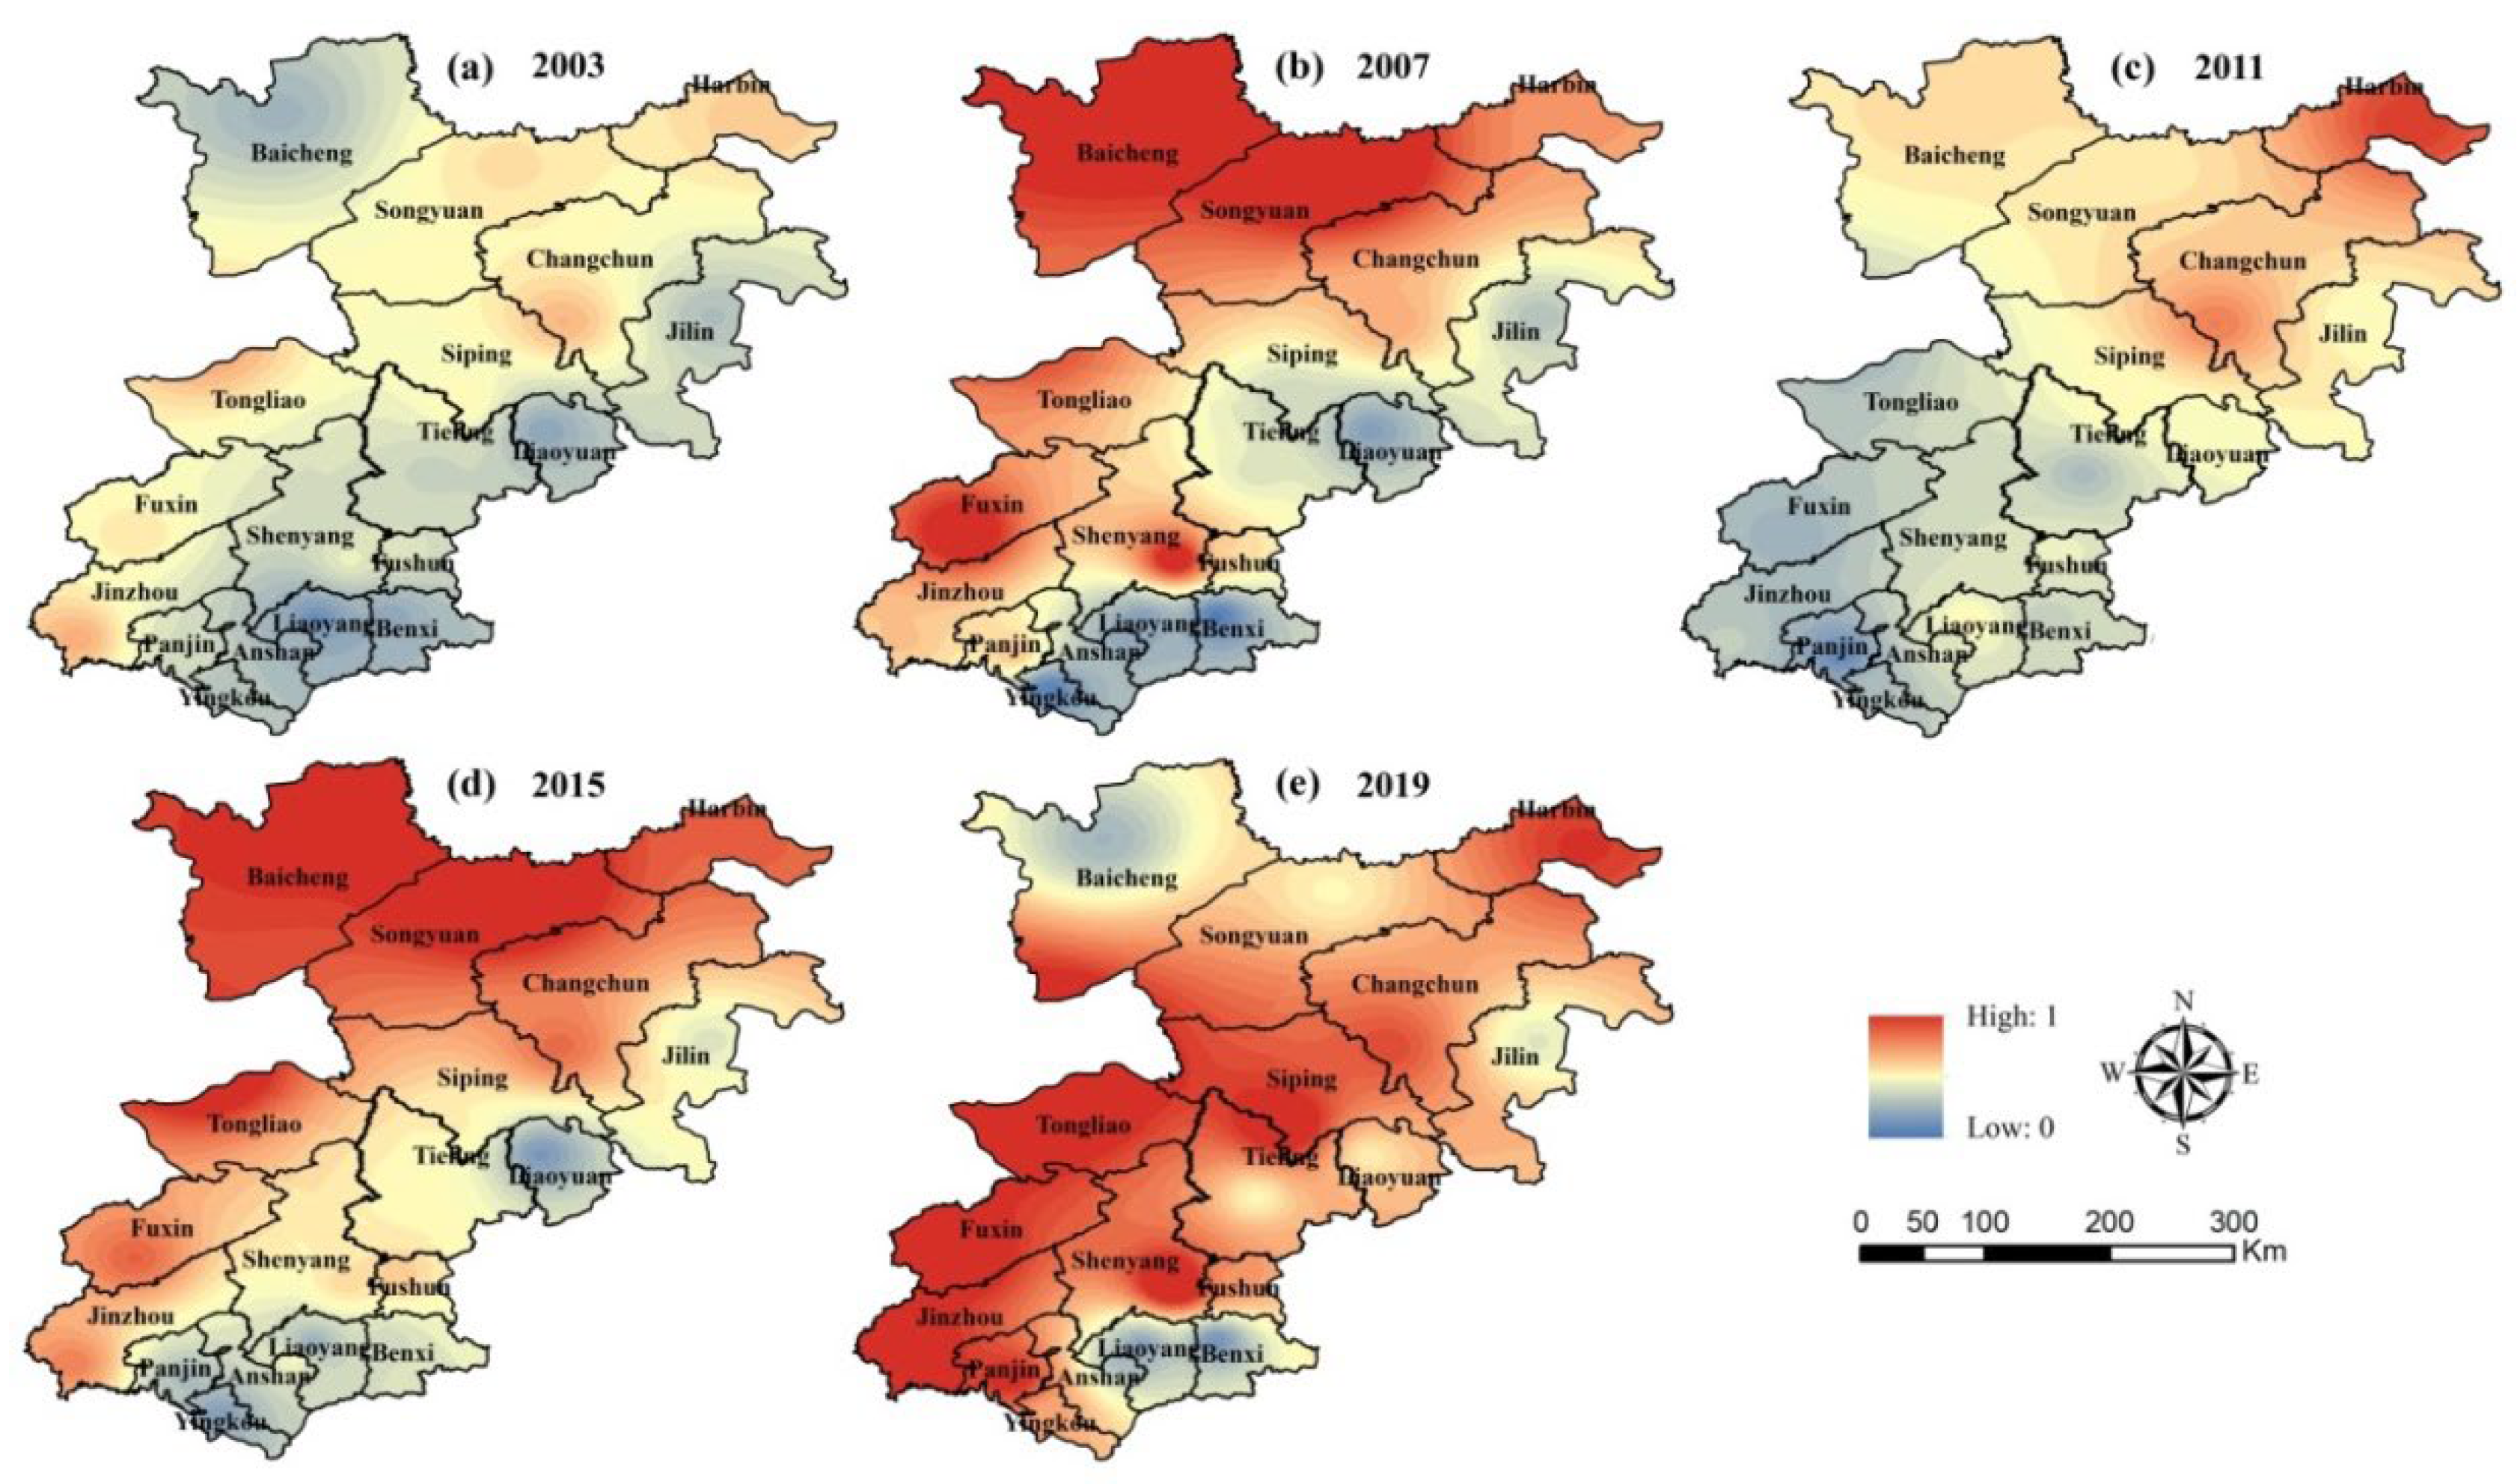
We aimed to verify the applicability of the SE-DEA model in this study. Taking 2003, 2007, 2011, 2015, and 2019 as cases, the spatial distribution of maize drought vulnerability was obtained and compared with historical disaster data (Table 1) to verify the applicability of the evaluation results (Figure 7).

Table 1.
Records of historical drought disasters in the Songliao Plain.

Figure 7.
Spatial distributions of drought vulnerability of maize.
In Figure 7, it can be observed that the spatial distribution of the drought vulnerability in the Songliao Plain increased year by year. In 2003, drought vulnerability was relatively low, only Harbin, Changchun, Tongliao, and southern Jinzhou experienced drought. The situation in 2007 was similar to that in 2015, with high-value areas distributed in midwestern Jilin Province, Harbin, and the western parts of Liaoning Province. In 2011, the drought vulnerability in Harbin and Changchun was high, and the low-value area was located in the southern part of the study area. In 2019, except for the northwest of Baicheng, Liaoyang and Benxi were in low-value areas. At the same time, the rest of the region faced a high drought threat, particularly the western parts of Liaoning Province, including Tongliao, Fuxin, and Jinzhou.
By comparison with Table 1, the spatial distribution of the drought vulnerability obtained in this study is more consistent with historical disaster data, especially in 2007, 2011, and 2019. Therefore, it can be stated that the SE-DEA model selected in this study has good applicability and scientific validity in the evaluation of maize drought vulnerability in the Songliao Plain.
5. Discussion
We aimed to further explore what factors influence maize drought vulnerability in the Songliao Plain and to what extent. We used the Tobit model to analyze each disaster prevention and mitigation indicator for 2019 as an example. We aimed to identify the factors that play a positive role in mitigating drought vulnerability in the study area. Then, a cluster analysis was used to regionalize maize drought vulnerability in 2019.
5.1. Analysis of Influencing Factors of Drought Vulnerability
The total power of agricultural machinery, the proportion of effective irrigated area, the fiscal fund for assisting agriculture, the per capita income of rural households, and the consumption of chemical fertilizer were selected to analyze the factors affecting maize drought vulnerability. The characteristics of the variables are shown in Table 2.
Table 2.
Statistical description and expected impact of indicators of factors influencing maize drought vulnerability.
The Tobit model was used to analyze the influencing factors of maize drought vulnerability in the Songliao Plain. The vulnerability value obtained using the SE-DEA model was taken as the dependent variable to establish a Tobit linear regression model using Eviews 6.0 software (USA, QMS), and the results are shown in Table 3.
Table 3.
Tobit regression analysis results.
Table 3 shows that all the influencing factor variables passed the 5% significance test, except for consumption of chemical fertilizer; this indicates that fertilizer application has a small effect on maize drought vulnerability in the Songliao Plain. The other factors have a strong influence on drought vulnerability. According to Table 3, the regression equation of the Tobit model was obtained as follows:
Y = 0.119 − 0.321 X1 − 0.672 X2 − 0.217 X3 − 0.189 X4
According to the Tobit regression equation, the relative magnitude of maize drought vulnerability in the Songliao Plain can be found by each influencing factor. Through the above equation, the following conclusions were obtained:
- (1)
- The coefficient of the total power of agricultural machinery is negative, and its absolute value is relatively large, which indicates that it is more important to reduce the vulnerability to drought. The better developed the power of the agricultural machinery, the higher the level of agricultural modernization and the stronger the ability to reduce drought vulnerability. Mechanized drought resistance can reduce the ineffective evaporation of soil water and promote the rational utilization of water resources.
- (2)
- The proportion of effective irrigated area to vulnerability has a negative effect, and the coefficient estimation is the largest. The results show that emergency preparedness has the greatest impact on maize drought vulnerability among all the influencing factors. Increasing the irrigated area can greatly reduce regional vulnerability and mitigate the adverse effects of drought, thus reducing yield and economic losses.
- (3)
- The fiscal fund for assisting agriculture has a negative effect on drought vulnerability, and by investing in agricultural support, regional vulnerability can be reduced to a large extent, thus reducing the losses caused by drought disasters. Additionally, it also demonstrates the importance that local governments attach to agriculture. Government decision makers will also be more systematic and complete in the formulation of relevant disaster prevention and mitigation policies.
- (4)
- The per capita income of rural households has a relatively small and negative impact on drought vulnerability. This indicates whether residents have the financial capacity to manage a drought. The more economic investment that can be invested in pre-disaster prevention, response, and post-disaster reconstruction, the lower the vulnerability to drought.
- (5)
- The consumption of chemical fertilizer did not pass the 5% significance test, indicating that it had no significant effect on maize drought vulnerability. However, some studies have shown that the proper application of fertilizers can promote the growth of crops at the early stage of growth and enhance their vitality, thus improving their ability to resist adverse environments [60]. However, an excessive application of fertilizers affects soil quality, damages soil physical and chemical properties, and reduces soil productivity, thereby causing damage to crops, or even death [61,62].
5.2. Recommendations for Drought Risk Management in Maize
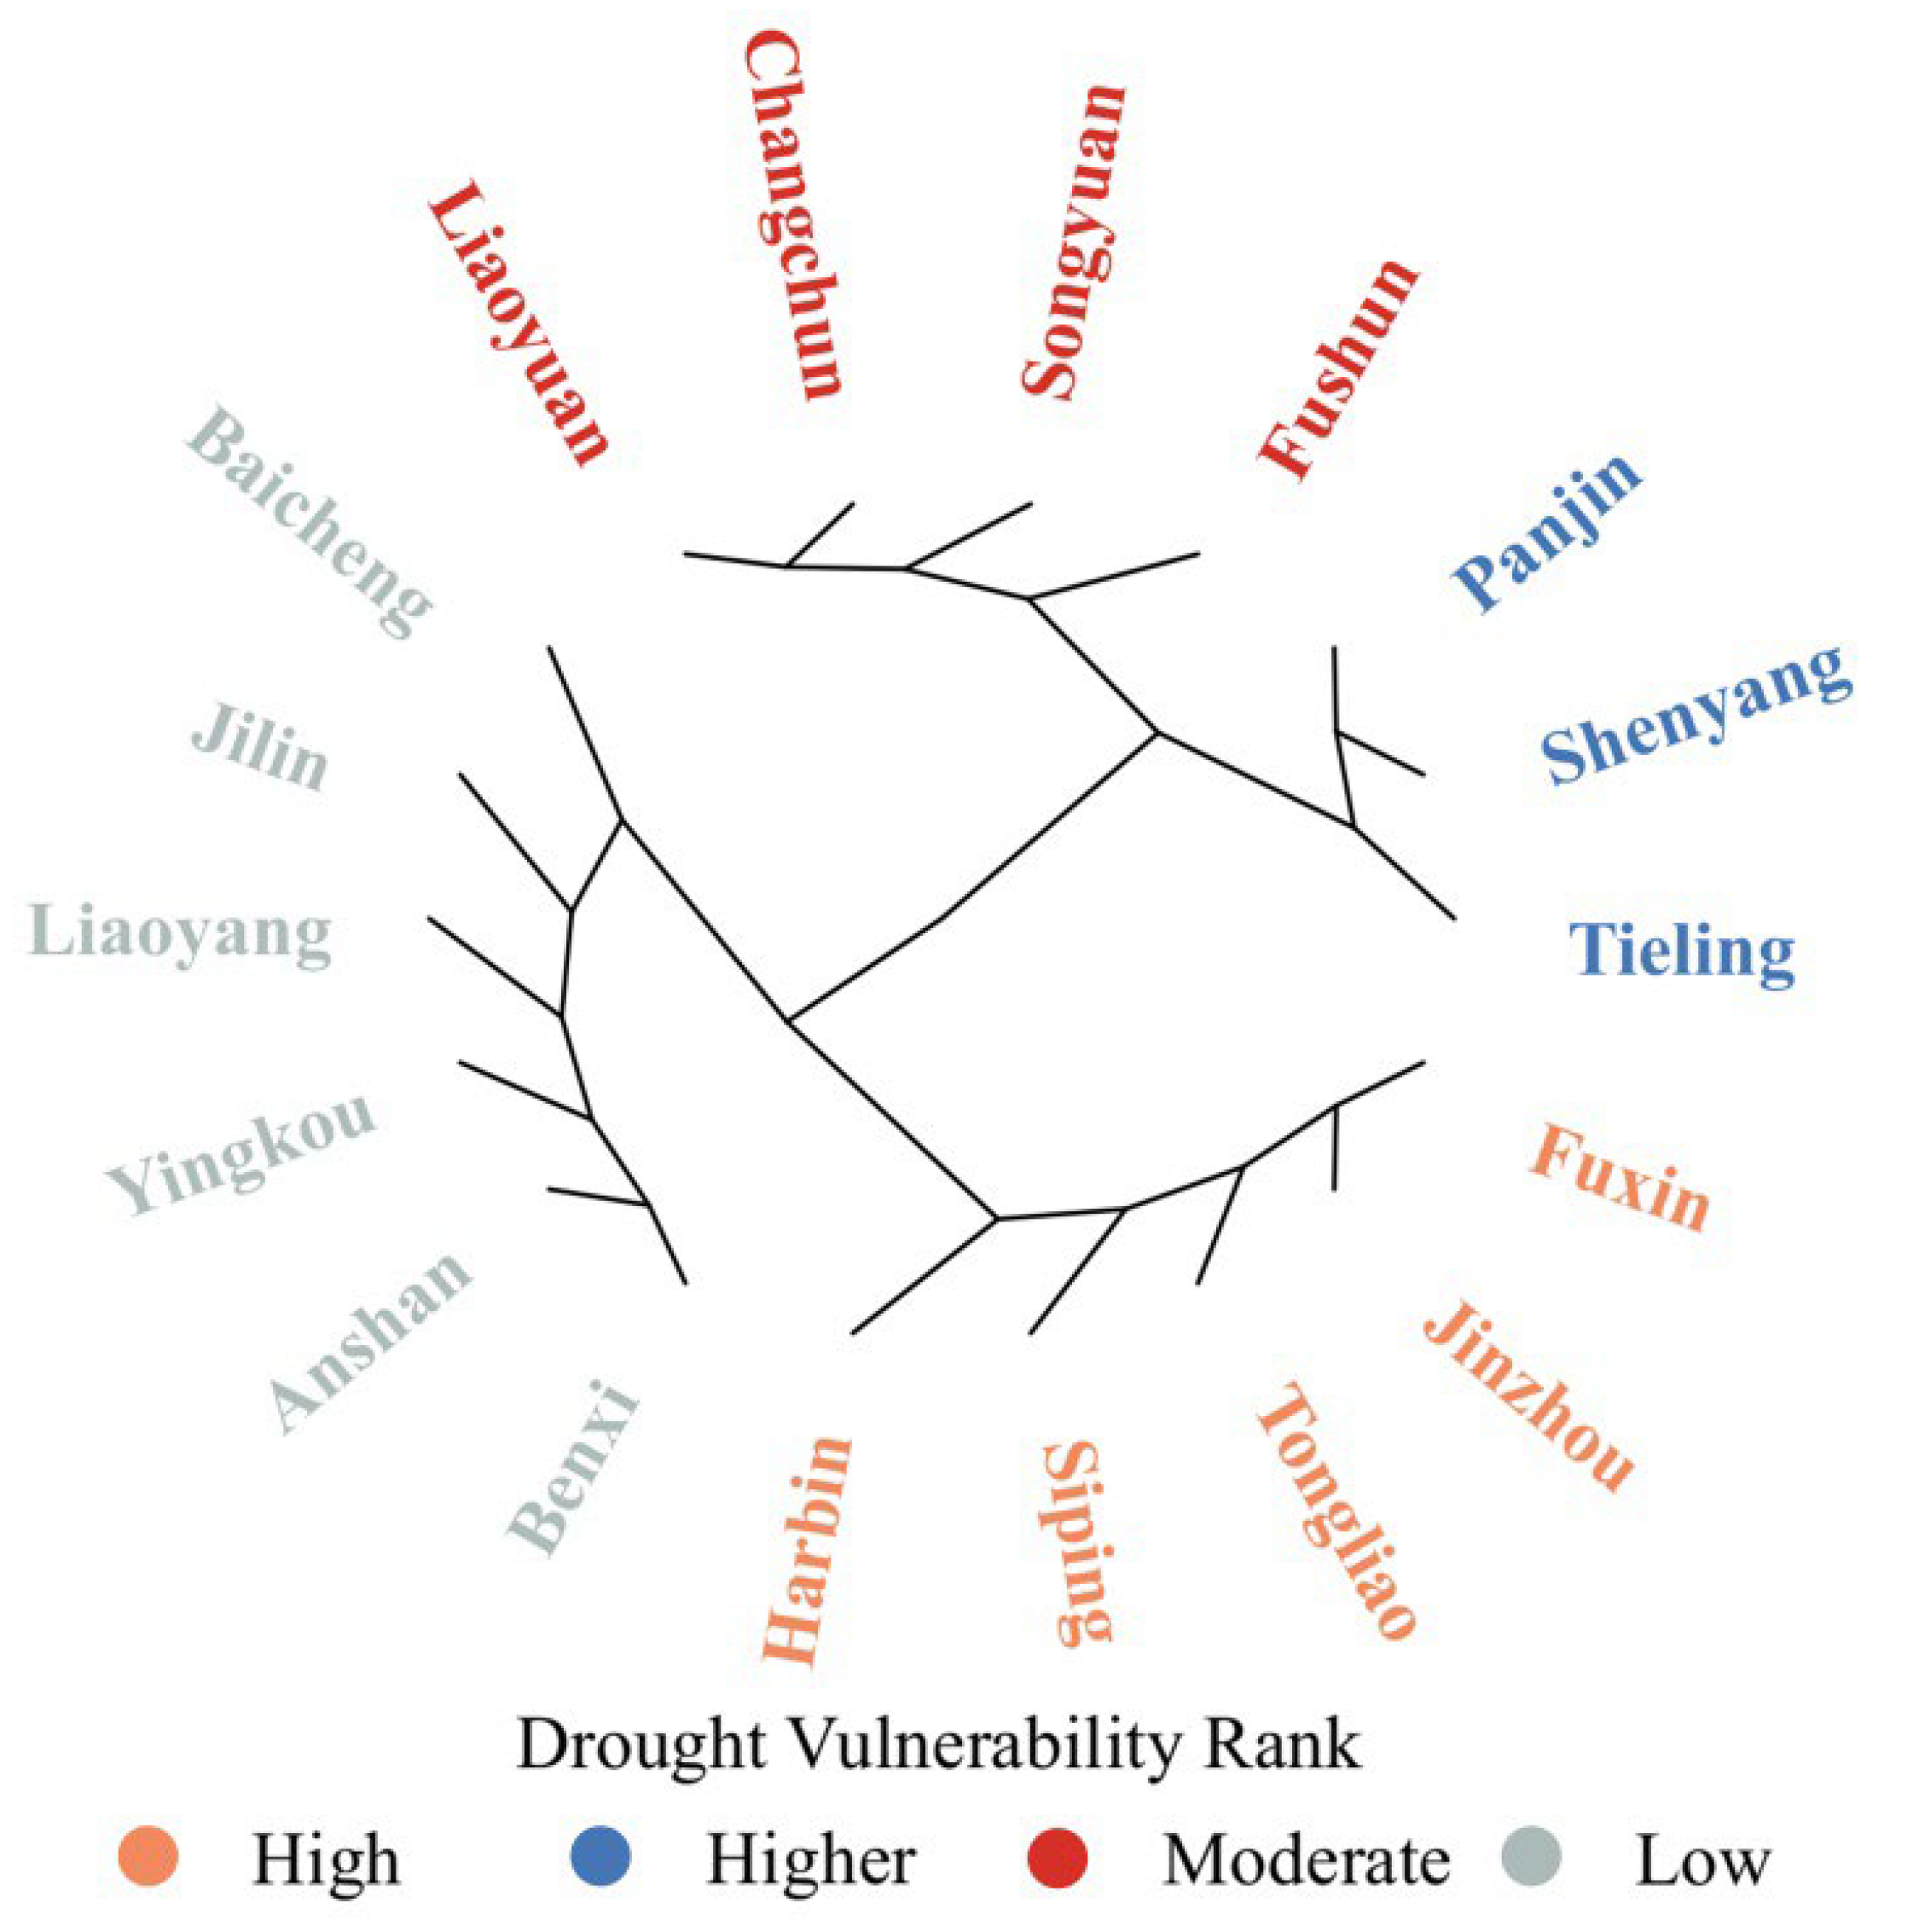
As a widespread natural disaster, drought poses a serious threat to agricultural production. We identified the main factors of the mitigation of maize drought vulnerability in the Songliao Plain using the Tobit model (Figure 8). This was followed by maize drought vulnerability zonation using Ward’s cluster analysis (Figure 9). The aim of using Ward’s cluster analysis (Figure 9) was to provide a reference for regional disaster mitigation.
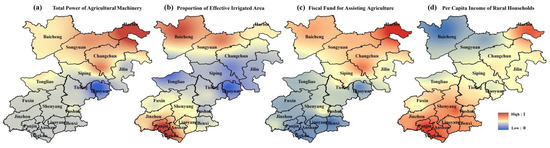
Figure 8.
Spatial distribution of factors influencing drought vulnerability in the Songliao Plain.

Figure 9.
Classification and zoning of maize drought vulnerability in Songliao Plain.
The areas with high drought vulnerability were mainly concentrated in Liaoning Province and the south-central part of Jilin Province (Figure 9). The economic level, irrigation water consumption, and agricultural development in these areas are generally low, especially in Tongliao and Siping (Figure 8). These areas should actively develop irrigated agriculture and reduce the proportion of rain-fed agriculture, thus reducing the dependence of crops on natural precipitation and the disaster sensitivity of agricultural systems. By developing regulated deficit irrigation techniques, increasing the root depth of crops, and making full use of deep soil moisture, water supply for the normal growth and development of crops can be ensured when drought occurs [63,64,65].
For a long time, the agricultural irrigation mode used is mainly full irrigation. While a lot of irrigation water is consumed, irrigation efficiency and economic benefits are often not significantly improved. Therefore, it is undoubtedly a wise choice to implement regulated deficit irrigation in arid areas with low precipitation and high evaporation. Regulated deficit irrigation reduces irrigation water during the non-critical period and concentrates water resources during the critical period of crop water demand [66]. As far as corn is concerned, it has strong drought resistance at the seedling stage [67]. Moderate water deficit treatment at this stage can enhance drought resistance and water use efficiency. However, some studies have pointed out that it is not advisable to regulate deficits too early in the seedling stage; otherwise, water stress will harm the growth of seedling roots. This affects the compensation effect after rehydration, resulting in a decrease in dry matter accumulation. Full irrigation should be carried out at the maize jointing and tasseling stages to ensure dry matter accumulation in later stages [68,69,70,71].
In actual production, a suitable water deficit will improve maize yield and water use efficiency. However, the photosynthetic physiological characteristics of maize are different in each growth stage, and planting area conditions and climatic conditions are also different. There is no definite standard for determining the degree of water deficit, but it should be adapted to local conditions. We suggest to increase the investment of scientific research funds and technical personnel and to determine a suitable deficit irrigation scheme for each region by conducting a large number of experiments. Only by constantly combining the maize regulation deficit irrigation system with modern agricultural technology can it be further systematized and become more efficient and intelligent. Only in this way can we find a way out for maize production in arid areas and provide strong support for the precise control of yield and quality, as well as the promotion of social sustainable development.
6. Conclusions
A vulnerability evaluation can provide scientific reference for disaster prevention and mitigation decisions. In this study, we used the SE-DEA model to assess maize drought vulnerability in the Songliao Plain from 2000 to 2019. The drought vulnerability of the Songliao Plain increased year by year, and the area of high vulnerability increased. It was suggested that regulated deficit irrigation should be adopted, and the investment of disaster prevention funds and human resources should be continuously increased. The evaluation results were validated with historical disaster data, and it was found that the SE-DEA model can provide scientific and reasonable results. We used the Tobit model to explore the factors influencing drought vulnerability. Analyzing the changes in regional vulnerability and the causes of regional differences will be helpful for the implementation of regional disaster prevention and mitigation. In this study, for the output indicators of the SE-DEA model, we only considered the undesirable outputs. Therefore, in future research, output indicators can be selected from two aspects, namely, undesirable outputs and desirable outputs, and, as a result, the accuracy and application value of the research results will be greatly improved.
Author Contributions
Y.M.: conceptualization and writing—original draft. S.G.: investigation and data curation. X.L.: conceptualization, methodology, and resources. Z.T.: writing—review and editing. J.X.: conceptualization. J.Z.: conceptualization and writing—review and editing. All authors have read and agreed to the published version of the manuscript.
Funding
This study was supported by National Key R&D Program of China (2019YFD1002201), the National Natural Science Foundation of China (U21A2040), the National Natural Science Foundation of China (41877520), the National Natural Science Foundation of China (42077443), Industrial technology research and development Project of Development and Reform Commission of Jilin Province (2021C044-5), the Key Scientific and Technology Research and Development Program of Jilin Province (20200403065SF), and the Construction Project of Science and Technology Innovation Center (20210502008ZP).
Conflicts of Interest
The authors declare no conflict of interest.
References
- IPCC. Climate Change 2007: The Physical Science Basis. Summary for Policy Makers; IPCC WGI Fourth Report; IPCC: Paris, France, 2007; pp. 195–199. [Google Scholar]
- Ji, F.; Wu, Z.; Huang, J.; Chassignet, E. Evolution of land surface air temperature trend. Nat. Clim. Change 2014, 6, 462–466. [Google Scholar] [CrossRef]
- Paparrizos, S.; Matzarakis, A. Assessment of future climate change impacts on the hydrological regime of selected Greek areas with different climate conditions. Hydrol. Res. 2017, 48, 1327–1342. [Google Scholar] [CrossRef]
- Gao, X.; Shi, Y.; Giorgi, F. A high resolution simulation of climate change over China. Sci. China Earth Sci. 2011, 54, 462–472. [Google Scholar] [CrossRef]
- Bodner, G.; Nakhforoosh, A.; Kaul, H.P. Management of crop water under drought: A review. Agron. Sustain. Dev. 2015, 35, 401–442. [Google Scholar] [CrossRef]
- Wang, Y.; Zhou, B.; Qin, D.; Wu, J.; Gao, R.; Song, L. Changes in mean and extreme temperature and precipitation over the arid region of northwestern China: Observation and projection. Adv. Atmos. Sci. 2017, 34, 289–305. [Google Scholar] [CrossRef]
- Han, L.; Zhang, Q.; Zhang, Z.; Jia, J.; Wang, Y.; Huang, T.; Cheng, Y. Drought area, intensity and frequency changes in China under climate warming, 1961–2014. J. Arid Environ. 2021, 193, 104596. [Google Scholar] [CrossRef]
- Deng, S.; Liu, S.; Mo, X. Assessment and attribution of China’s droughts using an integrated drought index derived from GRACE and GRACE-FO data. J. Hydrol. 2021, 603, 127170. [Google Scholar] [CrossRef]
- Wang, F.; Lai, H.; Li, Y.; Feng, K.; Zhang, Z.; Tian, Q.; Zhu, X.; Yang, H. Dynamic variation of meteorological drought and its relationships with agricultural drought across China. Agric. Water Manag. 2022, 261, 107301. [Google Scholar] [CrossRef]
- Wang, Z.; Xi, L.; Li, Y.; Dong, A. Characteristics of droughts in eastern Northwest China over the past 546 years. Acta. Meteorol. Sin. 2020, 78, 72–85. [Google Scholar]
- Wan, W.; Liu, Z.; Li, J.; Xu, J.; Wu, H.; Xu, Z. Spatiotemporal patterns of maize drought stress and their effects on biomass in the Northeast and North China Plain from 2000 to 2019. Agric. For. Meteorol. 2022, 315, 108821. [Google Scholar] [CrossRef]
- Zhang, Y.; Hao, Z.; Feng, S.; Zhang, X.; Hao, F. Changes and driving factors of compound agricultural droughts and hot events in eastern China. Agric. Water Manag. 2022, 263, 107485. [Google Scholar] [CrossRef]
- Qin, Z.; Tang, H.; Li, W.; Zhang, H.; Zhao, S.; Wang, Q. Modelling impact of agro-drought on grain production in China. Int. J. Disaster Risk Reduct. 2014, 7, 109–121. [Google Scholar] [CrossRef]
- Guo, E.; Liu, X.; Zhang, J.; Wang, Y.; Wang, C.; Wang, R.; Li, D. Assessing spatiotemporal variation of drought and its impact on maize yield in Northeast China. J. Hydrol. 2017, 553, 231–247. [Google Scholar] [CrossRef]
- Piao, S.; Ciais, P.; Huang, Y.; Shen, Z.; Peng, S.; Li, J.; Zhou, L.; Liu, H.; Ma, Y.; Ding, Y.; et al. The impacts of climate change on water resources and agriculture in China. Nature 2010, 467, 43–51. [Google Scholar] [CrossRef]
- IPCC. Climate Change 2013: The Physical Science Basis. Working Group I Contribution to the Fifth Assessment Report of the Intergovernmental Panel on Climate Change; Cambridge University Press: Cambridge, UK, 2013. [Google Scholar]
- Ishtiaque, A.; Estoque, R.C.; Eakin, H.; Parajuli, J.; Rabby, Y.W. IPCC’s current conceptualization of ‘vulnerability’ needs more clarification for climate change vulnerability assessments. J. Environ. Manag. 2022, 303, 114246. [Google Scholar] [CrossRef]
- Ye, T.; Shi, P.; Wang, J.; Liu, L.; Fan, Y.; Hu, J. China’s drought disaster risk management: Perspective of severe droughts in 2009–2010. Int. J. Disaster Risk Sci. 2012, 3, 84–97. [Google Scholar] [CrossRef] [Green Version]
- Chen, W.; Zhang, L. Building vulnerability assessment in seismic areas using ensemble learning: A Nepal case study. J. Clean. Prod. 2022, 350, 131418. [Google Scholar] [CrossRef]
- Van, C.T.; Tuan, N.C.; Son, N.T.; Tri, D.Q.; Anh, L.N.; Tran, D.D. Flood vulnerability assessment and mapping: A case of Ben Hai-Thach Han River basin in Vietnam. Int. J. Disaster Risk. Reduct. 2022, 75, 102969. [Google Scholar] [CrossRef]
- Oikonomou, P.D.; Tsesmelis, D.E.; Waskom, R.M.; Grigg, N.S.; Karavitis, C.A. Enhancing the standardized drought vulnerability index by integrating spatiotemporal information from satellite and in situ data. J. Hydrol. 2019, 569, 265–277. [Google Scholar] [CrossRef]
- Li, Y.; Huang, H.; Ju, H.; Lin, E.; Xiong, W.; Han, X.; Wang, H.; Peng, Z.; Wang, Y.; Xu, J.; et al. Assessing vulnerability and adaptive capacity to potential drought for winter-wheat under the RCP 8.5 scenario in the Huang-Huai-Hai Plain. Agric. Ecosyst. Environ. 2015, 209, 125–131. [Google Scholar] [CrossRef]
- Guo, H.; Wang, R.; Garfin, G.M.; Zhang, A.; Lin, D.; Liang, Q.; Wang, J. Rice drought risk assessment under climate change: Based on physical vulnerability a quantitative assessment method. Sci. Total Environ. 2021, 751, 141481. [Google Scholar] [CrossRef]
- Zhu, X.; Xu, K.; Liu, Y.; Guo, R.; Chen, L. Assessing the vulnerability and risk of maize to drought in China based on the AquaCrop model. Agric. Syst. 2021, 189, 103040. [Google Scholar] [CrossRef]
- Farhangfar, S.; Bannayan, M.; Khazaei, H.R.; Baygi, M.M. Vulnerability assessment of wheat and maize production affected by drought and climate change. Int. J. Disaster Risk Reduct. 2015, 13, 37–51. [Google Scholar] [CrossRef]
- Yildirim, E.; Demir, I. Agricultural flood vulnerability assessment and risk quantification in Iowa. Sci. Total Environ. 2022, 826, 154165. [Google Scholar] [CrossRef]
- Hoque, M.A.; Pradhan, B.; Ahmed, N. Assessing drought vulnerability using geospatial techniques in northwestern part of Bangladesh. Sci. Total Environ. 2020, 705, 135957. [Google Scholar] [CrossRef]
- Ekrami, M.; Marj, A.F.; Barkhordari, J.; Dashtakian, K. Drought vulnerability mapping using AHP method in arid and semiarid areas: A case study for Taft Township, Yazd Province, Iran. Environ. Earth Sci. 2016, 75, 1039. [Google Scholar] [CrossRef]
- Wu, H.; Qian, H.; Chen, J.; Huo, C. Assessment of Agricultural Drought Vulnerability in the Guanzhong Plain, China. Water Resour. Manag. 2017, 31, 1557–1574. [Google Scholar] [CrossRef]
- Hou, J.; Lv, J.; Chen, X.; Yu, S. China’s regional social vulnerability to geological disasters: Evaluation and spatial characteristics analysis. Nat. Hazards 2016, 84, 97–111. [Google Scholar] [CrossRef]
- Fisher, R.A. The statistical utilization of multiple measurements. Ann. Eugen. 1938, 8, 376–386. [Google Scholar] [CrossRef]
- Charnes, A.; Cooper, W.W.; Rhodes, E. Measuring the efficiency of decision making units. Eur. J. Oper. Res. 1978, 2, 429–444. [Google Scholar] [CrossRef]
- Miao, C.; Duan, M.; Sun, X.; Wu, X. Safety management efficiency of China’s coal enterprises and its influencing factors—Based on the DEA-Tobit two-stage model. Process Saf. Environ. 2020, 140, 79–85. [Google Scholar] [CrossRef]
- Dalei, N.N.; Joshi, J.M. Estimating technical efficiency of petroleum refineries using DEA and tobit model: An India perspective. Comput. Chem. Eng. 2020, 142, 107047. [Google Scholar] [CrossRef]
- Huang, X.; Jin, H.; Bai, H. Vulnerability assessment of China’s coastal cities based on DEA cross-efficiency model. Int. J. Disaster Risk Reduct. 2019, 36, 101091. [Google Scholar] [CrossRef]
- Yang, Y.; Guo, H.; Wang, D.; Ke, X.; Li, S.; Huang, S. Flood vulnerability and resilience assessment in China based on super-efficiency DEA and SBM-DEA methods. J. Hydrol. 2021, 600, 126470. [Google Scholar] [CrossRef]
- Yao, L.; Shuai, Y.; Chen, X. Regional water system vulnerability evaluation: A bi-level DEA with multi-followers approach. J. Hydrol. 2020, 589, 125160. [Google Scholar] [CrossRef]
- Wei, Y.; Fan, Y.; Lu, C.; Tsai, H.T. The assessment of vulnerability to natural disasters in China by using the DEA method. Environ. Impact Assess. 2004, 24, 427–439. [Google Scholar] [CrossRef]
- Sahana, V.; Mondal, A.; Sreekumar, P. Drought vulnerability and risk assessment in India: Sensitivity analysis and comparison of aggregation techniques. J. Environ. Manag. 2021, 299, 113689. [Google Scholar] [CrossRef]
- Huang, D.; Zhang, R.; Huo, Z.; Mao, F.; Zheng, Y. An assessment of multidimensional flood vulnerability at the provincial scale in China based on the DEA method. Nat. Hazards 2012, 64, 1575–1586. [Google Scholar] [CrossRef]
- Villano, R.A.; Magcale-Macandog, D.B.; Acosta, L.A.; Tran, C.D.T.T.; Eugenio, E.A.; Macandog, P.B.M. Measuring disaster resilience in the Philippines: Evidence using network data envelopment analysis. Clim. Dev. 2020, 12, 67–79. [Google Scholar] [CrossRef]
- Li, C.; Li, N.; Wu, L.; Hu, A. A relative vulnerability estimation of flood disaster using data envelopment analysis in the Dongting Lake region of Hunan. Nat. Hazards Earth. Syst. 2013, 13, 1723–1734. [Google Scholar] [CrossRef]
- Zhou, W. A Study on Available Water Capacity of Main Soil Types in China Based on Geographic Information System; Nanjing Agricultural University: Nanjing, China, 2003. (In Chinese) [Google Scholar]
- Zhou, W. Empirical estimation of effective soil water content in black soils of Northeast China. J. Arid. Land Resour. Environ. 2003, 4, 88–95. (In Chinese) [Google Scholar]
- Xue, M.; Harker, P.T. Note: Ranking DMUs with infeasible super-efficiency DEA methods. Manag. Sci. 2002, 48, 705–707. [Google Scholar] [CrossRef] [Green Version]
- Banker, R.D.; Charnes, A.; Cooper, W.W. Models for the estimation of technical and scale inefficiencies in DEA. Manag. Sci. 1984, 30, 1078–1092. [Google Scholar] [CrossRef] [Green Version]
- Su, S.; Zhang, F. Modeling the role of environmental regulations in regional green economy efficiency of China: Empirical evidence from super efficiency DEA-Tobit model. J. Environ. Manag. 2020, 261, 110227. [Google Scholar] [CrossRef]
- Tobin, J. Estimation of Relationships for Limited Dependent Variables. Econometrica 1958, 26, 24–36. [Google Scholar] [CrossRef] [Green Version]
- Albertini, F.; Gomes, L.P.; Grondona, A.E.B.; Caetano, M.O. Assessment of environmental performance in building construction sites: Data envelopment analysis and Tobit model approach. J. Build. Eng. 2021, 44, 102994. [Google Scholar] [CrossRef]
- Ma, Y.; Zhang, J.; Zhao, C.; Li, K.; Dong, S.; Liu, X.; Tong, Z. Spatiotemporal Variation of Water Supply and Demand Balance under Drought Risk and Its Relationship with Maize Yield: A Case Study in Midwestern Jilin Province, China. Water 2021, 13, 2490. [Google Scholar] [CrossRef]
- Gao, C.; Chen, C.; He, Y.; Ruan, T.; Luo, G.; Sun, Y. Response of Agricultural Drought to Meteorological Drought: A Case Study of the Winter Wheat above the Bengbu Sluice in the Huaihe River Basin, China. Water 2020, 12, 2805. [Google Scholar] [CrossRef]
- Tian, Q.; Lu, J.; Chen, X. A novel comprehensive agricultural drought index reflecting time lag of soil moisture to meteorology: A case study in the Yangtze River basin, China. Catena 2022, 209, 105804. [Google Scholar] [CrossRef]
- Ma, Y.; Guga, S.; Xu, J.; Liu, X.; Tong, Z.; Zhang, J. Assessment of Maize Drought Risk in Midwestern Jilin Province: A Comparative Analysis of TOPSIS and VIKOR Models. Remote Sens. 2022, 14, 2399. [Google Scholar] [CrossRef]
- Allen, R.G.; Pereira, L.S.; Raes, D.; Smith, M. Crop Evapotranspiration: Guidelines for Computing Crop Water Requirements; FAO: Rome, Italy, 1998. [Google Scholar]
- Chu, R.; Li, M.; Shen, S.; Islam, A.R.M.T.; Cao, W.; Tao, S.; Gao, P. Changes in reference evapotranspiration and its contributing factors in Jiangsu, a major economic and agricultural province of eastern China. Water 2017, 9, 486. [Google Scholar] [CrossRef] [Green Version]
- Jhajharia, D.; Dinpashoh, Y.; Kahya, E.; Singh, V.P.; Fard, A.F. Trends in reference evapotranspiration in the humid region of northeast India. J. Hydrol. 2012, 26, 421–435. [Google Scholar] [CrossRef]
- Zhang, Y.; Wang, Y.; Niu, H. Effects of temperature, precipitation and carbon dioxide concentrations on the requirements for crop irrigation water in China under future climate scenarios. Sci. Total Environ. 2019, 656, 373–387. [Google Scholar] [CrossRef]
- Ma, Y.; Guga, S.; Xu, J.; Zhang, J.; Tong, Z.; Liu, X. Comprehensive Risk Assessment of High Temperature Disaster to Kiwifruit in Shaanxi Province, China. Int. J. Environ. Res. Public Health 2021, 18, 10437. [Google Scholar] [CrossRef]
- Ward, J.H., Jr. Hierarchical grouping to optimize an objective function. J. Am. Stat. Assoc. 1963, 58, 236–244. [Google Scholar] [CrossRef]
- Tilman, D.; Balzer, C.; Hill, J.; Befort, B.L. Global food demand and the sustainable intensification of agriculture. Proc. Natl. Acad. Sci. USA 2011, 108, 20260–20264. [Google Scholar] [CrossRef] [Green Version]
- Choruma, D.J.; Balkovic, J.; Pietsch, S.A.; Odume, O.N. Using EPIC to simulate the effects of different irrigation and fertilizer levels on maize yield in the Eastern Cape, South Africa. Agric. Water Manag. 2021, 254, 106974. [Google Scholar] [CrossRef]
- Grinsven, H.J.M.V.; Holland, M.; Jacobsen, B.H.; Klimont, Z.; Sutton, M.A.; Willems, W.J. Costs and benefits of nitrogen for Europe and implications for mitigation. Environ. Sci. Technol. 2013, 47, 3571–3579. [Google Scholar] [CrossRef] [PubMed]
- Domínguez, A.; Juan, J.A.; Tarjuelo, J.M.; Martínez, R.S.; Martínez-Romero, A. Determination of optimal regulated deficit irrigation strategies for maize in a semi-arid environment. Agric. Water Manag. 2012, 110, 67–77. [Google Scholar] [CrossRef]
- Zou, Y.; Saddique, Q.; Ali, A.; Xu, J.; Khan, M.I.; Qing, M.; Azmat, M.; Cai, H.; Siddique, K.H.M. Deficit irrigation improves maize yield and water use efficiency in a semi-arid environment. Agric. Water Manag. 2021, 243, 106483. [Google Scholar] [CrossRef]
- Kang, S.; Shi, W.; Zhang, J. An improved water-use efficiency for maize grown under regulated deficit irrigation. Field Crops Res. 2000, 67, 207–214. [Google Scholar] [CrossRef]
- Fereres, E.; Soriano, M.A. Deficit irrigation for reducing agricultural water use. J. Exp. Bot. 2007, 58, 147–159. [Google Scholar] [CrossRef] [Green Version]
- Zhang, F.; Chen, Y.; Zhang, J.; Guo, E.; Wang, R.; Li, D. Dynamic drought risk assessment for maize based on crop simulation model and multi-source drought indices. J. Clean. Prod. 2019, 233, 100–114. [Google Scholar] [CrossRef]
- Bolanos, J.; Edmeades, G. The importance of the anthesis-silking interval in breeding for drought tolerance in tropical maize. Field Crops Res. 1996, 48, 65–80. [Google Scholar] [CrossRef]
- NeSmith, D.; Ritchie, J. Effects of soil water-deficits during tassel emergence on development and yield component of maize (Zea mays). Field Crop. Res. 1992, 28, 251–256. [Google Scholar] [CrossRef]
- Saini, H.S.; Westgate, M.E. Reproductive development in grain crops during drought. Adv. Agron. 2000, 68, 59–96. [Google Scholar] [CrossRef]
- Çakir, R. Effect of water stress at different development stages on vegetative and reproductive growth of corn. Field Crops Res. 2004, 89, 1–16. [Google Scholar] [CrossRef]


Publisher’s Note: MDPI stays neutral with regard to jurisdictional claims in published maps and institutional affiliations. |
© 2022 by the authors. Licensee MDPI, Basel, Switzerland. This article is an open access article distributed under the terms and conditions of the Creative Commons Attribution (CC BY) license (https://creativecommons.org/licenses/by/4.0/).