
Rapid and Automated Mapping of Crop Type in Jilin Province Using Historical Crop Labels and the Google Earth Engine


Abstract
:
1. Introduction
2. Materials and Methods
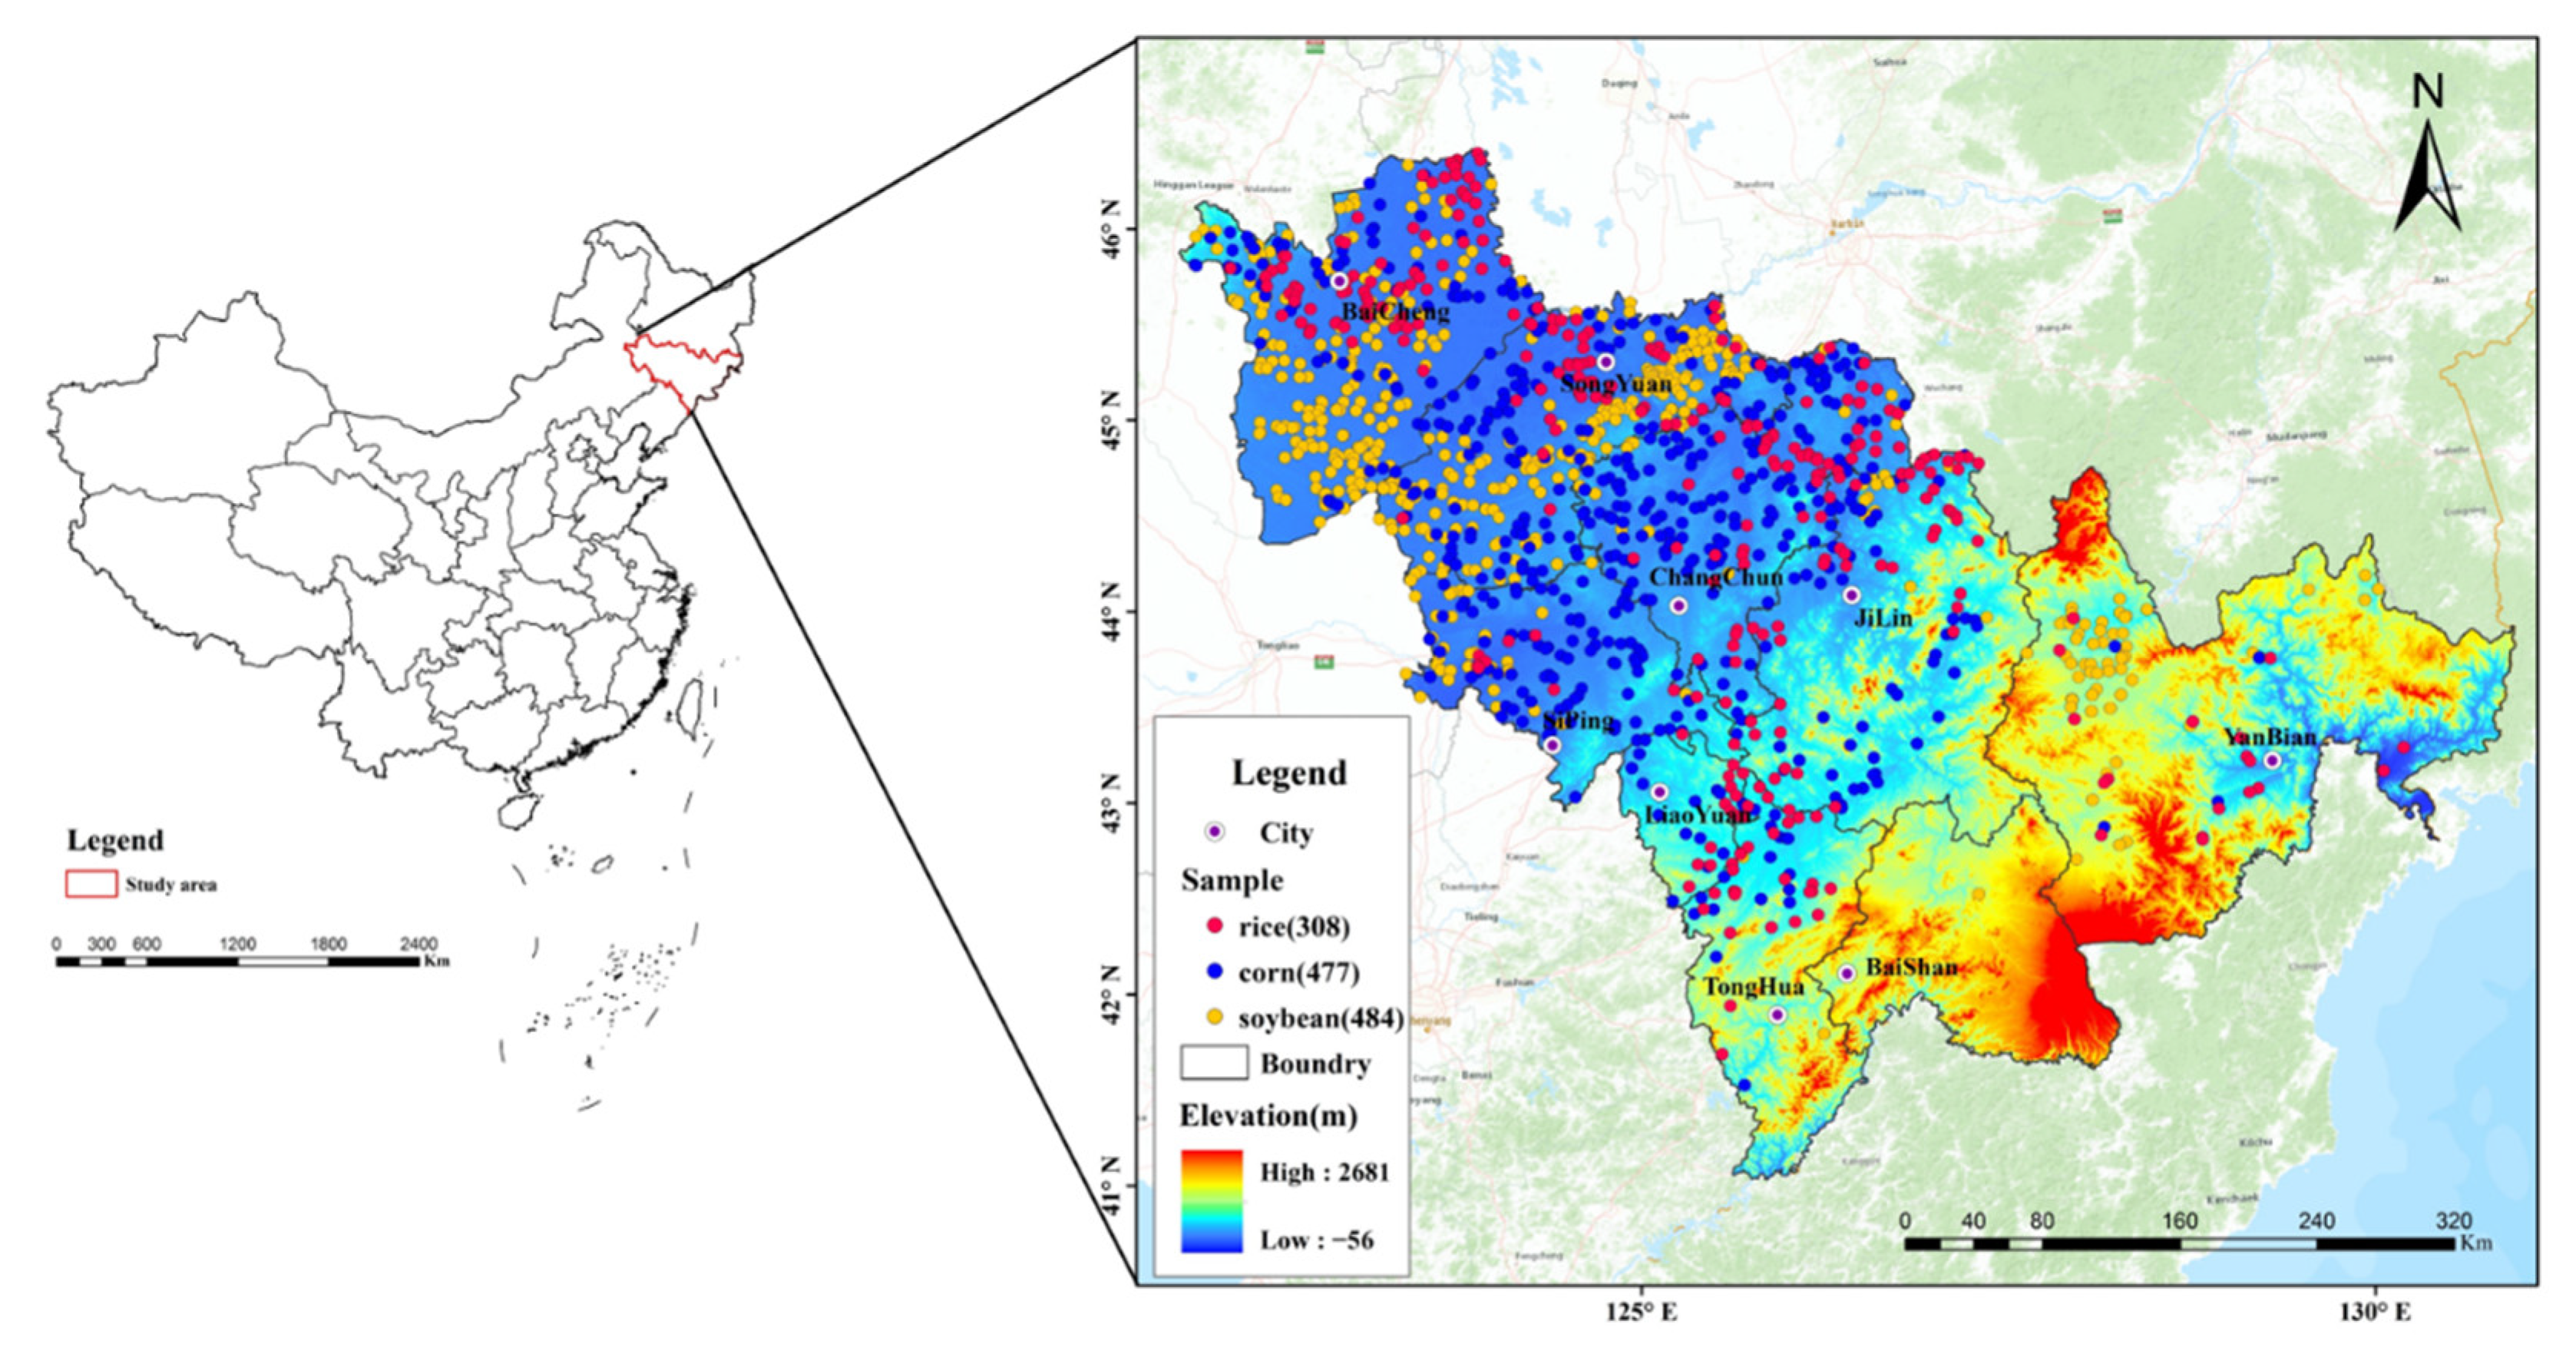
2.1. Study Area
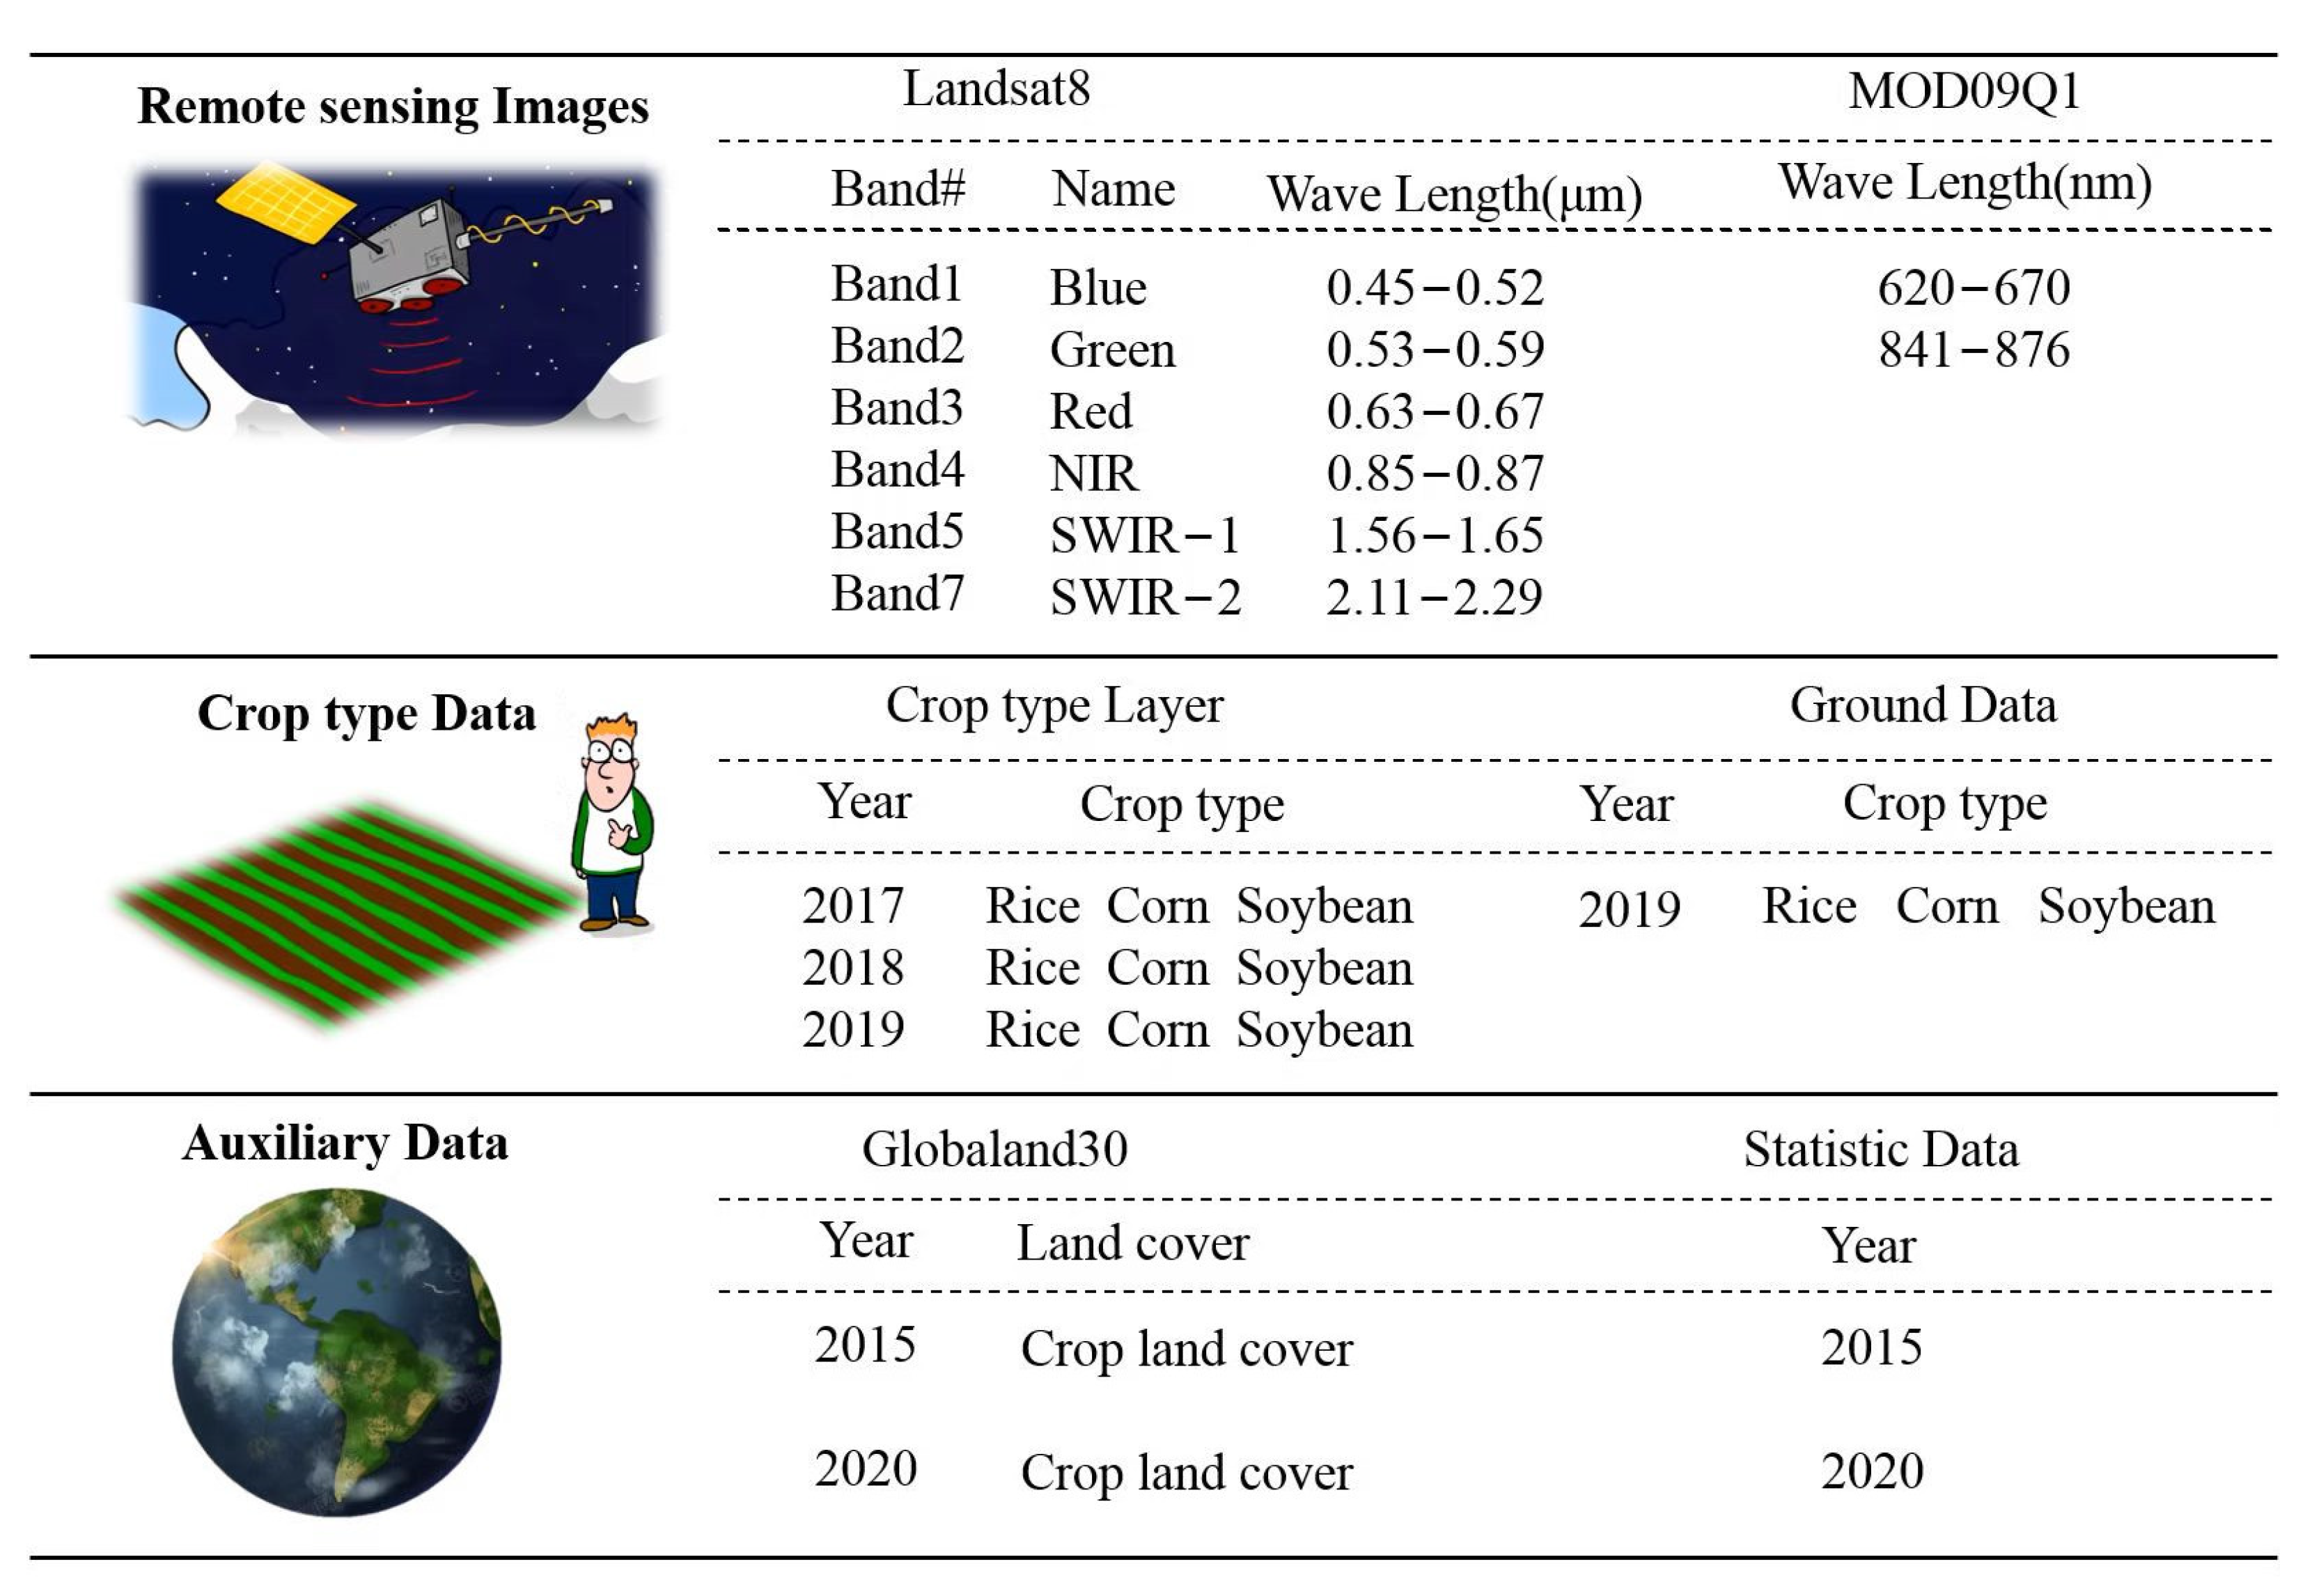
2.2. Data Sources
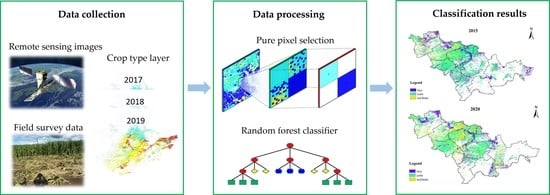
2.2.1. Remote Sensing Data in GEE
2.2.2. Cropland Data Layer
2.2.3. Validation Data
2.2.4. Auxiliary Data
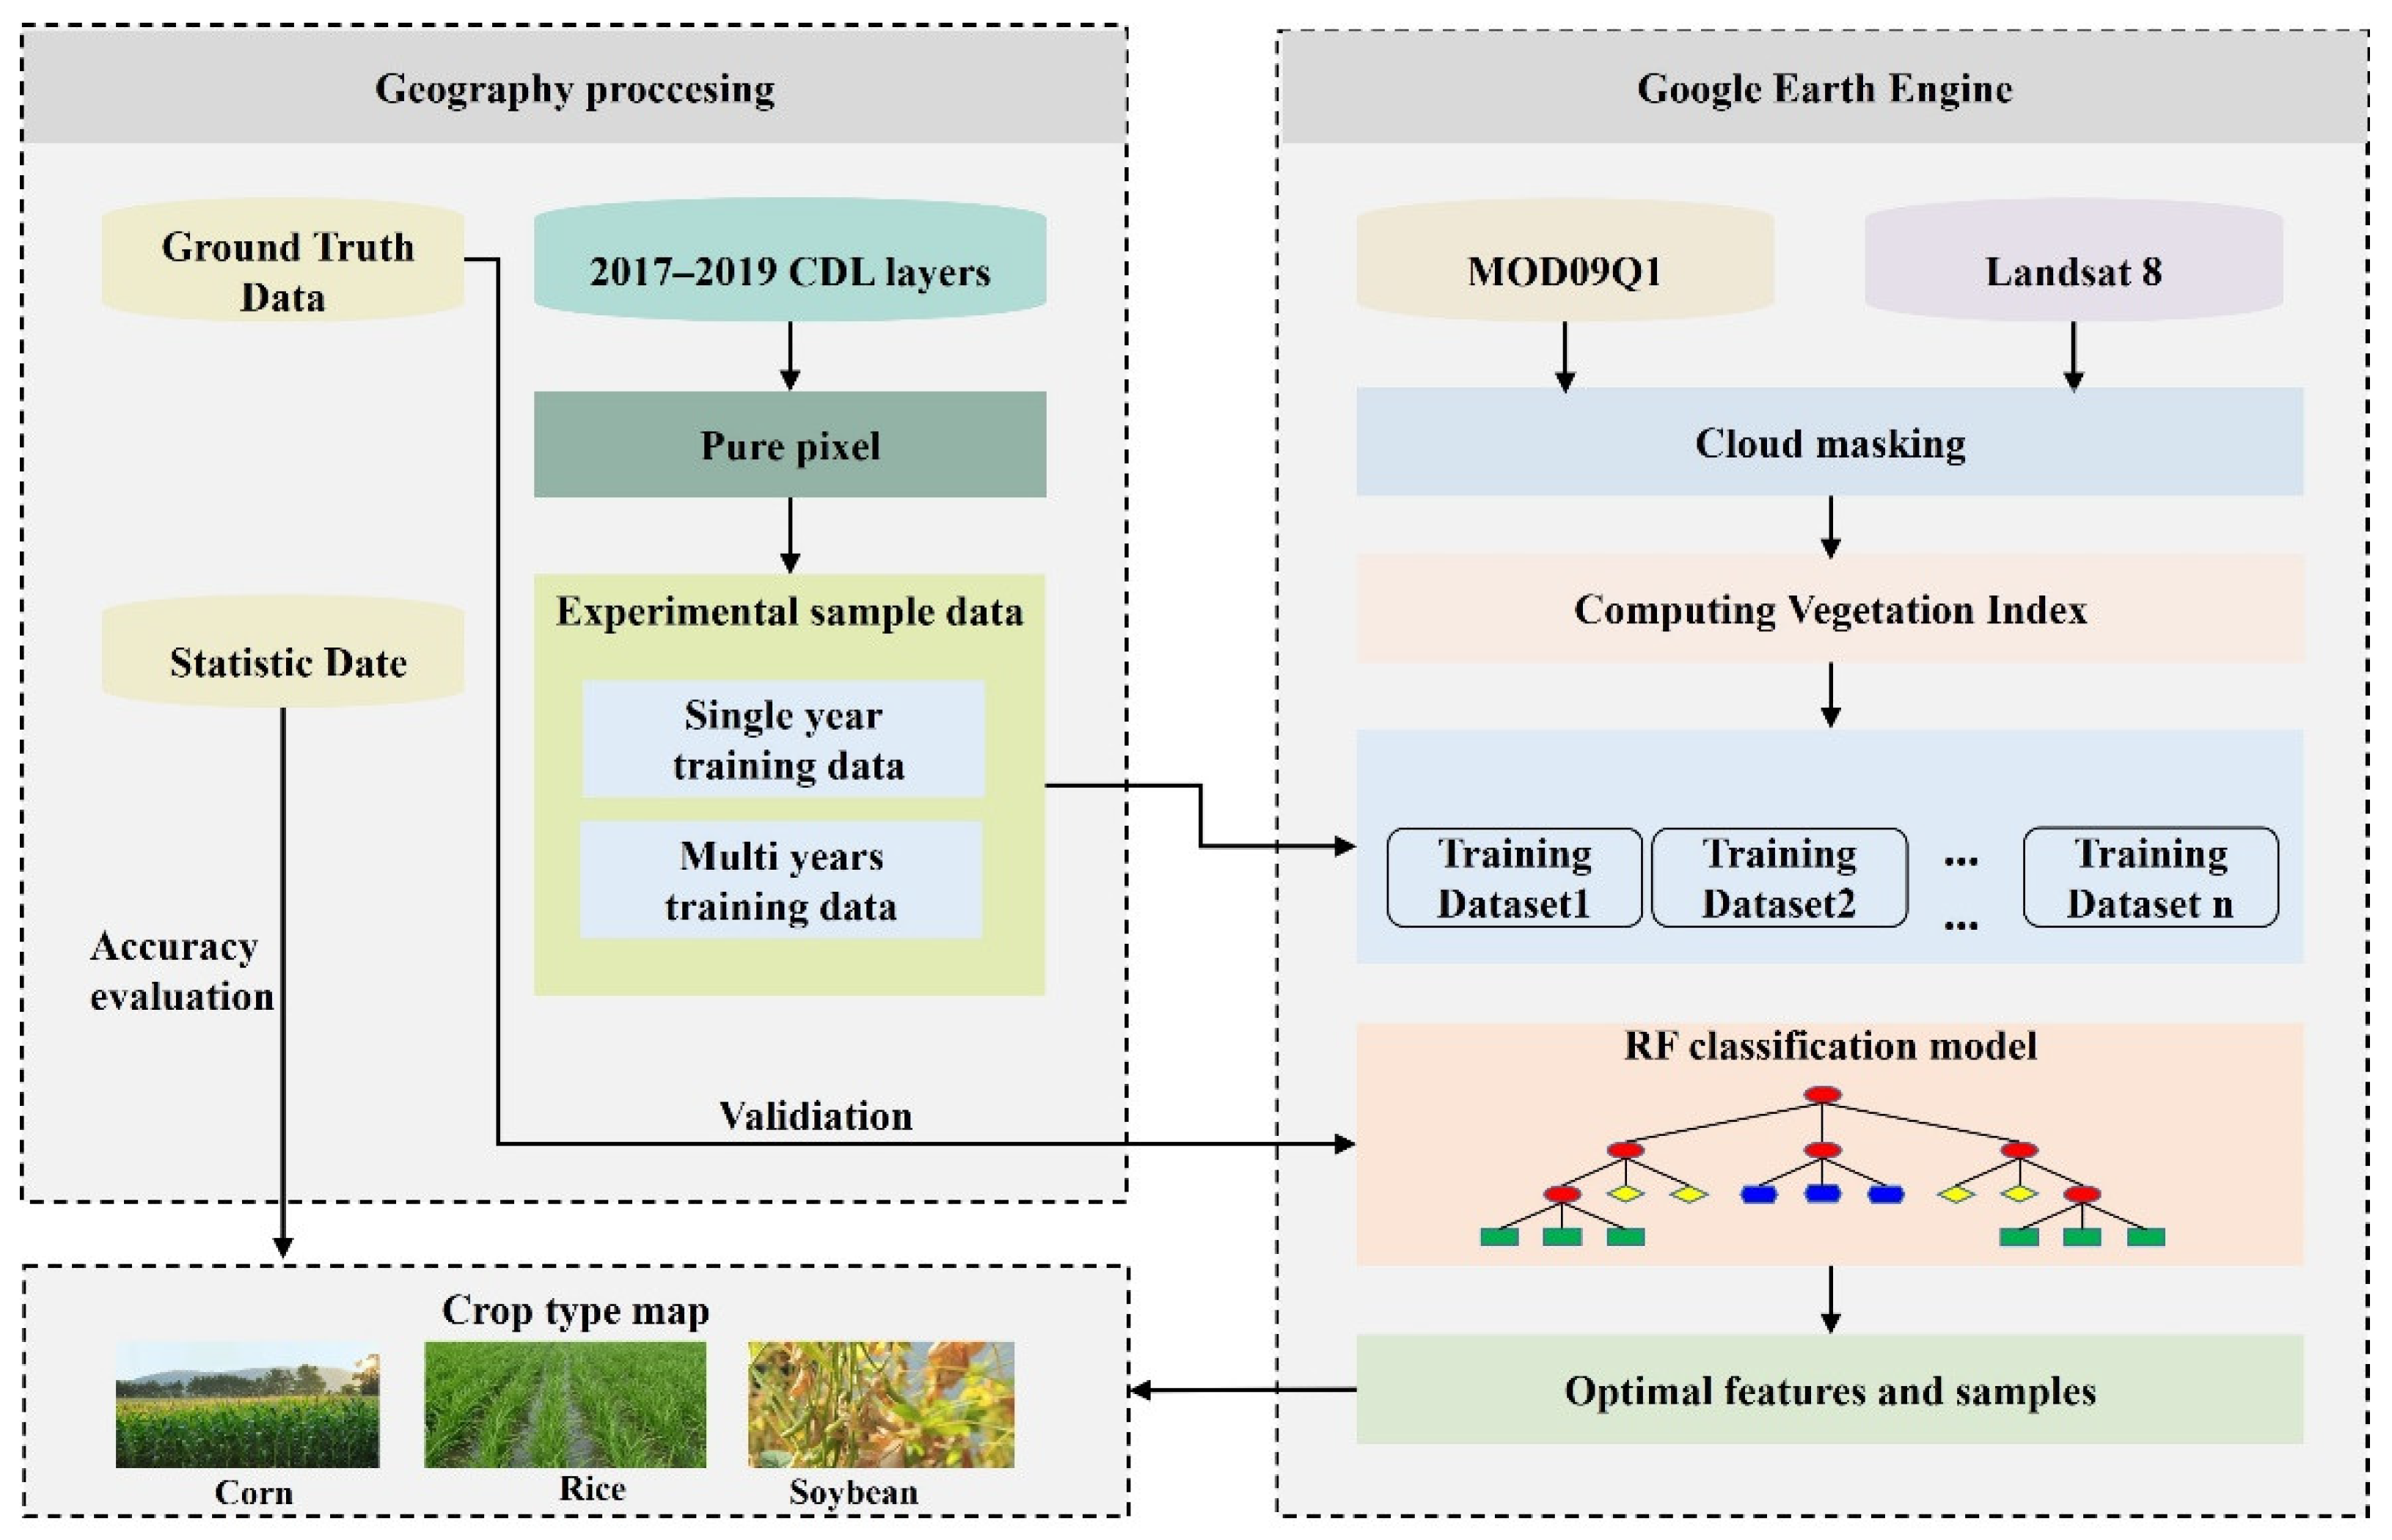
2.3. Methods
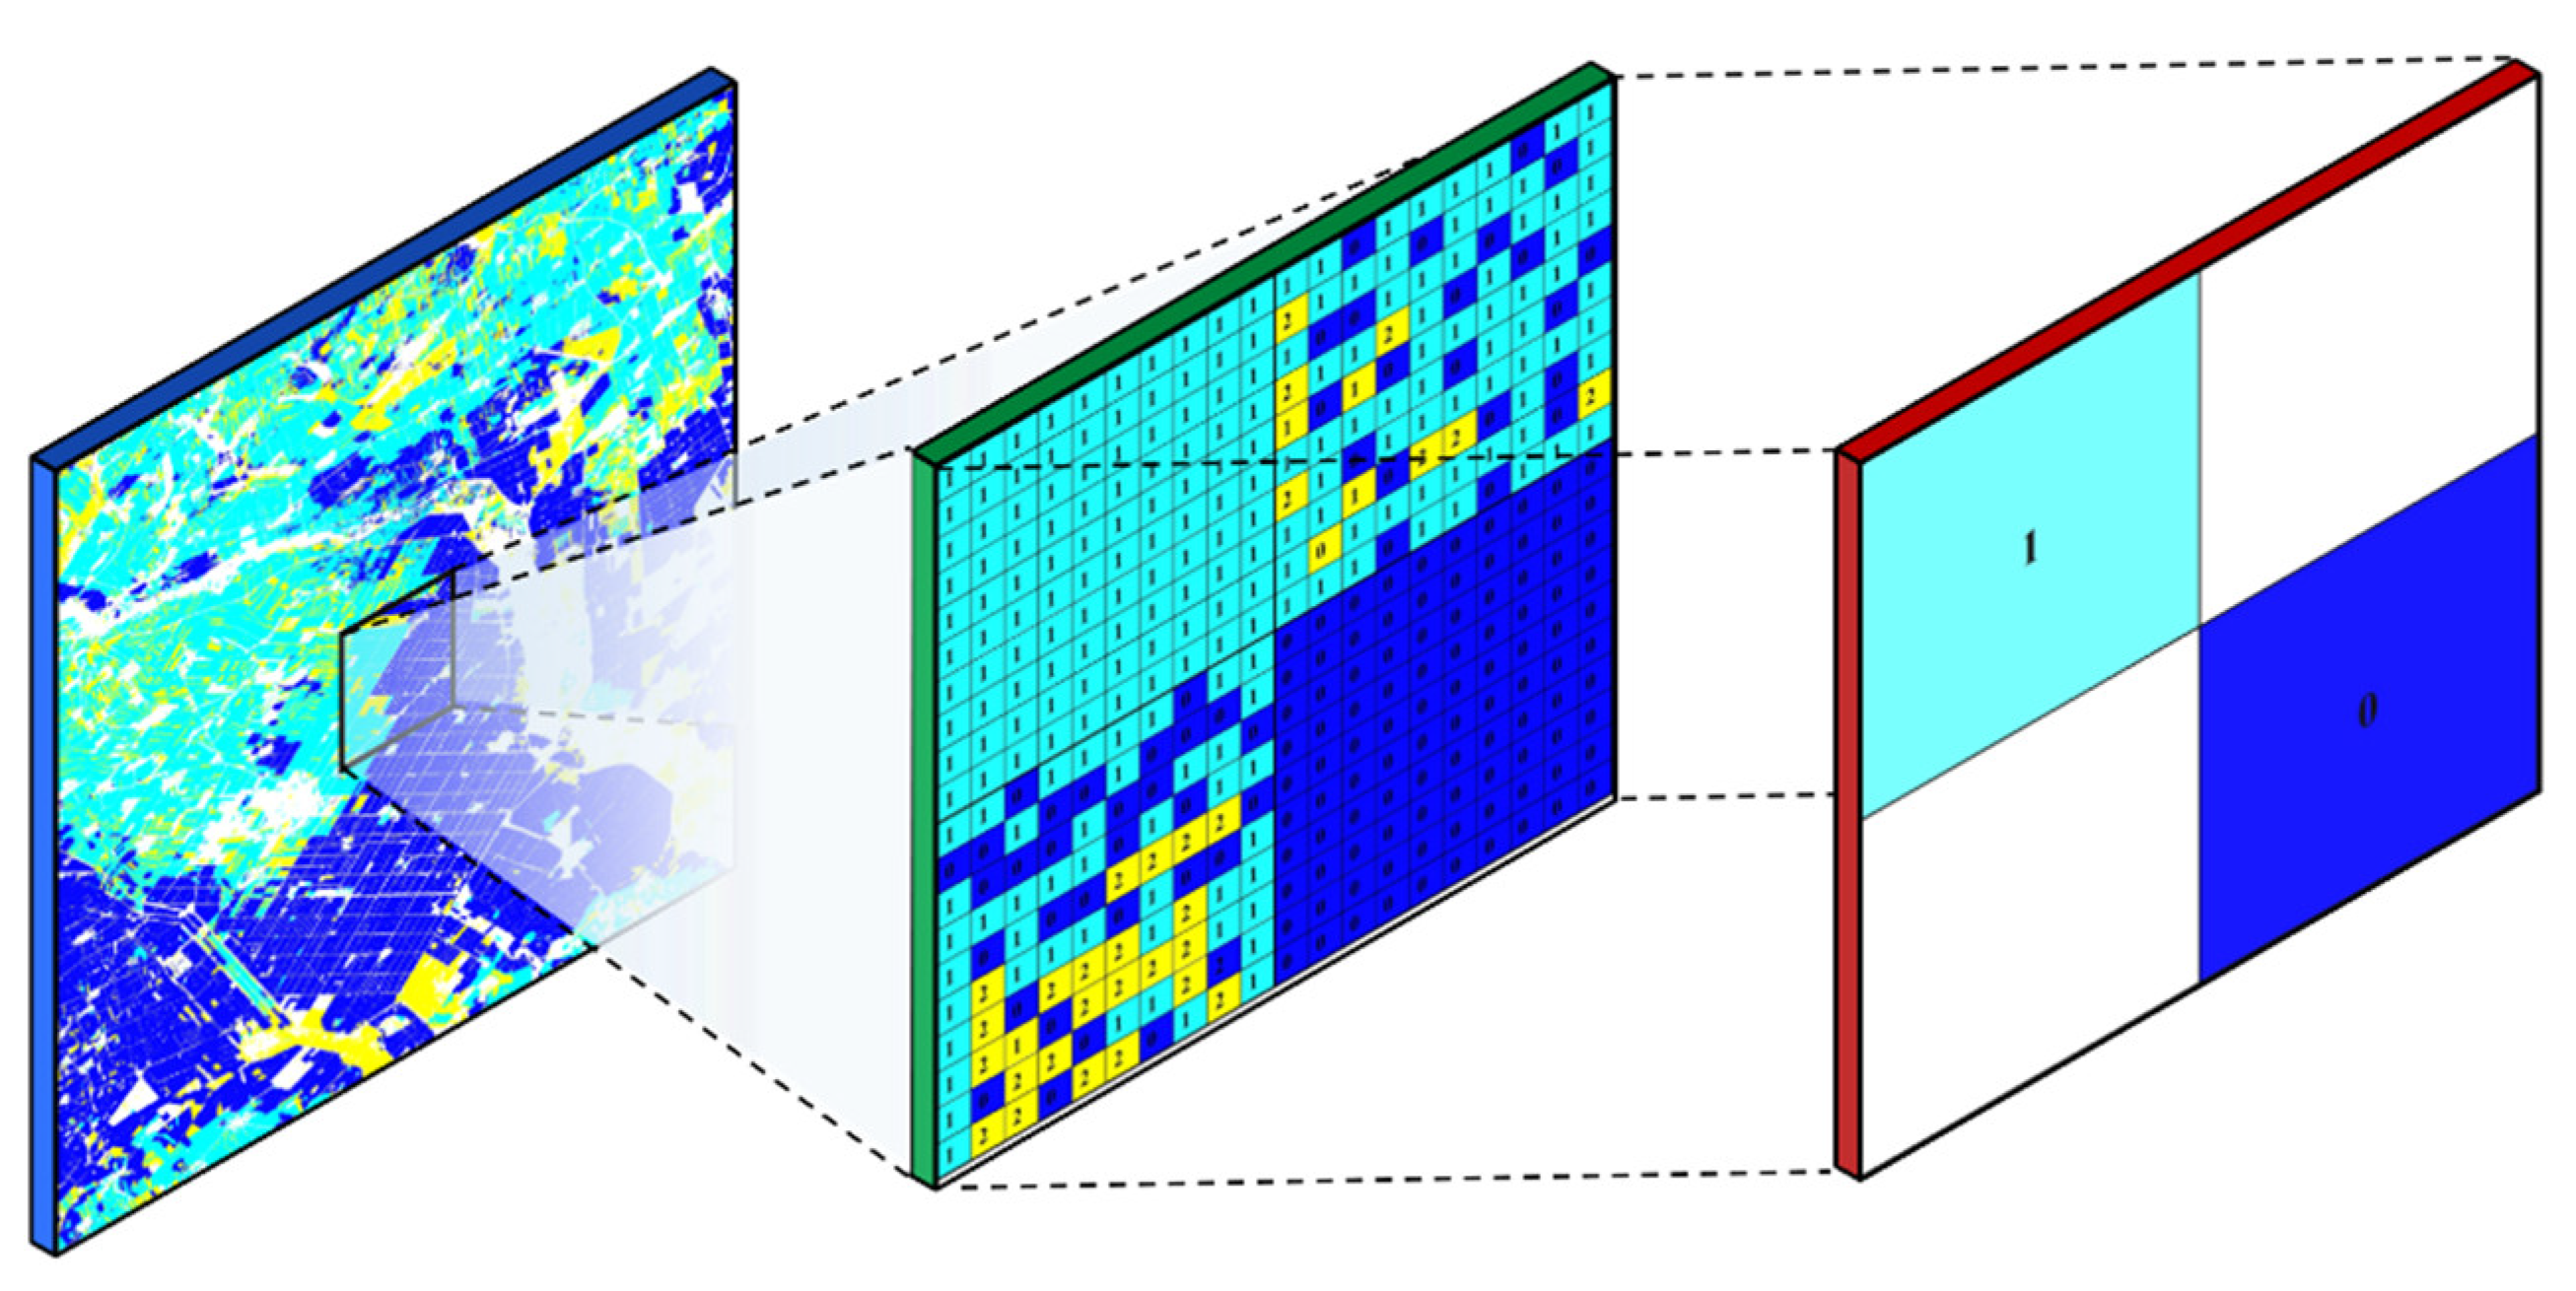
2.3.1. Pure Pixel Sample Selection
2.3.2. Feature Selection
2.3.3. RF Classification Method and Feature Importance Selection
- Gini coefficient calculation:Here, represents categories and the proportion of category K in node ;
- Characteristic : The importance of J at node , that is, the change in value of the Gini coefficient impurity before and after node m branching. The greater the change in value, the greater the characteristic can quickly divide the samples into different sets with higher purity, that is, the stronger the classification ability;Here and respectively, represent the purity of coefficients of the left and right child nodes after branching;
- If feature occurs times in the decision tree , then the feature importance of feature in decision tree is:
- Assuming that there are trees in the RF, the characteristic importance of characteristic in the RF is calculated as:
- Finally, the importance of all features is normalized as the final feature importance score:
2.3.4. Experimental Design
2.3.5. Accuracy Verification
3. Results
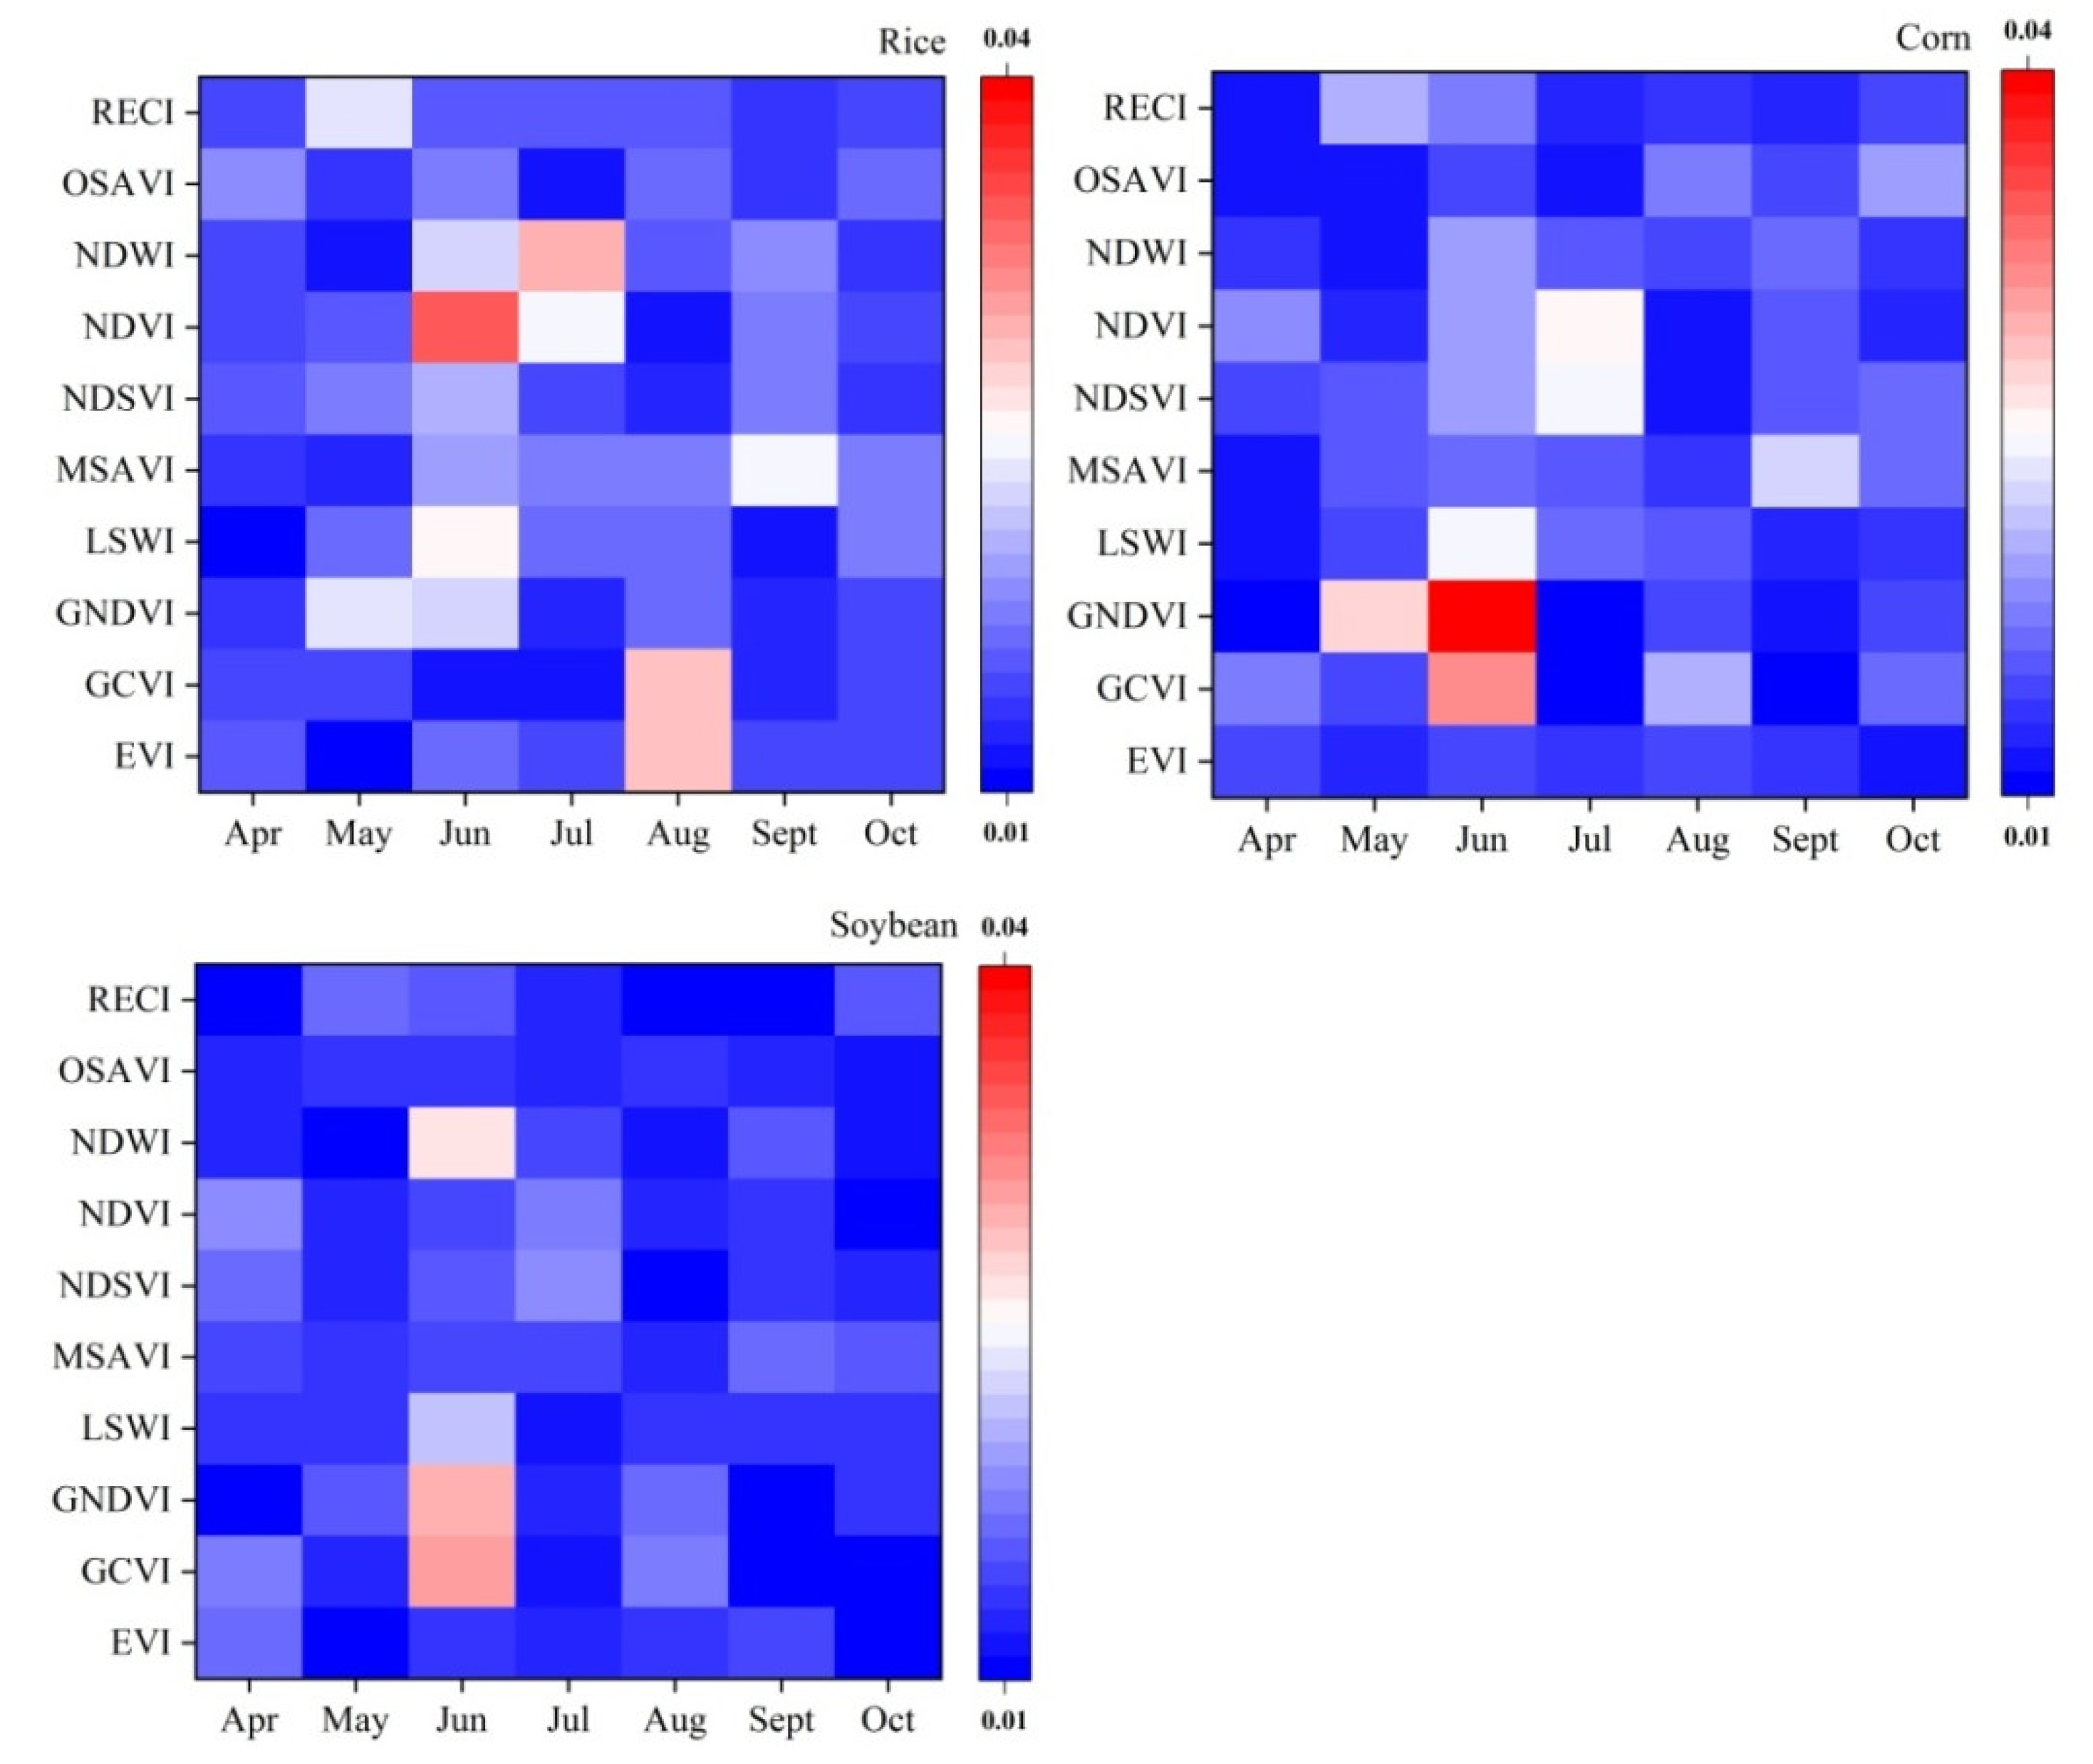
3.1. Feature Importance Analysis
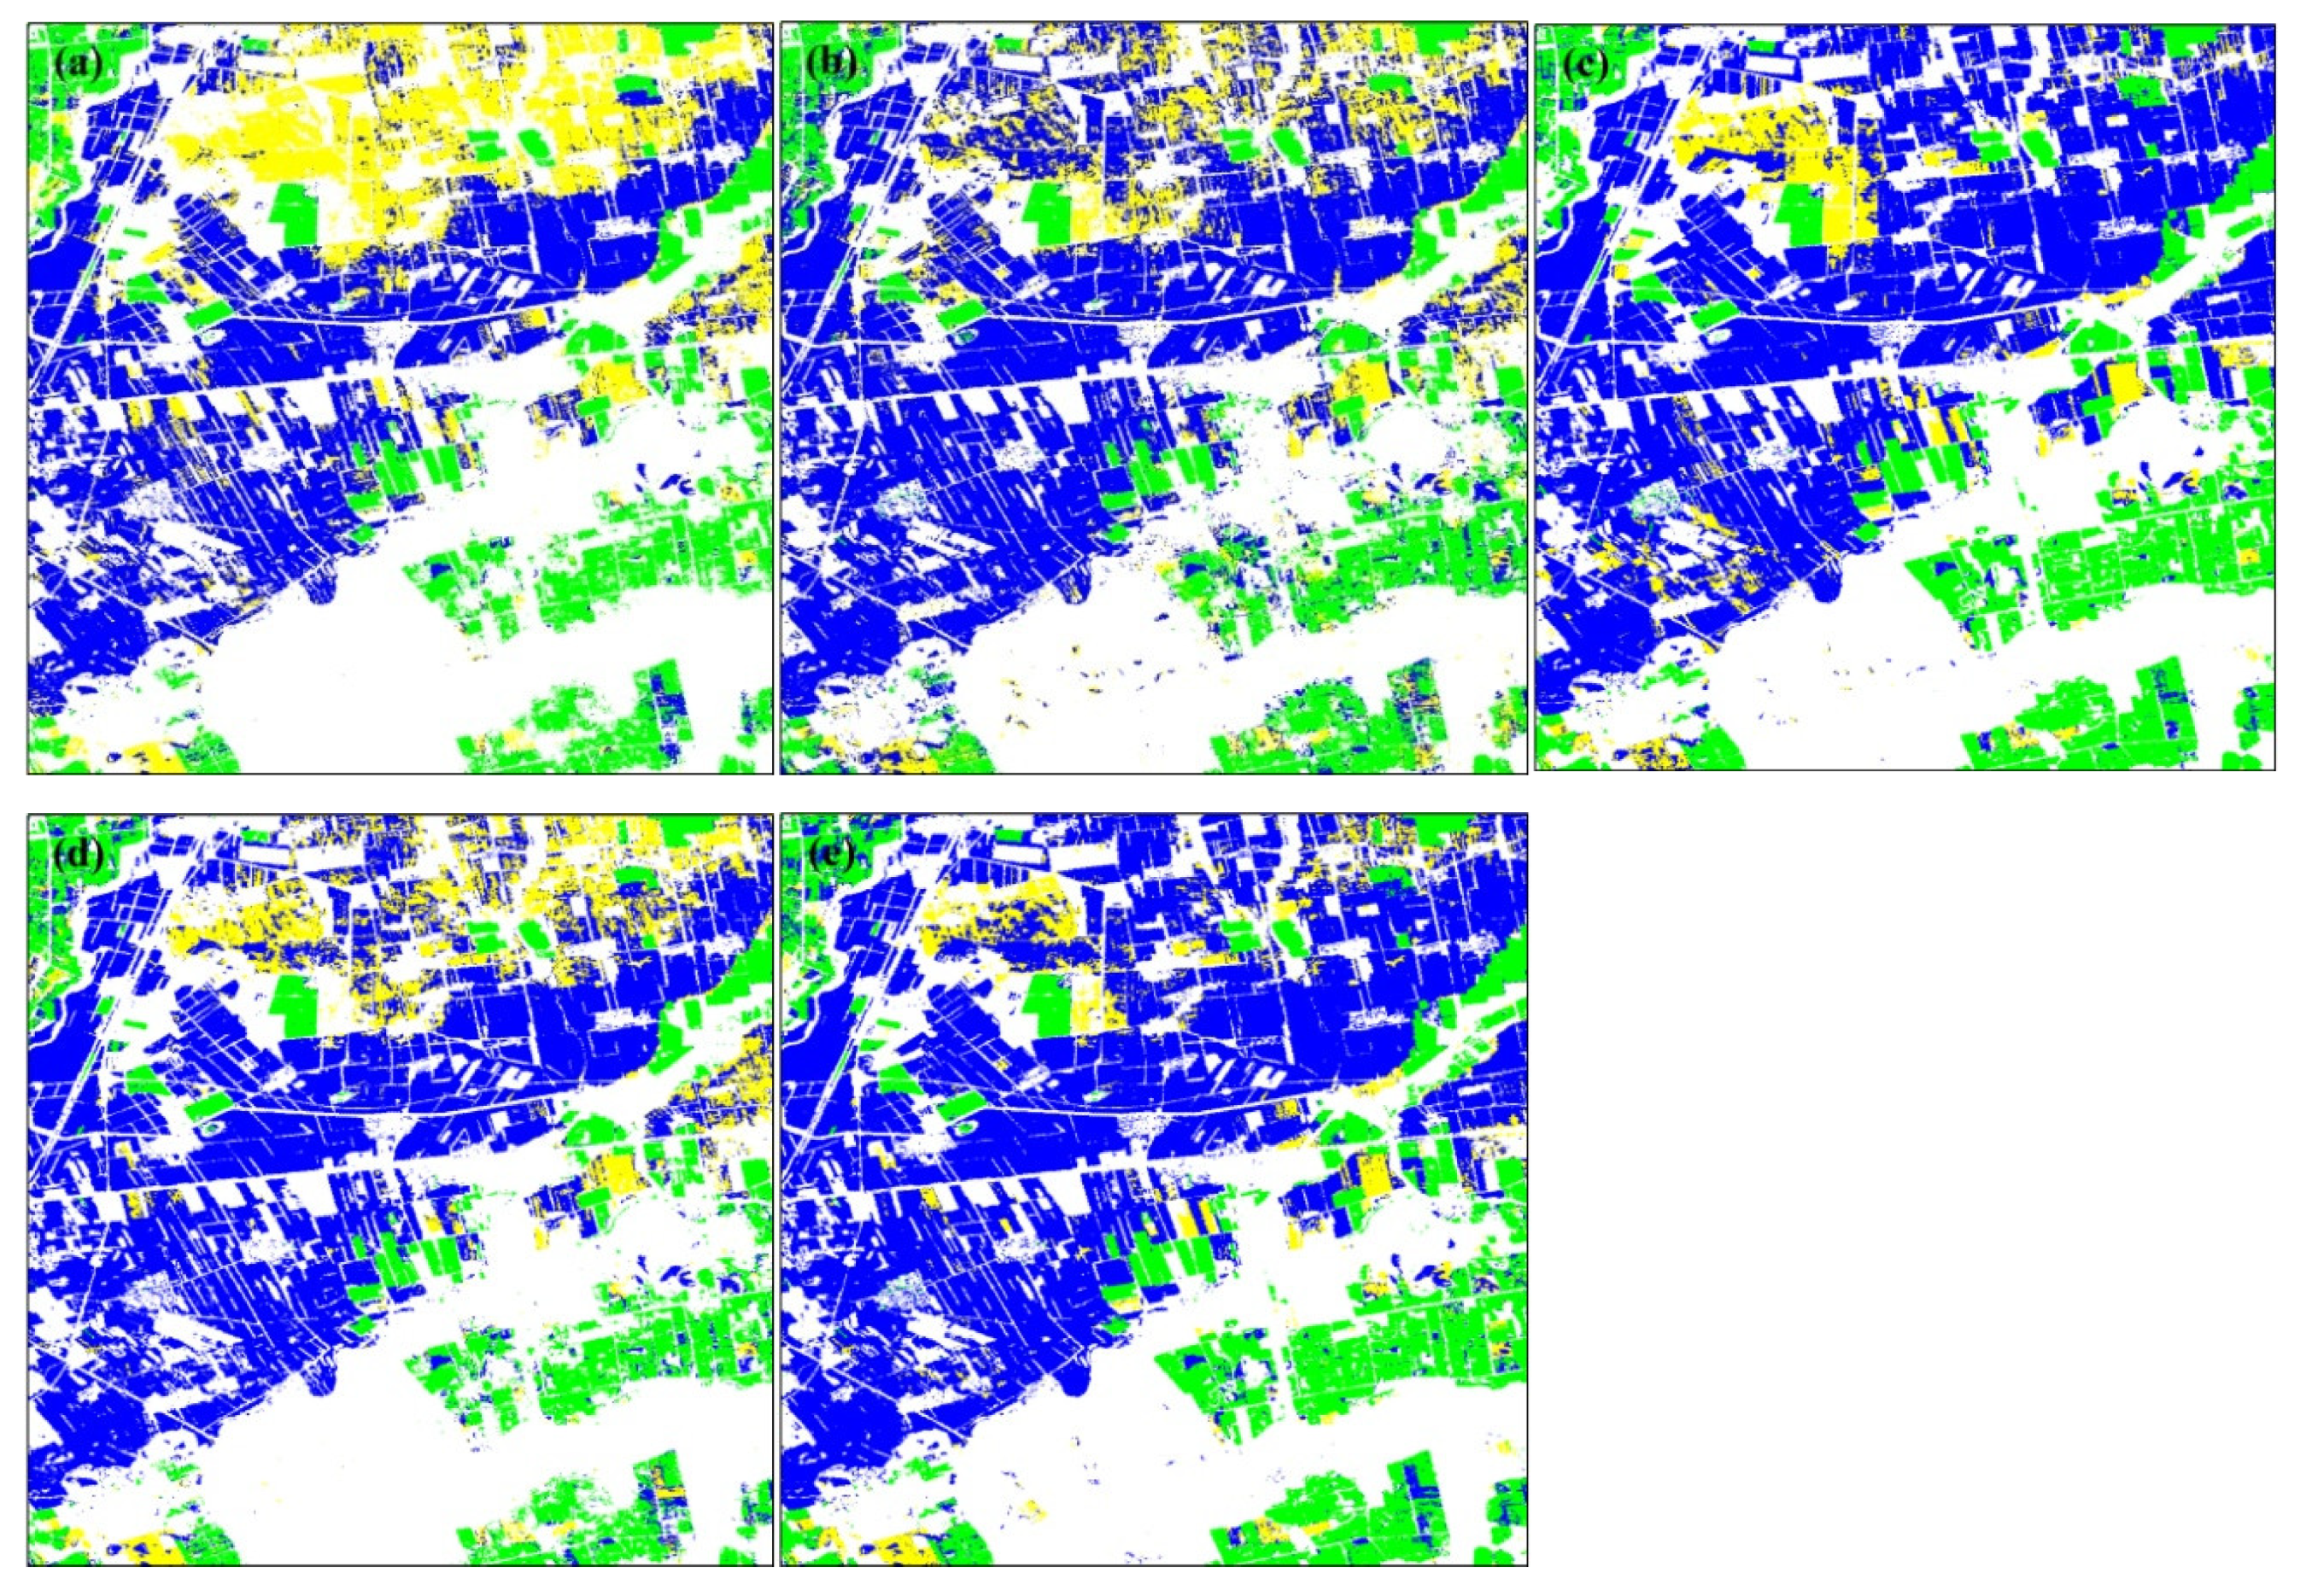
3.2. Impact of Time Sampling on Classification
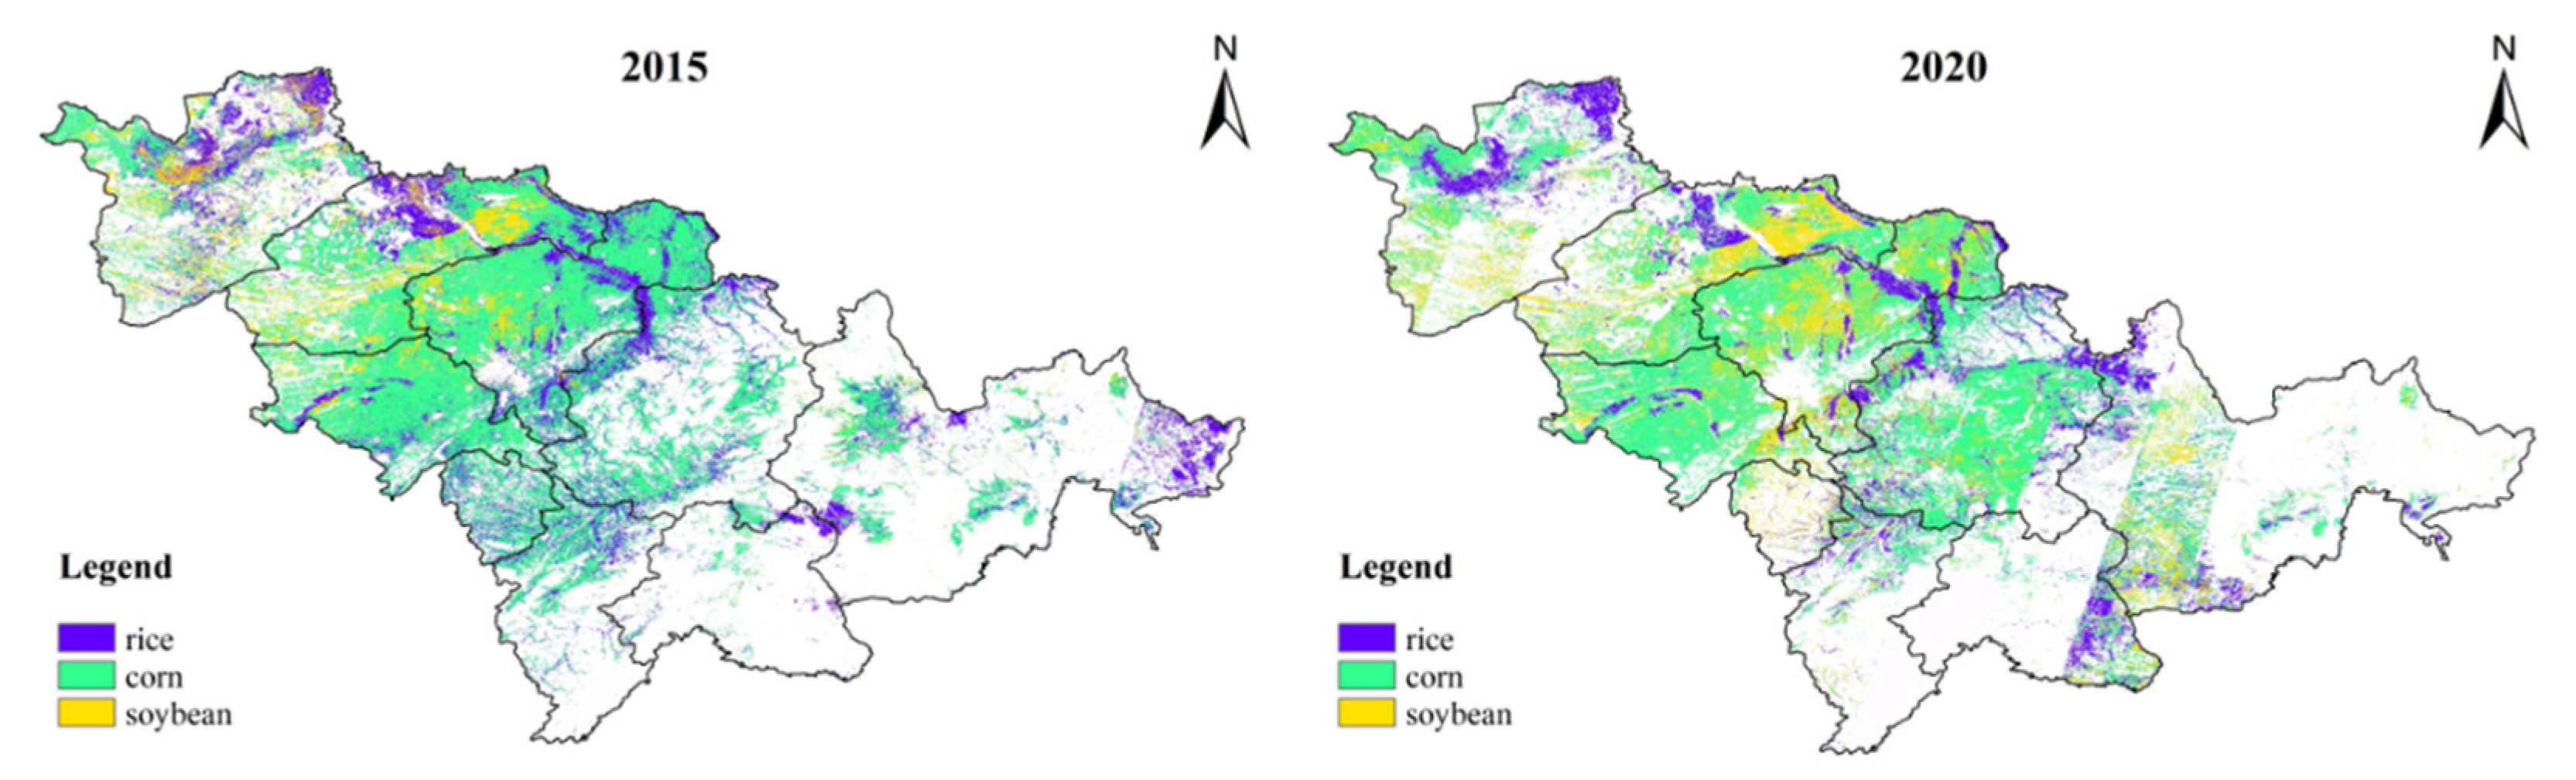
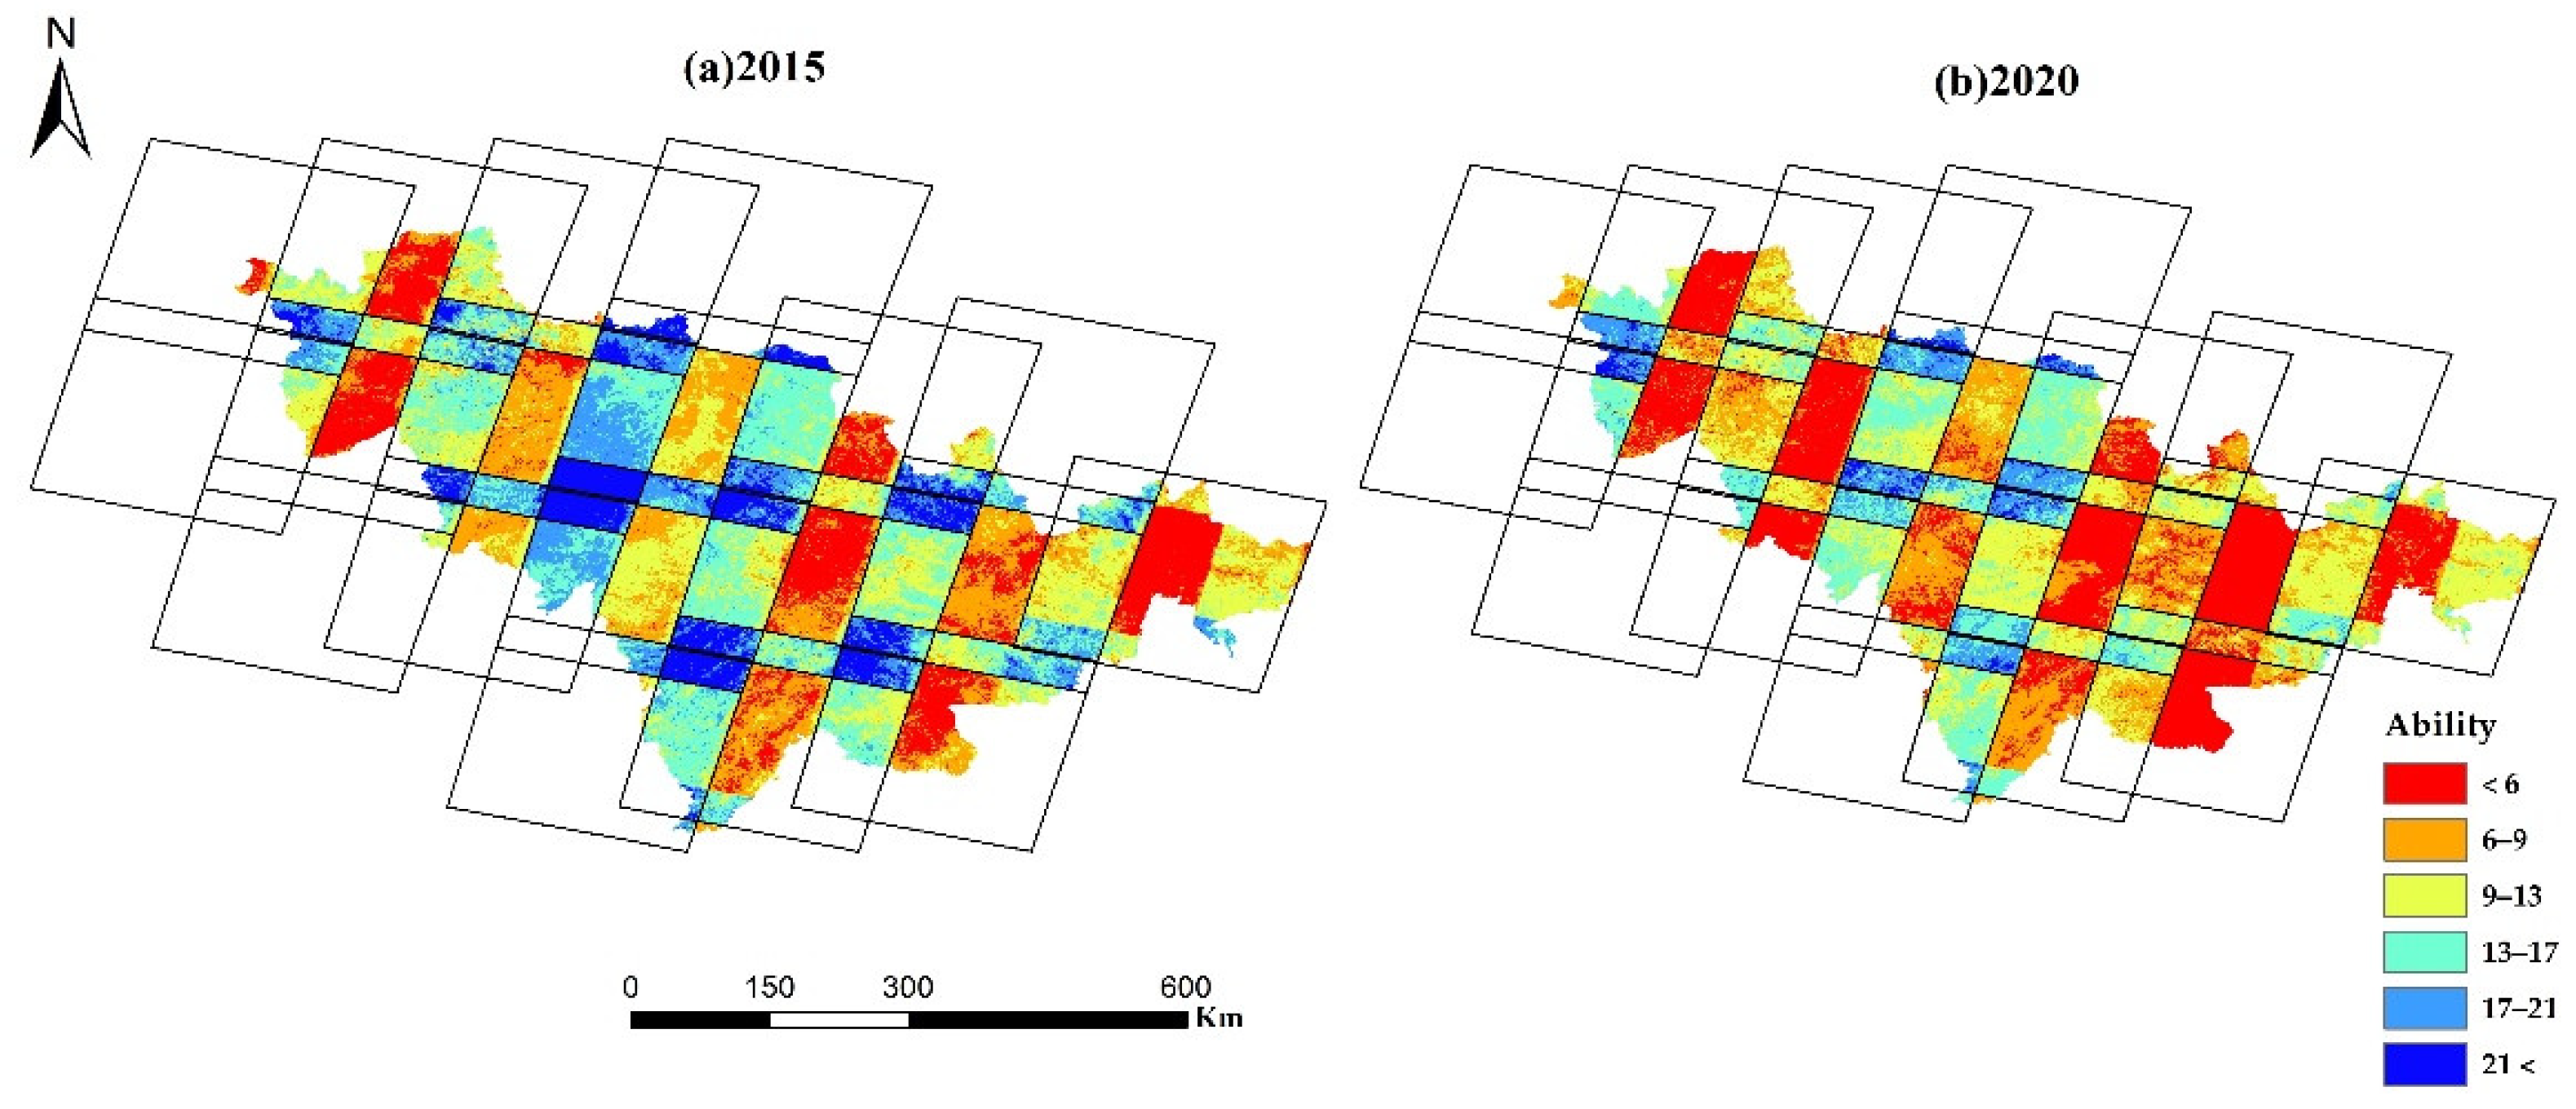
3.3. Spatial Distribution of Crops in Jilin Province
4. Discussion
4.1. Select Multiple Vegetation Index
4.2. Availability of Remote Sensing Data
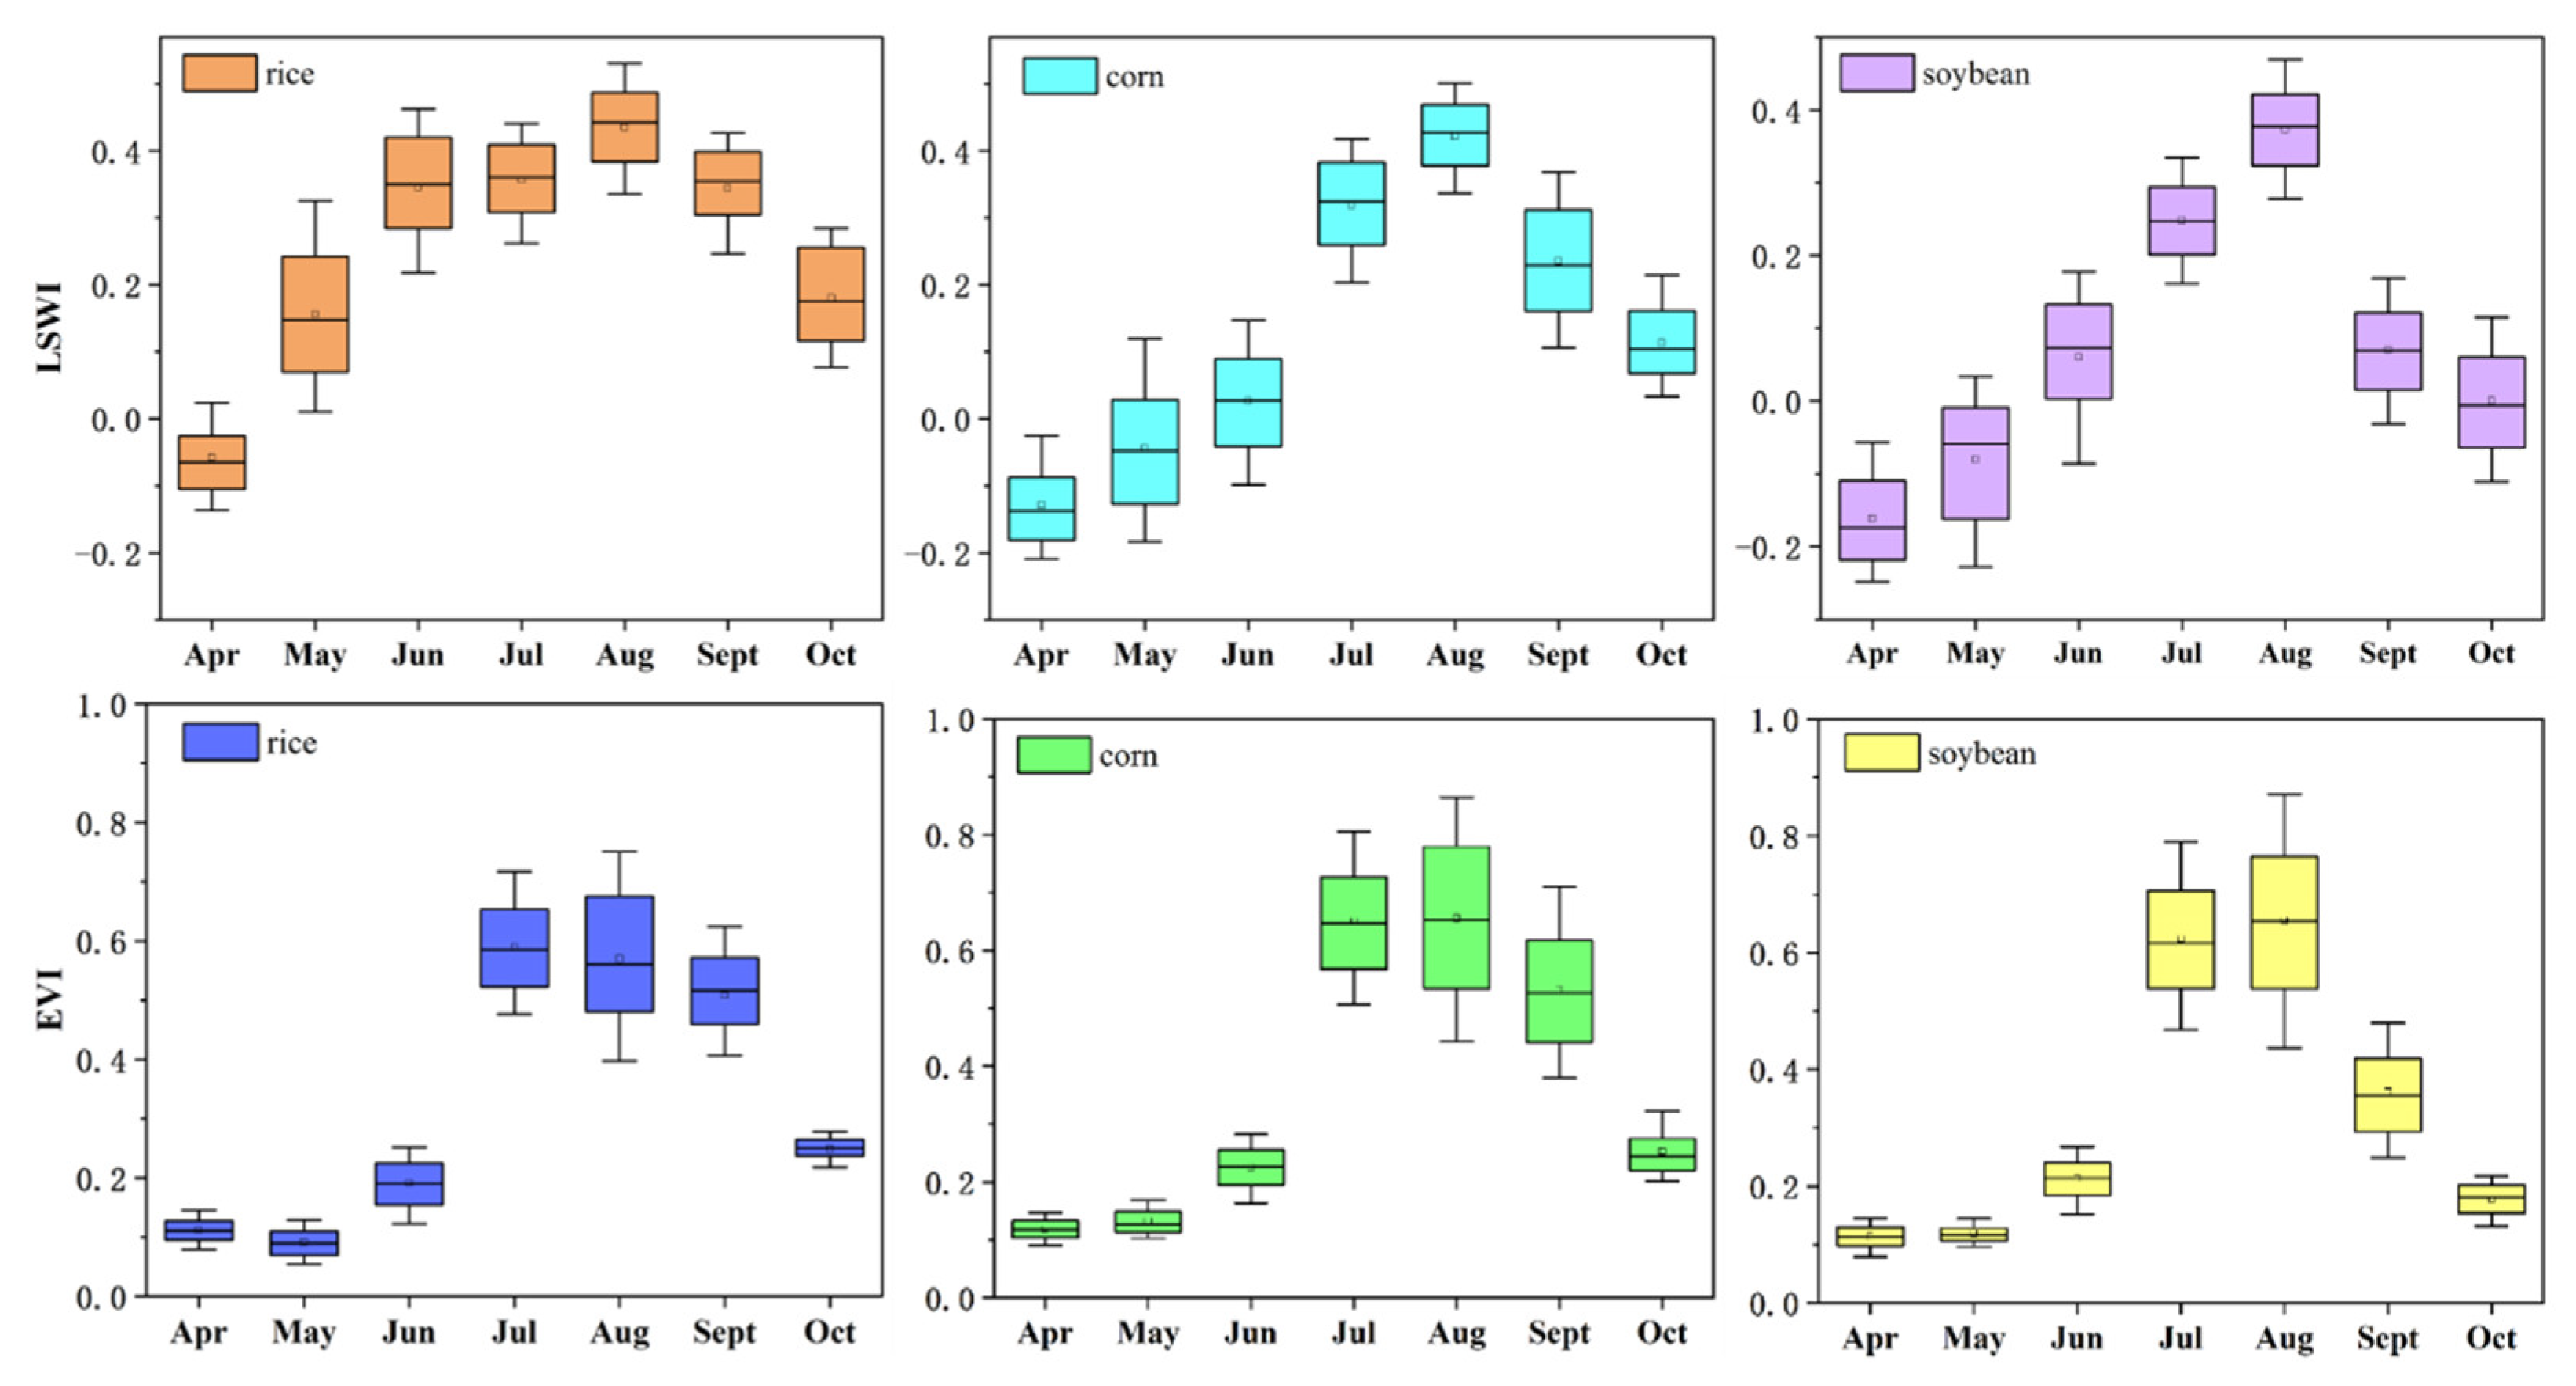
4.3. Spectral Characteristics of Different Crops
5. Conclusions
Author Contributions
Funding
Conflicts of Interest
References
- Nicholson, C.C.; Emery, B.F.; Niles, M.T. Global relationships between crop diversity and nutritional stability. Nat. Commun. 2021, 12, 5310. [Google Scholar] [CrossRef] [PubMed]
- Becker-Reshef, I.; Justice, C.; Sullivan, M.; Vermote, E.; Tucker, C.; Anyamba, A.; Small, J.; Pak, E.; Masuoka, E.; Schmaltz, J.; et al. Monitoring global croplands with coarse resolution earth observations: The global agriculture monitoring (glam) project. Remote Sens. 2010, 2, 1589–1609. [Google Scholar] [CrossRef]
- Ferreira, T.R.; Silva, B.B.D.; Moura, M.S.B.D.; Verhoef, A.; Nóbrega, R.L.B. The use of remote sensing for reliable estimation of net radiation and its components: A case study for contrasting land covers in an agricultural hotspot of the brazilian semiarid region. Agr. For. Meteorol. 2020, 291, 108052. [Google Scholar] [CrossRef]
- Fick, S.E.; Hijmans, R.J. Worldclim 2: New 1-km spatial resolution climate surfaces for global land areas. Int. J. Climatol. 2017, 37, 4302–4315. [Google Scholar] [CrossRef]
- Ajadi, O.A.; Barr, J.; Liang, S.-Z.; Ferreira, R.; Kumpatla, S.P.; Patel, R.; Swatantran, A. Large-scale crop type and crop area mapping across brazil using synthetic aperture radar and optical imagery. Int. J. Appl. Earth Obs. 2021, 97, 102294. [Google Scholar] [CrossRef]
- Ibrahim, E.S.; Rufin, P.; Nill, L.; Kamali, B.; Nendel, C.; Hostert, P. Mapping crop types and cropping systems in nigeria with Sentinel-2 imagery. Remote Sens. 2021, 13, 3523. [Google Scholar] [CrossRef]
- Griffiths, P.; Nendel, C.; Hostert, P. Intra-annual reflectance composites from Sentinel-2 and Landsat for national-scale crop and land cover mapping. Remote Sens. Environ. 2019, 220, 135–151. [Google Scholar] [CrossRef]
- Prins, A.J.; Van Niekerk, A. Crop type mapping using LiDAR, Sentinel-2 and aerial imagery with machine learning algorithms. Geo-Spat. Inf. Sci. 2021, 24, 215–227. [Google Scholar] [CrossRef]
- Kpienbaareh, D.; Sun, X.; Wang, J.; Luginaah, I.; Bezner Kerr, R.; Lupafya, E.; Dakishoni, L. Crop Type and Land Cover Mapping in Northern Malawi Using the Integration of Sentinel-1, Sentinel-2, and PlanetScope Satellite Data. Remote Sens. 2021, 13, 700. [Google Scholar] [CrossRef]
- Blickensdörfer, L.; Schwieder, M.; Pflugmacher, D.; Nendel, C.; Erasmi, S.; Hostert, P. Mapping of Crop Types and Crop Sequences with Combined Time Series of Sentinel-1, Sentinel-2 and Landsat 8 Data for Germany. Remote Sens. Environ. 2012, 269, 112831. [Google Scholar] [CrossRef]
- Rustowicz, R.; Cheong, R.; Wang, L.; Ermon, S.; Burke, M.; Lobell, D. Semantic Segmentation of Crop Type in Africa: A Novel Dataset and Analysis of Deep Learning Methods. In Proceedings of the IEEE/CVF Conference on Computer Vision and Pattern Recognition (CVPR) Workshops, Long Beach, CA, USA, 16–20 June 2019. [Google Scholar]
- Mazarire, T.T.; Ratshiedana, P.E.; Nyamugama, A.; Adam, E.; Chirima, G. Exploring machine learning algorithms for mapping crop types in a heterogeneous agriculture landscape using Sentinel-2 data. A case study of Free State Province, South Africa. S. Afr. J. Geomat. 2020, 9, 333–347. [Google Scholar] [CrossRef]
- Boryan, C.; Yang, Z.W.; Di, L.P. Deriving 2011 cultivated land cover data sets using usda national agricultural statistics service historic cropland data layers. In Proceedings of the 2012 IEEE International Geoscience and Remote Sensing Symposium (IGARSS), Munich, Germany, 22–27 July 2012; pp. 6297–6300. [Google Scholar] [CrossRef]
- Boryan, C.G.; Yang, Z.W. Implementation of a new automatic stratification method using geospatial cropland data layers in Nass area frame construction. In Proceedings of the 2014 IEEE International Geoscience and Remote Sensing Symposium (IGARSS), Quebec City, QC, Canada, 13–18 July 2014; pp. 2110–2113. [Google Scholar] [CrossRef]
- Fisette, T.; Davidson, A.; Daneshfar, B.; Rollin, P.; Aly, Z.; Campbell, L. Annual space-based crop inventory for Canada. In Proceedings of the 2014 IEEE International Geoscience and Remote Sensing Symposium (IGARSS), Quebec City, QC, Canada, 13–18 July 2014; pp. 5095–5098. [Google Scholar] [CrossRef]
- Luo, Y.; Zhang, Z.; Chen, Y.; Li, Z.; Tao, F. ChinaCropPhen1km: A high-resolution crop phenological dataset for three staple crops in China during 2000–2015 based on leaf area index (LAI) products. Earth Syst. Sci. Data 2020, 12, 197–214. [Google Scholar] [CrossRef]
- Luo, Y.; Zhang, Z.; Li, Z.; Chen, Y.; Zhang, L.; Cao, J.; Tao, F. Identifying the spatiotemporal changes of annual harvesting areas for three staple crops in China by integrating multi-data sources. Environ. Res. Lett. 2020, 15, 074003. [Google Scholar] [CrossRef]
- You, N.; Dong, J.; Huang, J.; Du, G.; Zhang, G.; He, Y.; Yang, T.; Di, Y.; Xiao, X. The 10-m crop type maps in Northeast China during 2017–2019. Sci. Data 2021, 8, 41. [Google Scholar] [CrossRef] [PubMed]
- Peña-Barragán, J.M.; Ngugi, M.K.; Plant, R.E.; Six, J. Object-based crop identification using multiple vegetation indices, textural features and crop phenology. Remote Sens. Environ. 2011, 115, 1301–1316. [Google Scholar] [CrossRef]
- Adrian, J.; Sagan, V.; Maimaitijiang, M. Sentinel sar-optical fusion for crop type mapping using deep learning and google earth engine. ISPRS. J. Photogramm. 2021, 175, 215–235. [Google Scholar] [CrossRef]
- Belgiu, M.; Csillik, O. Sentinel-2 cropland mapping using pixel-based and object-based time-weighted dynamic time warping analysis. Remote Sens. Environ. 2018, 204, 509–523. [Google Scholar] [CrossRef]
- Gorelick, N.; Hancher, M.; Dixon, M.; Ilyushchenko, S.; Thau, D.; Moore, R. Google earth engine: Planetary-scale geospatial analysis for everyone. Remote Sens. Environ. 2017, 202, 18–27. [Google Scholar] [CrossRef]
- Phalke, A.R.; Özdoğan, M.; Thenkabail, P.S.; Erickson, T.; Gorelick, N.; Yadav, K.; Congalton, R.G. Mapping croplands of europe, middle east, russia, and central asia using landsat, random forest, and google earth engine. ISPRS J. Photogramm. 2020, 167, 104–122. [Google Scholar] [CrossRef]
- You, N.; Dong, J. Examining earliest identifiable timing of crops using all available Sentinel 1/2 imagery and google earth engine. ISPRS J. Photogramm. 2020, 161, 109–123. [Google Scholar] [CrossRef]
- Wang, J.; Xiao, X.; Liu, L.; Wu, X.; Qin, Y.; Steiner, J.L.; Dong, J. Mapping sugarcane plantation dynamics in Guangxi, China, by time series Sentinel-1, Sentinel-2 and landsat images. Remote Sens. Environ. 2020, 247, 111951. [Google Scholar] [CrossRef]
- Wuyun, D.; Sun, L.; Sun, Z.; Chen, Z.; Hou, A.; Teixeira Crusiol, L.G.; Reymondin, L.; Chen, R.; Zhao, H. Mapping fallow fields using Sentinel-1 and Sentinel-2 archives over farming-pastoral ecotone of Northern China with Google Earth Engine. GIsci. Remote Sens. 2022, 59, 333–353. [Google Scholar] [CrossRef]
- Tian, H.; Pei, J.; Huang, J.; Li, X.; Wang, J.; Zhou, B.; Qin, Y.; Wang, L. Garlic and winter wheat identification based on active and passive satellite imagery and the Google Earth Engine in Northern China. Remote Sens. 2020, 12, 3539. [Google Scholar] [CrossRef]
- Yin, L.; You, N.; Zhang, G.; Huang, J.; Dong, J. Optimizing feature selection of individual crop types for improved crop mapping. Remote Sens. 2020, 12, 162. [Google Scholar] [CrossRef]
- Lin, C.; Zhong, L.; Song, X.-P.; Dong, J.; Lobell, D.B.; Jin, Z. Early- and in-season crop type mapping without current-year ground truth: Generating labels from historical information via a topology-based approach. Remote Sens. Environ. 2022, 274, 112994. [Google Scholar] [CrossRef]
- Lambert, M.-J.; Traoré, P.C.S.; Blaes, X.; Baret, P.; Defourny, P. Estimating smallholder crops production at village level from Sentinel-2 time series in Mali’s cotton belt. Remote Sens. Environ. 2018, 216, 647–657. [Google Scholar] [CrossRef]
- Kwak, G.-H.; Park, N.-W. Impact of texture information on crop classification with machine learning and uav images. Appl. Sci. 2019, 9, 643. [Google Scholar] [CrossRef]
- Boschetti, M.; Busetto, L.; Manfron, G.; Laborte, A.; Asilo, S.; Pazhanivelan, S.; Nelson, A. Phenorice: A method for automatic extraction of spatio-temporal information on rice crops using satellite data time series. Remote Sens. Environ. 2017, 194, 347–365. [Google Scholar] [CrossRef]
- Wang, S.; Di Tommaso, S.; Deines, J.M.; Lobell, D.B. Mapping twenty years of corn and soybean across the us midwest using the landsat archive. Sci. Data 2020, 7, 307. [Google Scholar] [CrossRef] [PubMed]
- Xu, J.; Zhu, Y.; Zhong, R.; Lin, Z.; Xu, J.; Jiang, H.; Huang, J.; Li, H.; Lin, T. Deepcropmapping: A multi-temporal deep learning approach with improved spatial generalizability for dynamic corn and soybean mapping. Remote Sens. Environ. 2020, 247, 111946. [Google Scholar] [CrossRef]
- Veloso, A.; Mermoz, S.; Bouvet, A.; Le Toan, T.; Planells, M.; Dejoux, J.-F.; Ceschia, E. Understanding the temporal behavior of crops using Sentinel-1 and Sentinel-2-like data for agricultural applications. Remote Sens. Environ. 2017, 199, 415–426. [Google Scholar] [CrossRef]
- Li, L. Study on Climatic Suitability and Frost Damage of Soybean in Jilin Province; Nanjing University of Information Engineering: Nanjing, China, 2021. [Google Scholar] [CrossRef]
- Ma, Y.; Guga, S.; Xu, J.; Liu, X.; Tong, Z.; Zhang, J. Assessment of maize drought risk in midwestern jilin province: A comparative analysis of topsis and vikor models. Remote Sens. 2022, 14, 2399. [Google Scholar] [CrossRef]
- Cai, Y.P.; Guan, K.Y.; Peng, J.; Wang, S.W.; Christopher, S.; Brian, W.; Li, Z. A High-Performance and in-Season Classification System of Field-Level Crop Types Using Time-Series Landsat Data and a Machine Learning Approach. Remote Sens. Environ. 2018, 210, 35–47. [Google Scholar] [CrossRef]
- Rodriguez-Galiano, V.F.; Chica-Olmo, M.; Abarca-Hernandez, F.; Atkinson, P.M.; Jeganathan, C. Random forest classification of mediterranean land cover using multi-seasonal imagery and multi-seasonal texture. Remote Sens. Environ. 2012, 121, 93–107. [Google Scholar] [CrossRef]
- Zhong, L.; Gong, P.; Biging, G.S. Efficient corn and soybean mapping with temporal extendability: A multi-year experiment using landsat imagery. Remote Sens. Environ. 2014, 140, 1–13. [Google Scholar] [CrossRef]
- Dahal, D.; Wylie, B.; Howard, D. Rapid crop cover mapping for the conterminous united states. Sci. Rep. 2018, 8, 8631. [Google Scholar] [CrossRef]


| Features | Calculation Formula | Description of Features |
|---|---|---|
| NDVI | (NIR/RED)/(NIR + RED) | Vegetation has strong reflection in the near-infrared band, with high reflectivity, while it has strong absorption in the red band, with low reflectivity, which can reflect the health of vegetation and the growth of vegetation. It is widely used in agriculture, forestry, ecological environment, and other fields, but it is very sensitive to soil brightness and atmospheric impact. |
| RECI | (NIR/RED) − 1 | Because the chlorophyll content directly depends on the nitrogen content in the plant, this index is sensitive to the chlorophyll content in the leaves nourished by nitrogen, so it is helpful to detect the yellow or deciduous areas of the plant. |
| MSAVI | (2× NIR + 1 − sqrt((2 × NIR + 1)2 – 8 × (NIR − RED)))/2 | It is applicable when NDVI cannot provide accurate values, especially in areas with a high proportion of bare soil, sparse vegetation, or low chlorophyll content in plants. This index is useful at the beginning of the crop growth season when seedlings begin to grow. |
| GNDVI | (NIR − GREEN)/(NIR + GREEN) | This index is a modification of NDVI, which is sensitive to withered or aging crops, monitors the nitrogen content in leaves, and is sensitive to dense canopy or mature vegetation. |
| GDSVI | (SWIR1 − RED)/(SWIR1 + RED) | This index is sensitive to the aging and yellowing of vegetation and can be used to distinguish the characteristics of different crops in different growth seasons. |
| NDWI | (GREEN − NIR)/(GREEN + NIR) | The difference ratio between green light band and near-infrared band is used to enhance the water information and weaken the information of vegetation, soil, buildings, and other ground features. This index has great advantages in pure water extraction and is widely used in farmland inundation and wetland feature extraction. |
| OSAVI | (NIR − RED)/(NIR + RED + 0.16) | It is applicable when the canopy coverage is low and has better sensitivity to the canopy coverage of more than 50%. |
| EVI | 2.5 × (NIR − RED)/((NIR) + (6 × RED) − (7.5× BULE) + 1) | Since NDVI is easily disturbed by soil background and atmosphere, EVI adapts to atmospheric and soil noise, especially in the vegetation area of cats, reducing saturation. Used to analyze dense vegetation areas with large amounts of chlorophyll. |
| GCVI | NIR/GREEN − 1 | It is used to estimate the chlorophyll content in various plants, which reflects the physiological state of vegetation. |
| LSWI | (NIR − SWIR1)/(NIR + SWIR1) | Surface water index, which can characterize the change of soil moisture. |
| Sample | Rice | Corn | Soybean | |||
|---|---|---|---|---|---|---|
| Producer’s Accuracy | User’s Accuracy | Producer’s Accuracy | User’s Accuracy | Producer’s Accuracy | User’s Accuracy | |
| 2017 | 0.6259 | 0.7529 | 0.5924 | 0.6482 | 0.4012 | 0.5676 |
| 2018 | 0.6315 | 0.7619 | 0.5615 | 0.6858 | 0.4262 | 0.5937 |
| 2019 | 0.8254 | 0.9041 | 0.7854 | 0.8502 | 0.698 | 0.7528 |
| 2017 + 2018 | 0.7926 | 0.84256 | 0.6952 | 0.74828 | 0.6542 | 0.7014 |
| 2017 + 2018 + 2019 | 0.8341 | 0.91548 | 0.7621 | 0.82947 | 0.634 | 0.69291 |
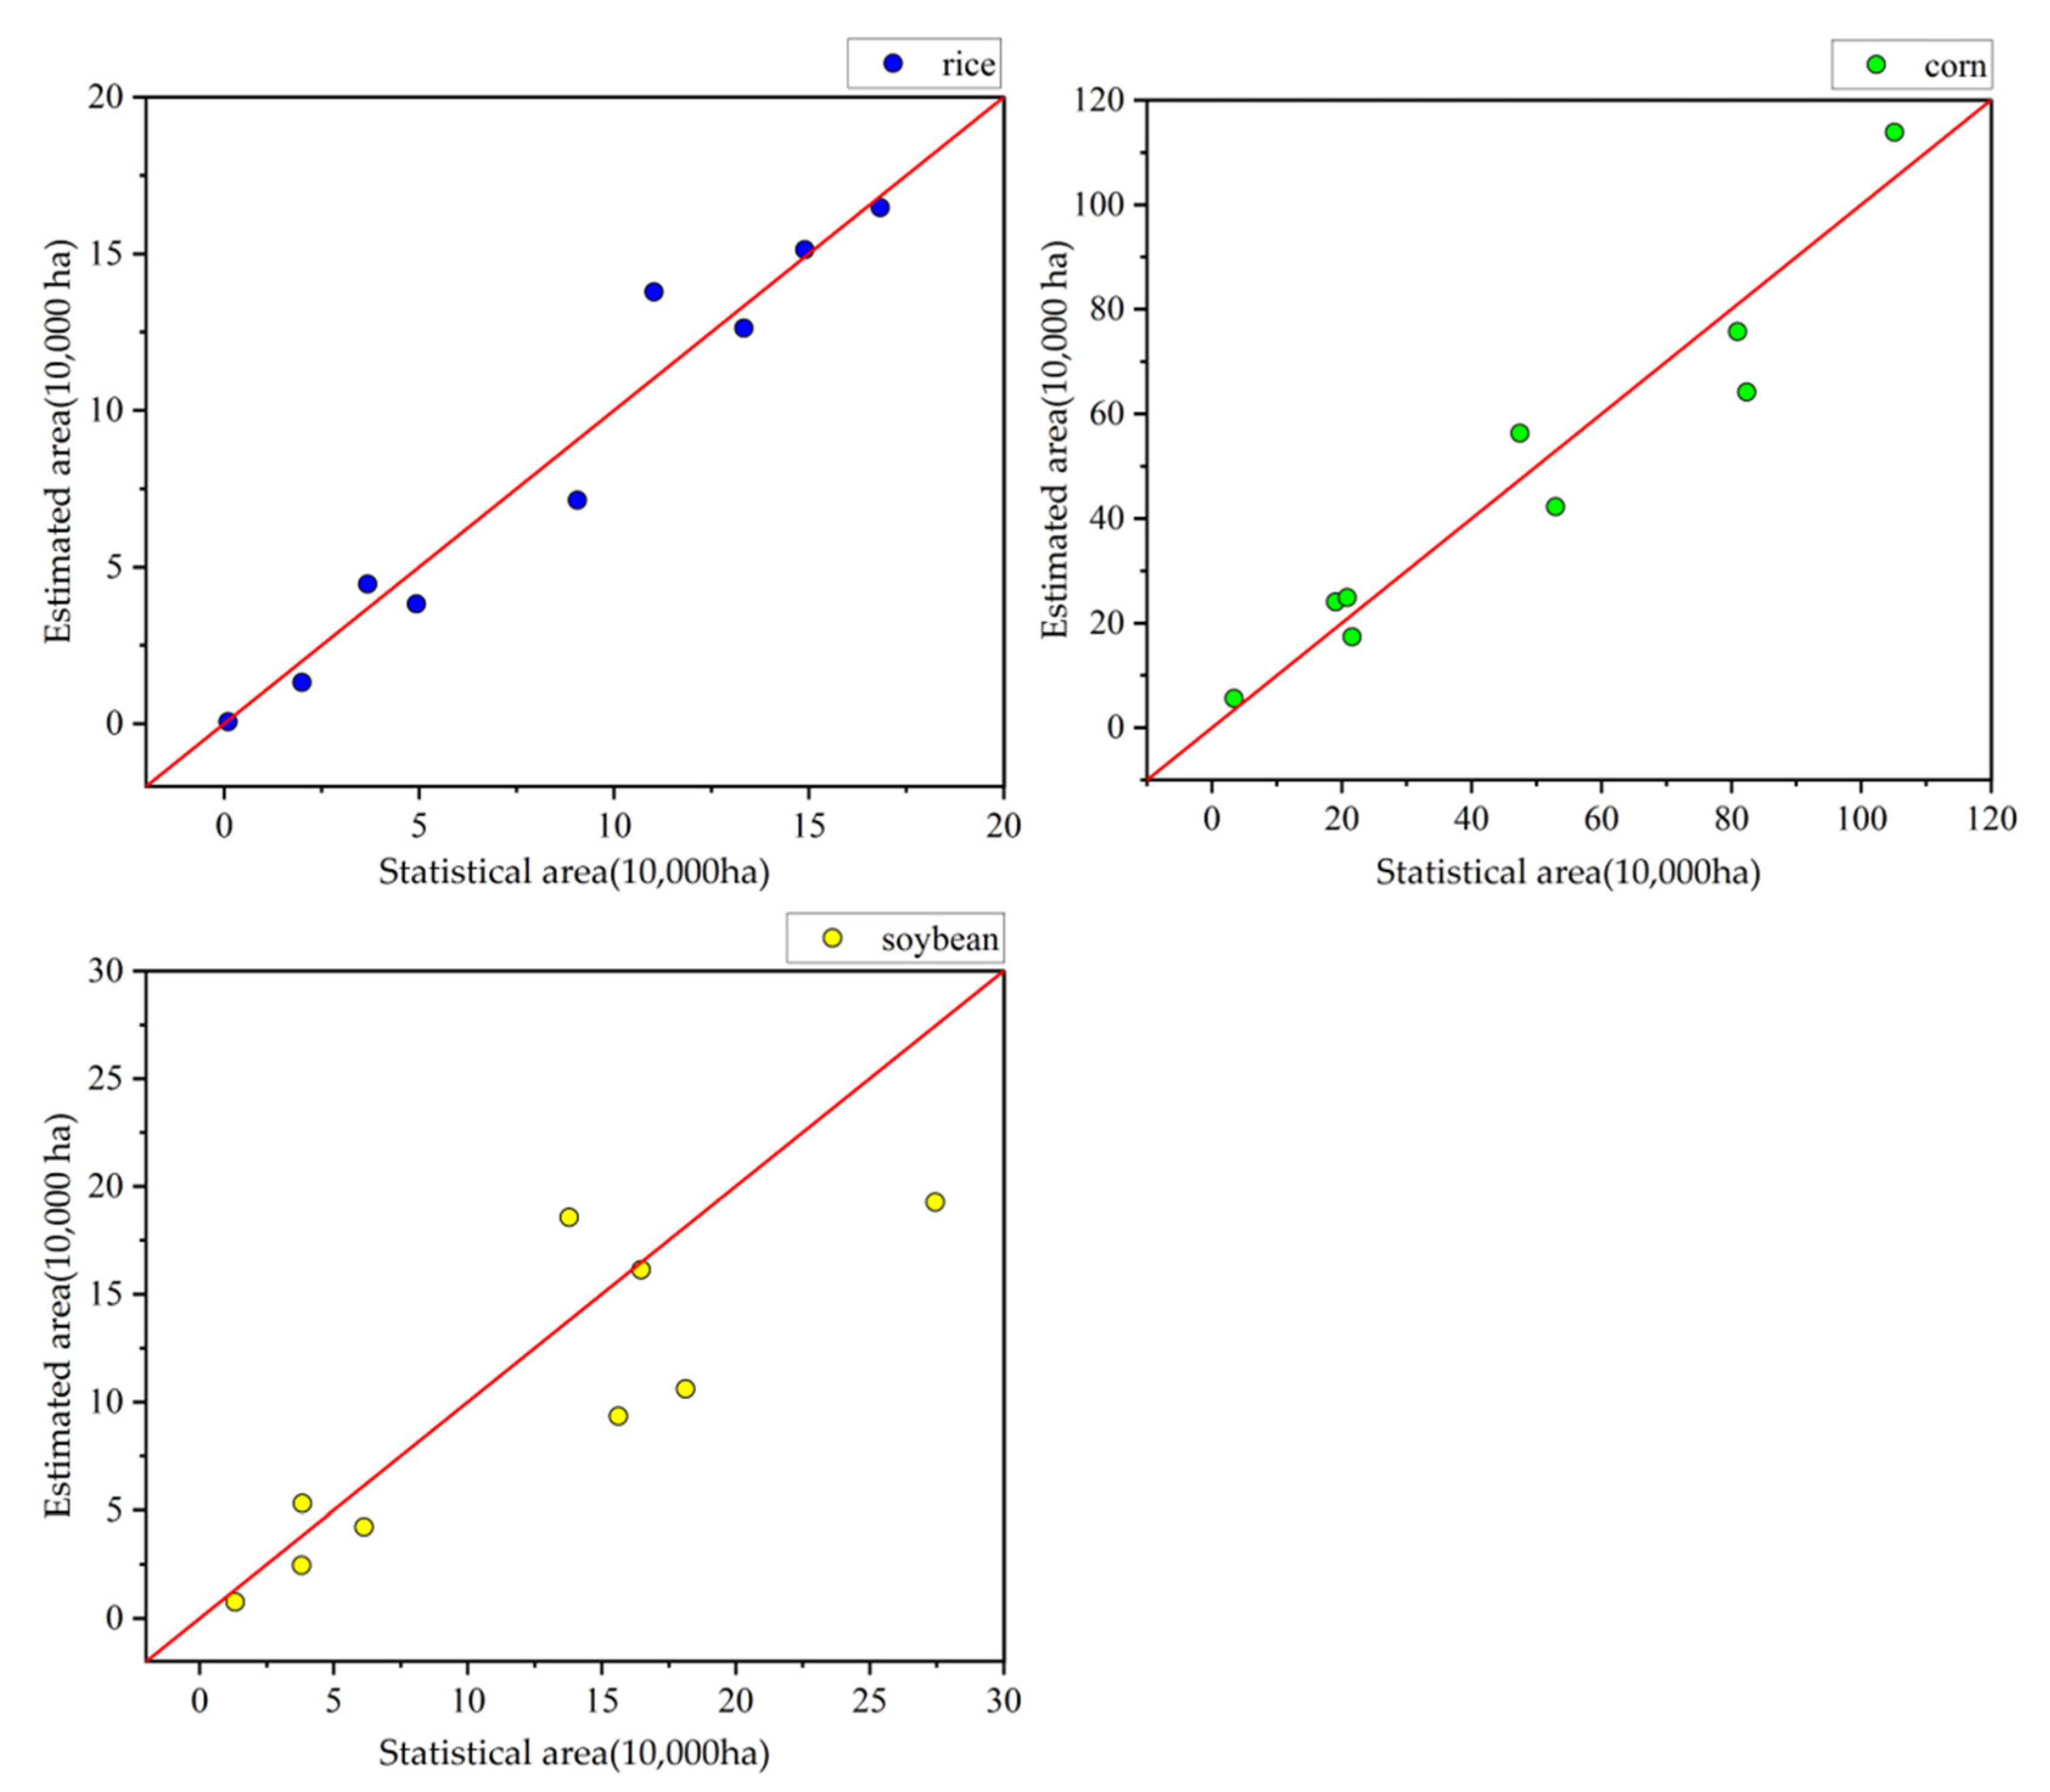
| City | Rice | Corn | Soybean | ||||||
|---|---|---|---|---|---|---|---|---|---|
| Statistical Area | Estimated Area | Relative Error | Statistical Area | Estimated Area | Relative Error | Statistical Area | Estimated Area | Relative Error | |
| ChangChun | 16.83 | 16.47 | −0.02 | 105.11 | 113.84 | 0.08 | 16.47 | 16.13 | −0.02 |
| JiLin | 13.33 | 12.62 | −0.05 | 47.42 | 56.32 | 0.16 | 15.62 | 9.34 | −0.40 |
| SiPing | 4.93 | 3.82 | −0.23 | 80.93 | 75.68 | −0.07 | 3.82 | 5.29 | 0.39 |
| LiaoYuan | 1.99 | 1.32 | −0.34 | 21.56 | 17.34 | −0.24 | 1.32 | 0.75 | −0.43 |
| TongHua | 9.06 | 7.13 | −0.21 | 19.04 | 24.08 | 0.21 | 6.13 | 4.22 | −0.31 |
| BaiShan | 0.10 | 0.05 | −0.50 | 3.43 | 5.60 | 0.39 | 3.79 | 2.46 | −0.35 |
| SongYuan | 11.03 | 13.78 | 0.25 | 82.38 | 64.13 | −0.28 | 13.78 | 18.55 | 0.35 |
| BaiCheng | 14.89 | 15.13 | 0.02 | 52.90 | 42.23 | −0.25 | 18.13 | 10.60 | −0.42 |
| YanBian | 3.68 | 4.45 | 0.21 | 20.82 | 24.87 | 0.16 | 27.45 | 19.26 | −0.30 |
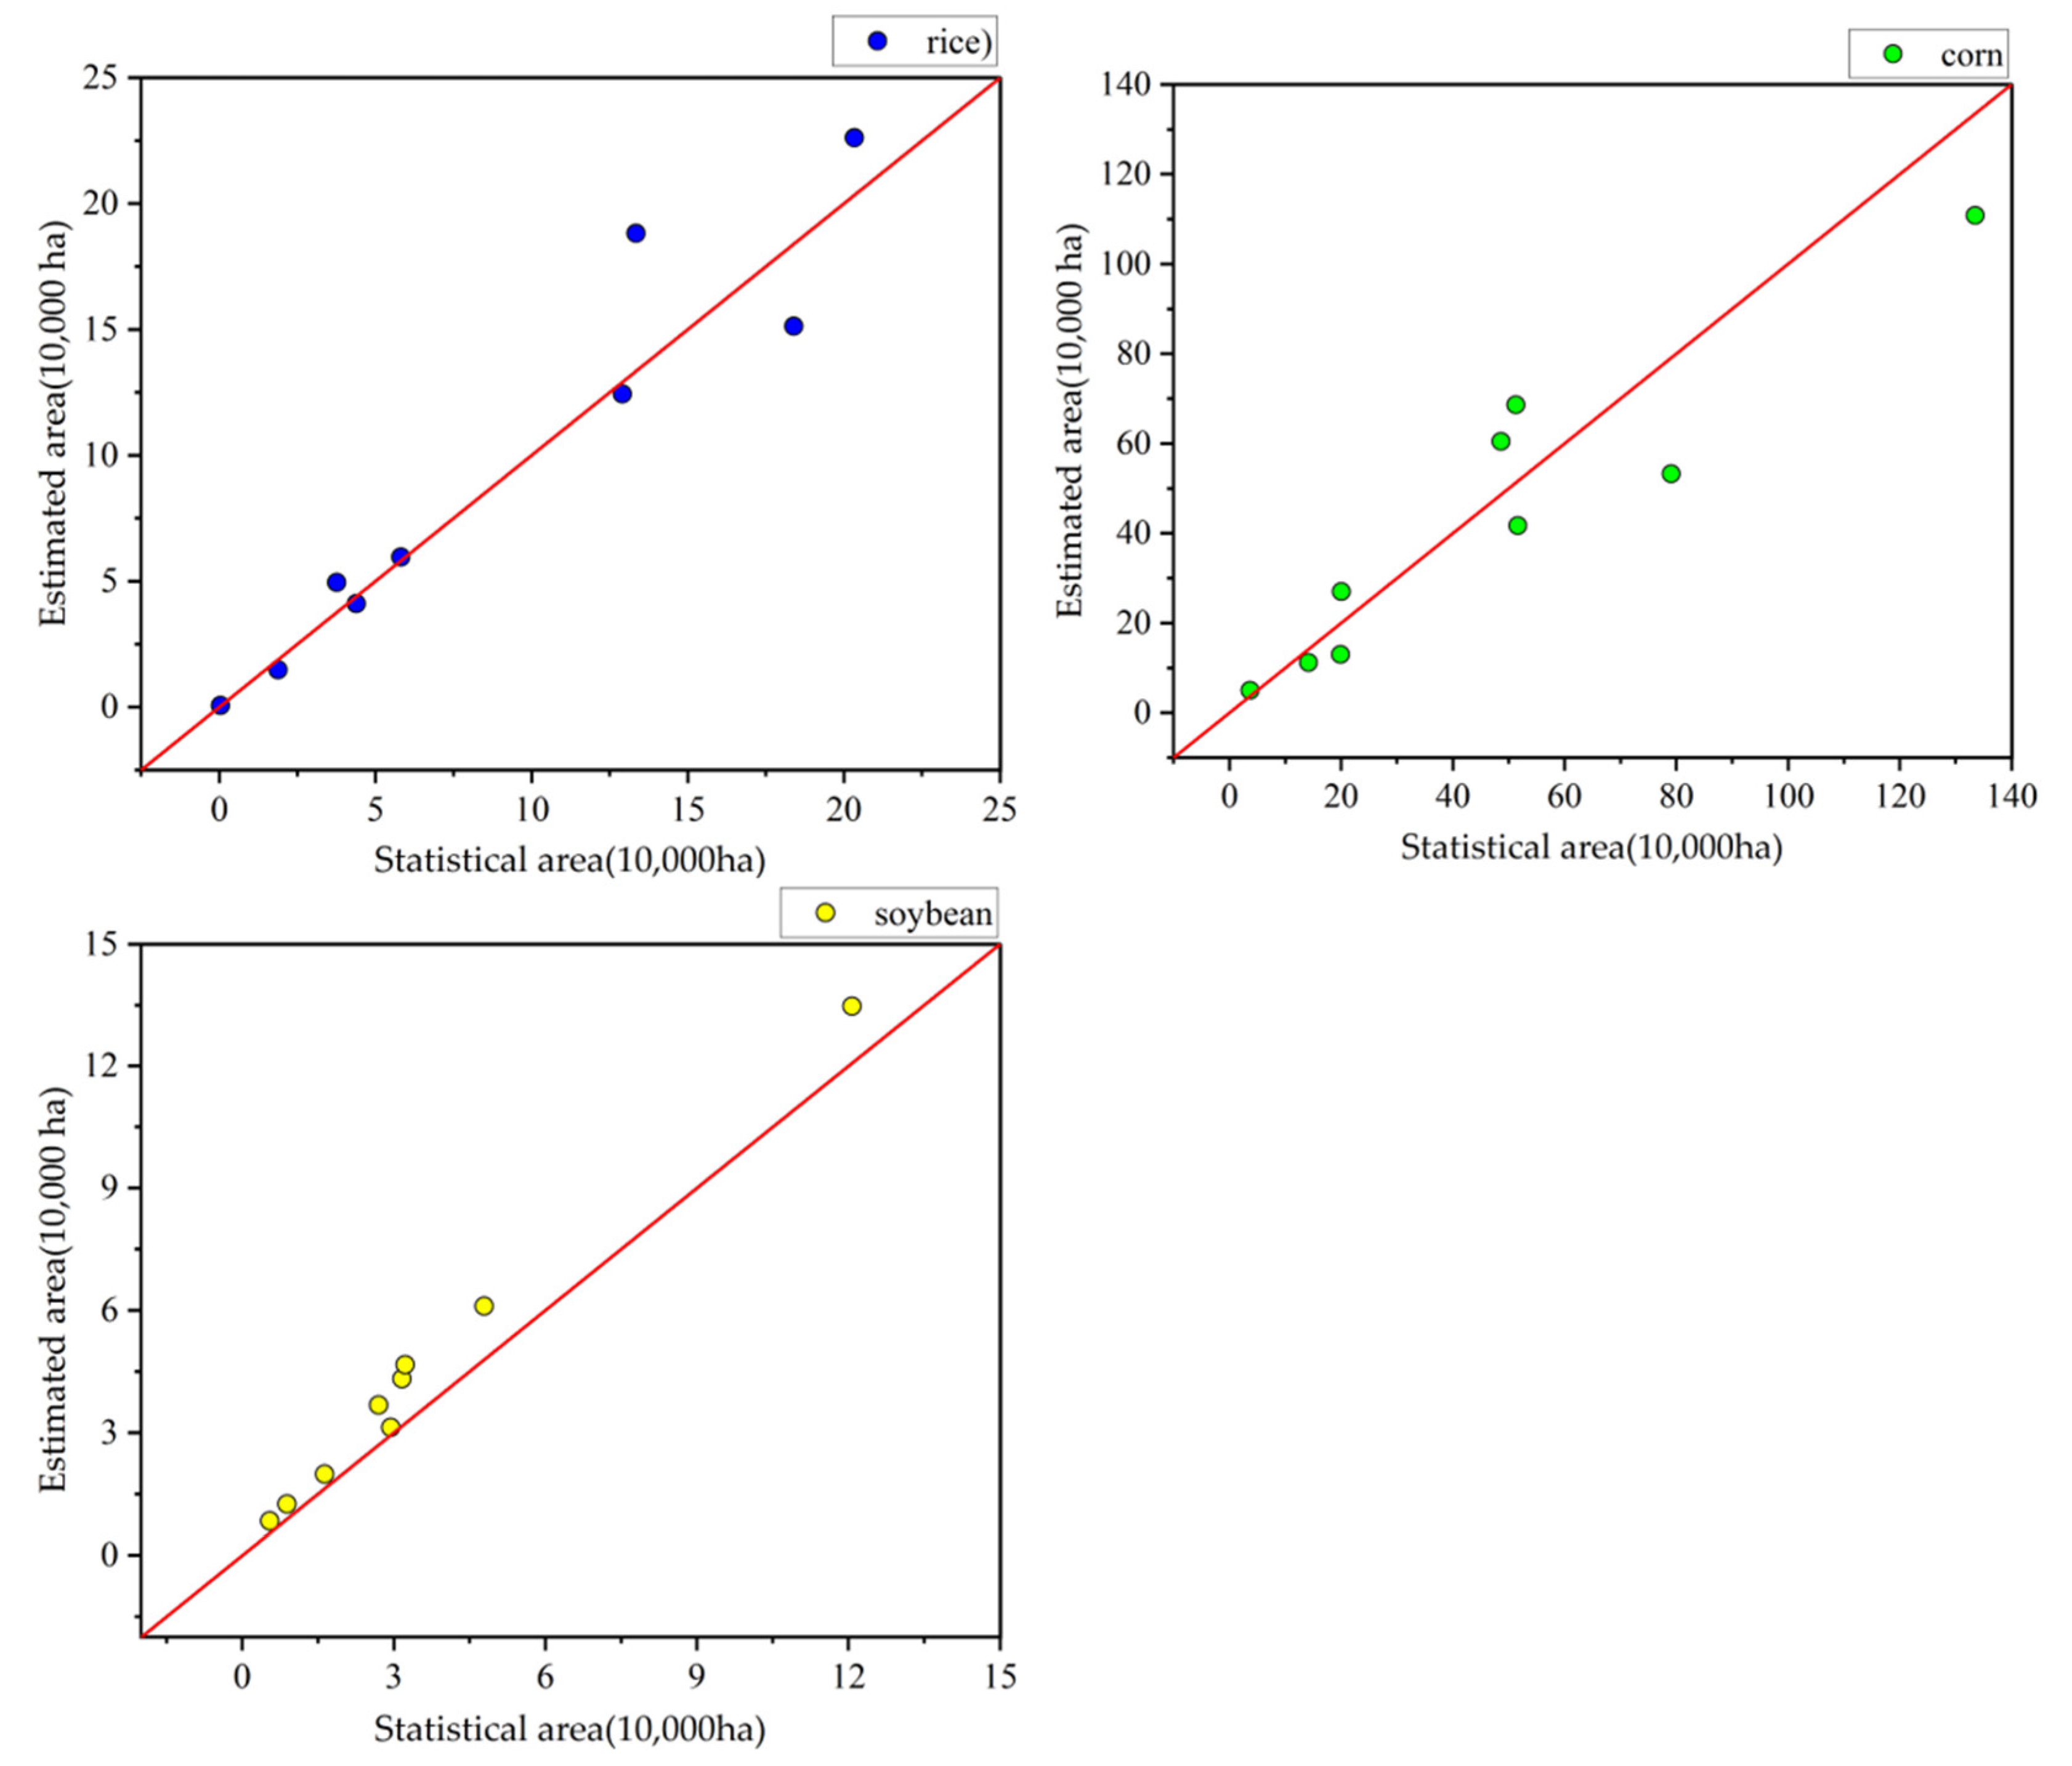
| City | Rice | Corn | Soybean | ||||||
|---|---|---|---|---|---|---|---|---|---|
| Statistical Area | Estimated Area | Relative Error | Statistical Area | Estimated Area | Relative Error | Statistical Area | Estimated Area | Relative Error | |
| ChanChun | 18.39 | 15.12 | −0.18 | 133.48 | 110.77 | −0.17 | 2.70 | 3.68 | 0.36 |
| JiLin | 13.34 | 14.81 | 0.11 | 48.61 | 60.49 | 0.24 | 3.16 | 4.32 | 0.37 |
| SiPing | 4.38 | 4.11 | −0.06 | 51.27 | 68.57 | 0.34 | 1.63 | 1.98 | 0.21 |
| LiaoYuan | 1.88 | 1.48 | −0.21 | 19.91 | 12.95 | −0.35 | 0.54 | 0.84 | 0.55 |
| TongHua | 5.81 | 5.95 | 0.02 | 14.12 | 11.21 | −0.21 | 0.88 | 1.25 | 0.42 |
| BaiShan | 0.04 | 0.05 | 0.33 | 3.69 | 5.02 | 0.36 | 2.94 | 3.13 | 0.06 |
| SongYuan | 12.91 | 12.43 | −0.04 | 79.09 | 53.25 | −0.33 | 4.79 | 6.10 | 0.27 |
| BaiCheng | 20.34 | 22.61 | 0.11 | 51.62 | 41.67 | −0.19 | 3.22 | 4.67 | 0.45 |
| YanBian | 3.75 | 4.94 | 0.32 | 20.01 | 27.02 | 0.35 | 12.07 | 13.47 | 0.12 |
Publisher’s Note: MDPI stays neutral with regard to jurisdictional claims in published maps and institutional affiliations. |
© 2022 by the authors. Licensee MDPI, Basel, Switzerland. This article is an open access article distributed under the terms and conditions of the Creative Commons Attribution (CC BY) license (https://creativecommons.org/licenses/by/4.0/).
Share and Cite
Zhi, F.; Dong, Z.; Guga, S.; Bao, Y.; Han, A.; Zhang, J.; Bao, Y. Rapid and Automated Mapping of Crop Type in Jilin Province Using Historical Crop Labels and the Google Earth Engine. Remote Sens. 2022, 14, 4028. https://doi.org/10.3390/rs14164028
Zhi F, Dong Z, Guga S, Bao Y, Han A, Zhang J, Bao Y. Rapid and Automated Mapping of Crop Type in Jilin Province Using Historical Crop Labels and the Google Earth Engine. Remote Sensing. 2022; 14(16):4028. https://doi.org/10.3390/rs14164028
Chicago/Turabian StyleZhi, Feng, Zhenhua Dong, Suri Guga, Yongbin Bao, Aru Han, Jiquan Zhang, and Yulong Bao. 2022. "Rapid and Automated Mapping of Crop Type in Jilin Province Using Historical Crop Labels and the Google Earth Engine" Remote Sensing 14, no. 16: 4028. https://doi.org/10.3390/rs14164028
APA StyleZhi, F., Dong, Z., Guga, S., Bao, Y., Han, A., Zhang, J., & Bao, Y. (2022). Rapid and Automated Mapping of Crop Type in Jilin Province Using Historical Crop Labels and the Google Earth Engine. Remote Sensing, 14(16), 4028. https://doi.org/10.3390/rs14164028