
Monitoring Mass Variations in Iraq Using Time-Variable Gravity Data


Abstract
:1. Introduction
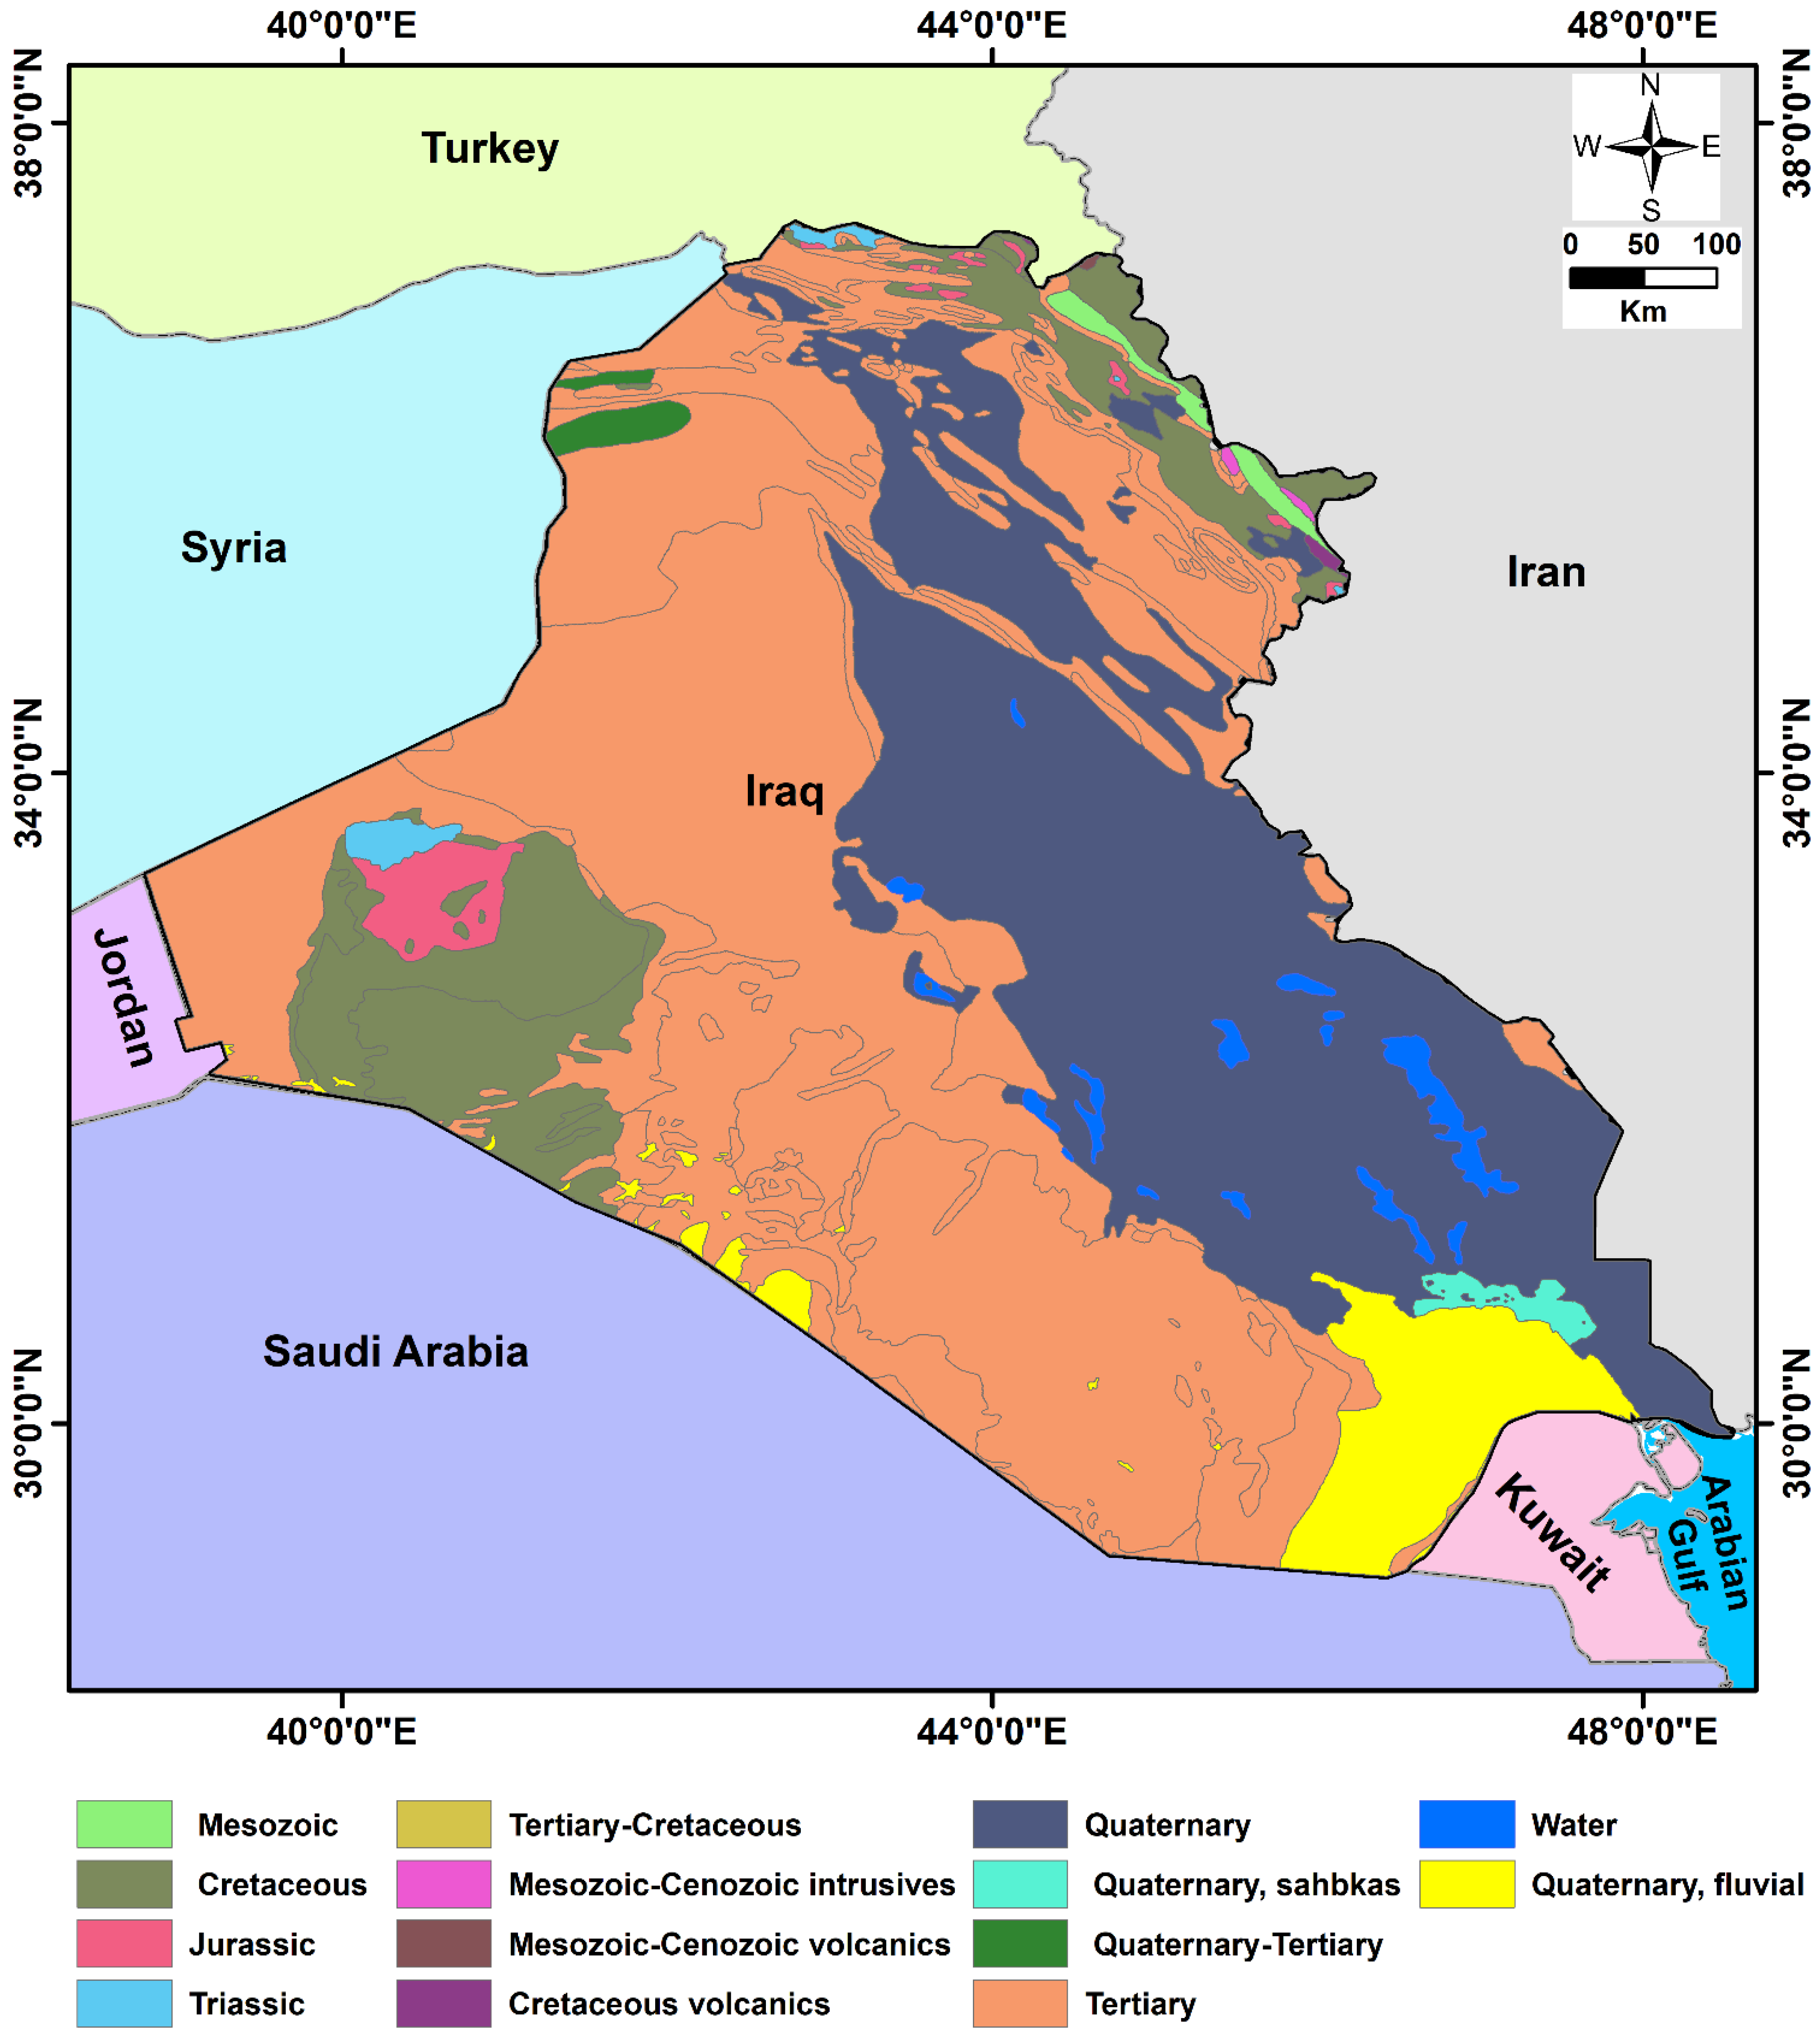
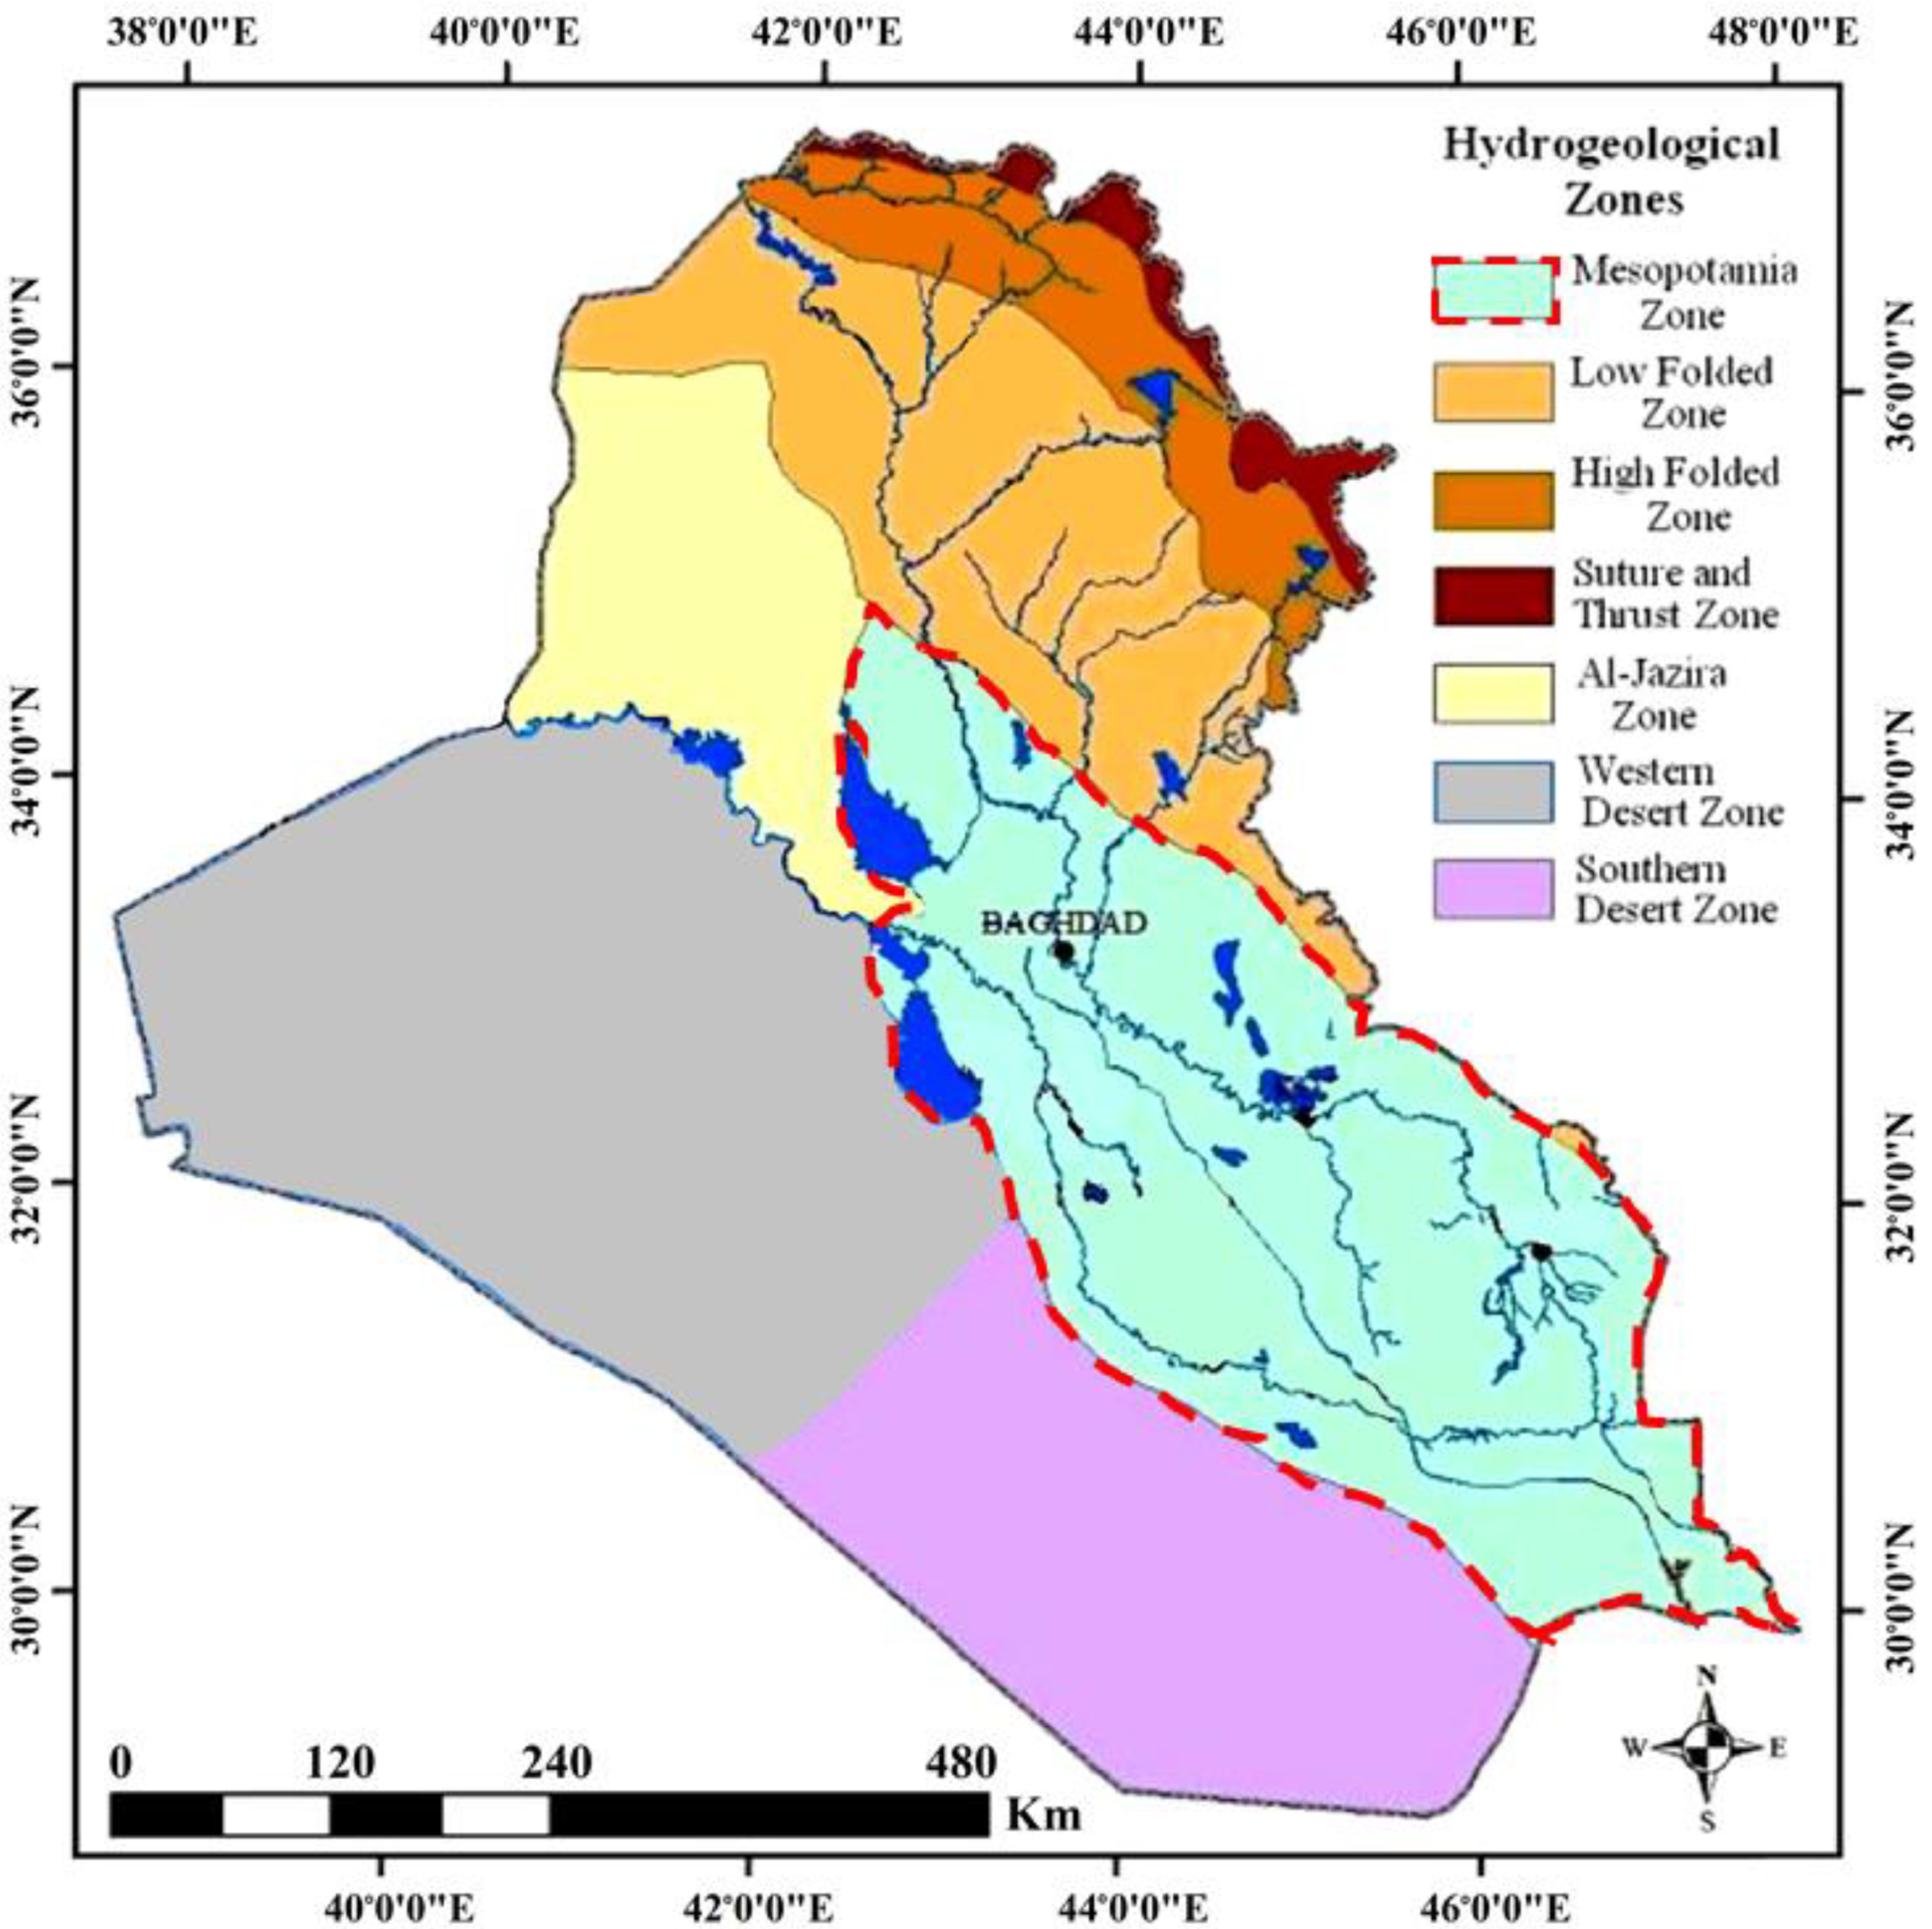
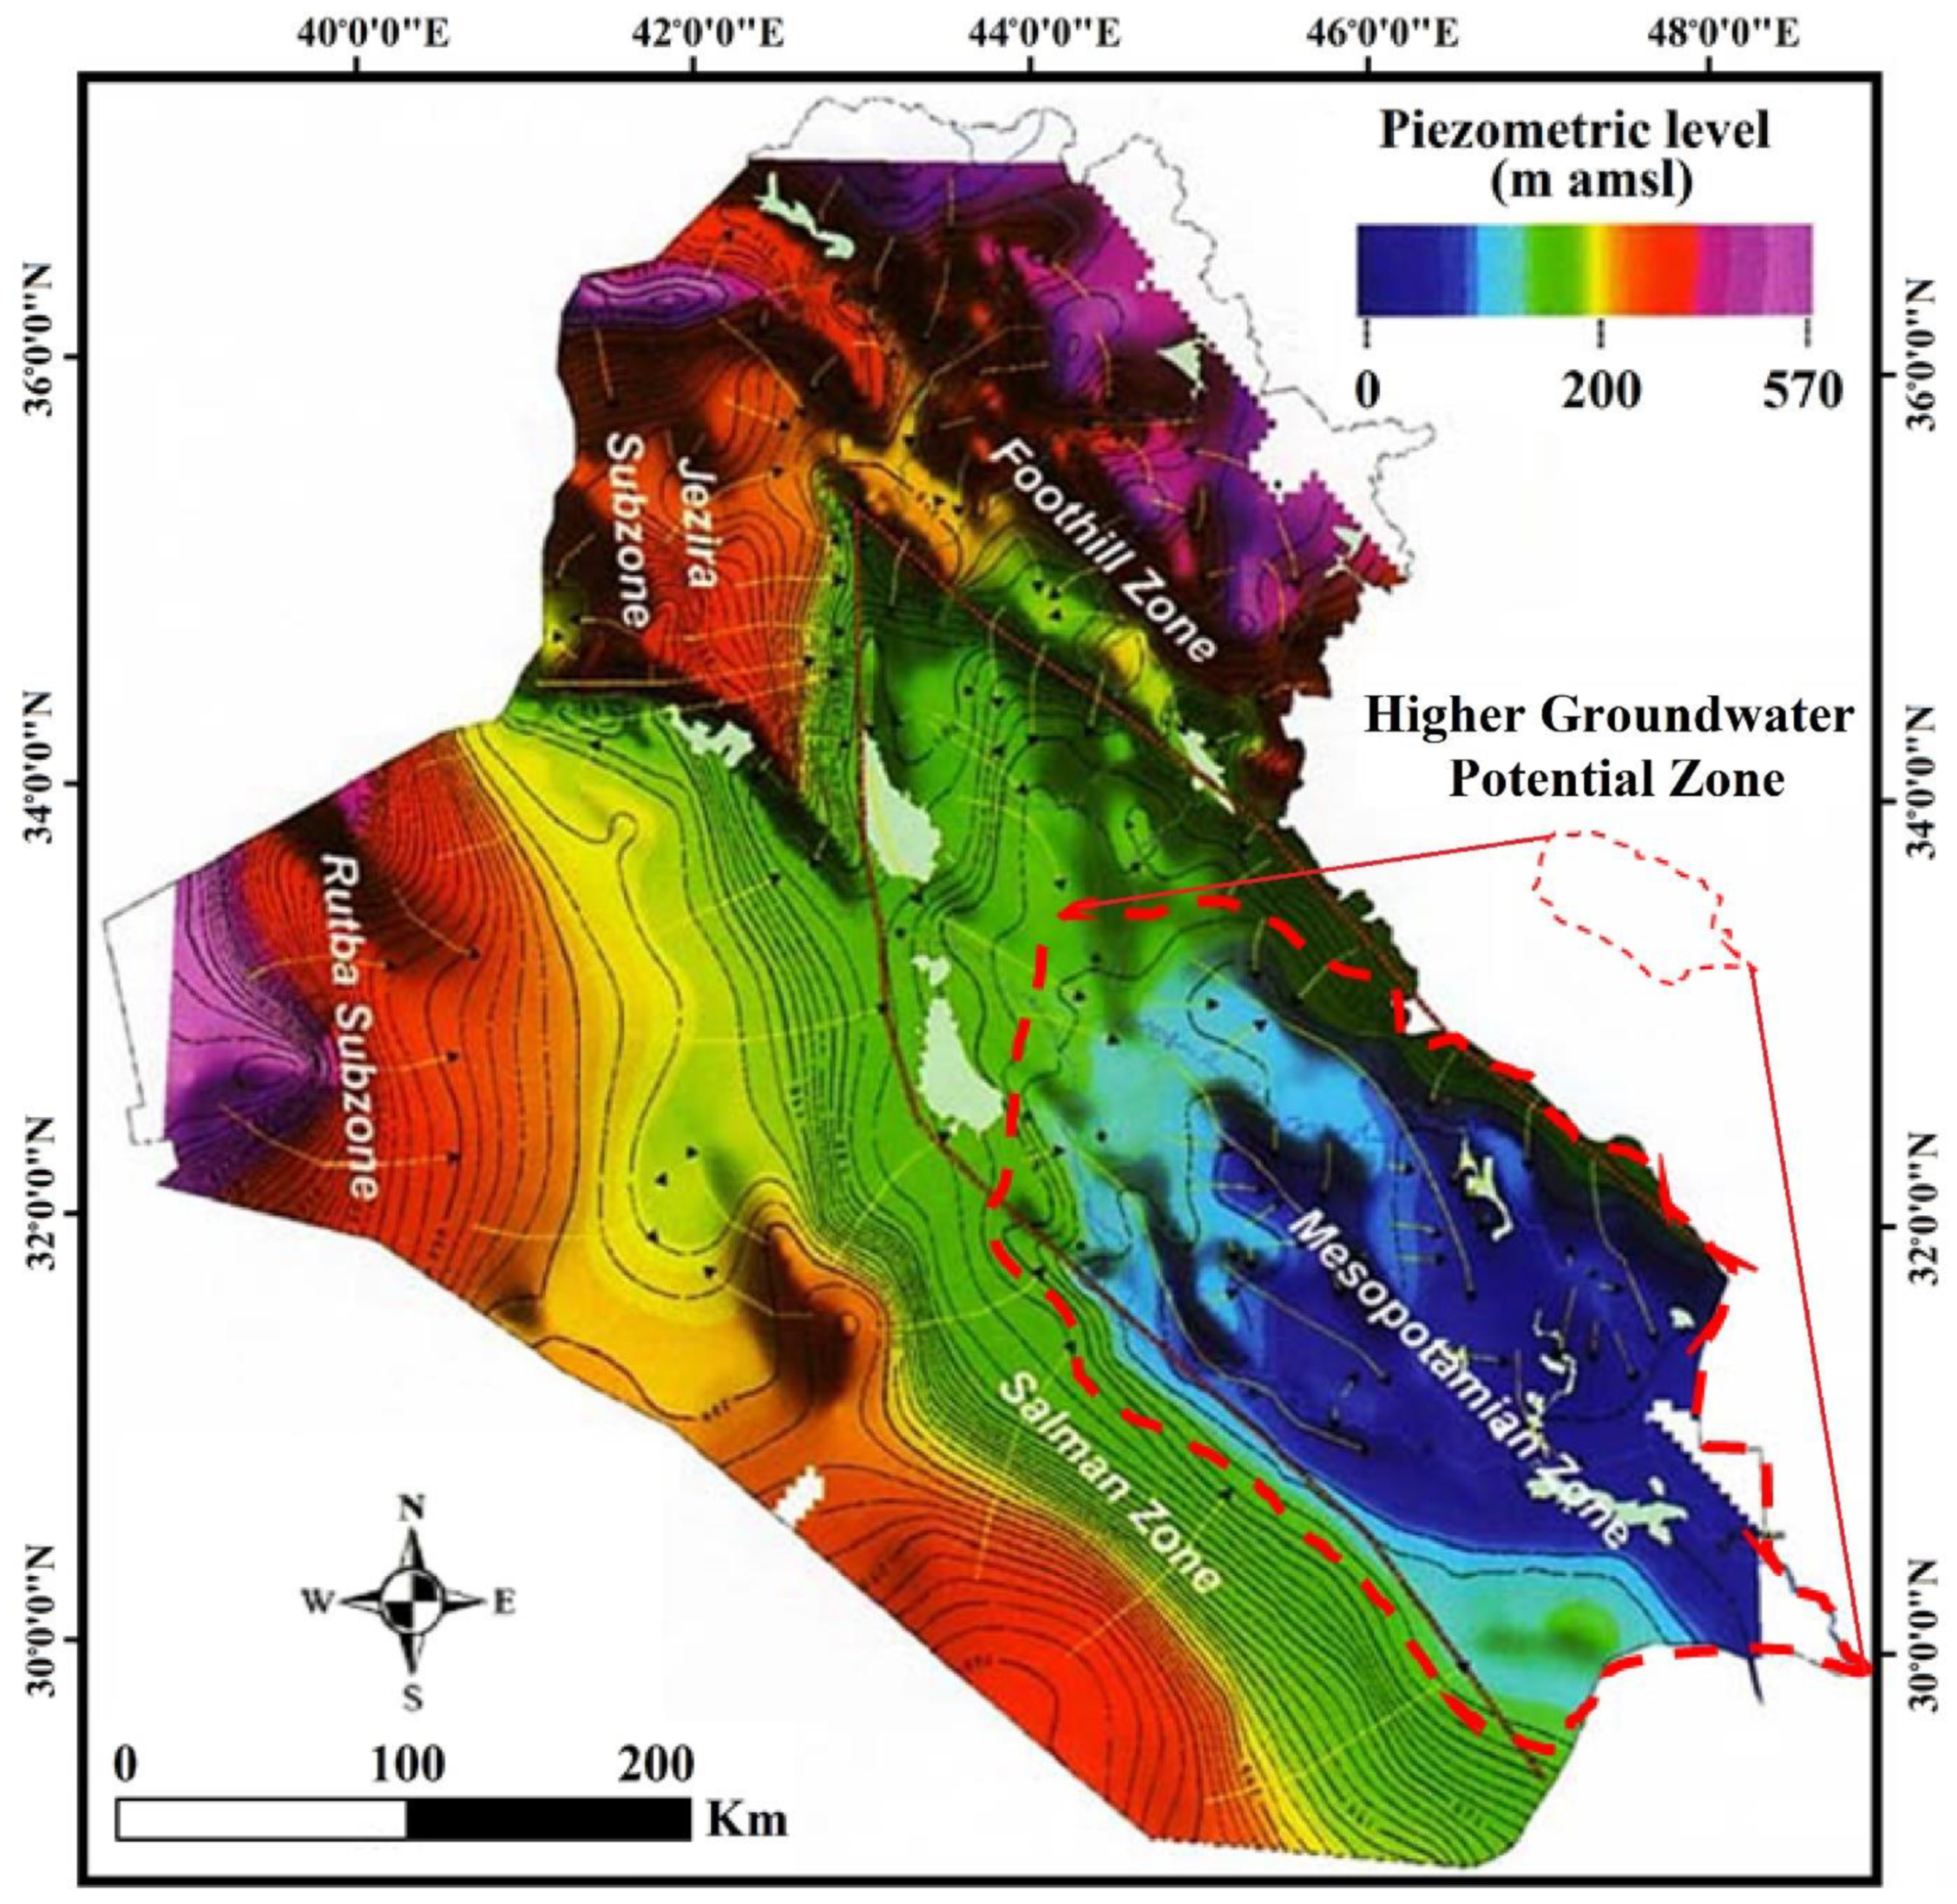
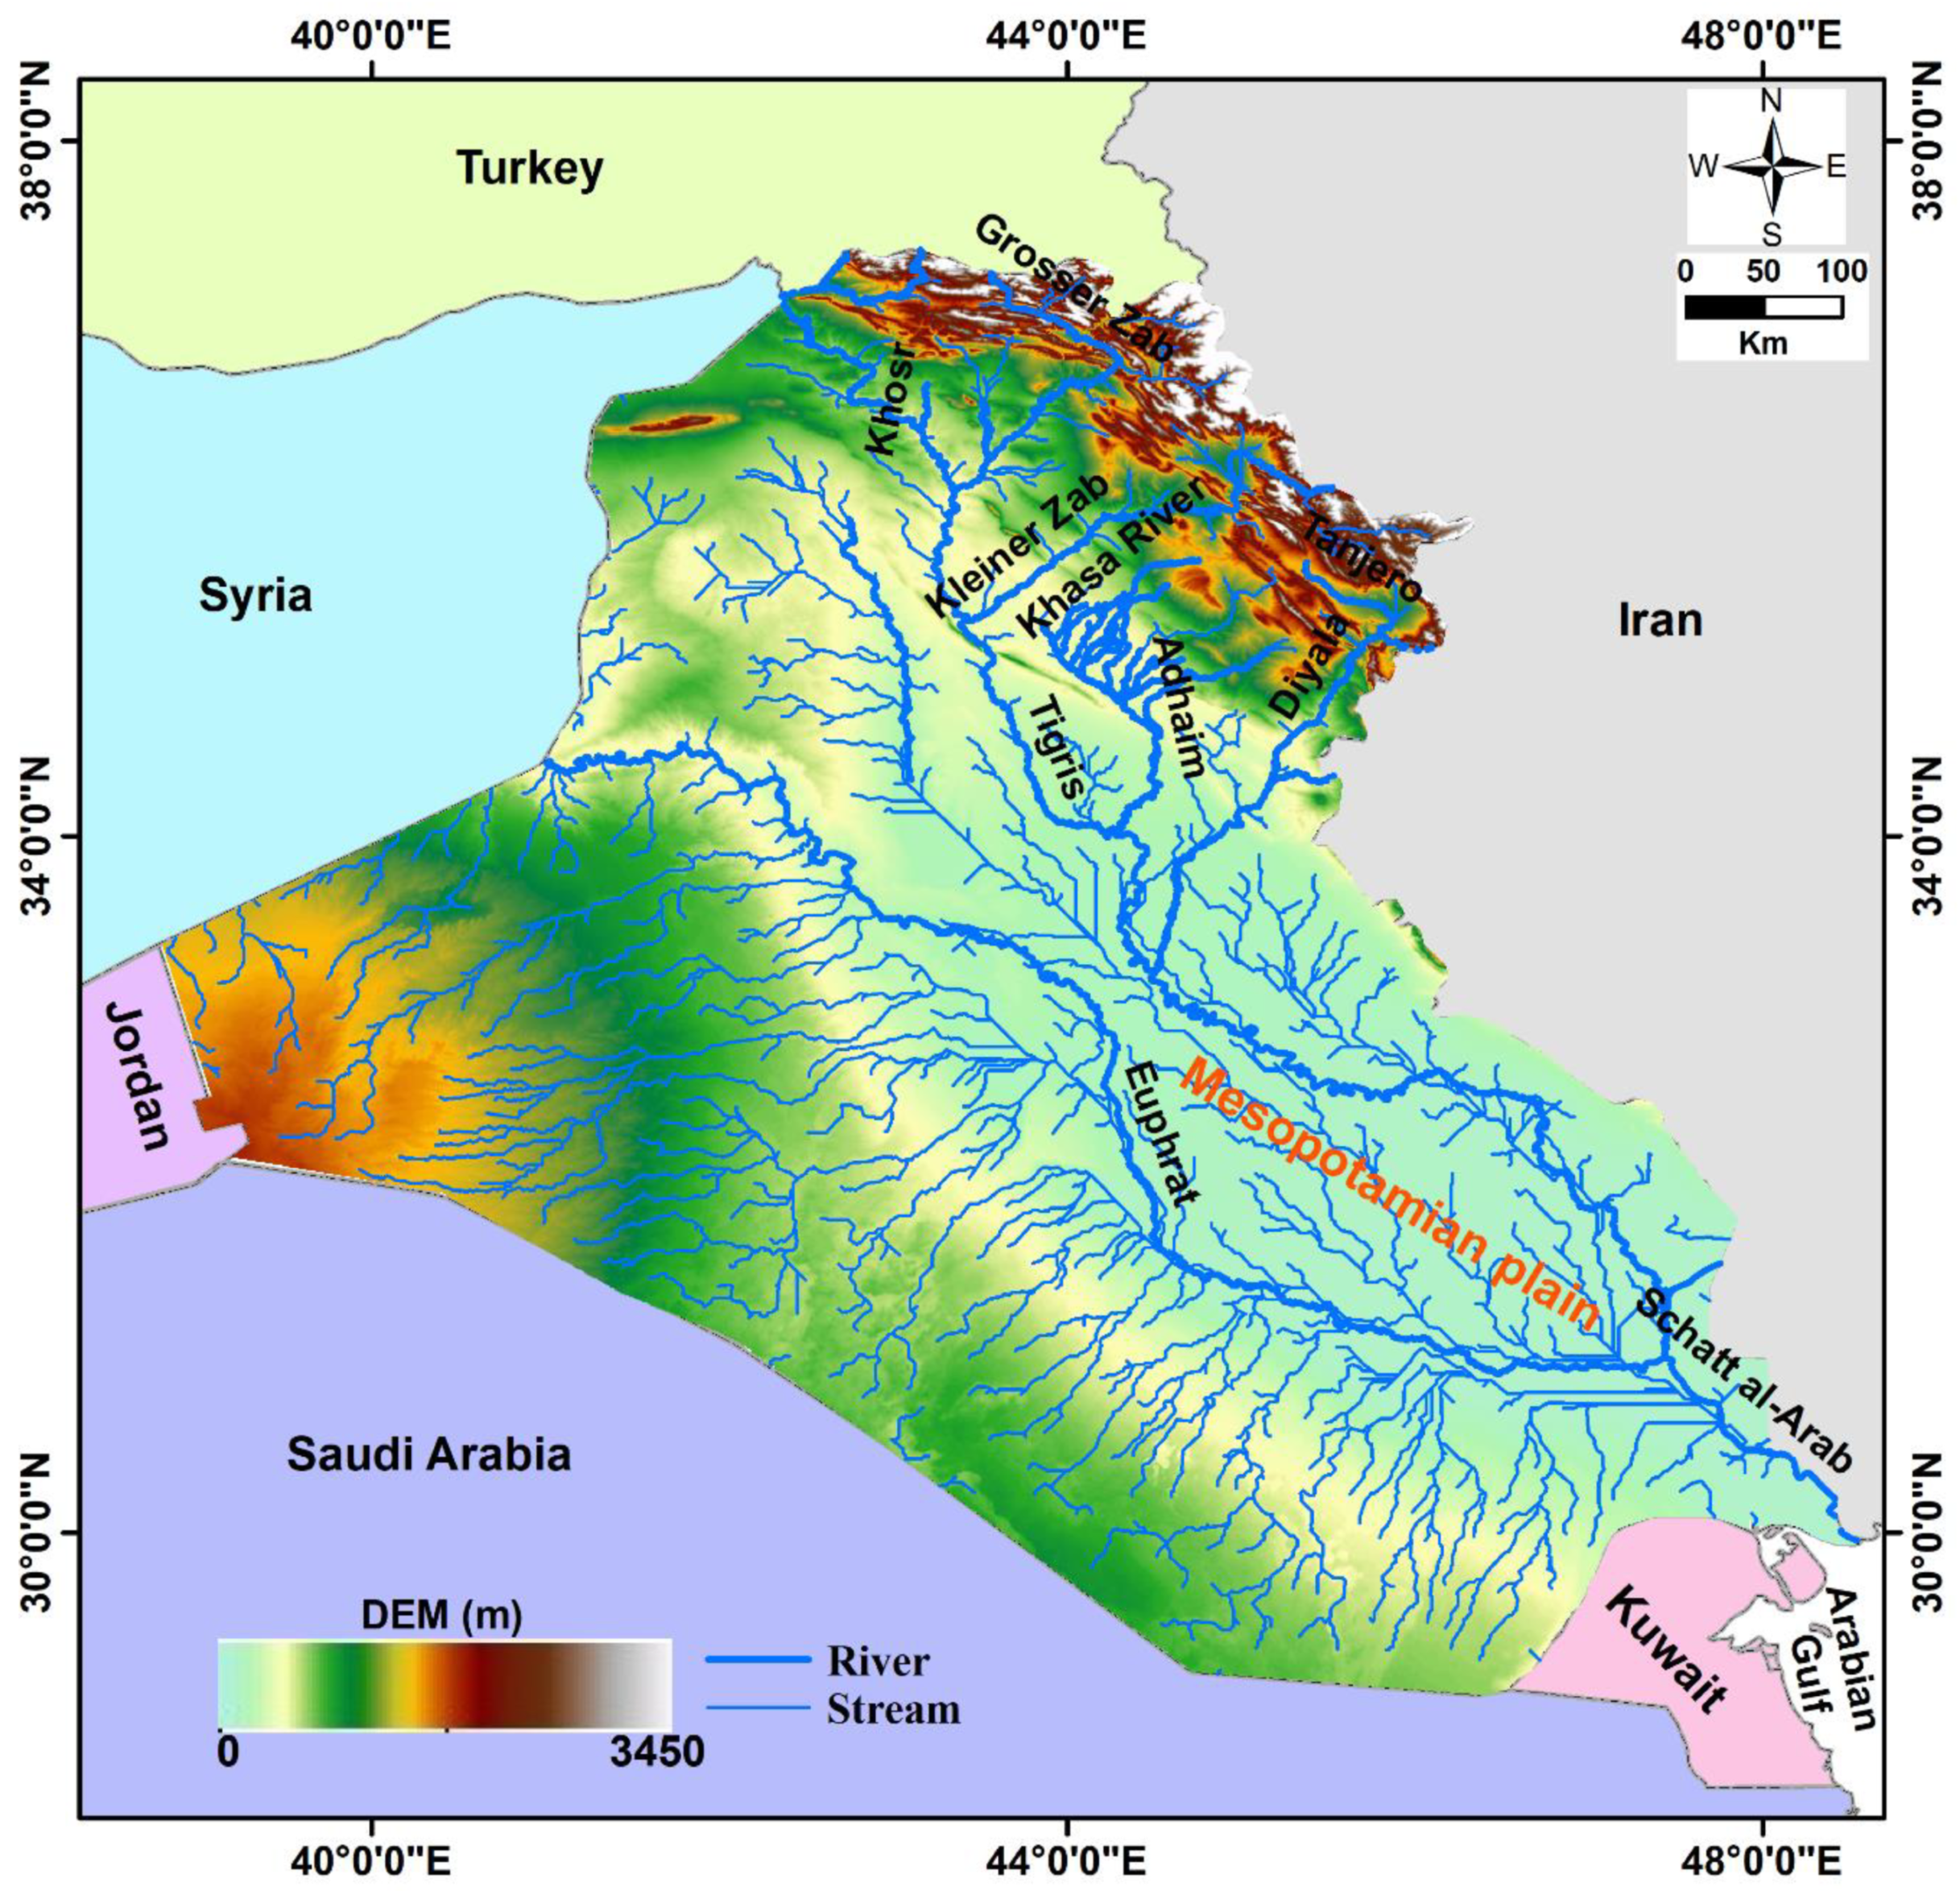
2. Geological and Hydrogeological Setting
3. Data and Methodology
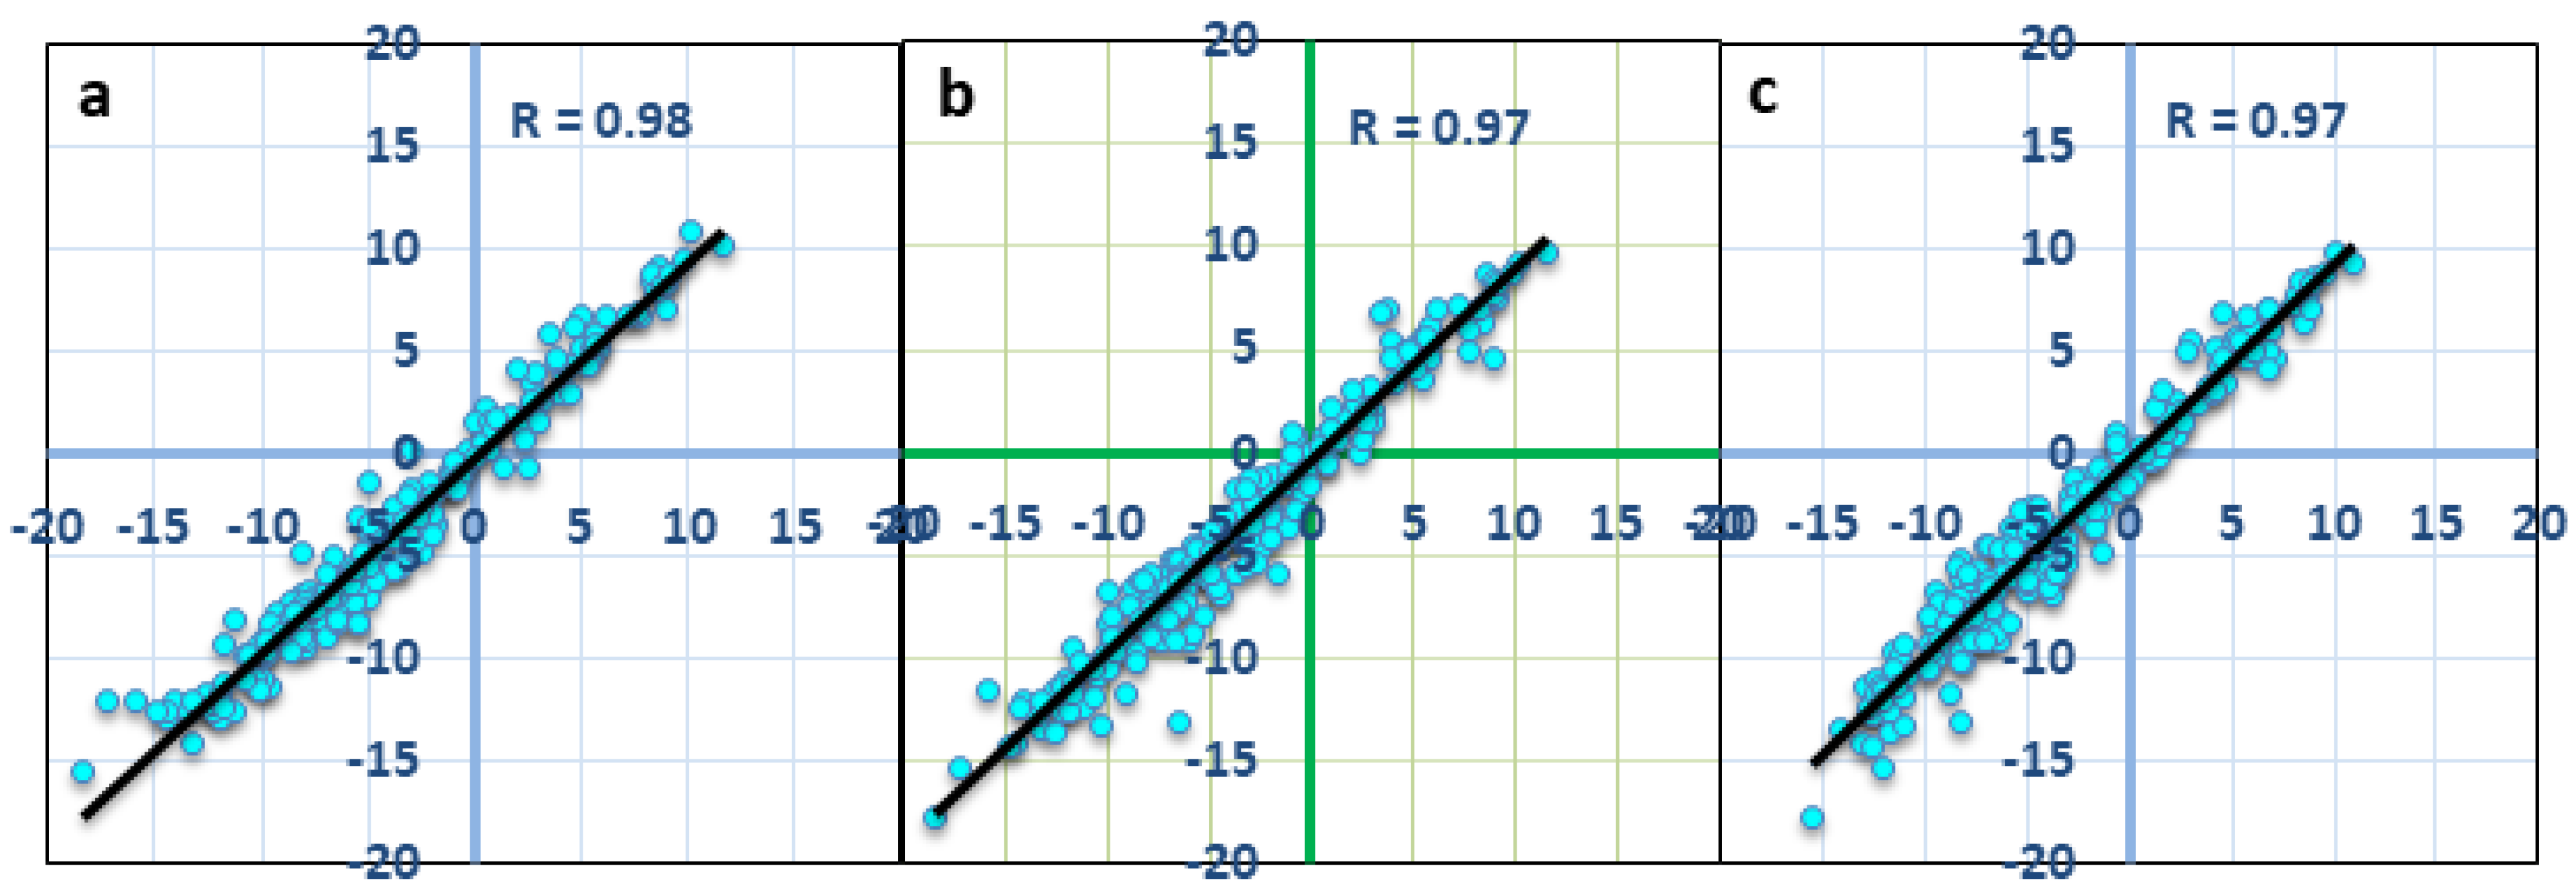
3.1. GRACE Data
3.2. GLDAS and TRMM Data
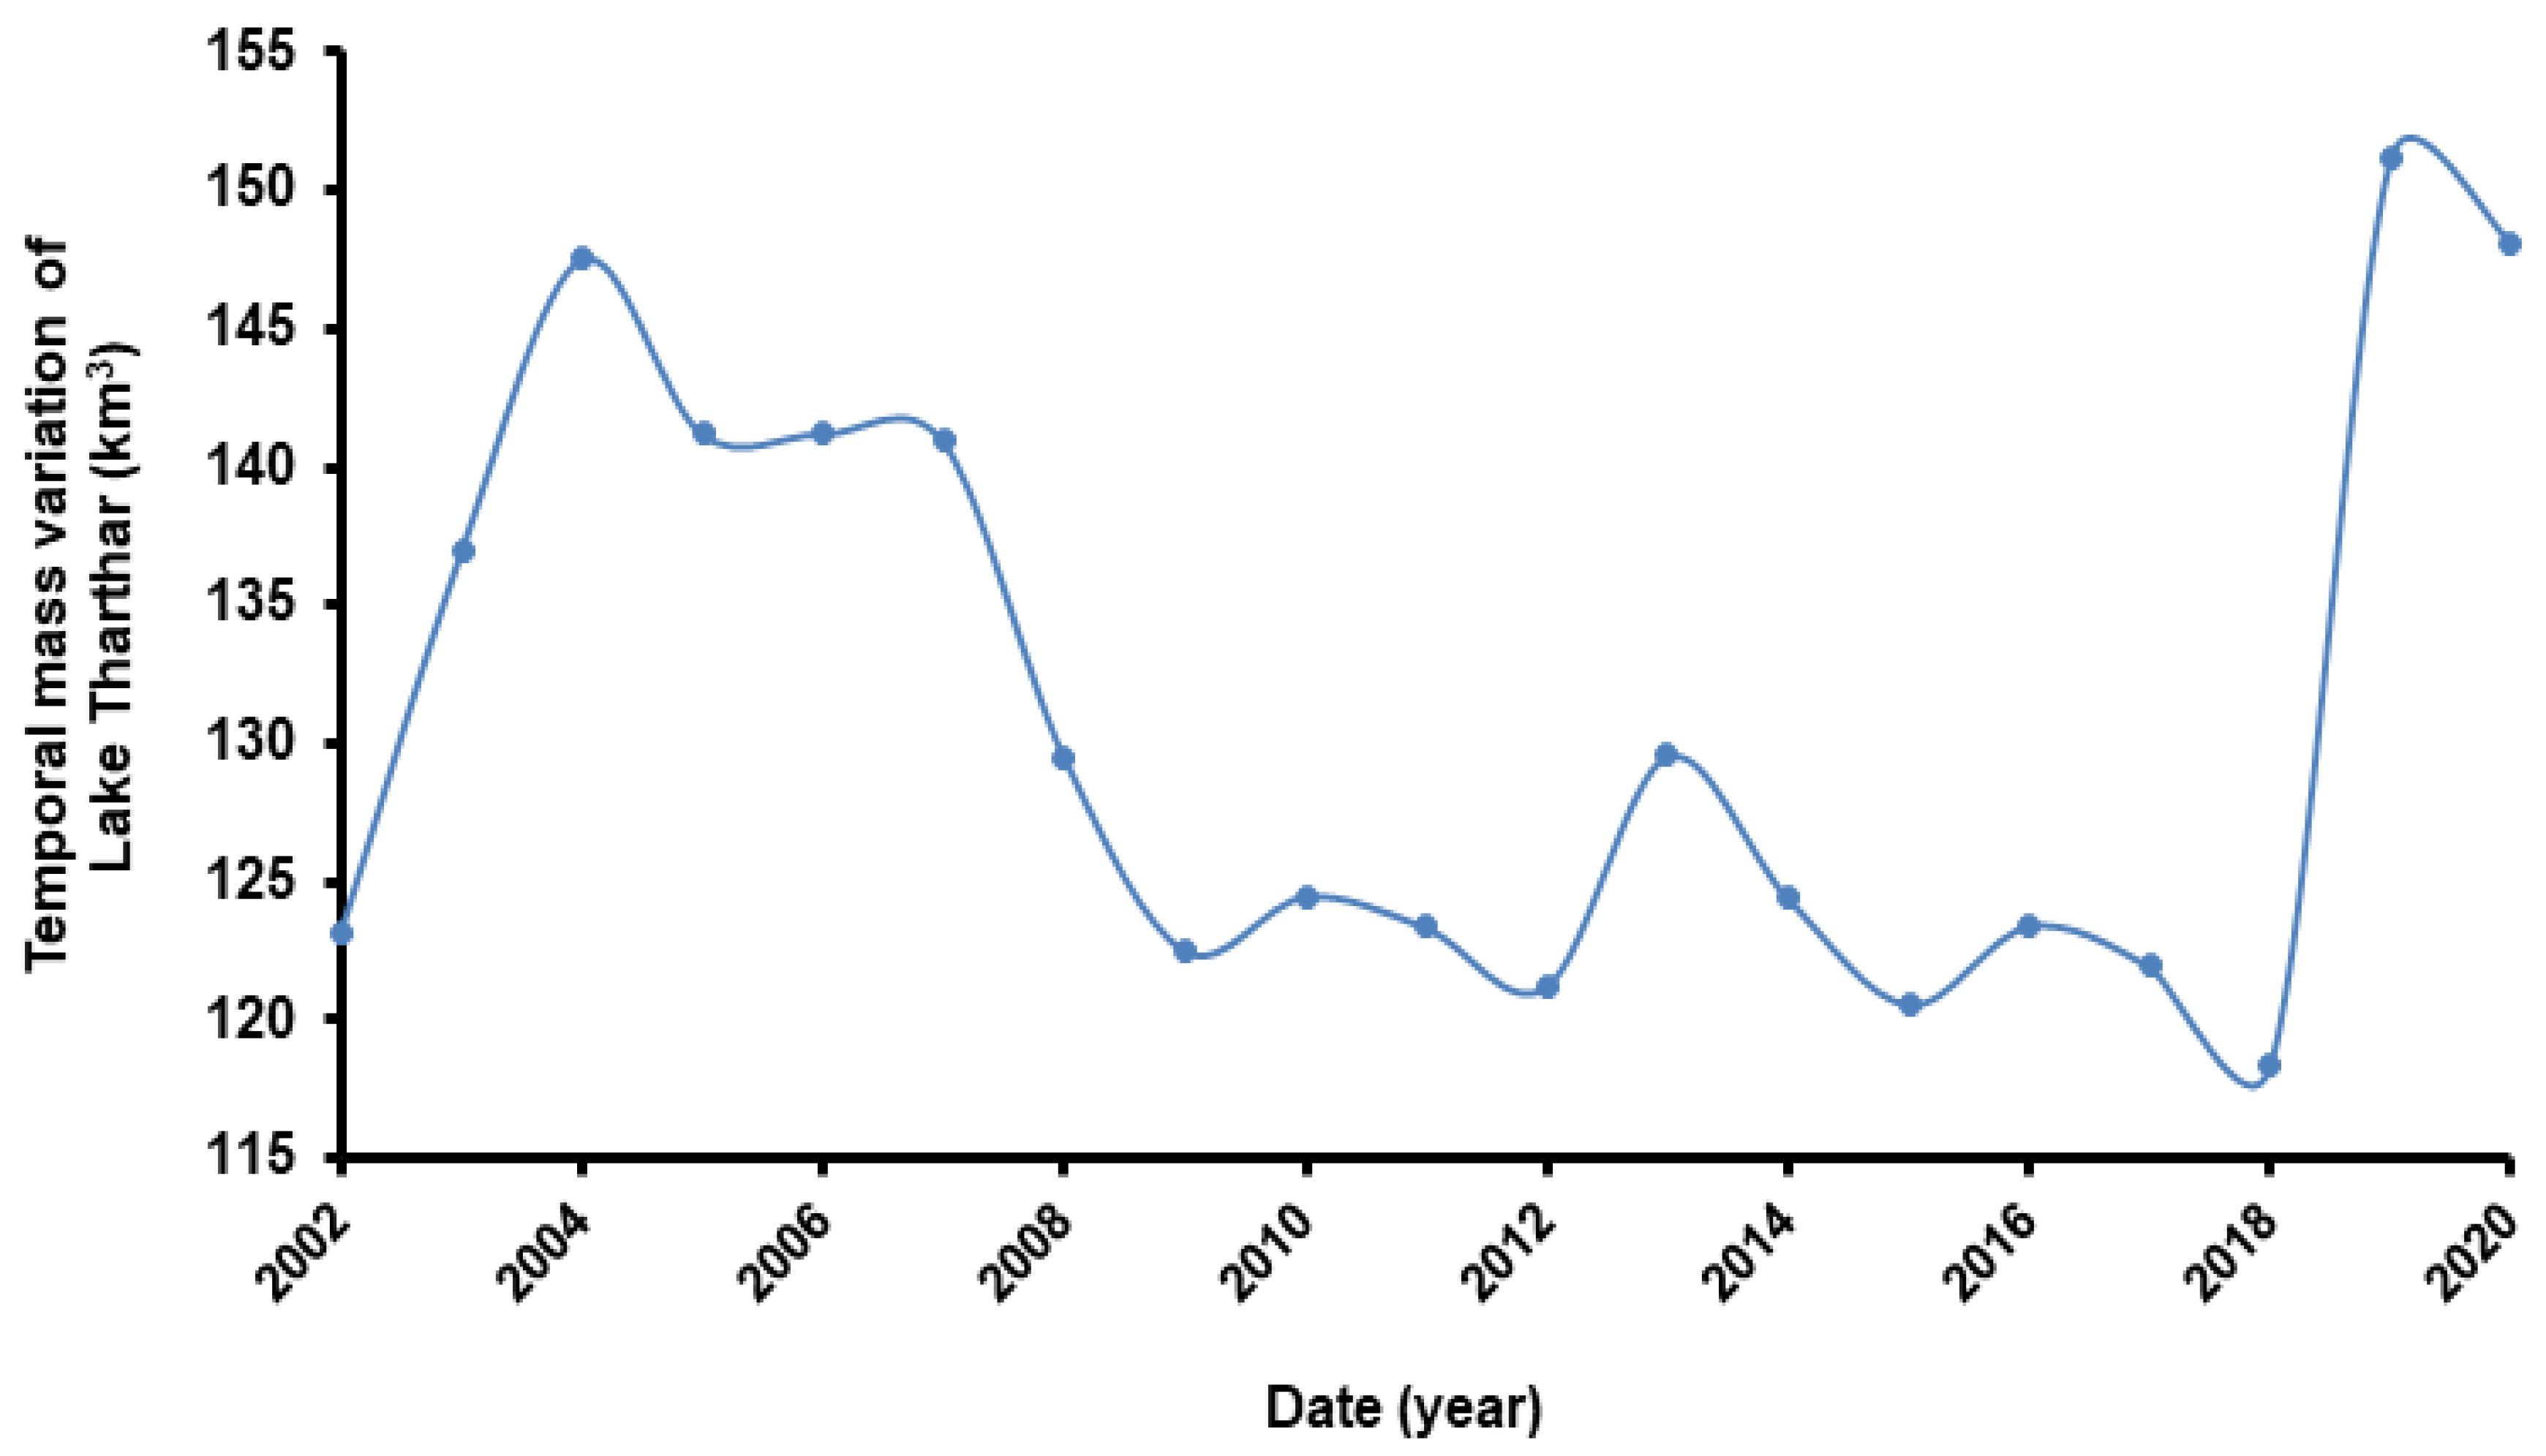
3.3. Temporal Variations in Surface Water Storage
4. Results
5. Discussion
5.1. Identification of Time-Periods
5.2. Water Budget
5.3. Stream Networks
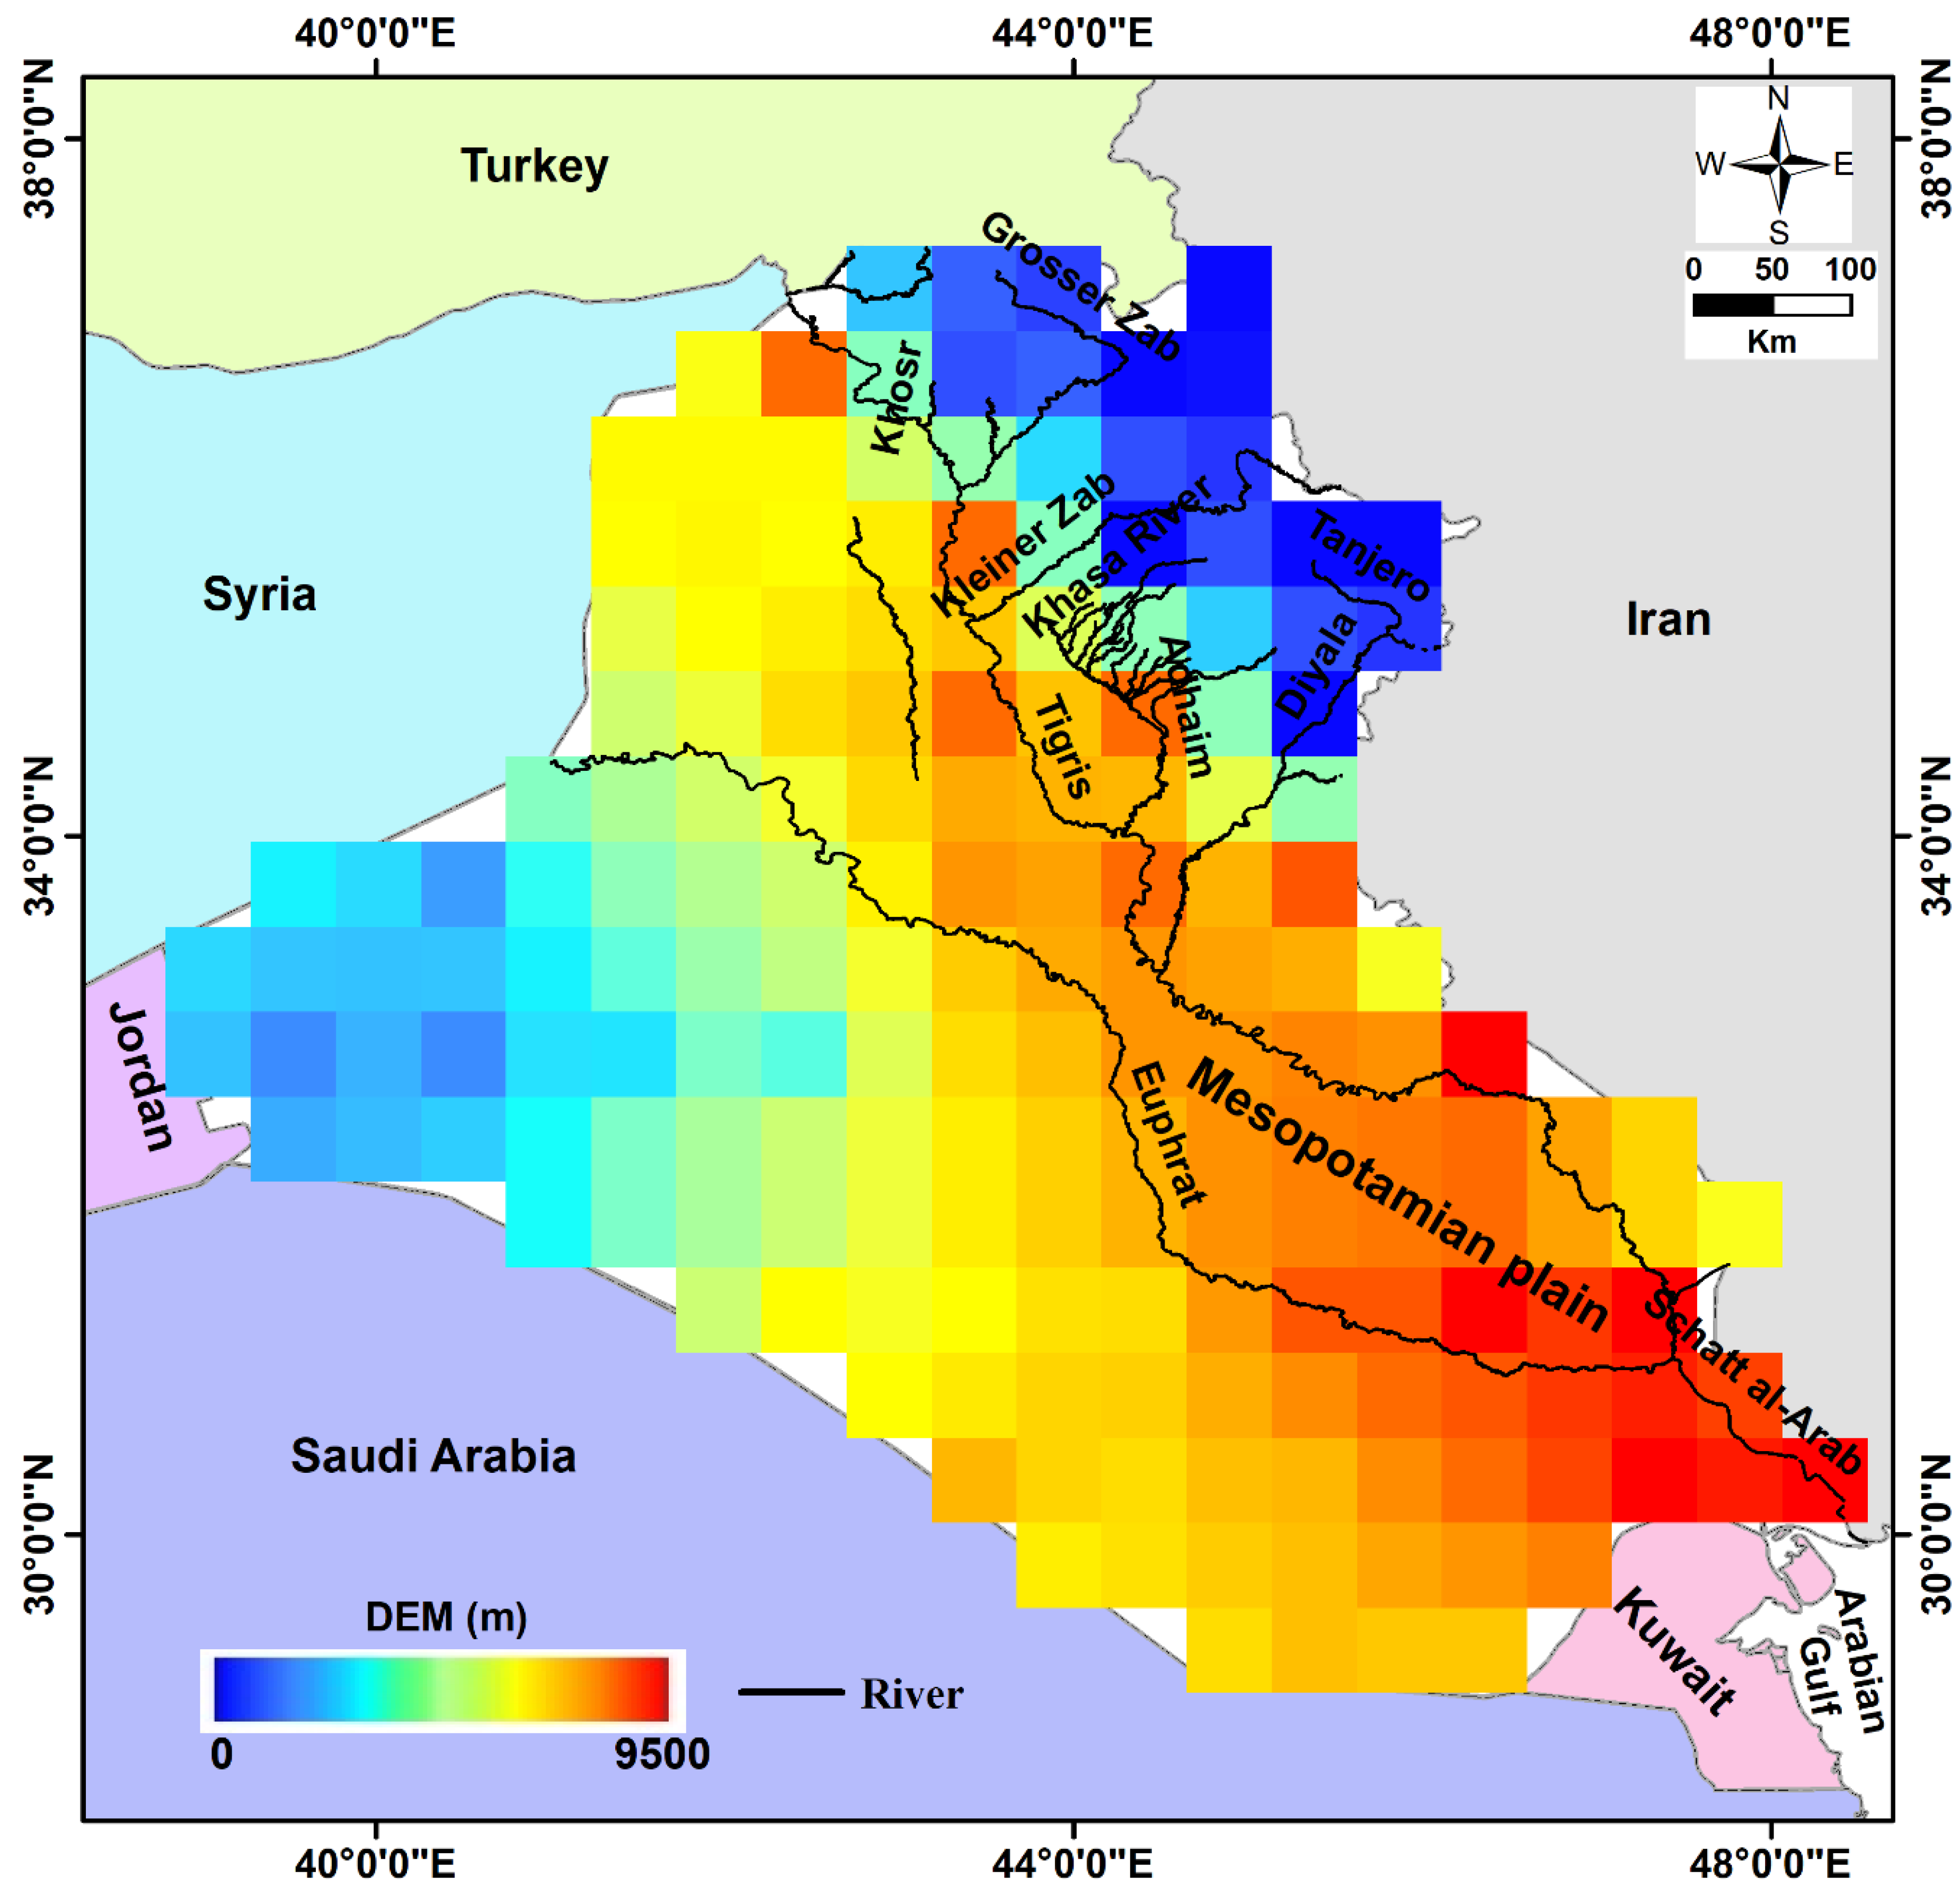
5.4. Sediment Thickness
5.5. Level of Confidence and Inaccuracy Estimation in GWS Trends
6. Conclusions
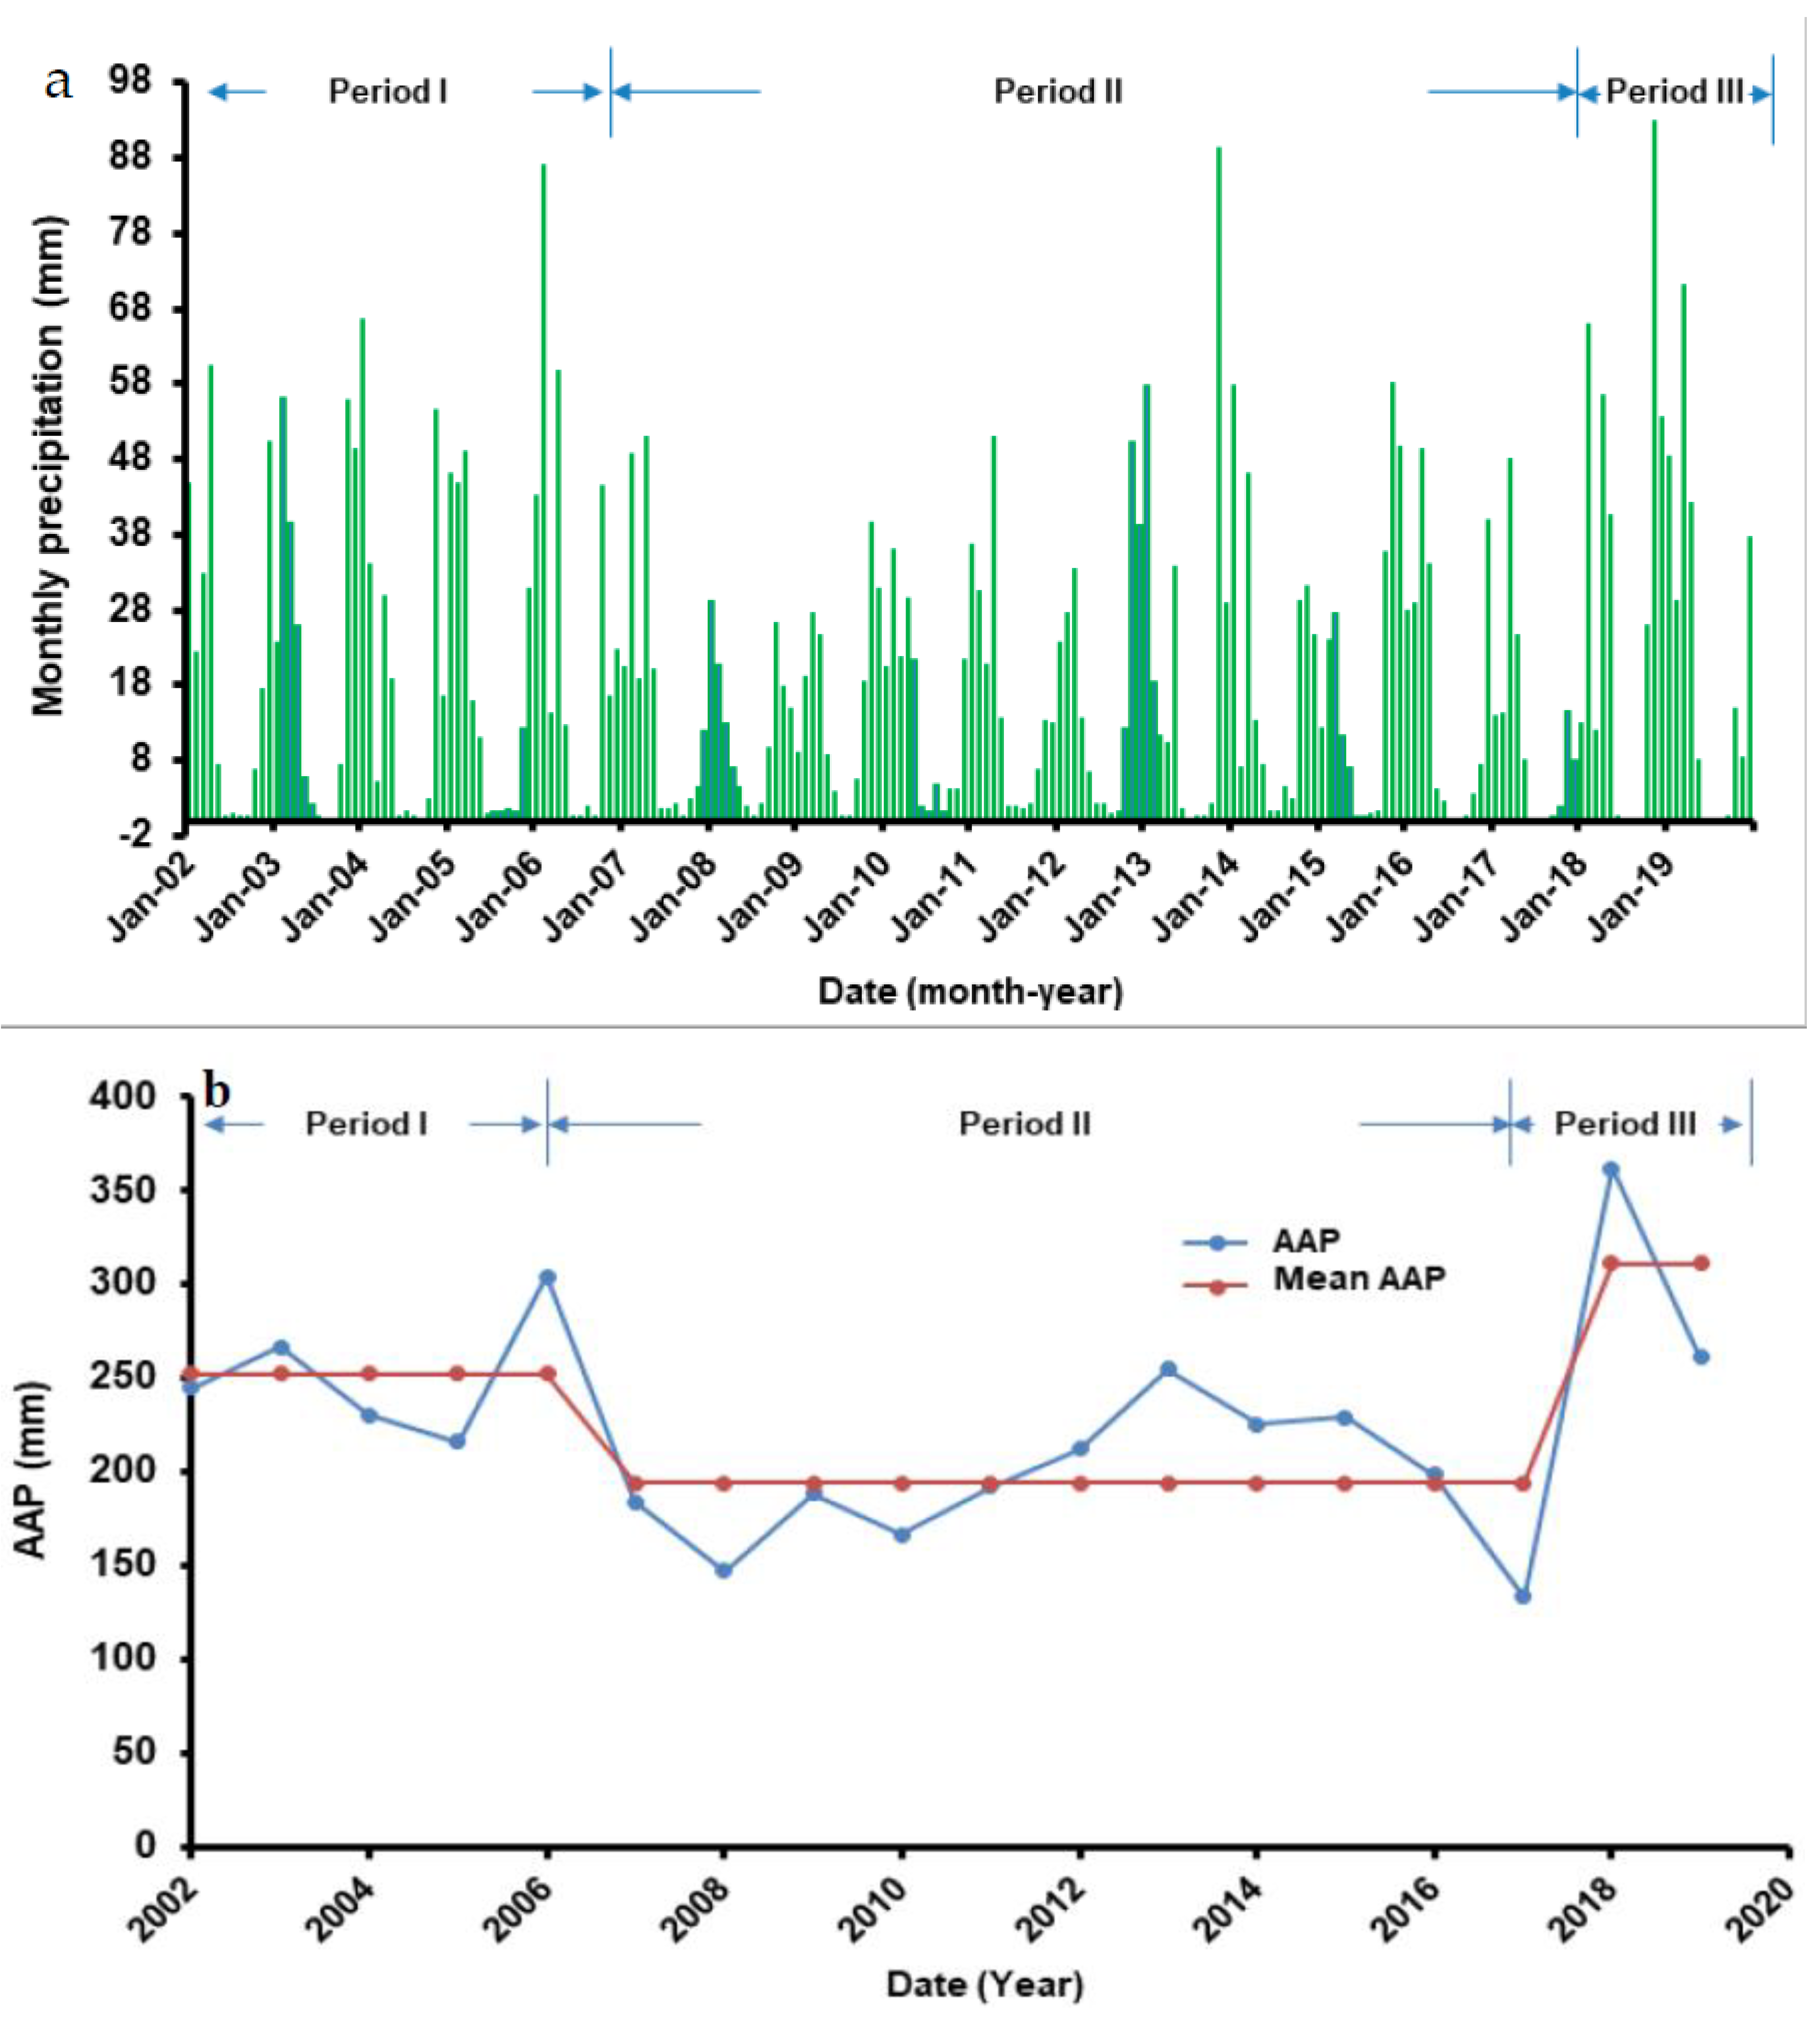
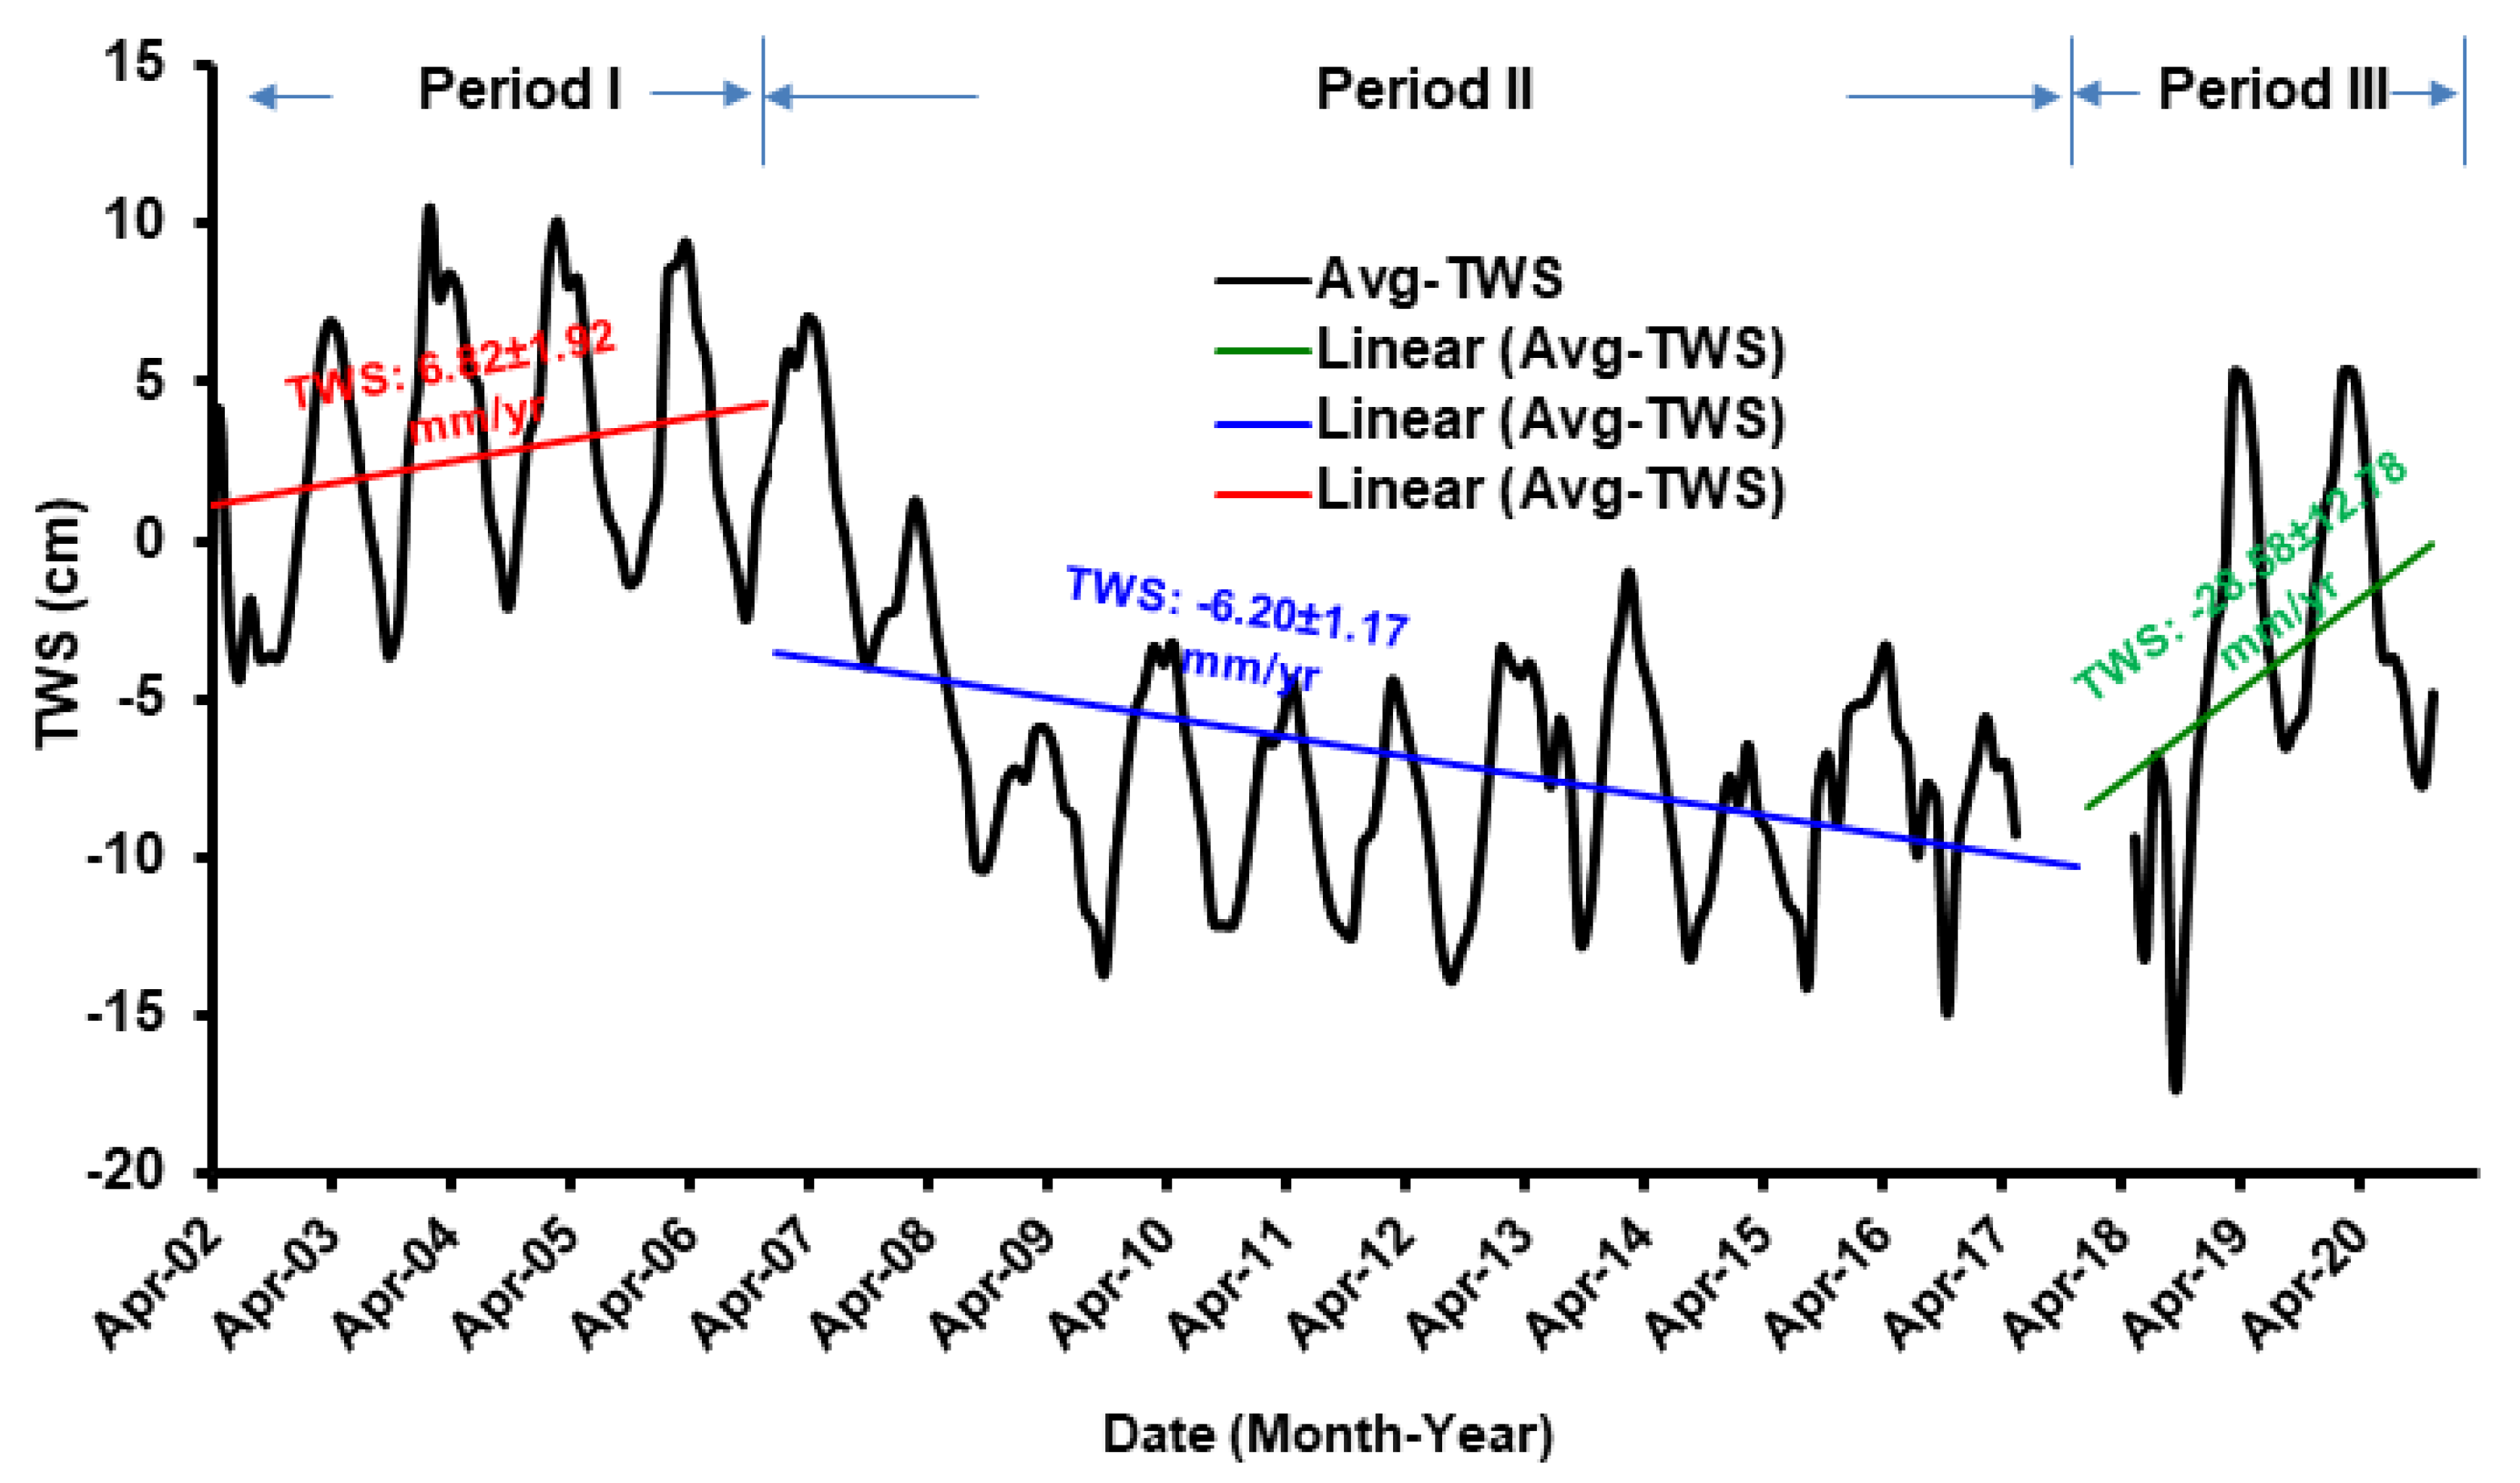
- Based on rainfall studies in Iraq, three distinct climatic periods were identified over the study period: Period I (12/2002–12/2006), which had a higher precipitation value of 252.5 mm/y; Period II (01/2007–12/2017), which had a lower precipitation value of 194.2 mm/y; and Period III (01/2018–12/2020) with the maximum precipitation rate of 311.6 mm/y;
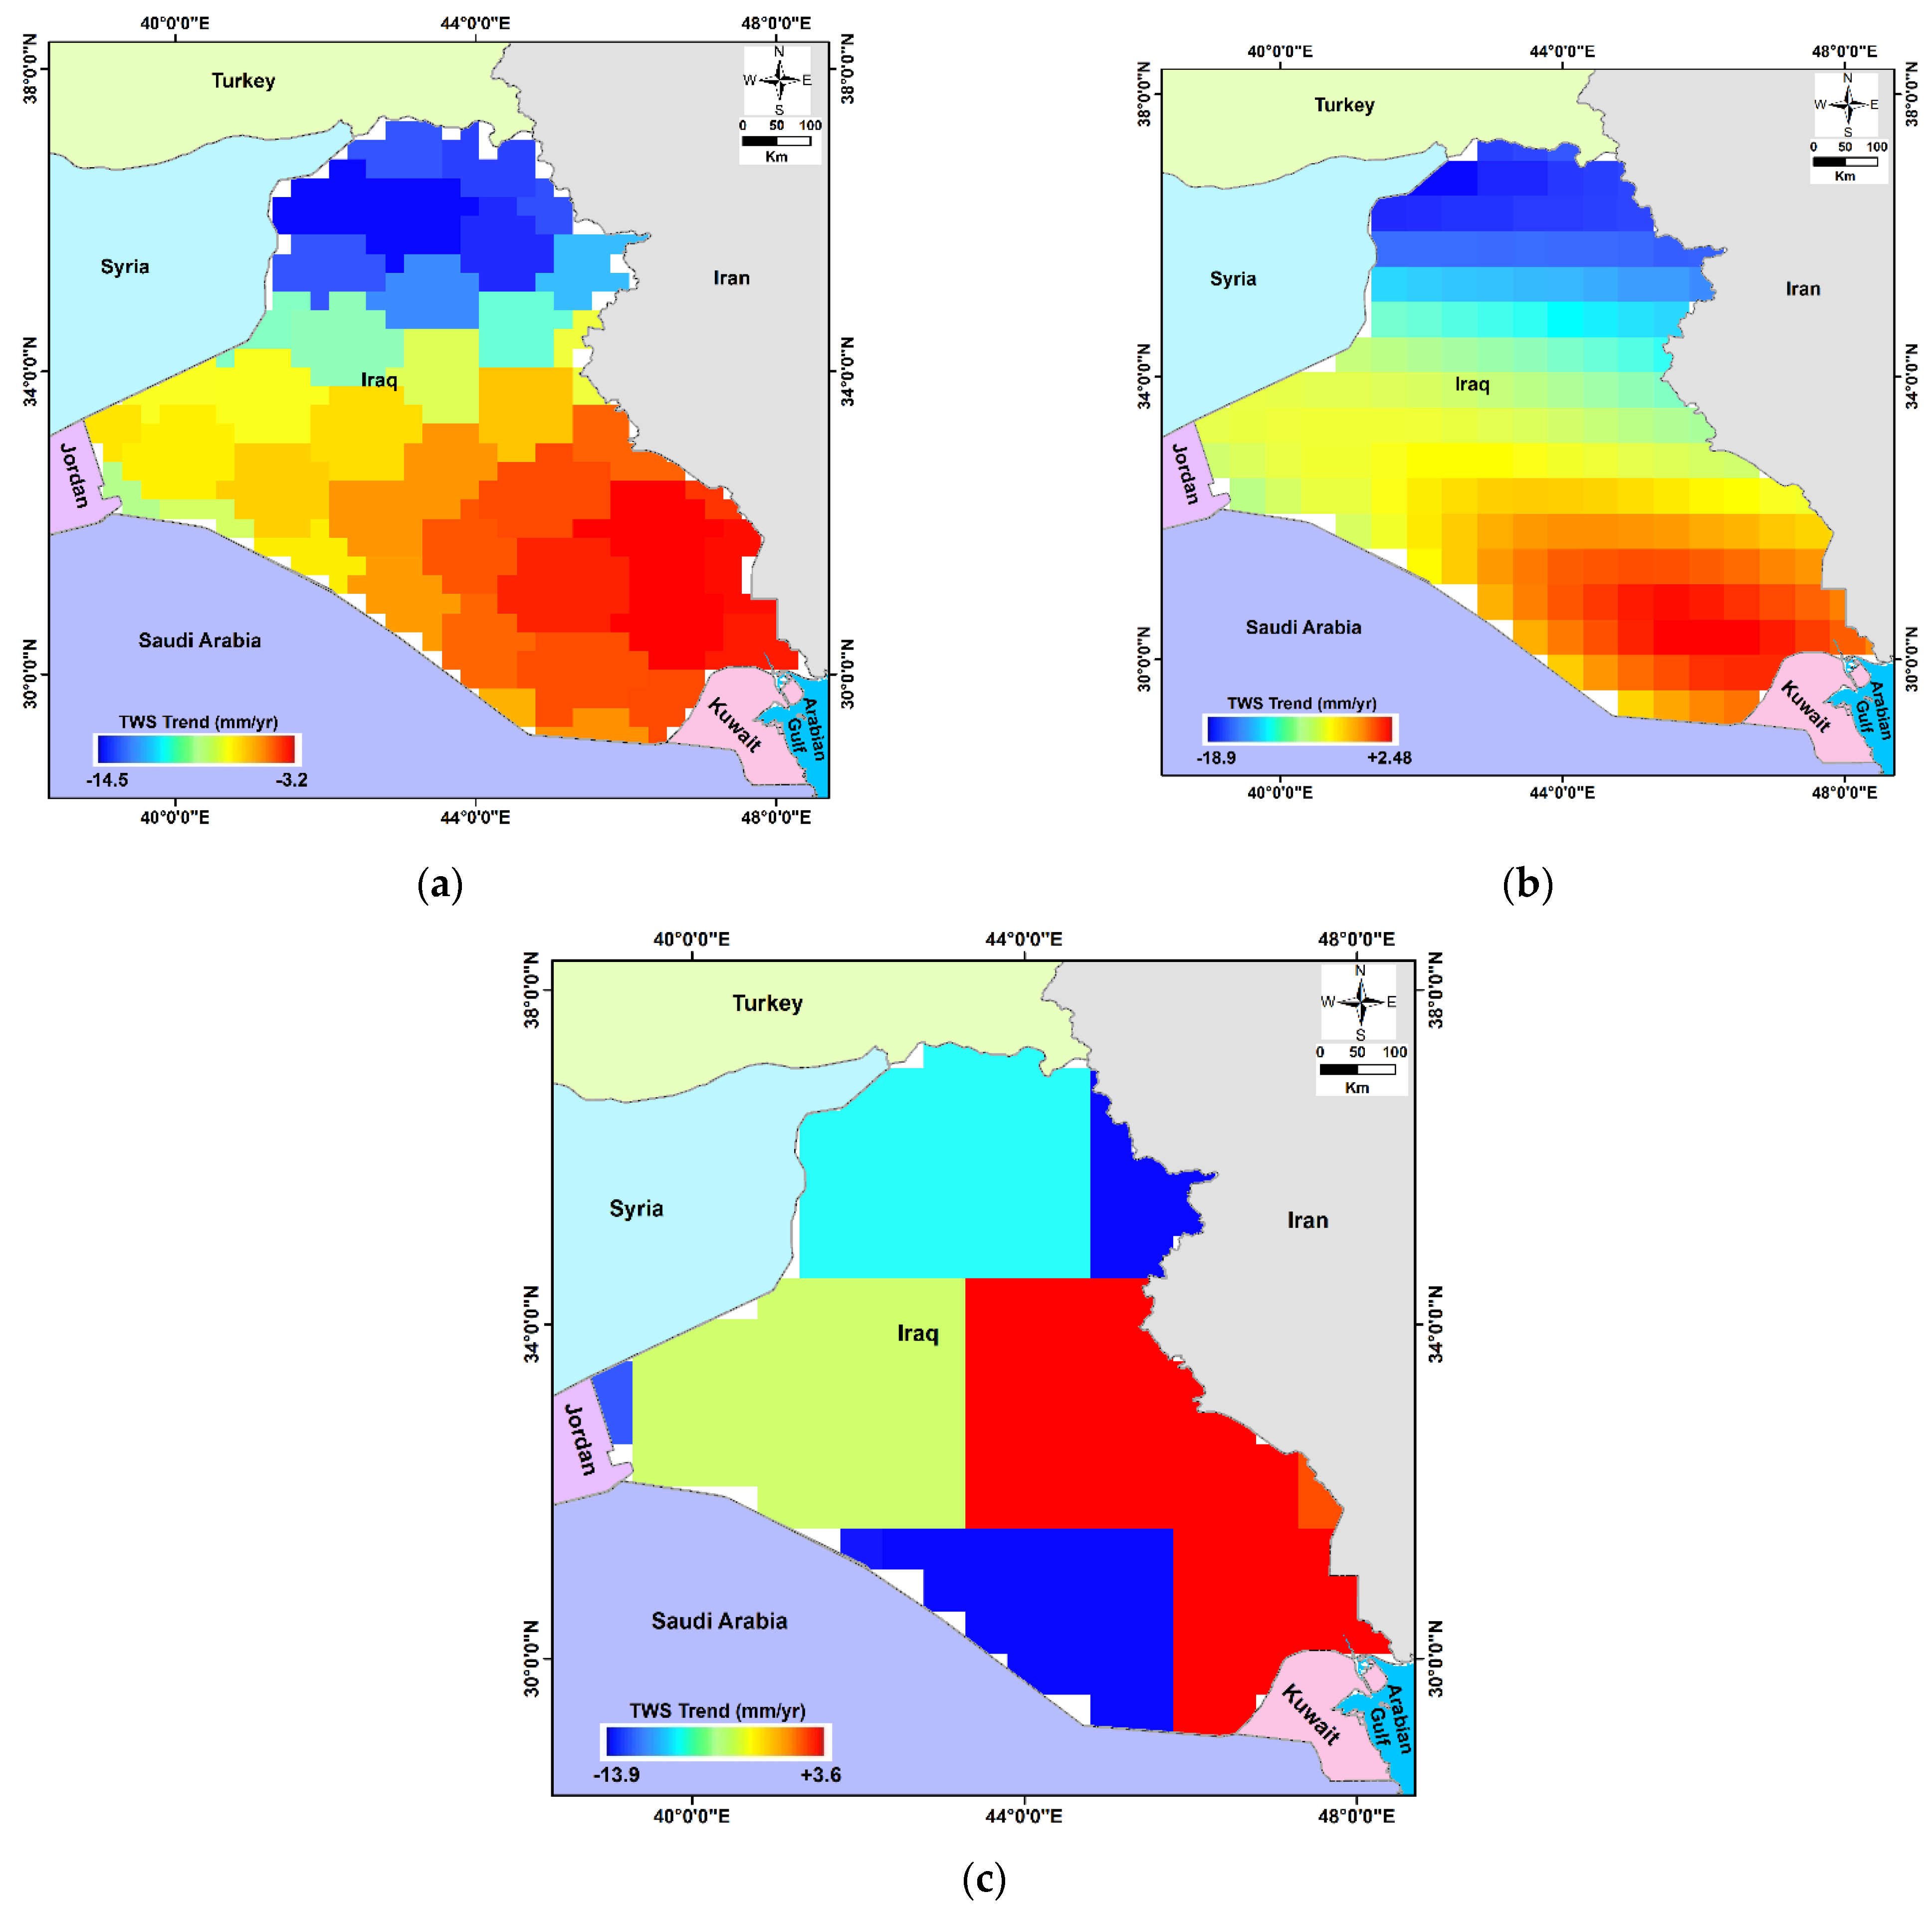
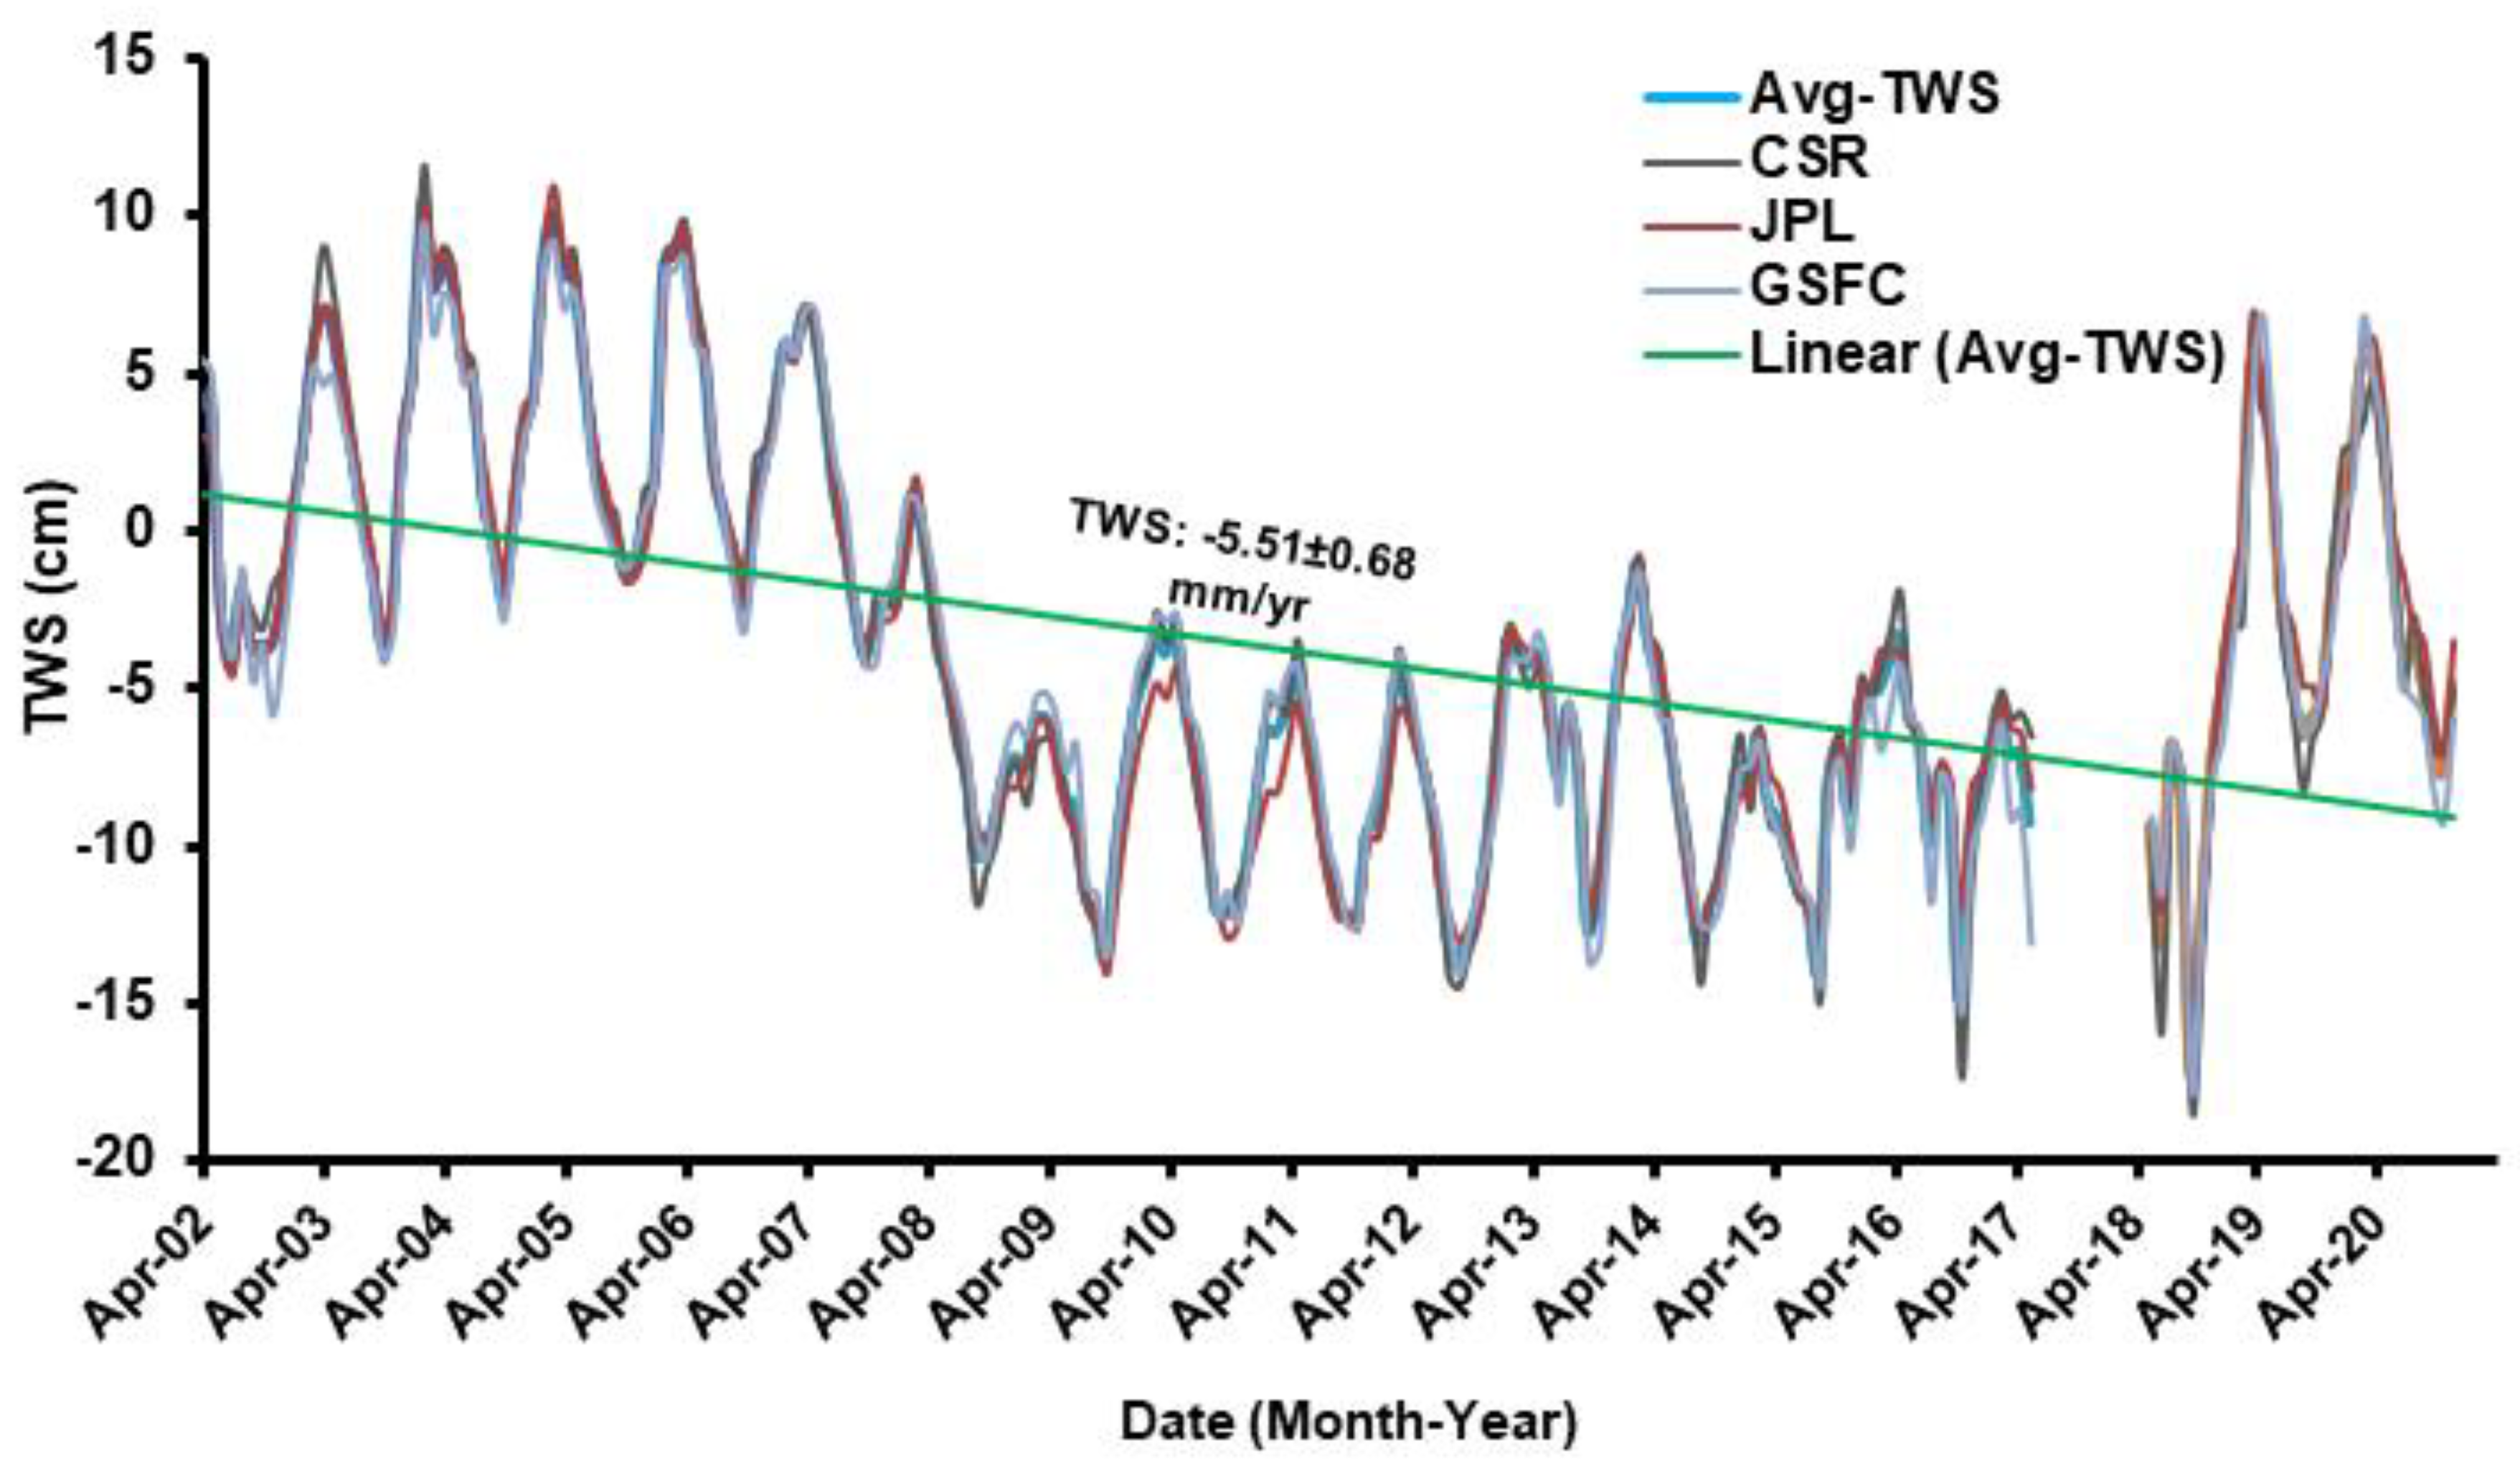
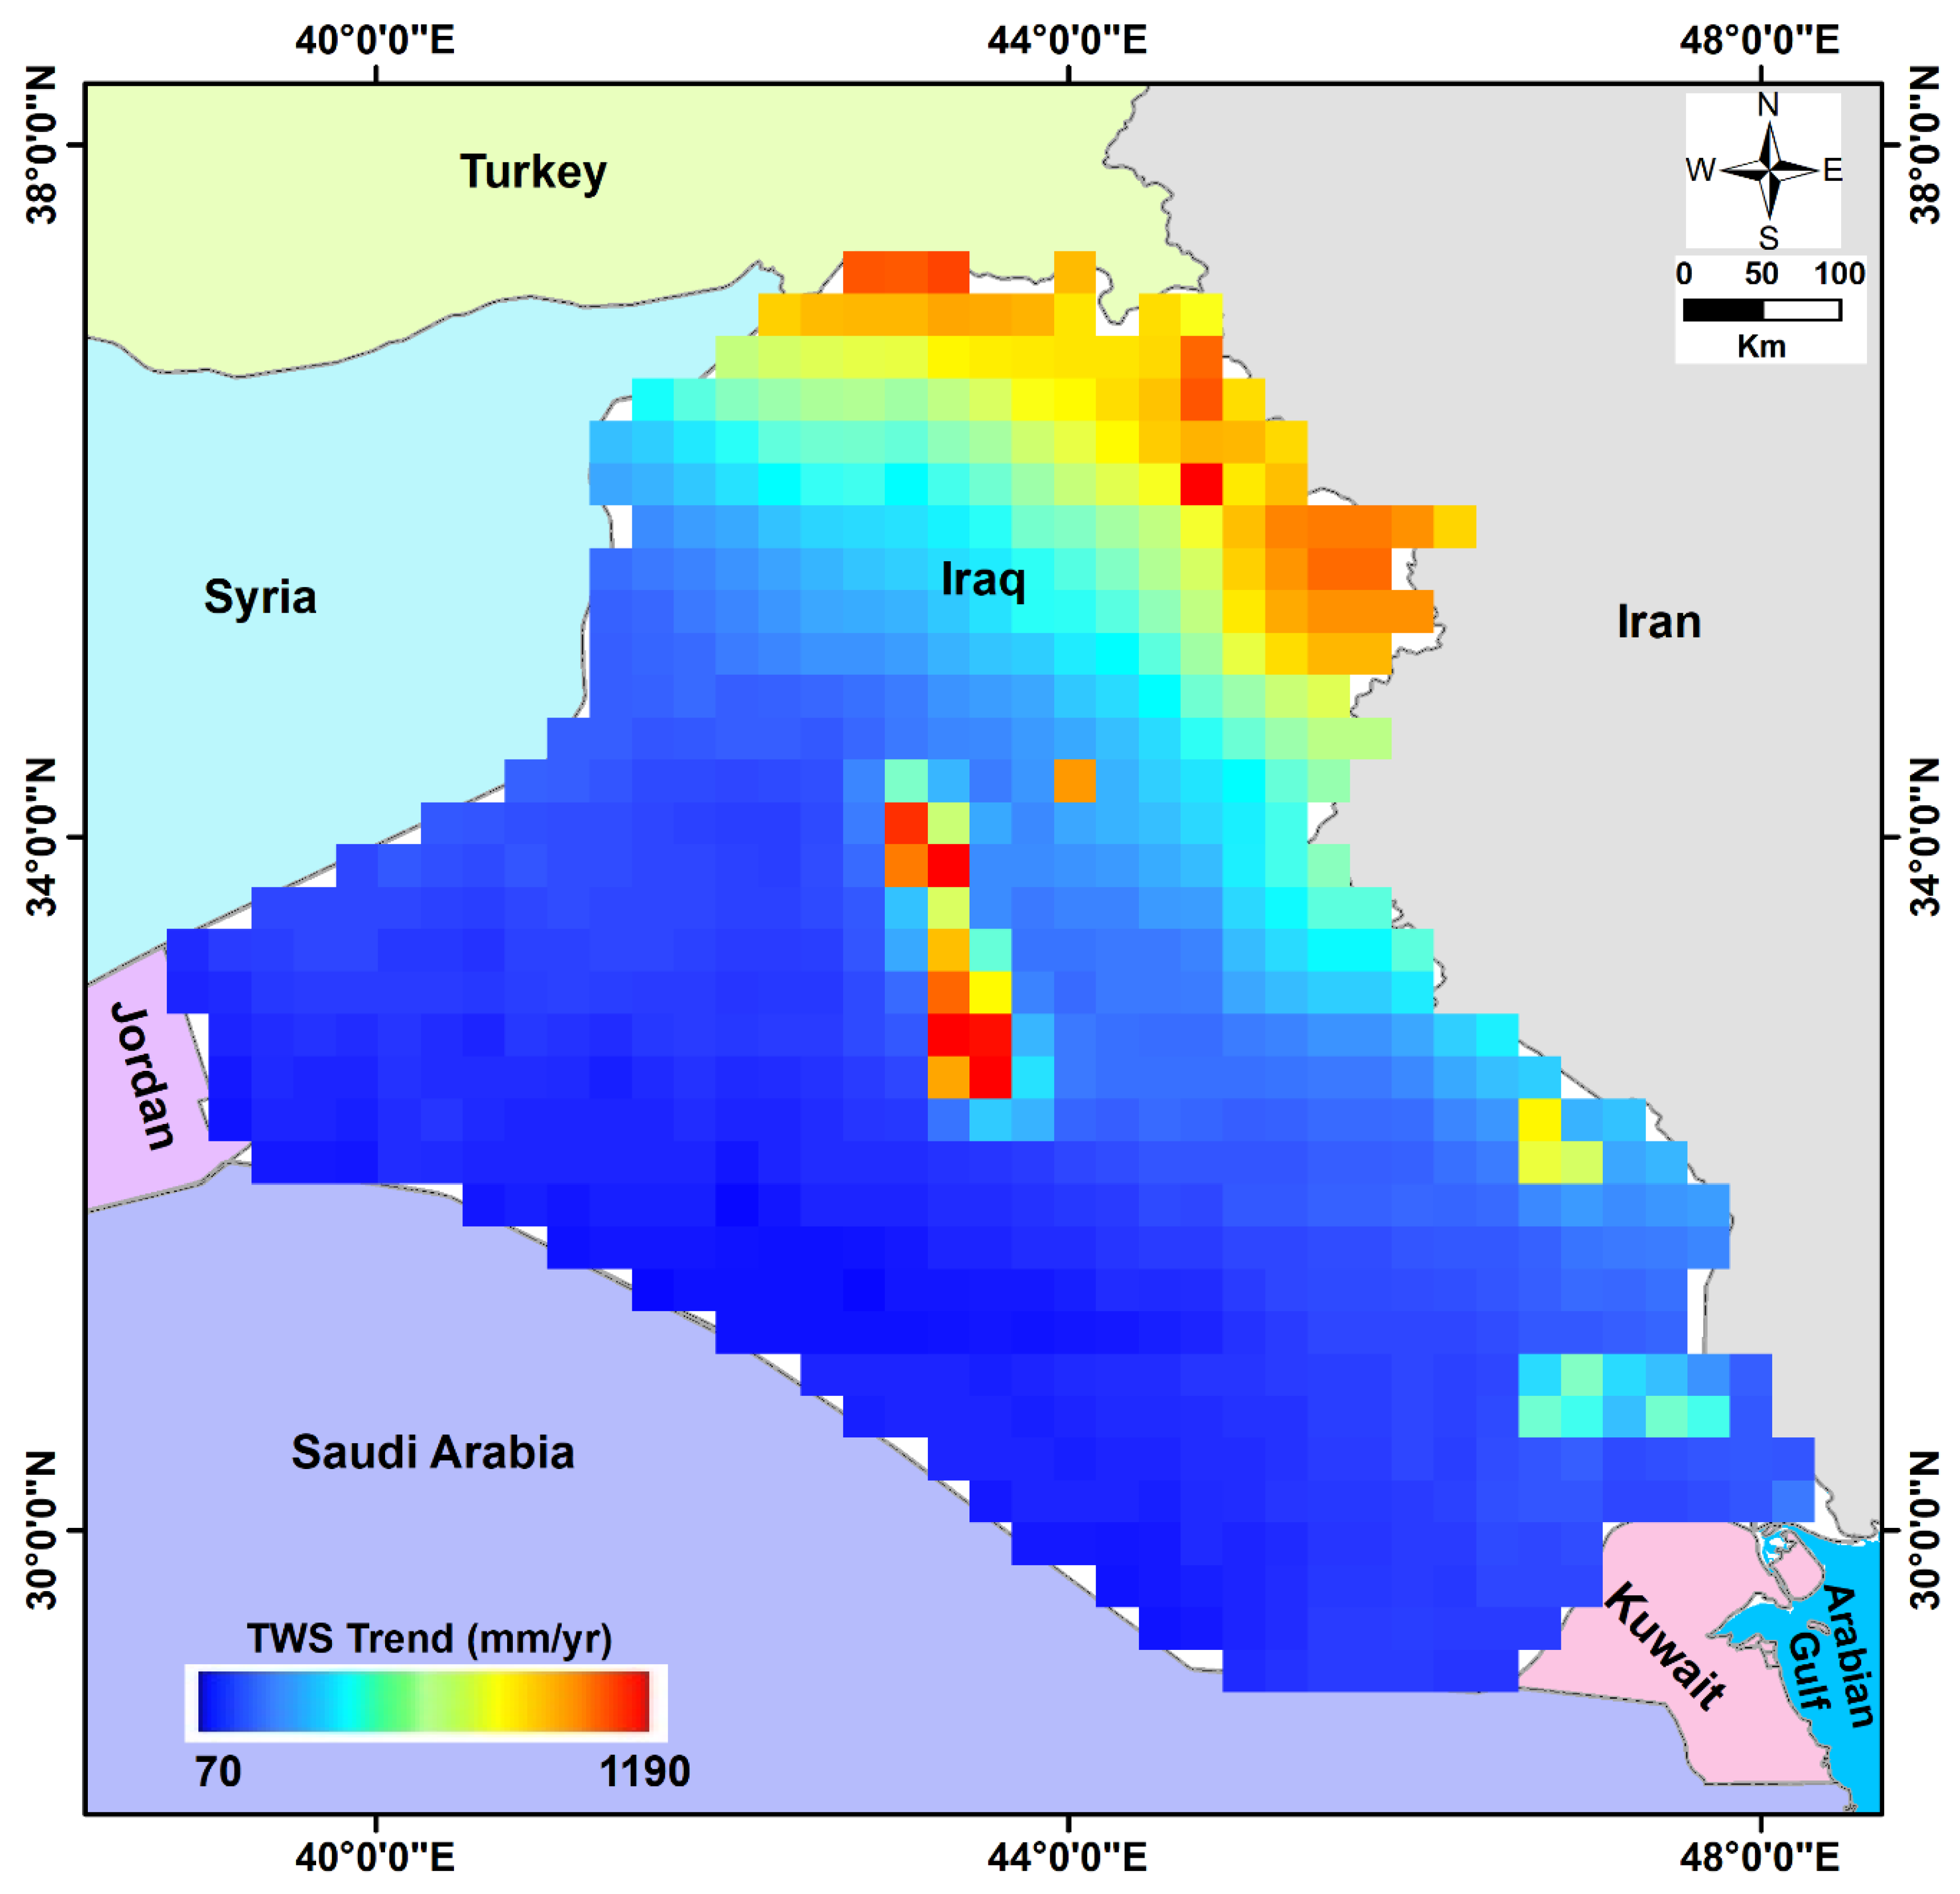
- During the whole study period, the GRACE-derived TWS showed a general depletion pattern, with positive TWS signals over the southern part of the country and negative signals over the northern parts;
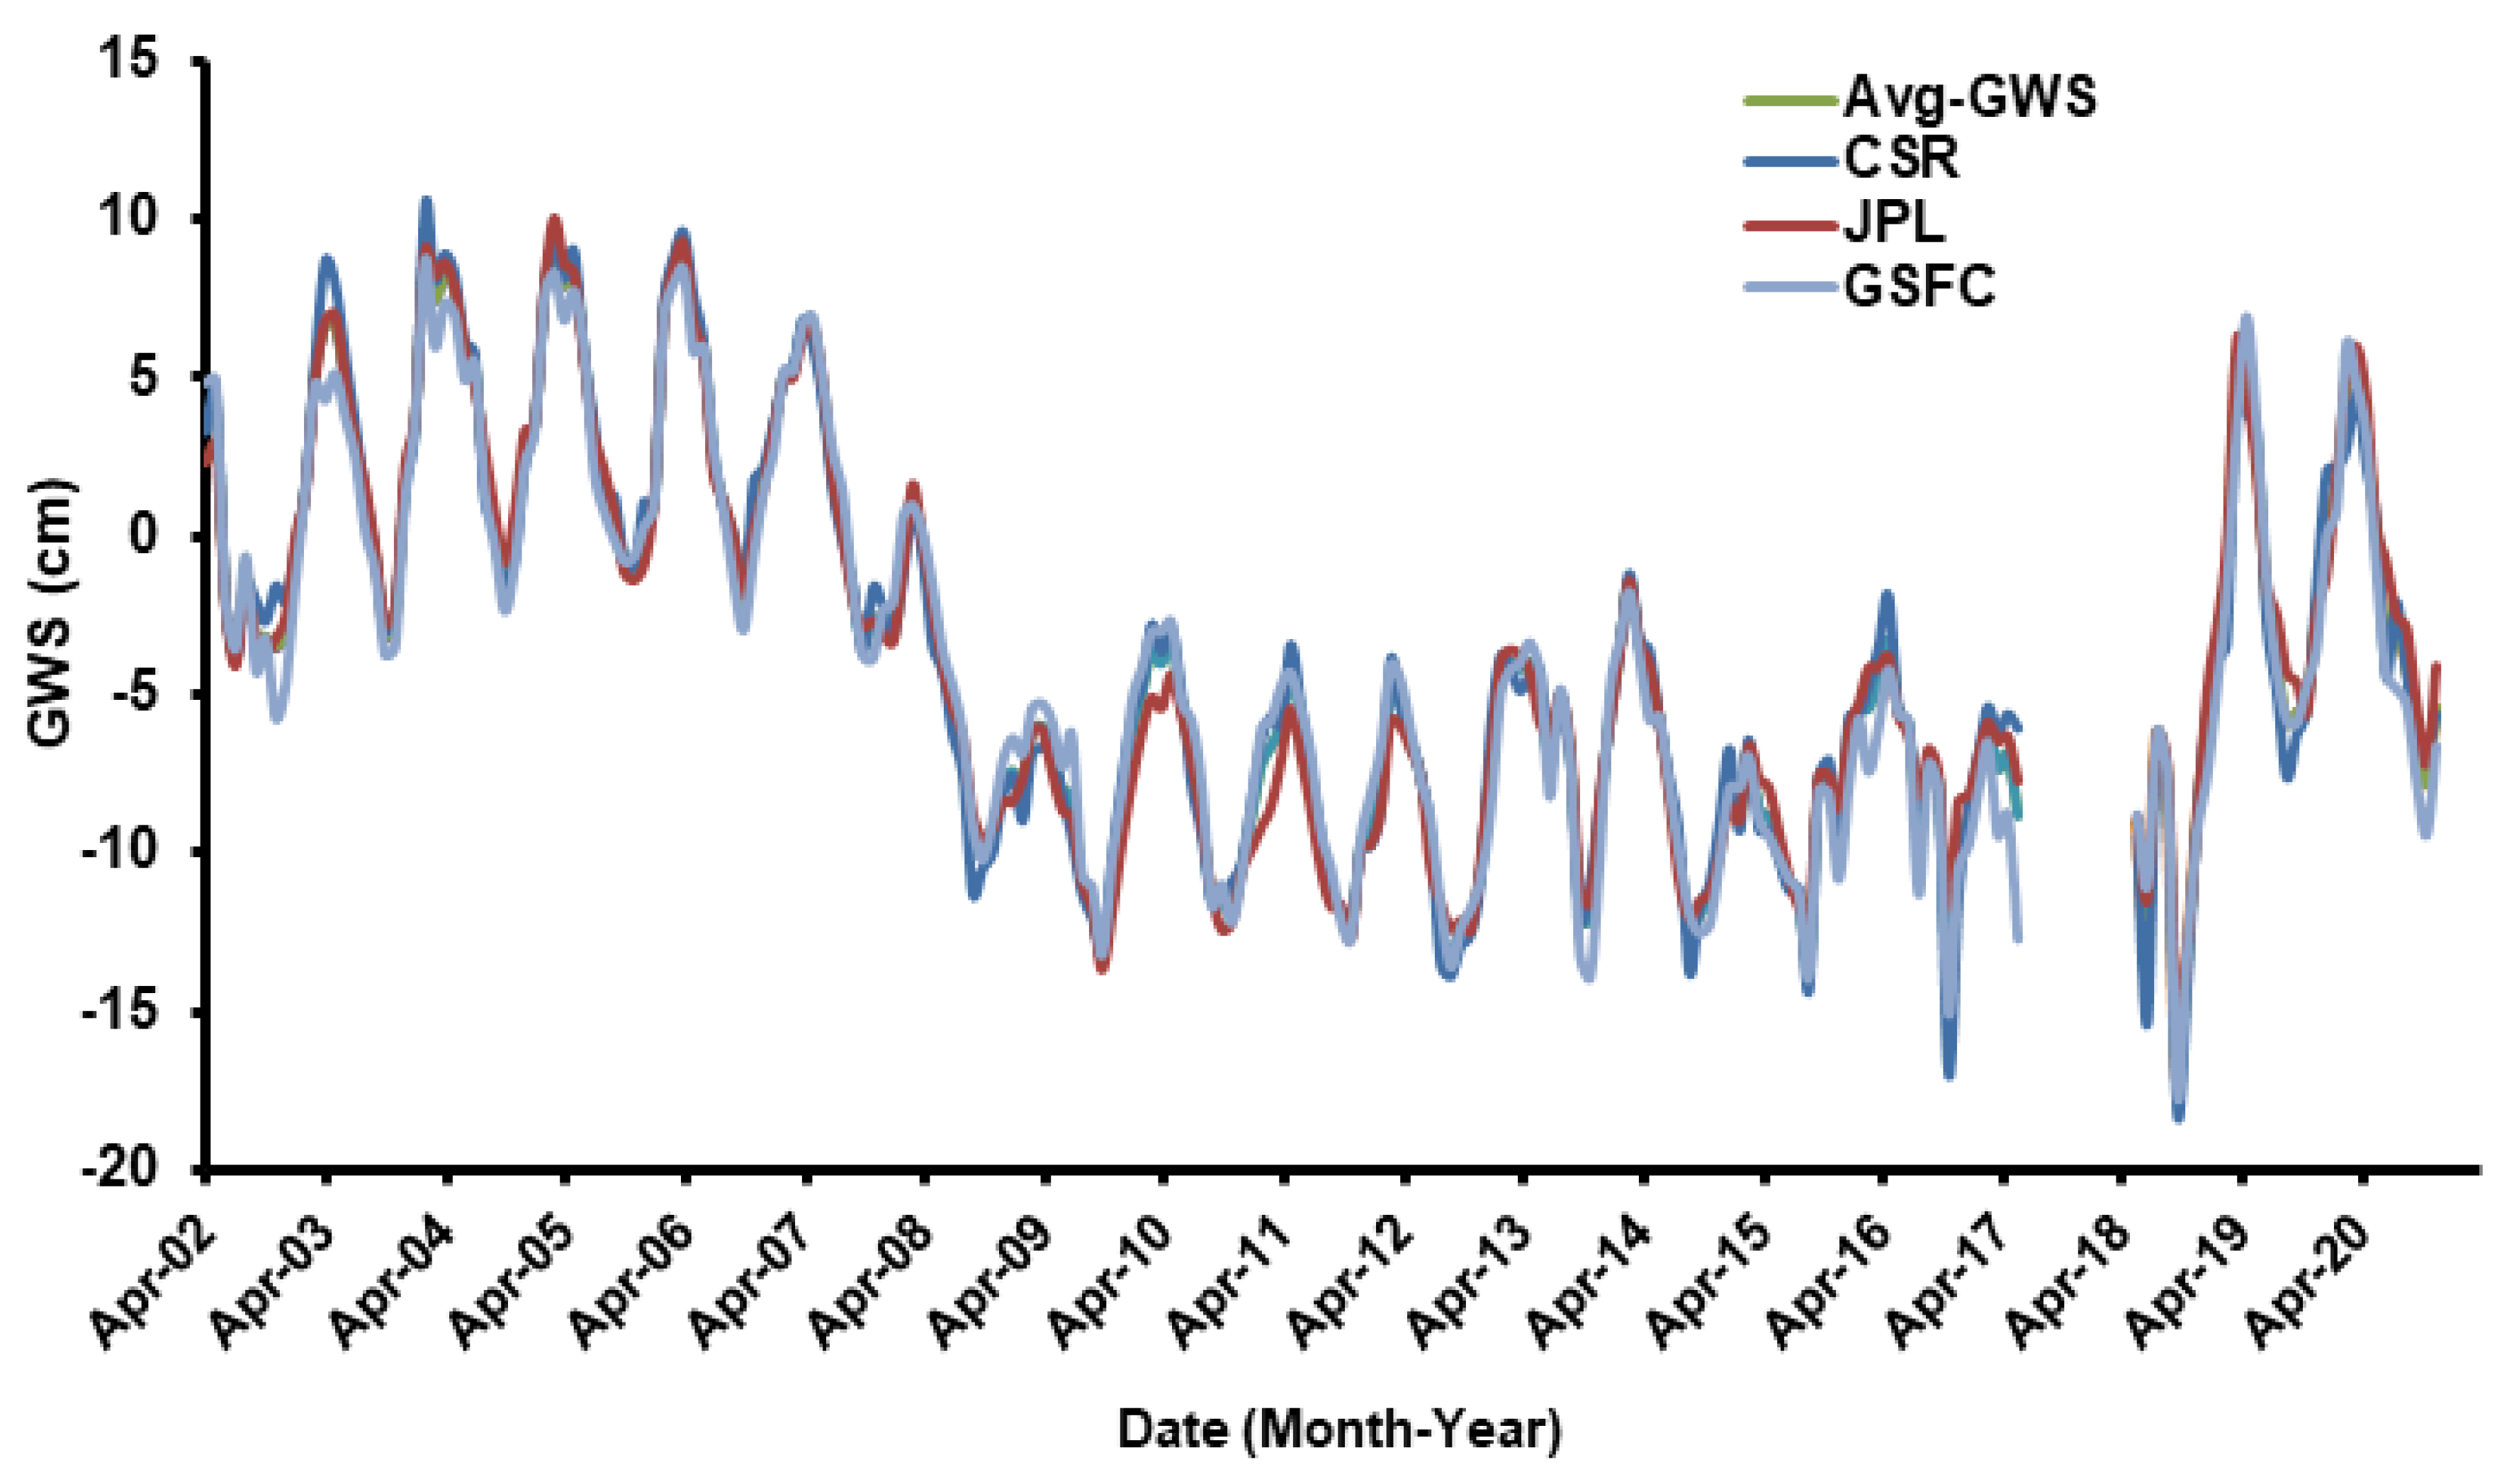
- Following the drought and the lower rainfall period starting in 2007, Iraq’s groundwater declined;
- For Period I, the rate of GWS was calculated to be −2.47 ± 2.20 mm/y; for Period II, a higher GWS depletion rate of −3.79 ± 1.20 mm/y was obtained than for Period III;
- The GWS indicates an overall depletion rate of −4.63 ± 12.99 mm/y over the study area throughout the period studied, which is the result of major anthropogenic activity combined with the low rainfall rate that prevailed in the majority of Iraq;
- The Euphrates–Tigris Rivers and the Mesopotamian plain, which has a larger sediment thickness, receive surface water from the streams that cross the mountainous areas of northeastern Iraq;
- The findings demonstrate that the GRACE and GLDAS datasets are capable of providing a reliable calculation of the water budget in arid environments.
Author Contributions
Funding
Data Availability Statement
Conflicts of Interest
References
- United Nations, Department of Economic and Social Affairs. Population Division (2013); United Nations: New York, NY, USA, 2013. [Google Scholar]
- Bernauer, T.; Böhmelt, T. International conflict and cooperation over freshwater resources. Nat. Sustain. 2020, 3, 350–356. [Google Scholar] [CrossRef]
- Wada, Y.; van Bee, K.L.P.H.; van Kempen, C.M.; Reckman, J.W.T.M.; Vasak, S.; Bierkens, M.F.P. Global depletion of groundwater resources. Geophys. Res. Lett. 2010, 37, L20402. [Google Scholar] [CrossRef] [Green Version]
- United Nations World Water Assessment Programme (WWAP). The United Nations World Water Development Report 2014. In Water and Energy; UNESCO: Paris, France, 2014. [Google Scholar]
- Siebert, S.; Burke, J.; Faures, J.M.; Frenken, K.; Hoogeveen, J.; Döll, P.; Portmann, F.T. Groundwater use for irrigation—A global inventory. Hydrol. Earth Syst. Sci. 2010, 14, 1863–1880. [Google Scholar] [CrossRef] [Green Version]
- Gerten, D.; Heck, V.; Jägermeyr, J.; Bodirsky, B.L.; Fetzer, I.; Jalava, M.; Kummu, M.; Lucht, W.; Rockström, J.; Schaphoff, S.; et al. Feeding ten billion people is possible within four terrestrial planetary boundaries. Nat. Sustain. 2020, 3, 200–208. [Google Scholar] [CrossRef]
- Boretti, A.; Rosa, L. Reassessing the projections of the World Water Development Report. NPJ Clean Water 2019, 2, 15. [Google Scholar] [CrossRef]
- United Nations World Water Assessment Programme. The United Nations World Water Development Report 2018; United Nations Educational, Scientific and Cultural Organization: New York, NY, USA, 2018; Available online: www.unwater.org/publications/world-water-development-report-2018/ (accessed on 26 May 2022).
- Sayl, K.N.; Muhammad, N.S.; El-Shafie, A. Robust approach for optimal positioning and ranking potential rainwater harvesting structure (RWH): A case study of Iraq. Arab. J. Geosci. 2017, 10, 413. [Google Scholar] [CrossRef]
- Alwan, I.A.; Aziz, N.A.; Hamoodi, M.N. Potential water harvesting sites identification using spatial multi-criteria evaluation in Maysan Province, Iraq. ISPRS Int. J. Geo-Inf. 2020, 9, 235. [Google Scholar] [CrossRef]
- World Economic Forum Annual Meeting. Shared Norms for the New Reality, Davos-Klosters, Switzerland, 26–30 January 2011. Available online: www.weforum.org (accessed on 26 May 2022).
- Falkenmark, M.; Widstrand, C. Population and water resources: A delicate balance. Popul. Bull. 1992, 47, 1–36. [Google Scholar]
- Wolf, A. Conflict and cooperation along international waterways. Water Policy 1998, 1, 251–265. [Google Scholar] [CrossRef]
- U.S. Department of Agriculture (USDA). Foreign Agricultural Service. Middle East and Central Asia: Continued Drought in 2009/2010 Threatens Greater Food Grain Shortages. 2008. Available online: http://www.pecad.fas.usda.gov/highlights/2008/09/mideast_cenasia_drought/ (accessed on 16 September 2008).
- Integrated Regional Information Networks. Syria: Drought Pushing Millions into Poverty. 2010. Available online: http://www.irinnews.org/Report/90442/SYRIA-Drought-pushing-millionsinto-poverty (accessed on 26 May 2022).
- Michel, D.; Pandya, A.; Hasnain, S.I.; Sticklor, R.; Panuganti, S. Water Challenges and Cooperative Response in the Middle East and North Africa; Brookings Institution: Washington, DC, USA, 2012; Available online: http://www.brookings.edu/research/papers/2012/11/water-security-middle-east-iwf (accessed on 26 May 2022).
- World Bank. Making the Most of Scarcity: Accountability for Better Water Management Results in the Middle East and North Africa; The MENA Development Report; The World Bank: Washington, DC, USA, 2007. [Google Scholar]
- Kandeel, A. Climate Change: The Middle East Faces a Water Crisis. 2018. Available online: http://www.mei.edu/content/article/climate-change-middle-east-faces-water-crisis (accessed on 26 May 2022).
- Procházka, P.; Hönig, V.; Maitah, M.; Pljučarská, I.; Kleindienst, J. Evaluation of water scarcity in selected countries of the Middle East. Water 2018, 10, 1482. [Google Scholar] [CrossRef] [Green Version]
- de Vries, J.J.; Simmers, I. Groundwater recharge: An overview of process and challenges. Hydrogeol. J. 2002, 10, 5–17. [Google Scholar] [CrossRef]
- Milewski, A.; Sultan, M.; Yan, E.; Becker, R.; Abdeldayem, A.; Soliman, F.; Gelil, K.A. A remote sensing solution for estimating runoff and recharge in arid environments. J. Hydrol. 2009, 373, 1–14. [Google Scholar] [CrossRef]
- Mohamed, A.; Ahmed, E.; Alshehri, F.; Abdelrady, A. The groundwater flow behavior and the recharge in the Nubian Sandstone Aquifer System during the wet and arid periods. Sustainability 2022, 14, 6823. [Google Scholar] [CrossRef]
- Mohamed, A.; Asmoay, A.; Alshehri, F.; Abdelrady, A.; Othman, A. Hydro-geochemical applications and multivariate analysis to assess the water–rock interaction in arid environments. Appl. Sci. 2022, 12, 6340. [Google Scholar] [CrossRef]
- Tapley, B.D.; Bettadpur, S.; Watkins, M. The Gravity Recovery and Climate Experiment: Mission Overview and Early Results. Geophys. Res. Lett. 2004, 31, L09607. [Google Scholar] [CrossRef] [Green Version]
- Syed, T.H.; Famiglietti, J.S.; Chen, J.; Rodell, M.; Seneviratne, S.I.; Viterbo, P.; Wilson, C.R. Total basin discharge for the Amazon and Mississippi River basins from GRACE and 20 a land-atmosphere water balance. Geophys. Res. Lett. 2005, 32, L24404. [Google Scholar] [CrossRef] [Green Version]
- Crowley, J.W.; Mitrovica, J.X.; Bailey, R.C.; Tamisiea, M.E.; Davis, J.L. Annual variations in water storage and precipitation in the Amazon Basin: Bounding sink terms in the terrestrial hydrological balance using GRACE satellite gravity data. J. Geod. 2008, 82, 9–13. [Google Scholar] [CrossRef]
- Xavier, L.; Becker, M.; Cazenave, A.; Longuevergne, L.; Llovel, W.; Filho, O.C.R. Interannual variability in water storage over 2003–2008 in the Amazon Basin from GRACE space gravimetry, in situ river level and precipitation data. Remote Sens. Environ. 2010, 114, 1629–1637. [Google Scholar] [CrossRef] [Green Version]
- Papa, F.; Frappart, F.; Malbeteau, Y.; Shamsudduha, M.; Vuruputur, V.; Sekhar, M.; Ramillien, G.; Prigent, C.; Aires, F.; Pandey, R.K.; et al. Satellite-derived surface and sub-surface water storage in the Ganges–Brahmaputra River Basin. J. Hydrol. Reg. Stud. 2015, 4, 15–35. [Google Scholar] [CrossRef] [Green Version]
- Rodell, M.; Famiglietti, J.S.; Chen, J.; Seneviratne, S.I.; Viterbo, P.; Holl, S.; Wilson, C.R. Basin scale estimates of evapotranspiration using grace and other observations. Bull. Am. Meteorol. Soc. 2004, 31, 10–13. [Google Scholar] [CrossRef] [Green Version]
- Ahmed, M.; Sultan, M.; Wahr, J.; Yan, E. The use of GRACE data to monitor natural and anthropogenic induced variations in water availability across Africa. Earth-Sci. Rev. 2014, 136, 289–300. [Google Scholar] [CrossRef]
- Śliwińska, J.; Wińska, M.; Nastula, J. Validation of GRACE and GRACE-FO mascon data for the study of polar motion excitation. Remote Sens. 2021, 13, 1152. [Google Scholar] [CrossRef]
- Mohamed, A.; Sultan, M.; Ahmed, M.; Yan, E.; Ahmed, E. Aquifer recharge, depletion, and connectivity: Inferences from GRACE, land surface models, and geochemical and geophysical data. Bull. Geol. Soc. Am. 2017, 129, 534–546. [Google Scholar] [CrossRef] [Green Version]
- Mohamed, A. Hydro-geophysical study of the groundwater storage variations over the Libyan area and its connection to the Dakhla basin in Egypt. J. Afr. Earth Sci. 2019, 157, 103508. [Google Scholar] [CrossRef]
- Mohamed, A. Gravity based estimates of modern recharge of the Sudanese area. J. Afr. Earth Sci. 2020, 163, 103740. [Google Scholar] [CrossRef]
- Mohamed, A. Gravity applications in estimating the mass variations in the Middle East: A case study from Iran. Arab. J. Geosci. 2020, 13, 364. [Google Scholar] [CrossRef]
- Mohamed, A. Gravity applications to groundwater storage variations of the Nile Delta Aquifer. J. Appl. Geophys. 2020, 182, 104177. [Google Scholar] [CrossRef]
- Mohamed, A.; Ragaa Eldeen, E.; Abdelmalik, K. Gravity based assessment of spatio-temporal mass variations of the groundwater resources in the Eastern Desert, Egypt. Arab. J. Geosci. 2021, 14, 500. [Google Scholar] [CrossRef]
- Mohamed, A.; Gonçalvès, J. Hydro-geophysical monitoring of the North Western Sahara Aquifer System’s groundwater resources using gravity data. J. Afr. Earth Sci. 2021, 178, 104188. [Google Scholar] [CrossRef]
- Taha, A.I.; Al Deep, M.; Mohamed, A. Investigation of groundwater occurrence using gravity and electrical resistivity methods: A case study from Wadi Sar, Hijaz Mountains, Saudi Arabia. Arab. J. Geosci. 2021, 14, 334. [Google Scholar] [CrossRef]
- Mohamed, A.; Abdelrahman, K.; Abdelrady, A. Application of time—Variable gravity to groundwater storage fluctuations in Saudi Arabia. Front. Earth Sci. 2022, 10, 873352. [Google Scholar] [CrossRef]
- Mohamed, A.; Al Deep, M.; Othman, A.; Taha Al Alshehri, F.; Abdelrady, A. Integrated geophysical assessment of ground-water potential in southwestern Saudi Arabia. Front. Earth Sci. 2022, 10, 937402. [Google Scholar] [CrossRef]
- Mohamed, A.; Faye, C.; Othman, A.; Abdelrady, A. Assessment of the global variability of terrestrial water storage in Senegal using gravity data. Remote Sens. 2022; under review. [Google Scholar]
- Watkins, M.M.; Wiese, D.N.; Yuan, D.N.; Boening, C.; Landerer, F.W. Improved methods for observing Earth’s time variable mass distribution with GRACE using spherical cap mascons. J. Geophys. Res. Solid Earth 2015, 120, 2648–2671. [Google Scholar] [CrossRef]
- Milyukov, V.K.; Yeh, H.C. Next generation space gravimetry: Scientific tasks, concepts, and realization. Astron. Rep. 2018, 62, 1003–1012. [Google Scholar] [CrossRef]
- Rodell, M.; Houser, P.R.; Jambor, U.; Gottschalck, J.; Mitchell, K.; Meng, C.-J.; Arsenault, K.; Cosgrove, B.; Radakovich, J.; Bosilovich, M.; et al. The global land data Assimilation system. Bull. Am. Meteorol. Soc. 2004, 85, 381–394. [Google Scholar] [CrossRef] [Green Version]
- Rodell, M.; Chen, J.; Kato, H.; Famiglietti, J.S.; Nigro, J.; Wilson, C.R. Estimating groundwater storage changes in the Mississippi River basin (USA) using GRACE. Hydrogeol. J. 2009, 15, 159–166. [Google Scholar] [CrossRef] [Green Version]
- Moiwo, J.; Tao, F.; Lu, W. Estimating soil moisture storage change using quasiterrestrial water balance method. Fuel Energy Abstr. 2011, 107, 25–34. [Google Scholar]
- Ahmed, M.; Sultan, M.; Yan, E.; Wahr, J. Assessing and improving land surface model outputs over Africa using GRACE, feld, and remote sensing data. Surv. Geophys. 2016, 37, 529–556. [Google Scholar] [CrossRef]
- Mohamed, A.; Al Deep, M. Depth to the bottom of the magnetic layer, crustal thickness, and heat flow in Africa: Inferences from gravity and magnetic data. J. Afr. Earth Sci. 2021, 179, 104204. [Google Scholar] [CrossRef]
- Mohamed, A.; Abu El Ella, E.M. Magnetic applications to subsurface and groundwater investigations: A case study from Wadi El Assiuti, Egypt. Int. J. Geosci. 2021, 12, 77–101. [Google Scholar] [CrossRef]
- Al Deep, M.; Araffa, S.A.S.; Mansour, S.A.; Taha, A.I.; Mohamed, A.; Othman, A. Geophysics and remote sensing applications for groundwater exploration in fractured basement: A case study from Abha Area, Saudi Arabia. J. Afr. Earth Sci. 2021, 184, 04368. [Google Scholar] [CrossRef]
- Mohamed, A.; Al Deep, M.; Abdelrahman, K.; Abdelrady, A. Geometry of the magma chamber and curie point depth beneath Hawaii Island: Inferences from magnetic and gravity data. Front. Earth Sci. 2022, 10, 847984. [Google Scholar] [CrossRef]
- Othman, A. Measuring and Monitoring Land Subsidence and Earth Fissures in Al-Qassim Region, Saudi Arabia: Inferences from InSAR. In Advances in Remote Sensing and Geo Informatics Applications, Proceedings of the Conference of the Arabian Journal of Geosciences, CAJG 2018, Hammamet, Tunisia, 12–15 November 2018; El-Askary, H., Lee, S., Heggy, E., Pradhan, B., Eds.; Advances in Science, Technology & Innovation (IEREK Interdisciplinary Series for Sustainable Development); Springer: Cham, Switzerland, 2019. [Google Scholar] [CrossRef]
- Voss, K.A.; Famiglietti, J.S.; Lo, M.; De Linage, C.; Rodell, M.; Swenson, S. Groundwater depletion in the Middle East from GRACE with implications for transboundary water management in the Tigris–Euphrates–western Iran region. Water Resour. Res. 2013, 49, 904–914. [Google Scholar] [CrossRef] [PubMed] [Green Version]
- Sissaskian, V.K.; Fouad, S.F.A. Geological Map of Iraq, Scale 1:1,000,000, 4th ed.; Iraq Geological Survey: Baghdad, Iraq, 2012. [Google Scholar]
- Numan, M.S. A plate tectonic scenario for the phanerozoic succession in Iraq. Iraqi Geol. J. 1997, 30, 89–90. [Google Scholar]
- Aqrawi, A. Paleozoic stratigraphy and petroleum systems of the Western and Southwestern Deserts of Iraq. GeoArabia 1998, 3, 229–248. [Google Scholar] [CrossRef]
- Hessami, K.; Koyi, H.A.; Talbot, C.J. The significance of strike-slip faulting in the basement of the Zagros fold and thrust belt. J. Pet. Geol. 2001, 24, 5–28. [Google Scholar] [CrossRef]
- Al-Jiburi, H.K.; Al-Basrawi, N.H. Hydrogeological map of Iraq, scale 1:1,000,000. Iraqi Bull. Geol. Min. 2015, 11, 17–26. [Google Scholar]
- Krasny, J.; Alsam, S.; Jassim, S.Z. Hydrology. In Geology of Iraq; Jassim, S.Z., Goff, J.C., Eds.; Dolin, Prague and Moravian Museum: Prague, Czech Republic, 2006; pp. 251–287. [Google Scholar]
- Saleh, S.A.; Al-Ansari, N.; Abdullah, T. Groundwater hydrology in Iraq. J. Earth Sci. Geotech. Eng. 2020, 10, 55–197. [Google Scholar]
- Alsam, S.; Jassim, S.Z.; Hanna, F. Water Balance of Iraq: Stage 2, Geological and Hydrogeological Conditions; Report; Ministry of Irrigation: Baghdad, Iraq, 1990.
- Domemico, P.A.; Schwartz, F.W. Physical and Chemical Hydrogeology; John Wiley and Sons, Inc.: New York, NY, USA, 1998; p. 506. [Google Scholar]
- Araim, H. Geological Map of Iraq 1:1,000,000 Series, Sheet 5, Hydrogeological Map of Iraq; The Geological Survey of Iraq: Erbil, Iraq, 1991. [Google Scholar]
- Luthcke, S.B.; Sabaka, T.J.; Loomis, B.D.; Arendt, A.A.; McCarthy, J.J.; Camp, J. Antarctica, Greenland, and Gulf of Alaska land-ice evolution from an iterated GRACE global mascon solution. J. Glaciol. 2013, 59, 216. [Google Scholar] [CrossRef]
- Save, H.; Bettadpur, S.; Tapley, D.D. High resolution CSR GRACE RL05 mascons. J. Geophys. Res. Solid Earth 2016, 121, 7547–7569. [Google Scholar] [CrossRef]
- Wiese, D.N.; Landerer, F.W.; Watkins, M.M. Quantifying and reducing leakage errors in the JPL RL05M GRACE mascon solution. Water Resour. Res. 2016, 52, 7490–7502. [Google Scholar] [CrossRef]
- Save, H. CSR GRACE and GRACE-FO RL06 Mascon Solutions v02. 2020. Available online: http://www2.csr.utexas.edu/grace/RL06_mascons.html (accessed on 1 March 2022).
- Tiwari, V.M.; Wahr, J.; Swenson, S. Dwindling groundwater resources in northern India, from satellite gravity observations. Geophys. Res. Lett. 2009, 36, L18401. [Google Scholar] [CrossRef] [Green Version]
- Gonçalvès, J.; Petersen, J.; Deschamps, P.; Hamelin, B.; Baba-Sy, O. Quantifying the modern recharge of the “fossil” Sahara aquifers. Geophys. Res. Lett. 2013, 40, 2673–2678. [Google Scholar] [CrossRef]
- Hassan, A.A.; Jin, S.G. Water cycle and climate signals in Africa observed by satellite gravimetry. In IOP Conference Series: Earth and Environmental Science, Proceedings of the 35th International Symposium on Remote Sensing of Environment (ISRSE35), Beijing, China, 22–26 April 2013; IOP Publishing: Bristol, UK, 2014; Volume 17, p. 012149. [Google Scholar] [CrossRef] [Green Version]
- Sultan, M.; Sturchio, N.C.; Alsefry, S.; Emil, M.K.; Ahmed, M.; Abdelmohsen, K.; AbuAbdullah, M.M.; Yan, E.; Save, H.; Alharbi, T.; et al. Assessment of age, origin, and sustainability of fossil aquifers: A geochemical and remote sensing-based approach. J. Hydrol. 2019, 576, 325–341. [Google Scholar] [CrossRef]
- Bhanja, S.N.; Zhang, X.; Wang, J. Estimating long-term groundwater storage and its controlling factors in Alberta, Canada. Hydrol. Earth Syst. Sci. 2018, 22, 6241–6255. [Google Scholar] [CrossRef] [Green Version]
- Richey, A.S.; Thomas, B.F.; Lo, M.-H.; Reager, J.T.; Famiglietti, J.S.; Voss, K.; Swenson, S.; Rodell, M. Quantifying renewable groundwater stress with GRACE. Water Resour. Res. 2015, 51, 5217–5238. [Google Scholar] [CrossRef]
- Trigo, R.M.; Gouveia, C.M.; Barriopedro, D. The intense 2007–2009 drought in the Fertile Crescent: Impact and associated atmospheric circulation. Agric. For. Meteorol. 2010, 150, 1245–1257. [Google Scholar] [CrossRef]
- Tourian, M.J.; Elmi, O.; Chen, Q.; Devaraju, B.; Roohi, S.; Sneeuw, N. A spaceborne multisensor approach to monitor the desiccation of Lake Urmia in Iran. Remote Sens. Environ. 2015, 156, 349–360. [Google Scholar] [CrossRef]
- Divins, D. Total Sediment Thickness of the World’s Oceans and Marginal Seas; NOAA National Geophysical Data Center: Boulder, CO, USA, 2003. [Google Scholar]


| Component | Entire Period | Period I | Period II | Period III | |
|---|---|---|---|---|---|
| GRACE total (ΔTWS) | CSR-M | −5.79 ± 0.70 | +6.43 ± 4.08 | −5.60 ± 1.24 | +32.7 ± 13.07 |
| JPL-M | −5.11 ± 0.70 | +7.15 ± 4.00 | −5.22 ± 1.18 | +30.16 ± 12.25 | |
| GSFC | −5.64 ± 0.67 | +6.87 ± 3.97 | −7.77 ± 1.15 | +22.89 ± 13.5 | |
| AVG | −5.51 ± 0.68 | +6.82 ± 1.92 | −6.20 ± 1.17 | +28.58 ± 12.78 | |
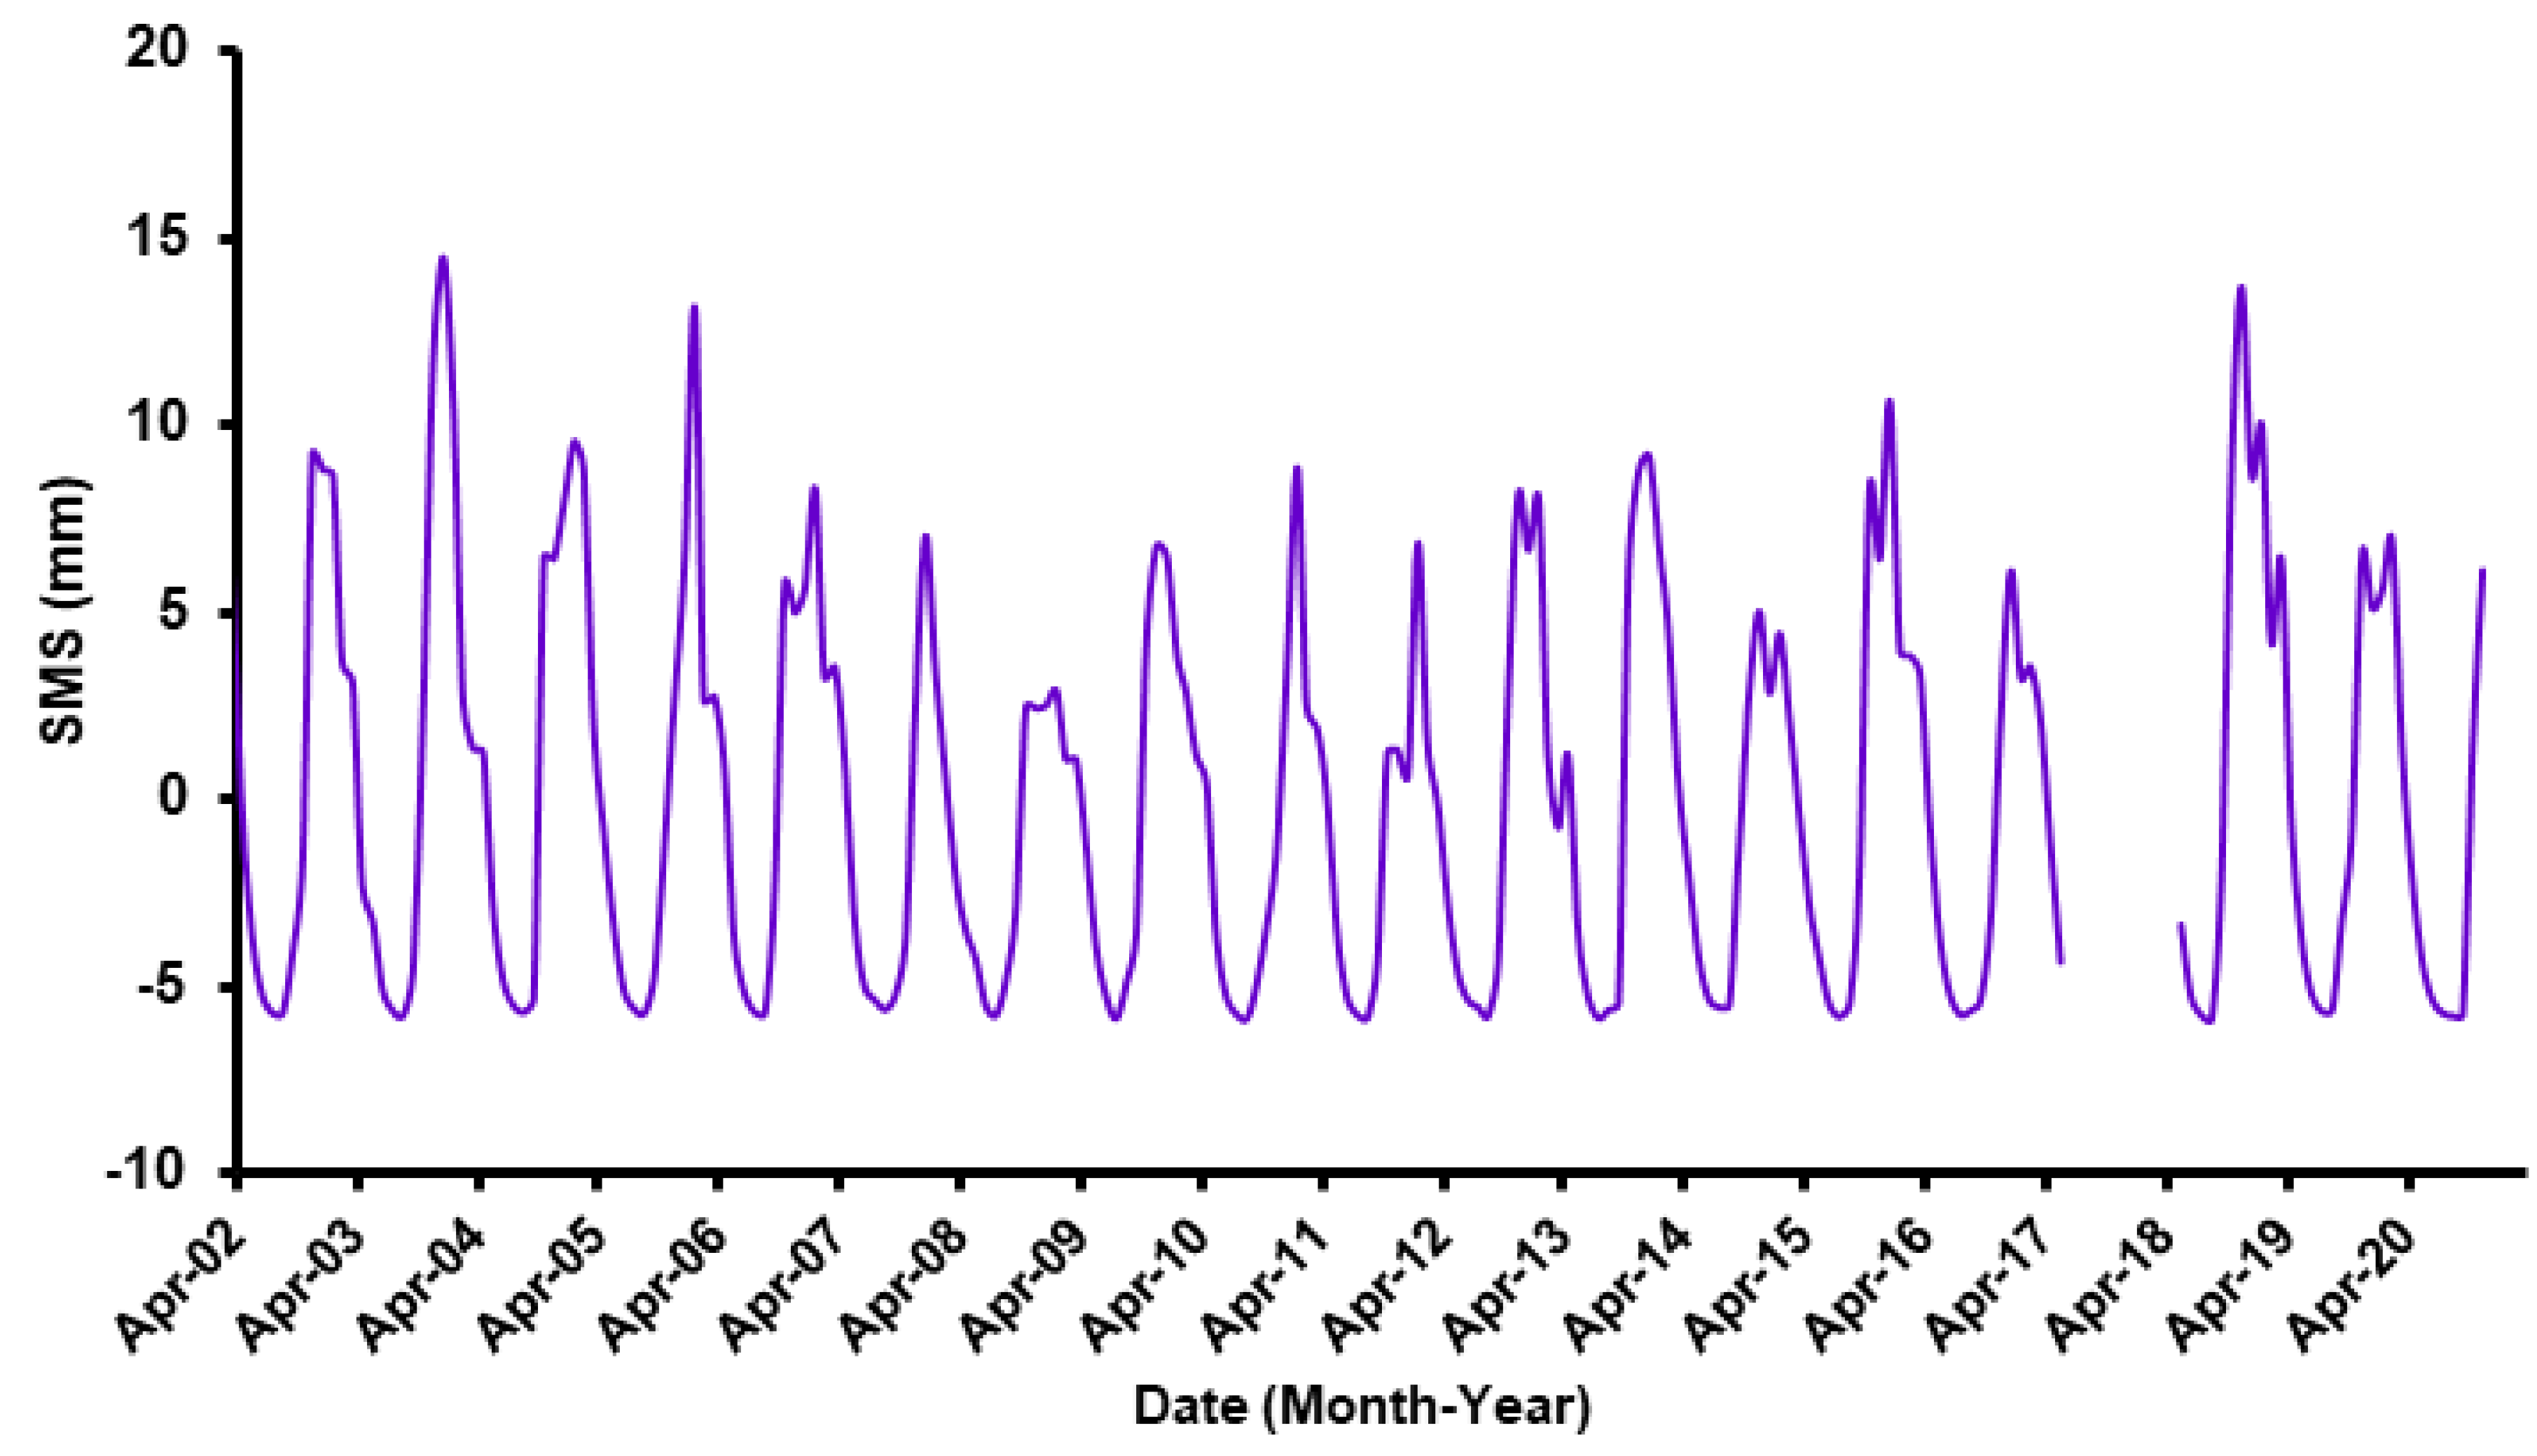
| ΔSMS | −0.03 ± 0.02 | +0.01 ± 0.01 | +0.08 ± 0.04 | −0.84 ± 1.45 | |
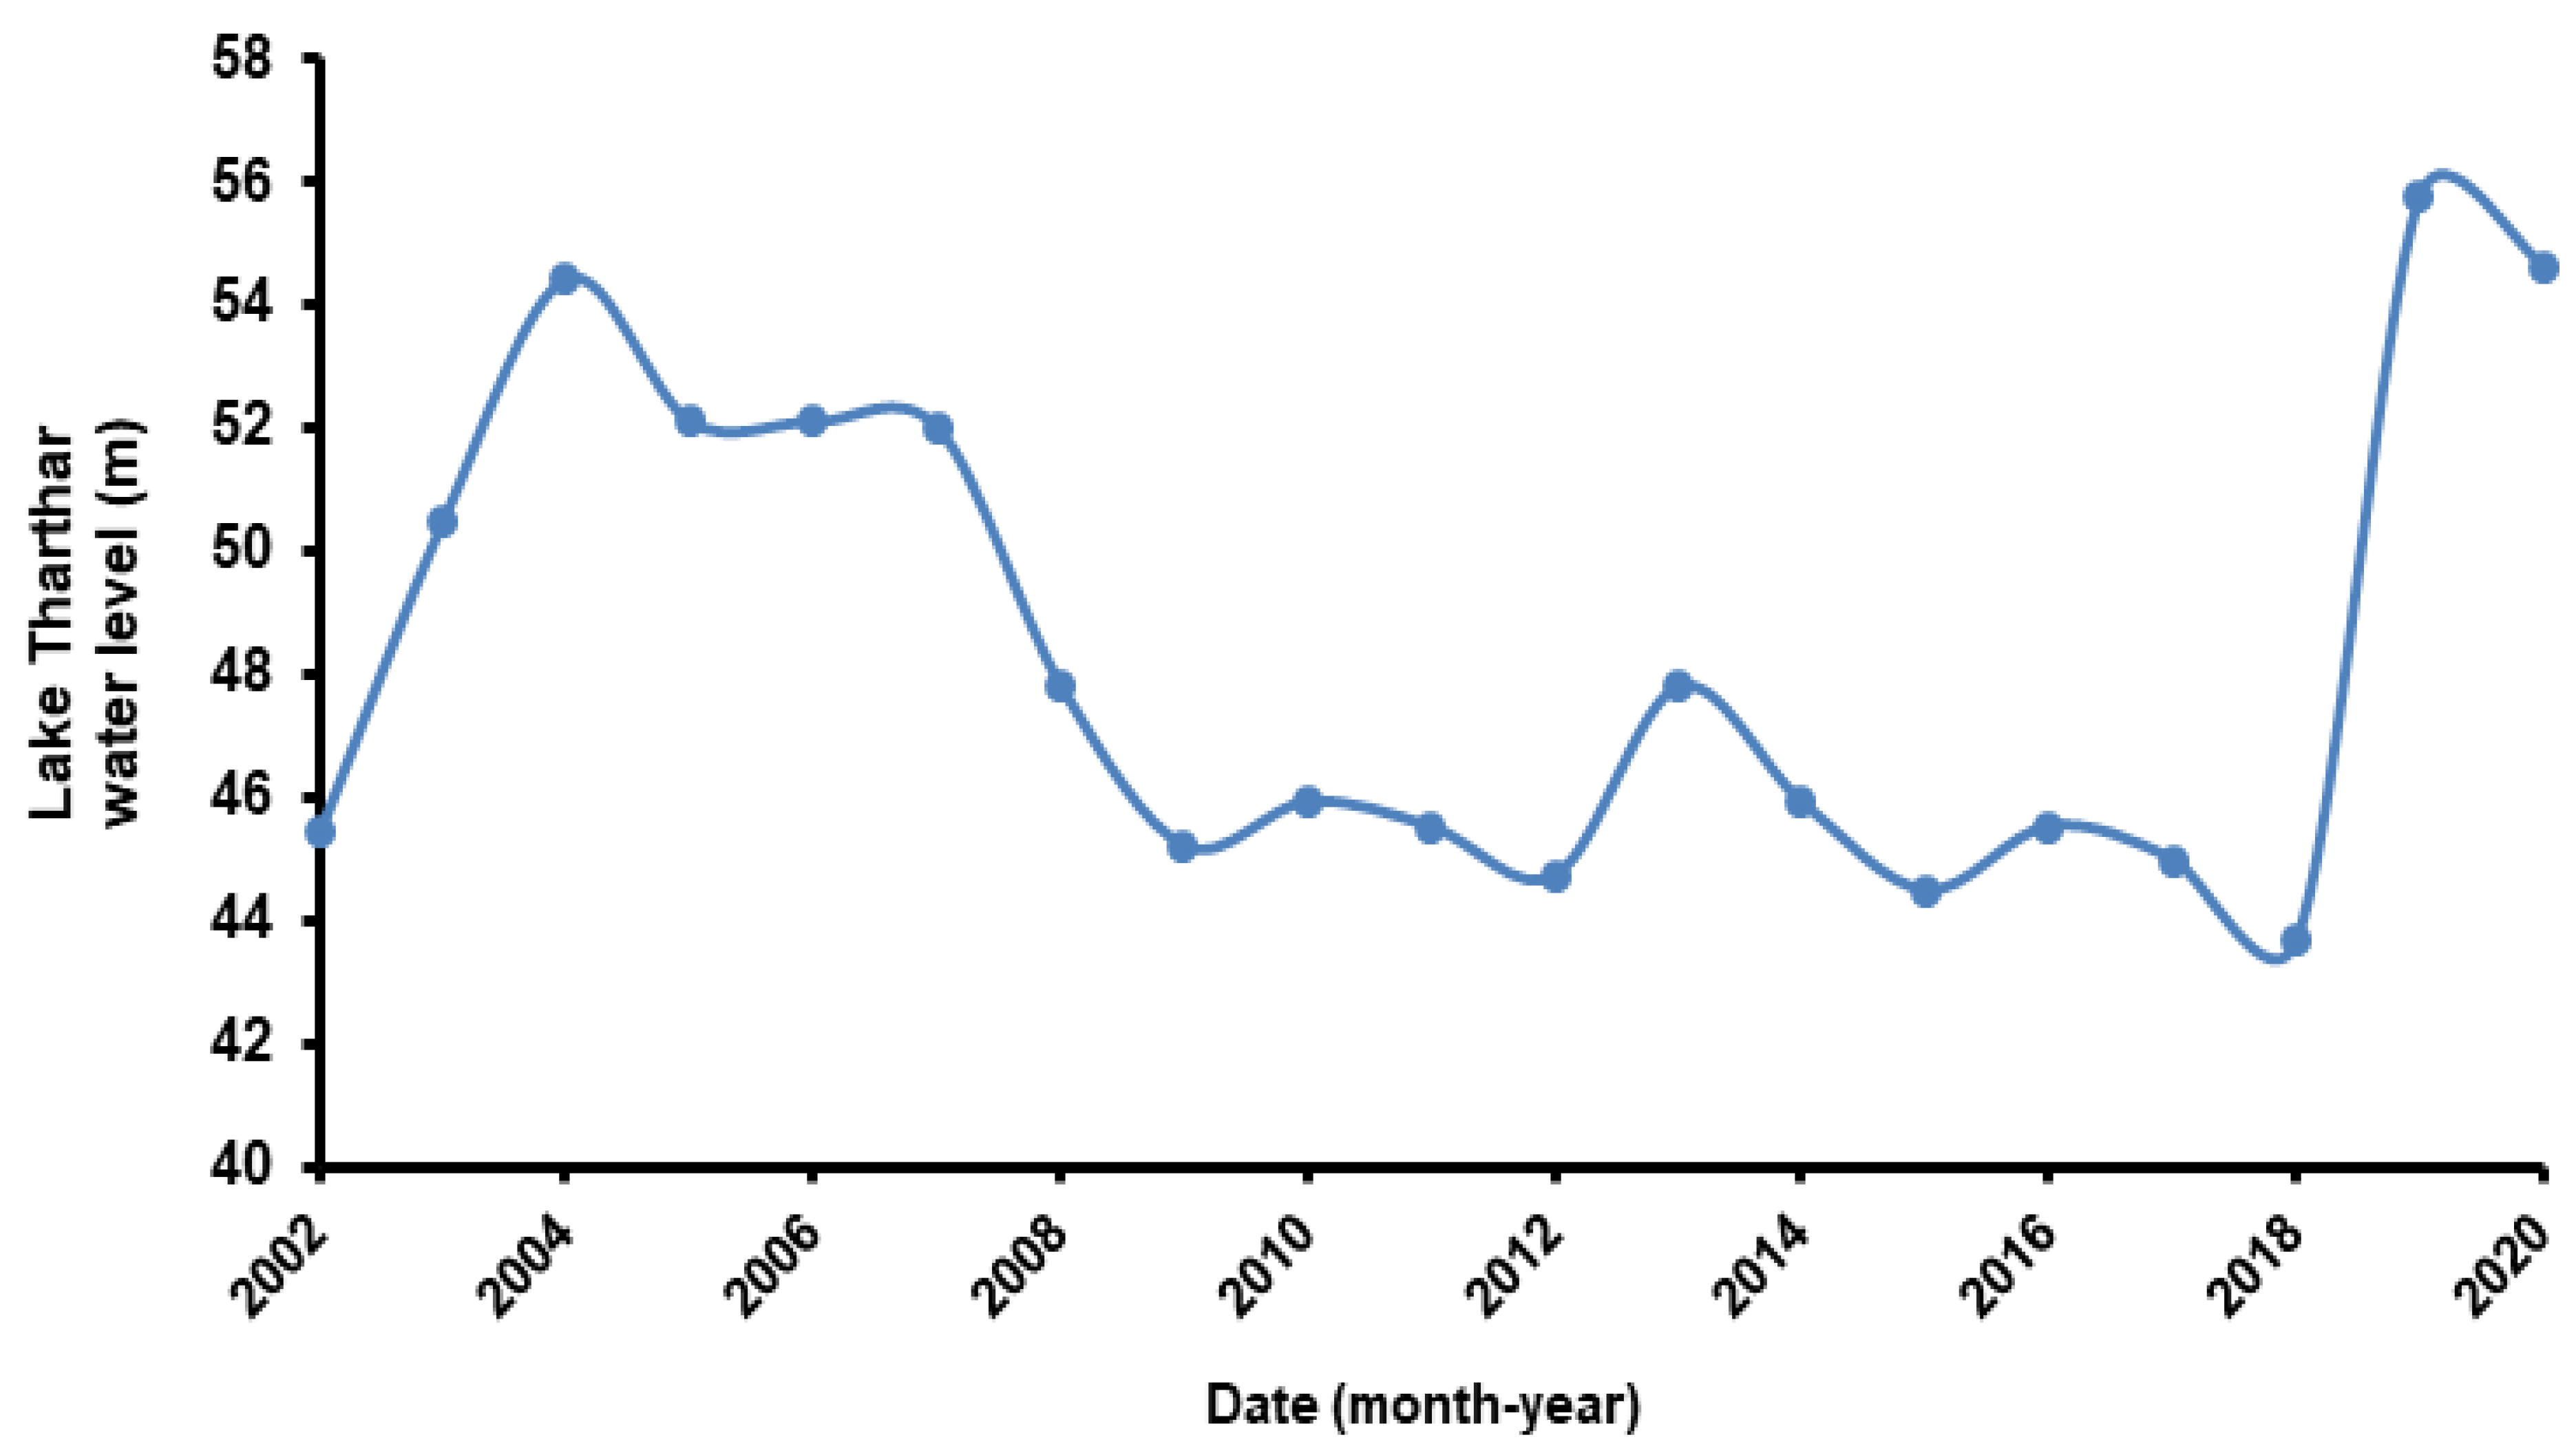
| Tharthar Lake | −0.62 ± 0.06 | +9.28 ± 0.93 | −2.48 ± 0.25 | +34.05 ± 3.4 | |
| ΔGWS p-value | −4.86 ± 0.68 <0.0001 | −2.47 ± 2.20 0.0542 | −3.79 ± 1.20 <0.0001 | −4.63 ± 12.99 0.0253 | |
| AAP | 223.4 | 252.5 | 194.2 | 311.6 | |
Publisher’s Note: MDPI stays neutral with regard to jurisdictional claims in published maps and institutional affiliations. |
© 2022 by the authors. Licensee MDPI, Basel, Switzerland. This article is an open access article distributed under the terms and conditions of the Creative Commons Attribution (CC BY) license (https://creativecommons.org/licenses/by/4.0/).
Share and Cite
Othman, A.; Abdelrady, A.; Mohamed, A. Monitoring Mass Variations in Iraq Using Time-Variable Gravity Data. Remote Sens. 2022, 14, 3346. https://doi.org/10.3390/rs14143346
Othman A, Abdelrady A, Mohamed A. Monitoring Mass Variations in Iraq Using Time-Variable Gravity Data. Remote Sensing. 2022; 14(14):3346. https://doi.org/10.3390/rs14143346
Chicago/Turabian StyleOthman, Abdullah, Ahmed Abdelrady, and Ahmed Mohamed. 2022. "Monitoring Mass Variations in Iraq Using Time-Variable Gravity Data" Remote Sensing 14, no. 14: 3346. https://doi.org/10.3390/rs14143346
APA StyleOthman, A., Abdelrady, A., & Mohamed, A. (2022). Monitoring Mass Variations in Iraq Using Time-Variable Gravity Data. Remote Sensing, 14(14), 3346. https://doi.org/10.3390/rs14143346