
Hydro-Geophysical Evaluation of the Regional Variability of Senegal’s Terrestrial Water Storage Using Time-Variable Gravity Data


Abstract
:1. Introduction
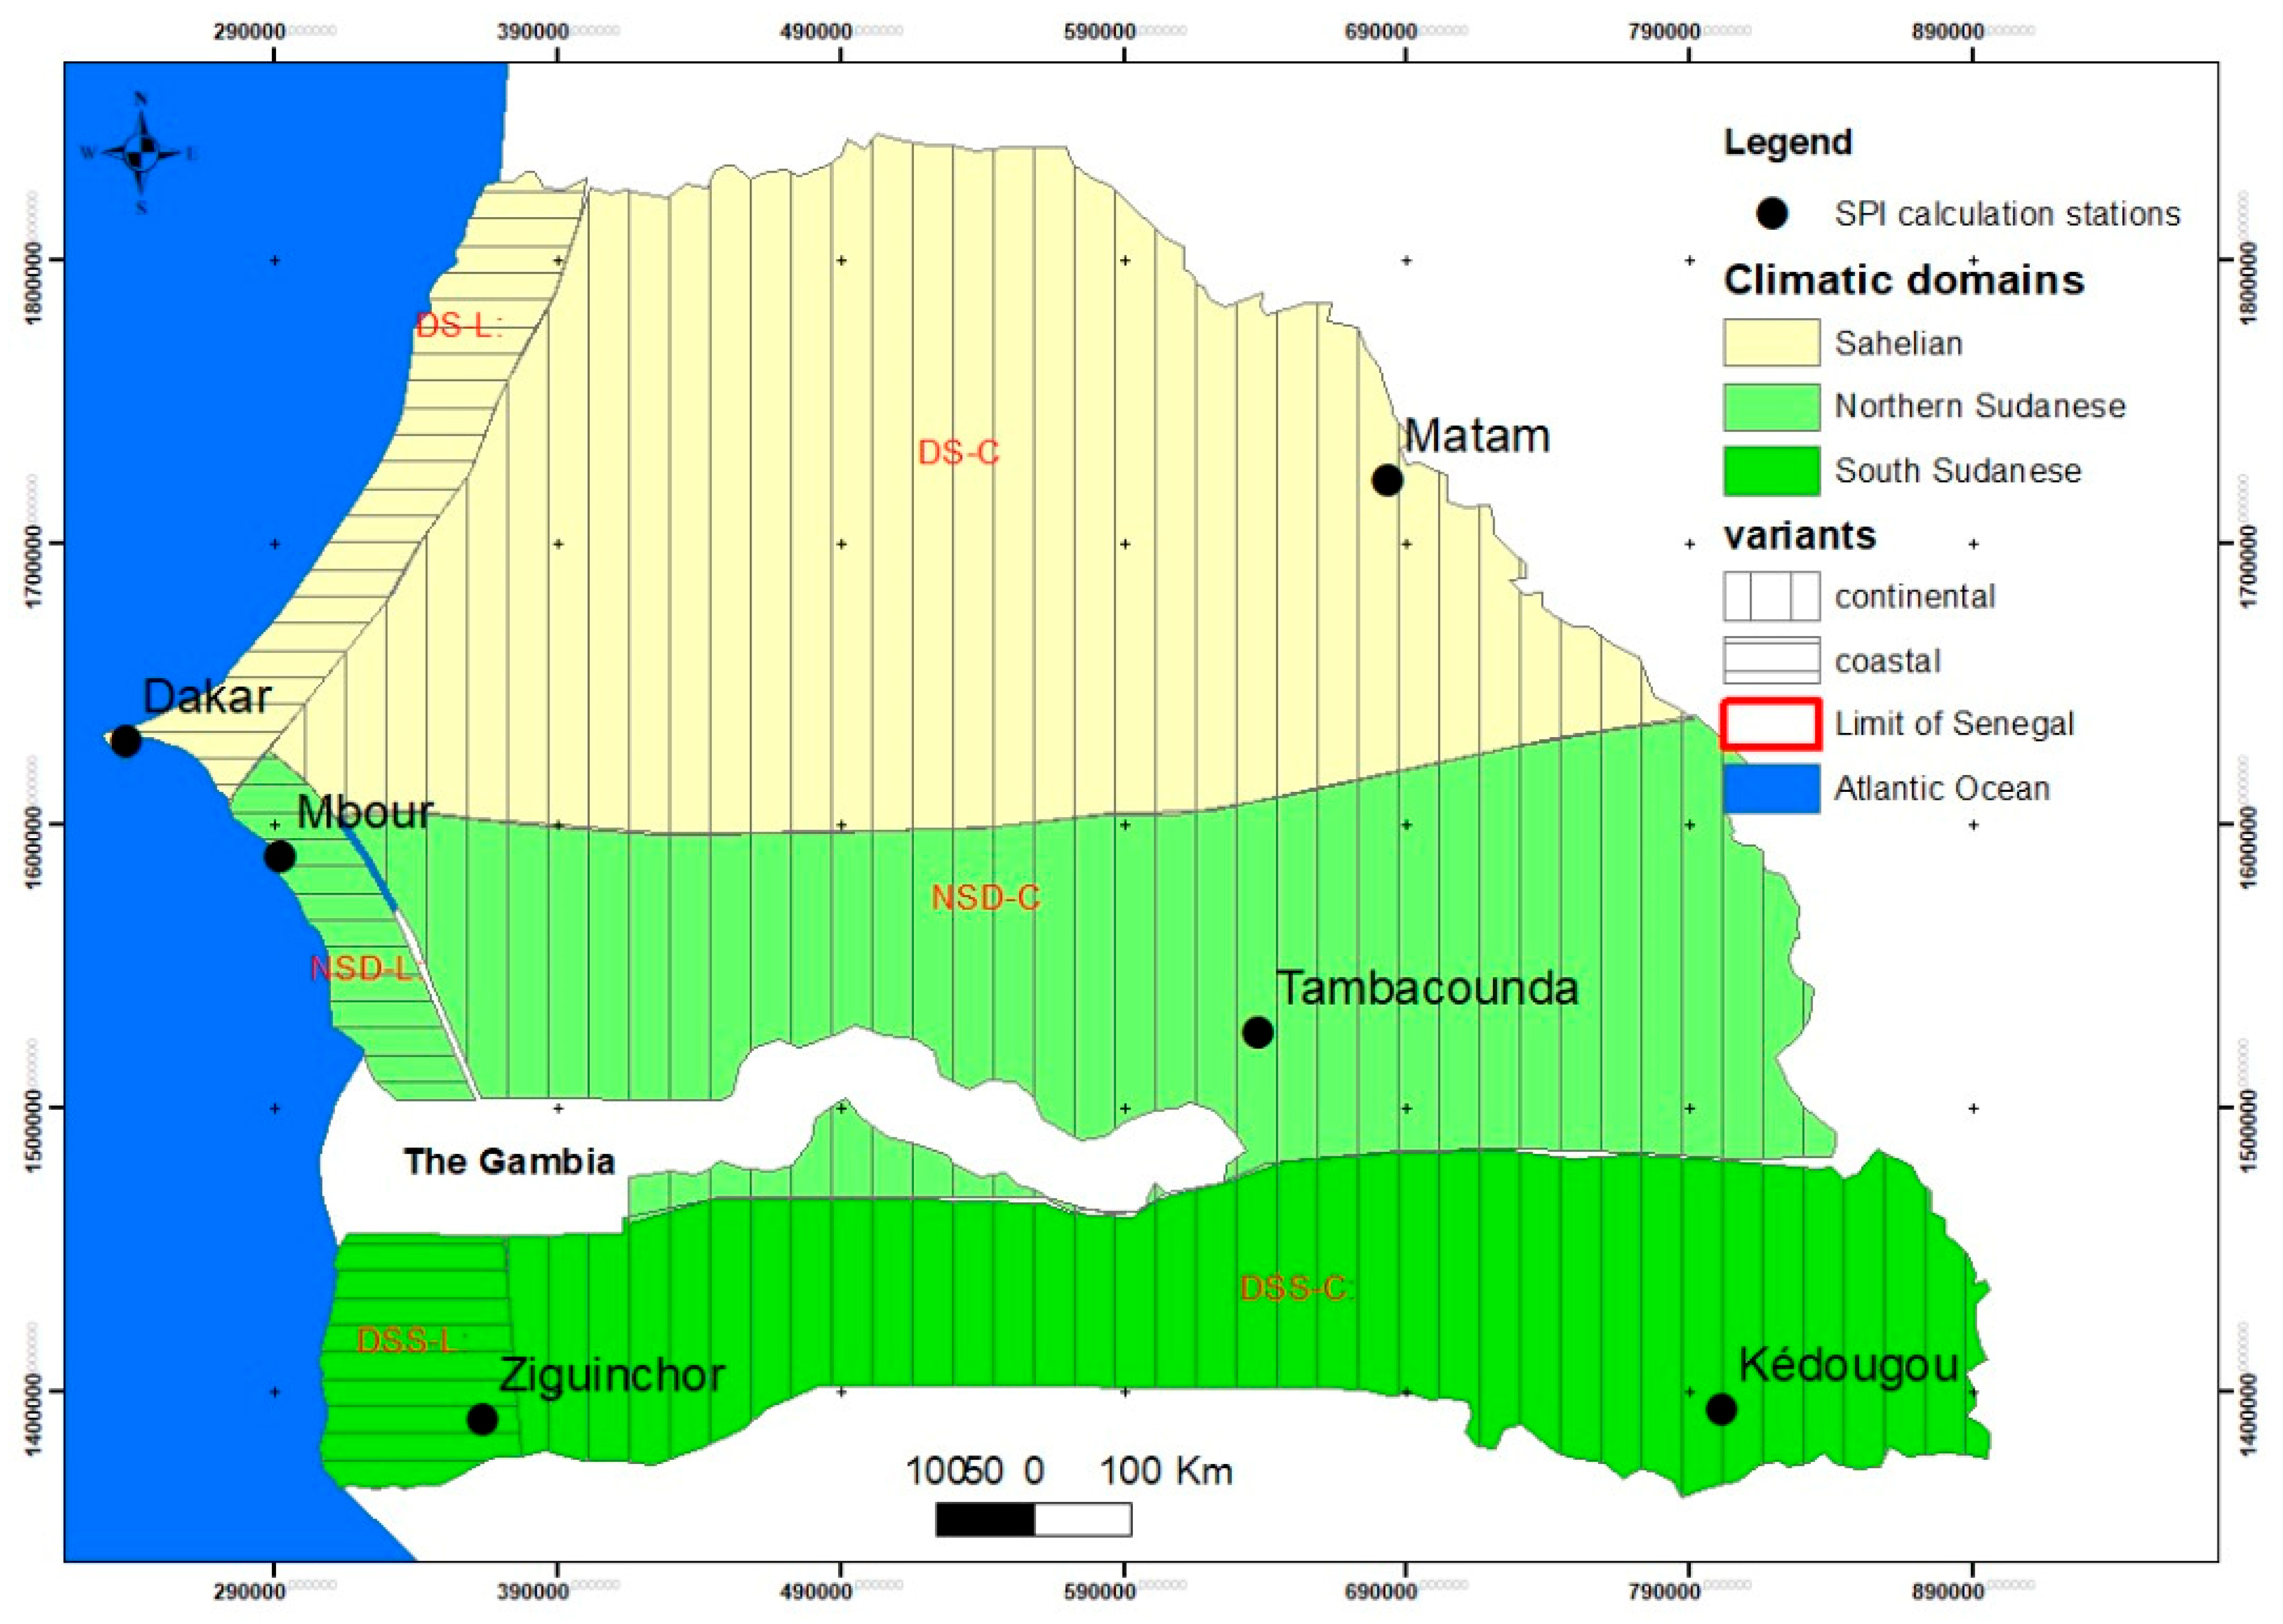
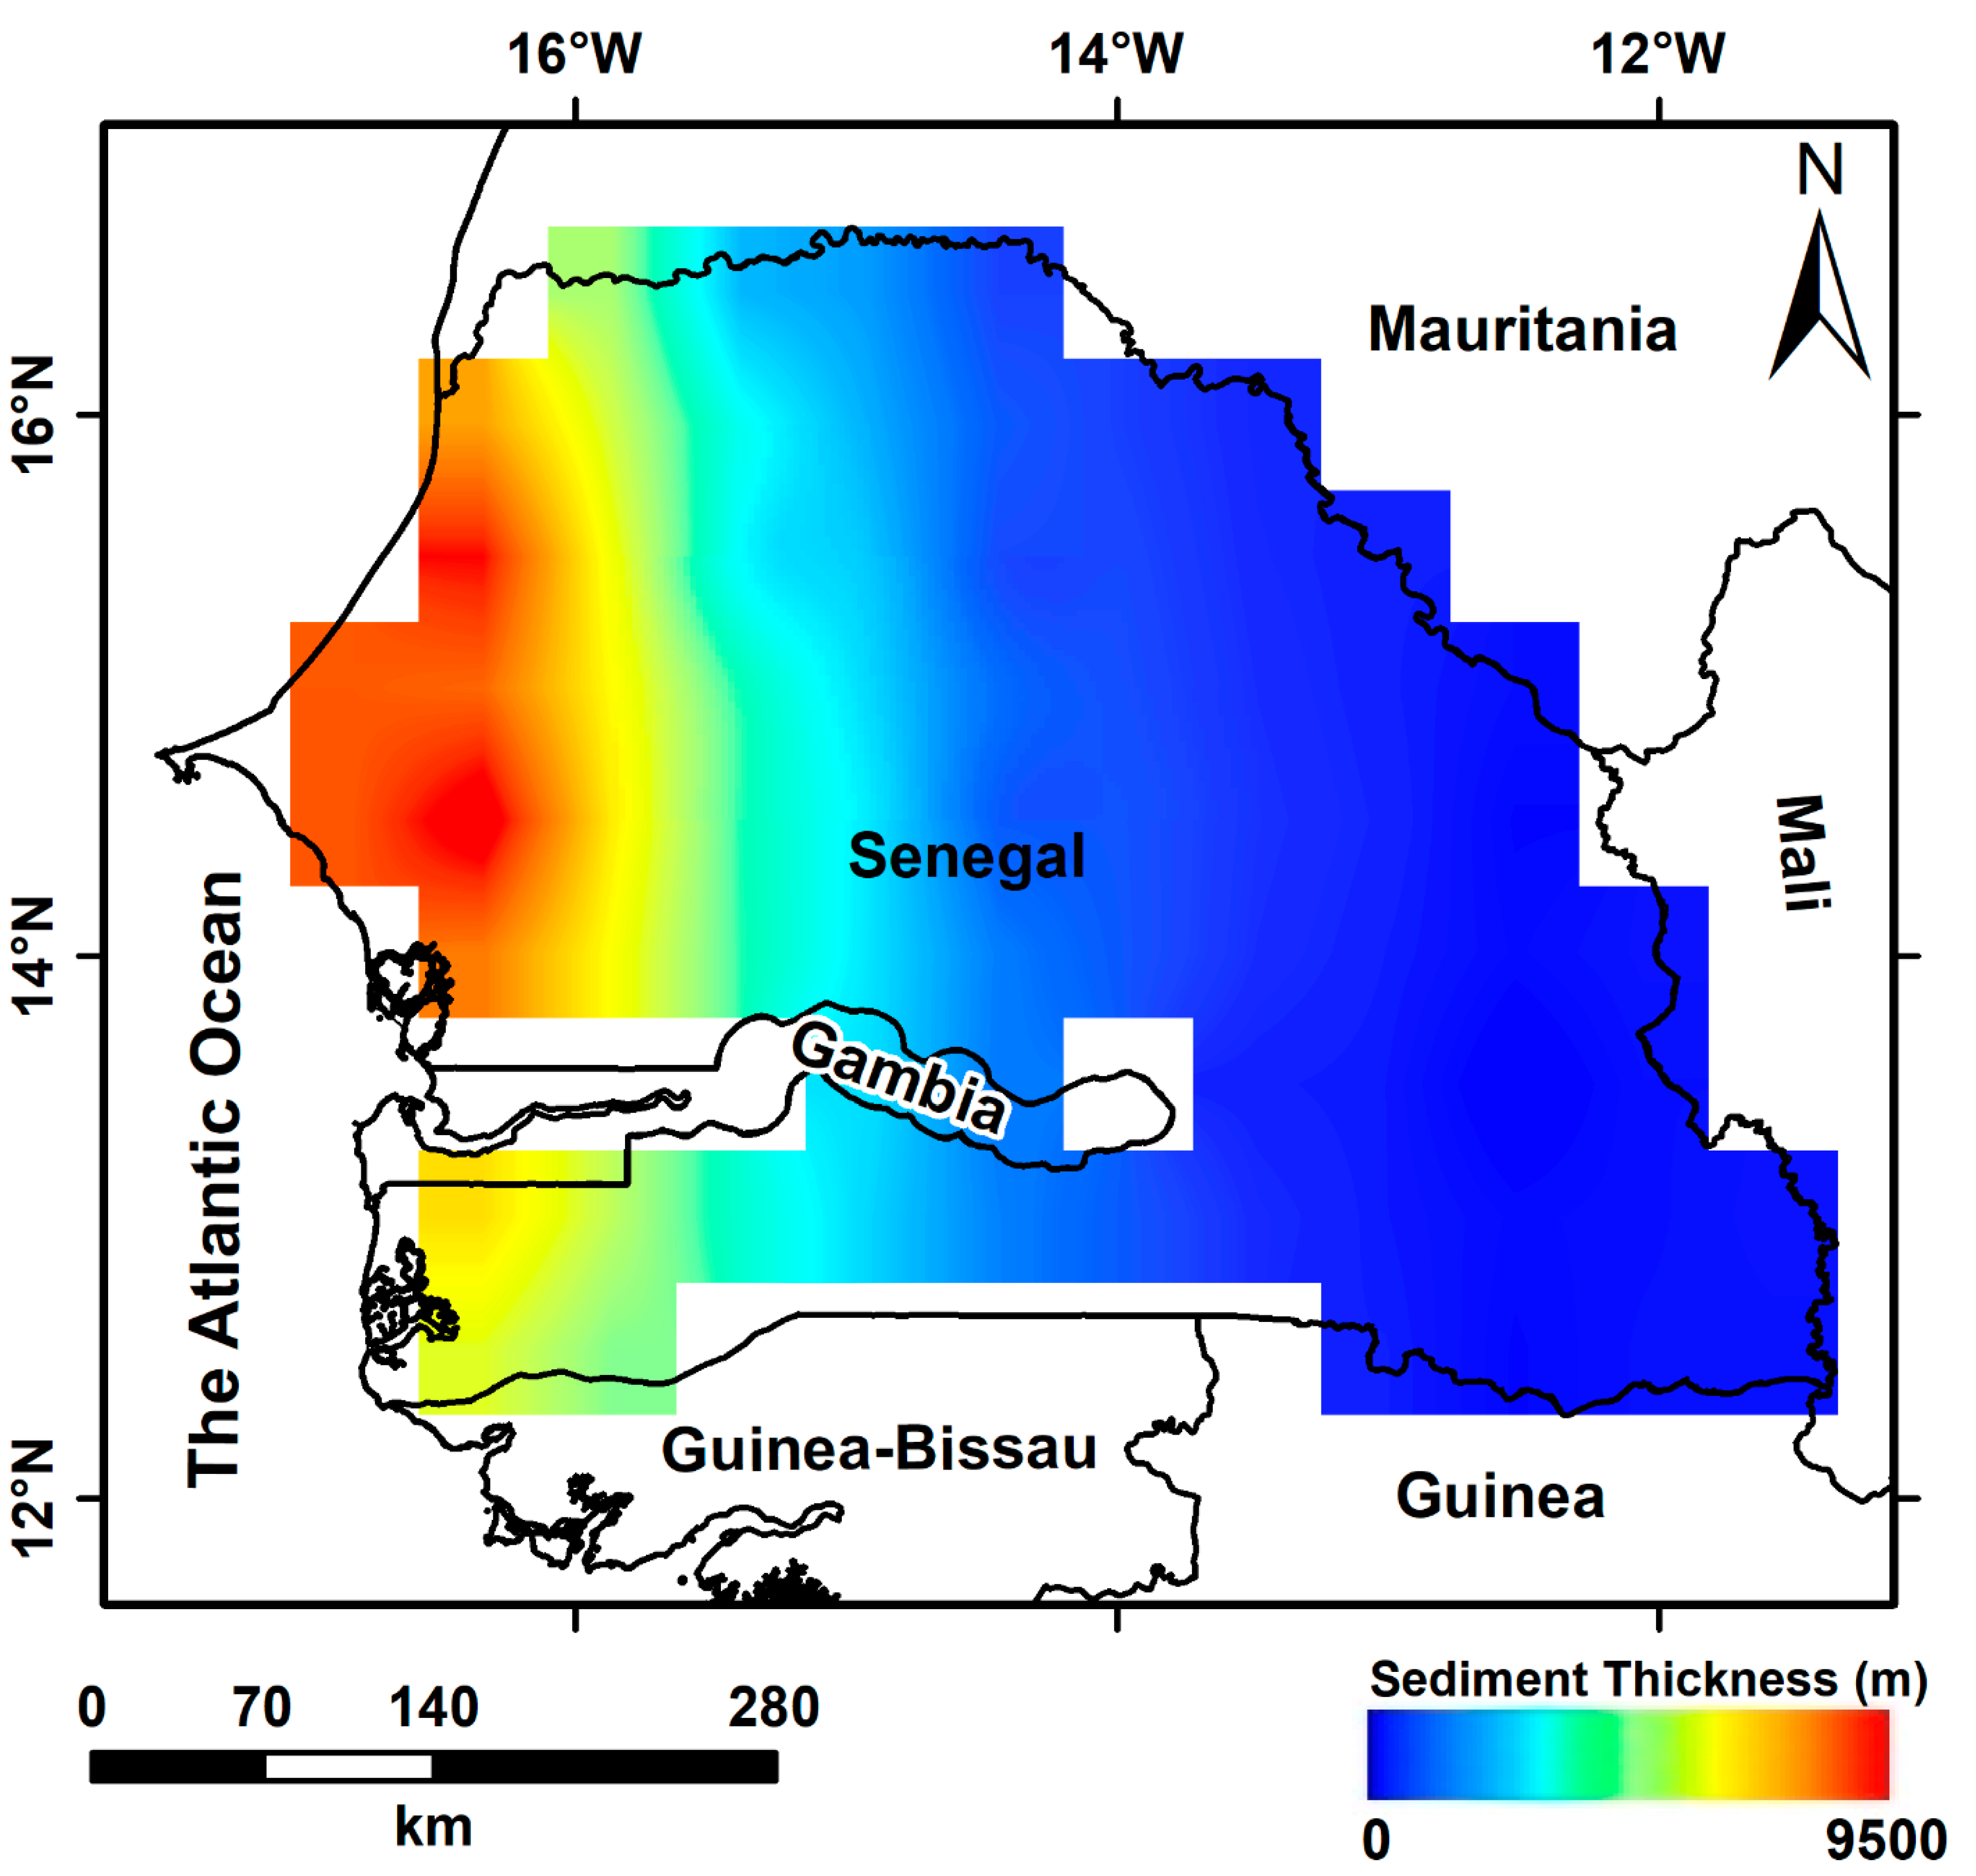
2. Study Area
3. Data and Methods
3.1. Gravity Data
3.2. Groundwater Storage Change
3.3. Rainfall, and Temperature Data
3.4. Standardized Drought Indices
4. Result and Analysis
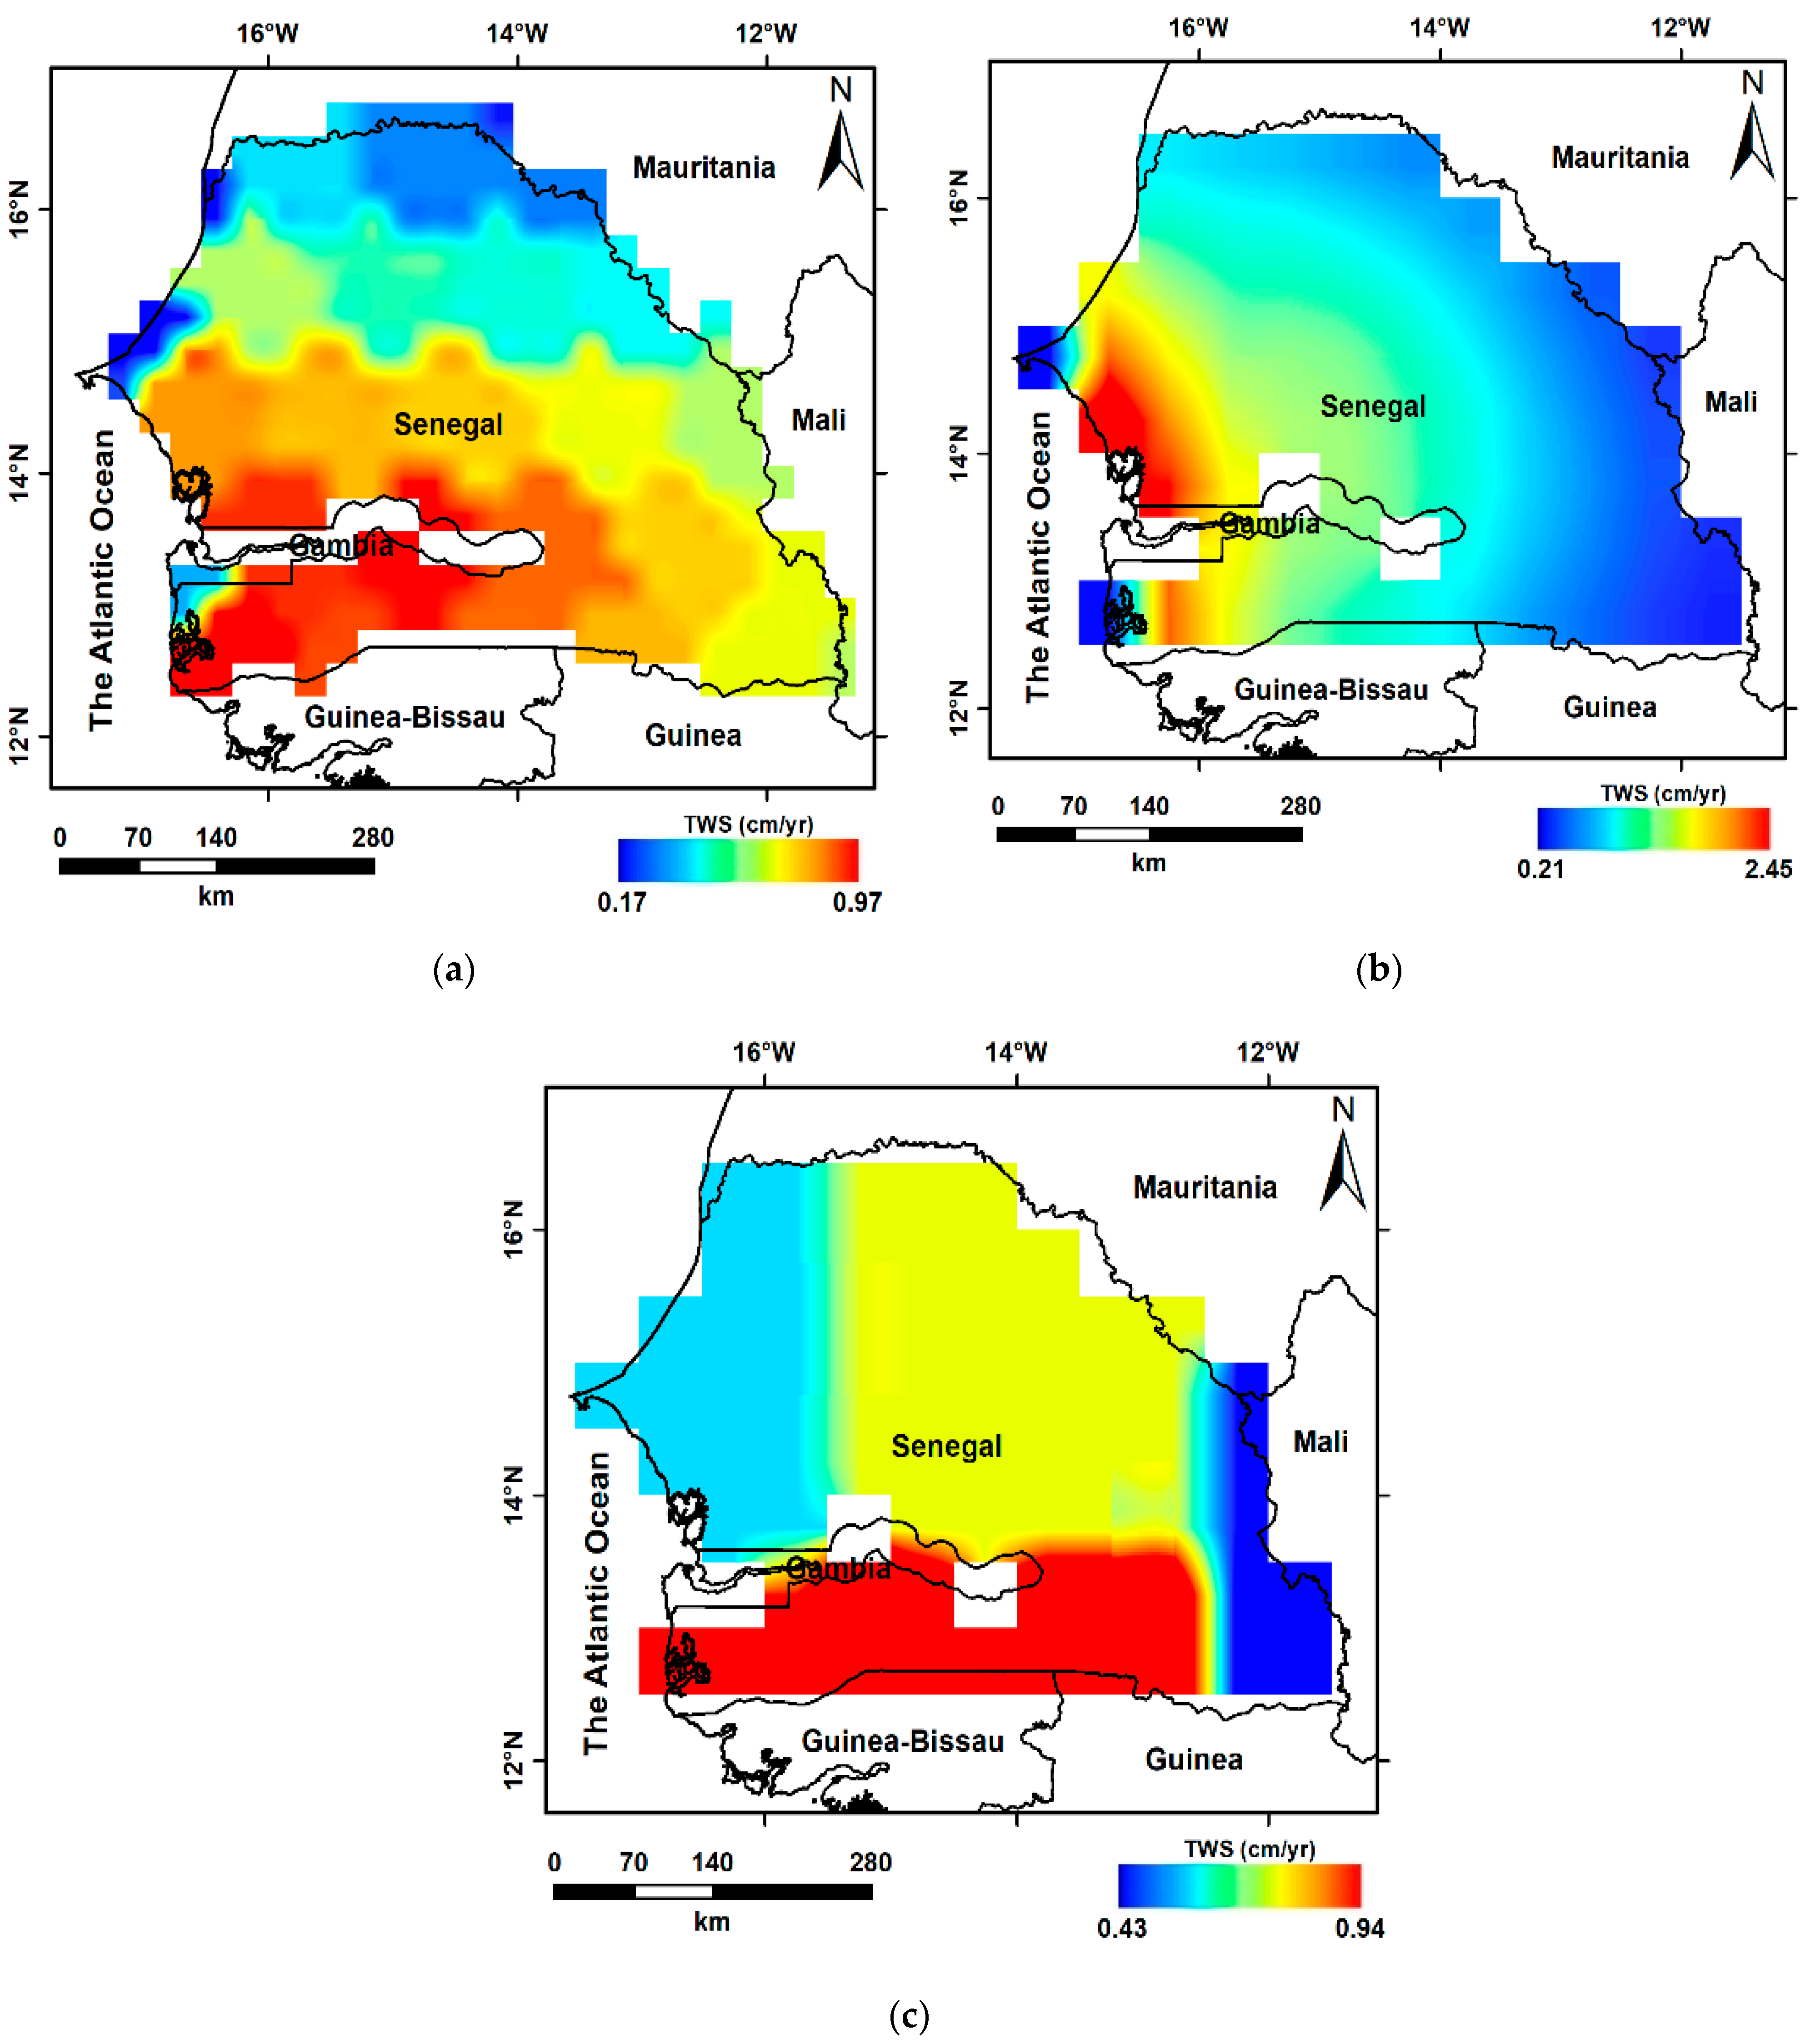
4.1. Analysis of ΔTWS Trends
4.2. Analysis of the Groundwater Storage Variation from GRACE
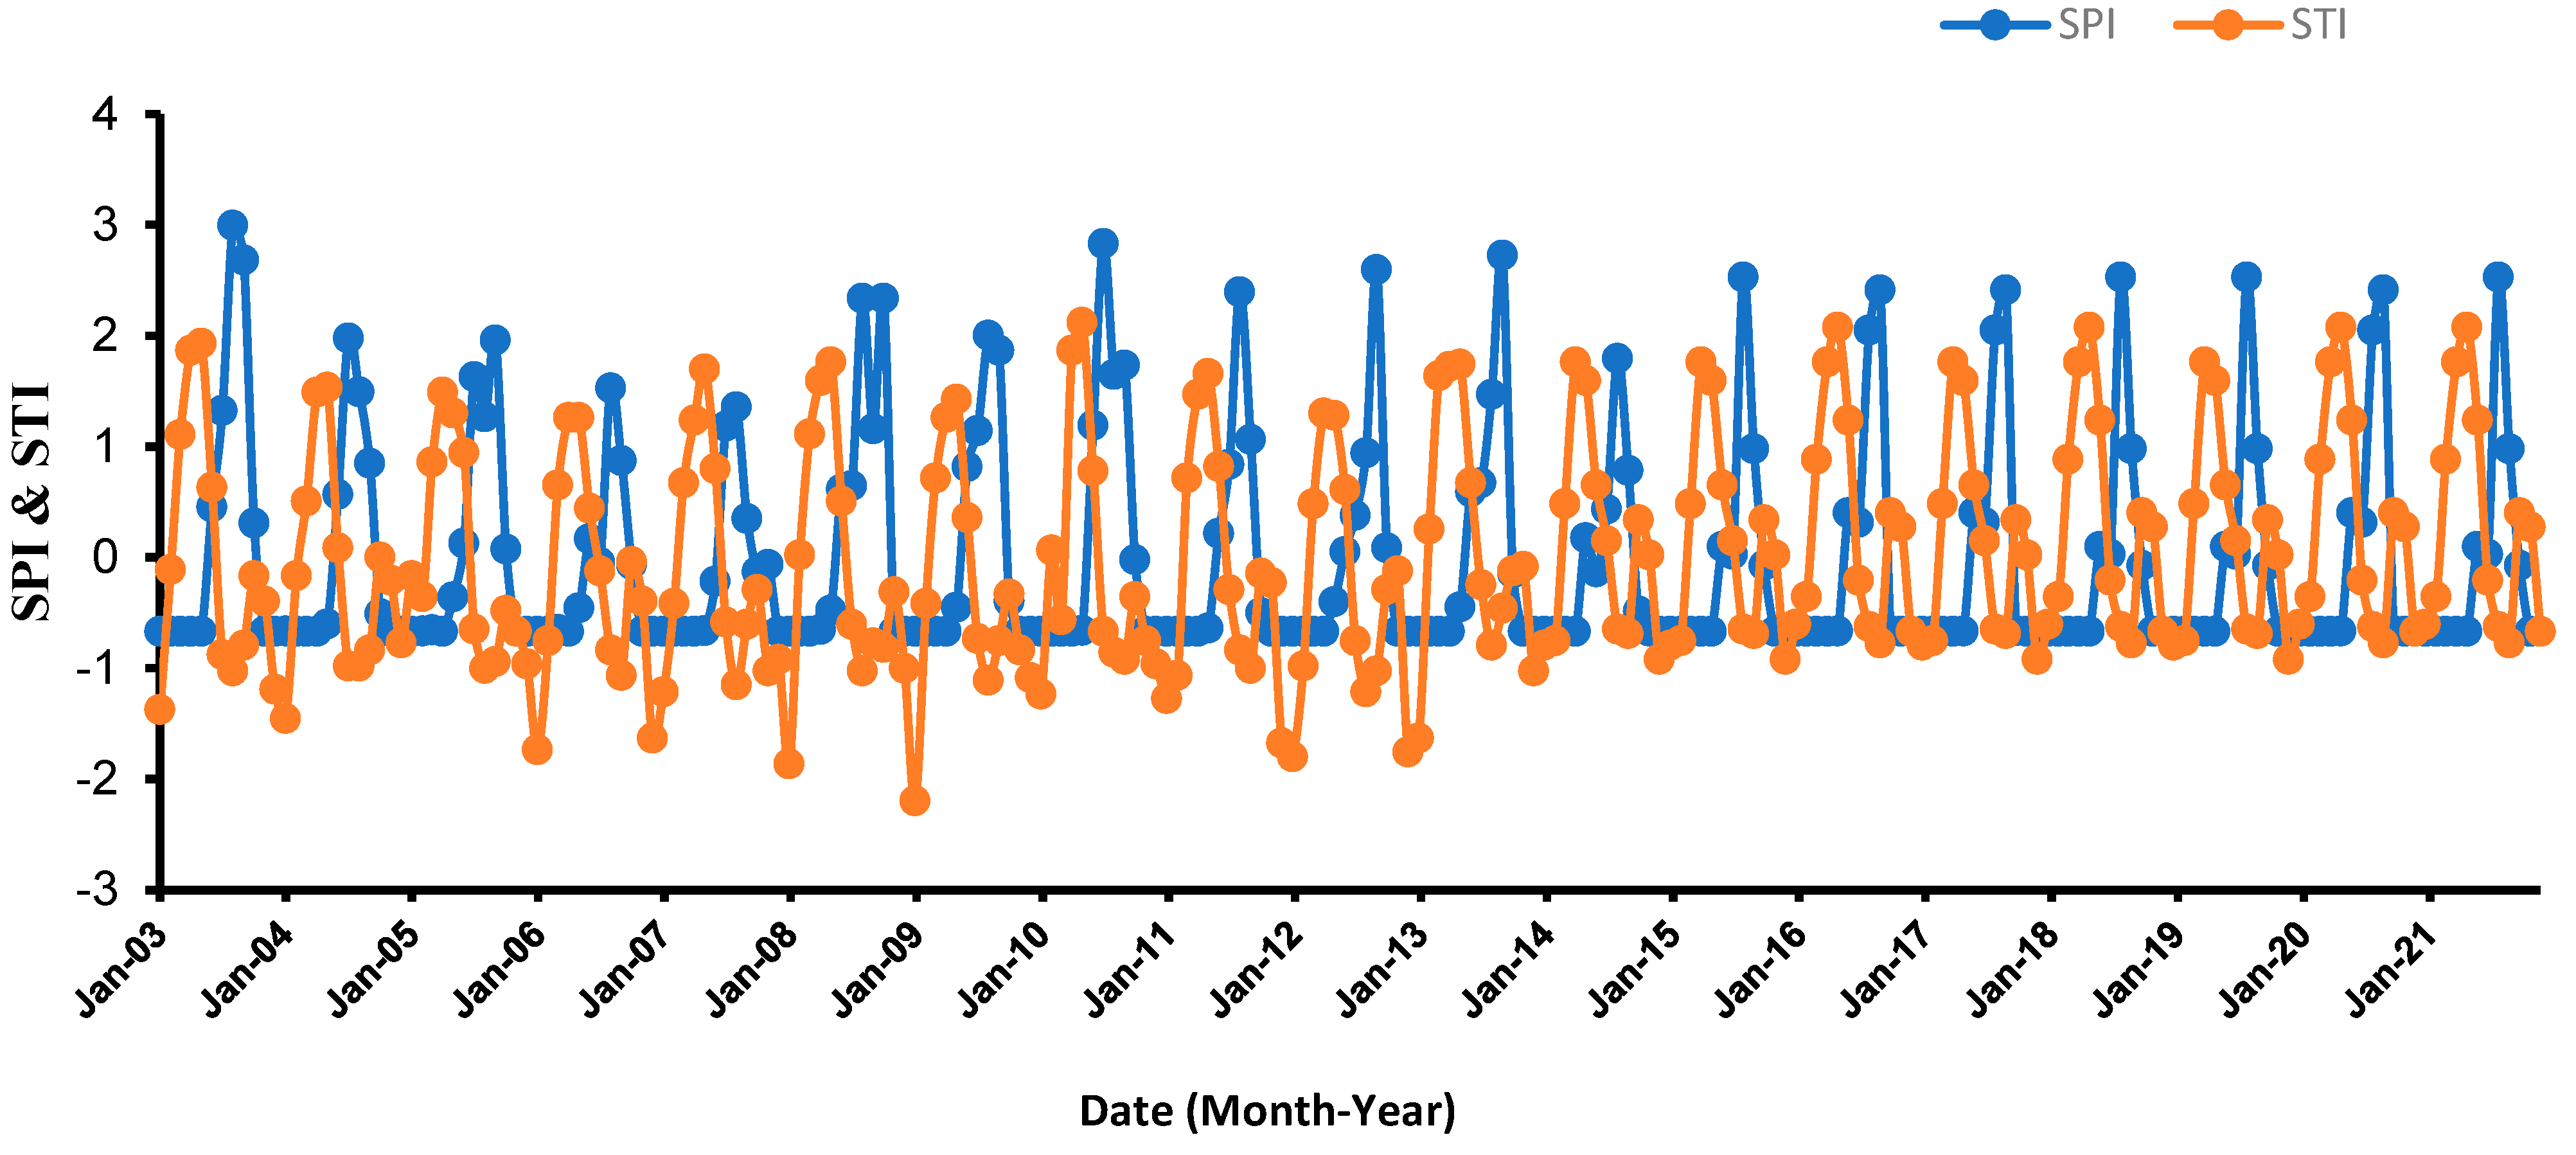
4.3. Investigation of the Relationship between Drought Indices and GRACE Data
5. Discussion
6. Conclusions
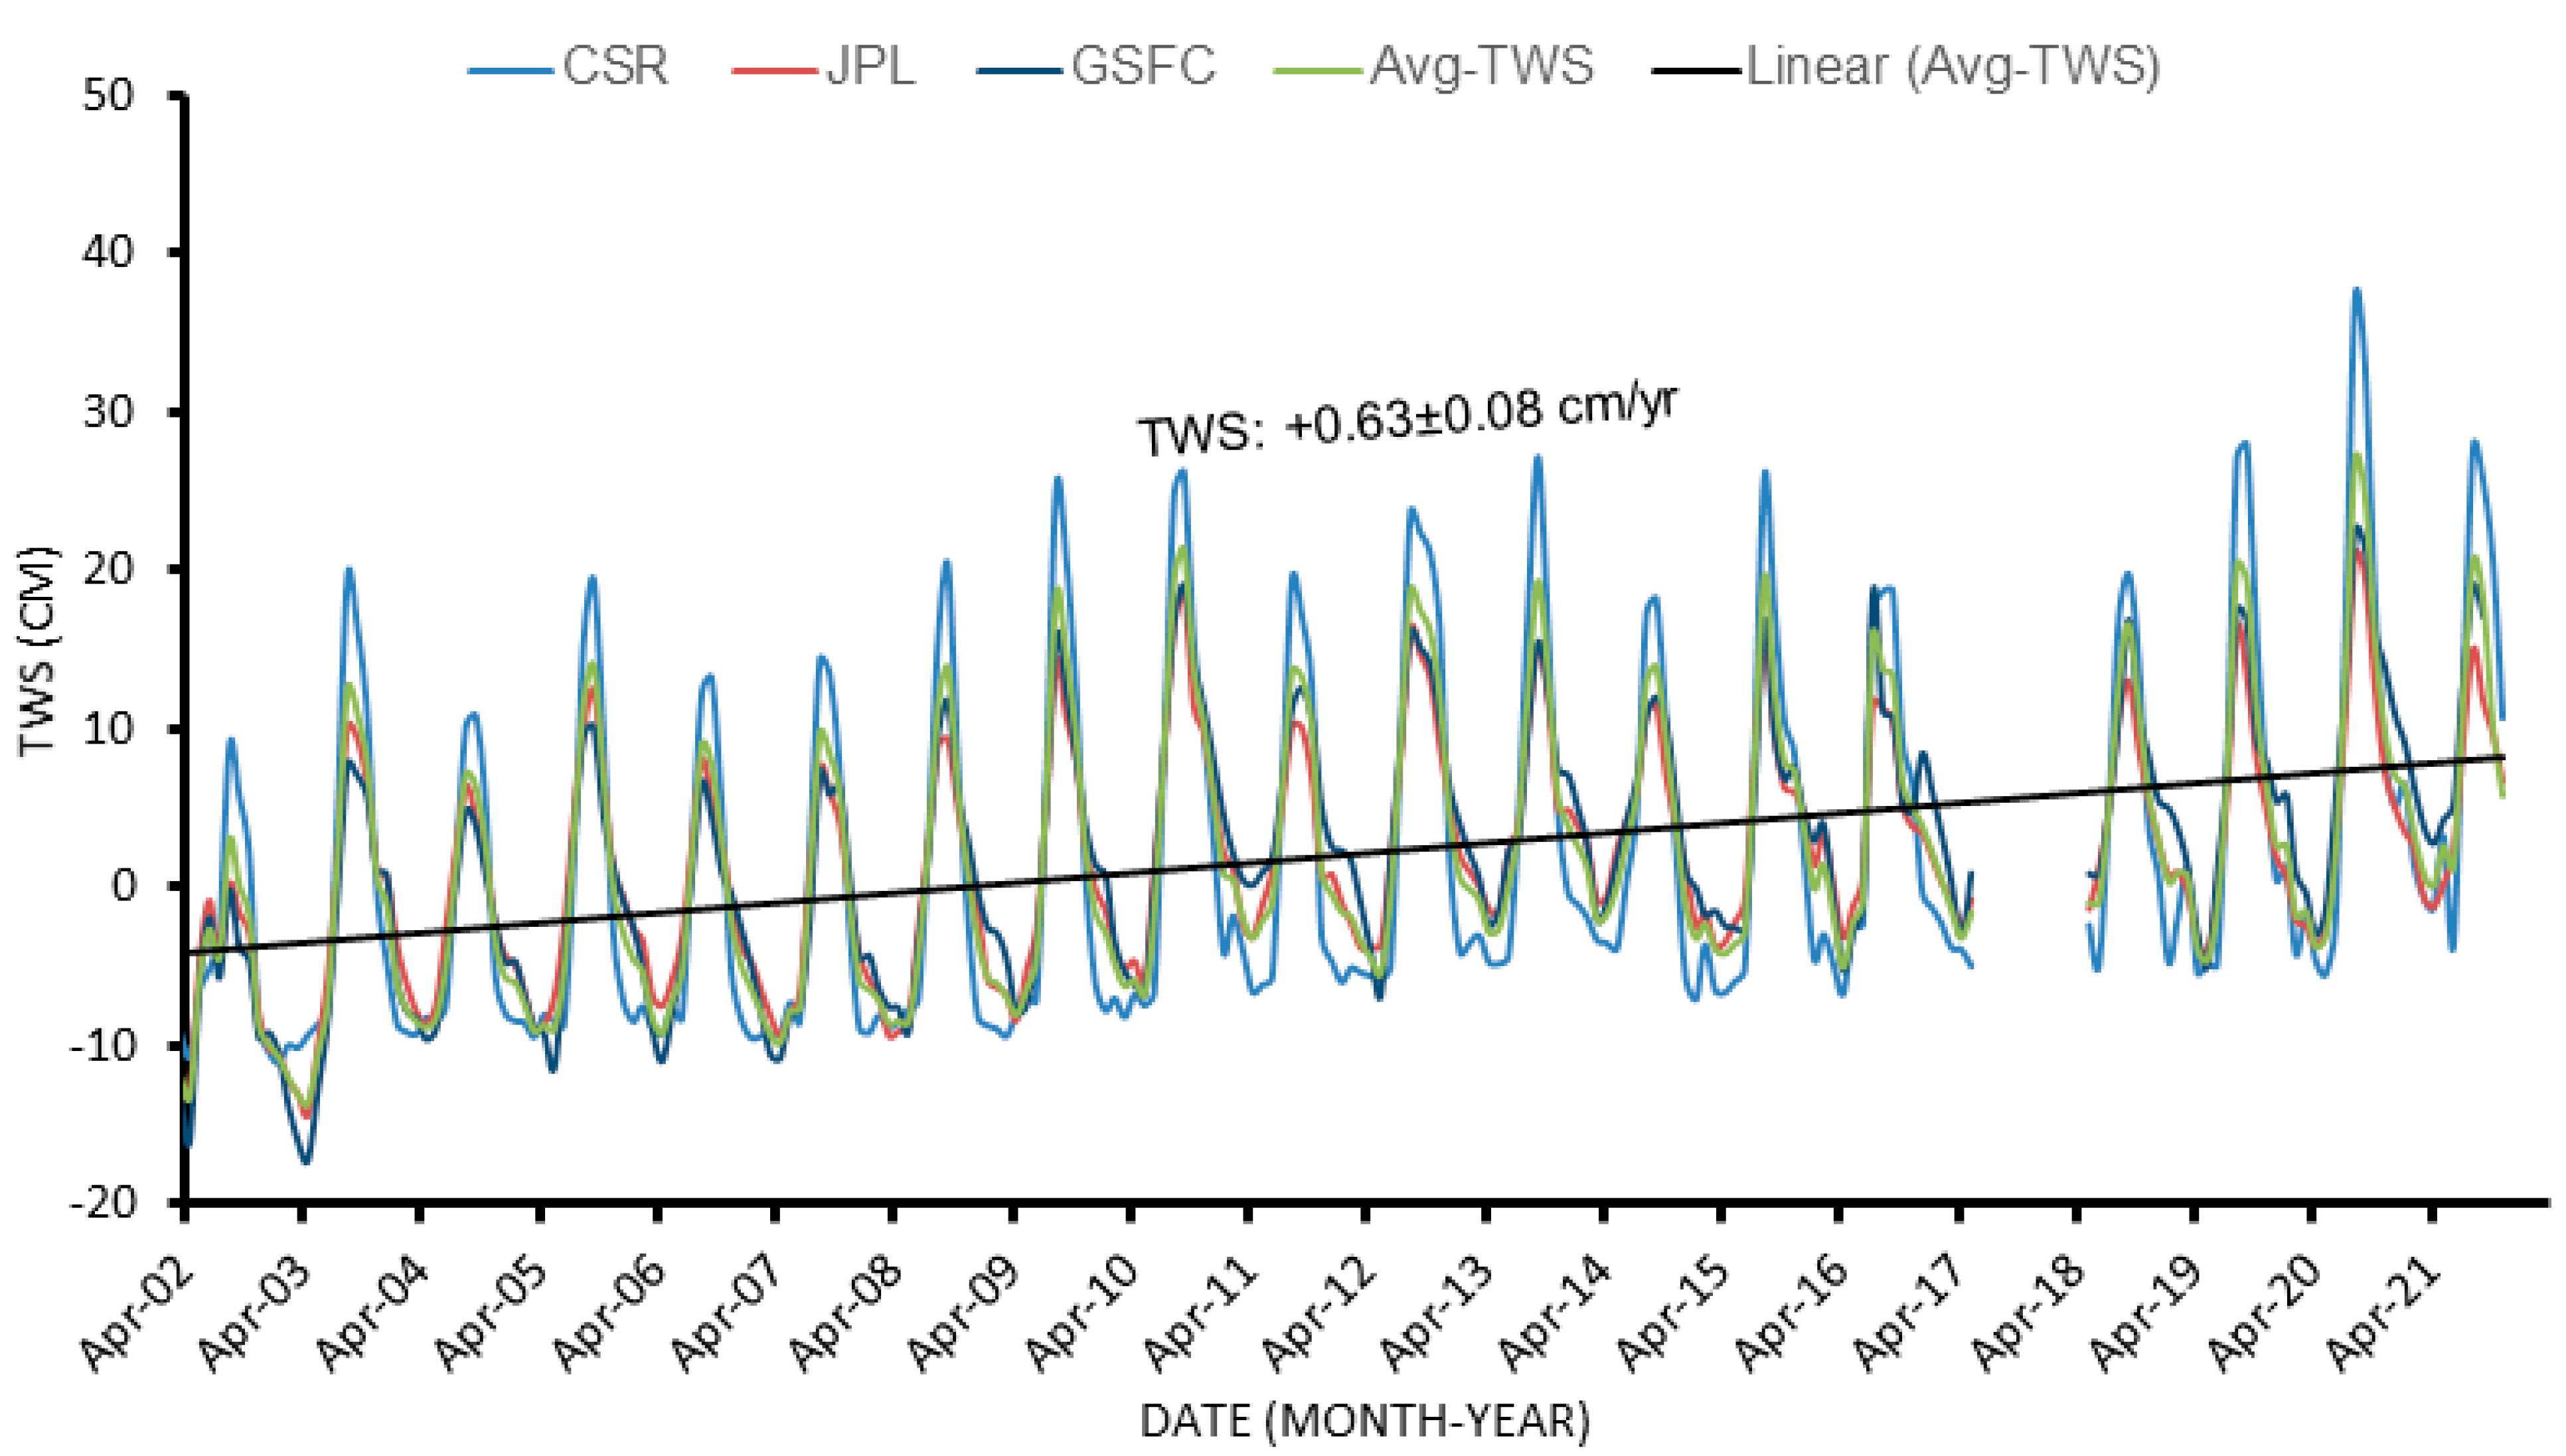
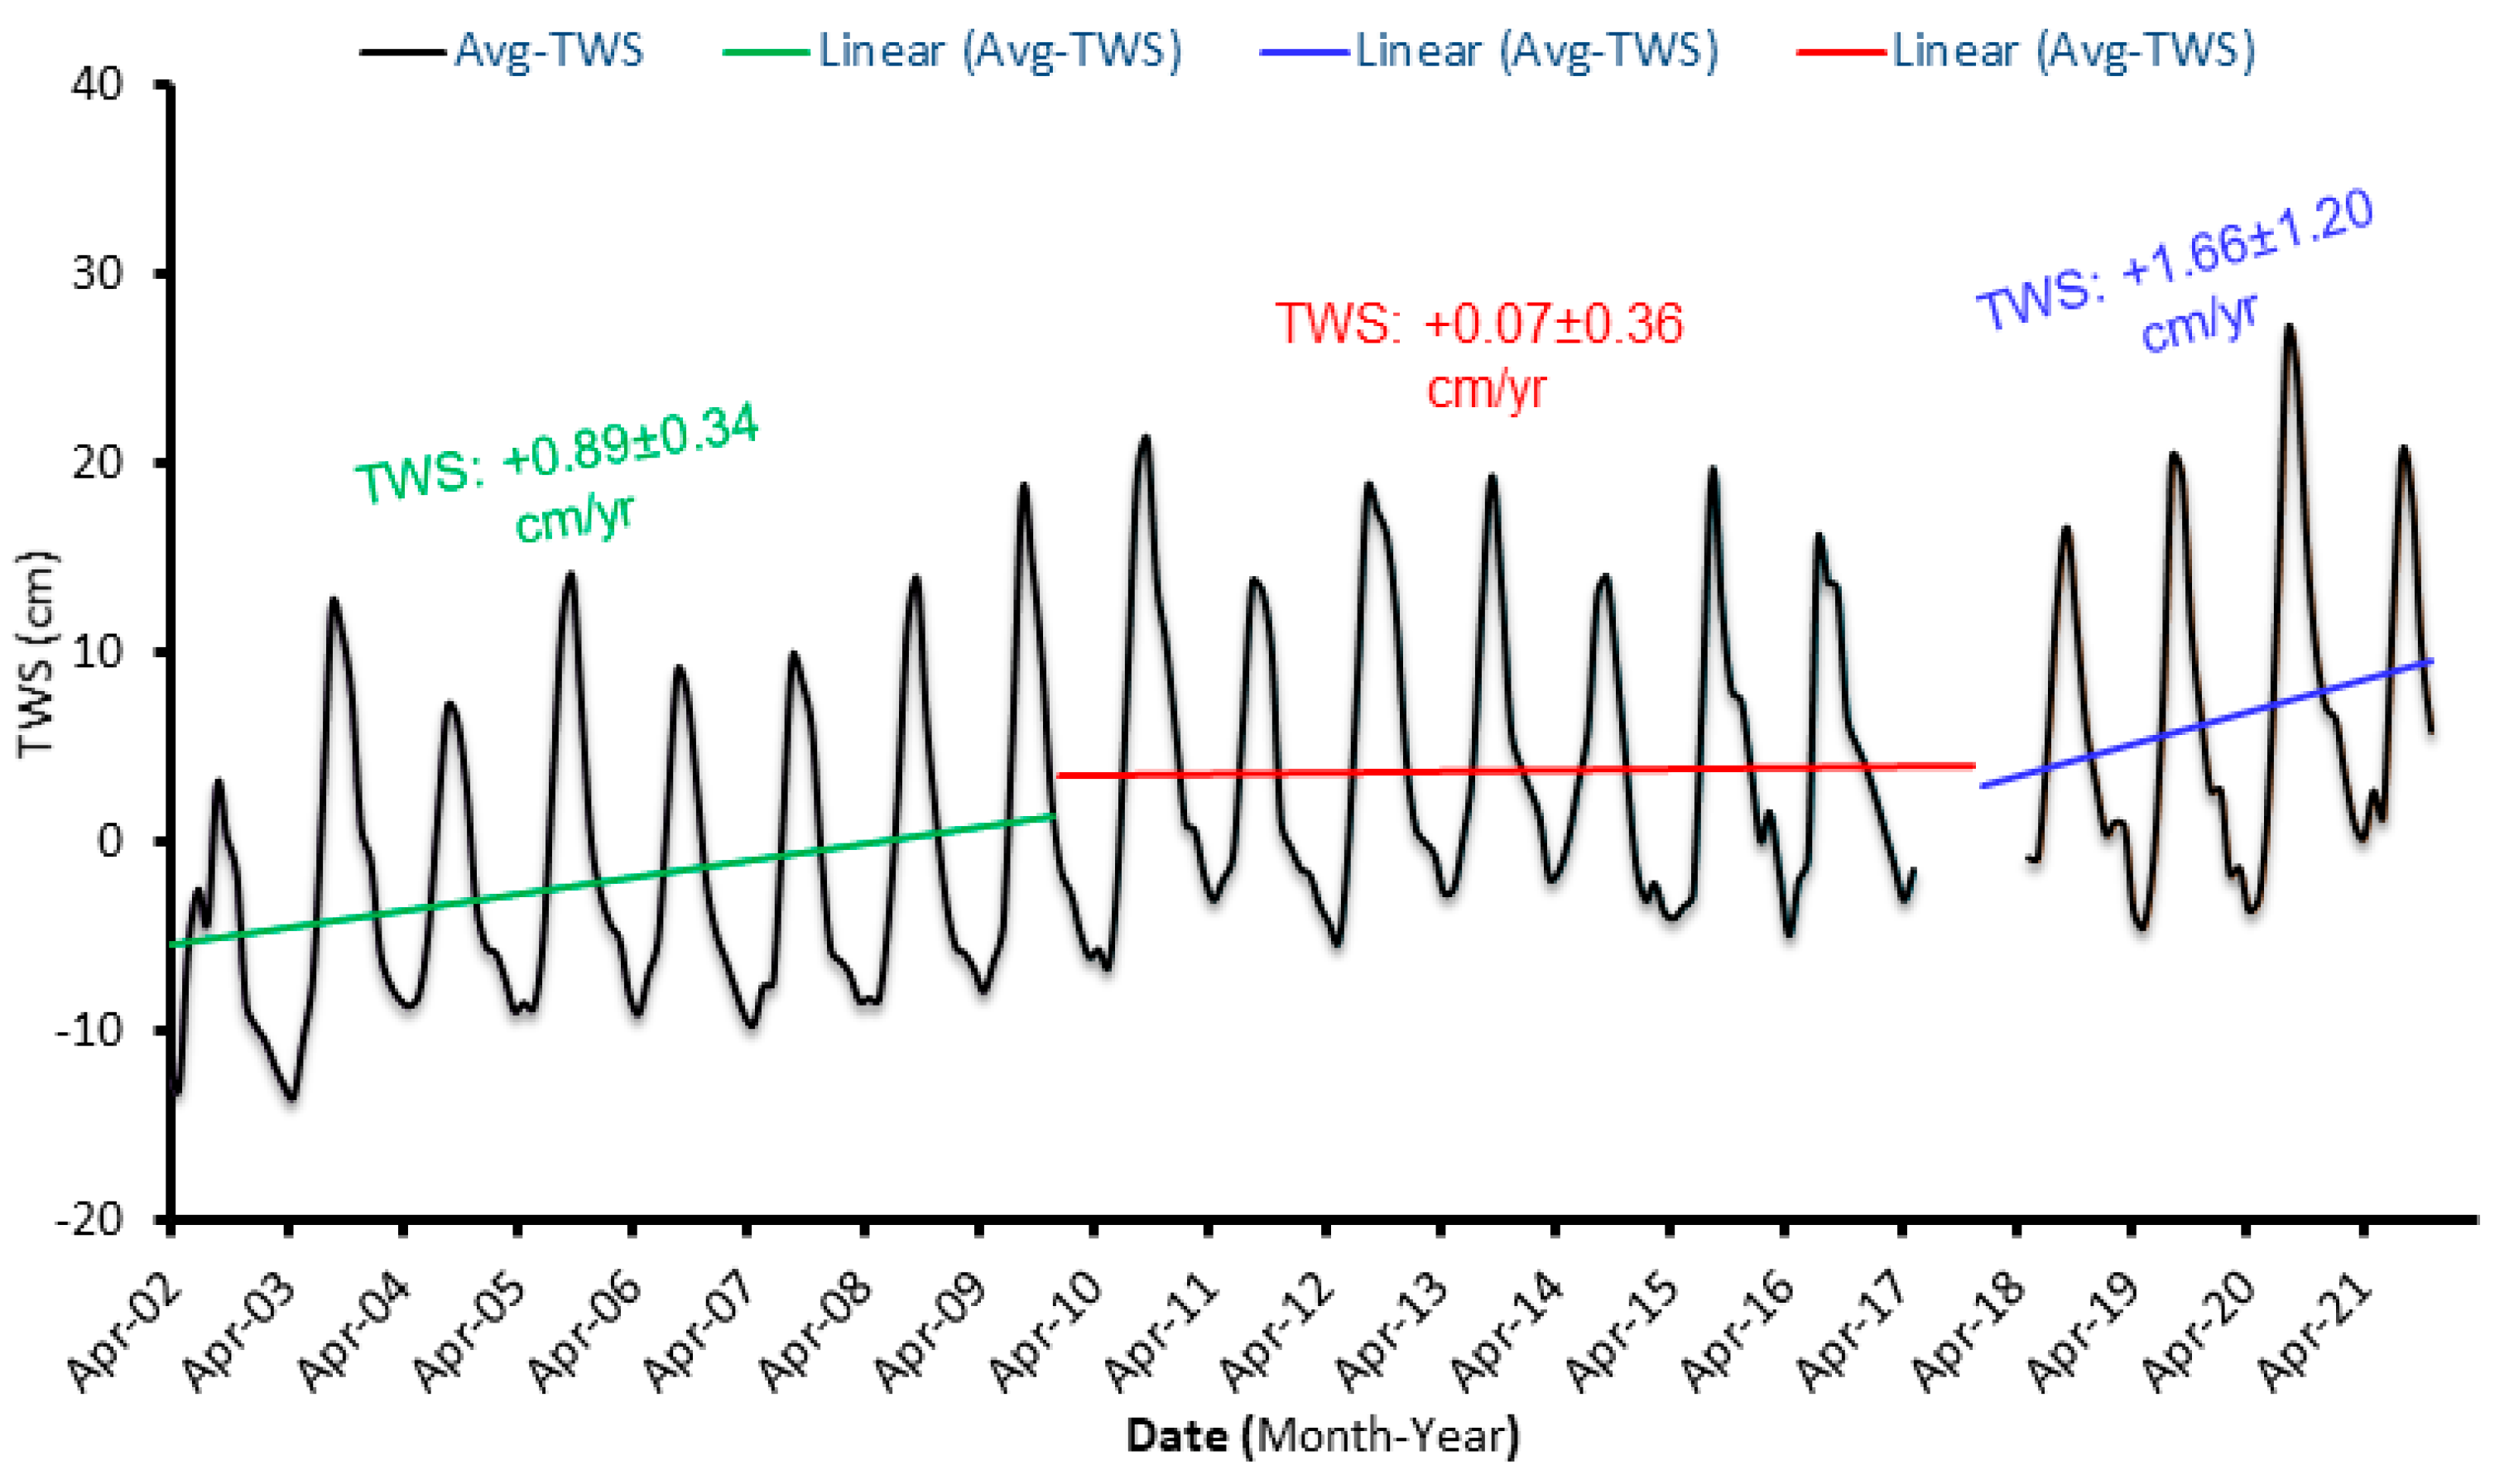
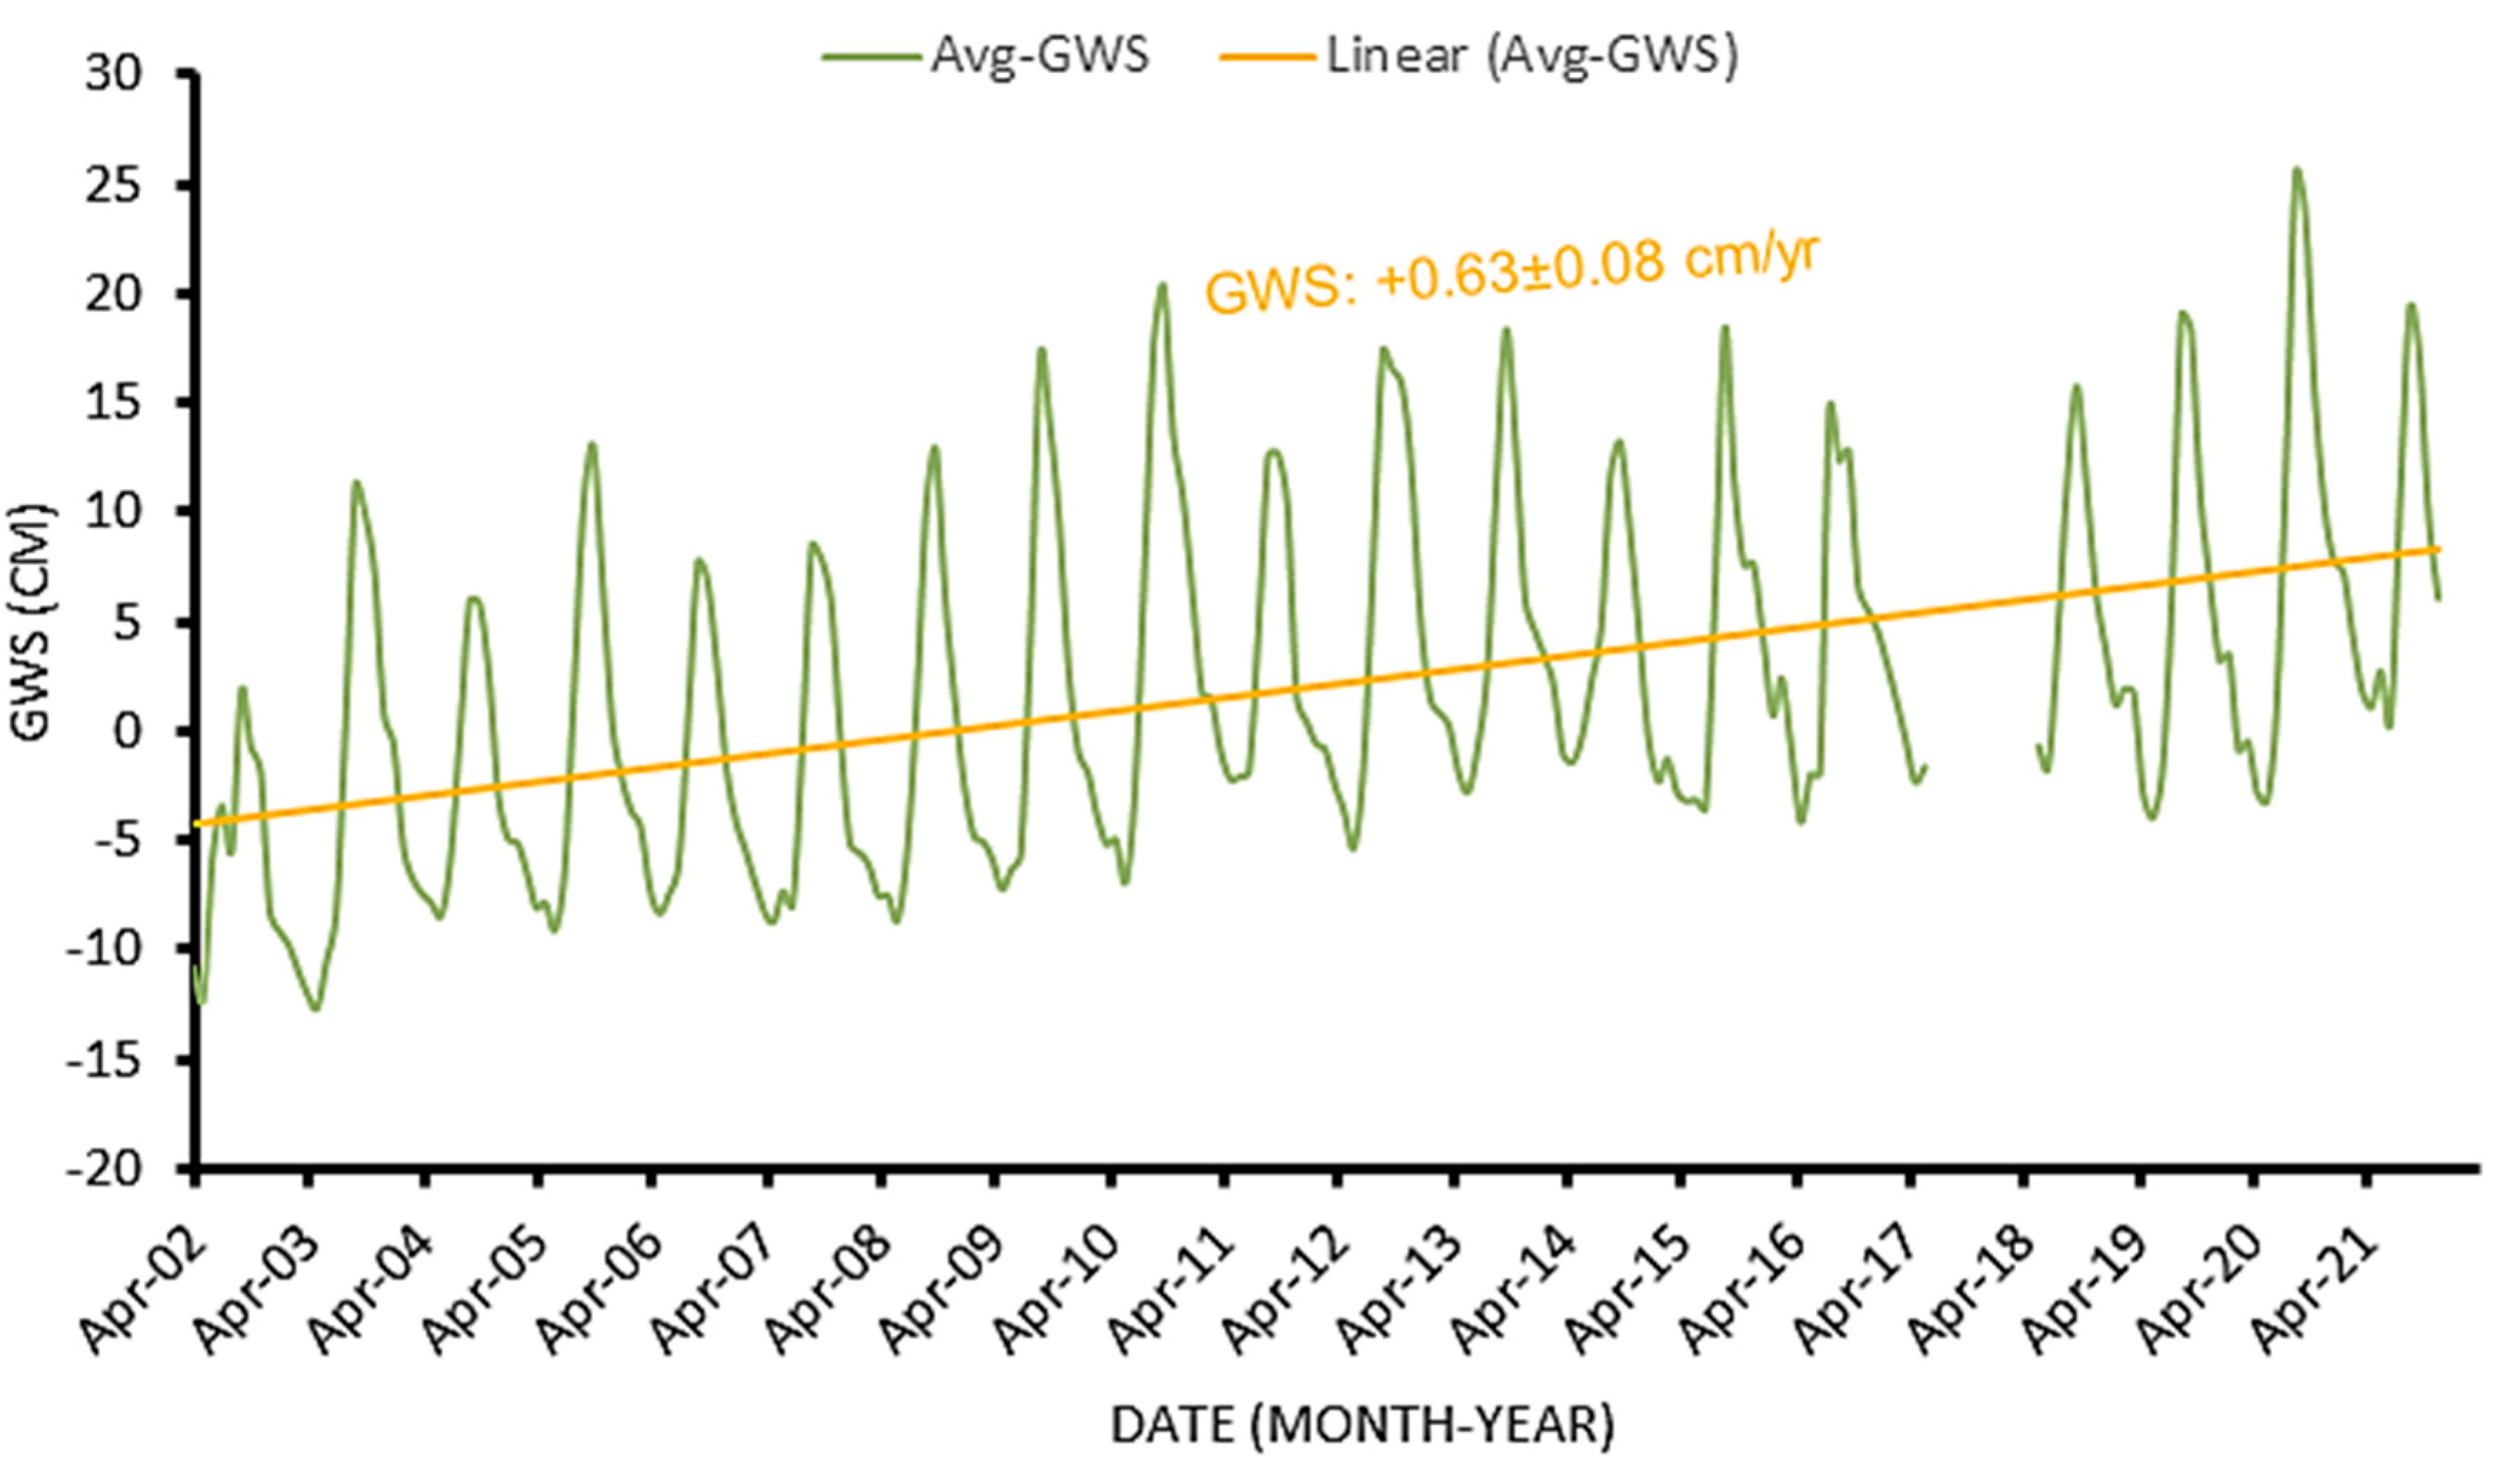
- At +0.63 ± 0.08 cm/yr, the average terrestrial water storage exhibits a positive increase trend over the study period.
- The fluctuations in groundwater storage are comparable to those of terrestrial water storage.
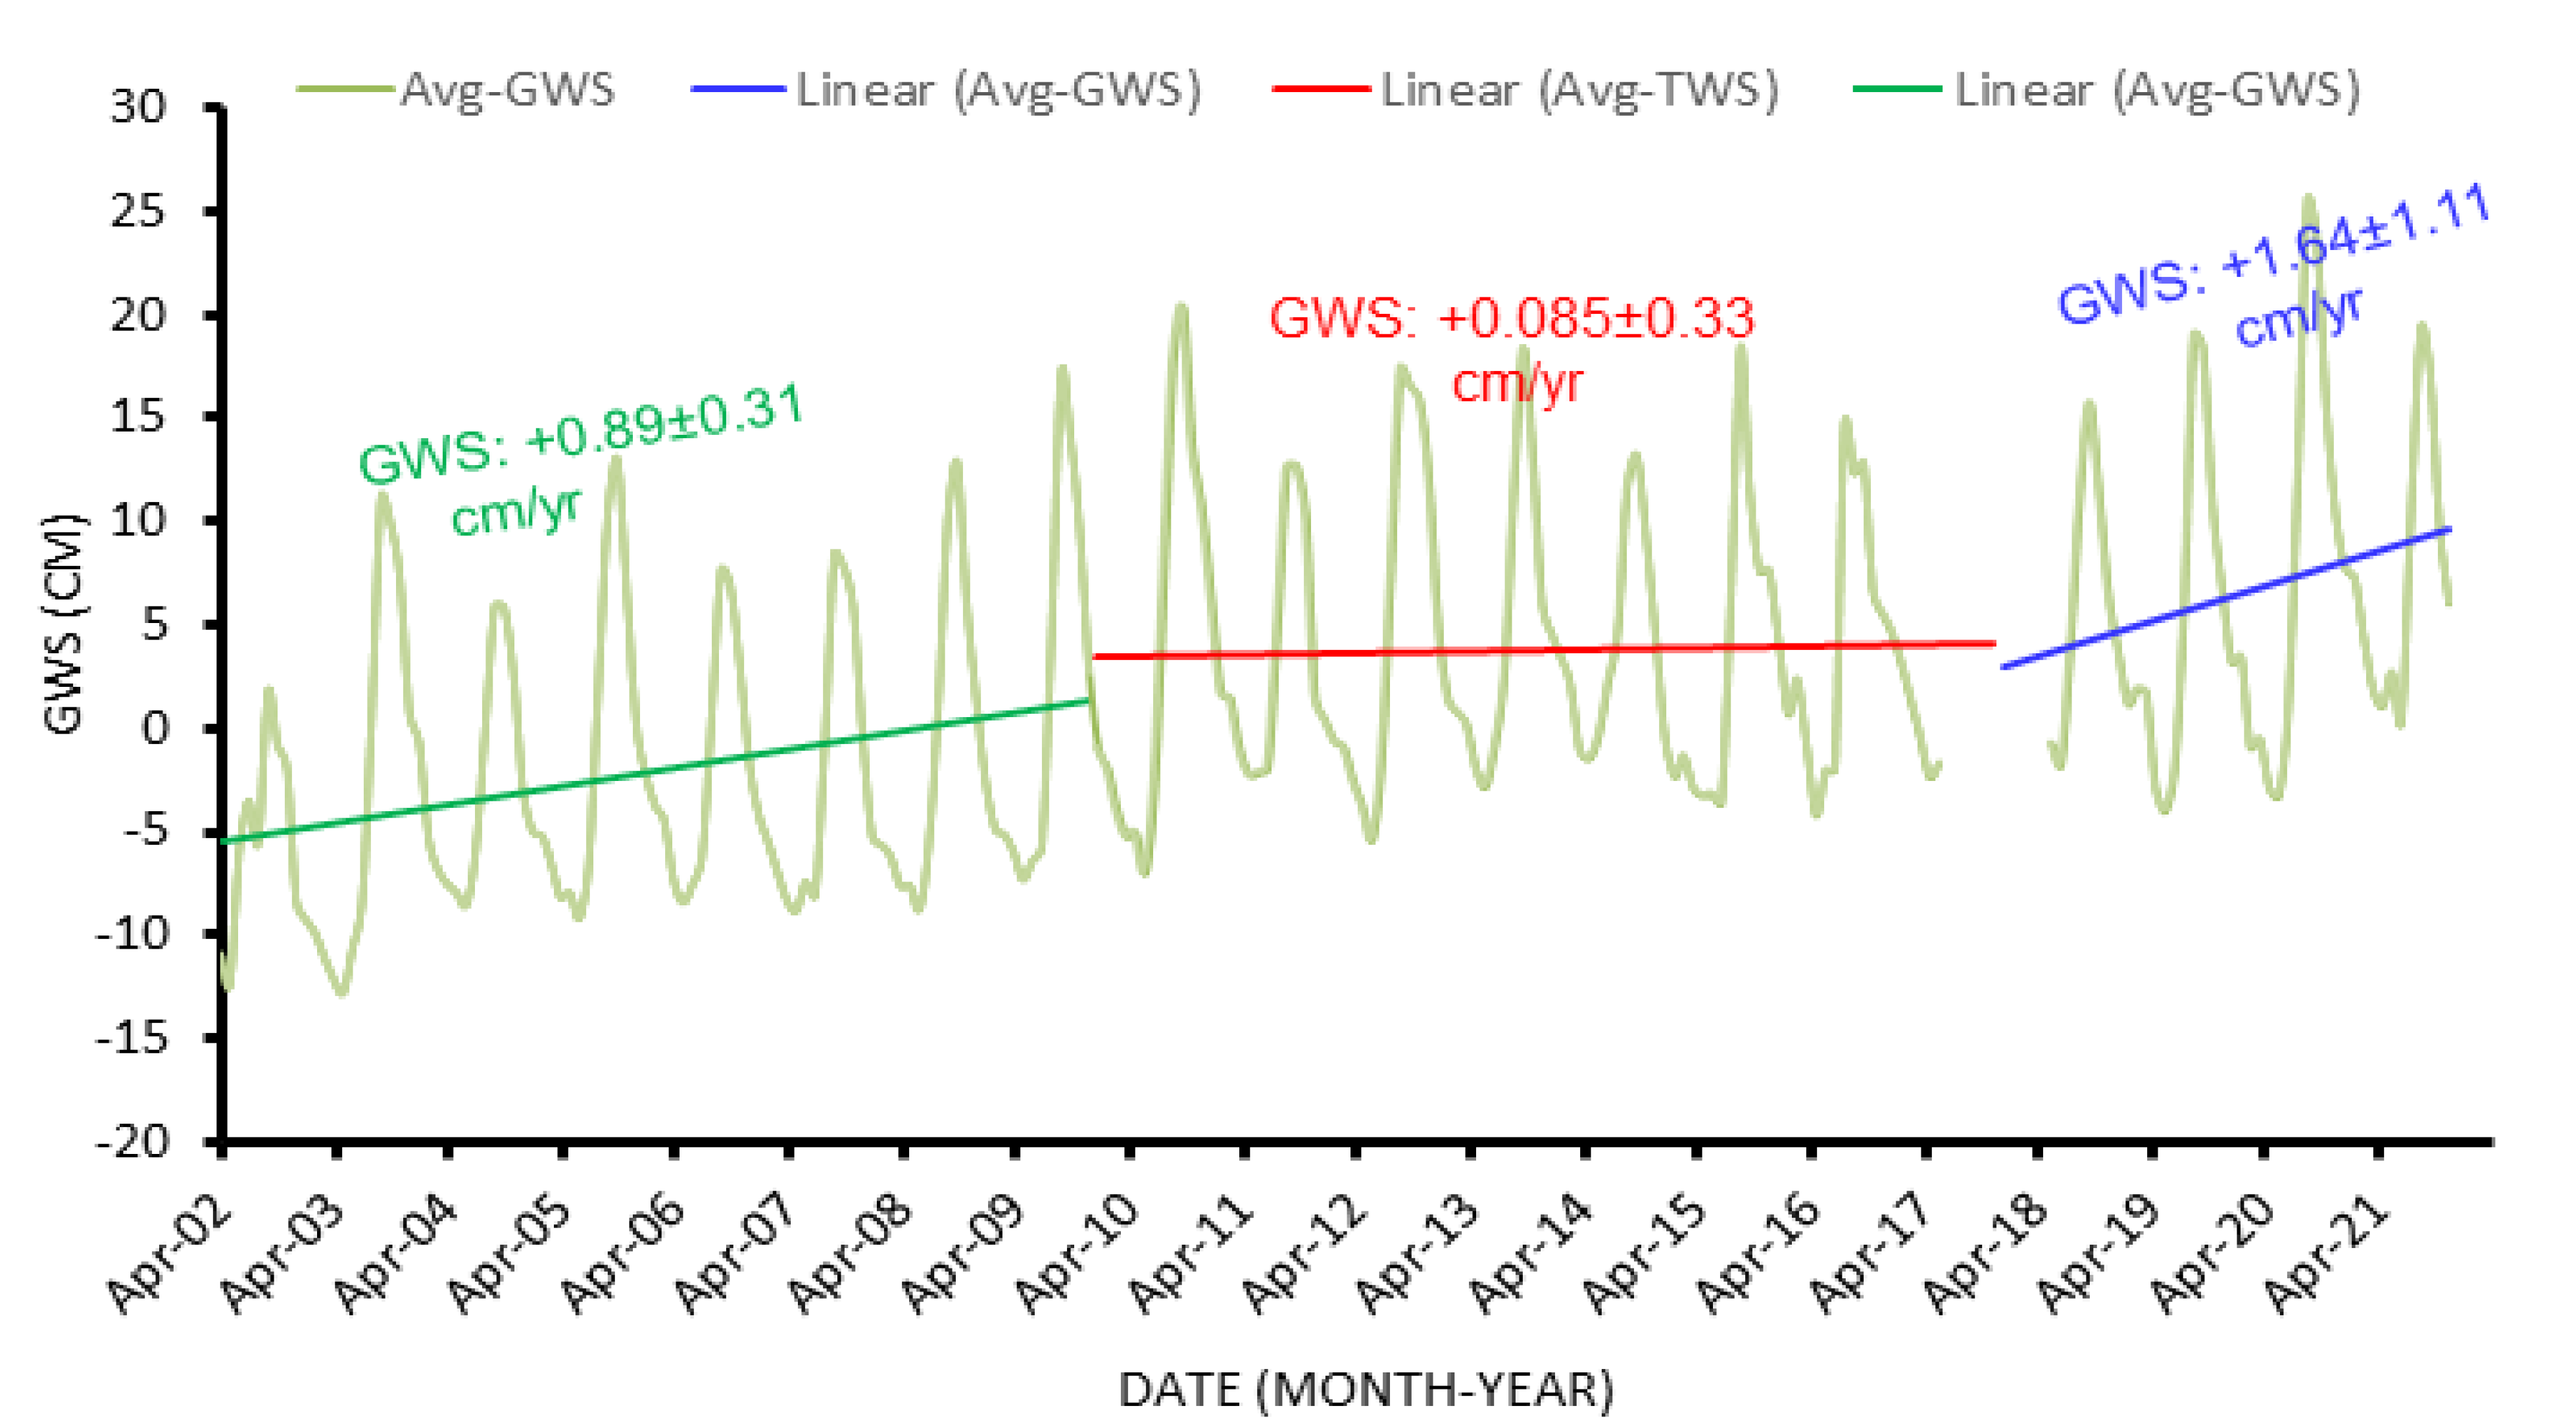
- Throughout the entire period, the groundwater storage has a generally positive trend of +0.63 ± 0.08 cm/yr, with Period III showing the highest trend value of +1.64 ± 1.11 cm/yr.
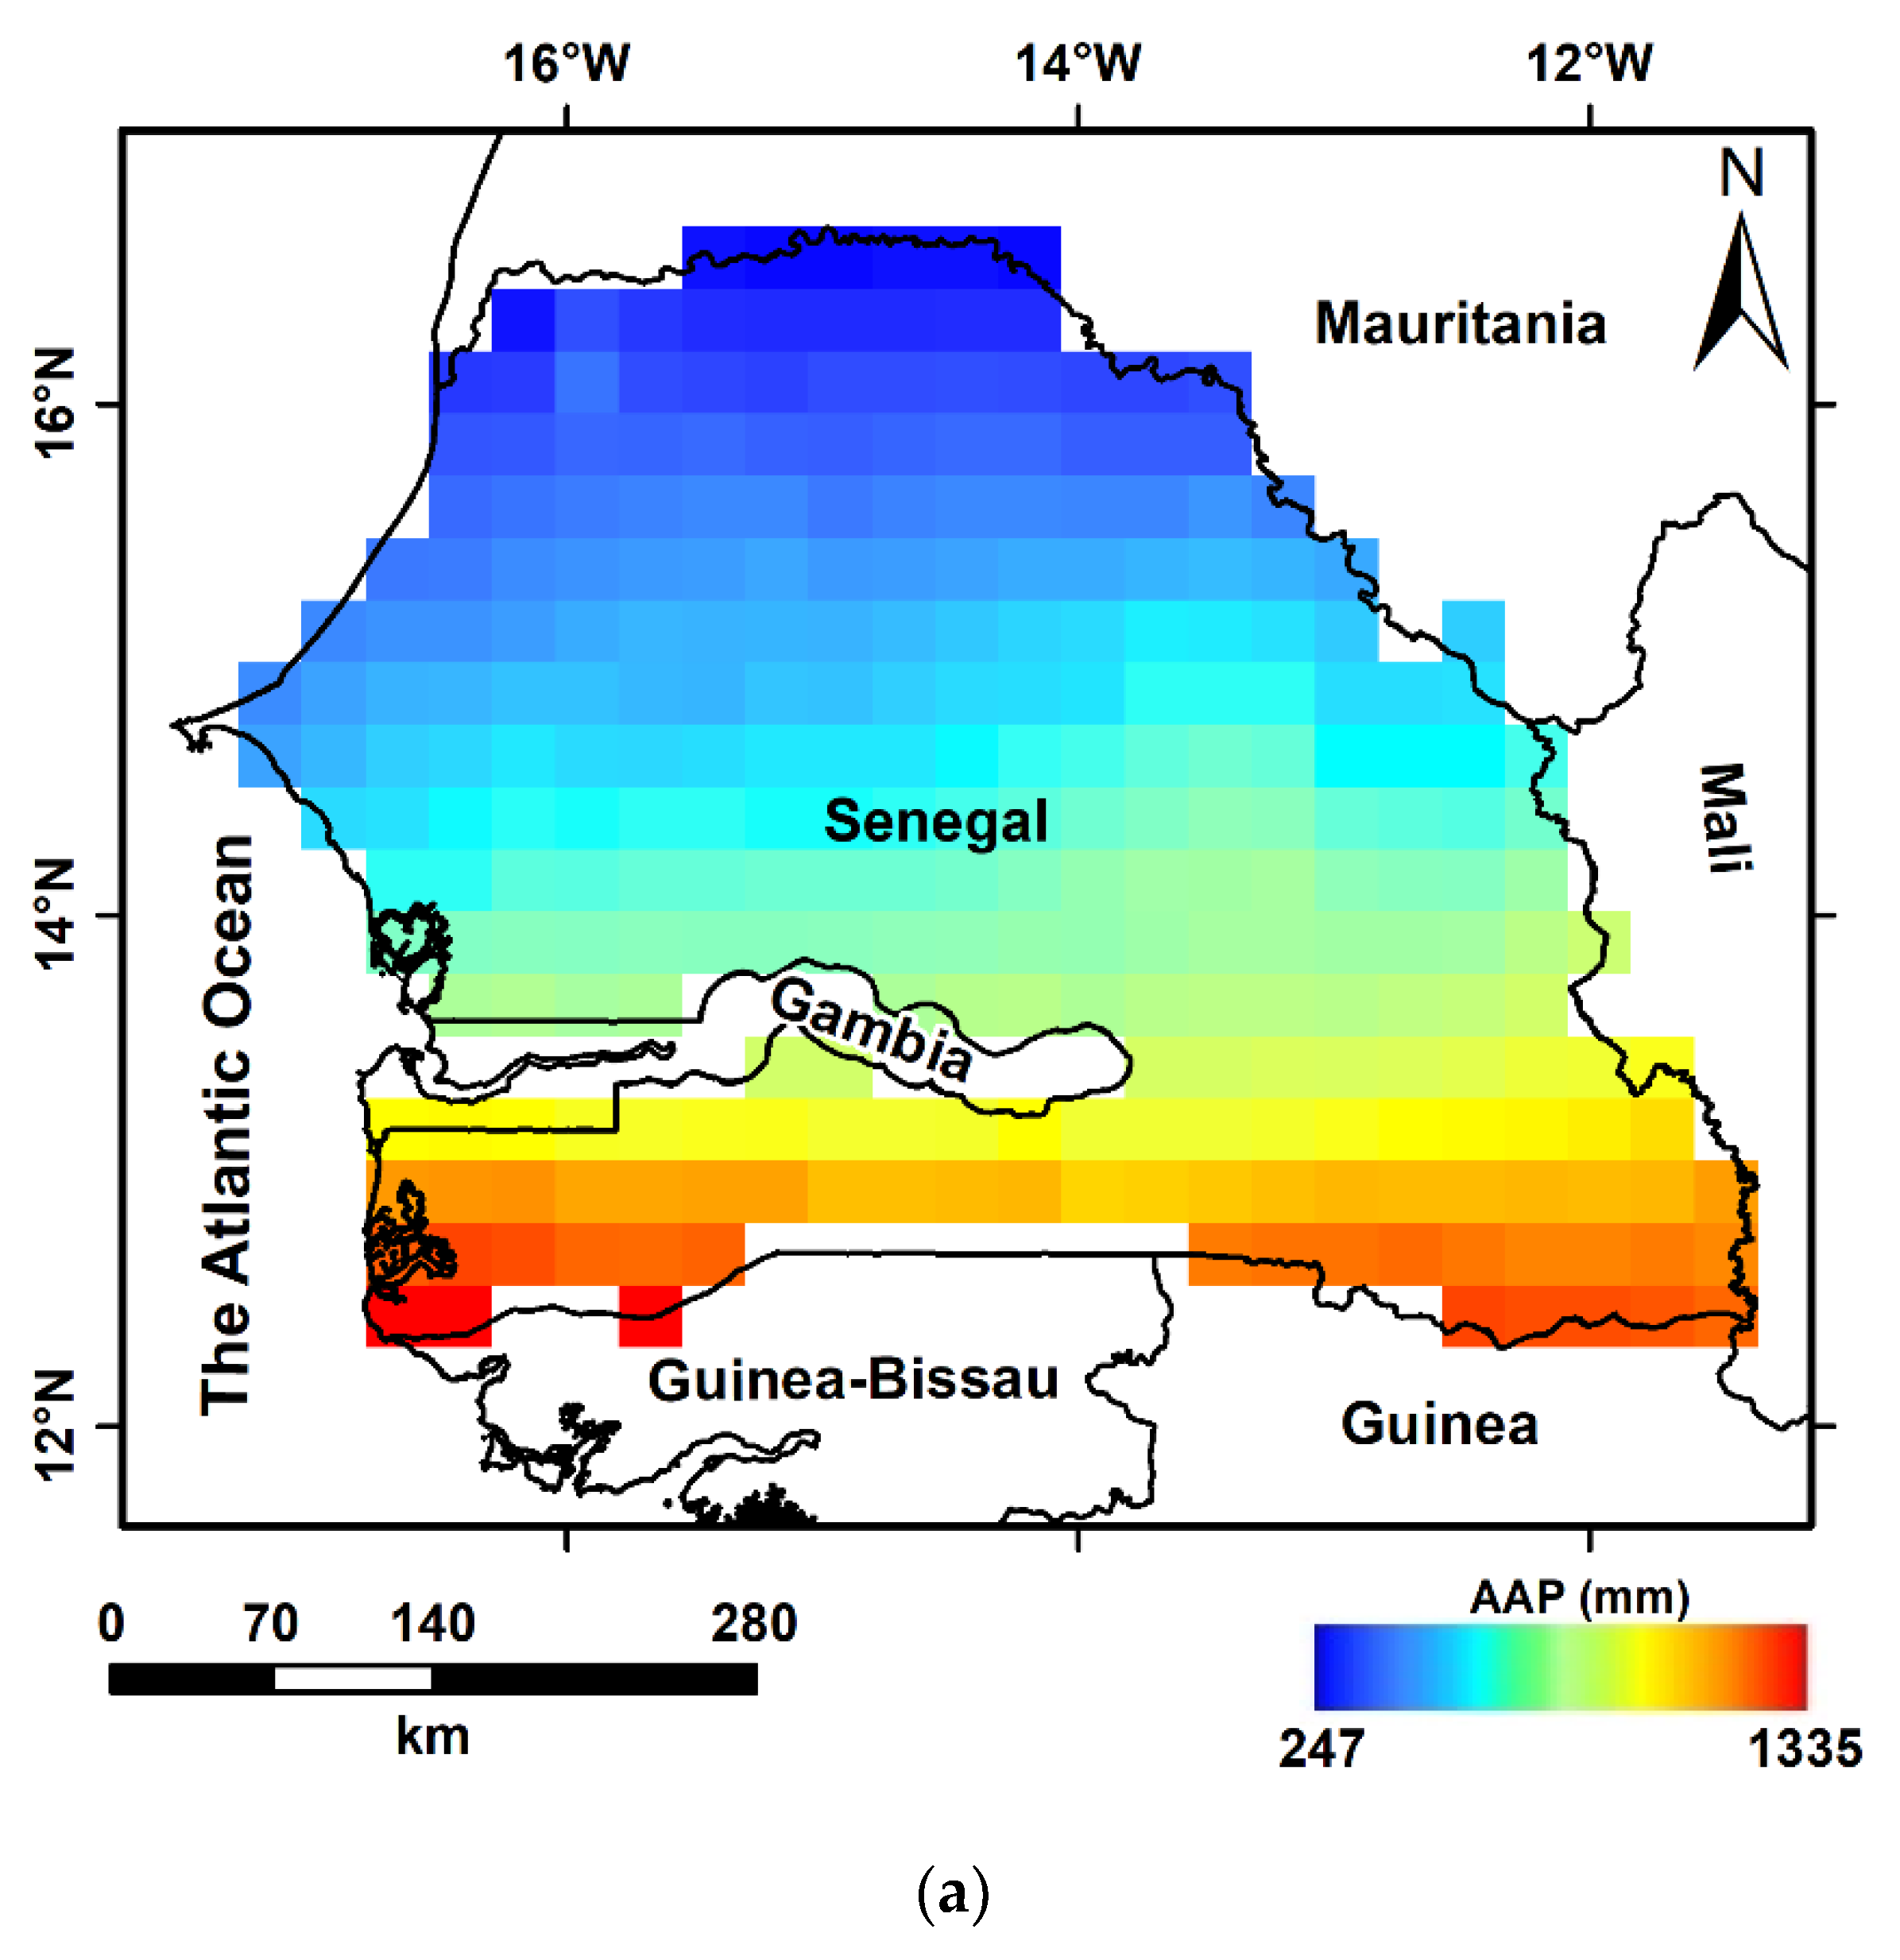
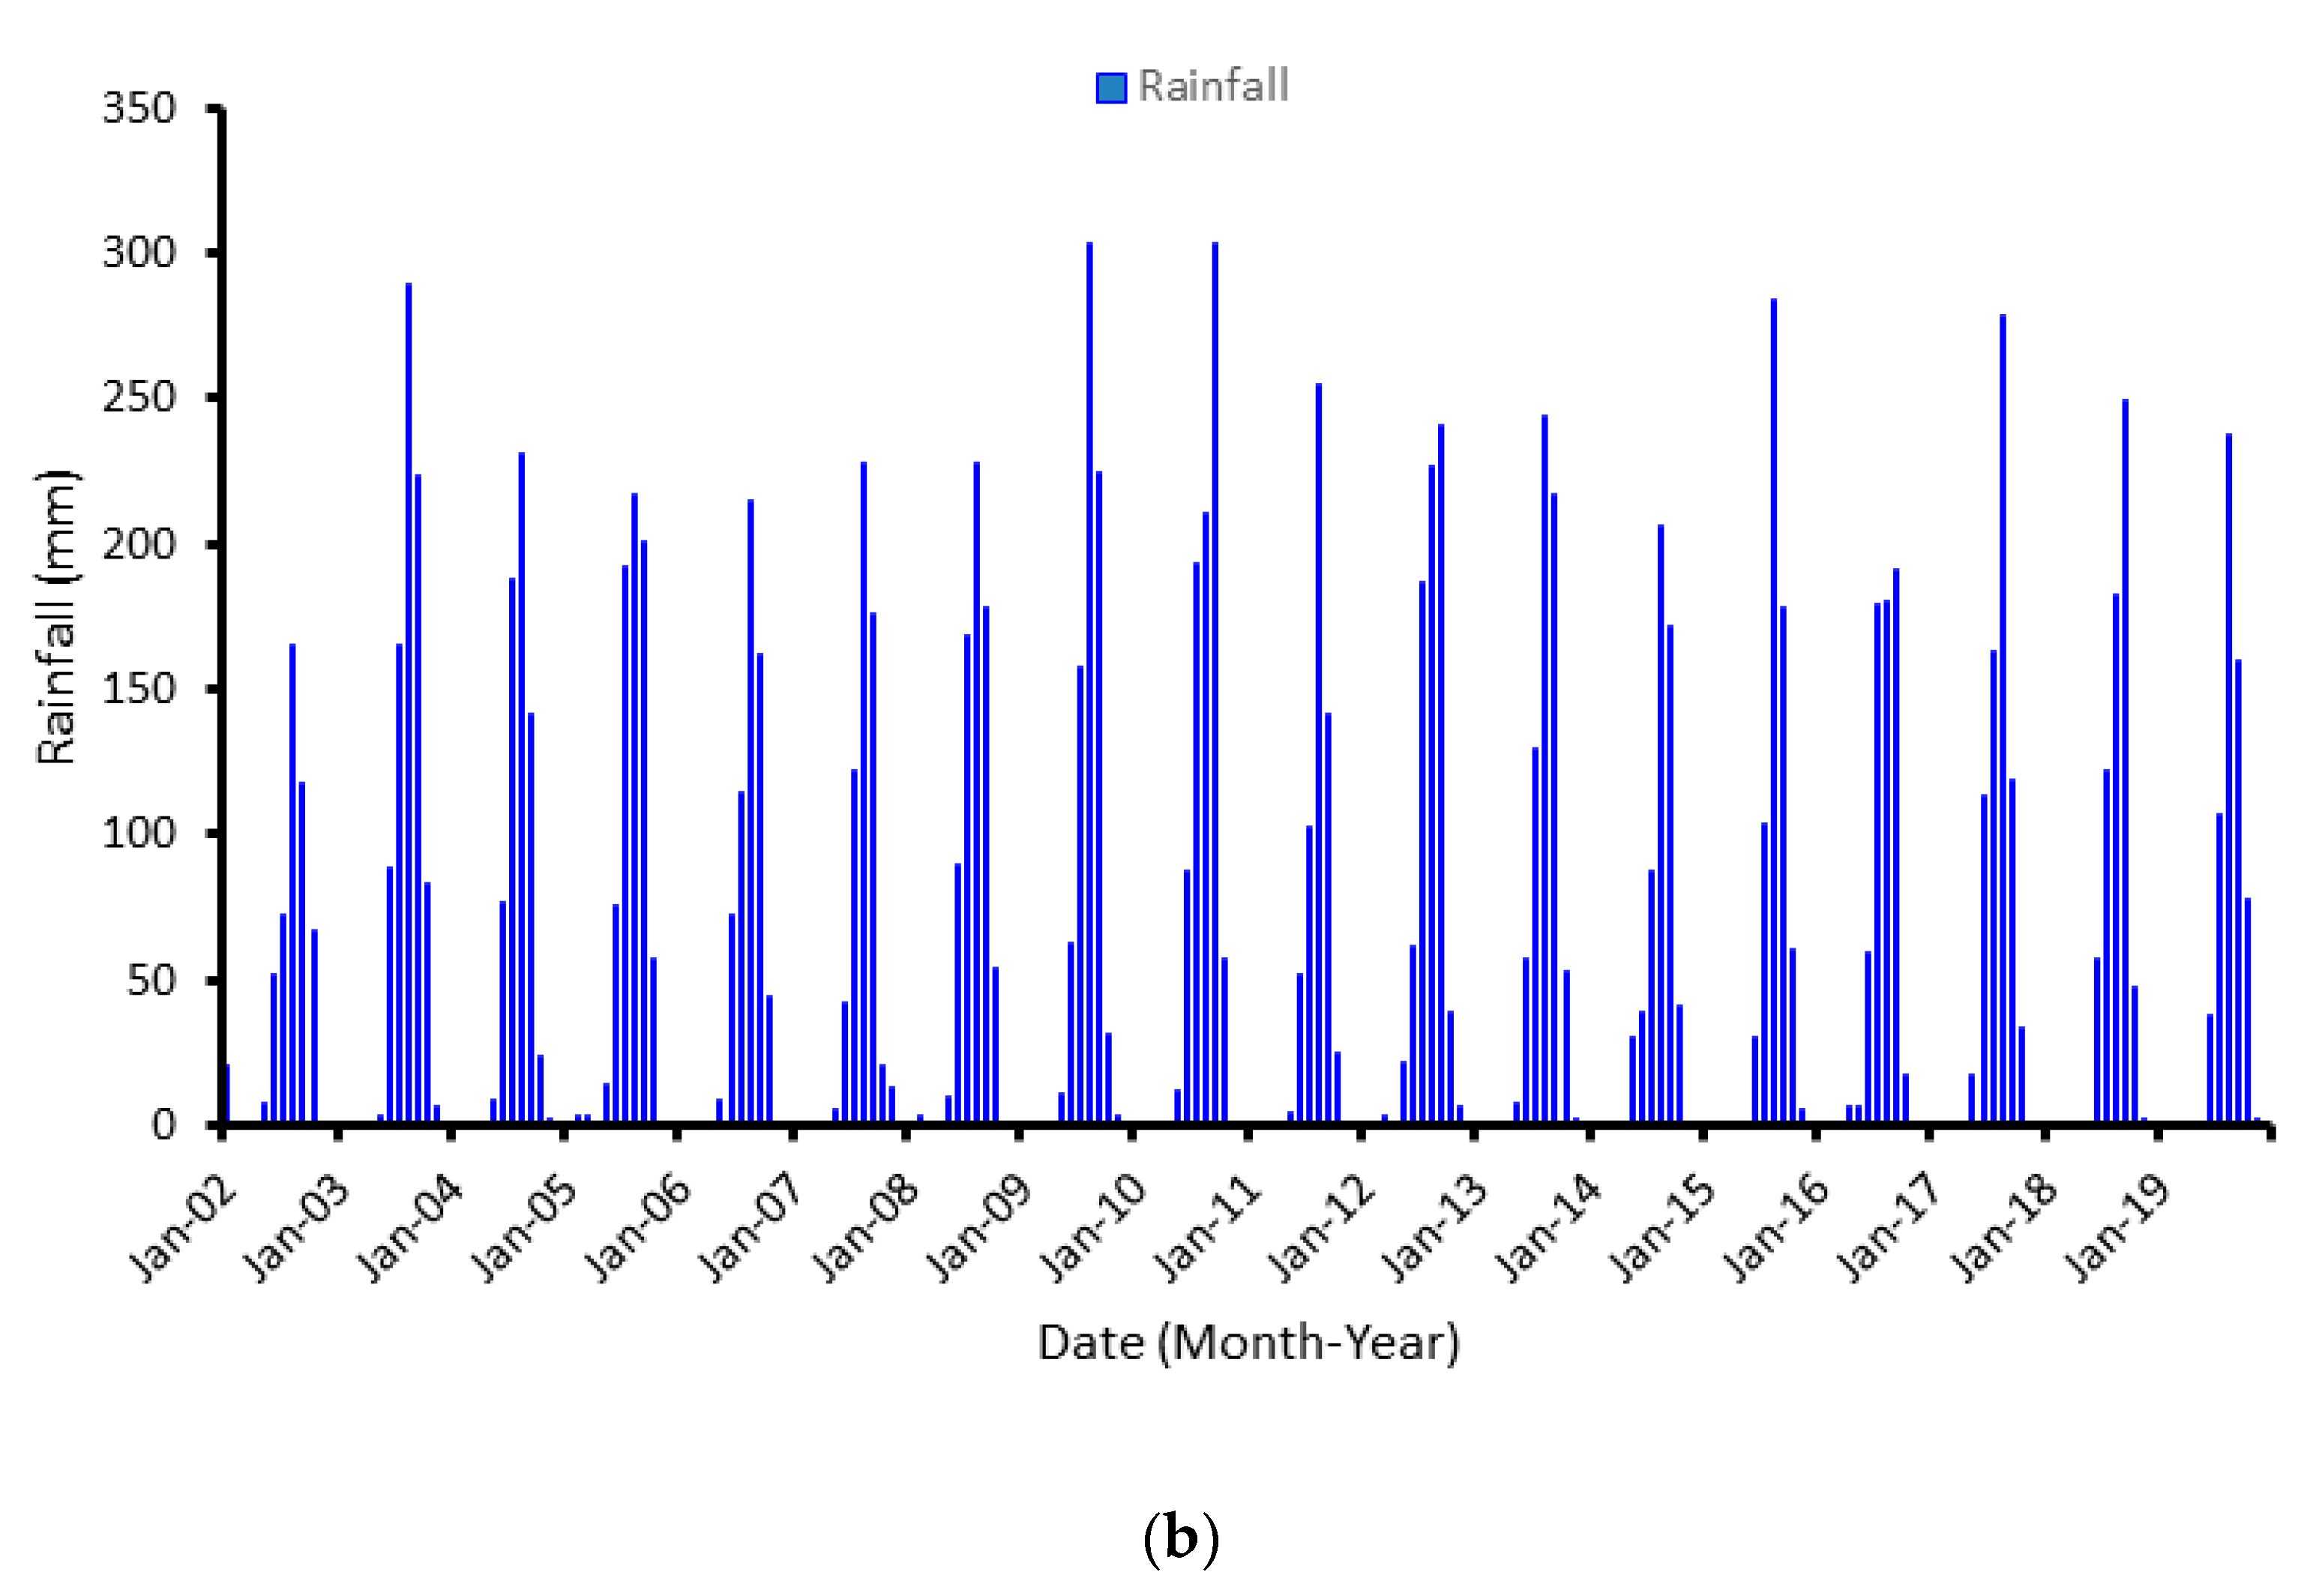
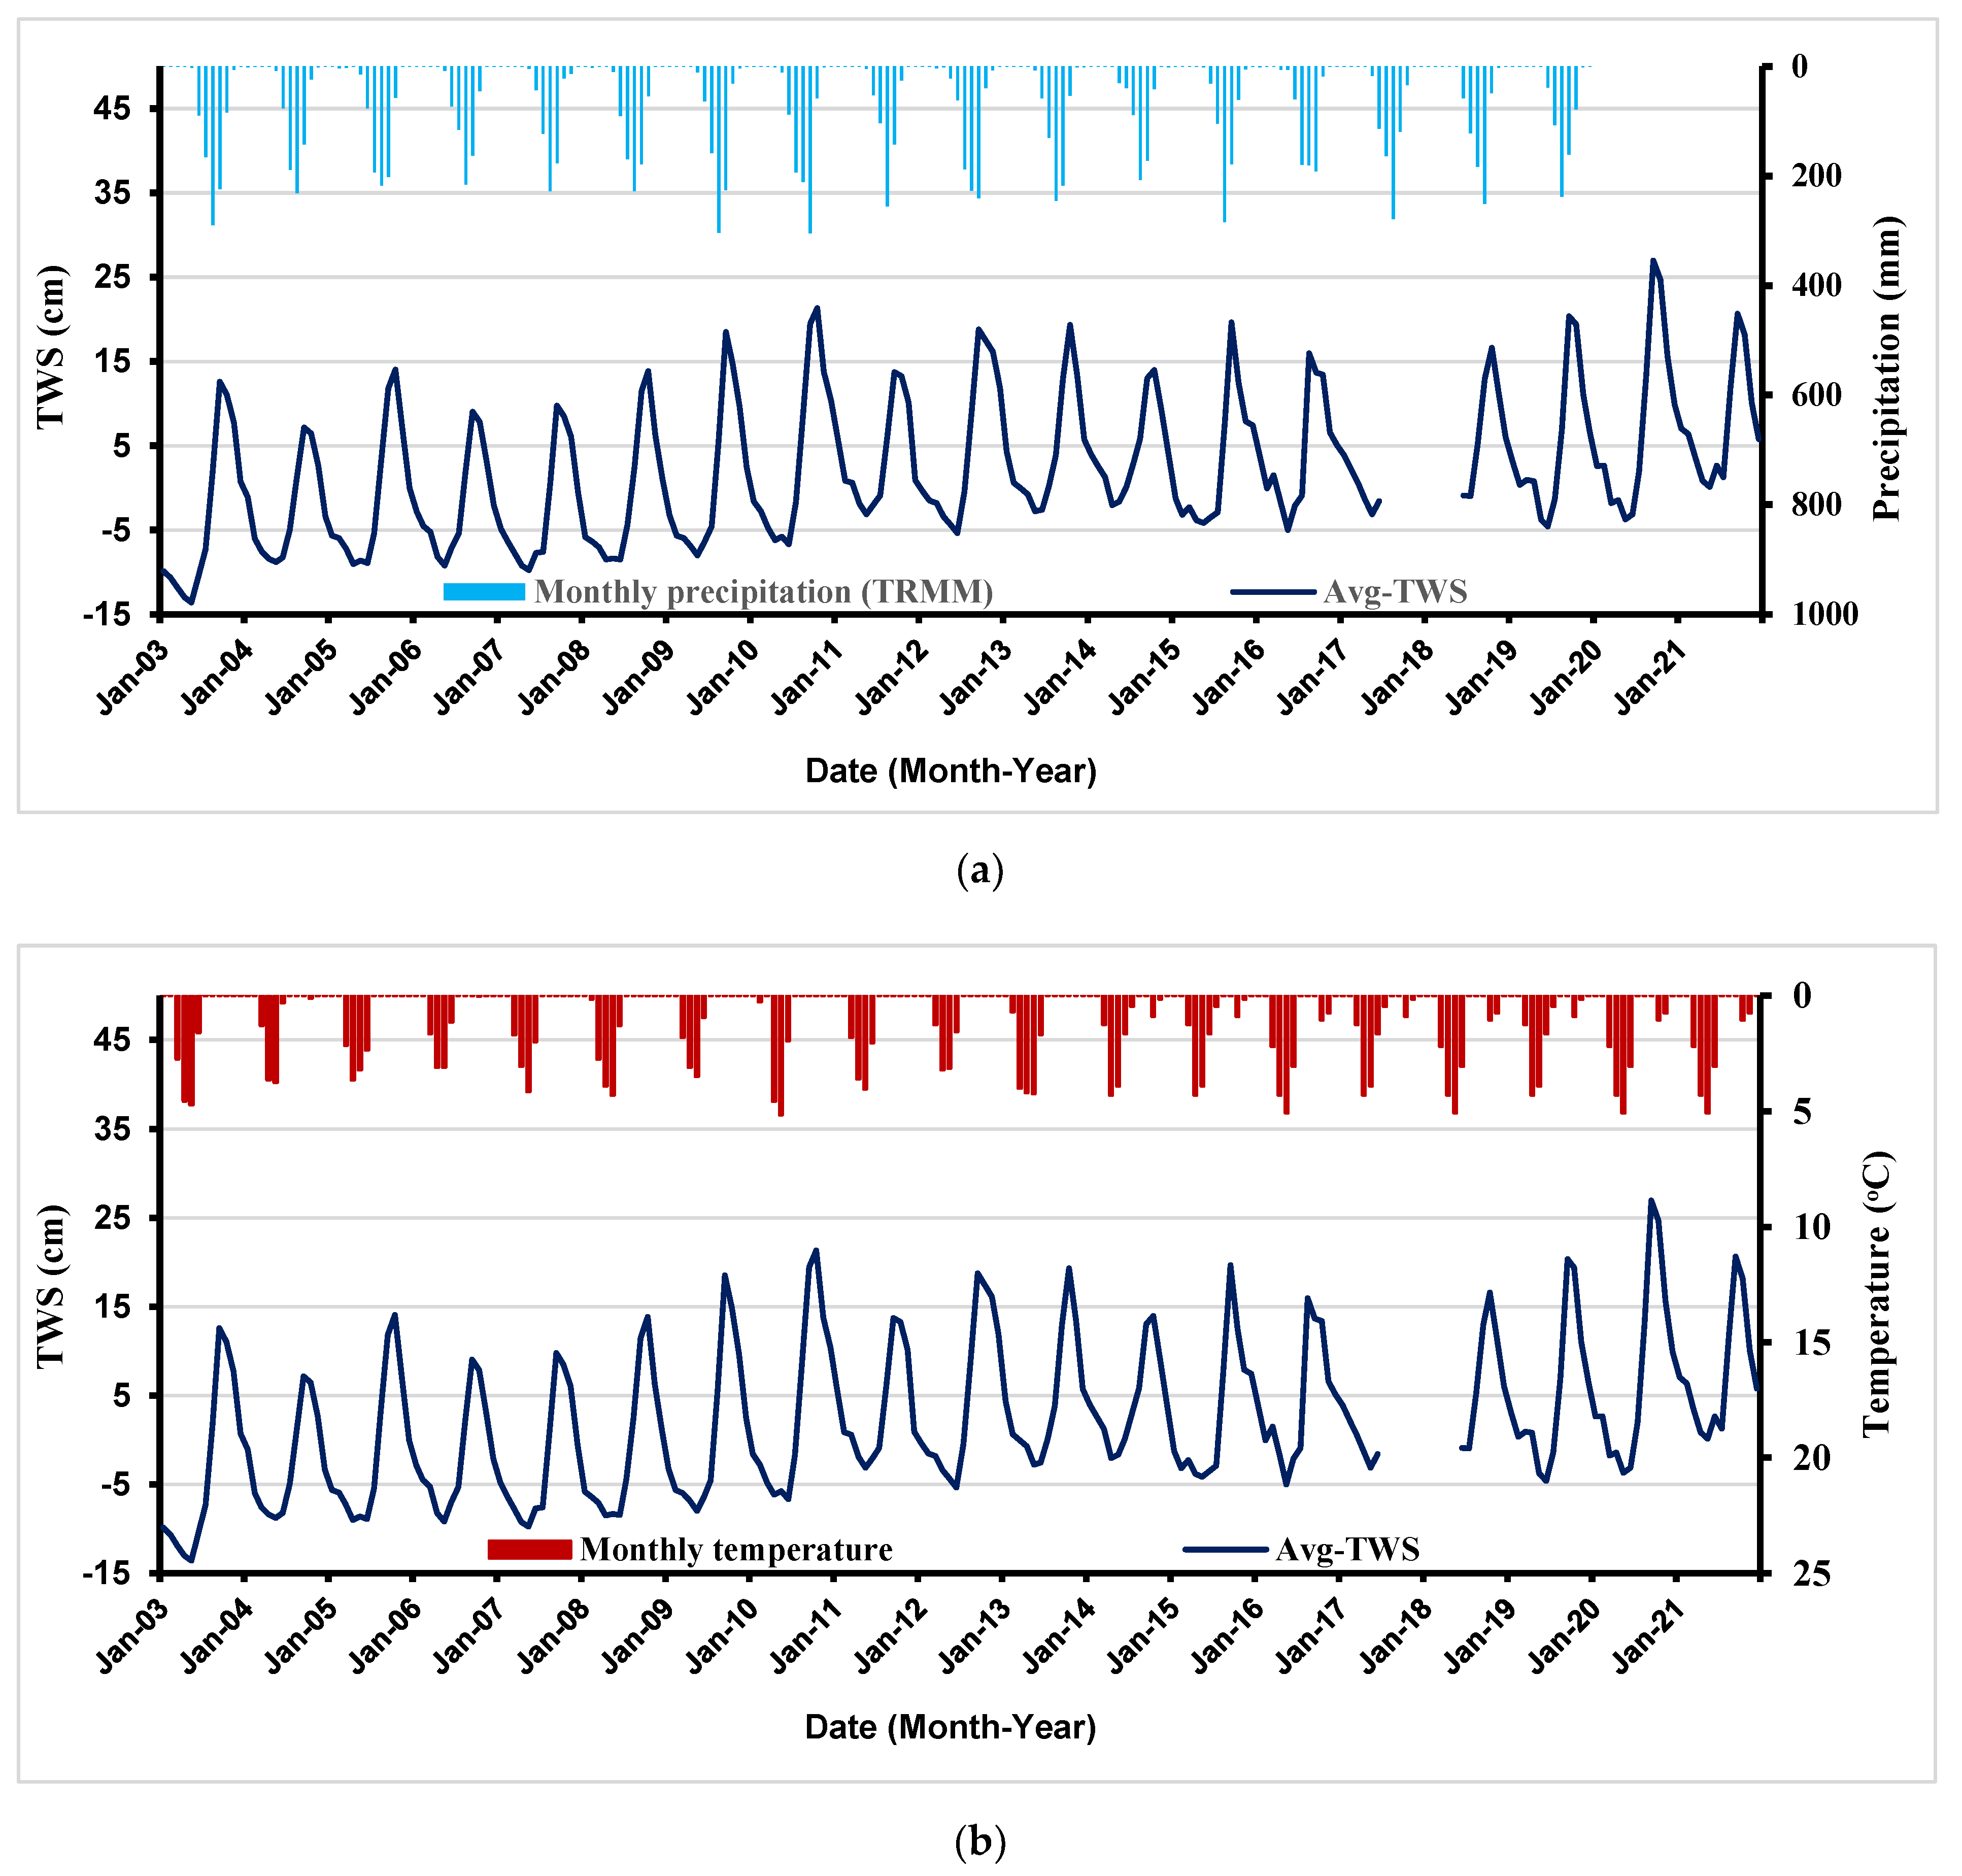
- Throughout the whole period, the research area has experienced an average yearly precipitation rate of 692.5 mm.
- In addition to SPI and STI, GRACE-based ΔTWS anomalies are useful indicators for tracking extreme hydrological events.
- Groundwater recharge is currently being seen in the country as a result of rising rainfall, according to GRACE-derived estimations of ΔTWS.
- The annual amplitude of groundwater in Senegal is 5.36 cm, with a positive trend of about 0.63 ± 0.08 cm/year (1.24 ± 0.16 km3/yr) during the entire period.
- Throughout the entire era, the nation receives an annual recharge rate of +1.76 ± 0.14 cm/yr (+3.46 ± 0.28 km3/yr).
- More effective procedures should be implemented to assess the increase in groundwater detected by GRACE in Senegal and observe any additional water-related activities to those already taking place.
- In general, the approach utilized in this article allowed for the estimation of groundwater storage variation as well as the identification of the most significant drought periods that have affected the Senegalese area.
- For large-scale areas, especially those where hydrometeorological sites are scarce or where the reliability of the available data is low, GRACE data can also be a perfect replacement. To improve the application’s accuracy and coverage, the future investigation should concentrate on enhancing the methodology of ΔTWS indices and determining the severity of drought.
Author Contributions
Funding
Data Availability Statement
Conflicts of Interest
References
- FAO 2022. AQUASTAT Website. Food and Agriculture Organization of the United Nations. Available online: http://www.fao.org/statistics/fr/ (accessed on 26 June 2022).
- CONGAD. Blue Book “Water, Life, Human Development” Country Report: Senegal, Consultation Document Provided by Senagrosol Consult; 2009; p. 72.
- Faye, C.; Gomis, E.N.; Dieye, S. Current situation and sustainable development of water resources in Senegal. Ecol. Eng. Environ. Prot. 2019, 1, 5–16. [Google Scholar] [CrossRef]
- Faye, C.; Dieye, S. Valorization of water resources in Senegal for economic, social and sustainable development. Afr. J. Environ. Sci. Technol. 2018, 12, 449–460. [Google Scholar]
- Sow, A.A. L’hydrologie du Sud-est du Sénégal et de ses Confins Guinéo-Maliens: Les Bassins de la GAMBIE et de la Falémé. Ph.D. Thesis, Université Cheikh Anta Diop de Dakar, Dakar, Senegal, 2007; p. 1232. [Google Scholar]
- Faye, C. Evaluation and Integrated Management of Water Resources in a Context of Hydroclimatic Variability: Case of the Falémé Watershed. Ph.D. Thesis, Cheikh Anta Diop University of Dakar, Dakar, Senegal, 2013; p. 309. [Google Scholar]
- Faye, C.; Sow, A.A.; Ndong, J.B. Study of rainfall and hydrological droughts in tropical Africa: Characterization and mapping of drought by indices in the upper Senegal River basin. Physio-Geo-Phys. Geogr. Environ. 2015, 9, 17–35. [Google Scholar]
- Faye, C. Characterisation of low water: The lasting effects of rainfall deficit on low water and drying up in the Bakoye basin. Espaces Soc. Mutat. Spec. Issue 2015, 109–126. [Google Scholar]
- Faye, C.; Diop, E.S.; Mbaye, I. Impacts of climate change and development on the water resources of the Senegal River: Characterization and evolution of hydrological regimes of natural and developed sub-catchments. Belgeo 2015, 4, 1–22. [Google Scholar]
- Faye, C. Variability and trends observed in monthly, seasonal and annual mean flows in the Falémé River basin (Senegal). Hydrol. Sci. J. J. Des Sci. Hydrol. 2017, 62, 259–269. [Google Scholar] [CrossRef]
- Dai, A.G. Drought under global warming: A review. Adv. Rev. 2011, 2, 45–65. [Google Scholar] [CrossRef]
- Zhao, Q.; Wu, W.W.; Wu, Y.L. Variations in China’s terrestrial water storage over the past decade using GRACE data. Geod. Geodyn. 2015, 6, 187–193. [Google Scholar] [CrossRef]
- Döll, P.; Jiménez-Cisneros, B.; Oki, T.; Arnell, N.W.; Benito, G.; Cogley, J.G.; Jiang, T.; Kundzewicz, Z.W.; Mwakalila, S.; Nishijima, A. Integrating risks of climate change into water management. Hydrol. Sci. J. 2014, 60, 4–13. [Google Scholar] [CrossRef]
- Tapley, B.D.; Bettadpur, S.; Ries, J.C.; Thompson, P.F.; Watkins, M. GRACE measurements of mass variability in the Earth system. Science 2004, 305, 503–505. [Google Scholar] [CrossRef]
- Wahr, J.; Swenson, S.; Zlotnicki, V.; Velicogna, I. Time-variable gravity from GRACE: First results. Geophys. Res. Lett. 2004, 31, L11501. [Google Scholar] [CrossRef]
- Rodell, M.; Famiglietti, J.S.; Chen, J.; Seneviratne, S.I.; Viterbo, P.; Holl, S.; Wilson, C.R. Basin scale estimates of evapotranspiration using GRACE and other observations. Geophys. Res. Lett. 2004, 31, L20504. [Google Scholar] [CrossRef]
- Girotto, M.; Rodell, M. Chapter Two—Terrestrial water storage. In Extreme Hydroclimatic Events and Multivariate Hazards in a Changing Environment; Maggioni, V., Massari, C., Eds.; Elsevier: Amsterdam, The Netherlands, 2019; pp. 41–64. ISBN 9780128148990. [Google Scholar] [CrossRef]
- Ramillien, G.; Frappart, F.; Cazenave, A.; Güntner, A. Time variations of land water storage from an inversion of 2 years of GRACE geoids. Earth Planet. Sci. Lett. 2005, 235, 283–301. [Google Scholar] [CrossRef]
- Davis, J.L.; Elósegui, P.; Mitrovica, J.X.; Tamisiea, M.E. Climate-driven deformation of the solid Earth from GRACE and GPS. Geophys. Res. Lett. 2004, 31, L24605. [Google Scholar] [CrossRef]
- Yeh, P.J.; Swenson, S.C.; Famiglietti, J.S.; Rodell, M. Remote sensing of groundwater storage changes in Illinois using the gravity recovery and climate experiment (GRACE). Water Resour. Res. 2006, 42, 1–7. [Google Scholar] [CrossRef]
- Castellazzi, P.; Longuevergne, L.; Martel, R.; Rivera, A.; Brouard, C.; Chaussard, E. Quantitative mapping of groundwater depletion at the water management scale using a combined GRACE/InSAR approach. Remote Sens. Environ. 2018, 205, 408–418. [Google Scholar] [CrossRef]
- Yan, H.; Wang, S.; Wang, J.; Lu, H.; Guo, A.; Zhu, Z.; Myneni, R.; Shugart, H. Assessing spatiotemporal variation of drought in China and its impact on agriculture during 1982–2011 by using PDSI indices and agriculture drought survey data. J. Geophys. Res. 2016, 121, 2283–2298. [Google Scholar] [CrossRef]
- Heim, R.R. A review of twentieth-century drought indices used in the United States. Bull. Am. Meteorol. Soc. 2002, 83, 1149–1165. [Google Scholar] [CrossRef]
- Ni, S.; Chen, J.; Wilson, C.R.; Li, J.; Hu, X.; Fu, R. Global terrestrial water storage changes and connections to ENSO events. Surv. Geophys. 2018, 39, 1–22. [Google Scholar] [CrossRef]
- Anyah, R.O.; Forootan, E.; Awange, J.L.; Khaki, M. Understanding linkages between global climate indices and terrestrial water storage changes over Africa using GRACE products. Sci. Total Environ. 2018, 635, 1405–1416. [Google Scholar] [CrossRef] [PubMed]
- Ndehedehe, C.E.; Awange, J.L.; Corner, R.J.; Kuhn, M.; Okwuashi, O. On the potentials of multiple climate variables in assessing the spatio-temporal chracterstics of hydrological droughts over the Volta Basin. Sci. Total Environ. 2016, 557–558, 819–837. [Google Scholar] [CrossRef] [PubMed]
- Seyoum, W.M. Characterizing water storage trends and regional climate influence using GRACE observation and satellite altimetry data in the Upper Blue Nile River Basin. J. Hydrol. 2018, 566, 274–284. [Google Scholar] [CrossRef]
- Scanlon, B.R.; Longuevergne, L.; Long, D. Ground referencing GRACE satellite estimates of groundwater storage changes in the California Central Valley, USA. Water Resour. Res. 2012, 48, W04520. [Google Scholar] [CrossRef]
- Ferreira, V.G.; Gong, Z.; Andam-Akorful, S.A. Monitoring mass changes in the volta river basin using GRACE satellite gravity and TRMM precipitation. Bol. Cienc. Geod. 2012, 18, 549–563. [Google Scholar] [CrossRef]
- Richey, A.S.; Thomas, B.F.; Lo, M.-H.; Reager, J.T.; Famiglietti, J.S.; Voss, K.; Swenson, S.; Rodell, M. Quantifying renewable groundwater stress with GRACE. Water Resour. Res. 2015, 51, 5217–5238. [Google Scholar] [CrossRef]
- Mohamed, A.; Sultan, M.; Ahmed, M.; Yan, E.; Ahmed, E. Aquifer recharge, depletion, and connectivity: Inferences from GRACE, land surface models, and geochemical and geophysical data. Bull. Geol. Soc. Am. 2017, 129, 534–546. [Google Scholar] [CrossRef]
- Rodell, M.; Famiglietti, J.S.; Wiese, D.N.; Reager, J.T.; Beaudoing, H.K.; Landerer, F.W.; Lo, M.-H. Emerging trends in global freshwater availability. Nature 2018, 557, 651–659. [Google Scholar] [CrossRef]
- Fallatah, O.A.; Ahmed, M.; Cardace, D.; Boving, T.; Akanda, A.S. Assessment of modern recharge to arid region aquifers using an integrated geophysical, geochemical, and remote sensing approach. J. Hydrol. 2019, 569, 600–611. [Google Scholar] [CrossRef]
- Mohamed, A. Hydro-geophysical study of the groundwater storage variations over the Libyan area and its connection to the Dakhla basin in Egypt. J. Afr. Earth Sci. 2019, 157, 103508. [Google Scholar] [CrossRef]
- Mohamed, A. Gravity based estimates of modern recharge of the Sudanese area. J. Afr. Earth Sci. 2020, 163, 103740. [Google Scholar] [CrossRef]
- Mohamed, A. Gravity applications in estimating the mass variations in the Middle East: A case study from Iran. Arab. J. Geosci. 2020, 13, 364. [Google Scholar] [CrossRef]
- Mohamed, A. Gravity applications to groundwater storage variations of the Nile Delta Aquifer. J. Appl. Geophys. 2020, 182, 104177. [Google Scholar] [CrossRef]
- Mohamed, A.; Ragaa Eldeen, E.; Abdelmalik, K. Gravity based assessment of spatio-temporal mass variations of the groundwater resources in the Eastern Desert, Egypt. Arab. J. Geosci. 2021, 14, 500. [Google Scholar] [CrossRef]
- Mohamed, A.; Abdelrahman, K.; Abdelrady, A. Application of Time- Variable Gravity to Groundwater Storage Fluctuations in Saudi Arabia. Front. Earth Sci. 2022, 10, 873352. [Google Scholar] [CrossRef]
- Mohamed, A.; Al Deep, M.; Othman, A.; Taha Al Alshehri, F.; Abdelrady, A. Integrated geophysical assessment of ground-water potential in southwestern Saudi Arabia. Front. Earth Sci. 2022, 10, 937402. [Google Scholar] [CrossRef]
- Taha, A.I.; Al Deep, M.; Mohamed, A. Investigation of groundwater occurrence using gravity and electrical resistivity methods: A case study from Wadi Sar, Hijaz Mountains, Saudi Arabia. Arab. J. Geosci. 2021, 14, 334. [Google Scholar] [CrossRef]
- Mohamed, A.; Gonçalvès, J. Hydro-geophysical monitoring of the North Western Sahara Aquifer System’s groundwater resources using gravity data. J. Afr. Earth Sci. 2021, 178, 104188. [Google Scholar] [CrossRef]
- Othman, A.; Abdelrady, A.; Mohamed, A. Monitoring Mass Variations in Iraq Using Time-Variable Gravity Data. Remote Sens. 2022, 14, 3346. [Google Scholar] [CrossRef]
- Andam-Akorful, S.A.; Ferreira, V.G.; Awange, J.L.; Forootan, E.; He, X.F. Multi-model and multi-sensor estimations of evapotranspiration over the Volta Basin, West Africa. Int. J. Climatol. 2015, 35, 3132–3145. [Google Scholar] [CrossRef]
- Li, B.; Rodell, M.; Zaitchik, B.F.; Reichle, R.H.; Koster, R.D.; van Dam, T.M. Assimilation of GRACE terrestrial water storage into a land surface model: Evaluation and potential value for drought monitoring in western and central Europe. J. Hydrol. 2012, 446–447, 103–115. [Google Scholar] [CrossRef]
- Rodell, M.; Velicogna, I.; Famiglietti, J.S. Satellite-based estimates of groundwater depletion in India. Nature 2009, 460, 999–1002. [Google Scholar] [CrossRef] [PubMed]
- Moiwo, J.P.; Tao, F.; Lu, W. Estimating soil moisture storage change using quasi-terrestrial water balance method. Agric. Water Manag. 2011, 102, 25–34. [Google Scholar] [CrossRef]
- Long, D.; Shen, Y.J.; Sun, A.; Hong, Y.; Longuevergne, L.; Yang, Y.T.; Li, B.; Chen, L. Drought and flood monitoring for a large karst plateau in southwest China using extended GRACE data. Remote Sens. Environ. 2014, 155, 145–160. [Google Scholar] [CrossRef]
- Thomas, A.C.; Reager, J.T.; Famiglietti, J.S.; Rodell, M. A GRACE based water storage deficit approach for hydrological drought characterization. Geophys. Res. Lett. 2014, 41, 1537–1545. [Google Scholar] [CrossRef]
- Zhang, Y.; Yao, L.; Jing, G.; Gaopeng, L.; Zhisheng, Y.; Haishan, N. Correlation analysis between drought indices and terrestrial water storage from 2002 to 2015 in China. Environ. Earth Sci. 2018, 77, 462. [Google Scholar] [CrossRef]
- Nie, N.; Zhang, W.; Zhang, Z.; Guo, H.; Ishwaran, N. Reconstructed terrestrial water storage change (ΔTWS) from 1948 to 2012 over the Amazon Basin with the latest GRACE and GLDAS products. Water Resour. Manag. 2016, 30, 279–294. [Google Scholar] [CrossRef]
- Tang, J.S.; Cheng, H.W.; Liu, L. Assessing the recent droughts in southwestern China using satellite gravimetry. Water Resour. Res. 2014, 50, 3030–3038. [Google Scholar] [CrossRef]
- Cao, Y.P.; Nan, Z.T.; Cheng, G.D. GRACE gravity satellite observations of terrestrial water storage changes for drought characterization in the arid land of Northwestern China. Remote Sens. 2015, 7, 1021–1047. [Google Scholar] [CrossRef]
- Vicente-Serrano, S.; van der Schrier, G.; Beguería, S.; Azorin-Molina, C.; Lopez-Moreno, J. Contribution of precipitation and reference evapotranspiration to drought indices under different climates. J. Hydrol. 2015, 526, 42–54. [Google Scholar] [CrossRef]
- Zhao, M.; Velicogna, A.G.R.; Kimball, I.J.S. Satellite observations of regional drought severity in the continental United States using GRACE-based terrestrial water storage changes. J. Clim. 2017, 30, 6297–6308. [Google Scholar] [CrossRef]
- Sane, M. Note Sur Les Ressources en Eaux du Sénégal: Zones potentielles Pour le Transfert D’eau; Directeur de l’hydraulique: République du Sénégal, Senegal, 2015; p. 8. [Google Scholar]
- Luthcke, S.B.; Sabaka, T.J.; Loomis, B.D.; Arendt, A.A.; McCarthy, J.J.; Camp, J. Antarctica, Greenland, and Gulf of Alaska land-ice evolution from an iterated GRACE global mascon solution. J. Glaciol. 2013, 59, 216. [Google Scholar] [CrossRef]
- Watkins, M.M.; Wiese, D.N.; Yuan, D.-N.; Boening, C.; Landerer, F.W. Improved methods for observing Earth’s time variable mass distribution with GRACE using spherical cap mascons. J. Geophys. Res. Solid Earth 2015, 120, 2648–2671. [Google Scholar] [CrossRef]
- Wiese, D.N.; Landerer, F.W.; Watkins, M.M. Quantifying and reducing leakage errors in the JPL RL05M GRACE mascon solution. Water Resour. Res. 2016, 52, 7490–7502. [Google Scholar] [CrossRef]
- Save, H.; Bettadpur, S.; Tapley, B. High-resolution CSR GRACE RL05 mascons. J. Geophys. Res. Solid Earth 2016, 121, 7547–7569. [Google Scholar] [CrossRef]
- Save, H. CSR GRACE and GRACE-FO RL06 Mascon Solutions v02. Mascon Solut. 2020, 12, 24. [Google Scholar]
- Loomis, B.D.; Luthcke, S.B.; Sabaka, T.J. Regularization and error characterization of GRACE mascons. J. Geod. 2019, 93, 1381–1398. [Google Scholar] [CrossRef]
- Yirdaw, S.Z.; Snelgrove, K.R.; Agboma, C.O. GRACE satellite observations of terrestrial moisture changes for drought characterization in the Canadian Prairie. J. Hydrol. 2008, 356, 84–92. [Google Scholar] [CrossRef]
- Rodell, M.; Houser, P.R.; Jambor, U.; Gottschalck, J.; Mitchell, K.; Meng, C.-J.; Arsenault, K.; Cosgrove, B.; Radakovich, J.; Bosilovich, M.; et al. The global land data Assimilation system. Bull. Am. Meteorol. Soc. 2004, 85, 381–394. [Google Scholar] [CrossRef]
- Kummerow, C.; Barnes, W.; Koju, T.; Shiue, J.; Simpson, J. The Tropical Rainfall Measuring Mission (TRMM) Sensor Package. J. Atmos. Ocean. Technol. 1998, 15, 809–817. [Google Scholar] [CrossRef]
- McKee, T.B.; Doesken, N.J.; Kleist, J. The relationship of drought frequency and duration to time scales. In Proceedings of the 8th Conference on Applied Climatology, Boston, MA, USA, 17–22 January 1993; American Meteorological Society: Anaheim, CA, USA, 1993; pp. 179–186. [Google Scholar]
- Hayes, M.J.; Svoboda, M.D.; Wilhite, D.A.; Vanyarkho, O.V. Monitoring the 1996 drought using the standardized precipitation index. Bull. Am. Meteorol. Soc. 1999, 80, 429–438. [Google Scholar] [CrossRef]
- Li, B.; Rodell, M.; Famiglietti, J.S. Groundwater variability across temporal and spatial scales in the central and northeastern U.S. J. Hydrol. 2015, 525, 769–780. [Google Scholar] [CrossRef]
- Famiglietti, J.S. The global groundwater crisis. Nat. Clim. Change 2014, 4, 945–948. [Google Scholar] [CrossRef]
- Famiglietti, J.S.; Cazenave, A.; Eicker, A.; Reager, J.T.; Rodell, M.; Velicogna, I. Satellites provide the big picture. Science 2015, 349, 684–685. [Google Scholar] [CrossRef]
- Döll, P. Vulnerability to the impact of climate change on renewable groundwater resources: A global-scale assessment. Environ. Res. Lett. 2009, 4, 035006. [Google Scholar] [CrossRef]
- Thomas, B.F.; Caineta, J.; Nanteza, J. Global assessment of groundwater sustainability based on storage anomalies. Geophys. Res. Lett. 2017, 44, 1–11. [Google Scholar] [CrossRef]
- Rosegrant, M.W.; Ringler, C.; Zhu, T. Water for agriculture: Maintaining food security under growing scarcity. Annu. Rev. Environ. Resour. 2009, 34, 205–222. [Google Scholar] [CrossRef]
- Connor, R. The United Nations World Water Development Report 2015: Water for a Sustainable World; UNESCO Publishing: France, Paris, 2015; Volume 1, p. 122. [Google Scholar]
- Zhangli, S.; Xiufang, Z.; Yaozhong, P.; Jinshui, Z.; Xianfeng, L. Drought evaluation using the GRACE terrestrialwater storage deficit over the Yangtze River Basin, China. Sci. Total Environ. 2018, 634, 727–738. [Google Scholar]
- Feng, W. Regional Variations in Terrestrial Water Storage and Sea Level Detected by Spatial Gravimetry. Ph.D. Thesis, University Toulouse 3 Paul Sabatier (UT3 Paul Sabatier), Toulouse, France, 2014; p. 140. [Google Scholar]
- Emerton, R.E.; Stephens, E.M.; Pappenberger, F.; Pagano, T.C.; Weerts, A.H.; Wood, A.W.; Salamon, P.; Brown, J.D.; Hjerdt, N.; Donnelly, C.; et al. Continental and global scale flood forecasting systems. Wiley Interdiscip. Rev. Water 2016, 3, 391–418. [Google Scholar] [CrossRef]
- Chen, J.L.; Wilson, C.R.; Seo, K.W. Optimized smoothing of gravity recovery and climate experiment (grace) time-variable gravity observations. J. Geophys. Res. Solid Earth 2006, 111, 408. [Google Scholar] [CrossRef]
- Duan, X.J.; Guo, J.Y.; Shum, C.K.; van der Wal, W. On the postprocessing removal of correlated errors in GRACE temporal gravity field solutions. J. Geod. 2009, 83, 1095–1106. [Google Scholar] [CrossRef]
- Mohamed, A.; Al Deep, M. Depth to the bottom of the magnetic layer, crustal thickness, and heat flow in Africa: Inferences from gravity and magnetic data. J. Afr. Earth Sci. 2021, 179, 104204. [Google Scholar] [CrossRef]
- Mohamed, A.; Al Deep, M.; Abdelrahman, K.; Abdelrady, A. Geometry of the Magma Chamber and Curie Point Depth Beneath Hawaii Island: Inferences from Magnetic and Gravity Data. Front. Earth Sci. Sect. Solid Earth Geophys. 2022, 10, 847984. [Google Scholar] [CrossRef]
- Othman, A. Measuring and Monitoring Land Subsidence and Earth Fissures in Al-Qassim Region, Saudi Arabia: Inferences from InSAR. In Advances in Remote Sensing and Geo Informatics Applications; El-Askary, H., Lee, S., Heggy, E., Pradhan, B., Eds.; Springer: Cham, Switzerland, 2019; pp. 287–291. [Google Scholar] [CrossRef]
- AL Deep, M.; Araffa, S.A.S.; Mansour, S.A.; Taha, A.I.; Mohamed, A.; Othman, A. Geophysics and remote sensing applications for groundwater exploration in fractured basement: A case study from Abha area, Saudi Arabia. J. Afr. Earth Sci. 2021, 184, 104368. [Google Scholar] [CrossRef]
- Mohamed, A.; Abu El Ella, E.M. Magnetic Applications to Subsurface and Groundwater Investigations: A Case Study from Wadi El Assiuti, Egypt. Int. J. Geosci. 2021, 12, 77–101. [Google Scholar] [CrossRef]
- Buma, W.G.; Lee, S.-I.; Seo, J.Y. Hydrological Evaluation of Lake Chad Basin Using Space Borne and Hydrological Model Observations. Water 2016, 8, 205. [Google Scholar] [CrossRef]
- Skaskevych, A.; Lee, J.; Jung, H.C.; Bolten, J.; David, J.L.; Policelli, F.S.; Goni, I.B.; Favreau, G.; San, S.; Ichoku, C.M. Application of GRACE to the estimation of groundwater storage change in a data-poor region: A case study of Ngadda catchment in the Lake Chad Basin. Hydrol. Process. 2020, 34, 941–955. [Google Scholar] [CrossRef]
- Gonçalvès, J.; Petersen, J.; Deschamps, P.; Hamelin, B.; Baba-Sy, O. Quantifying the modern recharge of the “fossil” Sahara aquifers. Geophys. Res. Lett. 2013, 40, 2673–2678. [Google Scholar] [CrossRef]
- Divins, D. Total Sediment Thickness of the World’s Oceans and Marginal Seas; NOAA National Geophysical Data Center: Boulder, CO, USA, 2003.
- de Vries, J.J.; Simmers, I. Groundwater recharge: An overview of process and challenges. Hydrogeol. J. 2002, 10, 5–17. [Google Scholar] [CrossRef]
- Milewski, A.; Sultan, M.; Yan, E.; Becker, R.; Abdeldayem, A.; Soliman, F.; Gelil, K.A. A remote sensing solution for estimating runoff and recharge in arid environments. J. Hydrol. 2009, 373, 1–14. [Google Scholar] [CrossRef]
- Mohamed, A.; Ahmed, E.; Alshehri, F.; Abdelrady, A. The groundwater flow behavior and the recharge in the Nubian Sandstone Aquifer System during the wet and arid periods. Sustainability 2022, 14, 6823. [Google Scholar] [CrossRef]
- Mohamed, A.; Asmoay, A.; Alshehri, F.; Abdelrady, A.; Othman, A. Hydro-geochemical applications and multivariate analysis to assess the water–rock interaction in arid environments. Appl. Sci. 2022, 12, 6340. [Google Scholar] [CrossRef]


| Component | Entire Period | Period I | Period II | Period III | |
|---|---|---|---|---|---|
|
GRACE total (ΔTWS) | CSR | +0.63 ± 0.12 | +0.69 ± 0.44 | +0.18 ± 0.50 | +2.78 ± 1.72 |
| JPL | +0.54 ± 0.07 | +0.80 ± 0.29 | +0.05 ± 0.29 | +1.13 ± 0.95 | |
| GSFC | +0.76 ± 0.08 | +1.17 ± 0.30 | +0.011 ± 0.30 | +2.04 ± 1.08 | |
| AVG | +0.63 ± 0.08 | +0.89 ± 0.34 | +0.07 ± 0.36 | +1.66 ± 1.20 | |
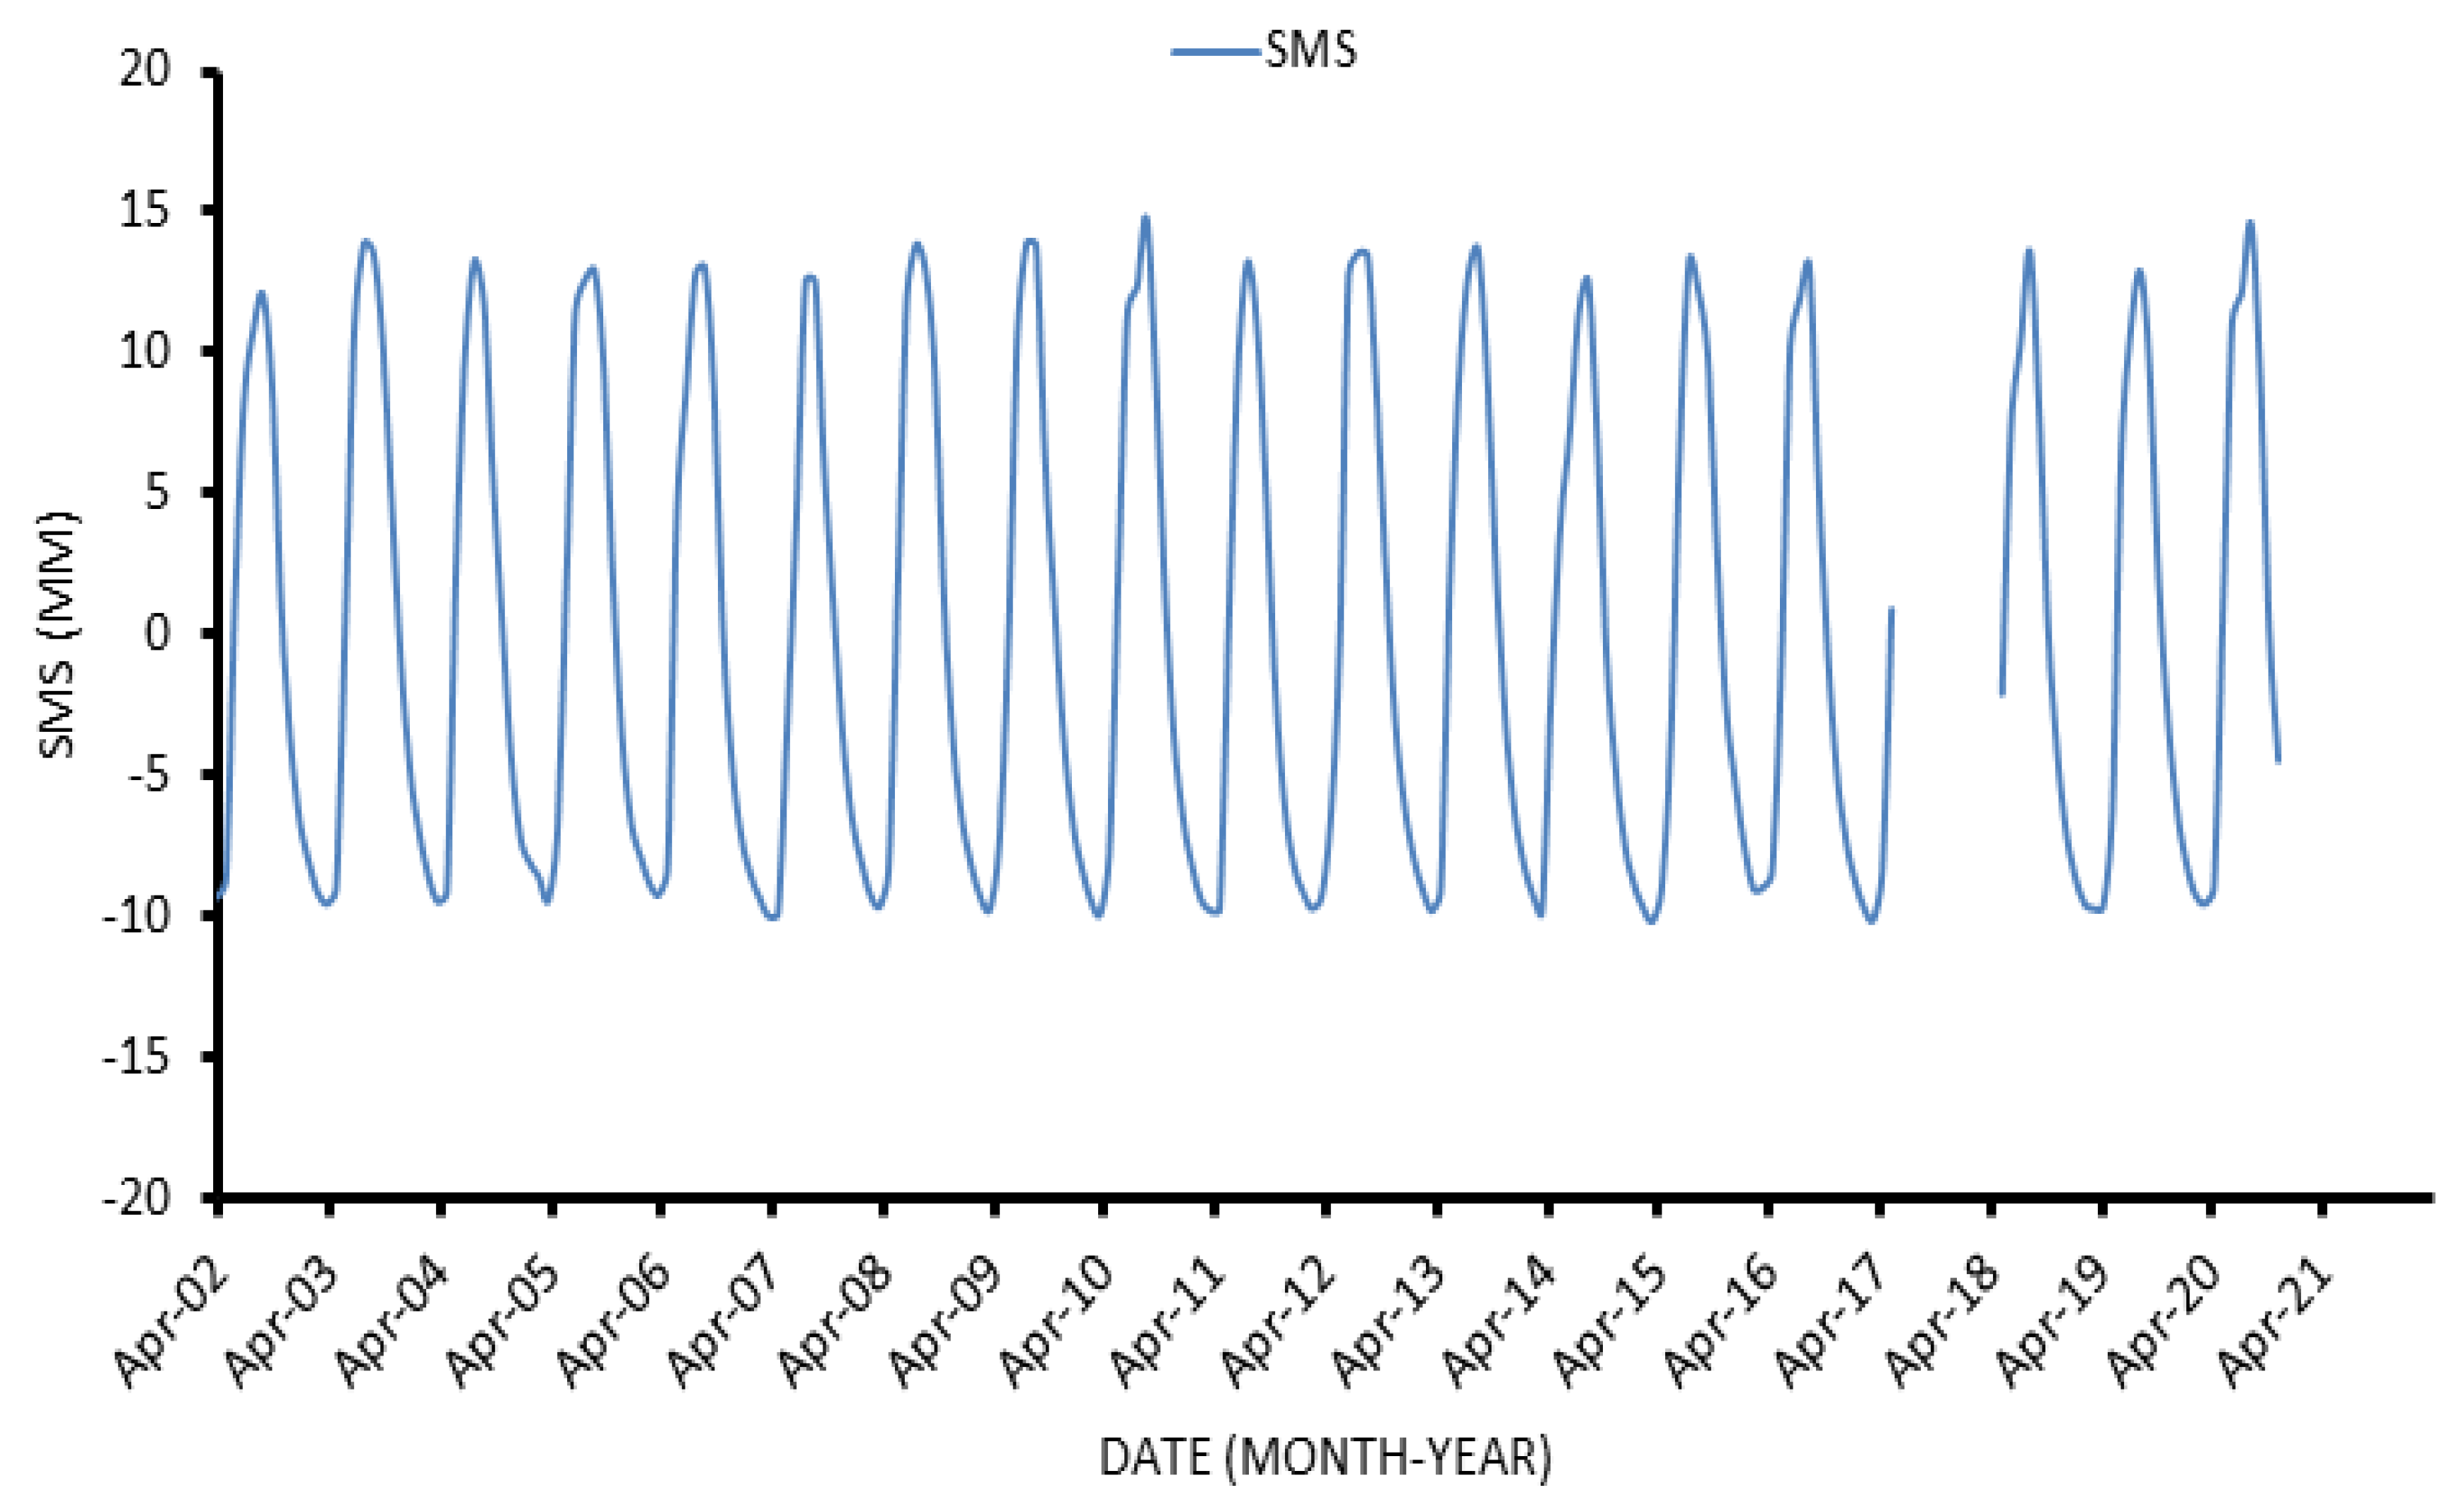
| ΔSMS | −0.002 ± 0.01 | 0.004 ± 0.003 | −0.013 ± 0.042 | 0.022 ± 0.132 | |
| ΔGWS | +0.63 ± 0.08 | +0.89 ± 0.31 | 0.085 ± 0.33 | +1.64 ± 1.11 | |
| AAP (mm) | 692.5 | 696.1 | 696.1 | 645.8 | |
| STI Zig | STI Ked | STI Tamba | STI Matam | SPI Ziguinchor | SPI Kédougou | SPI Mbour | SPI Tamba | SPI Dakar | SPI Matam | CSR | JPL | GSFC | |
|---|---|---|---|---|---|---|---|---|---|---|---|---|---|
| STI Zig | 1 | ||||||||||||
| STI Ked | 0.64 | 1 | |||||||||||
| STI Tamba | 0.30 | 0.09 | 1 | ||||||||||
| STI Matam | 0.58 | 0.48 | 0.61 | 1 | |||||||||
| SPI Ziguinchor | 0.42 | 0.54 | 0.20 | 0.36 | 1 | ||||||||
| SPI Kédougou | −0.18 | −0.57 | 0.26 | 0.10 | 0.03 | 1 | |||||||
| SPI Mbour | 0.30 | 0.19 | 0.13 | 0.48 | 0.39 | 0.36 | 1 | ||||||
| SPI Tamba | −0.01 | −0.31 | 0.00 | −0.28 | 0.11 | 0.41 | 0.19 | 1 | |||||
| SPI Dakar | 0.19 | 0.22 | 0.17 | 0.20 | 0.62 | 0.35 | 0.71 | 0.13 | 1 | ||||
| SPI Matam | −0.39 | −0.39 | −0.31 | −0.29 | −0.28 | 0.03 | 0.06 | −0.17 | −0.10 | 1 | |||
| CSR | 0.34 | 0.58 | 0.45 | 0.68 | 0.39 | 0.01 | 0.16 | −0.33 | 0.08 | −0.20 | 1 | ||
| JPL | 0.40 | 0.70 | 0.38 | 0.71 | 0.44 | −0.12 | 0.18 | −0.50 | 0.14 | −0.19 | 0.97 | 1 | |
| GSFC | 0.45 | 0.72 | 0.28 | 0.63 | 0.51 | −0.11 | 0.19 | −0.39 | 0.18 | −0.16 | 0.94 | 0.97 | 1 |
Publisher’s Note: MDPI stays neutral with regard to jurisdictional claims in published maps and institutional affiliations. |
© 2022 by the authors. Licensee MDPI, Basel, Switzerland. This article is an open access article distributed under the terms and conditions of the Creative Commons Attribution (CC BY) license (https://creativecommons.org/licenses/by/4.0/).
Share and Cite
Mohamed, A.; Faye, C.; Othman, A.; Abdelrady, A. Hydro-Geophysical Evaluation of the Regional Variability of Senegal’s Terrestrial Water Storage Using Time-Variable Gravity Data. Remote Sens. 2022, 14, 4059. https://doi.org/10.3390/rs14164059
Mohamed A, Faye C, Othman A, Abdelrady A. Hydro-Geophysical Evaluation of the Regional Variability of Senegal’s Terrestrial Water Storage Using Time-Variable Gravity Data. Remote Sensing. 2022; 14(16):4059. https://doi.org/10.3390/rs14164059
Chicago/Turabian StyleMohamed, Ahmed, Cheikh Faye, Abdullah Othman, and Ahmed Abdelrady. 2022. "Hydro-Geophysical Evaluation of the Regional Variability of Senegal’s Terrestrial Water Storage Using Time-Variable Gravity Data" Remote Sensing 14, no. 16: 4059. https://doi.org/10.3390/rs14164059
APA StyleMohamed, A., Faye, C., Othman, A., & Abdelrady, A. (2022). Hydro-Geophysical Evaluation of the Regional Variability of Senegal’s Terrestrial Water Storage Using Time-Variable Gravity Data. Remote Sensing, 14(16), 4059. https://doi.org/10.3390/rs14164059