Article

Mapping the Recent Vertical Crustal Deformation of the Weihe Basin (China) Using Sentinel-1 and ALOS-2 ScanSAR Imagery

1
College of Geology Engineering and Geomatics, Chang’an University, Xi’an 710054, China
2
Department of Earth Sciences, Southern Methodist University, Dallas, TX 75025, USA
3
School of Mining and Geomatics Engineering, Hebei University of Engineering, Handan 056038, China
4
Handan Key Laboratory of Natural Resources Spatial Information, Handan 056038, China
5
School of Geomatics Science and Technology, Nanjing Tech University, Nanjing 211800, China
*
Author to whom correspondence should be addressed.
Remote Sens. 2022, 14(13), 3182; https://doi.org/10.3390/rs14133182
Submission received: 26 May 2022 / Revised: 28 June 2022 / Accepted: 1 July 2022 / Published: 3 July 2022
(This article belongs to the Special Issue Advances in InSAR Imaging and Data Processing)

Abstract

:
The Weihe Basin, located in central China, is a Cenozoic rift basin that is characterized by a complicated geological background, with intense tectonic movement and relatively significant seismic activity. The faulting behaviors, slip rates, geometrical structures, and possible surface traces of the active faults in the Weihe Basin are still not well known. The goal of this work is to provide a more complete picture of recent vertical ground deformation of the basin and to identify active faults. We derived two basin-wide average InSAR deformation maps during 2015–2019 using C-band Sentinel-1A/B and L-band ALOS PALSAR2 ScanSAR imagery. The basin-wide vertical and east–west deformation components decomposed from ascending and descending InSAR measurements show that vertical movement dominates the deformation of the Weihe Basin. Subsidence and uplift maxima both occurred over the Xi’an region at rates of about −146 and 20 mm/y, respectively. A subsidence of ~38 mm/y was found at Sanyuan, Fuping, Weinan, Lantian, Qianxian, and Xingping while an uplift of ~11 mm/y was found at Fufeng, Huxian, Jingyang, Fuping, Pucheng, and Huaxian. The significant vertical deformation in these regions is spatially linked to previously identified or unmapped faults. A slip rate of ~13.7 mm/y on faults F20, F6, F10, and F7 explained the observed uplift of up to 5 mm/y in the Fufeng and Wugong areas. Furthermore, surface fault traces were clearly identified for faults F7-1, F8-1, F20, F25, and F26 based on discontinuities in the InSAR-derived vertical deformation measurements. Our results provide an accurate and economical way to delineate the surface deformation and fault movement and the associated geohazards over the Weihe Basin, and offer independent unprecedented data for further geological and geophysical interpretation.

1. Introduction

The Weihe Basin is an elongated Cenozoic rift basin located in central China, which formed after the collision between the Indian and Eurasian plates, covering nearly 40,000 km2 along the Weihe River (Figure 1). This elongated intracontinental graben is filled with Tertiary sediments and surrounded by the Weibei Uplift of the Ordos Basin, the Qinling Orogenic Belt, the North China Block, and the Qinghai-Tibet Block. Depression of the basin has occurred since the Eocene period under the continuous northward drift and push of the Qinghai-Tibet Plateau [1]. The basin is characterized by a complicated geological background, with intense tectonic movement and induced deformation due to anthropological activities, mainly the overexploitation of groundwater, e.g., [2,3,4,5]. Quaternary active normal faults are well-developed through the whole basin as a response to the continental rifting associated with the Ordos Block and the Qinling Orogenic Belt [6]. More than 100 faults have been discovered over the Weihe Basin, and a sequence of E–W trending parallel normal fault structures, dipping towards the basin, are the principal factor of sedimentary basin formation, including of the North Qinling Fault, the Kouzhen-Guanshan Fault, the Weihe Fault, and the Huashan Fault. The N–S striking faults, including the Longxian–Mazhao Fault, the Changan–Lintong–Baishui Fault, and the Jingyang–Lantian Fault, were also involved in the development of the basin [4,7]. These tectonic active crisscross faults cut the underground unconsolidated sedimentary layers into several tectonic fault blocks, as Figure 1 shows. Previous researchers have inferred that the average dip-slip rate of these faults was about ~0.18–5.7 mm/y, based on their estimations of the loess tableland vertical offset and radiocarbon dating [6,8]. High levels of seismicity have been recorded historically in the basin since 1177 AD, and four of them were larger than Mw7, including the world’s deadliest Mw8.5 earthquake in Huaxian (Figure 1) [9]. Most of the documented earthquakes in the Weihe Basin were related to faulting activity, demonstrating that the normal faults in the Weihe Basin are seismically active [4,6,8]. Recently, seismicity has been active in the Weihe Basin, with 3160 earthquakes occurring during the period of 2009–2021, although no violent earthquakes have occurred, as only 4 of these 3160 were larger than Mw4 but smaller than Mw5.3.
Accurate localization and monitoring of recent ground deformation and active faults remain crucial for the protection of people and infrastructures from severe damage. A more detailed study of fault segments is necessary to determine the cause of increased fault activity and, therefore, reduce the potential hazard of active faults. The crustal deformation and tectonic features of the Weihe Basin have been investigated using various means, including GPS [7,10,11,12], leveling [7,11,13], remote sensing [6], field surveys [6,8], and the InSAR technique [14]. Even though leveling and GPS (35 sites installed in the Weihe Basin) provide high-accuracy deformation measurements for scattered positions, they have limitations regarding their ability to offer more comprehensive details on tectonic deformation over such a large area as the Weihe Basin. In addition, only the horizontal component of the GPS velocity has been used for analysis in most of the related studies due to the accuracy restriction of vertical measurement. With the assistance of a field investigation, remote sensing imagery could detect active fault traces through multi-perspective views of topographic features using satellite images [6]. Field surveys, including field investigations and all geophysical and geological observations that are generally conducted onsite, are still the principal method used to discover surface fault lines and structure features over most of the Weihe Basin area. However, performing this surveying network or geological investigation in the field is labor-intensive, costly, and offers low repeatability. InSAR has the capacity to retrieve historical displacement, recognize small-sized ground anomalies, extensively unveil the geographical distributions of surface deformations, and identify displacement boundaries in a high spatial resolution of meters and an accuracy of centimeters to millimeters. The surface deformation over the Weihe Graben was investigated by the authors of [14], utilizing Envisat (2003–2010) and Sentinel-1 (2014–2021) SAR imagery. They recognized localized deformations triggered by both hydrocarbon production in the northern mountainous area and groundwater pumping in the Xi’an, Xianyang, and Kouzhen-Guanshan areas, and then quantified the effect of subsidence-caused coulomb stress changes on the surrounding faults over the Sanyuan region. However, while slip rates and structural features are reported by the literature for a few segments of some faults, e.g., in [3,4,5,6,7,8,10,11,13,15], the basin-wide deformation of unconsolidated sedimentary layers, the distribution of active faulting, and the vertical crustal deformation induced by this active normal faulting have rarely been studied. In addition, the faults in the Weihe Basin have been traced as very simple linear structures either along topographic boundaries or by drawing lines between the rare discrete geological investigation sites. The possible surface trace, slip rates, geometrical structures, and geometric distribution of these faulting have still not been imaged thoroughly and thus remain indistinct in the Weihe Graben.
Figure 1. Geologic map of the Weihe Basin. The colored blocks show the division of the tectonic units, whose names are indicated below the figure [16,17]. The black dashed lines display the major mapped faults [4,18]. The red and blue arrows represent the locations of the leveling benchmarks. The black dots show the major cities. The red balls display historic earthquakes larger than Mw7.0. The location of the Weihe Basin in China is shown at the lower left, on which the red and blue boxes indicate the coverages of the Sentinel-1A/B and ALOS-2 images, respectively.
Remotesensing 14 03182 g001
The goal of this work is to provide a more complete image of recent vertical ground deformation and to identify active faults in the Weihe Basin, including monitoring the geometric distribution, slip rate, and structural features, and establish the location of faulting behaviors using InSAR imagery. With C-band Sentinel-1A/B and L-band ALOS PALSAR2 ScanSAR scenes, and leveling measurements, this work explores the ground surface information and active faulting in the Weihe Basin using InSAR observations [19,20]. Firstly, we derived the long-term average InSAR deformation rate from 2015 to 2019 to illustrate the geometric spatial distribution of the ground surface deformation and active faulting in the Weihe Graben. In this paper, we used an established time-series InSAR processing technique that integrates both PS and SBAS to improve coherent pixels. We paid particular attention to spatial-temporal filters to reduce atmospheric artifacts. Secondly, the basin-wide vertical and horizontal components of ground movements during 2015–2019 were determined, for the first time, from both ascending and descending InSAR tracks, which facilitate the detection of the tectonic signal. Thirdly, leveling observations were employed to validate the InSAR vertical deformation, and cross-validation was also conducted between the descending PALSAR2 and ascending Sentinel-1A/B measurements. Fourthly, the structural features and slip rates of the principle active faults were analyzed. Fifthly, we generated a model of fault slip using our dense InSAR vertical measurements as constraints to investigate the fault features. Finally, we refined the fault traces using the vertical phase discontinuities as recognized by an InSAR displacement map. The InSAR-refined fault lines corresponded with the previously mapped ones in most locations.

2. Datasets and Processing Methods

2.1. Multitemporal InSAR (MTI) Processing

2.1.1. PS-InSAR Processing

The PS-InSAR method employs sequences of SAR images to identify Persistent Scatterer (PS) pixels whose phases remain coherent during the observation interval [21]. We implemented the Stanford Method for Persistent Scatterers (StaMPS) for PS-InSAR processing [19,20,22]. PS candidates are initially chosen and subjected to the amplitude analysis, and the PS probability is then estimated by an iterative phase analysis based upon the phase decorrelation noise, γx, which depicts the variance in the residuals between the observed and estimated phases at the PS candidate pixel [19]:
γ x = 1 N | i = 1 N exp { 1 ( ψ x , i Δ ψ ^ θ , x , i u ψ ˜ x , i ) } |
where N is the number of interferograms, ψ x , i is the wrapped phase of pixel x in the ith interferogram, Δ ψ ^ θ , x , i u is the evaluated spatially uncorrelated look angle error factor, and ψ ˜ x , i is the estimation of the spatially correlated factor. The change in the root mean square in γx Equation (1) is determined via each loop. The iterative process ceases when γx is no longer decreasing [20] and the solution has converged.

2.1.2. SBAS Processing

The Small Baseline Subsets (SBAS) method selects interferograms whose temporal separations, perpendicular baselines, and Dopplers are below certain thresholds to maximize interferometric coherence [19,23]. Range and azimuth filtering are implemented on image pairs to diminish the effects of the non-overlapping Doppler spectrum and geometric decorrelation. Slow filter phase (SFP) pixels are picked from amidst the pixel candidates in the same manner as in the PS method. It should be emphasized that the PS pixels are chosen by referring to the single-reference interferograms with no spectral filtering while SFP pixels are selected through multiple-reference small-baseline interferograms with spectral filtering.

2.1.3. MTI Processing

The pixels from both PSs and SFPs are then integrated prior to the process of phase unwrapping to ensure the stability of the unwrapped phase. The coordinate SBAS phase ( ψ x , R , S ) of PSs is calculated by restructuring the according single-reference interferogram phase:
ψ x , R , S = W { ψ x , S ψ x , R }
where ψ x , S is the single-reference phase for the SBAS secondary, ψ x , R is the single-reference phase for the SBAS reference, and W { } is the wrapping operator. The combined SBAS interferometric phases, composed of PS and SFP pixels, are then followed by the procedures of 3D phase unwrapping and a deformation-to-phase solution. The atmospheric artifact and baseline error are then estimated and eliminated by means of temporal high-pass filtering and spatial low-pass filtering. Additionally, the Toolbox for Reducing Atmospheric InSAR Noise (TRAIN) package [24] and GACOS [25] are optionally applied to produce atmospheric correction for select SAR images. The corrected unwrapped phase from selected small-baseline interferograms is then inverted to establish the deformation rates for all pixels by utilizing a least-squares approach.

2.2. Stacking Method

The stacking method extracts the deformation by averaging the unwrapped interferometric stacks to mitigate the effect of atmospheric phase signals. The method assumes that the ground surface deforms linearly and that the atmospheric phase delay is random in time [26]. The equation of the stacking method is as follows:
ϕ r a t e = ( i = 1 N t i × ϕ i ) / i = 1 N t i 2
where ϕ r a t e represents the average rate of the deformation phase, N is the amount of used interferograms, ti is the temporal baseline of interferogram I, and ϕ i is the unwrapped phase of interferogram i.

2.3. Multidimensional Small-Baseline Subset Method

In regions with overlapping spatiotemporal coverage of SAR images, multi-sensor acquisitions could be utilized to reconstruct deformations in a two-dimensional (2D) manner. The multidimensional small-baseline subset (MSBAS) method is employed in this paper to integrate datasets from the ascending Sentinel-1A/B and descending ALOS2 for the computation of the 2D deformation [27,28]. The sets of independent SAR acquisitions could be conferred in the following Equation (4) [27]. The MSBAS method applies Tikhonov regularization to remove oscillations induced by the rank deficiency, and the regularized problem can be written as in Equation (5):
A ^ V ^ l o s = ϕ ^ o b s
( A ^ λ L ) ( V E V U ) = ( ϕ ^ 0 )
where λ is a regularization parameter and L is a graphic identity matrix. V E and V U are the average deformation rates in the east–west and vertical directions, and ϕ ^ is the observed (unwrapped) interferometric displacement. The optimal λ could be selected at the intersection of the vertical and horizontal lines of the ‘L’ using the L-curve method, which is based on the parametric plots measuring the size of the regularized solution and the corresponding residual [27]. More details of the MSBAS technique can be found in [27].

2.4. SAR Data and Processing

The Weihe Basin is covered by a total of 92 Sentinel-1A/B scenes from ascending satellite track 84 and 6 ALOS PALSAR2 ScanSAR scenes from descending track 36, as shown in Figure 1. Sentinel-1 operates at the C-band (5.5 cm wavelength) while ALOS-2 PALSAR operates at the L-band (23.6 cm wavelength). In addition, we utilized a ~30 m Shuttle Radar Topography Mission (SRTM) DEM as an external DEM to eliminate the topographic phase in the generated interferograms [29].
Ninety-two SAR images from C-band Sentinel-1A/B tracks during the period of 2015–2019 were employed in this study to illustrate the spatial distributions of the land deformation over the Weihe Basin by utilizing the MTI processing method. We only had 6 scenes of ALOS-2 ScanSAR data from 2015 to 2018, and Stacking InSAR processing was applied to discover the deformation rates. Details about the SAR images employed in this work are shown in Table 1. The coverage of the ALOS-2 ScanSAR data is 350 km, with a pixel size of 8.6 and 2.1 m in the oblique range and azimuth directions, respectively. There are 5 sub-swaths of the image in each ScanSAR data, and the left 4 sub-swaths, covering the Weihe Basin, were utilized and processed separately in groups of swaths. The overlap area of about 8 km in the swath between neighboring sub-swaths was used for validation and mosaicking. We manually generated 16 interferograms by considering the baselines and quality of the interferograms, with a multi-look factor of 8 in range and 25 in azimuth. GACOS was applied to produce atmospheric corrections for the SAR images [25]. Ultimately, 4 average line-of-sight (LOS) deformation velocities during 2015 to 2019 were generated and then mosaicked using the raster dataset mosaic tool of ArcMap to show the overall distribution of deformation in the Weihe Basin.

2.5. Leveling Data

The first-order leveling data (the average probable accidental error per kilometer is ~0.45 mm and the average probable systematic error is ~1 mm) from 1972 to 2014 over the Weihe Basin were collected from the network of leveling benchmarks used for seismic applications across the major active faults in China, measured by the China Earthquake Administration, and the national leveling network of China, observed by the National Administration of Surveying, Mapping, and Geoinformation. Vertical rates at 5 selected GPS stations were used as prior constraints to restrain the system error in leveling nets when calculating the long-term vertical deformation rates. Locations and rates relative to the ITRF2008 frame of the leveling benchmarks are displayed in Figure 1 [7]. The observation times of the leveling routes are shown in Table 2. The average annual rate of each benchmark was calculated individually based on its own observation period.

3. Results

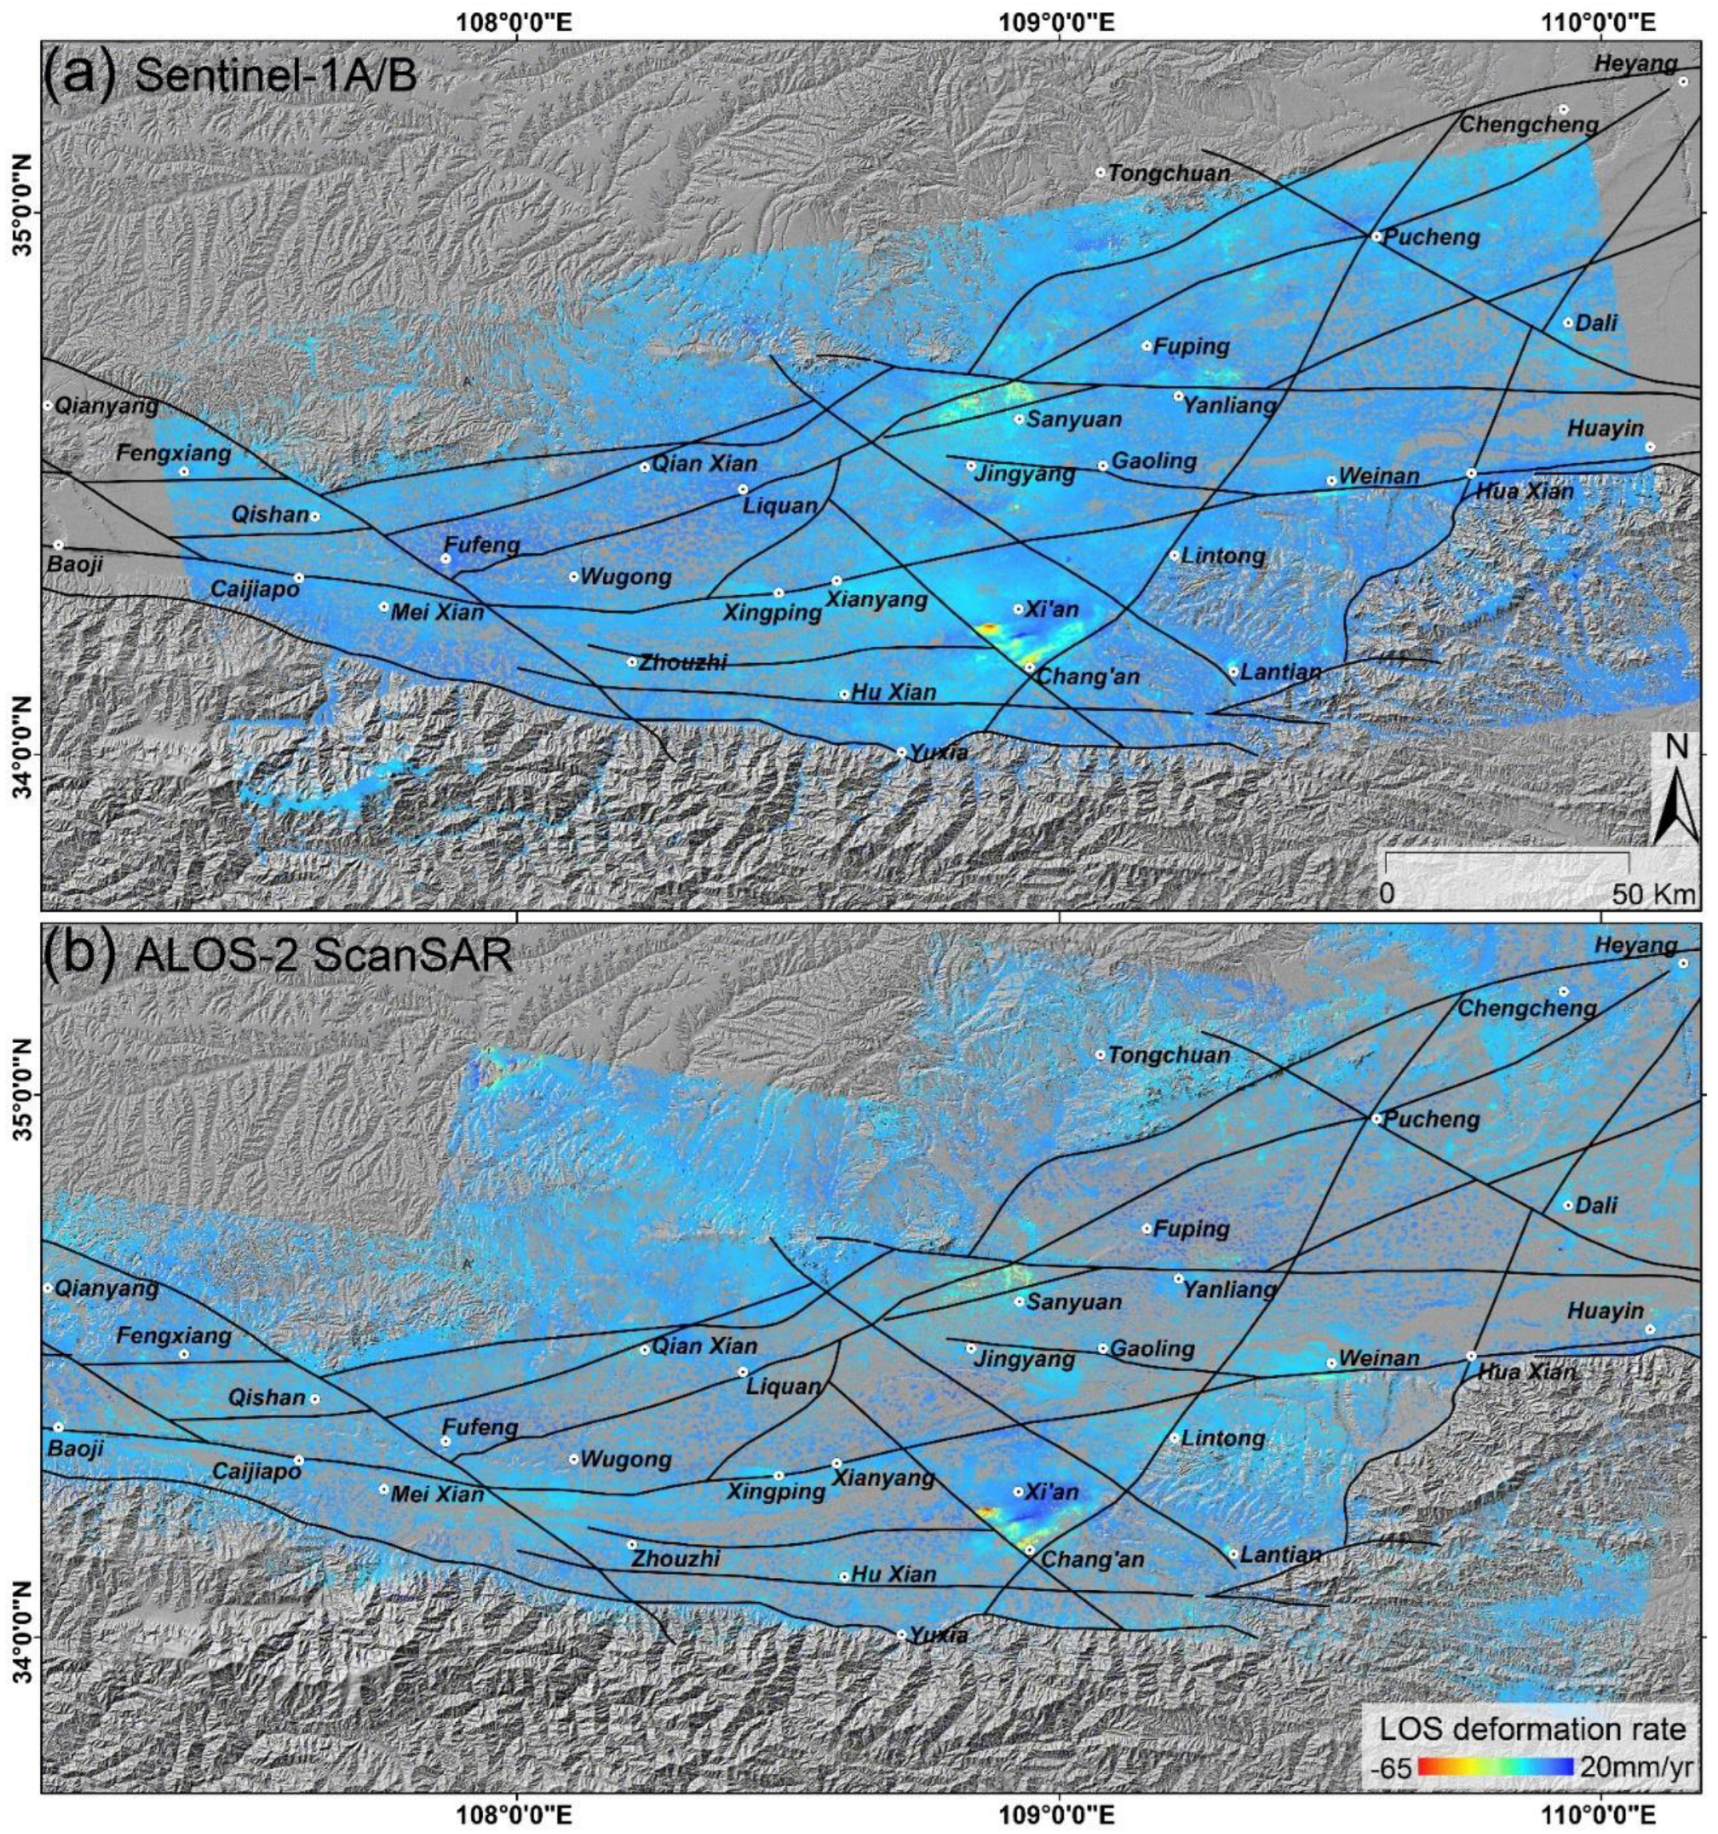
3.1. Long-Term Deformation Rate of the Weihe Basin

We processed SAR images from the Sentinel-1A/B and ALOS-2 PALSAR ScanSAR datasets by utilizing the MTI and stacking methods, respectively, and constructed two average line-of-sight (LOS) deformation maps of the Weihe Basin during the period of 2015–2019, as shown in Figure 2. Consistent deforming distributions and magnitudes were obtained between the measurements from the independent ascending and descending tracks. These velocity maps allowed us to delineate the spatially varying motions inside the basin. Subsidence and uplift maxima both occurred over the Xi’an region at a rate of about −140 and 17 mm/y, respectively. A subsidence of ~38 mm/y was observed over Sanyuan, Fuping, Weinan, Lantian, and Xingping while an uplift of ~11 mm/y was present over the areas of Fufeng, Huxian, Jingyang, Fuping, Pucheng, and Huaxian. It has been suggested that the large-scale ground deformation over Xi’an, Sanyuan, and Fuping was mainly induced by the extraction of groundwater, which is utilized for urban use and/or irrigation [4,7,14,30,31,32,33]. The subsidence rate at Xi’an and Sanyuan is much larger than the previously reported slip rates in the range of 2.1 to 5.7 mm/y over the southeastern part of the basin [6], excluding the possibility of tectonic origin. For Fuping County, the groundwater level change in the southern part of the county explains the deformation results acquired by both leveling and InSAR well [30], which is discussed in more detail in Section 3.3.

3.2. Two-Dimensional Deformation Maps

Because of the polar orbit of both the ascending and descending SAR data, the contribution from the north–south deformation component could not be evaluated through the InSAR measurements alone [34]. However, the sparse distribution of the GPS and leveling benchmarks mean they are inappropriate as part of the solution for deformation decomposition. In addition, the previous researchers that utilized GPS and leveling measurements state that the movement inside the Weihe Basin is principally in a vertical direction [4,5]. Thus, the basin-wide vertical and east–west components are decomposed from the ascending Sentinel-1A/B and descending ALOS-2 ScanSAR measurements. Given that the ascending and descending acquisitions are not acquired at the same resolution, we resampled both observations to a pixel size of 100 m, extracted the overlapping area of Sentinel-1 and ALOS-2, and then interpolated the blank area using a Laplace linear interpolation algorithm. The MSBAS method was then applied to decompose vertical and east–west deformations, and the 2D displacement components are demonstrated in Figure 3 [27]. The basin-wide vertical deformation rate map was constructed over the Weihe Basin for the first time. InSAR-detected deformation features are irregularly distributed in the basin in both the vertical and east–west directions. The color bar of Figure 3 has been converged to −10~10 mm/y to highlight the spatially varying crustal deformation inside the basin. The vertical displacement ranges from −146 to 20 mm/y, which is greater than that of the horizontal component (Figure 3), suggesting that vertical movement dominates the deformation of the Weihe Basin [4,5]. Because of a lack of external verification data, the horizontal deformation field is not discussed in this work.
The Weihe Basin has been divided into several fault-block tectonics with diverse sectional structures by the crisscross-orientated faults [3]. However, the segments of a fault are moving at a variable rate, and the ground within a fault block is also deforming at a different rate, which is described as a nonrigid block motion. Additionally, different active tectonic blocks behave with different patterns of movement. The significant vertical deformation in these regions is spatially linked to previously identified or unmapped faults, and clear contrasts in velocity can be observed across these fault positions, suggesting a high correlation between the measured deformation features and the faulting behaviors, e.g., F20, F6, and F7 of Figure 3. For instance, the major axes of the ellipsoidal subsidence and uplift patterns and the typical trends of ground fissures in Xi’an generally follow the Changan–Lintong Fault, the principal fault system bounding the Xi’an subsidence zones in the southeast, in an ENE orientation [4,33]. The Fufeng uplift zone is bounded by F6, F10, and F20 in the north, south, and east directions, respectively, and the Sanyuan subsidence pattern is confined by F4 in the north, as shown in Figure 2. Even though faulting is not the dominant impactor of the aforementioned deformation patterns, the existing fault geometry might destroy the integrality of the groundwater flow, restrict the deformation funnels migrating horizontally, and, consequently, exacerbate the localized deformation cone. Accordingly, an excessive localized deformation gradient would break the surface tension of soil and boost the relative motions between two sides of a fault. Therefore, land deformation and faulting mutually promote each other.

3.3. Accuracy Assessment

The deforming regions realized by the descending ALOS-2 ScanSAR and ascending Sentinel-1A/B imagery are typically in good agreement, as shown in Figure 2. We implemented a nearest neighbor method to interpolate both the ascending and descending InSAR measurements to a uniform grid before comparison, because the spatial distributions of the PSs from the two independent observations were disparate. Assuming that the deformation is purely vertical, two LOS observations were projected into the vertical direction regarding the corresponding incidence angles. Next, we compared the vertical displacements derived from the two independent sets of SAR imagery in the overlaps. A statistical histogram of the differences in the vertical deformations between the independent InSAR measurements is shown in Figure 4a. The RMS of the differences was approximately 3.3 mm/y. Leveling data were then used to assess the projected vertical deformations from Sentinel-1A/B and ALOS-2, and the MSBAS-derived vertical deformation (Figure 4b–d). The RMSs of the vertical displacement difference between the InSAR and leveling data were 2.6 (Sentinel-1A/B) and 2.8 mm/y (ALOS-2) individually, and the RMS was 2.2 mm/y for the difference between the MSBAS-derived vertical deformation and leveling data, demonstrating a great coincidence between the InSAR deformations and leveling data Figure 4d. This also illustrates that horizontal deformation cannot be neglected in the Weihe Basin, and that the MSBAS-derived deformation components can better delineate the characteristic of vertical displacement.
Subsequently, the InSAR-generated vertical deformations were compared with leveling measurements along six profiles (brown lines in Figure 3). Figure 5 displays the vertical surface displacements along six profile sections with a 5 km buffer zone in the north–south direction throughout the Weihe Basin. The gray dots show the InSAR vertical deformation, and the black lines represent the fitting lines of the InSAR observations utilizing an FFT low-pass filter method. The leveling measurements (rectangles), major faults (grey lines), and the refined fault’s locations (red lines), which are discussed in Section 6, are superimposed on the profile sections. The comparison results shown in Figure 4 and Figure 5 indicate that the InSAR measurement is in great accordance with the leveling measurement, with an RMS of ~2.2 mm/y, as shown in Figure 4d.
The discrepancies of ~8 mm/y that occurred at a few benchmarks, as shown in Figure 5, are probably due to the following three factors: First, the InSAR data are from 2015–2019 while the leveling work was conducted during the period of 1972–2014 at variable intervals, and we picked the average values of the accumulated years at each benchmark as the observed readings, i.e., the leveling measurements are from different observation sessions during 1972 to 2014 (Hu 2018). Thus, for benchmarks that experience time-varying displacements, the InSAR results might be different from those of leveling. The discrepancies in the benchmarks between F4 and F10, crossing the southern Fuping uplift feature, are one example (profile CC’ in Figure 5). InSAR realized an uplift pattern with a rate of ~5 mm/y during 2015–2019 while leveling recorded a subsidence of ~5 mm/y in a certain scenario during 1972 to 2014. According to the authors of [30], the withdrawal of groundwater from underground aquifers has been the principal water source for domestic and irrigation use in Fuping County since the 1960s, and the piezometric surface declined dramatically from 1985 to 2005 due to the over-extraction of groundwater, as shown in Figure 6. The rates of groundwater level decreased after Fuping County implemented groundwater withdrawal regulations no later than 2005; the groundwater level has even begun to rise since 2012, as shown in Figure 6 [30]. The leveling-derived subsidence is suggested to be related to the excessive exploitation of groundwater, and the InSAR-observed uplift feature is very likely induced by the recovered water level. The change in the groundwater level in southern Fuping County can explain the opposite deformation results acquired by leveling and InSAR well. Second, additional phase errors may have been induced by atmospheric delays and DEM errors in regions of larger relief; thus, the accuracy of InSAR products tends to be lower over mountainous areas [35]. The differences between InSAR and leveling along the EE’ profile is highly affected by the terrain, increasing gradually with the increase in the elevation, as shown in Figure 5. Third, larger difference values might occur over areas with localized deformation, e.g., some sites in profile section BB’, because our InSAR observations were extracted from a 5 km buffer zone, as shown in Figure 5. Leveling measurements from these sites do not satisfy the fitting line of the InSAR measurements but are consistent with some of the original InSAR observations. We infer that these leveling benchmarks might reside in areas that experience particular localized deformation.

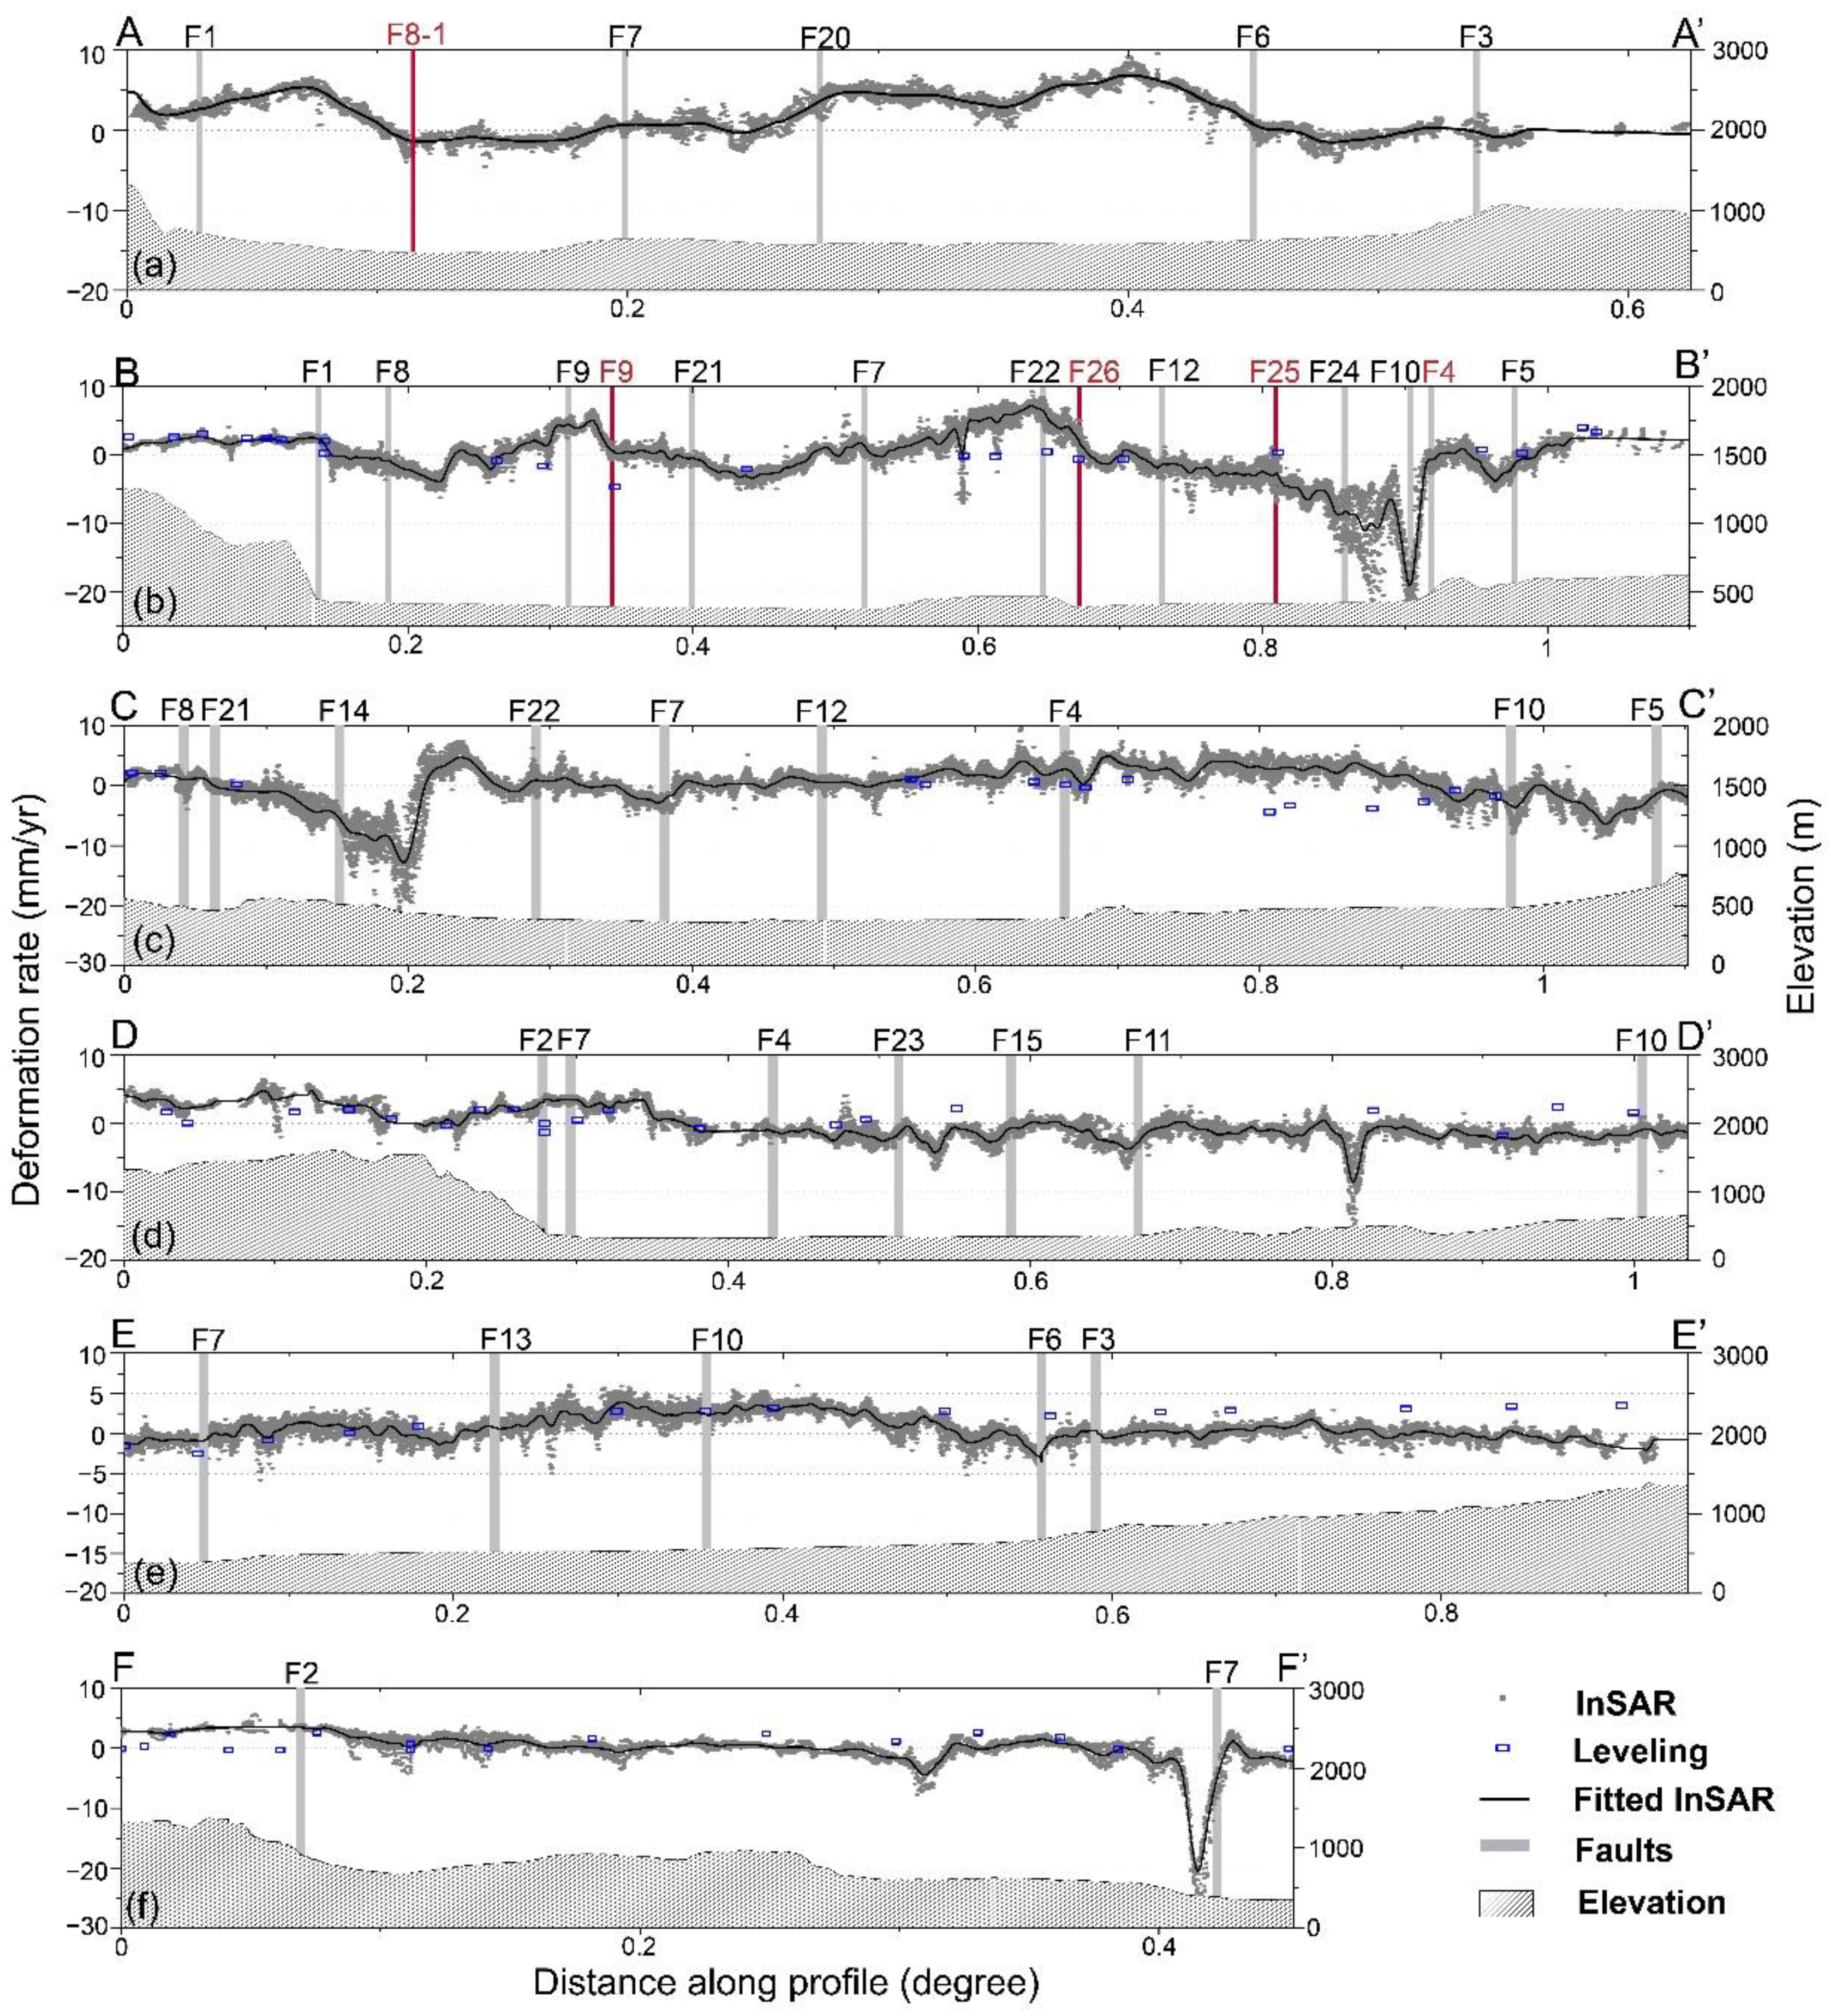
4. Analysis of Active Faults

The measurements from InSAR (2015–2019) and leveling (1972–2014), which were acquired in different periods of time, have a high degree of consistency, indicating that the normal faulting in the Weihe Basin exhibits high tectonic inheritance, as shown in Figure 5. Most of the anomalies in Figure 5 occurred over areas experiencing time-varied or localized deformation associated with human activities. Moreover, a high level of historical seismicity and massive tectonic fractures over the Cenozoic Weihe Basin also demonstrate that the normal faulting in the basin has been seismically active for hundreds of years [3,5]. Many of these faults that cut/bound the Weihe Basin were constantly active during our InSAR observation period of 2015–2019.
The North Qinling Fault (F1) bounds the Weihe Basin on the south, building up an approximate EW-trending 210-km-long mountain frontal fault, with the metamorphic rock and granite Qinling Mountains as the upthrown side and the well-dated and thick Cenozoic loess tableland as the downthrown side [7,36]. F1 has strong differential vertical movement, exhibiting abundant evidence of normal dip-slip faulting, with a dip angle of 60–85° towards the north [36]. InSAR discovered a differential movement of 2~4 mm/y along F1 during 2015–2019, as shown in Figure 3a,b, comparable with the rate of 2~3 mm/y observed by three routes of leveling during 1972–2014 [7]. The west–central section of F1 was slightly more active than the eastern part during 2015–2019 while the opposite happened in the period of 1972–2014, but the difference in the rates of the segments of F1 was only a tiny gap. No clustering earthquakes occurred along this continuous active fault system. InSAR realized a band-shaped uplift feature, covering a region of at least 55 km by 8 km, elongated east–west, on the north side of F1. The westward extensions of F8 and F1 are two major boundaries bounding this banded half-graben, as shown in Figure 3 and Figure 5. The EW-trending Yuxia–Tieluzi Fault (F8) is generally parallel with F1 6 km away in the north, and dip-slip down mostly to the north, with a >60° dip angle [37]. No prominent faulting activities are observed along the other parts of F8, as shown in Figure 3 and Figure 5.
The Kouzhen–Guanshan Fault (F4) is a hidden fault in the northeastern Weihe Basin, with an overall strike of EW, a length of 100–150 km, and a south dip of 40°–80°, and is one of the most seismically active faults in the Weihe Basin. This Holocene active fault has obvious linearity, which transversely cuts the NEE tendency northern Weihe fault system and is characterized mainly by a normal dip-slip and left-lateral strike-slip, with the south side moving down relatively [4,15,38,39]. More than 100 moderate–strong earthquakes have occurred in this area since 1976 [39]. Even though the deformations over Sanyuan and Fuping are principally induced by the withdrawal of groundwater, obvious differential movement between the two sides of F4 were observed from the InSAR vertical rate map, as shown in Figure 3. The different segments vary in their creeping rate, and the western section of F4 (~3 mm/y) was more active than the eastern part during 2015–2019, as shown in Figure 3 and Figure 5. Almost no vertical deformation was realized over eastern F4. According to the authors of [39], the eastern section experienced a quiescent stage after step-creeping occurred during 2012–2014. However, their conclusions about the constant creeping activities over sections of the western F4, which were drawn from two routs of fault-crossing short-leveling data over the Jingyangtai and Kouzhen sites, were still controversial. The exact locations of the observation sites in [39] were not provided, so it is still not certain whether these benchmarks fall into the range of Sanyuan and Fuping human-induced deformation features.
The Weihe fault zone (F7) is a buried deep basement fault zone along the Weihe River, with a length of >300 km, a width of 1–2 km, and an overall strike of EW, whose depth decreased gradually from the west to east [3,40]. According to [3], 68% of the Mw4 earthquakes and 70% of the Mw5 earthquakes in the Weihe Basin are correlated with F7; moreover, 87% of the Mw6 earthquake occurred along the seismic active Weihe fault zone. The recent faulting of F7 involves mainly normal dip-slip, with an N dip of 65°–80° at the eastern segments and an S dip of 70° at the western segments [7,39,40]. F7 is partitioned as active, with the north side moving up relatively, as shown in Figure 3 and Figure 5. Sharp changes of 3–10 mm/y in the vertical displacement across the Weihe fault zone can be observed in the InSAR subsidence map, especially over the sections between F20 and F21, while the most western part of F7, from Baoji to Meixian, was relatively inconspicuous during 2015–2019. The deformation of the segments between F21 and F14 is quite complex, due to the cross-distribution of several active faults. F7 intersects with the Chang’an–Lintong Fault (F14) in the deep formation and connects with the Jingyang–Gaoling Fault (F12) in the shallow sediments [40]. The majority of the recent shocks near F7 occurred over the V-shaped zone bounded by F22 and F14, i.e., the intersection of several faults (Figure 3). No obvious differential movements are observed along the eastern section of F7, except the deformation feature at Weinan. InSAR discovered a 9 km by 1.5 km strip-shaped subsidence feature, elongating EW, on the south side of F7, and a 2.5 km by 0.7 km strip-shaped uplift pattern on the north side of F7. The differential movement between two blocks can reach 25 mm/y. No groundwater-related subsidence was reported over this region, and the discovered intense differential movement is very likely caused by faulting.
The 130 km-long, NNW-trending Longxian–Mazhao Fault (F20) is another active fault in the Weihe Basin, whose south half-segment falls within the measurement footprint of the SAR image, i.e., mainly the Qishan–Mazhao part. The active faulting along F20 is dominated by left-lateral strike-slip, which has developed since the late Pleistocene [2]. However, a linear N-facing loess escarpment extends SE along the fault trace, indicating an apparent component of dip-slip occurring in the segment between F3 and F7 [2]. A differential movement of about 0.9 mm/y was reported by the authors of [7], with the eastern block moving up relatively. InSAR realized different surface displacements of ~5 mm/y around the Fufeng area during 2015–2019, where most of the recent earthquakes near F20 occurred. F20 cuts transversely across the EW-trending faults across the western Weihe Basin, including the very active F7, which has a great influence on both the underground geology and surface configuration of F20. The trace of F20 is no longer visible on the landform to the south of F7, i.e., the fault obscurely extends to the frontal mountain fault, F1 [2]. There is no contrast in the velocity across the branch of F20 between F7 and F1.
Changes in the vertical displacement across the Chang’an–Lintong–Baishui Fault (F14) could be realized from the InSAR deformation map, as shown in Figure 3. F14 is characterized principally by a normal dip-slip with the north block moving down relatively, with a length of 60 km, an overall strike of NE, and a dip angle of about 66° to the NNW [4]. InSAR discovered a 3~7 mm/y differential movement around the Xi’an area during 2015–2019, which remained fairly consistent, with a rate of 4 mm/y during 2005–2011, as measured by the authors of [41] using Envisat, ALOS-1, and TerraSAR-X SAR imagery in addition to geological investigations [42].
Velocity contrasts occurred at the majority of the fault positions, as shown in Figure 3a and Figure 5. The deformation rate varies widely among the fault sections, and even within a fault. In addition to the faults discussed above, an active faulting rate that varies from 1 to 8 mm/y can also be observed across the sections of F6, F10, F13, F21, F22, F24, F25, and F26 while the other faults are either dormant or inactive, with rates of less than 2 mm/y, including the Huashan Fault (F2), the seismogenic fault for the 1556 Huaxian earthquake, as shown in Figure 1 and Figure 5. Areas of faults’/blocks’ intersections are not only where the differential motion across faults mainly occurred but also where the seismic activity appeared. The seismicity around the Qishan–Mazhao Fault in the western Weihe Basin decreased while the seismicity in Gaoling and Yangling Counties in the middle portion of the Weihe Basin increased during our study period, as shown in Figure 3.

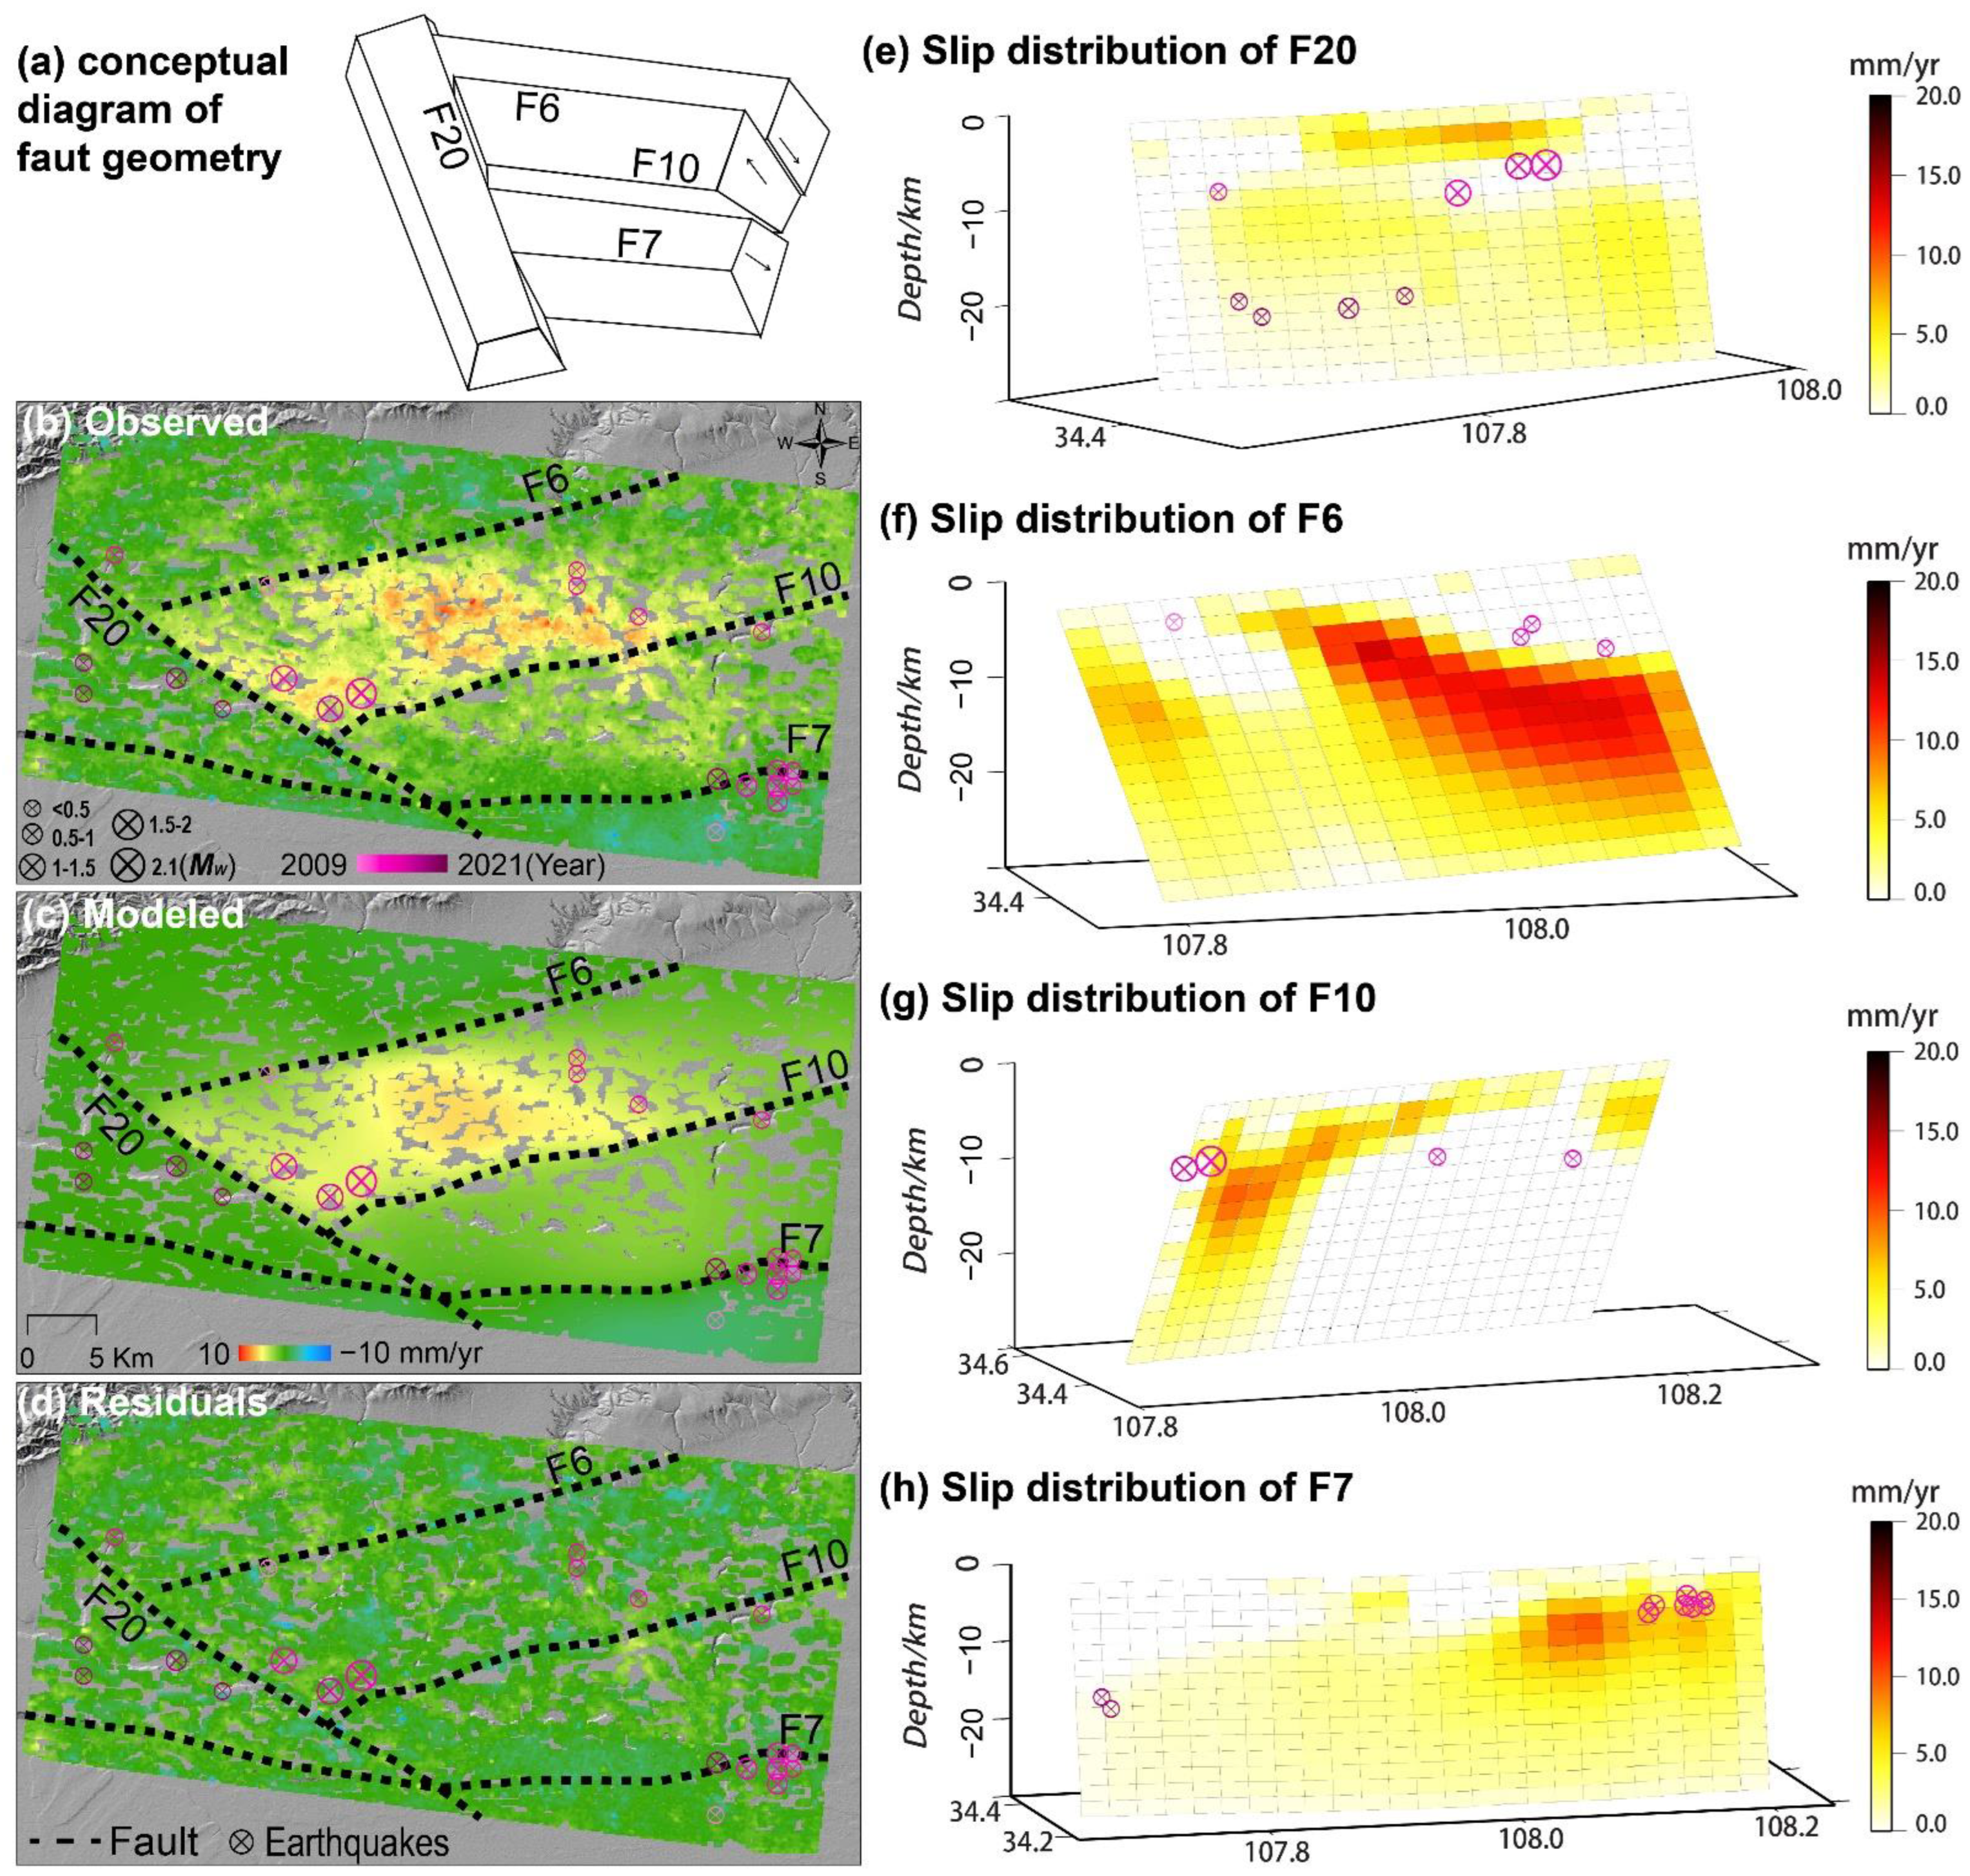
5. Construction of a Fault Model and Inversion of the Slip Distribution

In this section, we use the dense vertical deformation decomposed from InSAR maps with different viewing geometries to invert the detailed slip behaviors on faults over the Weihe Basin. Considering that the subsidence could be caused by anthropological activities, mainly the overexploitation of groundwater, it may be difficult to separate it from that of fault-related deformation. Thus, for simplicity, we only invert slip rates on faults distributed over the Fufeng and Wugong areas (location is marked on Figure 3a as pink rectangle), where tectonic movements are believed to be more prevalent, and no nontectonic activity has been documented before or in our study.

5.1. Fault Geometry Configuration and Modeling Method

Four faults, i.e., F20, F6, F10, and F7, are considered to be related to the InSAR-observed uplift over the Fufeng region. Previous geological and geodetic studies have shown that the western segments of F6 and F10, and the middle segment of F20 show a sense of reverse-slip motion with dip angles of 50°–85°. In this work, we simply assumed a uniform dip angle of 70° for F6, F10, and F7, and one of 80° for F20 [2,3,11,43,44]. The strike orientations of the four faults were directly derived from the previous mapped faults [2,19] and our InSAR-inferred fault traces. We used these four faults to build a fault model (denoted as Model D), with the conceptual fault geometry shown in Figure 7a.
We discretized the fault model into sequences of 3 km × 3 km sub-patches. Dislocations buried in an elastic half-space were utilized to solve the Green’s function for each sub-patch with a Poisson ratio of 0.25. The Steepest Descent Method (SDM) [45,46,47] was employed to invert the slip variations on fault planes using the InSAR-derived vertical deformation rate. To avoid unrealistic fluctuations in slip on faults, a smoothing parameter of 0.1 was employed to constrain the distribution of slip, which was determined from the analysis of the tradeoff curve between the data misfit and the slip roughness, as shown in Figure S1. The slip angles were set to vary between 80° and 100°, and fault motions are dominated by thrust slip.
It is also important to note that multiple experiments were carried out to find the fault model that could best explain the InSAR measurements. We built fault models consisting of one (Model A), two (Model B), three (Model C), and four (Model D) fault segments to examine the optimal fault model based on the correlation and RMS between the InSAR observation and its associated predictions (Table 3), and the experimental F test [48], as shown in Table 4. Finally, Model D, consisting of four fault segments, was utilized to build our fault model.

5.2. Simulation Results and Analysis

Table 3 shows that a correlation of 0.92 and an RMS of 1.0 mm/y were achieved for Model D while the corresponding values for Model B, Model C, and Model D ranged between 0.73–0.89 and 1.1–1.7 mm/y, respectively, indicating that Model D, consisting of F20, F6, F10, and F7, was the optimal fault model that can best explain the observations with an RMS misfit of 1 mm/y. Figure 7e–h show the inferred creep rates on F20, F6, F10, and F7, with a maximum slip of 13.7 mm/y observed on F6 at depths of 9–12 km. Furthermore, F6 appeared to be partially locked in the crust shallower than a depth of 12 km, although small earthquakes occurred there, as shown in Figure 7f. A slip maxima of 7.6 mm/y was observed on F20 at shallow depths of 3–6 km, as shown in Figure 7e. It seems that F20 is locked at depths of 9–16 km, where some small earthquakes with a magnitude from 1.3 to 1.8 ruptured these locked patches. Fault slip on the eastern segment of F10 appears to be concentrated at shallow depths ranging from ~15 km deep while slip on the western segment is distributed at depths of 15–24 km, with a maximum slip of ~9.7 mm/y. No significant shallow creep rate (<3 km) was observed on F7, but a maximum rate of ~10.0 mm/y was observed at 9–15 km, which decreases with depth. Figure 7e–h show that seismicity on faults F6, F7, F10, and F20, in general, occurred in little-to-no creeping patches that may be at least partially locked.
The median creep slip rates calculated from our model are 1.4 and 1.6 mm/y for F20 and F7, respectively, and 3.7 mm/y for both F6 and F10, as shown in Figure 7e–h. Geological studies [8] reported a slip rate of 1.5 mm/y in the vertical direction for F7, and studies from the authors of [6] announced that slip rates for faults in the southeastern Weihe Basin appear to be 2.1–5.7 mm/y. Our estimated creep slip rate could be a lower bound of the long-term fault slip rate. Nonetheless, our results are comparable to the geological slip rates. However, we should acknowledge that further studies on geometric structures and strain accumulation are needed to better shed light on the kinematic behaviors of these faults. The seismic moments released by the creeping on F20, F6, F10, and F7 are, respectively, 1.3 × 10¹⁶ N∙m, 4.0 × 10¹⁶N∙m, 1.4 × 10¹⁶ N∙m, and 2.6 × 10¹⁶ N∙m during the timing period of our observations, which are equivalent to events with a moment magnitude of Mw 4.68, Mw 5.01, Mw 4.71, and Mw 4.88, respectively.

6. Discussion about InSAR-identified Active Fault Traces

Extensive studies on faults have been conducted over the Weihe Basin, but most of the published fault maps are localized and rough, only traced as very simple linear structures either along topographic boundaries/surface fractures or drawing lines between the rare discrete geological investigation sites/surface fractures. This is especially the truth for buried faults without evidence on the ground surface, whose traces can only be delineated through drawing lines between the rare discrete geological sites. InSAR has the ability to comprehensively reveal large-scale ground deformations and identify small-sized surface anomalies and displacement boundaries with a high spatial resolution. Discontinuities in the deformation gradients across the fault positions offer the opportunity to picture active segments of faults through InSAR observations, because two blocks of a fault usually move at different rates, e.g., as shown in [49,50]. Several sharp phase discontinuities along/near fault lines have been successfully imaged by our long-term InSAR velocity map over the Weihe Basin, seen in contrasting colors in Figure 8a,c (pointed out by white arrows). Independent SAR data revealed remarkably coincidental velocity gradients (Figure 2). Underlying the assumption that the measured steep phase gradients are a consequence of ongoing differential movement between fault blocks, we drew lines along these discontinuities as fault lines. Figure 8 shows enlarged deformation maps over the Fufeng and Sanyuan areas, with superimposed known (white lines) [18] and InSAR-modified (black lines) faults. The InSAR discontinuous lines run on/near the pre-mapped fault locations in some places, demonstrating that our achievements essentially agree with the known fault positions but have the advantages of being more detail-oriented, having repeatability, wide coverage, and low consumption Figure 8.
The obvious phase discontinuity along the middle portion of F20 and F4 precisely follows the strike of the mapped fault traces, exhibiting a typical linear feature, as shown in Figure 8a,c. The InSAR-modified fault lines undoubtedly revealed the active segments of these two fault systems, even though no published material can support our findings. There has been much debate about whether F8-1 exists. F8-1 was considered as a normal fault with a dip angle of 45° and named the Gaojiacun–Gaodian Fault by the authors of [51] based on their geological trench profiles. The authors of [52] provided an opposite view, arguing that the faulting evidence reflected by the trench profiles in [51] was actually induced by either landslides or the erosion of an ancient riverbed instead of faulting, according to their trench and shallow seismic prospecting work. This being the case, they claimed that the trench profile is not definitive proof for active faulting, and that the Gaojiacun–Gaodian Fault does not exist at all. Despite the fact that we agree with their view on the non-inerrability of trench profiles, we still believe in the existence of F8-1 based on our deformation field and profile section. F1 is an active normal fault, with the north block moving down relatively, but a band-shaped uplift feature occurred at the north side of F1. The tendency of this uplift has been limited by F8-1 in the north, and the ground is gently subsided in the north side of F8-1, compatible with the entire basin, as shown in Figure 5. This suggests the possible existence of a reverse fault with a high dip angle, i.e., F8-1, that acts as an obstacle to the subsidence of the block between F1 and F8-1. Apparent differential movement between two blocks of F7 was also discovered by our InSAR measurement, and the trace of F7 was modified to F7-1. F7-1 generally follows the direction of F7, but with an overall shift northward by a few kilometers. Surprisingly, this modified fault is consistent with the fault line F7-Ma [53] (brown line) in most areas except the Xingping–Xianyang region, where F7-1 is in line with F7, as shown in Figure 8.
Figure 8. Enlarged vertical deformation maps over the Fufeng (a,b) and Sanyuan (c,d) regions, where the mapped faults (white lines) [18], InSAR-modified faults (black lines), and faults in Ma et al., 2018 (brown lines) [53] and Xu et al., 2017 (pink line) [54], and the main cities are superimposed.
Remotesensing 14 03182 g008
In addition to the modification of active fault positions in regard to [18], we also drew two new fault lines over the Jingyang area, i.e., F25 and F26, based upon our InSAR discontinuities. The mapped F25 tends to trend parallel to F10, F24, and F24-Xu in an ENE direction, and bound the Sanyuan subsidence cone in the south [18,37]. It looks as if F25 is involved in a listric faulting system together with F24, and the existence of F24, F24-Xu, and F25 acts as a barrier against groundwater motion, disrupting the integrity of groundwater flows and limiting the lateral extent of the Sanyuan settlement pattern. According to a previous study, an active fault has been developing in the Weihe Basin, and a variety of listric faults occurred along existing fault positions because of the continuous extending of the continental crust related to the Ordos Block [8]. F26 is generally mapped along the Jinghe River, trending parallel to the F22 in the northern half-section. The InSAR-derived fault line is perfectly coincidental with that from [53].

7. Conclusions

Utilizing C-and L-band SAR images collected during the period of 2015–2019, we explored the spatial distribution of ground deformation and the geometric distributions, slip rates, and structures of active faulting in the Weihe Basin. Combining InSAR data with leveling measurements and deformation modeling, we draw the following conclusions: First, basin-wide average InSAR deformation maps during 2015–2019 were derived by Sentinel-1A/B and ALOS PALSAR2 ScanSAR scenes. The peak subsidence and uplift both occurred in the Xi’an region, with rates of about −146 and 20 mm/y, respectively. A subsidence of ~38 mm/y was also found at Sanyuan, Fuping, Weinan, Lantian, Qianxian, and Xingping while an uplift of ~11 mm/y was found at Fufeng, Huxian, Jingyang, Fuping, Pucheng, and Huaxian. Second, by combining ascending and descending InSAR measurements, we produced, for the first time, basin-wide vertical and east–west components of the observed ground movements, which show that vertical movement dominates the deformation in the basin. The basin was divided into several fault blocks by the crisscross-orientated faults, and different active tectonic blocks behave as different patterns of movement. The detected features are spatially related to nearby faults, including nontectonic deformation patterns, as shown in Figure 2. Third, by utilizing leveling data, we declare that the precision of the InSAR-derived average (vertical) deformation rate could reach 2.2 mm/y. The high degree of consistency between the InSAR (2015–2019) and leveling (1972–2014) observations indicate that the normal faulting in the Weihe Basin exhibits high tectonic inheritance, as shown in Figure 5. Discrepancies occurred over regions experiencing time-varied or localized deformation associated with anthropogenic activities, such as Fuping County. Fourth, we analyzed the structural features and surface rates of the principle active faults. Dip-slip motion could be observed along the segments of F1, F4, F7, F20, F14, F6, F10, F13, F21, F22, F24, F25, and F26 while the other faults were either dormant or inactive during our study period. We also found that fault/block intersections and their surrounding regions are particularly sensitive seismic areas with extremely active faulting, i.e., large differential movement across faults. Fifth, we characterized the fault parameters through the modeling of our dense InSAR vertical measurements over the Fufeng area and realized that the inverted slip model of four faults can best explain the observed uplift of up to 5 mm/y. Last but not least, we performed modifications of the mapped fault locations based on the InSAR vertical phase discontinuities; at least three new/buried active fault traces were discovered and the segments of F20, F4, and F7 were imaged in detail.
InSAR provides an accurate and economical way to image ground deformation, fault motion, and the associated geohazards and offers independent unprecedented information for further geological interpretation. We will continue the work on monitoring tectonic deformations in the Weihe Basin, using all historic satellite images to review the spatial–temporal developments and the mechanisms of the basin-wide surface deformations and faulting activity, and to provide a more complete record of creeping faults over the basin.

Supplementary Materials

The following supporting information can be downloaded at: https://www.mdpi.com/article/10.3390/rs14133182/s1, Figure S1: Trade-off curve between roughness and misfit.

Author Contributions

All authors participated in editing and reviewing the manuscript. F.Q. and Y.N. processed the SAR data, Y.N., S.W. and F.Q. developed the modeling, F.Q., Q.Z., Y.N., Z.L., S.W., C.Z., W.Z., W.Q. and C.Y. analyzed and interpreted the results. All contributed the writing of this manuscript. All authors have read and agreed to the published version of the manuscript.

Funding

This research was supported by the China Postdoctoral Science Foundation (2016M602741), Shaanxi Province Postdoctoral Science Foundation (2017BSHEDZZ20), the Technologies R&D Program from the Bureau of Science and Technology of Handan (No. 21422903219), the National Key R&D Program of China (41731066), the Natural Science Foundation of China (42174032, 42174006, 42090055, 42074040 and 41929001), and the Science Fund for Distinguished Young Scholars of Shaanxi Province: 2022JC-18. Zhong Lu is supported by the Shuler-Foscue Endowment at Southern Methodist University.

Acknowledgments

We are grateful to The Second Monitoring and Application Center (CEA) for providing leveling data and earthquake catalog. 1 arc-seconds SRTM DEMs are freely downloaded from https://e4ftl01.cr.usgs.gov/MEASURES/SRTMGL1.003/ (accessed on 2 March 2020). Sentinel-1A/B data were downloaded from the European Space Agency (ESA), and the Japan Aerospace Exploration Agency (JAXA) kindly provided the ALOS-2 ScanSAR data. Thanks go to the StaMPS, TRAIN, GACOS, and SDM software packages.

Conflicts of Interest

The authors declare no conflict of interest.

References

  1. Zhang, Y.Q.; Mercier, J.L.; Vergély, P. Extension in the graben systems around the ordos (China), and its contribution to the extrusion tectonics of south china with respect to gobi-mongolia. Tectonophysics 1998, 285, 41–75. [Google Scholar] [CrossRef]
  2. Chen, Q.; Xiong, R.; Tian, Q. Segmentary characteristics of the geometrical structure of the longxian-qishan-mazhao active fault. Earthquake 2019, 38, 66–80. [Google Scholar]
  3. Peng, J. Tectonic evolution and seismicity of weihe fault zone. Seismol. Egology 1992, 14, 113. [Google Scholar]
  4. Peng, J.; Su, S.; Zhang, J. The Active Faults and Geohazards in Weihe Basin; Northwest University Press: Xi’an, China, 1992. [Google Scholar]
  5. Qu, W.; Lu, Z.; Zhang, Q.; Wang, Q.; Hao, M.; Zhu, W.; Qu, F. Crustal deformation and strain fields of the weihe basin and surrounding area of central china based on gps observations and kinematic models. J. Geodyn. 2018, 120, 1–10. [Google Scholar] [CrossRef]
  6. Rao, G.; Lin, A.; Yan, B.; Jia, D.; Wu, X. Tectonic activity and structural features of active intracontinental normal faults in the weihe graben, central China. Tectonophysics 2014, 636, 270–285. [Google Scholar] [CrossRef] [Green Version]
  7. Hu, Y.H.; Song, M.; Jia, S.; Zhi, Z.P. Present crustal motion inthree-dimensional orientations and fault activities in weihe basin. J. Geodesy Geodyn. 2018, 38, 1220–1226. [Google Scholar]
  8. Lin, A.; Rao, G.; Yan, B. Flexural fold structures and active faults in the northern–western weihe graben, central China. J. Asian Earth Sci. 2015, 114, 226–241. [Google Scholar] [CrossRef] [Green Version]
  9. Deng, Q.; Zhang, P.; Ran, Y.; Yang, X.; Min, W.; Chu, Q. Basic characteristics of active tectonics of China. Sci. China Ser. D-Earth Sci. 2003, 46, 356–372. [Google Scholar] [CrossRef]
  10. Cui, D.X.; Hao, M.; Li, Y.H.; Wang, W.P.; Qin, S.L.; Li, Z.J. Present-day crustal movement and strain of the surrounding area of ordos block derived from repeated gps observations. Chin. J. Geophys. 2016, 59, 3646–3661. [Google Scholar]
  11. Cui, D.; Hao, M.; Qin, S.; Wang, W. Inversion of fault dip-slip rate and locking depth in central-southern shaanxi of China. Chin. J. Geophys. 2019, 62, 4648–4657. [Google Scholar]
  12. Zhang, Q.; Qu, W.; Peng, J.; Wang, Q.; Li, Z. Research on tectonic causes of numerous ground fissures development mechanism and its unbalance distribution between eastern and western of weihe basin. Chin. J. Geophys. 2012, 55, 2589–2597. [Google Scholar]
  13. Hu, B.; Zhu, Y.; Tian, Q.; Cheng, H. Studyongravityfieldand itsdynamicevolutionalcharacteristicsintheguanzhongarea. Earthq. Res. China 2006, 22, 172. [Google Scholar]
  14. Chen, J.; Zhou, Y.; Chen, G.; Hao, M. Decades of ground deformation in the weihe graben, shaanxi province, china, in response to various land processes, observed by radar interferometry and levelling. Remote Sens. 2021, 13, 2374. [Google Scholar] [CrossRef]
  15. Bureau, S.P.S. Active Fault Celt in North Margin of the Qinling Mountains; Seismological Press: Beijing, China, 1996. [Google Scholar]
  16. Yang, P.; Ren, Z.; Zhang, J.; Xia, B.; Tian, T.; Cai, Z.; Zhang, Y. Discussion of the coupling relationships between the cenozoic sedimentary-tectonic migration of the weihe basin and the uplift of the weibei and east qinling areas. Chin. J. Geol. 2018, 53, 876–892. [Google Scholar]
  17. Rao, S.; Jiang, G.Z.; Gao, Y.J.; Hu, S.B.; Wang, J.Y. The thermal structure of the lithosphere and heat source mechanism of geothermal field in weihe basin. Chin. J. Geophys. 2016, 59, 2176–2190. [Google Scholar]
  18. He, H. Study on the Formation Mechanism of Ground Fissures in Weihe Basin. Ph.D. Thesis, Chang’an University, Xi’an, China, 2011. [Google Scholar]
  19. Hooper, A. A multi–Temporal insar method incorporating both persistent scatterer and small baseline approaches. Geophys. Res. Lett. 2008, 35, L16302. [Google Scholar] [CrossRef] [Green Version]
  20. Hooper, A.; Zebker, H.; Segall, P.; Kampes, B. A new method for measuring deformation on volcanoes and other natural terrains using insar persistent scatterers. Geophys. Res. Lett. 2004, 31, L23611. [Google Scholar] [CrossRef]
  21. Ferretti, A.; Prati, C.; Rocca, F. Permanent scatterers in sar interferometry. IEEE Trans. Geosci. Remote Sens. 2001, 39, 8–20. [Google Scholar] [CrossRef]
  22. Hooper, A.; Zebker, H.A. Phase unwrapping in three dimensions with application to insar time series. J. Opt. Soc. Am. A 2007, 24, 2737–2747. [Google Scholar] [CrossRef] [Green Version]
  23. Berardino, P.; Fornaro, G.; Lanari, R.; Sansosti, E. A new algorithm for surface deformation monitoring based on small baseline differential sar interferograms. IEEE Trans. Geosci. Remote Sens. 2002, 40, 2375–2383. [Google Scholar] [CrossRef] [Green Version]
  24. Bekaert, D.; Hooper, A.; Wright, T. A spatially variable power law tropospheric correction technique for insar data. J. Geophys. Res. Solid Earth 2015, 120, 1345–1356. [Google Scholar] [CrossRef]
  25. Yu, C.; Li, Z.; Penna, N.T.; Crippa, P. Generic atmospheric correction model for interferometric synthetic aperture radar observations. J. Geophys. Res. Solid Earth 2018, 123, 9202–9222. [Google Scholar] [CrossRef]
  26. Sandwell, D.T.; Price, E.J. Phase gradient approach to stacking interferograms. J. Geophys. Res. Solid Earth 1998, 103, 30183–30204. [Google Scholar] [CrossRef] [Green Version]
  27. Samsonov, S.; d’Oreye, N. Multidimensional time-series analysis of ground deformation from multiple insar data sets applied to virunga volcanic province. Geophys. J. Int. 2012, 191, 1095–1108. [Google Scholar]
  28. Samsonov, S.V.; Feng, W.; Peltier, A.; Geirsson, H.; d’Oreye, N.; Tiampo, K.F. Multidimensional small baseline subset (msbas) for volcano monitoring in two dimensions: Opportunities and challenges. Case study piton de la fournaise volcano. J. Volcanol. Geotherm. Res. 2017, 344, 121–138. [Google Scholar] [CrossRef]
  29. Massonnet, D.; Rossi, M.; Carmona, C.; Adragna, F.; Peltzer, G.; Feigl, K.; Rabaute, T. The displacement field of the landers earthquake mapped by radar interferometry. Nature 1993, 364, 138–142. [Google Scholar] [CrossRef]
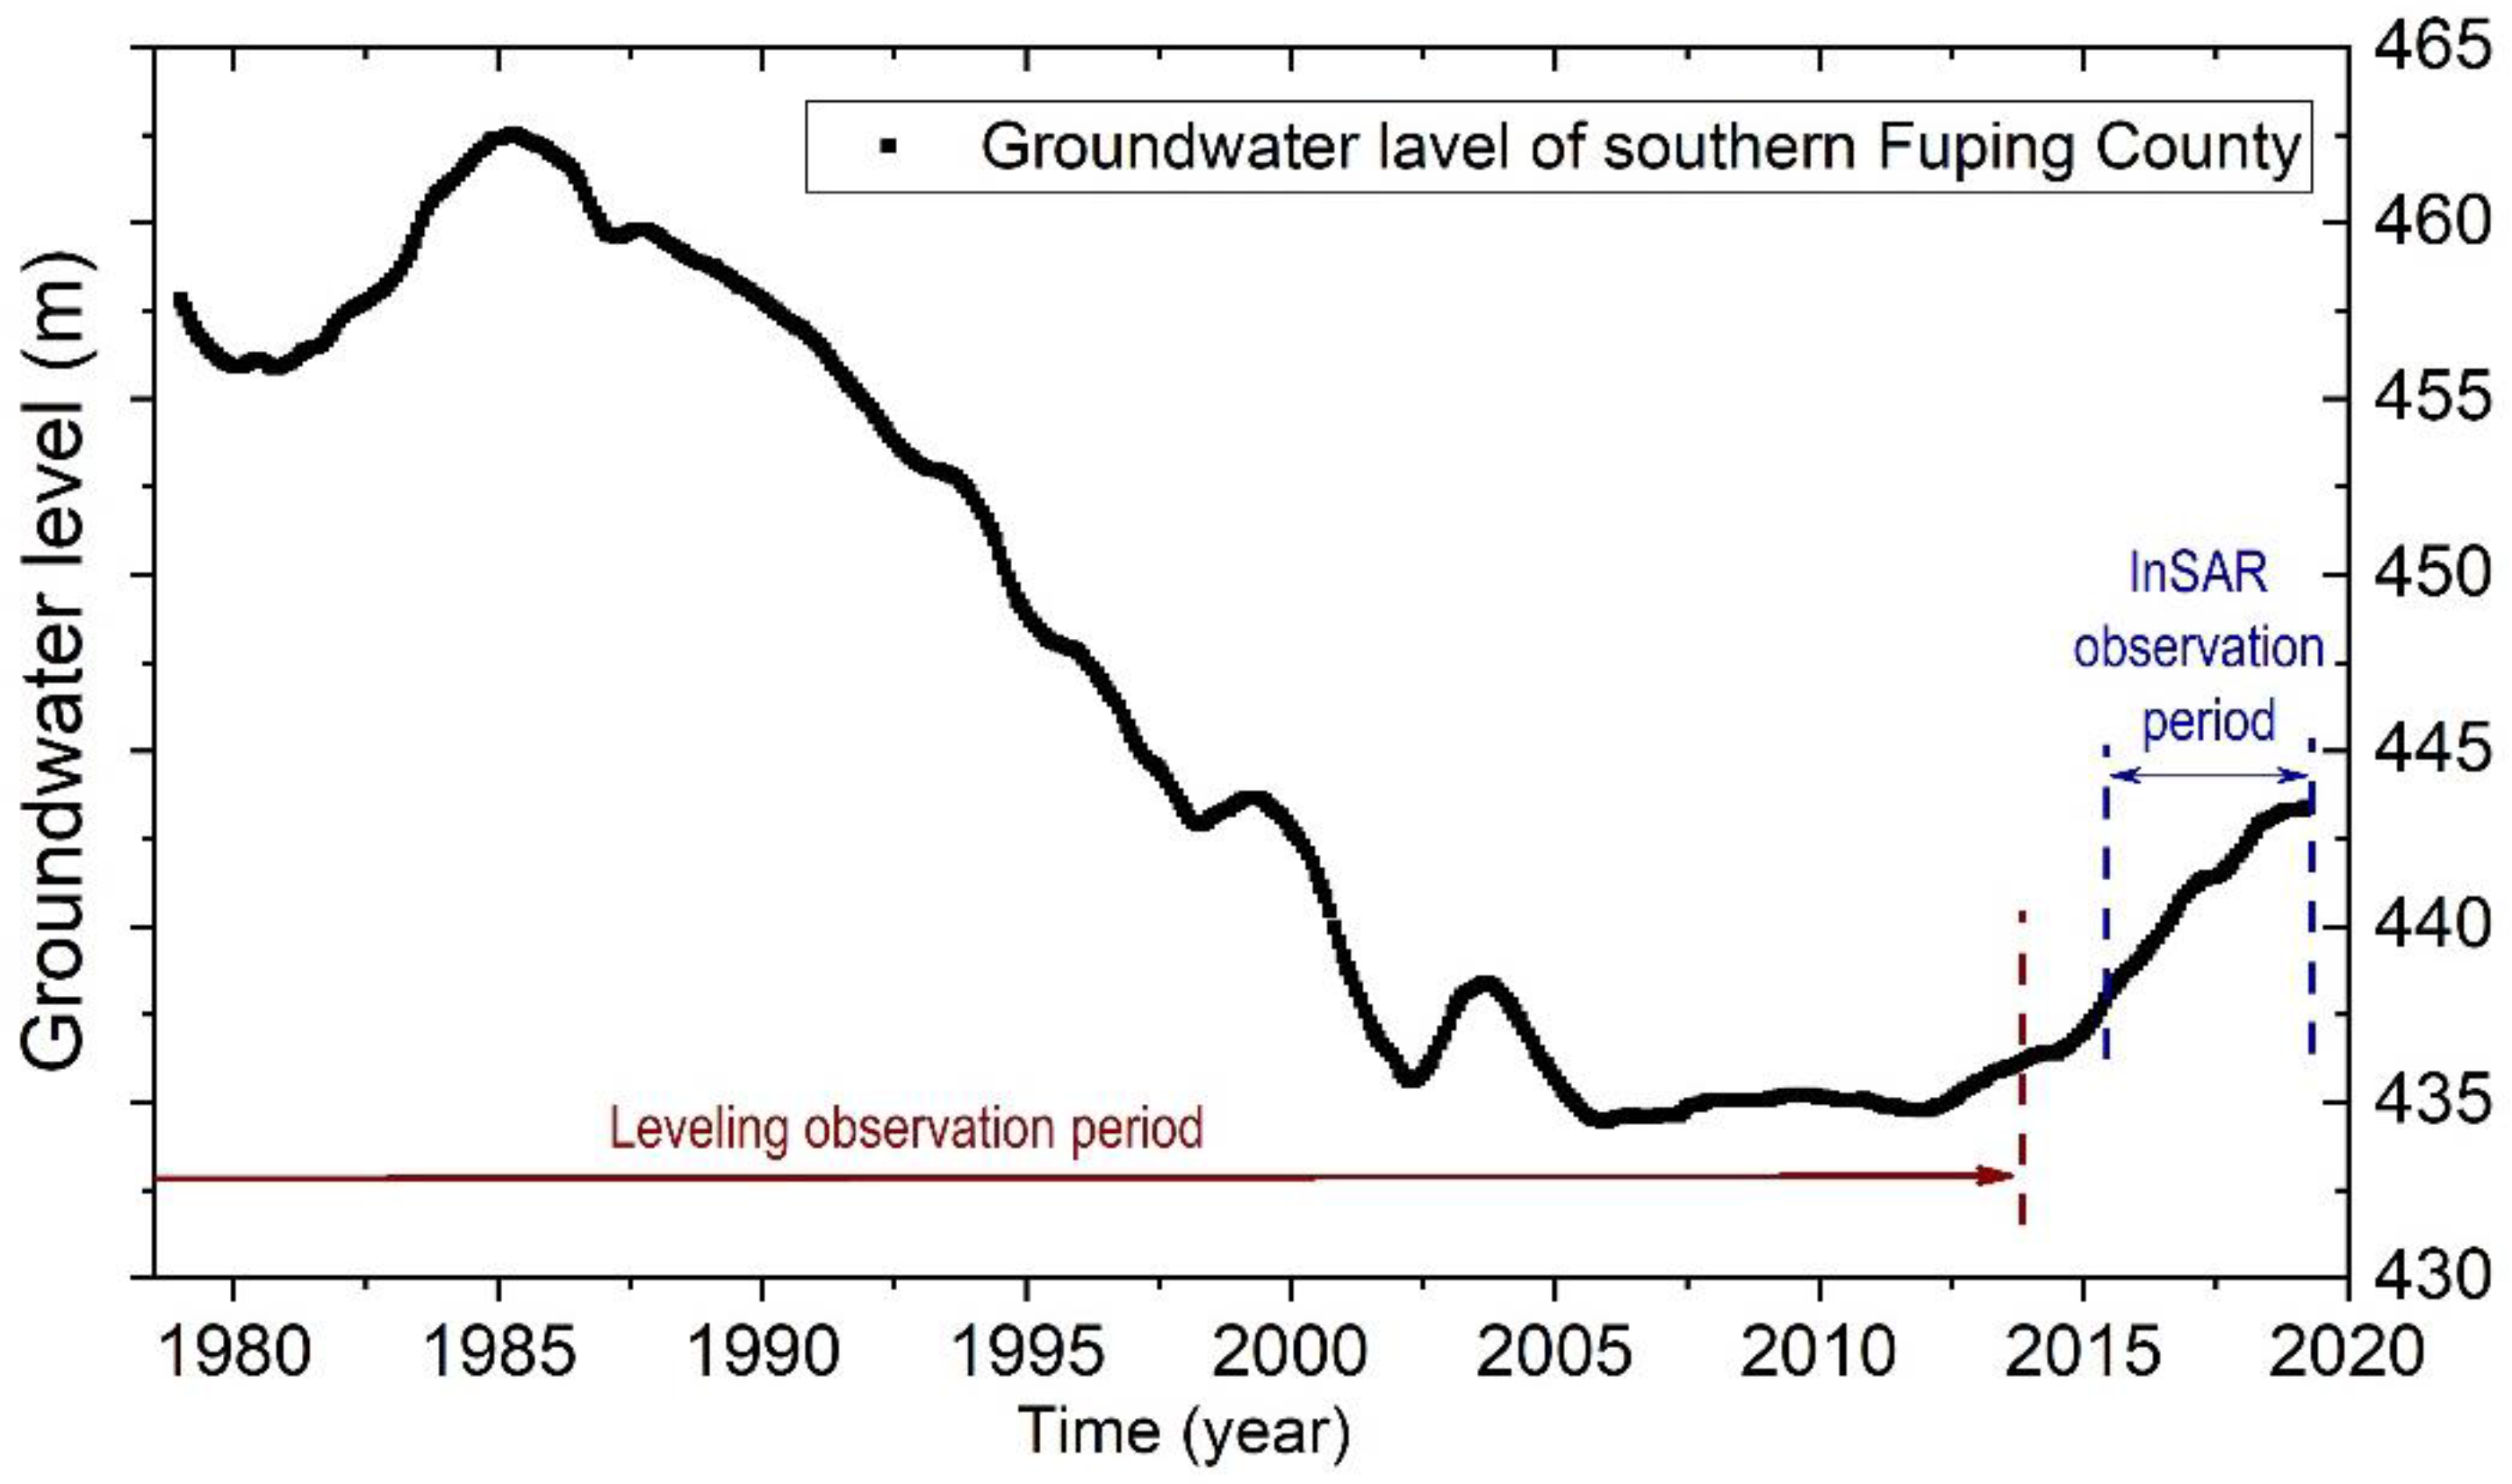
  30. Chai, J.; Cao, M.; Liu, S. Analysis on dynamic change of groundwater level in Fuping county. Ground Water 2021, 43, 3. [Google Scholar]
  31. Zhang, Q.; Zhao, C.Y.; Ding, X.; Chen, Y.Q.; Wang, L.; Huang, G.W.; Yang, C.S.; Ding, X.G.; Jing, M. Research on recent characteristics of spatio-temporal evolution and mechanism of xi’an land subsidence and ground fissure by using gps and insar techniques. Acta Geophys. Sin. 2009, 52, 1214–1222. [Google Scholar]
  32. Wang, Y.; Ye, S.; Yu, J.; Gong, X. Features and mechanisms of earth fissures induced groundwater withdrawal in China. Geol. J. China Univ. 2016, 22, 741. [Google Scholar]
  33. Wang, J.; Wang, J. Theory of Ground Fissures Hazards and Its Application; Shaanxi Science and Technology Press: Xi’an, China, 2000. [Google Scholar]
  34. Wright, T.J.; Parsons, B.; England, P.C.; Fielding, E.J. Insar observations of low slip rates on the major faults of western tibet. Science 2004, 305, 236–239. [Google Scholar] [CrossRef] [Green Version]
  35. Ding, X.L.; Li, Z.W.; Zhu, J.J.; Feng, G.C.; Long, J.P. Atmospheric effects on insar measurements and their mitigation. Sensors 2008, 8, 5426–5448. [Google Scholar] [CrossRef] [PubMed] [Green Version]
  36. Zhang, Y.Q.; Vergely, P.; Mercier, J. Active faulting in and along the qinling range (China) inferred from spot imagery analysis and extrusion tectonics of south china. Tectonophysics 1995, 243, 69–95. [Google Scholar] [CrossRef]
  37. Xu, W.; Yuan, B.; Yao, C. Geological significance and deep tectonic features of the yuxia-tieluzi fault zone and adjacent area based on comprehensive geophysical data. Prog. Geophys. 2021, 36, 977–992. [Google Scholar]
  38. Li, Y.; Wang, Q.; Cui, D.; Hao, M. Analysis on the faulting origin of kouzhen-guanshan fault in weihe basin. J. Geod. Geodyn. 2016, 36, 669–673. [Google Scholar]
  39. Yang, C.-Y.; Li, X.-N.; Feng, X.-J.; Zhu, L.; Li, M.; Zhang, E.-H. The late quaternary and present-day activities of the kouzhen-guanshan fault on the northern boundary of weihe graben basin, China. Seismol. Egology 2021, 43, 504–520. [Google Scholar]
  40. Shi, Y.Q.; Feng, X.J.; Dai, W.Q.; Ren, J.; Li, X.N.; Han, H.Y. Distribution and structural characteristics of the Xi’an section of the weihe fault. Acta Seismol. Sin. 2008, 21, 636–651. [Google Scholar] [CrossRef] [Green Version]
  41. Qu, F.; Zhang, Q.; Lu, Z.; Zhao, C.; Yang, C.; Zhang, J. Land subsidence and ground fissures in Xi’an, China 2005–2012 revealed by multi-band insar time-series analysis. Remote Sens. Environ. 2014, 155, 366–376. [Google Scholar] [CrossRef]
  42. Shi, Y.Q.; Feng, X.J.; Dai, W.Q.; Li, X.N.; Ren, J.; Chong, J. Geometric structure and formation mechanism of lintong-chang’an fault zone. Acta Seismol. Sin. 2008, 21, 156–169. [Google Scholar] [CrossRef]
  43. Xie, Z.; Yang, J.; Zheng, N. Characteristic of fault-block movement and seismicity in the weihe basin. Geol. ShaanXi 2010, 28, 59–65. [Google Scholar]
  44. Feng, X.J.; Dai, W.Q.; Dong, X.H. Quaternary activity of the weihe fault Obtained from the analysis of gushui trough profile in fufeng county, shaanxi province. Earthq. Res. China 2003, 19, 188–193. [Google Scholar]
  45. Wang, L.; Wang, R.; Roth, F.; Enescu, B.; Hainzl, S.; Ergintav, S. Afterslip and viscoelastic relaxation following the 1999 m 7.4 izmit earthquake from gps measurements. Geophys. J. Int. 2009, 178, 1220–1237. [Google Scholar] [CrossRef] [Green Version]
  46. Wang, R.; Parolai, S.; Ge, M.; Jin, M.; Walter, T.R.; Zschau, J. The 2011 m w 9.0 tohoku earthquake: Comparison of gps and strong-motion data. Bull. Seismol. Soc. Am. 2013, 103, 1336–1347. [Google Scholar] [CrossRef]
  47. Wang, R.; Schurr, B.; Milkereit, C.; Shao, Z.; Jin, M. An improved automatic scheme for empirical baseline correction of digital strong-motion records. Bull. Seismol. Soc. Am. 2011, 101, 2029–2044. [Google Scholar] [CrossRef]
  48. Dzurisin, D.; Lisowski, M.; Wicks, C.W. Continuing inflation at three sisters volcanic center, central oregon cascade range, USA, from gps, leveling, and insar observations. Bull. Volcanol. 2009, 71, 1091–1110. [Google Scholar] [CrossRef]
  49. Fialko, Y. Interseismic Strain Accumulation and the Earthquake Potential on the Southern san Andreas Fault System. Nature 2006, 441, 968–971. [Google Scholar] [CrossRef]
  50. Wright, T.; Parsons, B.; Fielding, E. Measurement of interseismic strain accumulation across the north anatolian fault by satellite radar interferometry. Geophys. Res. Lett. 2001, 28, 2117–2120. [Google Scholar] [CrossRef]
  51. Agency, S.E. The Northern Margin Fault Zone; Seismological Press: Beijing, China, 1996. [Google Scholar]
  52. Ma, R.; Hao, Q.; Li, P.; Shi, W.; Jiang, K.; Hong, L.; Guo, R. New Recognition on “Gaojiacun-Gaodian Fault” in Baoji Area of Shaanxi. J. Earth Sci. Environ. 2015, 37, 83–92. [Google Scholar]
  53. Ma, P.; Peng, J.; Li, T.; Wang, F.; Wang, Q.; Zhu, X. Forming mechanism and motion characteristics of the “3·8” jiangliu loess landslide in jingyang county of shanxi province. J. Eng. Geol. 2018, 26, 663–672. [Google Scholar]
  54. Xu, W.; Yang, Y.; Yuan, Z.; Liu, Z.; Gao, Z. Late quaternary faulted landforms and fault activity of the huashan piedmont fault. Seismol. Egology 2017, 39, 587. [Google Scholar]
Figure 2. Mean LOS deformation rate during 2015–2019 generated by (a) Sentinel-1A/B and (b) ALOS-2 ScanSAR. Faults (black lines) and main cities are superimposed.
Remotesensing 14 03182 g002
Figure 3. Two-dimensional deformation maps: (a) vertical deformation; (b) east–west deformation. Faults (black and white lines) and leveling routs (blue dots) are superimposed. The brown lines show the locations of cross-fault lines (brown lines), which are discussed in Figure 3, while the pink dashed rectangles represent locations where we conducted modeling work, as discussed in in Section 5.
Remotesensing 14 03182 g003
Figure 4. Histograms of the vertical deformation differences between the InSAR and leveling measurements: (a) ascending Sentinel-1A/B and descending ALOS-2; (b) Sentinel-1A/B and leveling data; (c) ALOS-2 and leveling data; and (d) MSBAS-derived vertical deformation and leveling data.
Remotesensing 14 03182 g004
Figure 5. (af) Average vertical deformations along six profiles, as shown in Figure 5. The gray dots show the InSAR vertical observations, and the squares display the leveling measurements. The vertical gray and red lines represent fault locations. The gray shadows show the corresponding surface heights.
Remotesensing 14 03182 g005
Figure 6. The average groundwater level in southern Fuping County (modified from Chai, 2021).
Remotesensing 14 03182 g006
Figure 7. (a) Conceptual diagram of fault geometry; (b) decomposed average vertical deformation from InSAR maps; and (c) modeled deformation for (b) from slip models shown in panels (eh). (d) Residual between (b,c). The black dashed lines show the fault traces. The pink circles are the locations of earthquakes that occurred during 2009–2021, and the graduated pink color displays the occurrence time of seismicity events.
Remotesensing 14 03182 g007
Table 1. Characteristics of the SAR data utilized in the Weihe Basin.
SAR SatelliteSentinel-1ALOS-2 ScanSAR
BandCL
PolarizationVVHH
Wavelength (cm)5.623.6
Path8436
Frame105–1102900
Heading (°)−10.1−167.3
Range of Incidence angle (°)29–4626–49
Number of used scenes926
Date range (yyyymmdd)20 June 2015–30 September 201913 April 2015–19 December 2018
Table 2. Observation times of the leveling routes.
RouteFaults CrossedObservation Time
CuifengQishan–Mazhao Fault1980, 1986, 2006, 2014
XianbaoWeihe Fault1980, 1986, 1996, 2014
LanxiWeihe Fault1973, 1977, 1980, 1985, 1986, 1994, 1996, 1998
BaobaoQinling Mountain Fault1972, 1980, 1996, 2006, 2009
ZhouchengQinling Mountain Fault1980, 1996, 2014
BengguangQinling Mountain Fault1987, 2006, 2014
FulanHuashan Mountain Fault1980, 1986, 1996, 2006, 2014
Table 3. The correlation between the InSAR observation and its associated predictions.
SchemeCorrelationRMS (mm/y)
One faultF20Model A-10.72811.7
F6Model A-20.80911.4
F10Model A-30.63881.9
Two faultsF6, F10Model B-10.87131.2
F6, F20Model B-20.86711.2
F10, F20Model B-30.82111.4
Three faultsF6, F10, F20Model C0.88951.1
Four faultsF6, F20, F10, F7Model D0.91711.0
Table 4. Comparison of the goodness-of-fit χ2 values and the calculated versus critical F-test values for fault models consisting of different numbers of fault segments. The calculated and critical F-test values were utilized to check if a model in a given row provides a better fit to the InSAR observation with 95% confidence than another model in a given column. Fcalculated > Fcritical indicates that the model in this row has a better fit than the model in this column, and the Fcalculated is displayed in square brackets in such cases.
Fault ModelDegrees of Freedomχ2 (misfit)F20F6F6, F20F6, F10
F202400.687
F62550.588
Fcalculated[42.654]
Fcritical1.669
F102700.770
Fcalculated−13.618
Fcritical1.462
F6, F204950.498
Fcalculated[5.286][2.670]
Fcritical1.1561.161
F6, F105250.492
Fcalculated[4.938][2.577][1.707]
Fcritical1.1481.1521.462
F10, F205100.571 N/A
Fcalculated[2.665]0.411
Fcritical1.1521.114
F6, F10, F207650.457
Fcalculated[3.156][1.851]1.105
Fcritical1.1131.1141.153
F6, F20, F10, F711400.399
Fcalculated[2.347][1.568][1.134][1.118]
Fcritical1.0921.0921.1051.107
Publisher’s Note: MDPI stays neutral with regard to jurisdictional claims in published maps and institutional affiliations.

