Article

Combined Radar Quality Index for Quantitative Precipitation Estimation of Heavy Rainfall Events

1
State Key Laboratory of Severe Weather, Chinese Academy of Meteorological Sciences, Beijing 100081, China
2
Meteorological Observation Centre, China Meteorological Administration, Beijing 100081, China
3
School of Atmospheric Sciences, Chengdu University of Information Technology, Chengdu 610225, China
4
Nation Meteorological Information Centre, China Meteorological Administration, Beijing 100081, China
5
Chongqing Meteorological Observatory, Chongqing 401147, China
*
Author to whom correspondence should be addressed.
Remote Sens. 2022, 14(13), 3154; https://doi.org/10.3390/rs14133154
Submission received: 10 June 2022 / Revised: 27 June 2022 / Accepted: 28 June 2022 / Published: 30 June 2022

Abstract

:
For quantitative precipitation estimation (QPE) based on polarimetric radar (PR) and rain gauges (RGs), the quality of the radar data is crucial for estimation accuracy. This paper proposes a combined radar quality index (CRQI) to represent the quality of the radar data used for QPE and an algorithm that uses CRQI to improve the QPE performance. Nine heavy rainfall events that occurred in Guangdong Province, China, were used to evaluate the QPE performance in five contrast tests. The QPE performance was evaluated in terms of the overall statistics, spatial distribution, near real-time statistics, and microphysics. CRQI was used to identify good-quality data pairs (i.e., PR-based QPE and RG observation) for correcting estimators (i.e., relationships between the rainfall rate and the PR parameters) in real-time. The PR-based QPE performance was improved because estimators were corrected according to variations in the drop size distribution, especially for data corresponding to 1.1 mm < average Dm < 1.4 mm, and 4 < average log10 Nw < 4.5. Some underestimations caused by the beam broadening effect, excessive beam height, and partial beam blockages, which could not be mitigated by traditional algorithms, were significantly mitigated by the proposed algorithm using CRQI. The proposed algorithm reduced the root mean square error by 17.5% for all heavy rainfall events, which included three precipitation types: convective precipitation (very heavy rainfall), squall line (huge raindrops), and stratocumulus precipitation (small but dense raindrops). Although the best QPE performance was observed for stratocumulus precipitation, the biggest improvement in performance with the proposed algorithm was observed for the squall line.

1. Introduction

Many quantitative precipitation estimation (QPE) products are widely available for applications in hydrology, nowcasting, and agriculture. Weather radar provides QPE with a higher spatial resolution over a wider area than rain gauges (RGs). However, weather radar-based QPE is subject to errors associated with an unrepresentative reflectivity–rainfall rate (ZR) relationship. Polarimetric radar (PR) is an upgrade over conventional weather radar and various PR parameters such as the horizontal reflectivity factor ZH, differential reflectivity factor ZDR, specific differential phase KDP, and correlation coefficient ρHV can be used for QPE. However, several sources of errors still affect the accuracy of PR-based QPE products [1,2,3,4], such as calibration biases, contamination by partial beam blockages, the bright band (BB), low signal-to-noise ratio (SNR), non-meteorological echoes, and beam broadening effect [4,5]. Meanwhile, RG offers a direct measurement of the precipitation and is more accurate than PR-based QPE for a specific location [6]. An interesting approach is to combine PR with a network of RG stations to improve the accuracy of QPE.
RG stations improve PR-based QPE in two ways. The first is by optimizing the estimators, which are relationships between the rainfall rate and the PR parameters ZH, ZDR, and KDP. Several studies have used RG stations to optimize the ZR relationship for weather radar in real-time [7,8]. QPE data and RG data are used to correct the coefficient “A” in the Z–R relationship in real-time. This method has been proven effective for QPE of stratiform precipitation, mei-yu precipitation, squall line, and typhoon precipitation [7,8,9]. Zhang [10] used a similar method to improve the performance of PR-based QPE by correcting the estimators according to variations in the drop size distribution (DSD). However, the above studies did not explicitly consider the quality of the radar data and its effect on the correction performance. The second is by merging radar-based QPE products and gauge-based observation data. Many studies have considered different methods for merging radar-based and gauge-based QPE products, such as mean field bias correction, spatially interpolated radar-gauge bias correction using inverse distance weighting-type functions, and geostatistical interpolation (e.g., kriging or optimal interpolation) [4,6,8,11,12,13,14,15,16,17,18,19,20,21]. The basic concept is to use RG data for the spatial correction of radar-based QPE. In general, a strong correlation between radar and RG data is a prerequisite for successful spatial correction [19]. Thus, radar data quality is important for merging QPE products. One study showed that including poor-quality radar data was worse for a high-resolution merging QPE product (<120 min) than when the poor-quality data were excluded [19]. The quality of the radar data affects the quality of the final QPE product. Thus, an index that quantifies the radar data quality may be helpful for combining PR and RG stations to obtain QPE products.
Many studies have developed indices that quantify the influence of various factors on radar data quality, such as the beam broadening effect, partial beam blockages, the BB, SNR, non-meteorological echoes, and attenuation of electromagnetic energy by hydrometeors [4,5,22,23,24]. Vulpiani et al. [23] developed the quality map Q to discriminate non-meteorological targets from weather returns. Similar quality indices have been used by a French radar mosaic system [12] to weight the best rainfall estimates and by an American radar mosaic system [24] to select good-quality ZH to mosaic. Zhang et al. [5] used quality indices to weight mosaic PR parameters and optimize the QPE products. They observed a good correlation between the QPE accuracy and quality indices, which was also supported by the results of Chen et al. [25] and Zhang et al. [26]. These results indicate that radar quality indices may be important for guiding the combination of PR and RG stations to obtain QPE products with high accuracy over a large scale.
In this study, QPE was performed by combining the data from RG and PR networks in Guangdong Province, China. The combined radar quality index (CRQI) is proposed to represent the radar quality, and an algorithm using CRQI is proposed to improve the QPE performance. Nine rainfall events were used to evaluate the performance of the proposed algorithm. The objective of this study was to demonstrate the potential and advantages of the proposed CRQI and algorithm. Section 2 describes the data and methodology used in this study and the details of the proposed algorithm. Section 3 presents the QPE performance of the proposed algorithm for the rainfall events in the study area. Section 4 discusses the QPE performance for the three precipitation types identified for the rainfall events, and Section 5 concludes the paper.

2. Materials and Methods

2.1. Polarimetric Radar Data and Quality Control

Some S-band single-polarization radar stations in Guangdong Province have been upgraded to PR since 2016. Table 1 presents the main specifications.
A series of tests was conducted to calibrate the transmitter and receiver of the S-band PR. The difference between the expected and measured values of the radar constant was calculated based on the radar transmit power and radar equation, and the difference was corrected in real-time to calibrate the transmitter. The receiver was calibrated by using a built-in test and the sun-calibration method. The test results indicated that ZH had an accuracy of less than 1 dB, which met the requirements for QPE. ZDR was also calibrated by the vertical pointed calibration method before radar operation.
Figure 1 shows the four PR stations used in this study, which are represented by black triangles: Heyuan, Guangzhou, Yangjiang, and Zhanjiang. From April to July 2019, nine rainfall events were observed by the four PR stations and the RG stations around them. Table 2 presents the details of these rainfall events. The rainfall events fell into three types of precipitation: convective, squall line, and stratocumulus. Each rainfall type had three rainfall events.
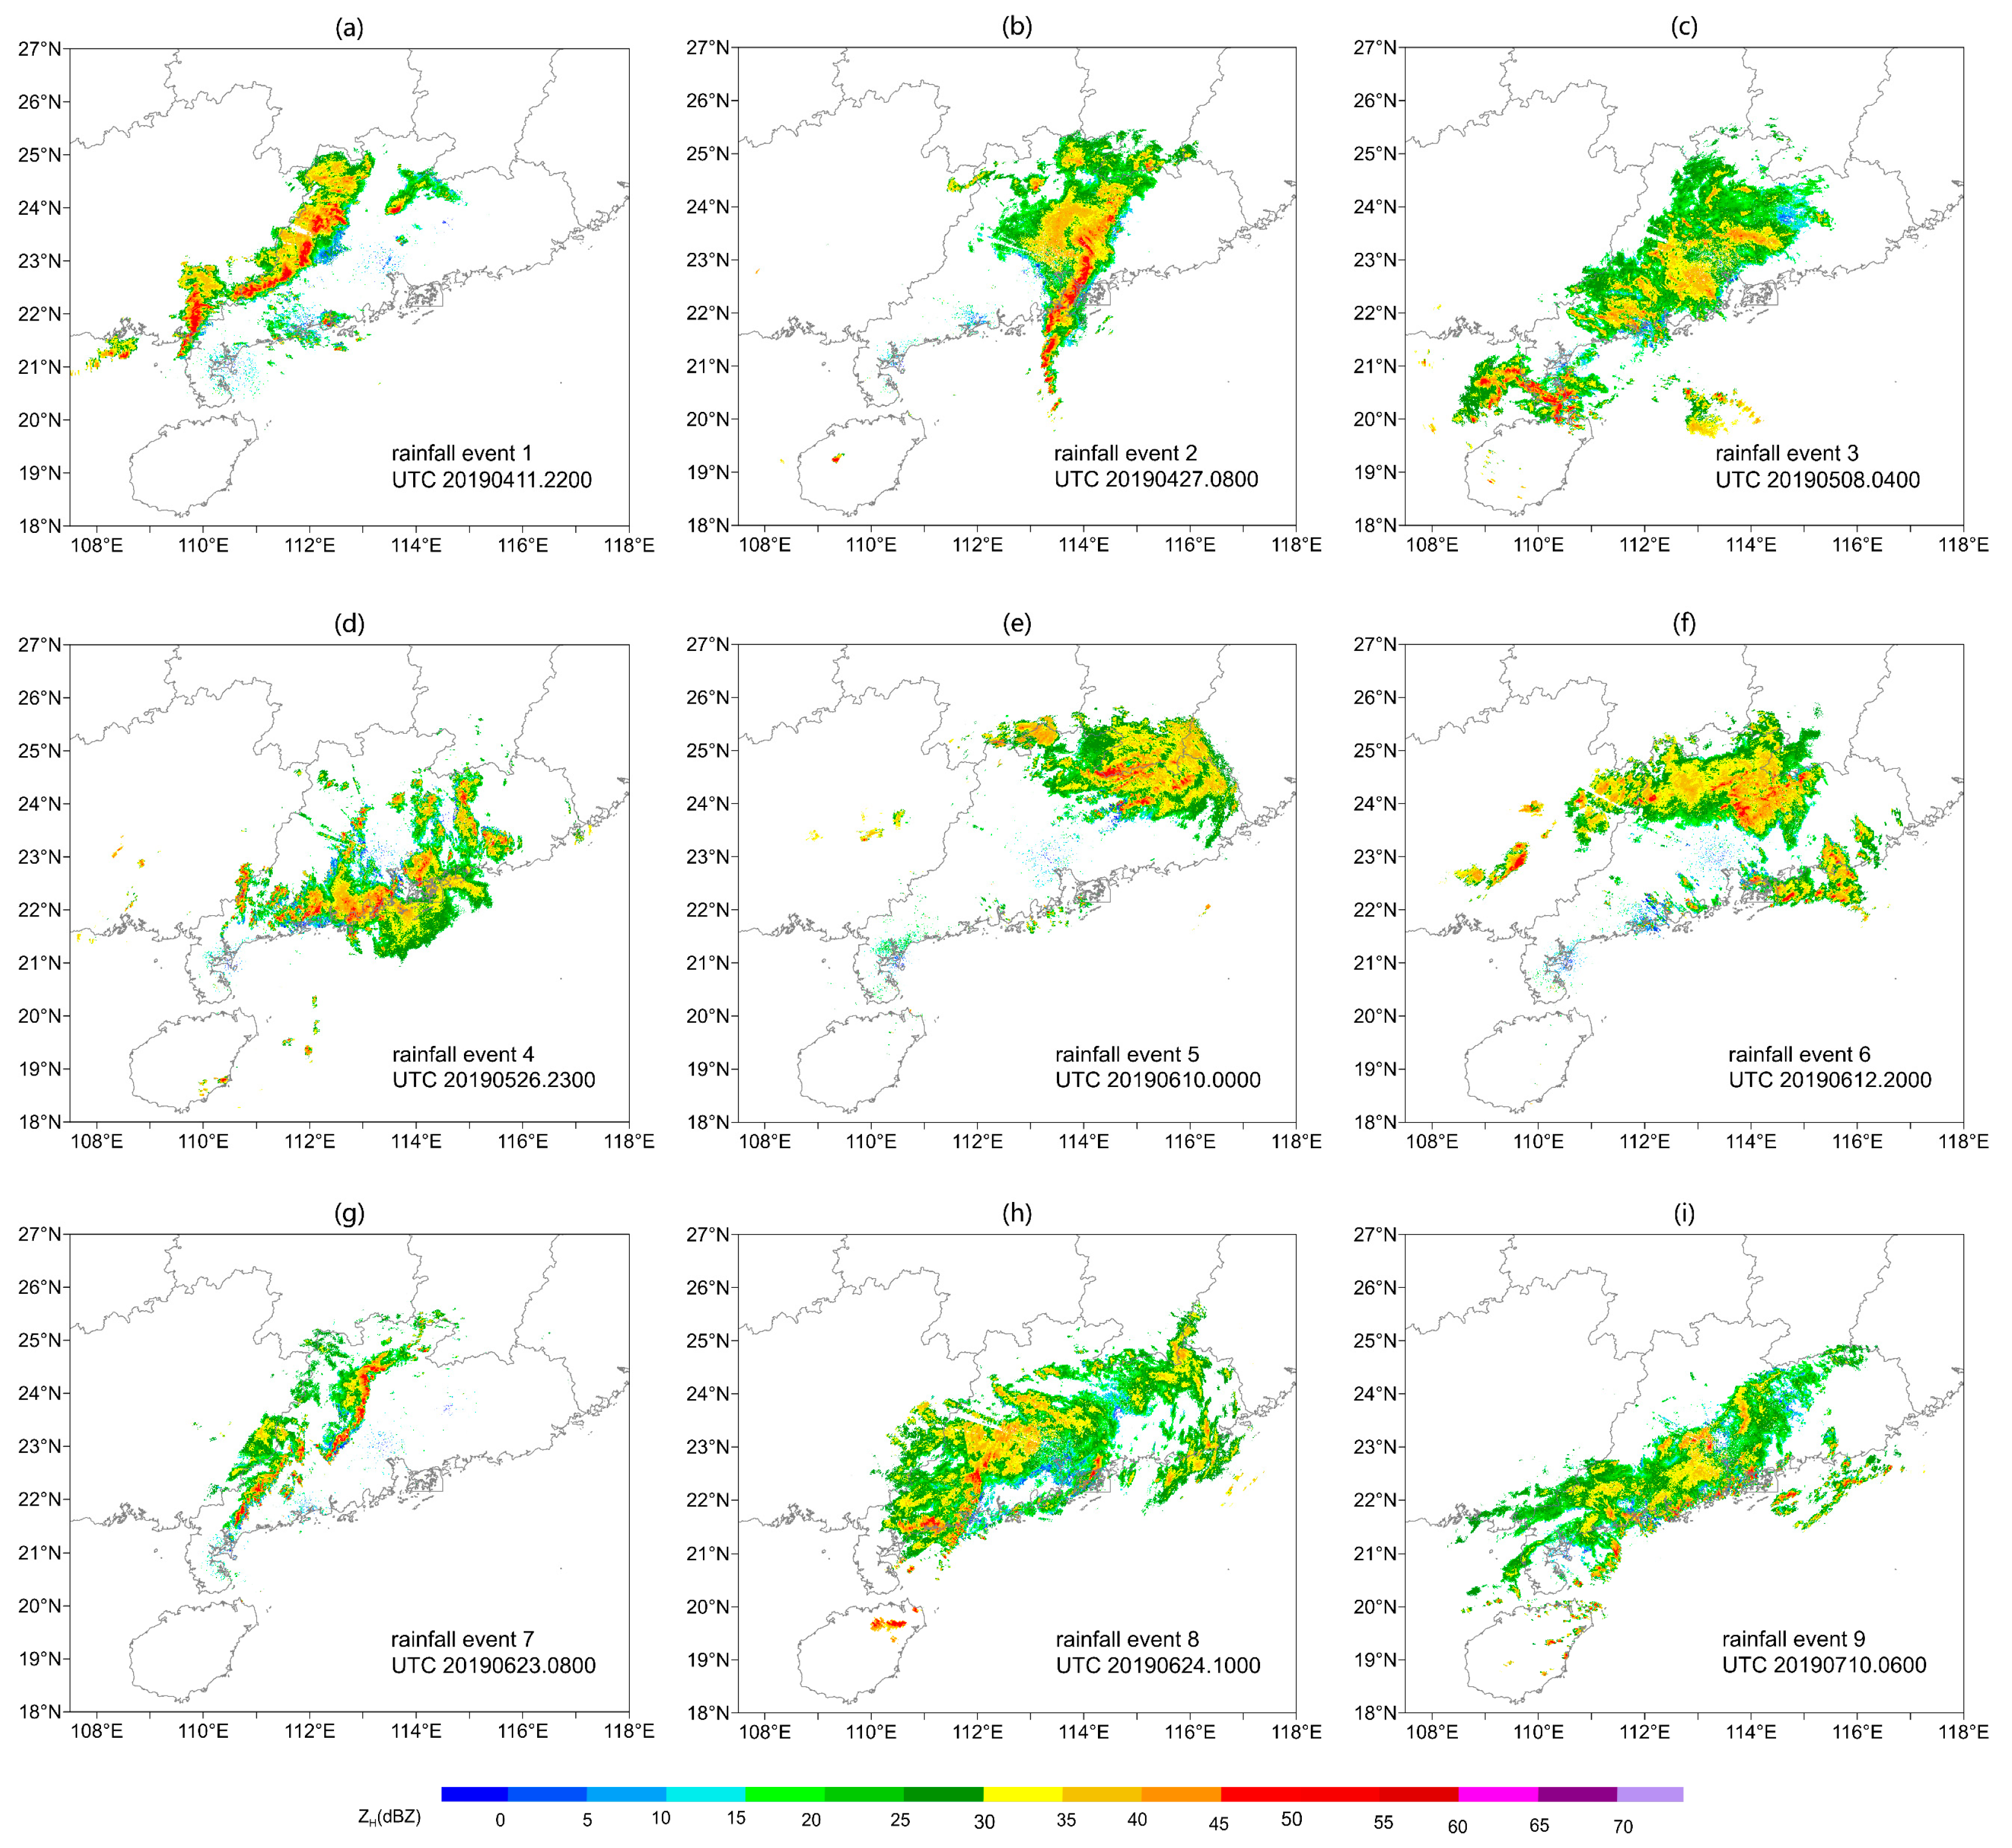
The PR data of the nine rainfall events are quality controlled and mosaiced by using the method of Zhang et al. [5]. The mosaic height is shown in Figure 1 with different colors. Typical mosaic echoes of the nine rainfall events are shown in Figure 2, which were used to identify the characteristics of three precipitation types. Rainfall events 1, 2, and 7 were squall line events based on their narrow and strong echoes. Rainfall events 4, 5, and 6 were convective precipitation. Note that, in this study, convective precipitation excluded squall line. Rainfall events 3, 8, and 9 were stratocumulus precipitation.

2.2. Rain Gauge Data and Quality Control

Figure 1b shows the 5348 RG stations used in this study, which were evenly divided into two groups (green and purple) according to their spatial distribution. The cross-validation method was used on the two groups of RG stations to evaluate the QPE results. RG data inevitably contain observation errors, so quality control was needed to eliminate unnecessary errors. This was performed by comparing the spatial consistency of the RG data, which generally should not differ very much among adjacent RG stations. Once the difference exceeds a certain range, the rainfall data of a given RG station should be considered abnormal, and the outlier needs to be removed. The spatial consistency was evaluated for each station. The calculated rainfall from the observations of surrounding stations was taken as the estimated rainfall at a target station. This was then compared with the observed rainfall at the target station [8,27,28,29,30,31]. The estimated rainfall at a target station can be calculated as follows [8,30,31]:
g A = i = 1 n g i w i i = 1 n w i
where gA (mm) is the estimated rainfall of the target station, and gi (mm) is the observed rainfall of the surrounding stations. wi is the weight applied to each of the surrounding stations and is linearly attenuated (i.e., the weight decreases with increasing distance from the target station)). n is the number of RG stations around the target station and was determined by counting the surrounding RG stations within a 13 km radius. The spatial consistency Δ was judged according to
Δ = | g A g o | σ
where g o (mm) was the observed rainfall of the target station and σ (mm) was the standard deviation of the observed rainfall from the 12 nearest RG stations. The threshold for judging spatial consistency is an empirical value, and it has been set to Δ = 3 in some studies [8,27,32]. This means that when Δ > 3, the observed rainfall of the target station is of poor quality and needs to be removed. Setting the threshold too low will remove normal data while setting the threshold too high will retain abnormal data. In this study, the threshold was set to Δ = 3.5 based on previous experience with the local data.
In addition, the following two parameters were added for quality control [8]:
r a t i o G = g A g o
d i f G = | g A g o |
where r a t i o G is the ratio of the estimated rainfall to the observed rainfall of the target station, and d i f G is the absolute deviation of the estimated rainfall from the observed rainfall at the target station. The observed rainfall was considered abnormal when r a t i o G > 4 and d i f G > 5 mm.

2.3. Polarimetric Radars and Rain Gauges Mosaic QPE Algorithm

2.3.1. Algorithm Introduction

Zhang et al. [5] proposed a radar quality index (RQI) to weight mosaic PR parameters and optimize the QPE performance. The results indicated a good correlation between the QPE accuracy and RQI. This implies that RQI can be used to guide the combination of PR and RG data for accurate and large-scale QPE. However, several PR parameters are used for QPE, and their contributions vary by the hour. In addition, the different PR parameters have different RQIs. To address these issues, the combined radar quality index (CRQI) was developed in the present study. CRQI represents the quality of PR-based QPE for a given hour as the weighted average of the individual RQIs:
CRQI = 1 10   ×   ( j 1 = 1 10 w j 1 RQI Z H   j 1 + j 2 = 1 10 w j 2 RQI Z DR   j 2 + j 3 = 1 10 w j 3 RQI K DP   j 3 )
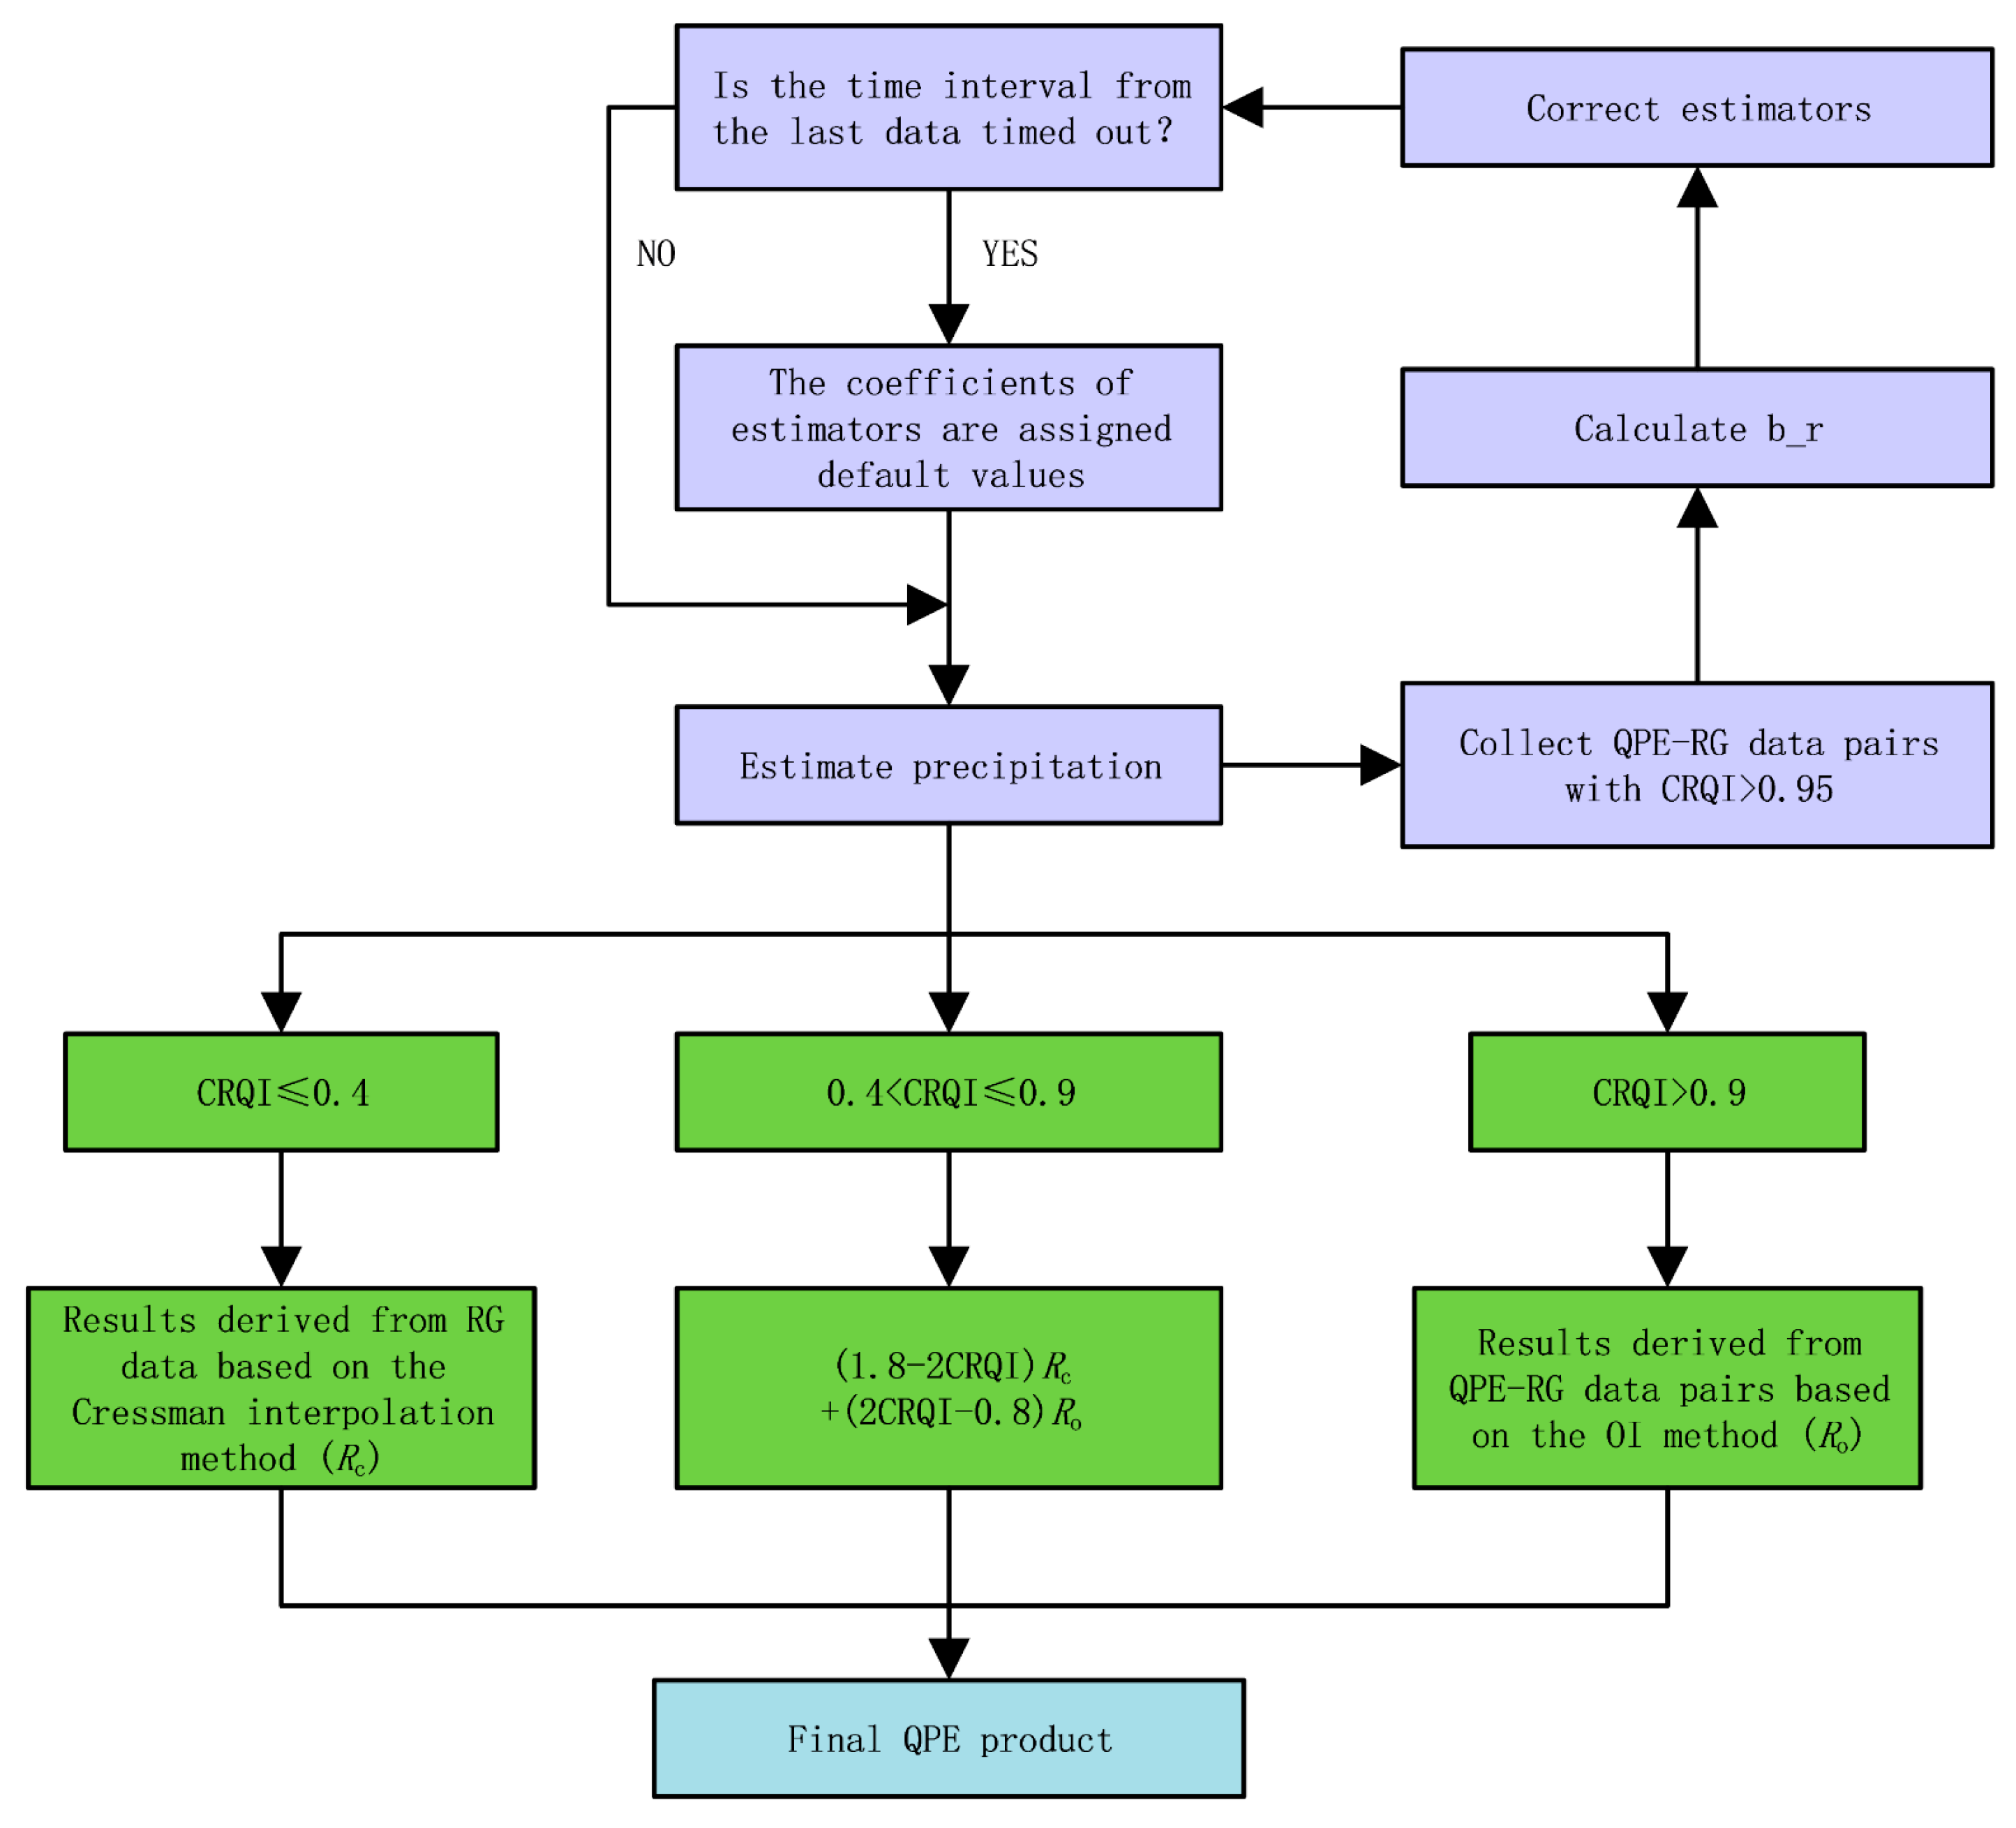
where j1, j2, and j3 represent the data series of ZH, ZDR, and KDP, respectively. RQI Z H   j 1 , RQI Z DR   j 2 , and RQI K DP   j 3 represent the RQIs of ZH, ZDR, and KDP, respectively. The weighting factors wj1, wj2, and wj3 represent the degrees to which ZH, ZDR, and KDP participate in QPE, respectively. For example, wj1, wj2, and wj3 are 1, 0, and 0, respectively, when R(ZH) is used and are 0, 0.5, and 0.5, respectively, when R(ZDR, KDP) is used. The sum of wj1, wj2, and wj3 is 1. CRQI plays a key role in the proposed algorithm. Figure 3 shows the flowchart of the proposed algorithm, which combines PR and RG data for QPE.
The purple blocks represent the process of using RG data to correct estimators in real-time. To avoid instability in the rainfall rate, the hourly accumulated precipitation is evaluated. The rainfall estimators are corrected hourly to improve the QPE accuracy. The bias ratio between QPE and the RG observation (b_r) is calculated first:
b _ r = i = 1 n R A i QPE i = 1 n R A i gauge
where RA is the accumulated rainfall from either QPE or RG observation. n is the number of R A i QPE R A i gauge pairs. The correction coefficients of rainfall estimators for rainfall rates in the ranges of 0–10, 10–20, 20–30, 30–40, 40–50, and 50–500 mm/h are obtained to optimize the next b_r, which means trying to make QPE equal to RG observation (b_r = 1). To achieve this goal, the multiplier coefficient for each rainfall estimator is corrected, and the index coefficients remain unchanged. The corrected multiplier coefficient is given by
a i = a 0 × j = 1 n ξ i   j
ξ i = 1 b _ r i   ( ξ i   min = 0.5 ,     ξ i   max = 1.5 )
where i represents the ith segment of rainfall rate corresponding to the above ranges. a0 is the default multiplier of the rainfall estimator, which is the initial value before correction. ξ i   j represents the correction coefficient after the jth evaluation, which is calculated by using the b_r for the ith segment. The minimum and maximum of ξ i   j are 0.5 and 1.5, respectively. This method was previously used by Zhang [10], but it does not limit the data pairs of PR-based QPE and RG observation used for correcting estimators. The proposed algorithm limits the correction for estimators to data pairs with CRQI > 0.95. This mitigates the negative influence of poor-quality data and allows the estimators to be corrected according to changes in DSD in real-time.
The green blocks represent the spatial correction process using RG data. The optimal interpolation (OI) method can achieve better correction results than PR-based QPE with good-quality radar data [20,21]. Therefore, the OI method is used when CRQI > 0.9. However, the OI method results in serious errors when the radar data has poor quality. Traditional correction methods take the radar-based QPE as the final result when the difference between the radar-based QPE and RG observation is too large. In contrast, the proposed algorithm detects poor-quality radar data when CRQI ≤ 0.4. In this case, the Cressman interpolation method is used to interpolate the RG data into the corresponding grids as the final result. When 0.4 < CRQI ≤ 0.9, CRQI is treated as a weighting factor to merge the above results:
R QPE - Gauge = ( 1.8 2 CRQI ) R c + ( 2 CRQI 0.8 ) R o
where Rc represents the interpolation of data from nearby RG stations using the Cressman interpolation method, Ro represents the result derived from PR-based QPE and data from nearby RG stations using the OI method, and RQPE-Gauge represents the merged data.

2.3.2. Contrast Tests

Several contrast tests were carried out to verify the effectiveness of the proposed algorithm. Table 3 presents the experimental details.
In test 1, only PR data were used for QPE. In tests 2 and 3, RG data were used to correct estimators in real-time. All data pairs (i.e., PR-based QPE and RG observation) were used in test 2, while only good-quality data pairs (CRQI > 0.95) were used in test 3. The effect of CRQI on correcting estimators was verified by comparing the results of tests 2 and 3. Tests 4 and 5 were based on test 3. In test 4, the spatial correction was implemented by using the traditional OI method. In test 5, the spatial correction was implemented by using the proposed algorithm. The effect of CRQI on spatial correction was verified by comparing the results of tests 4 and 5.

2.3.3. Evaluation Method for QPE Products

The rainfall rate estimated from the S-band PR at a temporal resolution of 6 min was used to calculate the hourly accumulated rainfall. The accumulated rainfall measured by the RG stations was taken as the true value. The average QPE of the nine grids nearest to an RG station was used to evaluate the QPE performance. The RG stations were divided into two groups for cross-validation. Since the minimum rainfall measurement of an RG station is 0.1 mm, only rainfall measurements that exceeded 0.1 mm were used for the evaluation. The QPE performance was evaluated according to the following statistical indicators: the correlation coefficient (CC), root mean square error (RMSE), normalized relative bias (NB), normalized absolute error (NE), and b_r (Equation (6)):
CC = i = 1 n ( R A i QPE R A i QPE ¯ ) ( R A i gauge R A i gauge ¯ ) i = 1 n ( R A i QPE R A i QPE ¯ ) 2 i = 1 n ( R A i gauge R A i gauge ¯ ) 2
RMSE = i = 1 n ( R A i QPE R A i gauge ) 2 n
NB = i = 1 n ( R A i QPE R A i gauge ) i = 1 n R A i gauge × 100
NE = i = 1 n | R A i QPE R A i gauge | i = 1 n R A i gauge × 100
where RA is the accumulated rainfall from either QPE or RG observation. An overbar represents a mean value. n is the number of R A i QPE R A i gauge pairs. RMSE is in millimeters, and NE and NB are both percentages. A smaller RMSE or NE indicates a better QPE performance. RMSE is influenced by the rainfall rate, while NE is not. NB values of greater than and less than zero indicate overestimation and underestimation, respectively. Similarly, b_rs greater than and less than one indicate overestimation and underestimation, respectively. The b_r was mainly used to analyze the spatial distribution of biases.

3. Results

3.1. Spatial Distribution of B_rs

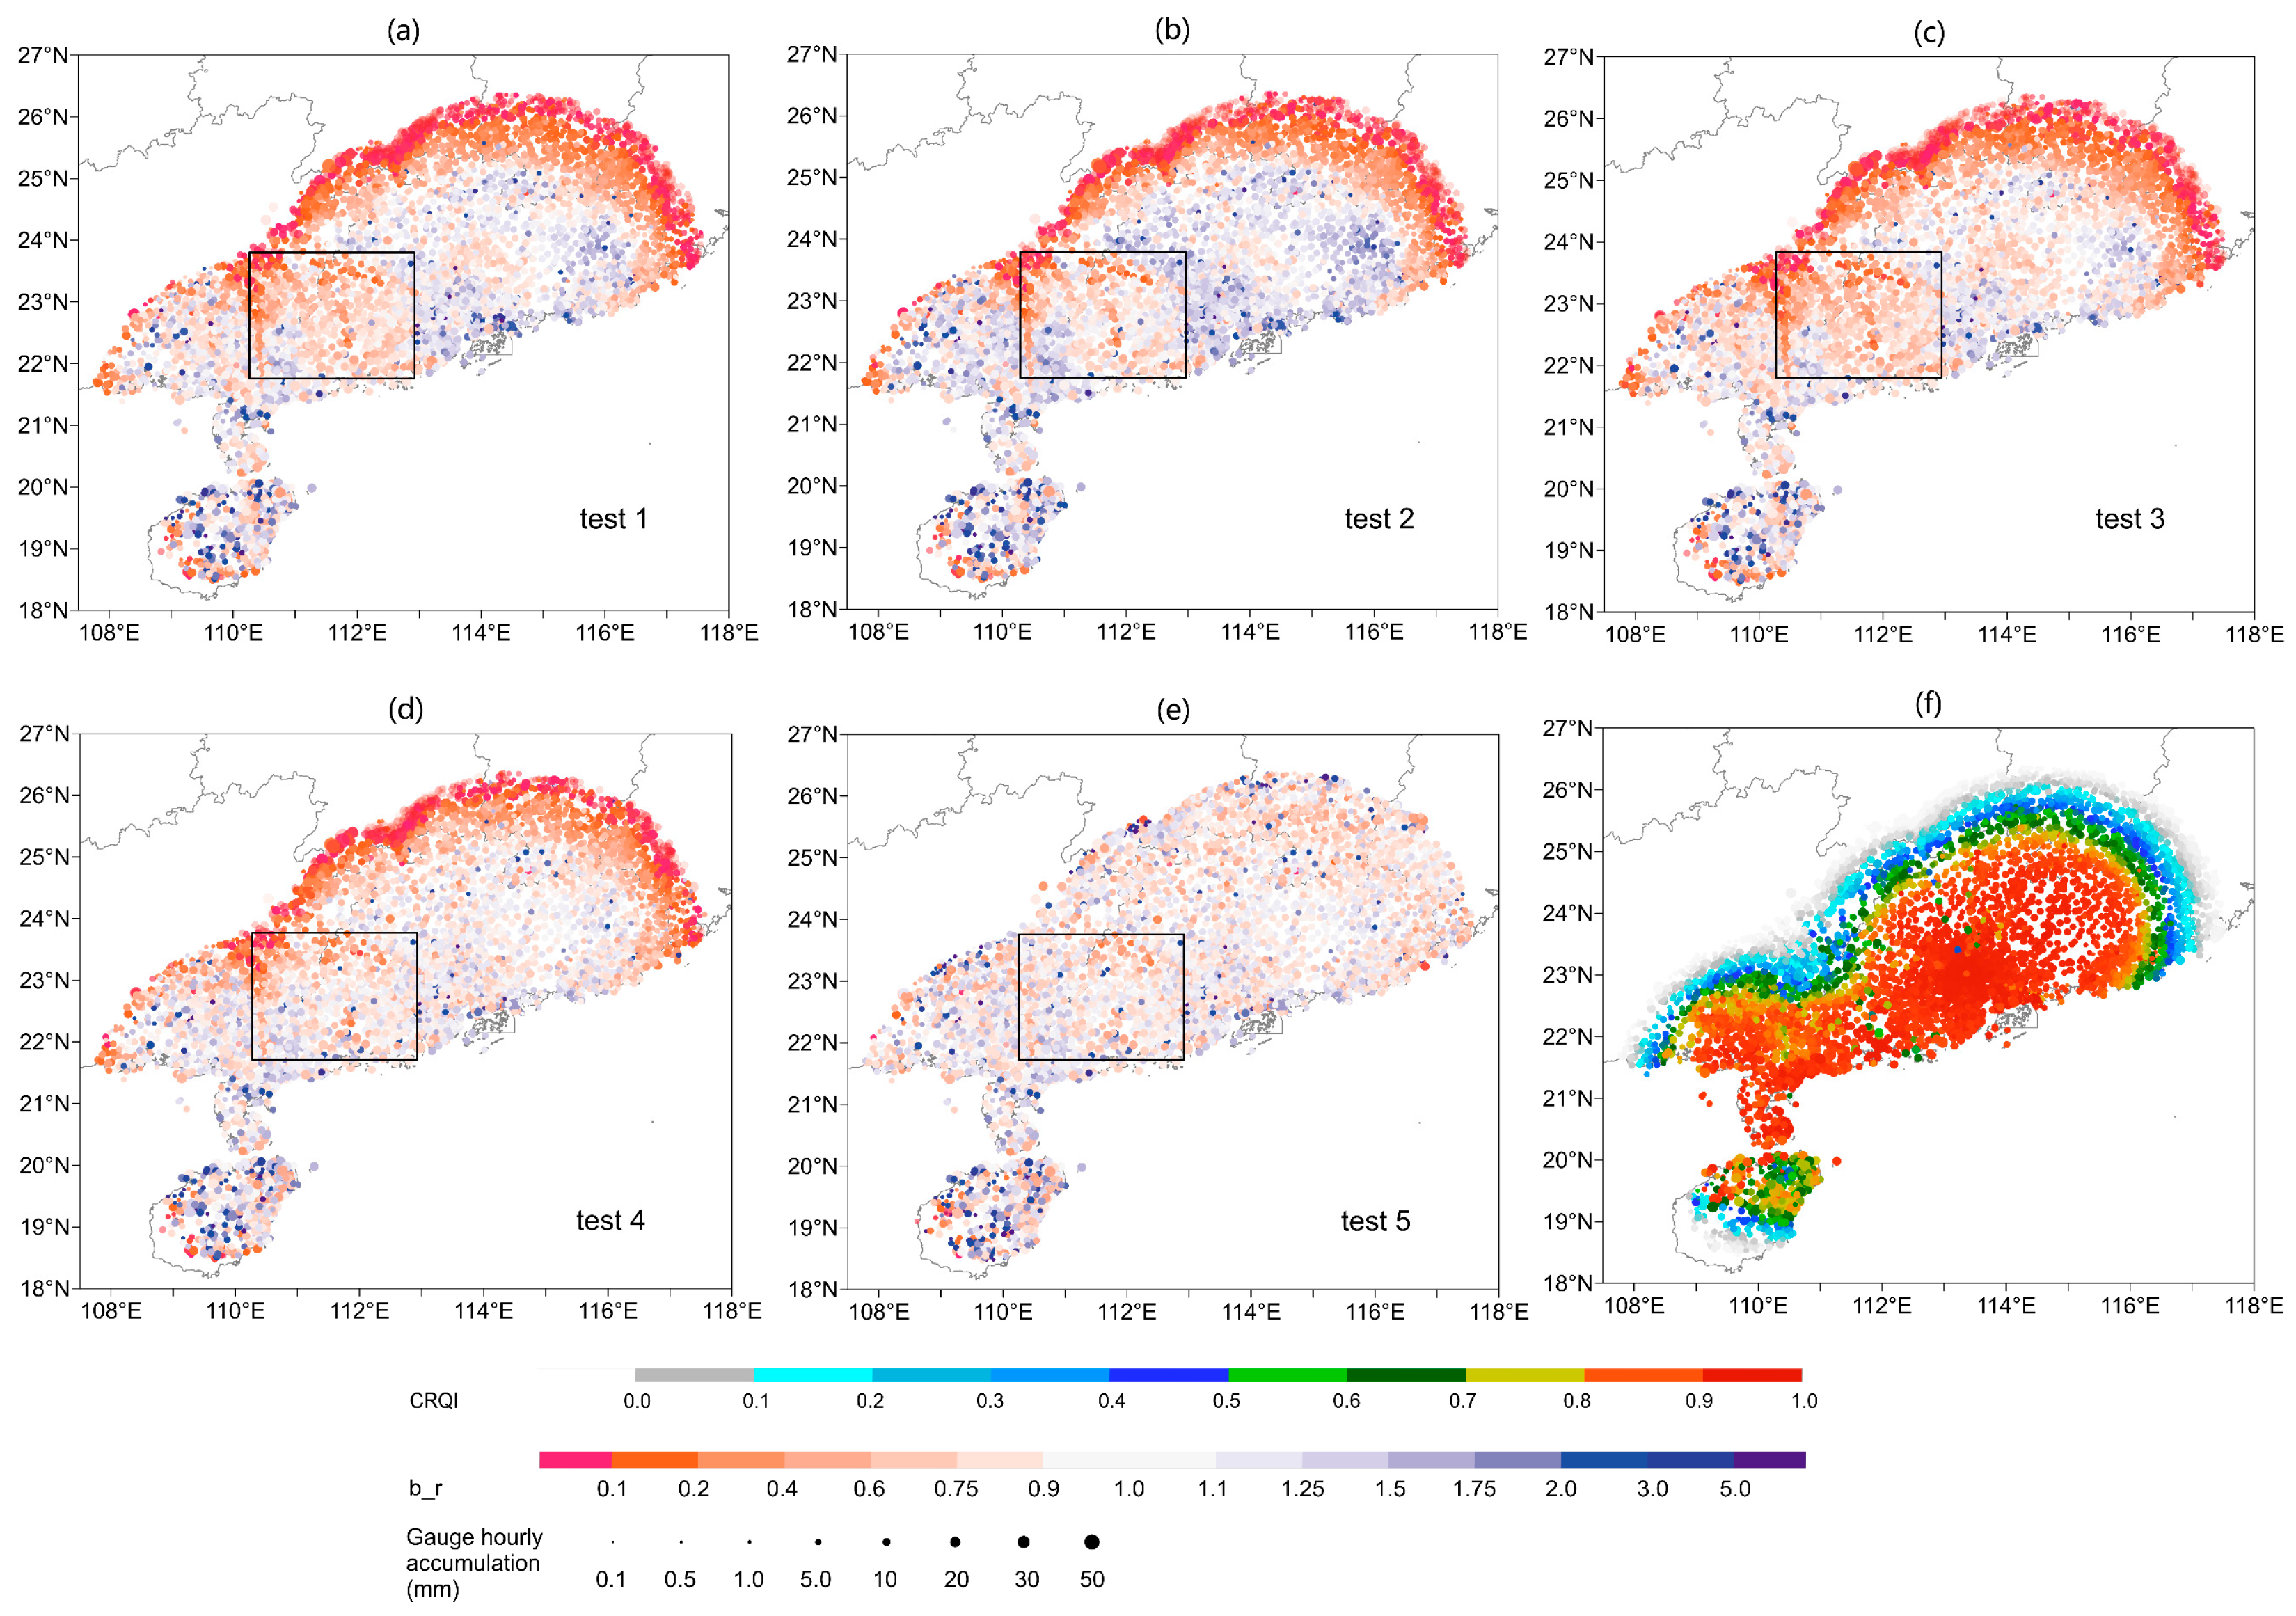
The data from all rainfall events were used to evaluate the QPE performance. The b_r was calculated for each RG station, and Figure 4a–e show the spatial distributions of the b_rs in each test. Figure 4f shows the spatial distribution of the average CRQI values at each RG station.
A good correlation was observed between the PR-based QPE accuracy and the average CRQI value. To quantify the correlation between the QPE accuracy and CRQI in test 1, a new b_r was calculated based on the work of Zhang et al. [5]:
new   b _ r = { b _ r                   b _ r   1   1 b _ r                   b _ r > 1
The value of new b_r can represent the QPE accuracy. A greater new b_r indicates a better QPE performance. The CC between the new b_r and average CRQI value was 0.73, which confirmed the good correlation between the PR-based QPE accuracy and CRQI. The correlation can be attributed to CRQI modeling the uncertainties of QPE due to radar data contamination by partial beam blockages, the BB, low SNR, non-meteorological echoes, and beam broadening effect.
Figure 4a shows the spatial distribution of b_rs derived from PR-based QPE. Underestimation was observed in areas far from PR stations because of the beam broadening effect and excessive beam height, which may lead the beam to overshoot the top of the echo or only observe a weak echo. The area marked by a rectangle indicates where underestimation was observed due to partial beam blockages. In addition, overestimation was observed near coastal cities, which may have been caused by ground clutter contamination near PR stations. Figure 4b shows that the overestimation areas expanded in test 2 compared with the areas in test 1. This suggests that using all data pairs to correct estimators was ineffective because the inclusion of poor-quality data pairs led to incorrect corrections. In contrast, the coefficients of estimators are effectively corrected by using good quality data pairs. The estimators changed with the DSD, so overestimation was mitigated in test 3 (Figure 4c). Figure 4d shows that using the OI method in test 4 resulted in no obvious overestimation or underestimation in areas with CRQI > 0.9. Figure 4e shows that the correct estimation was expanded to the entire study area in test 5 with the proposed algorithm. The proposed algorithm not only mitigated underestimation caused by the beam broadening effect and excessive beam height but also mitigated underestimation caused by partial beam blockages. This is a significant advantage over the traditional method.

3.2. Evaluated Statistical Scores

Figure 4 indicates obvious biases in areas with low CRQI values for tests 1–4. Using QPE products from these areas to calculate statistical scores would increase the bias significantly, which would mask the improvement in the QPE performance due to the correction methods considered in tests 2–4. Therefore, only QPE products corresponding to CRQI > 0.9 were used to compare the results of tests 1–4. Table 4 presents the statistical scores.
The QPE performance was worse in test 2 than in test 1, as indicated by the greater NB, NE, and RMSE. In contrast, the QPE performance was slightly better in test 3 than in test 1, as indicated by the smaller NE and RMSE. Using all data pairs to correct estimators did not result in better estimates because the poor-quality data pairs interfered with the correction results. The compared results indicate only good-quality data pairs are used to correct estimators; the estimators can become closer to “true estimators” and reflect the changes in the DSD. However, the QPE improvement in test 3 was not as obvious as expected. It may be because this correction method was not effective for all precipitation types; this will be discussed in Section 3.6. The QPE accuracy was further improved after the spatial correction was implemented. Thus, the QPE performance was better in test 4 than in test 3, as indicated by the larger CC and smaller NE and RMSE. The RMSE in test 4 decreased by 7.34% compared with test 1.
The proposed algorithm significantly mitigated underestimation in areas where CRQI < 0.9, as shown in Figure 4d,e. When the entire study area was evaluated (CRQI > 0.0), QPE showed obvious underestimation in test 4 in terms of NB. In contrast, NB was close to zero in test 5. In addition, the RMSE in test 5 decreased by 17.5% and 13.16% compared with tests 1 and 4, respectively. These results confirm that the proposed algorithm greatly improved the QPE performance.

3.3. Evaluation Results over Time

To evaluate the real-time QPE performance, the NE values for the nine rainfall events were obtained in near real-time. Similar to the evaluation described in Section 3.2, only the QPE corresponding to CRQI > 0.9 was evaluated to compare the results of tests 1–4, as shown in Figure 5.
For rainfall events 1, 2, and 5, the QPE performance was better in tests 2 and 3 than in test 1 for some time. This indicates that the correction for estimators improved the QPE performance regardless of the data quality for this time. For the other rainfall events, NE in test 3 was slightly less or comparable to that in test 1. In contrast, for rainfall events 3, 5, 6, 8, and 9, NE was generally larger in test 2 than in test 1 most of the time. This indicates that using all data pairs to correct estimators cannot improve QPE all the time. In fact, this approach often increases biases because of the interference from poor-quality data pairs. These results illustrate the necessity of using good-quality data pairs to correct estimators.
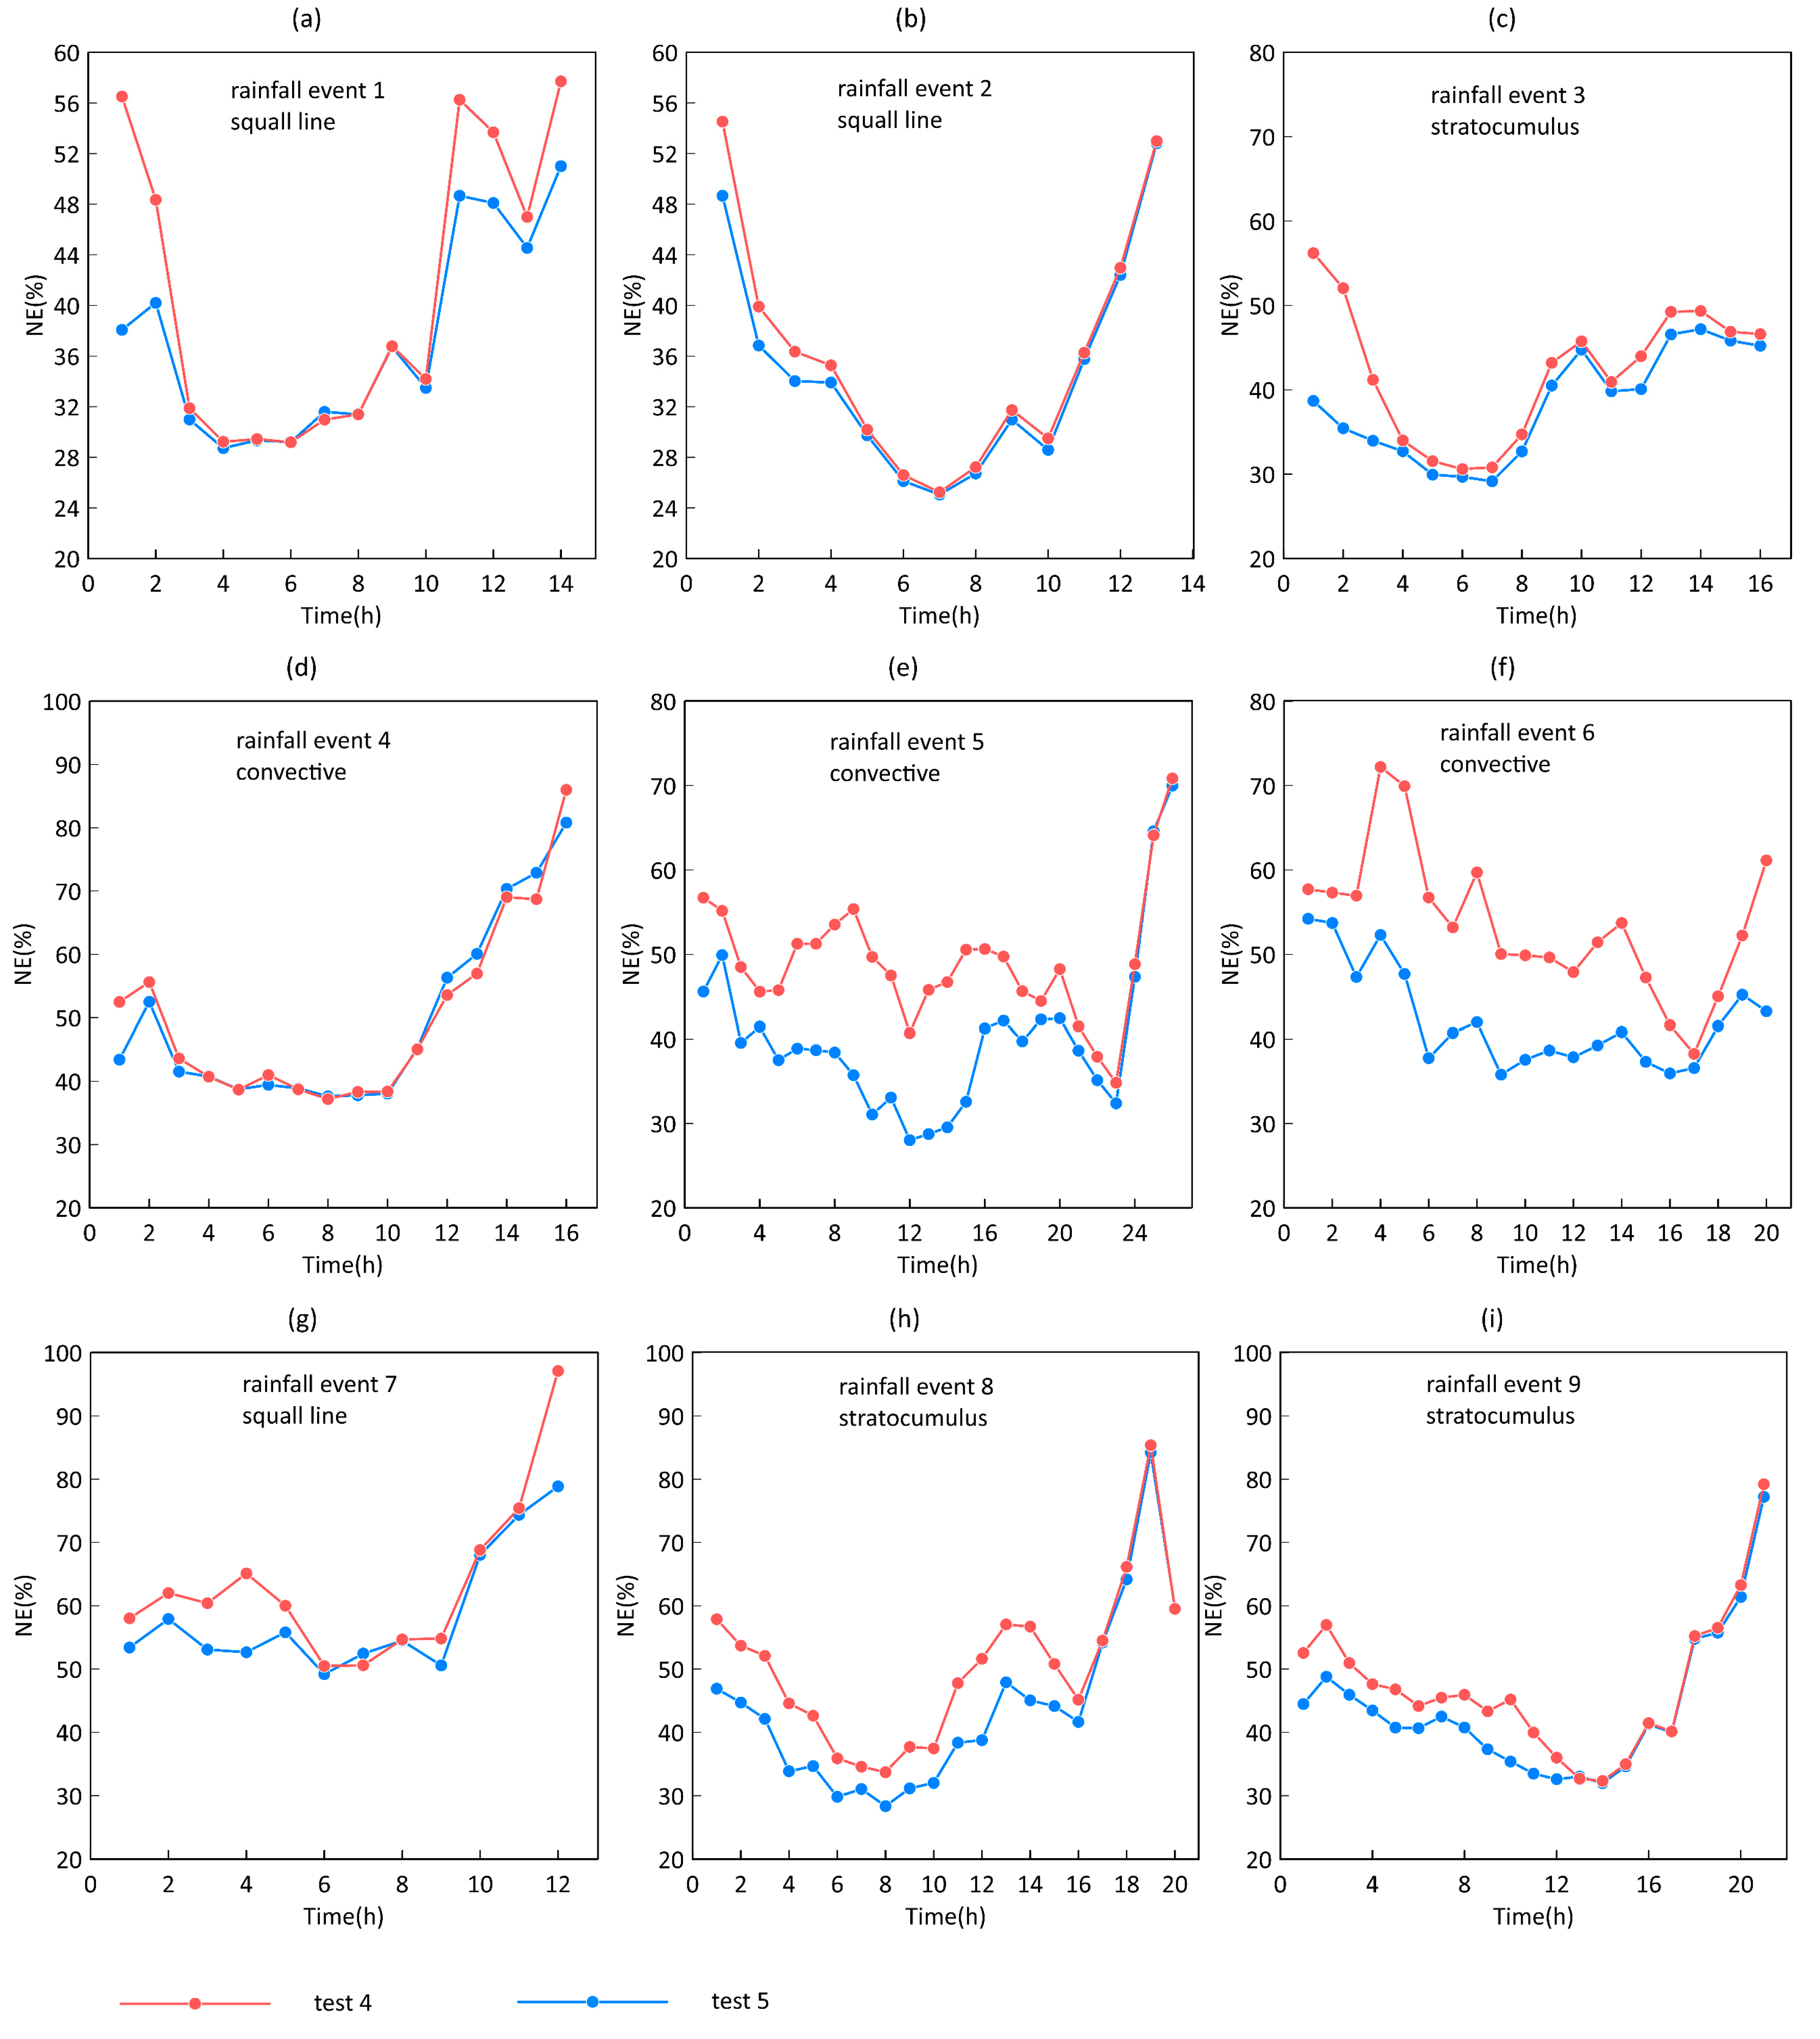
The NE values for tests 4 and 3 show that spatial correction improved the QPE performance for all rainfall events. The QPE performance was best in test 4 among tests 1–4, although this evaluation only considered QPE corresponding to CRQI > 0.9. To compare tests 4 and 5, QPE corresponding to CRQI > 0.0 was evaluated, as shown in Figure 6. The QPE performance was better in test 5 than in test 4 for all rainfall events, as indicated by the smaller NE values. These results demonstrate the advantage of the proposed algorithm for real-time QPE.

3.4. Biases Analysis Based on Microphysical Parameters

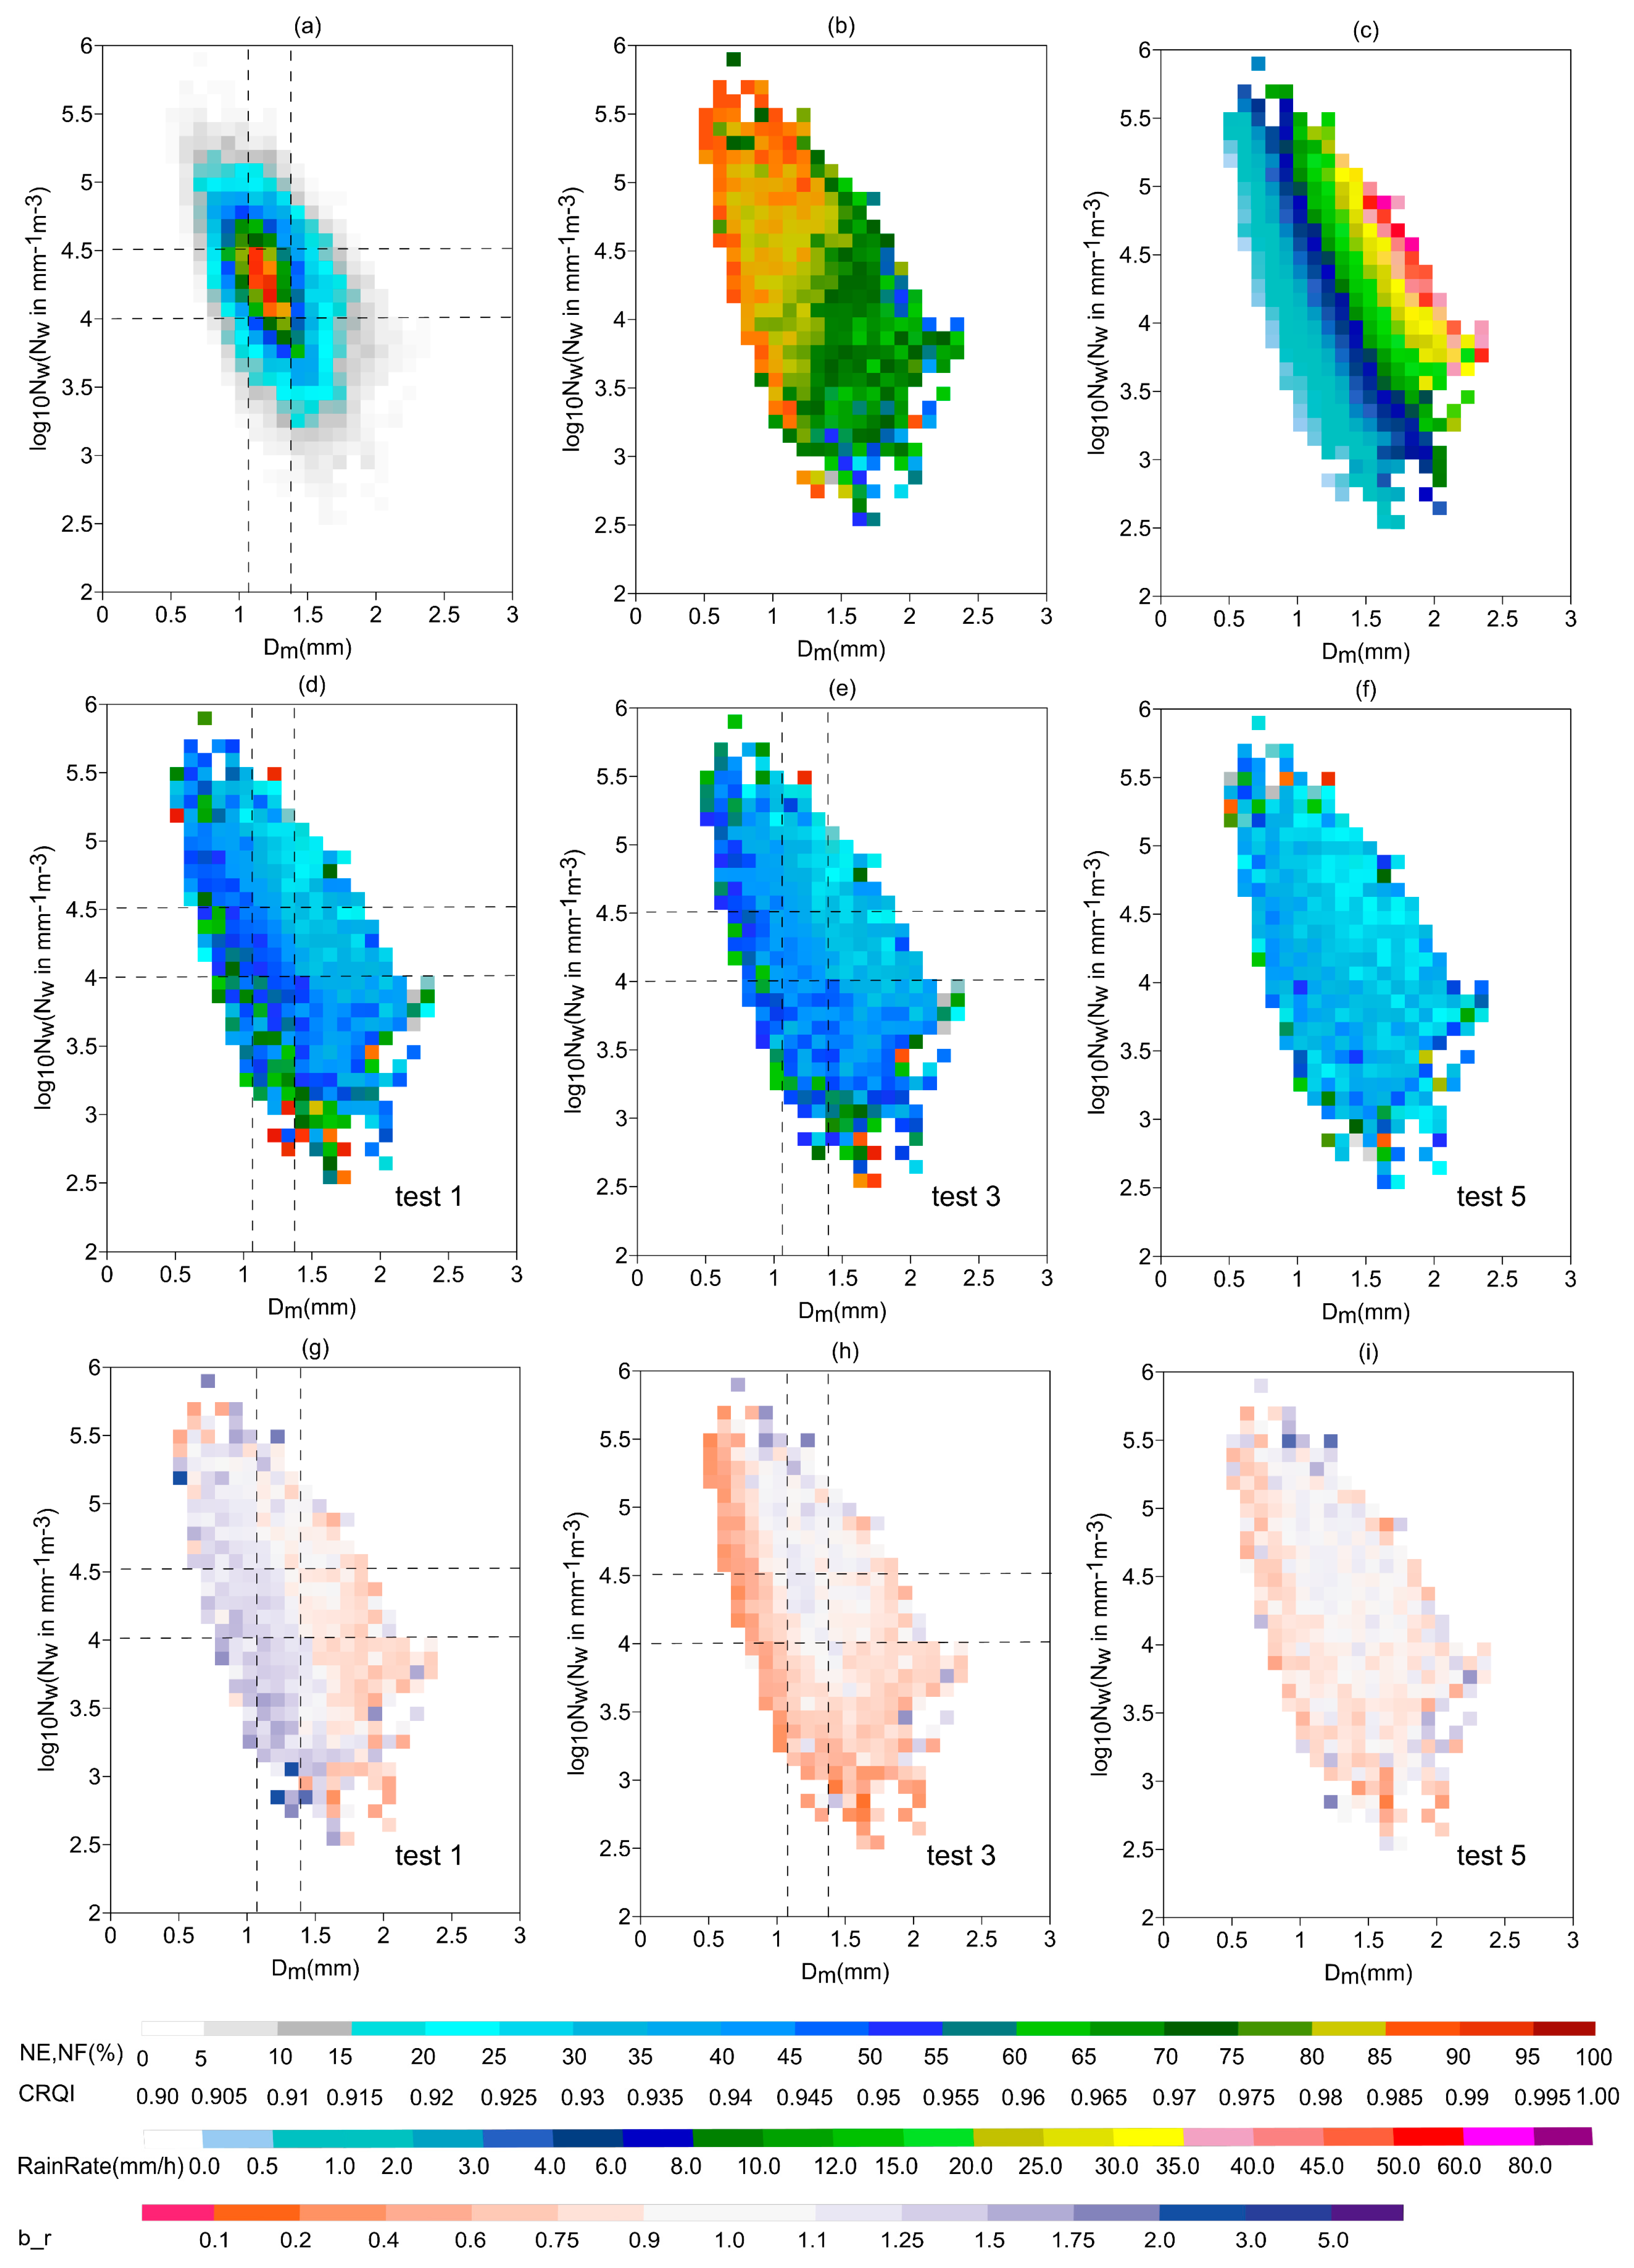
To analyze the QPE performance of the proposed algorithm in terms of microphysics, Dm and Nw were calculated from ZH and ZDR for all rainfall events based on the method of Zhang et al. [33]. When all the ZH and ZDR data in an hour were available with CRQI > 0.9, the average Dm and Nw in this hour were calculated to guarantee the credibility of the results. Figure 7 shows the normalized occurrence frequency (NF), CRQI, hourly accumulated precipitation, NE, and b_r for the QPE in tests 1, 3, and 5.
A certain correlation was observed between CRQI and the diameter of the precipitation particles when CRQI > 0.9. Larger particles generally corresponded to a lower CRQI and worse radar data quality. CRQI was very low for large particles with a low number concentration. This indicates that radar observations of precipitation particles with sparse but large diameters are not very accurate. Thus, the QPE performance was inadequate for these particles. Although CRQI generally showed a positive correlation with the QPE performance, this positive correlation was not obvious when CRQI > 0.9. This is because CRQI was designed without considering the effect of the DSD on PR-based QPE quality. DSD became the main factor influencing the QPE performance when CRQI > 0.9. The PR-based QPE performance and hourly accumulated precipitation also showed a certain amount of correlation: heavy rain was underestimated, while light rain was overestimated. NE was significantly greater for light rain than for heavy rain.
In this situation of PR-based QPE biases described above, the method of correcting estimators is implemented. The overestimation for light rain changes to underestimation for light rain after correcting estimators (Figure 7h). However, the QPE performance showed a significant improvement in the high normalized occurrence frequencies (NF) area. The high-NF area is marked with dashed lines, where 1.1 mm < Dm < 1.4 mm and 4 < log10 Nw < 4.5. About 21.82% of the data were in this high-NF area, where b_r was closer to one with the correction for estimators (1.0370) than with PR-based QPE alone (b_r = 1.0974), as shown in Figure 7g,h. NE also decreased by 8.01% with the correction for estimators than with PR-based QPE alone. This is because the method of correcting estimators is based on statistical biases. It tends to reduce the biases present in most QPE results. In addition, spatial correction (i.e., test 5) further mitigated the underestimation of light rain. Almost all QPE products were improved in that NE decreased for all QPE results except in low-NF areas. The lack of effectiveness in low-NF areas may be because the statistical data were relatively sparse and not well represented.

3.5. Microphysical Characteristics of Three Types of Precipitation

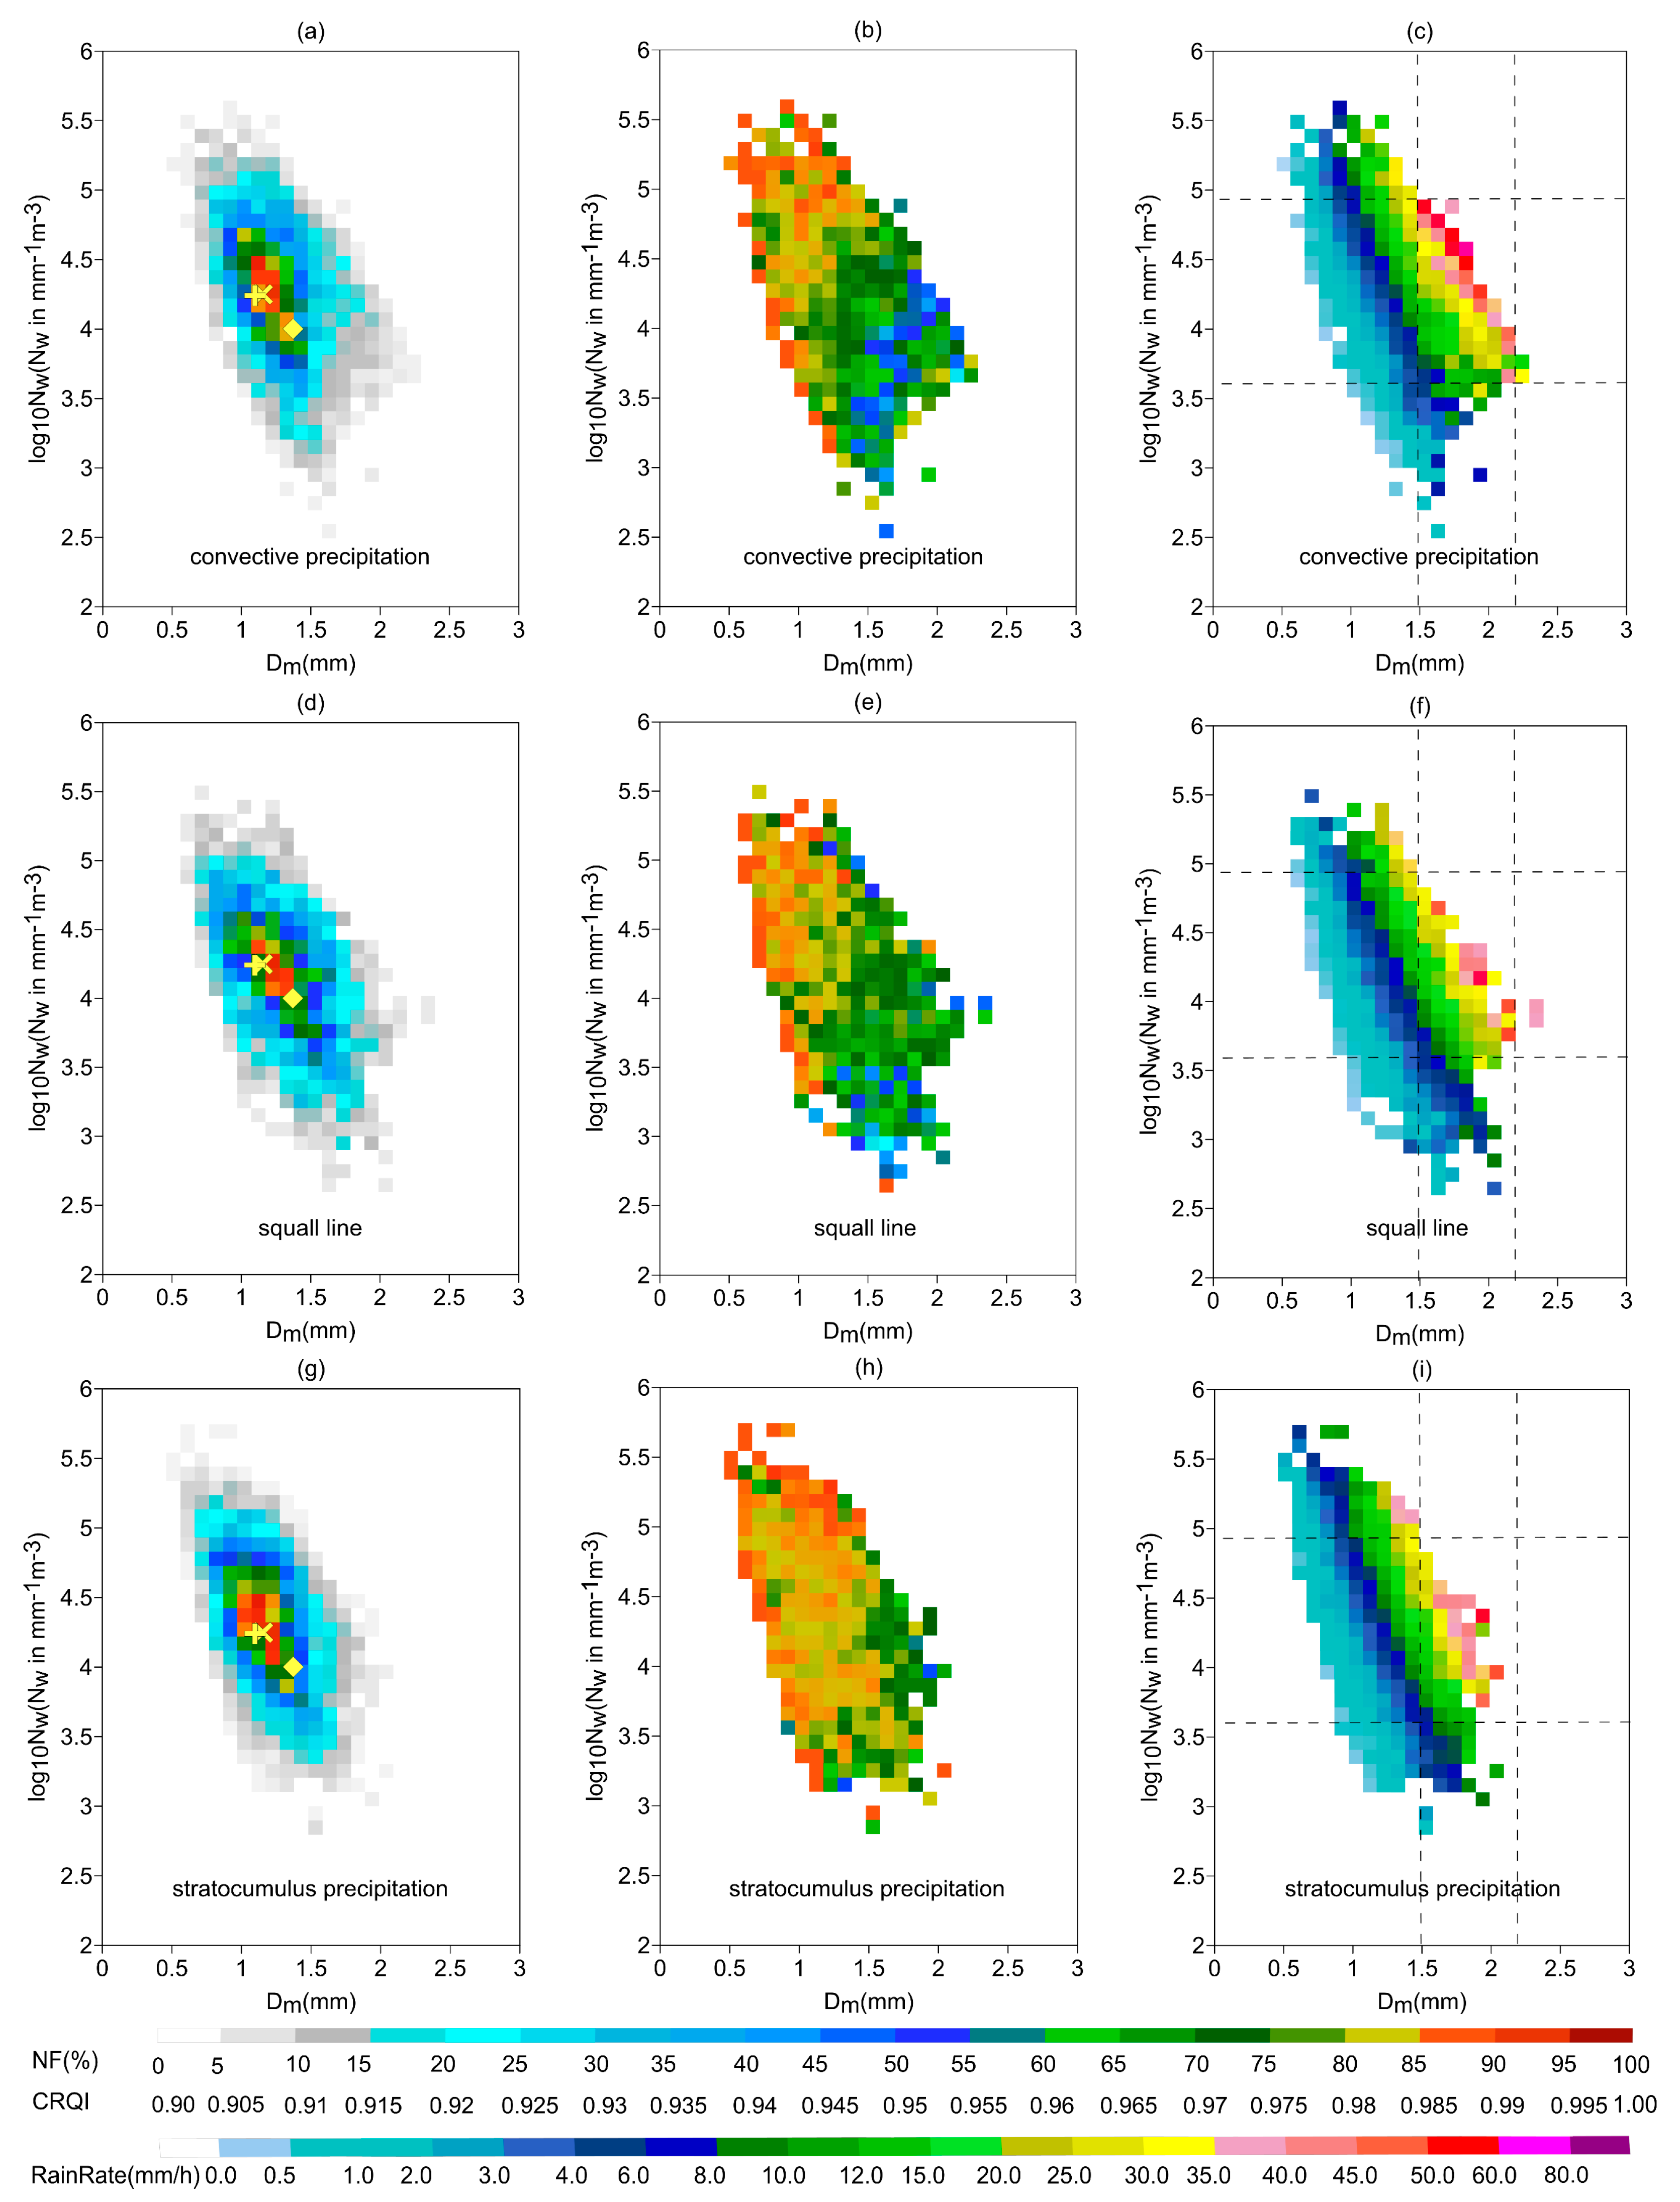
The nine rainfall events used in this study could be divided into three precipitation types: convective precipitation, squall line, and stratocumulus precipitation. Figure 8 shows the NF, CRQI, and hourly accumulated precipitation for these three precipitation types. The yellow cross, rhombus, and plus signs represent the average Dm–log10 Nw for convective precipitation, squall line, and stratocumulus precipitation, respectively. The average Dm was smaller for stratocumulus precipitation (1.10 mm) than for convective precipitation (1.15 mm). These two precipitation types had very similar average log10 Nw at 4.24 and 4.25, respectively. This is consistent with the findings of Huo et al. [34], who utilized DSD observations from disdrometers in Southern China. In contrast with the previous two precipitation types, squall line had larger (Dm = 1.37 mm) but sparser (log10 Nw = 4.00) particles. Chen et al. [35] studied the microphysical characteristics of a mei-yu rainband, typhoon rainband, and squall line by using DSD observations from a two-dimensional video disdrometer in Eastern China. They found that the squall line had larger ZDR than other precipitation types at the same ZH, which also indicates that squall line has larger but sparser particles. Meanwhile, the mei-yu and typhoon rainbands mostly comprised convective and stratocumulus precipitation. Therefore, the results of Chen et al. for squall line characteristics are consistent with the observations in the present study.
All of the three types of precipitation can lead to heavy rain (hourly accumulated precipitation > 35 mm), but the raindrop characteristics are different. For convective precipitation, Dm was distributed at 1.5–2.2 mm, and the rainfall is often extremely heavy (hourly accumulated precipitation > 50 mm). Dm for extremely heavy rain was distributed at 1.5–2.0 mm. Compared to the other types of precipitation, there are more pixels of extremely heavy rain in convective precipitation (Figure 8c). These results indicate that convective precipitation is more likely to result in extremely heavy rain than the other precipitation types. For heavy rain of squall line, Dm was distributed at 1.5–2.4 mm. Squall line had huge particles, which is in line with previous observations [35]. For heavy rain of stratocumulus precipitation, Dm was distributed at 1.3–2.1 mm. This indicates that small or medium-sized particles could lead to heavy rain, but this would mean that the number concentration must be very high. Only stratocumulus rainfall events had heavy rain under the conditions of Dm < 1.5 and log10 Nw > 5. Thus, heavy rain caused by small but dense particles is characteristic of stratocumulus rainfall events.

3.6. QPE Performances for Three Types of Precipitation

The QPE performances in tests 1, 3, and 5 were compared for the three types of precipitation. Table 5 presents the statistical scores. The CC and the absolute value of NB were similar for all three precipitation types in test 1. However, NE was the smallest for stratocumulus precipitation, followed by squall line and then convective precipitation. Therefore, the QPE performance was best for stratocumulus precipitation, followed by squall line and then convective precipitation. These results are consistent with the data quality of the three precipitation types according to CRQI, as shown in Figure 8b,e,h.
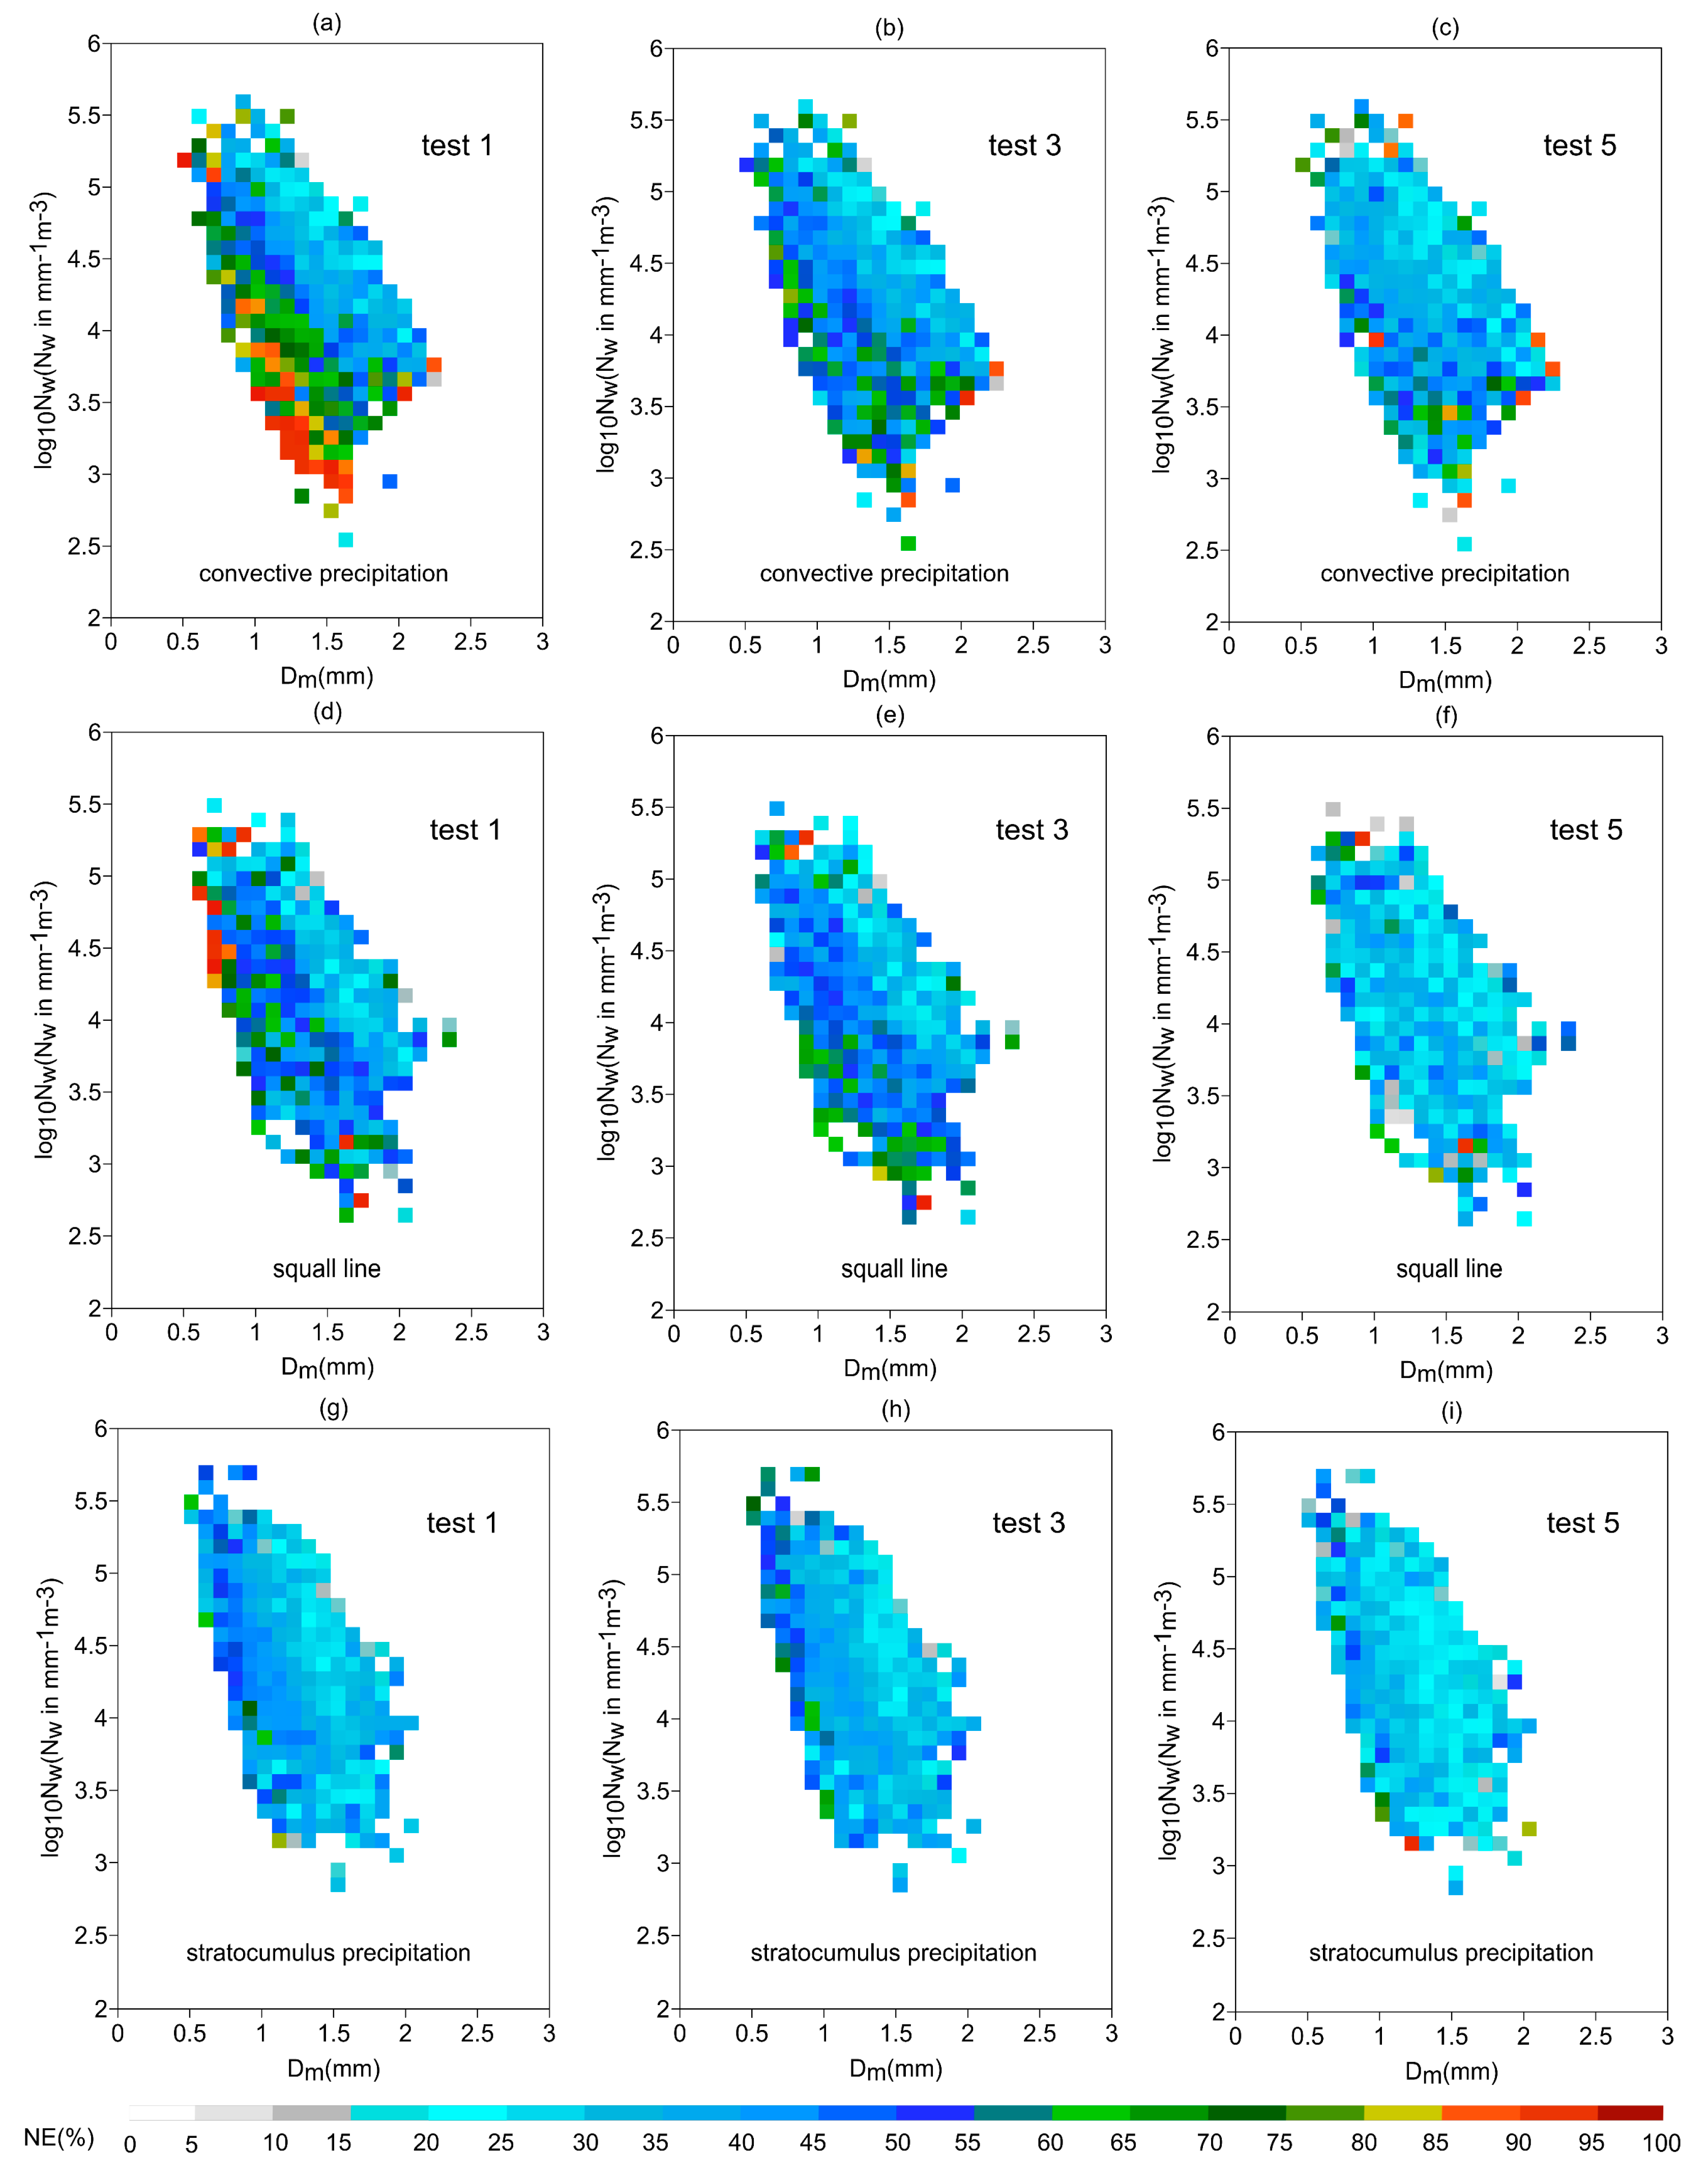
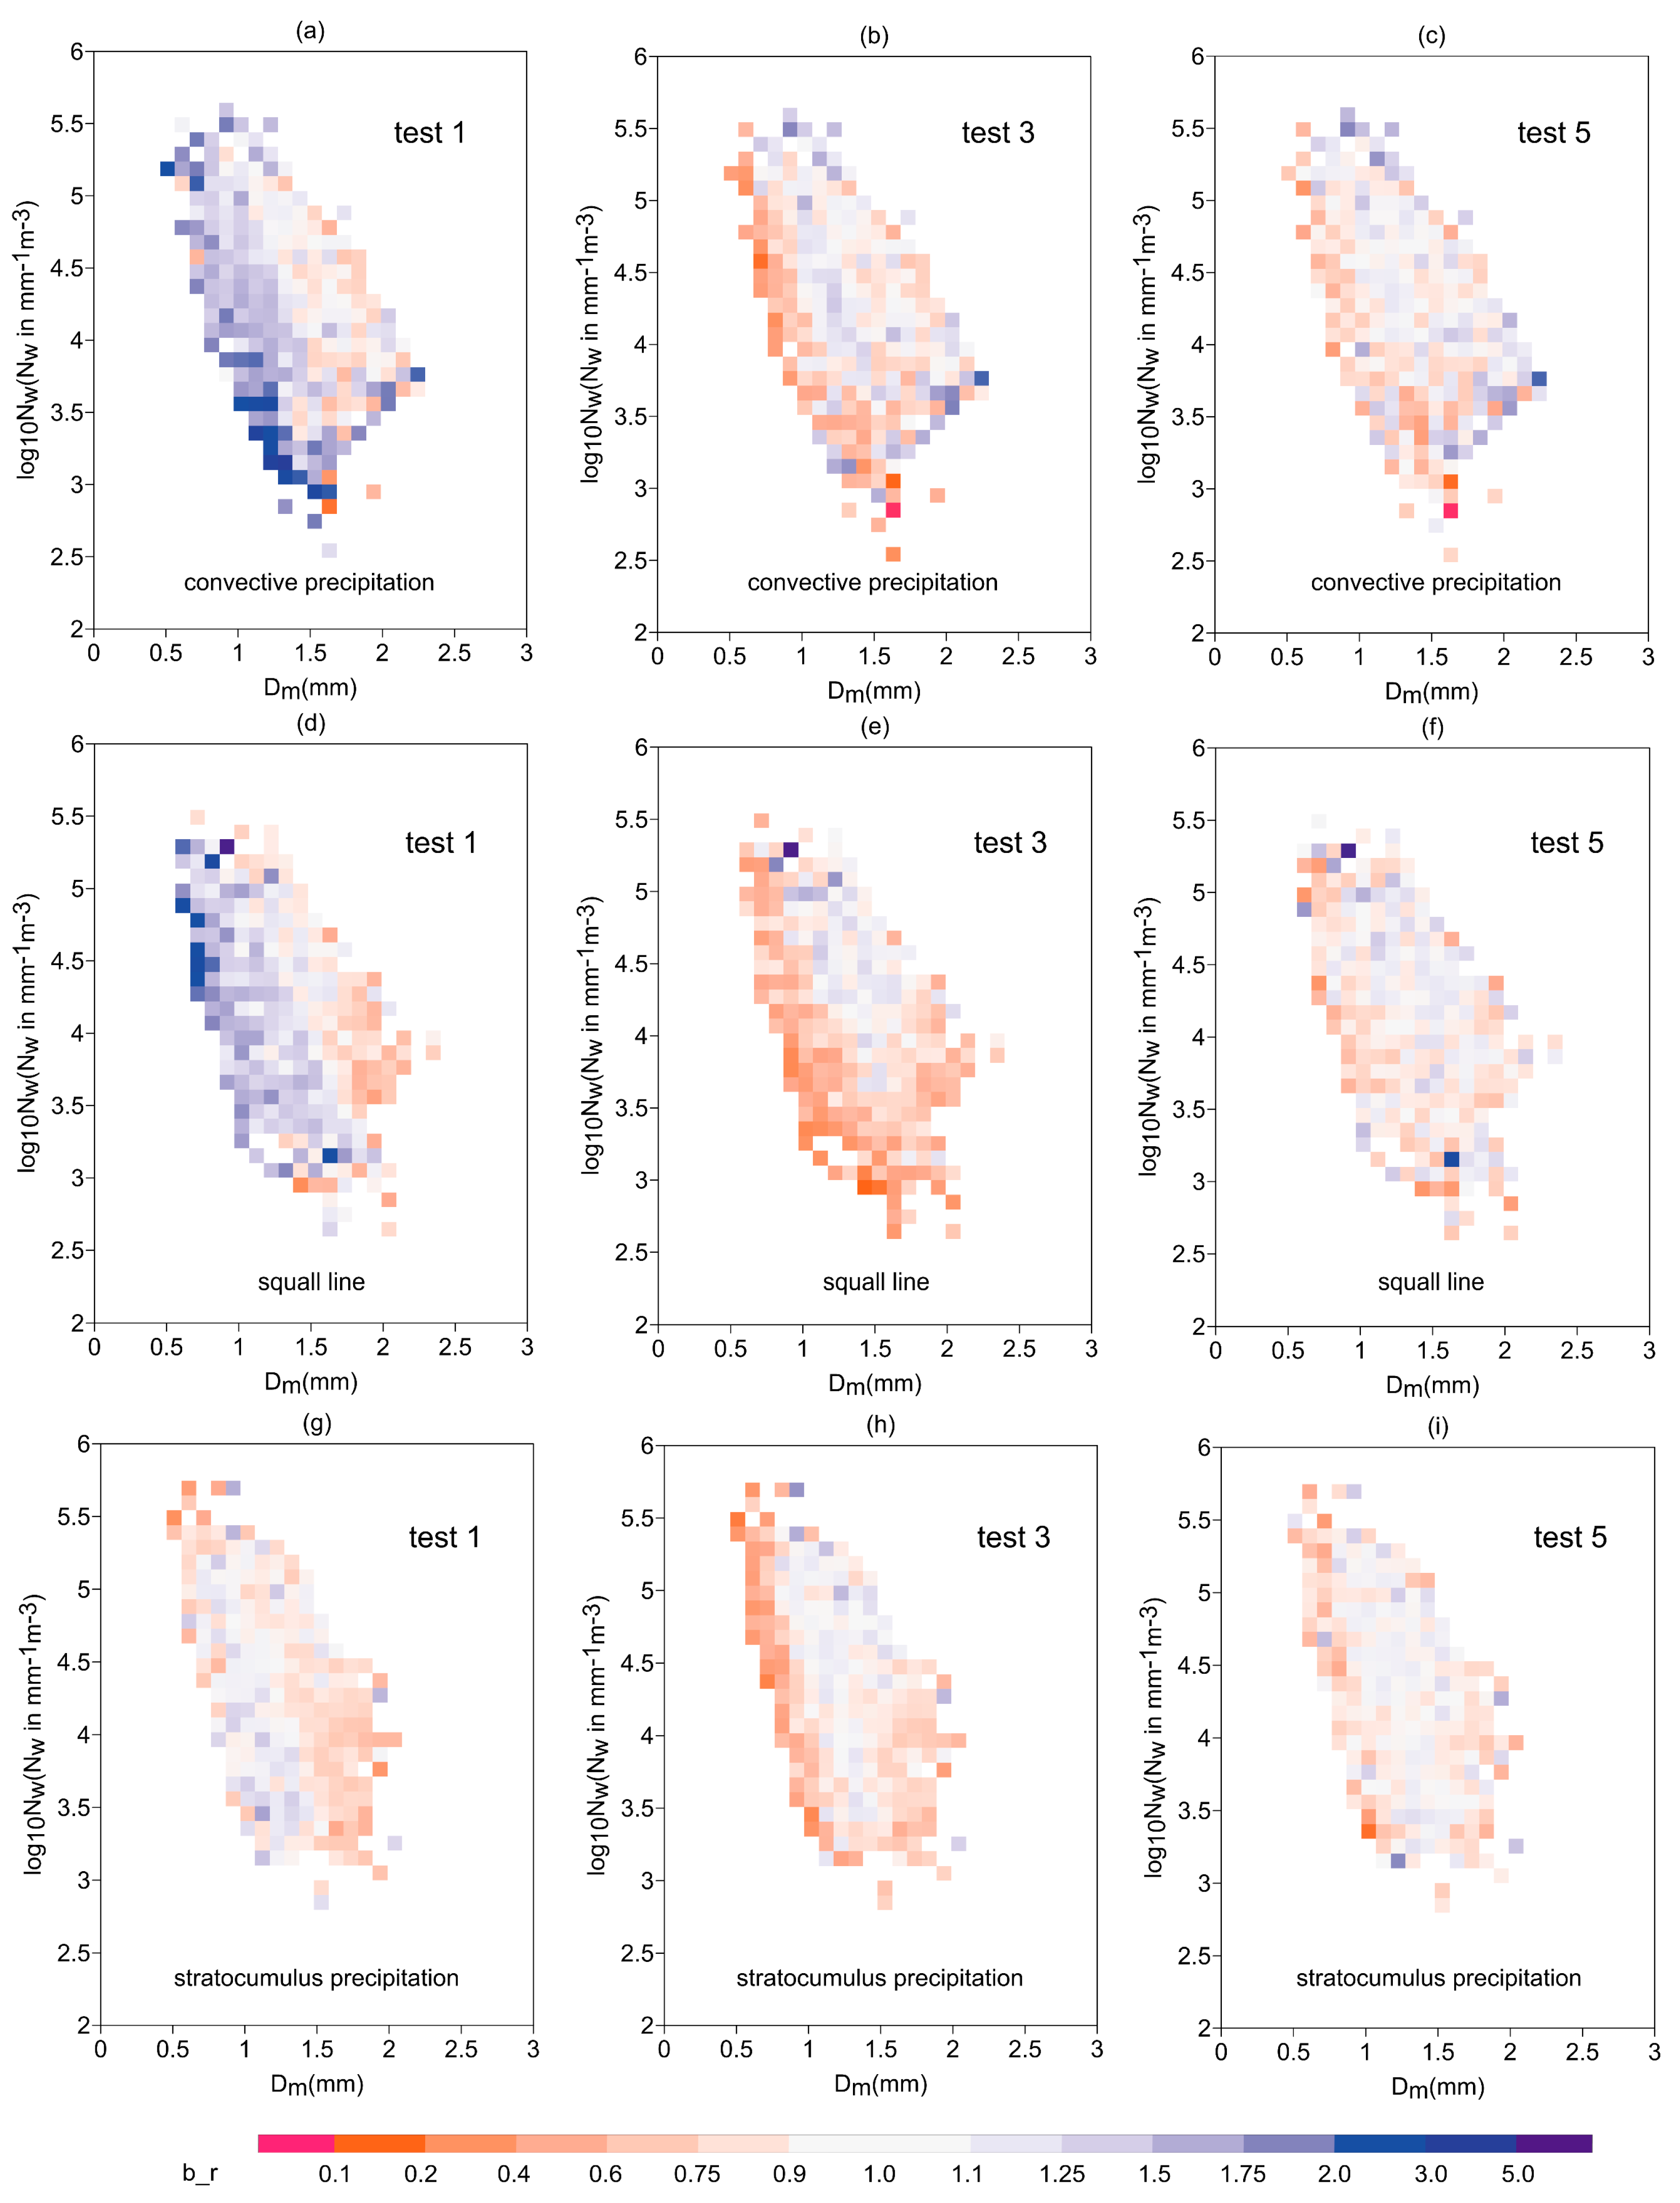
After correcting estimators in real-time (i.e., test 3), NB became closer to zero for convective precipitation and squall line. The overestimation of convective precipitation and squall line was significantly mitigated. The bias was also decreased in terms of NE and RMSE. Figure 9 and Figure 10 show the NE and b_r, respectively, of log10 Nw versus Dm. The overestimation caused by the small and medium-sized but sparse particles of convective precipitation was mitigated. In addition, the overestimation caused by the small but dense particles of squall line was mitigated. These results improved the QPE performances for convective precipitation and squall line. However, the QPE performance was not improved for stratocumulus precipitation. Through the correction for estimators, the estimators can follow the changes in DSD in real-time. The DSDs of convective precipitation and squall line are susceptible to change. This explains why the correction for estimators helped improve the QPE performance for these two precipitation types. In contrast, this method did not improve the QPE performance for stratocumulus precipitation because its DSD is relatively stable.
Spatial correction (i.e., test 5) improved the QPE performance significantly for all precipitation types according to all statistical scores listed in Table 5. NE and the b_r of log10 Nw versus Dm improved except in low-NF areas. The NB for QPE of stratocumulus precipitation became close to zero. The RMSE for convective precipitation, squall line, and stratocumulus precipitation decreased by 5.81%, 9.65%, and 7.00%, respectively, compared with PR-based QPE alone (i.e., test 1). Although the QPE performance was best for stratocumulus precipitation, the improvement in QPE performance was most obvious for squall line.

4. Discussion

The method of correcting estimators in real-time for PRs is not common because of its complexity in theory. There are too many estimators in a QPE algorithm and too many coefficients in an estimator (e.g., R(ZH, ZDR), R(KDP, ZDR)). If all coefficients need to be corrected with the variation of DSD, it is hard to find a simple way to change them correctly. For the proposed method, only multiplier coefficients of rainfall estimators are corrected in different rainfall rate ranges, and the index coefficients remain unchanged. This not only makes the method simple and feasible but also ensures the adaptability of the estimators to different intensities of precipitation. Although the method of correcting estimators in real-time for PRs is not common, the method of correcting the Z–R relationship for weather radar was used in some studies. Wang et al. [7] used this method to improve QPE performance for two heavy rainfall events in the Huaihe River Basin of China. The RMSE of the two rainfall events decreased from 13.84 and 10.48 mm to 12.56 and 10.45 mm for 24-h accumulated rainfall, respectively. It indicates that the method of correcting the Z–R relationship has different effects on different rainfall events. The same phenomenon occurred in the study of Gou et al. [8]. The mean bias decreased from 2.54 to 0.57 mm by using the method of correcting the Z–R relationship for squall line, while it increased from 0.38 to 0.42 mm for stratiform precipitation. The DSDs of squall line are susceptible to change, but the DSDs of stratiform precipitation are relatively stable. The method of correcting the Z–R relationship did not improve the QPE performance of the rainfall event with relatively stable DSDs, which is consistent with the results of this study.
The method of spatial correction proposed in this study is a geostatistical approach. Geostatistical approaches are sensitive to the quality and density of the data [4,6,17,19]. To reduce the influence of poor-quality radar data on QPE, Zhang et al. [6] used a radar quality index to help combine radar, RG, and orographic precipitation climatology. The merged QPE retained the high-resolution spatial structure of precipitation observed by radars and minimized the bias in the PR-based QPE. In addition, in the complex terrain where RG distributions are sparse, and radars have relatively poor coverage, a monthly precipitation climatology was used to provide a physically reasonable and spatially continuous precipitation map. It is a way to take advantage of good-quality data and avoid the disadvantages of poor-quality data, which is also the general idea of the proposed algorithm. In the proposed method of spatial correction, the OI method is implemented to take advantage of the good-quality PR data, and the Cressman interpolation method is implemented on RG data to avoid the disadvantage of the poor-quality PR data. The density of RGs is another factor influencing geostatistical approaches. The study of Goudenhoofdt and Delobbe [4] showed that the geostatistical merging methods performed better with the increasing density. When the density increased to a certain value, the rate of bias reduction slowed down. This certain value is one RG per 400 km2 in the study of Zhang [10] for the traditional OI method in Guangdong Province, China. The density of RGs used in this study is about one RG per 200 km2, which is much higher than one RG per 400 km2. It seems that the density is sufficiently high for the proposed algorithm, but it needs further research to confirm.

5. Conclusions

A QPE algorithm is proposed that combines data from PR and RG stations. The algorithm uses CRQI to improve the QPE performance. Five contrast tests were performed to evaluate the effect of CRQI. The test data are from nine rainfall events in Guangdong province, China, and detected by the PRs at Heyuan, Guangzhou, Yangjiang, and Zhanjiang stations and the nearby RGs. The QPE performance was evaluated in terms of the overall statistics, spatial distribution, near real-time statistics, and microphysics. The microphysical characteristics and QPE performances for three different precipitation types were analyzed: convective precipitation, squall line, and stratocumulus precipitation. The main conclusions can be summarized as follows:
CRQI was designed to represent the quality of the QPE without considering the effect of DSD. The CC between the new b_r and the average CRQI was 0.73, which indicates a good correlation between the QPE performance and CRQI. This fulfills the original design purpose. However, DSD became the main factor influencing the QPE performance when CRQI > 0.9. Thus, CRQI can also be used to determine when the QPE is mainly affected by the DSD or radar data quality. Therefore, CRQI was also used to help correct estimators with the variation of DSD in real-time and to help with merging data for spatial correction.
When all data pairs were used to correct estimators in real-time, the QPE performance was worsened because of the influence of poor-quality data pairs. CRQI was used to select only good-quality data pairs for correcting estimators, which improved the QPE performance, especially for data corresponding to 1.1 mm < average Dm < 1.4 mm and 4 < average log10 Nw < 4.5. With a traditional spatial correction method, the QPE performance was improved in areas with CRQI > 0.9. Some underestimations still occurred in areas with CRQI < 0.9 because of the beam broadening effect, excessive beam height, and partial beam blockages. In contrast, the proposed algorithm improved the QPE performance for all areas (CRQI > 0.0) and decreased RMSE by 17.5%. The above improvements with the proposed algorithm were observed not only in the overall statistical results but also in the near real-time statistical results. This is important for the operational application of the proposed algorithm.
There are some different microphysical characteristics for heavy rain (hourly accumulated precipitation > 30 mm) in the three different types of precipitation. Convective precipitation had more particles, which could lead to extremely heavy rain (hourly accumulated precipitation > 50 mm). Squall line generally had huge particles (average Dm > 2.3 mm). Only in stratocumulus rainfall events are there small but dense particles (average Dm < 1.5 and log10 Nw > 5) leading to heavy rain.
The correction for estimators improved the QPE performance when the DSD was susceptible to change. In contrast, it did not work very well when the DSD was relatively stable. Therefore, the correction for estimators significantly mitigated the overestimation of convective precipitation and squall line but did not improve the QPE performance for stratocumulus precipitation. Thus, the overall improvement for all rainfall events was not obvious. Although the QPE performance was best for stratocumulus precipitation, the improvement in QPE performance with the proposed algorithm was most obvious for squall line.
The results of this study demonstrated the advantages of the proposed algorithm with CRQI for QPE using PR and RG data. The correction for estimators did not improve the QPE performance for stratocumulus precipitation. Further study is needed to address this problem and further improve the QPE performance.

Author Contributions

Conceptualization, Y.Z. (Yang Zhang) and L.L.; Data curation, H.W. (Hao Wen), H.W. (Huiying Wang) and Y.Z. (Yong Zhang); Formal analysis, L.L.; Funding acquisition, Y.Z. (Yang Zhang), L.L., H.W. (Huiying Wang) and Y.Z. (Yong Zhang); Investigation, Y.Z. (Yang Zhang); Methodology, Y.Z. (Yang Zhang) and L.L.; Project administration, Y.Z. (Yang Zhang); Resources, H.W. (Hao Wen) and H.W. (Huiying Wang); Software, Y.Z. (Yang Zhang); Supervision, L.L.; Validation, Y.Z. (Yang Zhang), L.L., H.W. (Hao Wen) and B.Y.; Visualization, Y.Z. (Yang Zhang); Writing—original draft, Y.Z. (Yang Zhang); Writing—review and editing, Y.Z. (Yang Zhang), L.L., H.W. (Hao Wen) and B.Y. All authors have read and agreed to the published version of the manuscript.

Funding

This research was jointly funded by the National Natural Science Foundation of China (U2142210 and 42105141), Basic Research Fund of CAMS (2020Y017), and The Open Grants of the State Key Laboratory of Severe Weather (2021LASW-B14 and 2021LASW-B15).

Data Availability Statement

Not applicable.

Conflicts of Interest

The authors declare no conflict of interest.

References

  1. Wilson, J.W.; Brandes, E.A. Radar measurement of rainfall—A summary. Bull. Am. Meteorol. Soc. 1979, 60, 1048–1058. [Google Scholar] [CrossRef] [Green Version]
  2. Germann, U.; Galli, G.; Boscacci, M.; Bolliger, M. Radar precipitation measurements in a mountainous region. Q. J. R. Meteorol. Soc. 2006, 132, 1669–1692. [Google Scholar] [CrossRef]
  3. Ciach, G.J.; Krajewski, W.F.; Villarini, G. Product-errordriven uncertainty model for probabilistic precipitation estimation with NEXRAD data. J. Hydrometeorol. 2007, 8, 1325–1347. [Google Scholar] [CrossRef]
  4. Goudenhoofdt, E.; Delobbe, L. Evaluation of radar–gauge merging methods for quantitative precipitation estimates. Hydrol. Earth Syst. Sci. 2009, 13, 195–203. [Google Scholar] [CrossRef] [Green Version]
  5. Zhang, Y.; Liu, L.; Wen, H. Performance of a Radar Mosaic Quantitative Precipitation Estimation Algorithm Based on a New Data Quality Index for the Chinese Polarimetric Radars. Remote Sens. 2020, 12, 3557. [Google Scholar] [CrossRef]
  6. Zhang, J.; Qi, Y.; Langston, C.; Kaney, B.; Howard, K. A Real-Time Algorithm for Merging Radar QPEs with Rain Gauge Observations and Orographic Precipitation Climatology. J. Hydrometeorol. 2013, 15, 1794–1809. [Google Scholar] [CrossRef] [Green Version]
  7. Wang, G.; Liu, L.; Ding, Y. Improvement of radar quantitative precipitation estimation based on real-time adjustments to Z–R relationships and inverse distance weighting correction schemes. Adv. Atmos. Sci. 2012, 29, 575–584. [Google Scholar] [CrossRef]
  8. Gou, Y.; Liu, L.; Yang, J.; Wu, C. Operational application and evaluation of the quantitative precipitation estimates algorithm based on the multi–radar mosaic. Act. Meteor. Sin. 2014, 72, 731–748. (In Chinese) [Google Scholar] [CrossRef]
  9. Libertino, A.; Allamano, P.; Claps, P.; Cremonini, R.; Laio, F. Radar estimation of intense rainfall rates through adaptive calibration of the Z–R relation. Atmosphere 2015, 6, 1559–1577. [Google Scholar] [CrossRef] [Green Version]
  10. Zhang, Y. Study on the Quantitative Precipitation Estimation Algorithm and Performance Evaluation with the Operational Dual-Polarization Radar Network and Automatic Stations. Ph.D. Thesis, Nanjing University of Information Science and Technology, Nanjing, China, 2019. [Google Scholar]
  11. Fulton, R.A.; Breidenbach, J.P.; Seo, D.J.; Miller, D.A.; O’Bannon, T. The WSR-88D rainfall algorithm. Weather Forecast. 1998, 13, 377–395. [Google Scholar] [CrossRef]
  12. Tabary, P. The new French radar rainfall product. Part I: Methodology. Weather Forecast. 2007, 22, 393–408. [Google Scholar] [CrossRef]
  13. Zhang, J.; Howard, K.; Langston, C.; Vasiloff, S.; Kaney, B.; Arthur, A.; Van Cooten, S.; Kelleher, K.; Kitzmiller, D.; Ding, F.; et al. Coauthors: National Mosaic and Multi-Sensor QPE (NMQ) system: Description, results, and future plans. Bull. Am. Meteorol. Soc. 2011, 92, 1321–1338. [Google Scholar] [CrossRef] [Green Version]
  14. Haberlandt, U. Geostatistical interpolation of hourly precipitation from rain gauges and radar for a large-scale extreme rainfall event. J. Hydrol. 2007, 332, 144–157. [Google Scholar] [CrossRef]
  15. Velasco-Forero, C.A.; Sempere-Torres, D.; Cassiraga, E.F.; Gomez-Hernandez:, J.J. A non-parametric automatic blending methodology to estimate rainfall fields from rain gauge and radar data. Adv. Water Resour. 2009, 32, 986–1002. [Google Scholar] [CrossRef]
  16. Verworn, A.; Haberlandt:, U. Spatial interpolation of hourly rainfall—Effect of additional information, variogram inference and storm properties. Hydrol. Earth Syst. Sci. 2011, 15, 569–584. [Google Scholar] [CrossRef] [Green Version]
  17. Sideris, I.V.; Gabella, M.; Erdin, R.; Germann:, U. Realtime radar–rain-gauge merging using spatio-temporal co-kriging with external drift in the alpine terrain of Switzerland. Q. J. R. Meteorol. Soc. 2013, 140, 1097–1111. [Google Scholar] [CrossRef]
  18. Schiemann, R.; Erdin, R.; Willi, M.; Frei, C.; Berenguer, M.; Sempere-Torres:, D. Geostatistical radar-raingauge combination with nonparametric correlograms: Methodological considerations and application in Switzerland. Hydrol. Earth Syst. Sci. 2011, 15, 1515–1536. [Google Scholar] [CrossRef] [Green Version]
  19. Berndt, C.; Rabiei, E.; Haberlandt:, U. Geostatistical merging of rain gauge and radar data for high temporal resolutions and various station density scenarios. J. Hydrol. 2014, 508, 88–101. [Google Scholar] [CrossRef]
  20. Li, J.; Zhang, P. Optimum interpolation method used for measuring regional precipitation with weather radar. J. Oceanogr. Taiwan Strait 1996, 15, 255–259. [Google Scholar]
  21. Li, J.; Yang, W.; Gou, L.; Chen, Z. A study of improving precision of measuring regional precipitation in optimum interpolation method. J. Atmos. Sci. 2000, 24, 263–270. [Google Scholar] [CrossRef]
  22. Friedrich, K.; Hagen, M.; Einfalt, T. A Quality Control Concept for Radar Reflectivity, Polarimetric Parameters, and Doppler Velocity. J. Atmos. Ocean. Technol. 2006, 23, 865–887. [Google Scholar] [CrossRef] [Green Version]
  23. Vulpiani, G.; Montopoli, M.; Passeri, L.D.; Gioia, A.G.; Giordano, P.; Marzano, F.S. On the Use of Dual-Polarized C-Band Radar for Operational Rainfall Retrieval in Mountainous Areas. J. Appl. Meteorol. Climatol. 2012, 51, 405–425. [Google Scholar] [CrossRef]
  24. Qi, Y.; Zhang, J. A Physically Based Two-Dimensional Seamless Reflectivity Mosaic for Radar QPE in the MRMS System. J. Hydrometeorol. 2017, 18, 1327–1340. [Google Scholar] [CrossRef]
  25. Chen, S.; Gourley, J.J.; Hong, Y.; Kirstetter, P.E.; Zhang, J.; Howard, K.; Flaming, Z.L.; Hu, J.; Qi, Y. Evaluation and uncertainty estimation of NOAA/NSSL next-generation National Mosaic QPE (Q2) over the continental United States. J. Hydrometeorol. 2013, 14, 1308–1322. [Google Scholar] [CrossRef] [Green Version]
  26. Zhang, J.; Qi, Y.; Langston, C.; Kaney, B. Radar Quality Index (RQI)—A combined measure for beam blockage and VPR effects in a national network. In Proceedings of the Symposium Weather Radar and Hydrology, Exeter, UK, 18–21 April 2011. [Google Scholar] [CrossRef]
  27. Shafer, M.A.; Fiebrich, C.A.; Arndt, D.S.; Fredrickson, S.E.; Hughes, T.W. Quality Assurance Procedures in the Oklahoma Mesonetwork. J. Atmos. Ocean. Technol. 2000, 17, 474–494. [Google Scholar] [CrossRef]
  28. Eischeid, J.K.; Baker, C.B.; Karl, T.; Diaz, H.F. The quality control of long-term climatological data using objective data analysis. J. Appl. Meteorol. 1995, 34, 2787–2795. [Google Scholar] [CrossRef] [Green Version]
  29. Eischeid, J.K.; Pasteris, P.A.; Diaz, H.F.; Diaz, H.F.; Plantico, M.S.; Lott, N.J. Creating a Serially Complete, National Daily Time Series of Temperature and Precipitation for the Western United States. J. Appl. Meteorol. 2000, 39, 1580–1591. [Google Scholar] [CrossRef]
  30. Gandin, L.S. Complex Quality Control of Meteorological Observations. Mon. Weather Rev. 1988, 116, 1137–1156. [Google Scholar] [CrossRef] [Green Version]
  31. Wade, C.G. A quality control program for surface meteorological data. J. Atmos. Ocean. Technol. 1987, 4, 435–453. [Google Scholar] [CrossRef]
  32. Schroeder, J.L.; Burgett, W.S.; Haynie, K.B.; Sonmez, I.; Skwira, G.D.; Doggett, A.L.; Lipe, J.W. The West Texas Mesonet: A Technical Overview. J. Atmos. Ocean. Technol. 2005, 22, 211–222. [Google Scholar] [CrossRef]
  33. Zhang, Y.; Liu, L.; Wen, H.; Wu, C.; Zhang, Y. Evaluation of the Polarimetric-Radar Quantitative Precipitation Estimates of an Extremely Heavy Rainfall Event and Nine Common Rainfall Events in Guangzhou. Atmosphere 2018, 9, 330. [Google Scholar] [CrossRef] [Green Version]
  34. Huo, Z.; Ruan, Z.; Wei, M.; Ge, R.; Li, F.; Ruan, Y. Statistical characteristics of raindrop size distribution in south china summer based on the vertical structure derived from vpr-cfmcw. Atmos. Res. 2019, 222, 47–61. [Google Scholar] [CrossRef]
  35. Chen, G.; Zhao, K.; Zhang, G.; Huang, H.; Liu, S.; Wen, L.; Yang, Z.; Yang, Z.; Xu, L.; Zhu, W. Improving polarimetric c-band radar rainfall estimation with two-dimensional video disdrometer observations in eastern china. J. Hydrometeorol. 2017, 18, 1375–1391. [Google Scholar] [CrossRef]
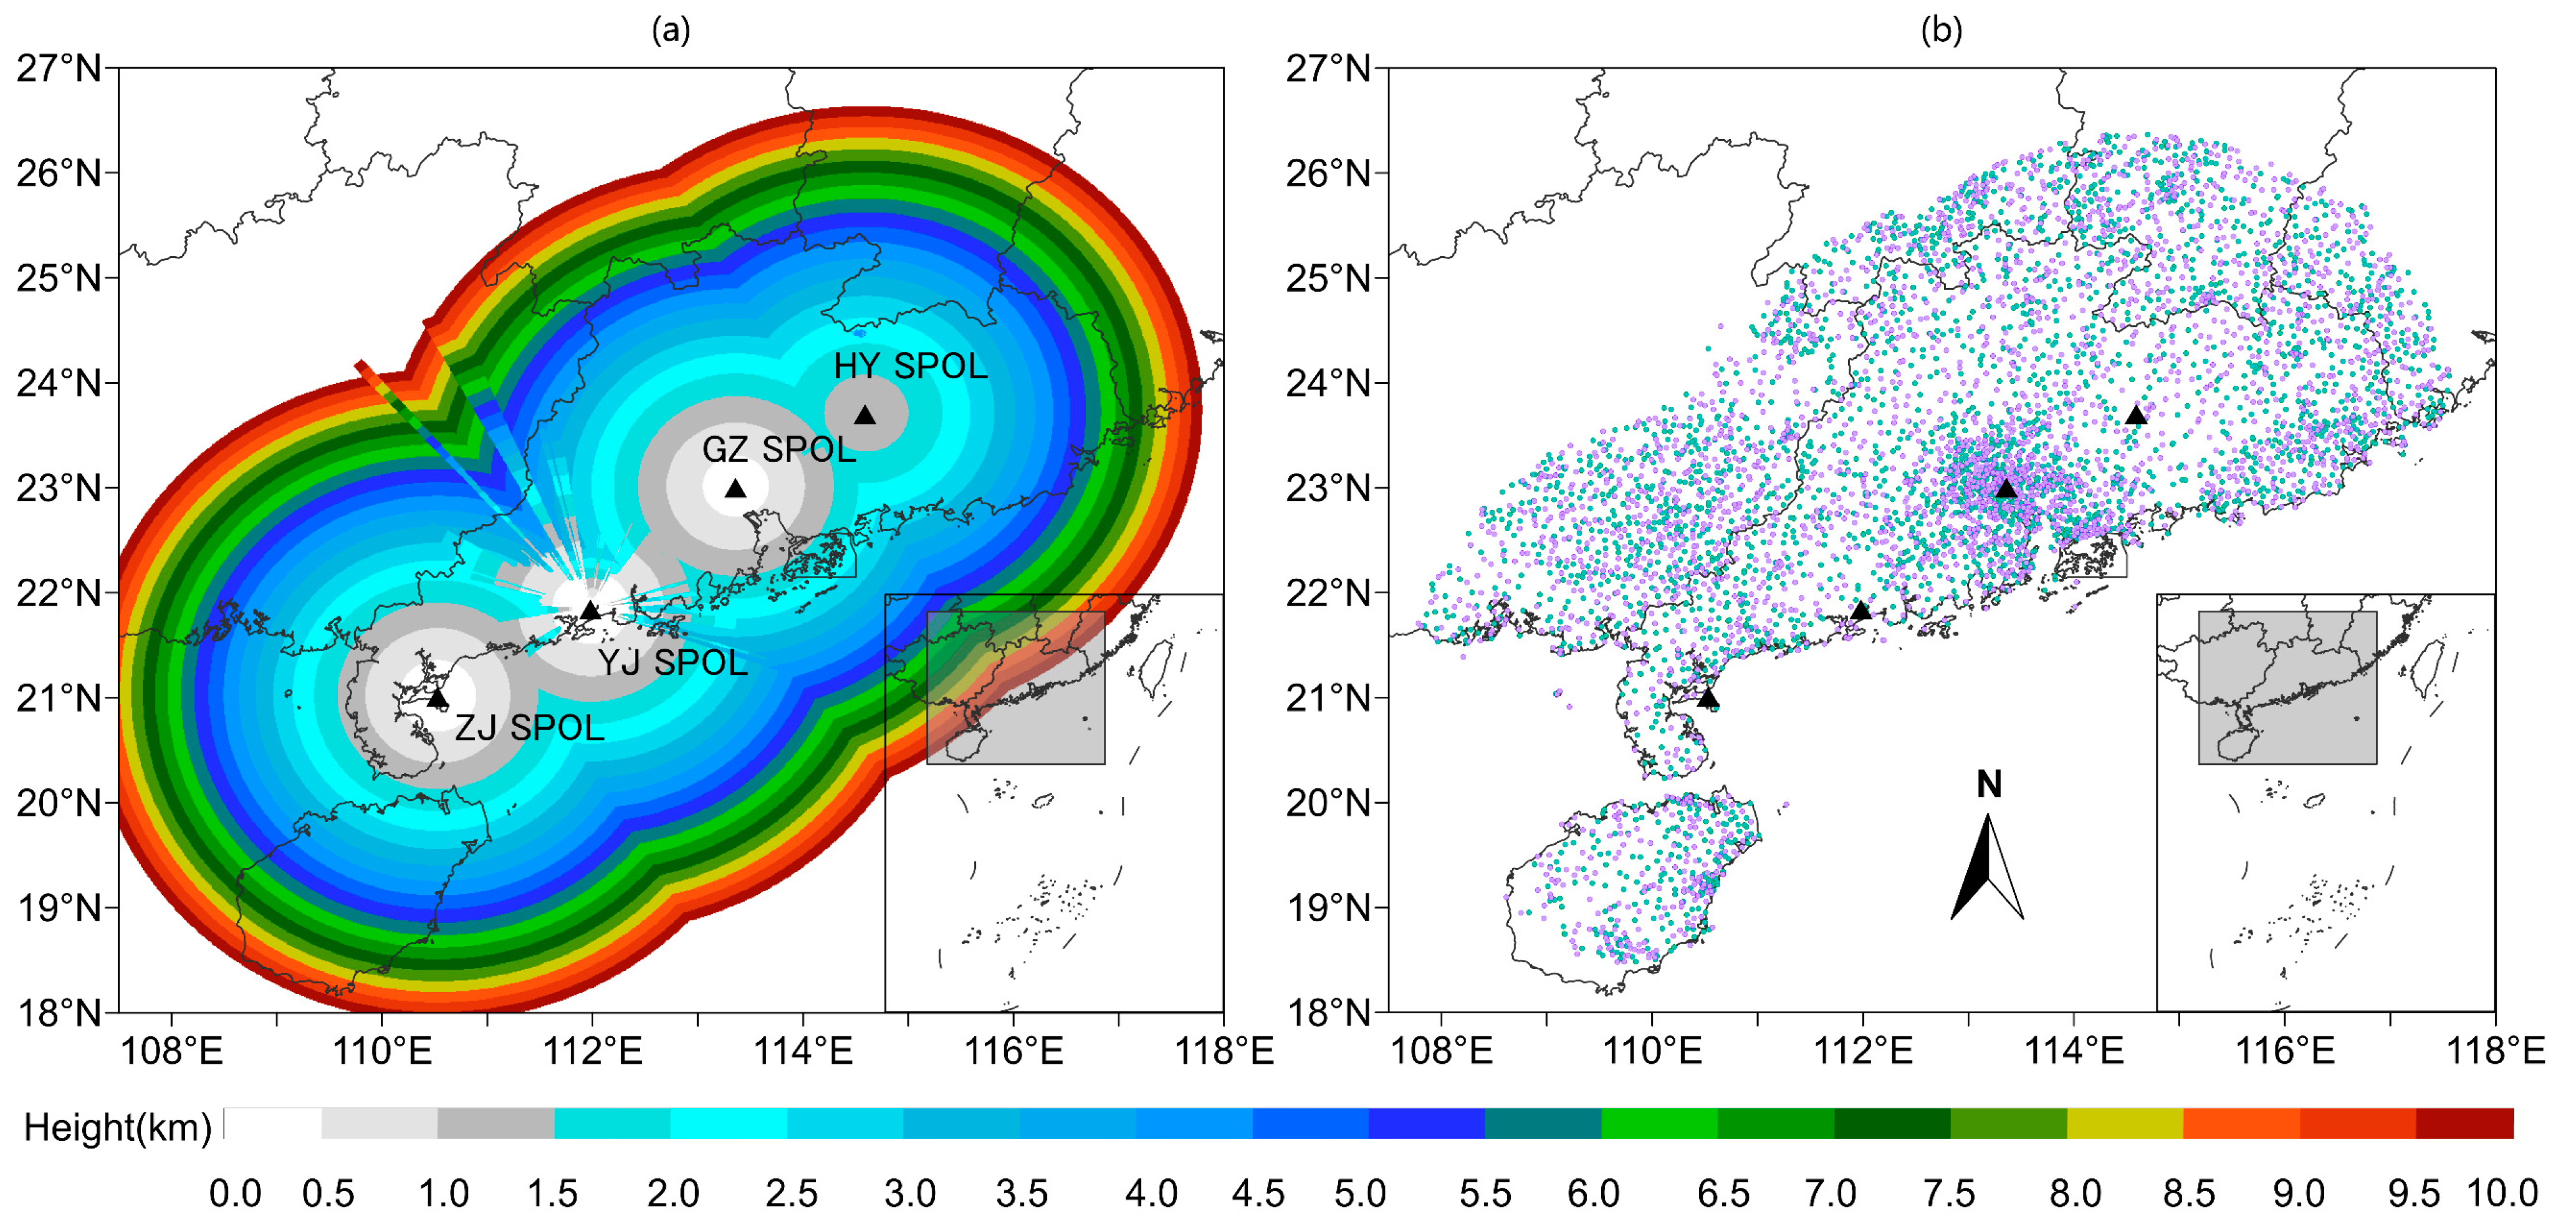
Figure 1. Distributions of the (a) S-band PR stations at Heyuan (HY), Guangzhou (GZ), Yangjiang (YJ), and Zhanjiang (ZJ) (black triangles and labeled as SPOL) and (b) RG stations (green and purple circles). The background colors in (a) indicate the mosaic height. The 5348 RG stations were evenly divided into two groups (green: 2681, purple: 2667) according to the spatial distribution. The gray rectangles in the insets show the extent of the study area and its location in Southern China.
Remotesensing 14 03154 g001
Figure 2. (ai) Typical mosaic echoes of the rainfall event 1–9. The corresponding rainfall events and time are indicated at the bottom right of each image.
Remotesensing 14 03154 g002
Figure 3. Flowchart of the algorithm combining PR and RG data for QPE.
Remotesensing 14 03154 g003
Figure 4. B_r distributions of the mosaic QPE in tests (a) 1, (b) 2, (c) 3, (d) 4, and (e) 5. The b_r was calculated between the QPE and observed precipitation at a given RG station. The evaluation results were based on all nine of the rainfall events. The bubble indicates the b_r at an RG station. Different colors indicate different b_r values. Red indicates underestimation, and purple indicates overestimation. (f) Average CRQI distribution for the nine rainfall events. The colors of the bubbles indicate the average CRQI values at the RG stations. The bubble size indicates the average hourly accumulated rainfall at each RG station.
Remotesensing 14 03154 g004
Figure 5. (ai) Time series of NE values for the rainfall event 1–9. The QPE performance at CRQI > 0.9 was evaluated. The purple, green, yellow, and red lines represent NE values in tests 1, 2, 3, and 4, respectively.
Remotesensing 14 03154 g005
Figure 6. (ai) Time series of NE values for the rainfall event 1–9. The QPE performance at CRQI > 0.0 was evaluated. The red and blue lines represent NE values in tests 4 and 5, respectively.
Remotesensing 14 03154 g006
Figure 7. (a) Normalized occurrence frequency (NF) of log10 Nw versus Dm. (b) CRQI of log10 Nw versus Dm. (c) Hourly accumulated precipitation observed by RG stations of log10 Nw versus Dm. (df) NE of log10 Nw versus Dm for QPE in tests 1, 3, and 5. (gi) B_rs of log10 Nw versus Dm for QPE in tests 1, 3, and 5. Dm and Nw were derived from good-quality ZH and ZDR for all rainfall events. The dashed lines indicate data with high NF.
Remotesensing 14 03154 g007
Figure 8. (a,d,g) Normalized occurrence frequency (NF) of log10 Nw versus Dm. (b,e,h) CRQI of log10 Nw versus Dm. (c,f,i) Hourly accumulated precipitation observed by RG stations of log10 Nw versus Dm. The top, middle, and bottom rows show the parameters for convective precipitation, squall line, and stratocumulus precipitation, respectively. Dm and Nw were derived from good-quality ZH and ZDR for all rainfall events. The dashed lines mark the area with heavy rain due to convective precipitation.
Remotesensing 14 03154 g008
Figure 9. (ai) NEs of log10 Nw versus Dm. The top, middle, and bottom rows show the results for convective precipitation, squall line, and stratocumulus precipitation, respectively. The left, middle, and right columns show the results from tests 1, 3, and 5, respectively. Dm and Nw were derived from good-quality ZH and ZDR for the corresponding events.
Remotesensing 14 03154 g009
Figure 10. (ai) B_rs of log10 Nw versus Dm. The top, middle, and bottom rows show the results for convective precipitation, squall line, and stratocumulus precipitation, respectively. The left, middle, and right columns show the results from tests 1, 3, and 5, respectively. Dm and Nw were derived from good-quality ZH and ZDR for the corresponding events.
Remotesensing 14 03154 g010
Table 1. Main specifications of the S-band PR.
Parameter TypeSetting
Antenna diameter (m)8.54
Antenna gain (dB)45.31
Beam width (°)<0.98
First side lobe (dB)<−30
Wavelength (cm)10.3
Operating modeSimultaneous horizontal and
vertical transmission and reception
Minimum detectable power (dBm)−117.8
Volume scan modeVCP21 (9 tilts)
Range resolution (km)0.25
Scan period (min)6
Table 2. Nine rainfall events used in this study.
#Date (UTC)Total Time
(h)
No. of Valued GaugesMean Gauge
Accumulation (mm)
Max Gauge
Accumulation (mm)
Precipitation Type
111–12 April 201914387316.66144.7squall line
227 April 201913299622.08189.2squall line
37–8 May 201916411417.42237.6stratocumulus
426–27 May 201916350619.64542.6convective
59–10 June 201926368435.53297.6convective
612–13 June 201920398225.09239.8convective
723 June 20191229059.1475.6squall line
823–24 June 201920318240.44211.6stratocumulus
99–10 July 201921357724.84176.6stratocumulus
Table 3. Contrast tests.
#Estimators Correction MethodSpatial Correction Method
1No correction for estimatorsNo spatial correction
2Correct estimators with all data pairsNo spatial correction
3Correct estimators with good-quality data pairs (CRQI > 0.95) No spatial correction
4Correct estimators with good-quality data pairs (CRQI > 0.95)Spatial correction
via the traditional OI method
5Correct estimators with good-quality data pairs (CRQI > 0.95)Spatial correction
via the proposed algorithm
Table 4. Statistical scores of tests 1–5.
TestCRQICCNB (%)NE (%)RMSE (mm)
1>0.90.871.2240.183.68
2>0.90.8710.8443.003.83
3>0.90.87−2.9639.313.66
4>0.90.89−0.4534.783.41
5>0.90.89−0.4434.793.41
1>0.00.78−15.6750.674.40
4>0.00.81−14.9345.044.18
5>0.00.86−2.5738.893.63
Table 5. Statistical scores of three types of precipitation in tests 1, 3, and 5.
TypeTestCCNB (%)NE (%)RMSE (mm)
convective10.866.5742.924.30
convective30.86−1.3841.154.28
convective50.880.6737.394.05
squall line10.878.3941.804.04
squall line30.880.8839.773.98
squall line50.902.3334.233.65
stratocumulus10.88−7.4337.013.00
stratocumulus30.88−6.5737.583.02
stratocumulus50.90−3.0333.082.79
Publisher’s Note: MDPI stays neutral with regard to jurisdictional claims in published maps and institutional affiliations.