Article

Dual-Frequency Radar Retrievals of Snowfall Using Random Forest

1
Department of Electronic Engineering, Chengdu University of Information Technology, Chengdu 610225, China
2
CMA Key Laboratory of Atmospheric Sounding, Chengdu 610225, China
3
Department of Electrical and Computer Engineering, Colorado State University, Fort Collins, CO 80523, USA
4
Institute of Atmospheric Physics, Chinese Academy of Sciences, Beijing 100029, China
5
College of Earth Sciences, University of Chinese Academy of Sciences, Beijing 100049, China
6
Institute of Urban Meteorology (IUM), Beijing 100089, China
*
Author to whom correspondence should be addressed.
Remote Sens. 2022, 14(11), 2685; https://doi.org/10.3390/rs14112685
Submission received: 25 April 2022 / Revised: 26 May 2022 / Accepted: 30 May 2022 / Published: 3 June 2022

Abstract

:
The microphysical parameters of snowfall directly impact hydrological and atmospheric models. During the International Collaborative Experiment hosted at the Pyeongchang 2018 Olympic and Paralympic Winter Games (ICE-POP 2018), dual-frequency radar retrievals of particle size distribution (PSD) parameters were produced and assessed over complex terrain. The NASA Dual-frequency Dual-polarized Doppler Radar (D3R) and a collection of second-generation Particle Size and Velocity (PARSIVEL2) disdrometer observations were used to develop retrievals. The conventional look-up table method (LUT) and random forest method (RF) were applied to the disdrometer data to develop retrievals for the volume-weighted mean diameter (Dm), the shape factor (mu), the normalized intercept parameter (Nw), the ice water content (IWC), and the snowfall rate (S). Evaluations were performed between the D3R radar and disdrometer observations using these two methods. The mean errors of the retrievals based on the RF method were small compared with those of the LUT method. The results indicate that the RF method is a promising way of retrieving microphysical parameters, because this method does not require any assumptions about the PSD of snowfall.

1. Introduction

In middle to high latitudes, the most common precipitation originates from snowfall [1]. Snowfall plays an important role in global precipitation, radiative balance, vegetation, and climate [1,2,3,4,5,6]. Additionally, snowstorms can cause significant injury and financial loss at higher latitudes [7]. Furthermore, the thermal, dynamic, and microphysical mechanisms of snowfall generation and evolution are linked to the microphysical properties of snowfall. At the same time, the microphysical parameterization process of snowfall in the current numerical weather prediction (NWP) models is not accurate [1,8,9,10,11,12,13,14,15,16]. Therefore, the microphysical parameters of snowfall need to be retrieved as accurately as possible to improve the accuracy of snowfall forecasts.
Retrieving the microphysical parameters of snowfall is challenging. This can be explained by the much greater natural variabilities of snowflakes, such as their density, shape orientation, terminal fall velocity (as a function of snowflake size), and structure, and also the inabilities of the modeled PSD to represent actual snow spectra compared to those of raindrops. In addition, the uncertainties related to simulating the scattering characteristics of snowfall are large because of the diverse habits of snowflakes [17,18,19,20,21,22,23,24,25]. All of these can lead to errors in the retrieval of snowfall parameters.
Traditional estimates of snowfall derived from single-frequency radar observations adopt empirical formulas, which are inherently uncertain [26,27,28,29,30,31] because the relationship is suitable for a specific area and the results may vary greatly for different cases. Additionally, single-frequency radars provide only one reflectivity observation, which is an average parameter per volume. All of these uncertainties result in large errors when using single-frequency radars to retrieve snowfall parameters. The Global Precipitation Measurement (GPM) core satellite was launched on 27 February 2014, which was a joint project between NASA and JAXA [32,33,34]. The GPM dual-frequency Precipitation Radar (DPR) was proposed to detect and retrieve clouds and precipitation, which operates with frequencies of 13.6 GHz (Ku-band) and 35.5 GHz (Ka-band). One of the DPR’s goals is to produce more accurate S and IWC estimations for higher latitude regions. Dual-frequency radar observations provide two reflectivities in an observation volume as a function of their size, which can be used to determine the snowfall distribution’s characteristic size. The general principle of dual-frequency radar is that snowfall backscattering at one wavelength operates in the Rayleigh regime or close to it, while another frequency operates in the non-Rayleigh (Mie) regime for a typical snowflake size, resulting in a measurable difference in reflectivities that can be directly related to size. When compared to a single-frequency radar, this allows for a more precise calculation of the microphysical parameters. Dual-wavelength radar is a potential method for properly retrieving microphysical snowfall information.
Several studies have been conducted to retrieve snowfall parameters from ground and airborne radar measurements using dual-frequency radar [35,36,37,38,39,40,41,42]. For computing radar backscattering cross sections, traditional DPR algorithms use a fixed-snow-density model and the assumption of a PSD function, such as exponential, gamma, or lognormal distribution.
The conventional DPR algorithms for retrieval set the density of snowfall as a constant for computing radar backscattering cross sections and assume the PSD function as the gamma distribution. However, some assumptions are introduced in this way. The assumptions cannot represent and characterize the actual parameters of snowfall, so the retrieval results remain uncertain. The development of deep learning techniques provides new methods for atmospheric science [43,44,45,46,47,48,49,50,51]. A few studies have explored the possibility of retrieval using machine learning [52,53]. However, there have been no machine learning applications for PSD retrieval utilizing Ku- and Ka-band radars. The random forest method will be used in this paper to obtain microphysical snowfall properties. The method uses information from observed PSDs while retrieving and does not need any assumptions.
The goal of this research is to investigate if the random forest technique can be used to obtain microphysical snowfall parameters, such as the mass-weighted diameter, S, IWC, and PSD parameters (shape factor µ and normalized intercept parameter Nw). As for the density of snowfall, we adopted the method proposed before [54,55]. In Section 2, the data and method used to produce and evaluate the algorithm are described. The retrievals using the conventional method and random forest are conducted based on dual-frequency radar (D3R) in Section 3, and the frequency bands of it are at Ku and Ka. Evaluations of the results using the second-generation Particle Size and Velocity (PARSIVEL2) disdrometer observations are analyzed in Section 4. Section 5 presents the main results of this study.

2. Data and Instruments

2.1. Experimental Design

Pyeongchang, South Korea, hosted the 23rd Olympic Winter Games and the 13th Paralympic Winter Games from 9 to 25 February and 9 to 18 March 2018. The Korea Meteorological Administration (KMA), with support from the World Meteorological Organization (WMO), conducted the International Collaborative Experiment for the Pyeongchang 2018 Olympics and Paralympic Winter Games (ICEPOP 2018) campaign to enhance our understanding of winter precipitation and the accuracy of snowfall forecasting over complicated terrain. Between December 2017 and March 2018, supersites were deployed along the coast and throughout the mountain range, and intense remote sensing and in situ cloud and precipitation studies were conducted, such as X-band doppler dual-polarization radar, pluvio2 weighting precipitation gauges, precipitation imaging probes (PIP), micro rain radar (MRR), particle size and velocity precipitation disdrometer (Parsivel), dual-frequency dual-polarimetric doppler radar (D3R), etc. Radiosondes were launched at the same time. More detailed information about the campaign and observations can be found in a few papers [56,57,58,59]. Such comprehensive datasets enable a deeper understanding of snowfall. In this study, we will focus on the data collected by a D3R and three disdrometers located at three different supersites, the details of which are provided in the following subsections.
The location of Pyeongchang and the observation sites are depicted in Figure 1. The western part of the Pyeongchang Olympic region is characterized by a continental climate due to its location in the eastern alpine region. The eastern part of the Pyeongchang Olympic region is located on the east coast of the South Korean peninsula. This location results in an oceanic climate at the same time, which means that it has a relatively narrow annual temperature range. The D3R radar is stationed at DGW (DaeGwanryung Regional Weather Office; 37°40′38.39″ N, 128°43′07.7″ E, 773 m a.m.s.l.), and the red circle in the Figure 1 depicts the D3R radar’s coverage. DGW, CPO (Cloud Physics Observatory; 37°41′13.03″ N, 128°45′31.09″ E, 855 m a.m.s.l.), and YPO (YongPyoeng cloud physics Observatory; 37°38′36.03 N, 128°40′13.78 E, 772 m a.m.s.l.) are the locations of the three different disdrometers (the red font in Figure 1). In relation to the DGW location, the YPO site is placed at 226° azimuth and 6.5 km range. With respect to the DGW site, the CPO site is placed at 75° azimuth and a range of 2 km. The data obtained at the three sites (YPO, DGW, and CPO) were chosen for analysis because the heights between the radar beam and ground observation at YPO, CPO, and DGW were 0.55, 0.17, and 0.15 km, respectively, resulting in minor height discrepancies between the radar beam and surface observation. As a result, the data measured with height difference were ignored.
During the field campaign, 21 snowfall events were selected to be analyzed in this study, as shown in Table 1. The meteorological conditions are listed in Table 1, including the temperature, humidity, wind speed, and wind direction. Because the temperatures during these periods were much lower than 0 °C, the particles were dry snowflakes and were not wet snowflakes or mixed with raindrops. This is important because the scattering properties are related to the types of the particles, which are important parameters when retrieving microphysical parameters, and the detailed approach to retrieval will be presented in the following section. Another reason that these cases were selected is that the accumulations of snowfall were large enough (>1 mm).

2.2. Instruments

OTT developed the disdrometer, which is a second-generation laser-based optical system [33,60,61]. It has a horizontal strip of light that is 30 mm wide, 180 mm long, and 54 cm2 in the sample area. When particles travel through the laser beam, the particle velocity is determined by the duration of the output voltage, and the particle size is determined by the signal reduction. Every 60 s, the particle size and velocity are separated into 32 bins, with sizes ranging from 0.062 to 24.5 mm and velocity from 0.05 to 20.8 m s−1, respectively. Because the signal-to-noise ratio (SNR) is poor in these classes, the smallest two size classes (less than 0.312 mm) were excluded from this investigation to reduce measurement uncertainty. As a result, the minimum particle size and velocity were 0.25 m s−1 and 0.312 mm, respectively. Every 60 s, total particle numbers that were less than 10 were deleted to eliminate noise. The requirements for data quality control were the same as those in the previous investigation [54,55].
The NASA D3R was developed in cooperation between Colorado State University, Remote Sensing Solutions, and NASA the Goddard Space Flight Center for ground validation from a GPM dual-frequency radar. The NASA Global Hydrology Resource Center DAAC [62] provided the dataset used in the study. At 35.5 GHz (Ka-band) and 13.9 GHz (Ku-band), the D3R radar delivers polarimetric and doppler measurements. Table 2 lists the D3R radar’s particular parameters. D3R has a range resolution of 150 m, a feasible minimum operable range of 450 m, and a maximum detectable range of 40 km. D3R is more sensitive to light rain and snowfall than S- and C-band radars since its minimum detectable signal is −10 dBZ at a distance of 15 km. During ICE-POP 2018, the radar acquired data that helped us to better understand winter precipitation over complicated regions. The differential frequency ratio (DFR), which is defined as the difference in radar reflectivity between two frequencies, is provided by the D3R radar. Z at the Ku-band and DFR were used to estimate the microphysical snow properties and associated bulk parameters in this paper, and then comparisons with the disdrometer observations were made.

3. Retrieval Methods

3.1. Conventional Method

After measuring the particle size distribution, the microphysical parameters, such as the volume-weighted mean diameter Dm, normalized intercept parameter Nw, snowfall rate S, and ice water content IWC, could be obtained when coupled with a density–size (ρ-D) relationship. Radar parameters, such as the radar reflectivity factors at the Ku- and Ka-bands, DFR, could be obtained when coupled with a scattering property dataset. The parameters computed made up the look-up tables. The microphysical features of snowfall were thus directly related to the radar observations. This algorithm is called the LUT method. This method introduces some assumptions: the scattering properties dataset, density–size relationship, and PSD distribution. The retrieval of the scattering properties of snowflakes is basic, but it is the most challenging procedure at the same time, because the true structure, shape, orientation, and density are too complex to be represented as a unified model. In this study, we simplified the snowflake as a spheroid. By analyzing images acquired by a MASC, Garrett et al. (2015) discovered that the axis ratio of a snowflake particle is between 0.6–0.7. The density of snowfall varies greatly during an event and was usually considered as a fixed constant or described using a density–size relationship when retrieved in early studies. However, the relationships have huge differences between different locations. As for the PSD model, the three-parameter gamma distribution was adopted in this study. The shape factor µ was assumed as a constant. There are a few studies that have conducted assessments of the factor for snowfall retrieval. The gamma distribution is expressed as:
N D = N w f μ D D m μ exp Λ D
f μ = 6 4 4 4 + μ μ + 4 Γ μ + 4
Λ = 4 + μ D m
where µ is the shape factor; Dm is the volume-weighted diameter; and Nw is the normalized intercept parameter. In this study, we adopted a power law ρ-Dm relationship [54], which is suitable for the Pyeongchang region of South Korea:
ρ = 0.3358 D m 1.243   D m > 1.7   m m ρ = 0.3774 D m 1.386   1.7   m m < D m < 2.7   m m ρ = 0.462 D m 1.879   D m < 1.7   m m
The radar reflectivity factor at a wavelength of λ is given by:
Z λ = λ i 4 π 5 K w 2 D min D max σ i D N D dD
where σ i D is the backscattering cross section, which can be calculated by the T-matrix method. We used a 0.7 axis ratio and a Gaussian canting angle distribution with a mean of zero and a standard deviation of 45°. K w 2 is the dielectric factor, and it was set to 0.93.
According to Equations (1) and (5), the radar reflectivity factor at λ can be expressed as:
Z λ = λ i 4 π 5 K w 2 D min D max σ i D N w f μ D D m μ exp 4 + μ D D m dD
The difference in the radar reflectivity factors (DFR) at two frequencies (λ1 and λ2) is:
DFR = 10 log 10 Z λ 1 / Z λ 2
According to Equations (6) and (7), DFR is dependent on Dm for a given µ. From Equation (6), after retrieving Dm and measuring the radar reflectivity factor, Nw will be retrieved by looking up tables. Then, associated bulk parameters, such as the snowfall rate S and ice water content IWC, will be obtained:
IWC = π 6 × 10 3 0 D max ρ s   D 3 N D dD
S = 6 π × 10 4 0 D max ρ s   D 3 v D N D dD
Using the equations above and the results of scattering simulation based on the T-matrix, it is possible to obtain relationships between the microphysical snowfall properties and radar measurements. Figure 2 shows the results under the assumptions with µ = 0. The top-left (a), top-right (b), bottom-left (c), and bottom-right (d) panels show the plots of Dm, Nw/ZKu, IWC/ZKu, and S/ZKu versus DFR with the assumptions that the densities are 0.06 g cm−3 (red), 0.10 g cm−3 (blue), 0.20 g cm−3 (green), and 0.30 g cm−3 (black), respectively. Figure 3 shows the results of these parameters versus DFR with the assumptions of ρ = 0.1 g cm−3 and µ varying from −1 to 2. The analysis of these results indicated that different assumptions had effects on the results of retrievals.
To assess the LUT method, measurements from the Ku- and Ka-band radars were used for retrieval, as shown in Figure 4. Dm had the smallest errors at µ = 2, and the errors of IWC, S, and Nw did not have large differences when the µ values were altered. Liao et al. [42] evaluated the performance of snow retrieval considering PSD models and scattering tables from the perspective of PSD measurements, and the relative errors in the estimates of IWC, S, Dm, and Nw were in the ranges of −40% to 70%, −50% to 40%, −30% to 50%, and −100% to 1000%, respectively. Although the errors of the results are still high in Figure 4, this is the first attempt to use a dual-frequency radar to retrieve microphysical snowfall parameters. The previous studies about retrieving microphysical parameters did not use measurements from a dual-frequency radar for retrieval [39,42].

3.2. Random Forest (RF) Method

Before developing retrievals from RF, the microphysical parameters should be calculated from the PSD measurements according to (1)–(9). Random forest is a supervised learning algorithm. RF is made up of a series of decision trees, usually trained with the “bagging” method. The general idea of the bagging method is that a combination of learning models increases the overall result. One big advantage of random forest is that it can be used for both classification and regression problems, and this paper is a regression problem. Estimators are just the number of trees the algorithm builds before taking the maximum voting. Max features are the maximum number of features that random forest considers to split a node. In this study, decision trees were trained using the regression tree algorithm to discover the appropriate split for the subset data. The information gain and mean absolute error are two metrics that can be used to assess the split’s quality. The RF model combines the predictions of the estimators to produce a more accurate prediction. We used Scikit-Learn in Python to train the model, which is a free machine learning library. It supports both supervised and unsupervised machine learning. A number of parameters, such as the number of trees, max data per tree, max depth, min data required to create a new branch, and min data per leaf, in the RF model should be tuned. The most ideal parameters in this study were selected using a grid searching approach, which is an iterative process, as shown in Table 3.
In this study, the most optimal parameters were determined through a grid searching method, which is an iterative method, and are listed in Table 3. The RF method develops retrievals from the calculated reflectivity factor Z and DFR as inputs to retrieve Dm, Nw, µ, S, and IWC. The training data consisted of 75% of the PSD data, and testing data were the remaining 25%, which were randomly selected.
Figure 5 shows scatterplots of the PSD-observed and retrieved Dm, Nw, µ, S, and IWC from training and testing. Their bias and correlation coefficient are also presented in the figures. Table 4 lists some other statistical parameters, such as the mean absolute error, accuracy, training, and testing correlation coefficient. It is obvious that the RF model developed in this study to retrieve the microphysical parameters performed well, as shown in Figure 5 and Table 4. The DFR made a great contribution because the importances of DFR for Dm, Nw, µ, S, and IWC retrievals were 0.98, 0.79, 0.86, 0.95, and 0.97, respectively.

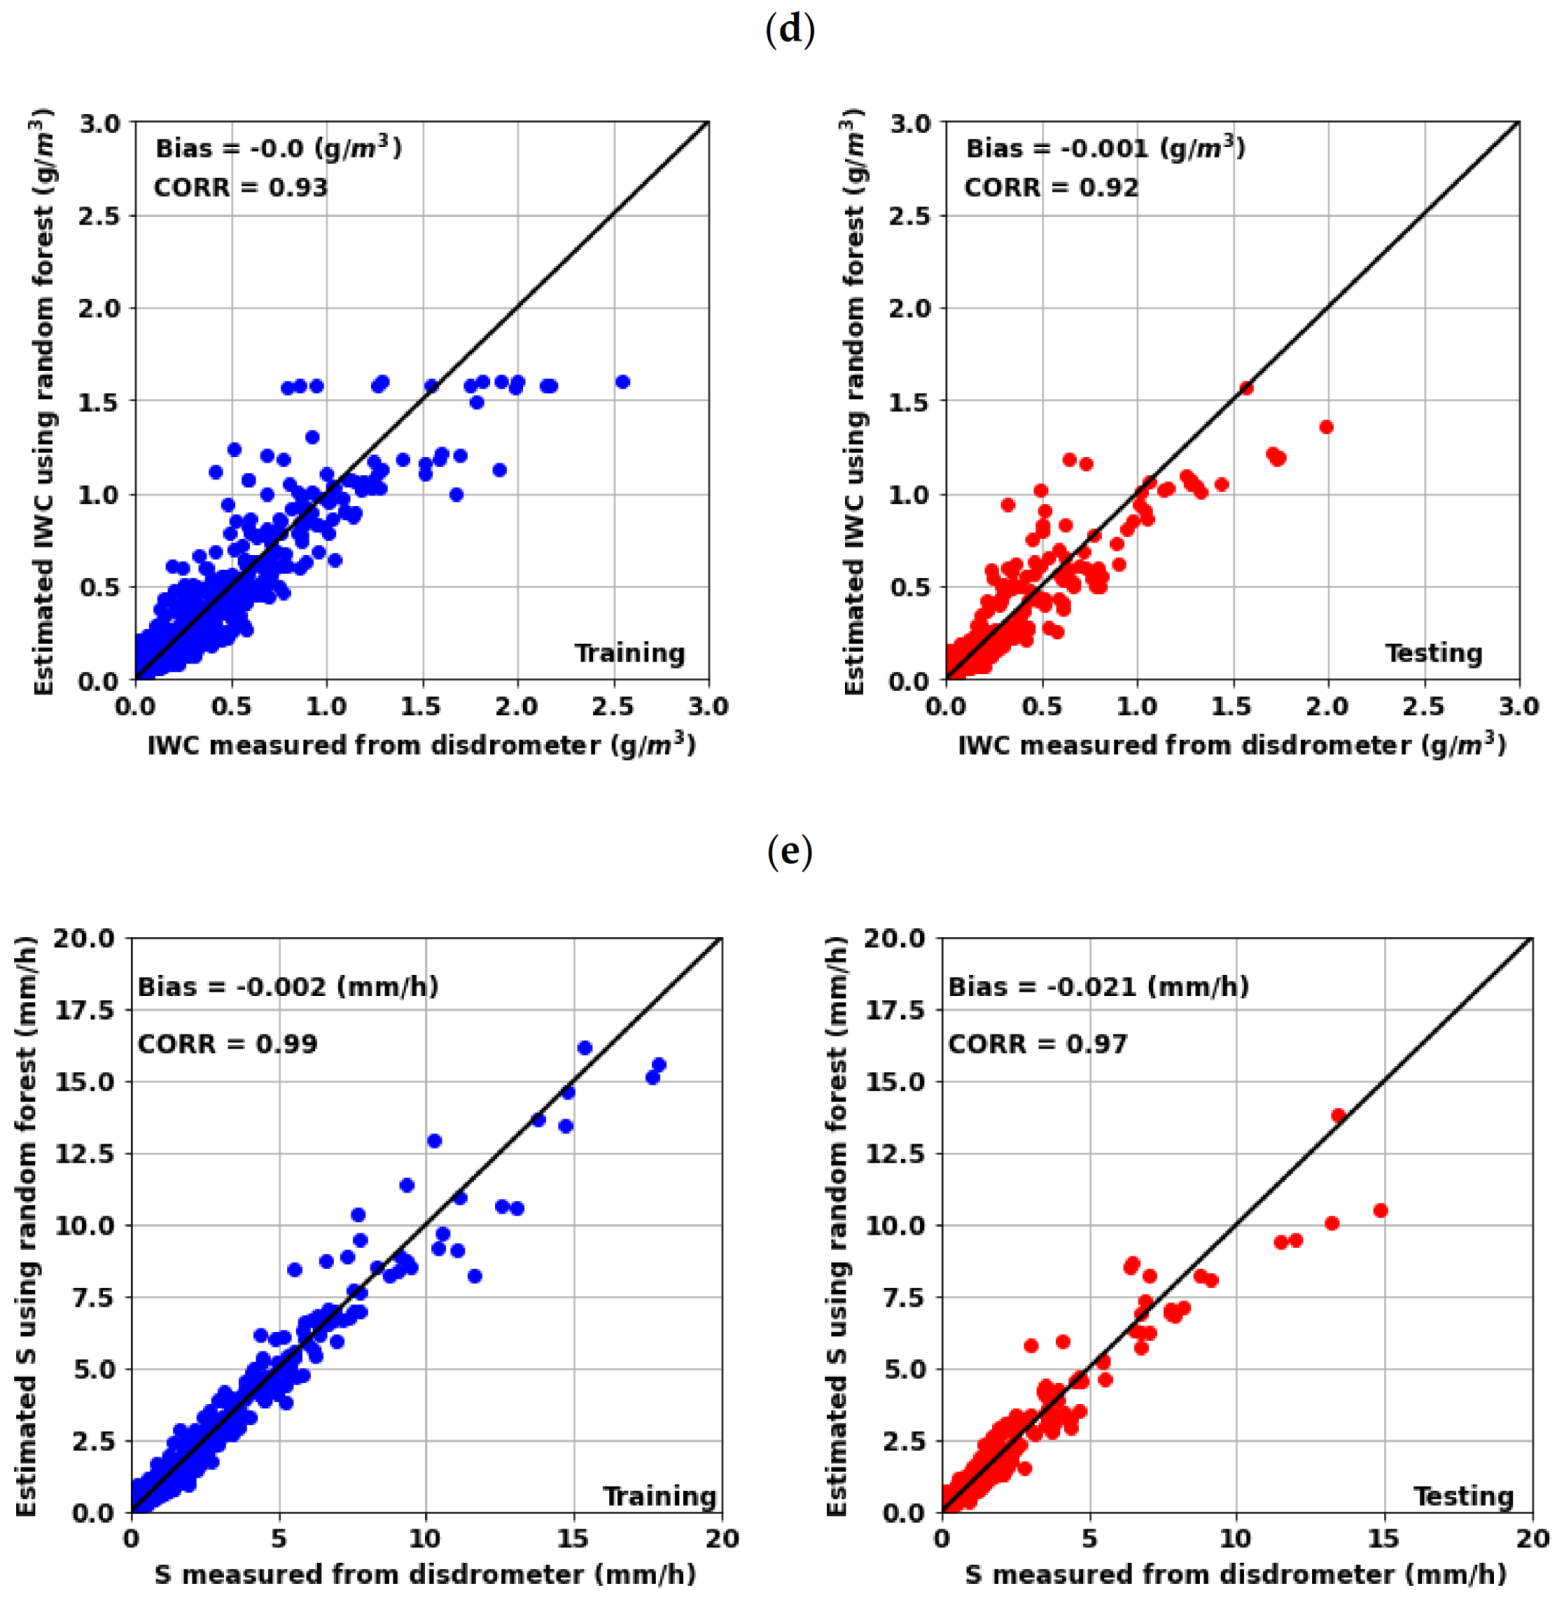
4. Evaluation of Retrievals

To evaluate the performance of the RF models, observations from the D3R radar during ICE-POP 2018 were used to retrieve the microphysical parameters using the models we developed above. The probability density of DFR and Z calculated from the PSD measurements and D3R observations are shown in Figure 6. Although there were some differences in certain regions, they matched well, generally speaking. We think that the differences are due to the fact that we assumed the snowflake as spheroid.
Figure 7 presents the distributions of the absolute error between the RF and the LUT retrievals and PSD measurements. The RF retrievals offered considerable advantages compared with the LUT method. The mean absolute error of Dm was about 0.7 mm using the RF method and about 0.75 mm using the LUT method. The mean absolute errors of log10Nw, S, and IWC using RF were 0.45 (Nw in mm−1m−3), 0.4 mm/h, and 0.10 g m−3, respectively. As for using the LUT method, the mean absolute errors of log10Nw, S, and IWC using RF were 0.9 (Nw in mm−1m−3), 1 mm/h, and 0.20 g m−3, respectively. The errors of all quantities from RF were small. The 25th and 75th absolute errors of the microphysical parameters based on RF were far less than those of the results using the LUT method.
Figure 8 shows the probability density of the microphysical parameters retrieved using RF methods. The volume-weighted diameter Dm around 2 mm (1.4 mm~2.4 mm) had the highest frequency, more than 50%. The highest frequency of log 10 N w was about 3.8 (which means that the value of Nw was 103.8 = 6310 mm−1m−3). The results with the shape factor µ smaller than 2, IWC less than 0.5 g m−3, and S less than 2 mm/h accounted for 90% of the total snowfall. To some extent, the results above have guiding significance for the microphysical parameterization of snowfall in the current numerical weather prediction models.

5. Conclusions

In this study, a conventional look-up table method and random forest method were developed to obtain dual-frequency radar retrievals of snowfall using a D3R radar during ICE-POP 2018. The DFR data, which are the differences in reflectivities at two bands, are one advantage of dual-frequency radars because they may be directly attributed to size. When compared with a single-frequency radar, this allows for more precise retrievals of microphysical parameters. The traditional dual-frequency algorithm is called the look-up table method (LUT). It adopts a fixed-snow-density model and assumes a parameter in the PSD function as a constant. This paper is the first attempt to use a dual-frequency radar to retrieve the microphysical parameters of snowfall and assess the performance of this method. The assumptions that this method adopted have effects on the accuracy of retrievals, and the absolute errors of Dm, Nw, IWC, and S are high (exceeding 50%).
The development of machine learning provides a new method for snowfall retrieval. This paper is the first to use random forest to retrieve the microphysical parameters of snowfall. In this method, no assumptions are introduced. The radar retrieval method for Dm, Nw, µ, IWC, and S is directly constructed using observations for disdrometer observations. The training and testing results show that the model developed in this paper matches the PSD observations well because of the low bias and high correlation coefficient between them. After development, evaluations showed that the retrieval results of random forest were more accurate than those of the traditional LUT method. The applications of random forest to dual-frequency radar for microphysical snowfall parameter retrieval provides a novel method, and this method is better for capturing the retrievals.

Author Contributions

Conceptualization, T.Y. and V.C.; methodology, T.Y., V.C. and L.Y.; software, L.L. and X.L.; validation, T.Y.; formal analysis and investigation, T.Y., V.C. and H.X.; data curation and resources, V.C.; writing—original draft preparation, T.Y.; writing—review and editing, V.C. and H.X.; supervision, V.C. and H.X.; project administration, L.Y.; funding acquisition, L.Y. All authors have read and agreed to the published version of the manuscript.

Funding

This paper was funded by the China Meteorological Administration Northwest Region Weather Modification Construction Research Test Project (Grant No. RYSY201902), the National Key Research and Development Plan of China (2019YFC1510304 and Grant Nos. 2016YFE0201900-02), and the National Natural Science Foundation of China (Grant No. 41575037). One of the authors, V. Chandrasekar, was supported by the NASA GPM-GV program.

Data Availability Statement

D3R radar data were provided by the National Aeronautics and Space Administration (NASA) Global Hydrology Resource Center DAAC, Huntsville, Alabama, U.S.A. Data is available at http://dx.doi.org/10.5067/GPMGV/ICEPOP/D3R/DATA101.

Acknowledgments

The authors are greatly thankful to the participants of the World Weather Research Program Research Development Project and Forecast Demonstration Project, and International Collaborative Experiments for Pyeongchang 2018 Olympic and Paralympic winter games (ICE-POP 2018), hosted by the Korea Meteorological Administration. D3R radar data were provided by the National Aeronautics and Space Administration (NASA) Global Hydrology Resource Center DAAC, Huntsville, Alabama, U.S.A. Data is available at http://dx.doi.org/10.5067/GPMGV/ICEPOP/D3R/DATA101. The authors thank the Korean Meteorological Administration (KMA) for providing the disdrometer and gauge data.

Conflicts of Interest

The authors declare no conflict of interest. The funders had no role in the design of the study; in the collection, analyses, or interpretation of data; in the writing of the manuscript, or in the decision to publish the results.

References

  1. Field, P.R.; Heymsfield, A.J. Importance of snow to global precipitation. Geophys. Res. Lett. 2015, 42, 9512–9520. [Google Scholar] [CrossRef] [Green Version]
  2. Hinzman, L.D.; Bettez, N.D.; Bolton, W.R.; Chapin, F.S.; Dyurgerov, M.B.; Fastie, C.L.; Griffith, B.; Hollister, R.D.; Hope, A.; Huntington, H.P.; et al. Evidence and implications of recent climate change in northern Alaska and other arctic regions. Clim. Change 2005, 72, 251–298. [Google Scholar] [CrossRef]
  3. Luckman, A.; Murray, T.; de Lange, R.; Hanna, E. Rapid and synchronous ice-dynamic changes in East Greenland. Geophys. Res. Lett. 2006, 33, L03503. [Google Scholar] [CrossRef]
  4. Choi, G.; Robinson, D.A.; Kang, S. Changing Northern Hemisphere Snow Seasons. J. Clim. 2010, 23, 5305–5310. [Google Scholar] [CrossRef]
  5. Muelmenstaedt, J.; Sourdeval, O.; Delanoe, J.; Quaas, J. Frequency of occurrence of rain from liquid-, mixed-, and ice-phase clouds derived from A-Train satellite retrievals. Geophys. Res. Lett. 2015, 42, 6502–6509. [Google Scholar] [CrossRef] [Green Version]
  6. Waliser, D.E.; Li, J.-L.F.; Woods, C.P.; Austin, R.T.; Bacmeister, J.; Chern, J.; Del Genio, A.; Jiang, J.H.; Kuang, Z.; Meng, H.; et al. Cloud ice: A climate model challenge with signs and expectations of progress. J. Geophys. Res. 2009, 114, D00A21. [Google Scholar] [CrossRef]
  7. Cortinas, J.V.; Bernstein, B.C.; Robbins, C.C.; Strapp, J.W. An analysis of freezing rain, freezing drizzle, and ice pellets across the United States and Canada: 1976-90. Weather. Forecast. 2004, 19, 377–390. [Google Scholar] [CrossRef]
  8. Cantrell, W.; Heymsfield, A. Production of ice in tropospheric clouds-A review. Bull. Am. Meteorol. Soc. 2005, 86, 795–807. [Google Scholar] [CrossRef] [Green Version]
  9. Lebo, Z.J.; Johnson, N.C.; Harrington, J.Y. Radiative influences on ice crystal and droplet growth within mixed-phase stratus clouds. J. Geophys. Res.-Atmos. 2008, 113, D09203. [Google Scholar] [CrossRef] [Green Version]
  10. Morrison, H.; Grabowski, W.W. A novel approach for representing ice microphysics in models: Description and tests using a kinematic framework. J. Atmos. Sci. 2008, 65, 1528–1548. [Google Scholar] [CrossRef] [Green Version]
  11. Delanoe, J.; Hogan, R.J.; Forbes, R.M.; Bodas-Salcedo, A.; Stein, T.H.M. Evaluation of ice cloud representation in the ECMWF and UK Met Office models using CloudSat and CALIPSO data. Q. J. R. Meteorol. Soc. 2011, 137, 2064–2078. [Google Scholar] [CrossRef]
  12. Morrison, H.; de Boer, G.; Feingold, G.; Harrington, J.; Shupe, M.D.; Sulia, K. Resilience of persistent Arctic mixed-phase clouds. Nat. Geosci. 2012, 5, 11–17. [Google Scholar] [CrossRef]
  13. Harrington, J.Y.; Sulia, K.; Morrison, H. A Method for Adaptive Habit Prediction in Bulk Microphysical Models. Part I: Theoretical Development. J. Atmos. Sci. 2013, 70, 349–364. [Google Scholar] [CrossRef]
  14. Klein, S.A.; Zhang, Y.; Zelinka, M.D.; Pincus, R.; Boyle, J.; Gleckler, P.J. Are climate model simulations of clouds improving? An evaluation using the ISCCP simulator. J. Geophys. Res. Atmos. 2013, 118, 1329–1342. [Google Scholar] [CrossRef]
  15. Morrison, H.; Milbrandt, J.A. Parameterization of Cloud Microphysics Based on the Prediction of Bulk Ice Particle Properties. Part I: Scheme Description and Idealized Tests. J. Atmos. Sci. 2015, 72, 287–311. [Google Scholar] [CrossRef]
  16. Stein, T.H.M.; Parker, D.J.; Hogan, R.J.; Birch, C.E.; Holloway, C.E.; Lister, G.M.S.; Marsham, J.H.; Woolnough, S.J. The representation of the West African monsoon vertical cloud structure in the Met Office Unified Model: An evaluation with CloudSat. Q. J. R. Meteorol. Soc. 2015, 141, 3312–3324. [Google Scholar] [CrossRef] [Green Version]
  17. Matrosov, S.Y. Modeling backscatter properties of snowfall at millimeter wavelengths. J. Atmos. Sci. 2007, 64, 1727–1736. [Google Scholar] [CrossRef]
  18. Liu, G. A Database of Microwave Single-Scattering Properties for Nonspherical Ice Particles. Bull. Am. Meteorol. Soc. 2008, 89, 1563–1570. [Google Scholar] [CrossRef] [Green Version]
  19. Kulie, M.S.; Bennartz, R.; Greenwald, T.J.; Chen, Y.; Weng, F. Uncertainties in Microwave Properties of Frozen Precipitation Implications for Remote Sensing and Data Assimilation. J. Atmos. Sci. 2010, 67, 3471–3487. [Google Scholar] [CrossRef] [Green Version]
  20. Petty, G.W.; Huang, W. Microwave Backscatter and Extinction by Soft Ice Spheres and Complex Snow Aggregates. J. Atmos. Sci. 2010, 67, 769–787. [Google Scholar] [CrossRef]
  21. Tyynela, J.; Leinonen, J.; Moisseev, D.; Nousiainen, T. Radar Backscattering from Snowflakes: Comparison of Fractal, Aggregate, and Soft Spheroid Models. J. Atmos. Ocean. Technol. 2011, 28, 1365–1372. [Google Scholar] [CrossRef] [Green Version]
  22. Leinonen, J.; Szyrmer, W. Radar signatures of snowflake riming: A modeling study. Earth Space Sci. 2015, 2, 346–358. [Google Scholar] [CrossRef]
  23. Lu, Y.; Jiang, Z.; Aydin, K.; Verlinde, J.; Clothiaux, E.E.; Botta, G. A polarimetric scattering database for non-spherical ice particles at microwave wavelengths. Atmos. Meas. Tech. 2016, 9, 5119–5134. [Google Scholar] [CrossRef] [Green Version]
  24. Eriksson, P.; Ekelund, R.; Mendrok, J.; Brath, M.; Lemke, O.; Buehler, S.A. A general database of hydrometeor single scattering properties at microwave and sub-millimetre wavelengths. Earth Syst. Sci. Data 2018, 10, 1301–1326. [Google Scholar] [CrossRef] [Green Version]
  25. Kuo, K.S.; Olson, W.S.; Johnson, B.T.; Grecu, M.; Tian, L.; Clune, T.L.; van Aartsen, B.H.; Heymsfield, A.J.; Liao, L.; Meneghini, R. The microwave Radiative Properties of Falling Snow Derived from Nonspherical Ice Particle Models. Part I: An Extensive Database of Simulated Pristine Crystals and Aggregate Particles, and Their Scattering Properties. J. Appl. Meteorol. Climatol. 2016, 55, 691–708. [Google Scholar] [CrossRef]
  26. Bukovčić, P.; Ryzhkov, A.; Zrnić, D.; Zhang, G. Polarimetric Radar Relations for Quantification of Snow Based on Disdrometer Data. J. Appl. Meteorol. Climatol. 2018, 57, 103–120. [Google Scholar] [CrossRef]
  27. Hassan, D.; Taylor, P.A.; Isaac, G.A. Snowfall rate estimation using C-band polarimetric radars. Meteorol. Appl. 2017, 24, 142–156. [Google Scholar] [CrossRef] [Green Version]
  28. Huang, G.-J.; Bringi, V.N.; Moisseev, D.; Petersen, W.A.; Bliven, L.; Hudak, D. Use of 2D-video disdrometer to derive mean density–size and Ze–SR relations: Four snow cases from the light precipitation validation experiment. Atmos. Res. 2015, 153, 34–48. [Google Scholar] [CrossRef]
  29. Huang, G.J.; Bringi, V.N.; Cifelli, R.; Hudak, D.; Petersen, W.A. A Methodology to Derive Radar Reflectivity-Liquid Equivalent Snow Rate Relations Using C-Band Radar and a 2D Video Disdrometer. J. Atmos. Ocean. Technol. 2010, 27, 637–651. [Google Scholar] [CrossRef]
  30. Souverijns, N.; Gossart, A.; Lhermitte, S.; Gorodetskaya, I.V.; Kneifel, S.; Maahn, M.; Bliven, F.L.; van Lipzig, N.P.M. Estimating radar reflectivity-Snowfall rate relationships and their uncertainties over Antarctica by combining disdrometer and radar observations. Atmos. Res. 2017, 196, 211–223. [Google Scholar] [CrossRef]
  31. von Lerber, A.; Moisseev, D.; Bliven, L.F.; Petersen, W.; Harri, A.-M.; Chandrasekar, V. Microphysical Properties of Snow and Their Link to Z(e)-S Relations during BAECC 2014. J. Appl. Meteorol. Climatol. 2017, 56, 1561–1582. [Google Scholar] [CrossRef]
  32. Hou, A.Y.; Kakar, R.K.; Neeck, S.; Azarbarzin, A.A.; Kummerow, C.D.; Kojima, M.; Oki, R.; Nakamura, K.; Iguchi, T. The global precipitation measurement mission. Bull. Am. Meteorol. Soc. 2014, 95, 701–722. [Google Scholar] [CrossRef]
  33. Skofronick-Jackson, G.; Hudak, D.; Petersen, W.; Nesbitt, S.W.; Chandrasekar, V.; Durden, S.; Gleicher, K.J.; Huang, G.-J.; Joe, P.; Kollias, P.; et al. Global Precipitation Measurement Cold Season Precipitation Experiment (GCPEX): For Measurement’s Sake, Let It Snow. Bull. Am. Meteorol. Soc. 2015, 96, 1719–1741. [Google Scholar] [CrossRef]
  34. Rose, C.R.; Chandrasekar, V. Extension of GPM dual-frequency iterative retrieval method with DSD-profile constraint. Ieee Trans. Geosci. Remote Sens. 2006, 44, 328–335. [Google Scholar] [CrossRef]
  35. Matrosov, S.Y. A dual-wavelength radar method to measure snowfall rate. J. Appl. Meteorol. 1998, 37, 1510–1521. [Google Scholar] [CrossRef]
  36. Szyrmer, W.; Zawadzki, I. Snow Studies. Part III: Theoretical Derivations for the Ensemble Retrieval of Snow Microphysics from Dual-Wavelength Vertically Pointing Radars. J. Atmos. Sci. 2014, 71, 1158–1170. [Google Scholar] [CrossRef]
  37. Szyrmer, W.; Zawadzki, I. Snow Studies. Part IV: Ensemble Retrieval of Snow Microphysics from Dual-Wavelength Vertically Pointing Radars. J. Atmos. Sci. 2014, 71, 1171–1186. [Google Scholar] [CrossRef]
  38. Liao, L.; Meneghini, R.; Tian, L.; Heymsfield, G.M. Retrieval of Snow and Rain From Combined X- and W-Band Airborne Radar Measurements. IEEE Trans. Geosci. Remote Sens. 2008, 46, 1514–1524. [Google Scholar] [CrossRef]
  39. Liao, L.; Meneghini, R.; Tokay, A.; Bliven, L.F. Retrieval of Snow Properties for Ku- and Ka-band Dual-Frequency Radar. J. Appl. Meteorol. Climatol. 2016, 55, 1845–1858. [Google Scholar] [CrossRef]
  40. Wang, Z.; Heymsfield, G.M.; Li, L.H.; Heymsfield, A.J. Retrieving optically thick ice cloud microphysical properties by using airborne dual-wavelength radar measurements. J. Geophys. Res.-Atmos. 2005, 110, D19201. [Google Scholar] [CrossRef] [Green Version]
  41. Huang, G.-J.; Bringi, V.N.; Newman, A.J.; Lee, G.; Moisseev, D.; Notaroš, B.M. Dual-wavelength radar technique development for snow rate estimation: A case study from GCPEx. Atmos. Meas. Tech. 2019, 12, 1409–1427. [Google Scholar] [CrossRef] [Green Version]
  42. Liao, L.; Meneghini, R.; Tokay, A.; Kim, H. Assessment of Ku- and Ka-band Dual-frequency Radar for Snow Retrieval. J. Meteorol. Soc. Jpn. 2020, 98, 1129–1146. [Google Scholar] [CrossRef]
  43. Herman, G.R.; Schumacher, R.S. Money Doesn’t Grow on Trees, but Forecasts Do: Forecasting Extreme Precipitation with Random Forests. Mon. Weather. Rev. 2018, 146, 1571–1600. [Google Scholar] [CrossRef]
  44. Chen, H.; Chandrasekar, V.; Cifelli, R.; Xie, P. A Machine Learning System for Precipitation Estimation Using Satellite and Ground Radar Network Observations. IEEE Trans. Geosci. Remote Sens. 2020, 58, 982–994. [Google Scholar] [CrossRef]
  45. Chen, H.N.; Chandrasekar, V.; Tan, H.M.; Cifelli, R. Rainfall Estimation From Ground Radar and TRMM Precipitation Radar Using Hybrid Deep Neural Networks. Geophys. Res. Lett. 2019, 46, 10669–10678. [Google Scholar] [CrossRef]
  46. Chen, H.; Sun, L.; Cifelli, R.; Xie, P. Deep Learning for Bias Correction of Satellite Retrievals of Orographic Precipitation. Ieee Trans. Geosci. Remote Sens. 2022, 60, 1–11. [Google Scholar] [CrossRef]
  47. Li, X.; Yang, Y.; Mi, J.; Bi, X.; Zhao, Y.; Huang, Z.; Liu, C.; Zong, L.; Li, W. Leveraging machine learning for quantitative precipitation estimation from Fengyun-4 geostationary observations and ground meteorological measurements. Atmos. Meas. Tech. 2021, 14, 7007–7023. [Google Scholar] [CrossRef]
  48. Moraux, A.; Dewitte, S.; Cornelis, B.; Munteanu, A. A Deep Learning Multimodal Method for Precipitation Estimation. Remote Sens. 2021, 13, 3278. [Google Scholar] [CrossRef]
  49. Peng, X.; Li, Q.; Jing, J. CNGAT: A Graph Neural Network Model for Radar Quantitative Precipitation Estimation. IEEE Trans. Geosci. Remote Sens. 2022, 60, 1–14. [Google Scholar] [CrossRef]
  50. Zhang, Y.; Bi, S.; Liu, L.; Chen, H.; Zhang, Y.; Shen, P.; Yang, F.; Wang, Y.; Zhang, Y.; Yao, S. Deep Learning for Polarimetric Radar Quantitative Precipitation Estimation during Landfalling Typhoons in South China. Remote Sens. 2021, 13, 3157. [Google Scholar] [CrossRef]
  51. Zhang, Y.; Wu, K.; Zhang, J.; Zhang, F.; Xiao, H.; Wang, F.; Zhou, J.; Song, Y.; Peng, L. Estimating Rainfall with Multi-Resource Data over East Asia Based on Machine Learning. Remote Sens. 2021, 13, 3332. [Google Scholar] [CrossRef]
  52. Conrick, R.; Zagrodnik, J.P.; Mass, C.F. Dual-Polarization Radar Retrievals of Coastal Pacific Northwest Raindrop Size Distribution Parameters Using Random Forest Regression. J. Atmos. Ocean. Technol. 2020, 37, 229–242. [Google Scholar] [CrossRef]
  53. Sekelsky, S.M.; Ecklund, W.L.; Firda, J.M.; Gage, K.S.; McIntosh, R.E. Particle Size Estimation in Ice-Phase Clouds Using Multifrequency Radar Reflectivity Measurements at 95, 33, and 2.8 GHz. J. Appl. Meteorol. 1999, 38, 5–28. [Google Scholar] [CrossRef]
  54. Yu, T.; Chandrasekar, V.; Xiao, H.; Joshil, S.S. Characteristics of Snow Particle Size Distribution in the PyeongChang Region of South Korea. Atmosphere 2020, 11, 1093. [Google Scholar] [CrossRef]
  55. Yu, T.; Chandrasekar, V.; Xiao, H.; Joshil, S.S. Snowfall Estimation Using Dual-wavelength Radar during the Pyeongchang 2018 Olympics and Paralympic Winter Games. J. Meteorol. Soc. Jpn. 2021, 99, 67–77. [Google Scholar] [CrossRef]
  56. Kim, K.; Bang, W.; Chang, E.-C.; Tapiador, F.J.; Tsai, C.-L.; Jung, E.; Lee, G. Impact of wind pattern and complex topography on snow microphysics during International Collaborative Experiment for PyeongChang 2018 Olympic and Paralympic winter games (ICE-POP 2018). Atmos. Chem. Phys. 2021, 21, 11955–11978. [Google Scholar] [CrossRef]
  57. In, S.-R.; Nam, H.-G.; Lee, J.-H.; Park, C.-G.; Shim, J.-K.; Kim, B.-J. Verification of Planetary Boundary Layer Height for Local Data Assimilation and Prediction System (LDAPS) Using the Winter Season Intensive Observation Data during ICE-POP 2018. Atmosphere 2018, 28, 369–382. [Google Scholar] [CrossRef]
  58. Jung, S.-P.; Lee, C.; Kim, J.-H.; Yang, H.J.; Yun, J.-H.; Ko, H.J.; Hong, S.-E.; Kim, S.-B. Thermodynamic Characteristics of Snowfall Clouds using Dropsonde Data During ICE-POP 2018. Atmosphere 2020, 30, 31–46. [Google Scholar] [CrossRef]
  59. Gehring, J.; Oertel, A.; Vignon, É.; Jullien, N.; Besic, N.; Berne, A. Microphysics and dynamics of snowfall associated with a warm conveyor belt over Korea. Atmos. Chem. Phys. 2020, 20, 7373–7392. [Google Scholar] [CrossRef]
  60. Battaglia, A.; Rustemeier, E.; Tokay, A.; Blahak, U.; Simmer, C. PARSIVEL Snow Observations: A Critical Assessment. J. Atmos. Ocean. Technol. 2010, 27, 333–344. [Google Scholar] [CrossRef]
  61. Kneifel, S.; von Lerber, A.; Tiira, J.; Moisseev, D.; Kollias, P.; Leinonen, J. Observed relations between snowfall microphysics and triple-frequency radar measurements. J. Geophys. Res. Atmos. 2015, 120, 6034–6055. [Google Scholar] [CrossRef] [Green Version]
  62. Chandrasekar, V. GPM Ground Validation Dual-Frequency Dual-Polarized Doppler Radar (D3R) ICE POP; NASA Global Hydrometeorology Resource Center DAAC: Huntsville, AL, USA, 2019. [Google Scholar] [CrossRef]
Figure 1. Location of Pyeongchang and the deployment of D3R and Parsivel disdrometers at three sites. D3R radar is deployed at the DGW site, and the red circle with a radius of 40 km is its coverage. Parsivel disdrometers were located at the YPO, CPO and DGW sites.
Remotesensing 14 02685 g001
Figure 2. The dual-frequency ratios DFR versus Dm (a), Nw/ZKu (b), IWC/ZKu (c), and S/ZKu (d) as a function of DFR when the densities of the aggregate are 0.06 g cm−3 (red), 0.10 g cm−3 (blue), 0.20 g cm−3 (green), and 0.30 g cm−3 (black); note that the elevation of radar is 0° and μ   = 0.
Remotesensing 14 02685 g002
Figure 3. The dual-frequency ratios DFR versus Dm (a), IWC/Zku (b), S/Zku (c), and Nw/Zku (d) as a function of DFR when the μ values are −1 (red), 0 (blue), 1 (green), and 2 (black); note that the density of the aggregate is 0.10 g cm−3.
Remotesensing 14 02685 g003aRemotesensing 14 02685 g003b
Figure 4. The absolute error normalized to the mean of Dm (a), Nw (b), IWC (c), and S (d) when the μ values are −1, 0, 1, and 2.
Remotesensing 14 02685 g004
Figure 5. Scatterplots of PSD-observed and retrieved Dm (a), Nw (b), µ (c), S (d), and IWC (e) from training (left) and testing (right). The black line is y = x.
Remotesensing 14 02685 g005aRemotesensing 14 02685 g005b
Figure 6. Probability density of DFR (a) and Z (b) from the observations of the D3R radar and calculated from PSD measurements.
Remotesensing 14 02685 g006
Figure 7. Boxplots (25, 50, and 75 percentiles) showing the absolute errors of the look-up table (LUT) and random forest (RF) method retrievals: (a) Dm, (b) Nw, (c) IWC, and (d) S, compared with PSD disdrometer measurements.
Remotesensing 14 02685 g007
Figure 8. Histograms of microphysical parameters retrieved using RF methods for total snowfall cases: (a) volume-weighted diameter Dm, (b) normalized intercept parameter, log 10 N w , (c) shape factor µ, (d) ice water content IWC, and (e) snowfall rate.
Remotesensing 14 02685 g008
Table 1. Snow events used to for analysis in this study. Meteorological conditions are listed, including the accumulation of snowfall, temperature (T), relative humidity (here abbreviated as RH), wind speed (WS), and wind direction (WD). The date is in UTC.
NO.Date and Time (UTC)Accumulation
(mm)
T
(°C)
RH
(%)
WS
(m/s)
WD
(°)
13 December 2017 00:00–23:003.18−1.186.05.0261.0
26 December 2017 10:00–19:001.99−3.381.011.0294.0
310 December 2017 00:00–16:004.16−3.772.016.0284.0
417 December 2017 17:00–24:001.38−11.050.011.0247.0
518 December 2017 00:00–13:002.39−2.573.018.0274.0
624 December 2017 00:00–16:006.29−2.295.015.0281.0
730 December 2017 11:00–23:001.80−0.277.02.0302.0
88 January 2018 00:00–20:004.74−3.273.010.0279.0
99 January 2018 13:00–21:002.24−9.664.016.0274.0
1016 January 2018 10:00–24:001.52−0.282.02.043.0
1122 January 2018 03:00–22:004.93−2.991.06.0277.0
1230 January 2018 07:00–24:003.78−8.677.010.0276.0
1322 February 2018 11:00–22:001.06−2.865.012.0261.0
1428 February 2018 00:00–24:0050.17−0.497.012.080.0
154 March 2018 15:00–24:0021.30−3.096.07.085.0
164 March 2018 00:00–09:004.72−5.591.01.087.0
177 March 2018 05:00–24:0012.59−0.990.04.078.0
188 March 2018 00:00–24:004.46−2.094.02.034.0
1916 March 2018 00:30–06:001.58−5.690.02.0286.0
2020 March 2018 18:00–24:004.45−5.888.014.088.0
2121 March 2018 00:00–14:008.59−3.795.08.054.0
Table 2. Operating parameters of D3R radar.
Parameters
FrequencyKu: 13.91 GHz ± 25 MHz
Ka: 35.56 GHz ± 25 MHz
Minimum operational range450 m
Maximum range40 km
Operational range resolution150 m
Minimum detectable signal−10 dBZ at 15 km for a single pulse at 150 m range resolution
Angular coverageAz: 0–360°, El: −0.5–90°
Table 3. The most optimal parameters used to generate the RF model to predict Dm, Nw, µ, S, and IWC.
DmNwµSIWC
NO. of trees
(n_estimators)
291091011101010710
max data per tree
(max_features)
(N)1/2(N)1/2(N)1/2(N)1/2(N)1/2
max_depth45385
min data required to create new branch
(min_samples_split)
212121421
min data per leaf
(min_samples_leaf)
10101028
Table 4. Mean absolute error, accuracy, importance of DFR, importance of Z, correlation coefficient of the training model, and correlation coefficient of the testing model.
DmNwµSIWC
Mean Absolute Error0.320.321.330.270.07
Accuracy85.77%91.62%72.96%72.93%55.75%
importance of DFR0.980.790.860.950.97
importance of Z0.020.210.140.050.03
training CORR0.890.710.80.990.93
testing CORR0.880.660.750.970.92
Publisher’s Note: MDPI stays neutral with regard to jurisdictional claims in published maps and institutional affiliations.

