Abstract
Accurate and reliable land cover information is vital for ecosystem management and regional sustainable development, especially for ecologically vulnerable areas. The South China Karst, one of the largest and most concentrated karst distribution areas globally, has been undergoing large-scale afforestation projects to combat accelerating land degradation since the turn of the new millennium. Here, we assess five recent and widely used global land cover datasets (i.e., CCI-LC, MCD12Q1, GlobeLand30, GlobCover, and CGLS-LC) for their comparative performances in land dynamics monitoring in the South China Karst during 2000–2020 based on the reference China Land Use/Cover Database. The assessment proceeded from three aspects: areal comparison, spatial agreement, and accuracy metrics. Moreover, divergent responses of overall accuracy with regard to varying terrain and geomorphic conditions have also been quantified. The results reveal that obvious discrepancies exist amongst land cover maps in both area and spatial patterns. The spatial agreement remains low in the Yunnan–Guizhou Plateau and heterogeneous mountainous karst areas. Furthermore, the overall accuracy of the five datasets ranges from 40.3% to 52.0%. The CGLS-LC dataset, with the highest accuracy, is the most accurate dataset for mountainous southern China, followed by GlobeLand30 (51.4%), CCI-LC (50.0%), MCD12Q1 (41.4%), and GlobCover (40.3%). Despite the low overall accuracy, MCD12Q1 has the best accuracy in areas with an elevation above 1200 m or a slope greater than 25°. With regard to geomorphic types, accuracy in non-karst areas is evidently higher than in karst areas. Additionally, dataset accuracy declines significantly (p < 0.05) with an increase in landscape heterogeneity in the region. These findings provide useful guidelines for future land cover mapping and dataset fusion.
1. Introduction
The information on global land cover (LC) change is an important proxy for understanding the complex interaction between human activities and global change [1]. It is also the basic input parameter for land surface simulations, atmosphere coupling models, and ecosystem models [2,3]. Global land cover is of great significance for the study of the ecological environment, climate change, and sustainable development [4,5,6]. Therefore, an accurate LC dataset is an important basis for scientific research in the fields of ecological environment monitoring and sustainable development.
Over the past few decades, much effort has been dedicated to developing global LC maps at various temporal and spatial resolutions. Currently, relatively new and widely used global land cover datasets include (1) the Moderate Resolution Imaging Spectroradiometer (MODIS) LC dataset (MCD12Q1 and MOD12Q1) at 500/1000 m resolution, updated yearly since 2001 [7,8]; (2) the Climate Change Initiative LC dataset (CCI-LC) from the European Space Agency (ESA) at 300 m resolution, also annually updated but from 1992 [9]; (3) the Global Land Cover Map (GlobCover) from the ESA at 300 m resolution for 2005 and 2009 [10]; (4) GlobeLand30 from the National Geomatics Center of China at 30 m resolution for 2000, 2010, and 2020 [11]; and (5) Copernicus Global Land Service land cover maps (CGLS-LC) at 100m resolution, covering 2015–2019 [12].
Because these datasets are produced by different countries and organizations, they exist as independent datasets and cannot be directly compared because of different classification schemes and methods used. Moreover, the different datasets have varying degrees of uncertainty, which may not be fully applicable to all types of research. Users do not know which land cover dataset (including accuracy and thematic content) is the optimal choice before applying the dataset [13,14,15,16]. Therefore, it is particularly important to assess the accuracy and regional applicability of different global LC datasets.
The South China Karst is one of the largest contiguous exposed carbonate rock areas globally, which covers eight provinces of China, with a total area of 1.93 million km2 and carbonate rocks area of 540,000 km2 [17]. The population density is 207 people/km2, which is 1.5 times the national average population density in China and more than twice the theoretical maximum population density in the karst region (100 people/km2) [18]. Intense pressure from human activity (such as deforestation and reclamation, steeply sloped cultivation, commercial logging, overgrazing, firewood harvesting, etc.) has resulted in serious vegetation loss and soil erosion, leading to severe rocky desertification [19,20]. Rocky desertification refers to the process of land degradation in karst areas originally covered with vegetation and soil transformed into desert-like landscapes with large areas of exposed rock [21]. According to the latest monitoring results of China’s Third National Bulletin on Rocky Desertification, the area of rocky desertification took up to 100,700 km2, or 22.3%, of the karst area in southern China as of 2016 [18]. Meanwhile, since 2000, to curb the further degradation of rocky desertification land in karst areas and to promote regional ecological restoration, the Chinese government has invested up to 19 billion US dollars and successively set up a series of ecological engineering projects in karst areas. These projects include the National Natural Forest Protection Program, the Grain for Green Project, and the Rocky Desertification Comprehensive Treatment, aimed at transforming steeply sloped croplands and rocky desertification areas into forests and grasslands [22]. Official statistics show that from 2002 to 2015, an average of 19,183 km2 of trees were planted in southern China every year (which also includes replanting on harvested plantations), especially on sloped croplands with topographic slopes of more than 25° [23]. During the implementation of the second largest program, namely the Rocky Desertification Comprehensive Treatment, the artificial afforestation area reached 5300 km2, and 15,700 km2 were naturally restored by the mountain closure for reforestation between 2008 and 2015 [24].
In the context of large-scale ecological restoration and afforestation projects, the karst rocky desertification area in southern China shows a declining trend, and the region is faced with the transformation from traditional, high-intensity human disturbances to large-scale natural restoration and artificial afforestation [25]. As a consequence, complex land cover changes with different change directions have taken place in the region over the last 20 years. Nevertheless, the spatial extent of these anthropogenic land cover changes remains largely unclear. Despite the fact that an increasing number of global LC products have emerged over the past few decades, these global datasets may, however, disagree on local and regional scales. Their accuracy and applicability in quantifying regional land cover dynamics need further assessment since the methods and algorithms for generating these products vary [8,11,26,27,28]. Considering the characteristics of large topographic relief, complex geomorphological types, and the high degree of landscape heterogeneity in the karst area of southern China, the demand for accurate land cover data in this area is increasingly urgent. Therefore, it is necessary to systematically assess the accuracy and applicability of global land cover products in this region in order to support regional scientific research, such as land degradation, ecosystem services assessment, biodiversity, and conservation and climate modeling. In addition, this would empower researchers to select more targeted and appropriate LC data products according to their specific application needs, such as biodiversity research for a specific elevational gradient, if they were well informed of the characteristics of each LC dataset.
However, at present, accuracy assessments of land cover datasets are primarily conducted at the global, continental, or national level [29,30,31,32], or targeted for a specific land cover type [33,34,35]. There are few reports of comprehensive and detailed fine-scale accuracy assessments for different land types, especially in the karst area, which greatly limits scientific research with land cover utilized as an important input parameter in this region. Additionally, most studies only focus on land cover products in a given year. Considering the dynamic update of the datasets, an accuracy assessment based on a single year is not comprehensive enough, and it is thus difficult to meet the needs of practical application.
The purpose of this paper is to assess the accuracy of the existing common global LC datasets in the karst areas of southern China, including the Climate Change Initiative LC dataset (CCI-LC), the MODIS LC dataset (MCD12Q1), GlobeLand30, the Global Land Cover Map (GlobCover), and Copernicus Global Land Service land cover maps (CGLS-LC). The specific research objectives include three aspects: (1) investigating the differences in the area and spatial patterns of each land type for the five global LC datasets during the period of 2000–2020; (2) elucidating the spatial agreement among the different LC maps and its changes over time; and (3) evaluating the accuracy of the LC datasets from different dimensions, such as landform type, elevation, and slope, and quantitatively assess the impact of spatial heterogeneity on the accuracy. Through these three aspects, the applicability of these datasets in karst areas is comprehensively assessed, and suitable datasets are recommended for different application scenarios.
2. Materials and Methods
2.1. Study Area
The South China Karst is one of the largest contiguous areas of exposed carbonate rocks in the world, including the eight provinces of Guangxi, Guangdong, Sichuan, Chongqing, Yunnan, Hunan, Hubei, and Guizhou, with a total area of 1.93 million km2, of which the karst area is about 540,000 km2 (Figure 1). The region traverses the three-tiered scale of Chinese relief, with high terrain in the west and low in the east. This region includes many first-class geomorphological units, such as the western Sichuan Plateau, the Yunnan–Guizhou Plateau, the Hengduan Mountains, the Sichuan Basin, the Dongting Lake Plain, the Liangguang Hills, etc. The types of karst landforms are diverse; the terrain is rugged and has a high degree of landscape heterogeneity. Furthermore, the types of ecosystems are diverse, mainly comprising mixed coniferous and deciduous forests, evergreen deciduous forests, shrubs, grasslands, agricultural lands, and alpine meadows. Most of the regions have a subtropical monsoon climate, with an average annual temperature of over 15 °C and average annual precipitation of over 1100 mm. Restrained by the special geological environment of the karst, the ecosystem in the South China Karst is very fragile. Under the interference of unreasonable human activities for decades, the serious problems of rocky desertification and land degradation in the region have emerged.
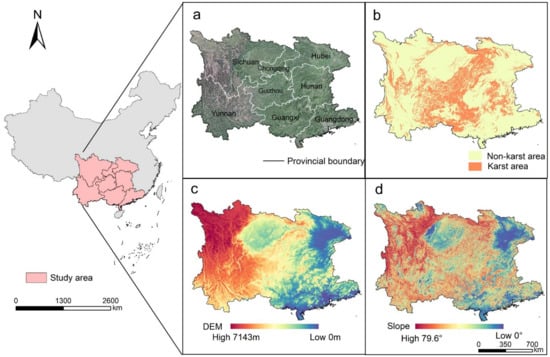
Figure 1.
The location of the study area in China. (a) Provincial boundaries and Google Earth image of the study area; (b) distribution map of karst and non-karst areas; (c) elevation; (d) terrain slope distribution within the study area.
2.2. Datasets
2.2.1. Global Land Cover Datasets
This study focuses on evaluating five recent global land cover datasets regarding their performances in the South China Karst, with information in the datasets explained in detail below and summarized in Table 1.

Table 1.
Summary of the five global land cover datasets assessed in this study.
The MODIS Collection 6 land cover type product (MCD12Q1) is produced by NASA and obtained by supervised classification of MODIS Terra and Aqua reflectance data. Based on the International Geosphere Biosphere Program (IGBP) classification system, MCD12Q1 has a resolution of 500 m, and its overall accuracy is 70–80% on a global scale [36]. The dataset covers the period from 2001 to 2018.
GlobeLand30 is the product developed based on the pixel–object–knowledge (POK)-based classification approach using a classification scheme consisting of 10 first-level classes led by the National Geomatics Centre of China (NGCC). The dataset has a spatial resolution of 30 m and global coverage for 2000, 2010, and 2020, with an overall accuracy of 80–85% [11,37].
GlobCover is generated by the ESA and adopts a hierarchical legend based on the Food and Agriculture Organization (FAO) of the United Nations Land Cover Classification System (UN FAO LCCS). The spatial resolution is 300 m, and the overall accuracy is 60% to 70% [10,38]. The dataset is produced for epochs 2005 and 2009. In this study, we only used the 2009 LC map for assessment.
CCI-LC is also produced by the ESA. The classification combines the supervised and unsupervised classification of images from the Medium Resolution Imaging Spectrometer (MERIS). It was built based on the experiences of the GlobCover project. Different from the GlobCover dataset, CCI-LC spans from 1992 to 2020 at an annual scale. The UN-LCCS classification system is used, with a spatial resolution of 300 m and an overall accuracy of 70–75% [9].
CGLS-LC is produced using the supervised classification method based on the UN LCCS classification system. CGLS LC maps are provided for the period 2015–2019 over the entire globe. The spatial resolution is 100 m and the overall accuracy is 80% to 85% [12,39,40].
Taking into account the proximity of dataset phases, the LC maps assessed in this study can be divided into four epochs: 2000 (CCI-LC 2000, MCD12Q1 2001, GlobeLand30 2000), 2010 (CCI-LC 2010, GlobCover 2009, MCD12Q1 2010, GlobeLand30 2010), 2015 (CCI-LC 2015, MCD12Q1 2015, CGLS-LC 2015), and 2020 (CGLS-LC 2019, CCI-LC 2020, GlobeLand30 2020).
2.2.2. Reference Land Cover Datasets
This study used the China Land Use/Cover Database (CLUD) as a reference to validate the five global land cover datasets over the South China Karst. The first version of the CLUD dataset for 1995 was established by the Chinese Academy of Sciences (CAS) in 1998, which pooled the decadal efforts of eight research institutes of the CAS and about 100 scientists [41]. Since then, this dataset has been continuously updated at an interval of five years, including 2000, 2005, 2010, 2015, 2020, and was also expanded backward to the late 1970s and 1980s, making it the longest timeseries dataset available for land use and land cover changes at the national scale over China [42]. This dataset utilized Landsat MSS, TM, ETM+, and OLI imagery as the main data sources, and the China Brazil Earth Resources Satellite (CBERS) and Environment Satellite 1 (HJ-1) as alternatives to fill gaps where Landsat data were unavailable or of poor quality. The visual interpretation was applied to satellite images to derive the 1:100,000-scale high-resolution national land use/cover database (i.e., CLUD) based on professional knowledge and established interpretation symbols. Specifically, technically supported by geographical information system (GIS) software, remote sensing experts manually interpreted the LC types based on the texture, structure, color, and spectral reflectance, combined with auxiliary information such as terrain, soil types, and climate. A hierarchical classification system was adopted during the interpretation process, which contains six first-level classes (cropland; woodland; grassland; waterbodies; build-up land; unused land) and 25 subclasses. Repeated interpretation by different professionals and intensive field verification were conducted to ensure the interpretation quality. The accuracy of the six first-level classes of land cover for CLUD exceeds 94.3%, and the overall accuracy of the 25 subclasses is above 91.2% [41,43,44], which is the highest accuracy among the national-scale LC data products over China. It has been the main authoritative data source for land cover change studies in China [5,45].
2.2.3. Auxiliary Data
To quantify differences in the performances of various global LC datasets in relation to terrain and landforms, this study also used the digital elevation model (DEM), topographic slope, and geomorphological data to aid in the accuracy analysis in dimensions of elevation, slope gradients, and landform types. Specifically, DEM data were derived from Shuttle Radar Topography Mission (SRTM) DEM with a spatial resolution of 90 m, freely downloaded from the Geospatial Data Cloud (https://www.gscloud.cn/ (accessed on 16 January 2021)). The topographic slope was calculated based on the DEM using ArcGIS 10.2 software. A vector-based map of karst and non-karst landform distribution areas, produced through the integrated use of geological maps, intensive field surveys, and high-resolution satellite images, was obtained from the Institute of Karst Geology, Chinese Academy of Geological Sciences (http://www.karst.cgs.gov.cn/ (accessed on 18 January 2021)). Moreover, vector data on city and provincial boundaries in South China were derived from the National Geomatics Centre of China (http://www.ngcc.cn/ngcc/ (accessed on 19 January 2021)).
2.3. Methods
In this study, the assessment proceeded from three aspects: areal comparison, spatial agreement, and accuracy. In addition to the overall accuracy evaluation for the entire South China Karst region and individual provinces, the accuracy assessment was also carried out in three other aspects: elevation gradients-based, topographic slope gradients-based, and geomorphic type-based.
2.3.1. Legend Harmonization
A unified LC classification scheme is the basis for assessing the accuracy of different datasets. Given that the classification systems of each LC dataset vary, it is impossible to compare them directly. Hence, this study referred to the classification scheme of the referenced CLUD dataset and aggregated all classification systems into nine LC types, namely, woodland, shrubland, grassland, cropland, wetlands, urban, permanent snow and ice, bare areas, and waterbodies. The new classification scheme minimized the impact of classification details and differences in land cover types as much as possible to better assess LC datasets. The specific classification scheme is shown in Table 2.
Table 2.
Reclassification schemes employed in the six LC datasets.
2.3.2. Areal Comparison
The first step of our dataset comparison was to compare the global LC datasets with each other in terms of the area discrepancy of different land types. To accurately calculate the area, all LC datasets were reprojected on the Asia North Albers Equivalent Conical Projection with the first standard parallel, 25°N, the second standard parallel, 47°N, and the central meridian, 105°E [46]. The datasets were sliced from the boundary data of eight provinces in southern China (Chongqing, Guangdong, Guangxi, Guizhou, Hubei, Hunan, Sichuan, and Yunnan). Area statistics for the nine cover types of all six LC datasets were conducted in the Esri ArcGIS 10.2 software (Redlands, CA, USA) environment.
2.3.3. Spatial Agreement Analysis
Owing to the inconsistent spatial resolution of different global LC datasets, it was necessary to resample the datasets to the same spatial unit. Considering that spatial resolution difference among LC datasets is large (ranging from 30 m to 500 m), the nearest neighbor resampling method may lead to errors. Some studies have shown that the maximum area resampling method is more applicable to discrete LC data [30,47]. Therefore, this study resampled five global LC datasets to 1 km resolution under the majority rule.
Spatial agreement analysis aims to reveal spatial discrepancies and similarities among different datasets, which was performed by generating an agreement map using all LC datasets [13]. This can help to illuminate areas of uncertainty in global LC maps and elucidate patterns of spatial correspondence [48]. Specifically, agreement maps were produced with Boolean comparison using spatial overlay analysis on a pixel-by-pixel basis for the periods of 2000, 2010, 2015, and 2020. Pixels with the same land cover type were labeled as agreement, and pixels with different types were labeled as disagreement. In this way, the number of different datasets matching land cover types was determined at the pixel scale.
In addition, with regard to the division of degree of consistency, there were four levels in the 2000, 2015, and 2020 epochs, since only three global LC datasets and a reference CLUD dataset were assessed during these periods, which included full agreement (four datasets were consistent), high agreement (three datasets were consistent), low agreement (two datasets were consistent) and no agreement (no datasets were consistent). Contrastingly, there were five datasets in epoch 2010, and consistency was divided into five levels, including full agreement (five datasets were consistent), high agreement (four datasets were consistent), medium agreement (three datasets were consistent), low agreement (two datasets were consistent), and no agreement (no datasets were consistent).
2.3.4. Accuracy Evaluation
To comprehensively analyze the temporal and spatial distribution and accuracy change characteristics of global LC datasets in southern China, this study assessed the accuracy of datasets in four epochs from the following dimensions, that is, regional and provincial-scale accuracy assessment, accuracy assessment with rising elevational gradients and topographic slope gradients, and accuracy variations between different geomorphological types (karst and non-karst areas). In detail, the elevation was stratified into five levels, including less than 250 m, 250–500 m, 500–800 m, 800–1200 m, and higher than 1200 m. Meanwhile, the topographic slope was stratified into flat (<6°), gently sloping (6–15°), sloping (15–25°), and steeply sloping (>25°). As described above, all LC datasets were resampled to 1 km resolution and accuracy was assessed based on the confusion matrix. The confusion matrix is a commonly used accuracy assessment method to validate the accuracy of LC data [49,50,51]. The confusion matrix can calculate the overall accuracy, user’s accuracy, and producer’s accuracy. The calculation formulas are as follows:
where is the total number of pixels, represents the number of class pixels correctly classified, is the sum of class pixels in the reference data, and is the sum of class pixels in the data to be verified.
2.3.5. Weighted Complexity of Land Cover
In this study, we used the indicator of weighted complexity of land cover to quantify the impacts of landscape heterogeneity on the accuracy of global land cover datasets [31]. The number of different LC types in the 10 × 10-pixel window around each pixel is defined as the LC type complexity of the central pixel. The complexity of land cover types in a region is termed weighted LC complexity. Nine land cover types were obtained by reclassification in this study, so the complexity range of LC types spans from one to nine. The formula for calculating the weighted complexity of LC in a specific region is as follows:
where is the weighted LC complexity, is the LC type complexity, and is the area with the complexity of land cover type, .
3. Results
3.1. Areal Comparison
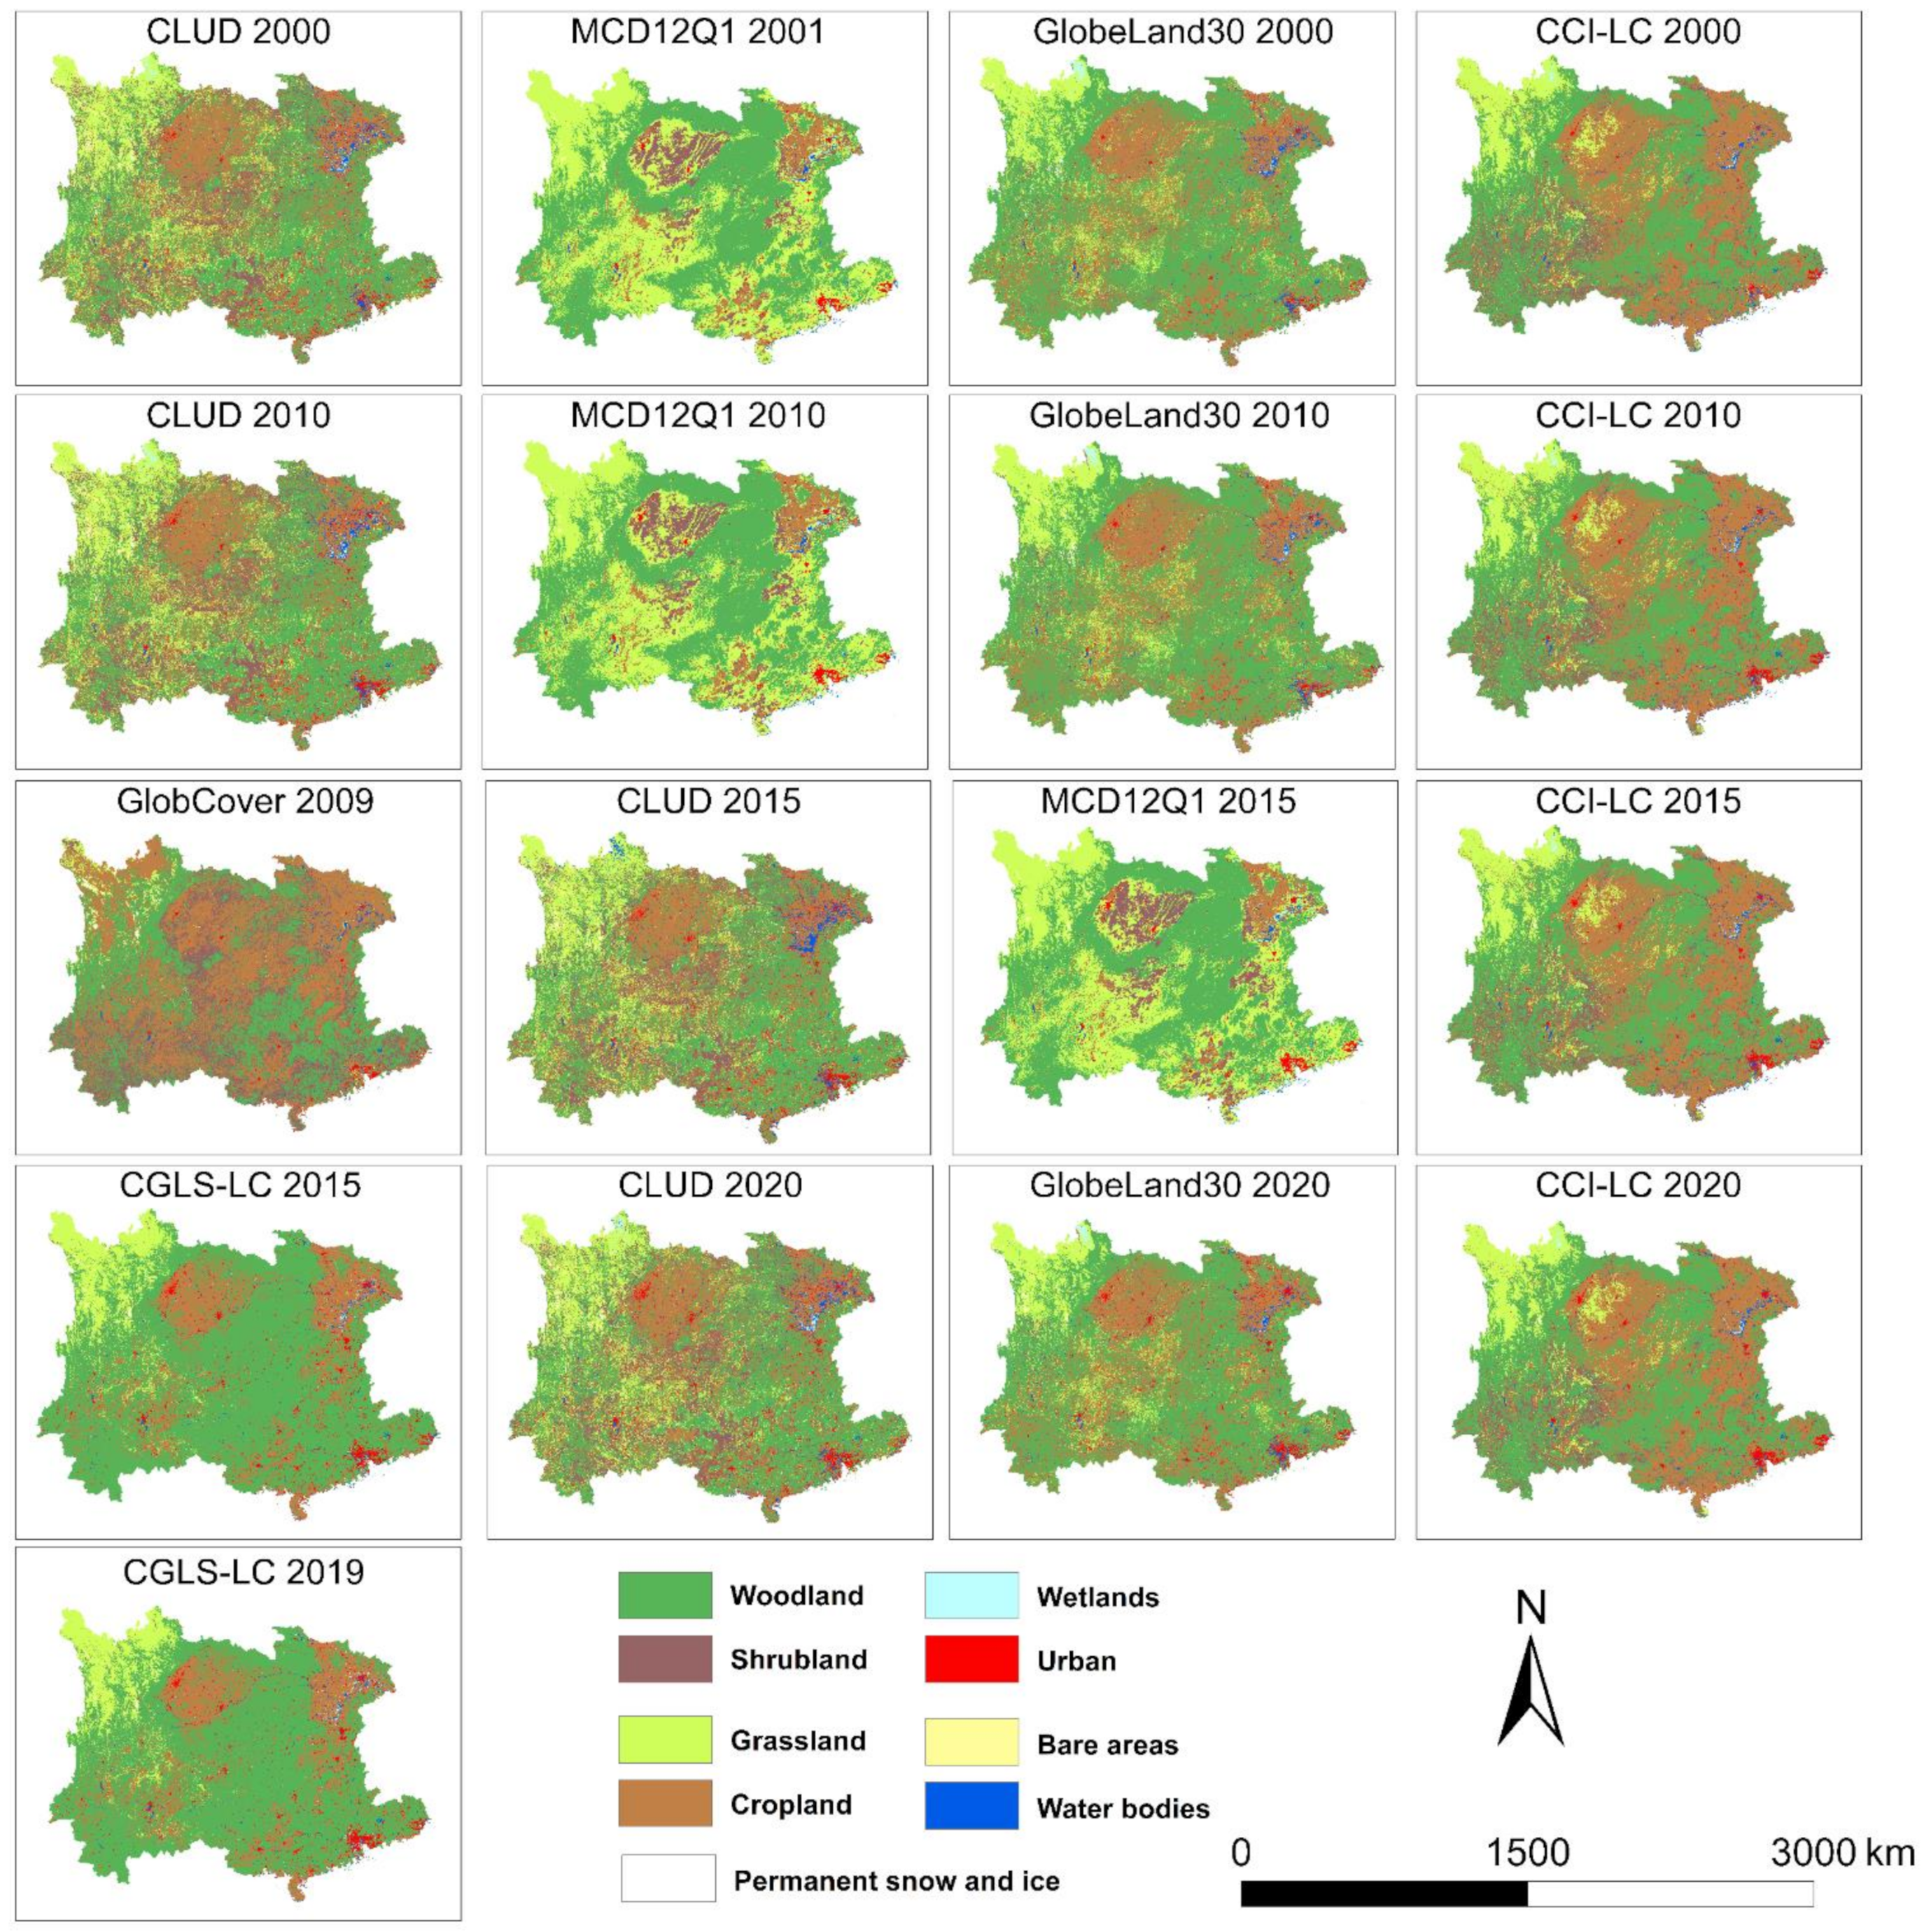
Figure 2 shows the spatial patterns of land cover classes among the six land cover maps during the four periods. Overall, the general spatial patterns for each class show both similarities and discrepancies among different datasets based on visual comparison. Figure 3 illustrates the area ratios for each land cover type for different global land cover datasets at the original spatial resolution in different years. The specific results are depicted below.

Figure 2.
Spatial patterns of the five global LC products and the CLUD dataset in a unified, nine-class scheme in southern China over 2000–2020.
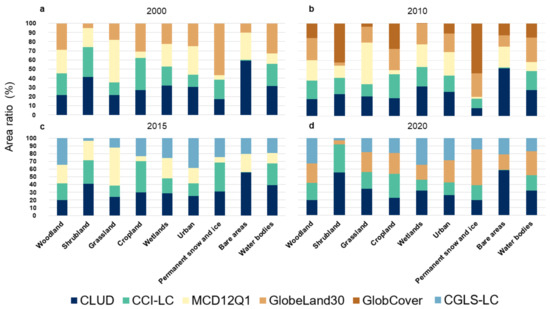
Figure 3.
Area ratio of each class type in the six land cover products for epochs (a) 2000, (b) 2010, (c) 2015, and (d) 2020.
Woodland: In the South China Karst, the woodland cover type is widely distributed. The woodland area of the CCI-LC and MCD12Q1 datasets is similar but higher than the CLUD and GlobCover datasets, and it is lower than that of GlobeLand30 and CGLS-LC datasets. According to the analysis of Table A1, the area of woodland counted by the reference CLUD dataset is lower than that of other datasets except GlobCover, which is possibly attributable to the inconsistent classification schemes. The CGLS-LC dataset has the largest area of woodland (1,269,967 km2 in 2015 and 1,241,843 km2 in 2019). Due to the comprehensive and detailed classification of woodland in its classification system, 12 subclasses are related to woodland. Compared to other datasets, the area of woodland may be overestimated in the CGLS-LC dataset. According to the trend of woodland area from 2000 to 2020, the woodland area in most datasets continues to grow and reaches the maximum in 2020, which is likely related to the national afforestation projects starting in 2000 in China.
Shrubland: According to the statistical results of the dataset (Table A1), the area of shrubland in the karst of southern China is stable and shows a general downward trend from 2000 to 2020. The area of shrubland in the CLUD dataset is similar to the CCI-LC dataset, higher than the MCD12Q1 dataset, and far larger than the GlobeLand30 and CGLS-LC datasets. Although the classification scheme of the GlobCover dataset is similar to that of the CCI-LC dataset, the area of shrubland is more than twice the amount of the CCI-LC dataset.
Grassland: The northwest plateau area of southern China is the main distribution area of grassland. The change in grassland area is small from 2000 to 2020. However, the area of grassland varies considerably among different datasets. For instance, the area of grassland in the MCD12Q1 LC dataset is two to twelve times the amount of the counterpart in other datasets in the same epoch. Due to differences in classification schemes or the influence of mosaic pixels, some sparse woodland or cropland may be mixed with grassland types.
Cropland: In the spatial domain, cropland is mainly distributed in the Sichuan Basin and the Plain of Hubei and Hunan. Generally speaking, the area of cropland remains relatively stable except for MCD12Q1 and CGLS-LC datasets. The area of cropland counted in the MCD12Q1 dataset is much lower than other datasets, which seriously underestimates the area of cropland. It is demonstrated in Figure 3 that the proportion of cropland in the four datasets in epoch 2020 is close, and the cropland area of CCI-LC is slightly higher.
Urban: From 2000 to 2020, due to rapid urban development, urban area continued to increase in all LC datasets except CGLS-LC. The urban area in the CLUD, MCD12Q1, and GlobeLand30 datasets is similar, the urban area in the CCI-LC dataset is small, and the CGLS-LC had the largest urban area (59,542 km2) in 2015. By contrast, the lowest urban area was found in GlobCover 2009 compared to other datasets in epoch 2010.
Permanent snow and ice: Permanent snow and ice are rarely covered in southern China, with no more than 6000 km2 (or 0.3% of total area) spreading across the western Sichuan Plateau. The area of permanent snow and ice in the CLUD, CCI-LC, and CGLS-LC datasets is similar, the MCD12Q1 dataset is significantly lower, and in the GlobeLand30 and GlobCover datasets, it is higher than the other datasets.
Bare areas: From 2000 to 2020, the area of bare land gradually decreased. In all LC datasets, the bare land area in the CLUD dataset is over 14,000 km2, which is far greater than other datasets. The average area of bare land in the CCI-LC dataset is only 268 km2, which may be seriously underestimated. The proportion of bare land in other datasets is similar.
Wetlands: Overall, the area of wetlands in southern China is small, less than 1% of the total area. Furthermore, the area difference among the various datasets is small. Among them, the largest area of wetlands was found in CGLS-LC, achieving 10,154 km2 in 2019, followed by CLUD 2020 (9263 km2) and MCD12Q1 2015 (8301 km2). By comparison, GlobCover 2009 had the lowest area of wetlands, attaining only 100 km2, which is likely seriously underestimated.
Waterbodies: Likewise, the area of waterbodies in southern China is small, accounting for less than 2% of the total area, mainly located in the plain area of the middle reaches of the Yangtze River. The area of waterbodies in CLUD and GlobeLand30 is close, while the water area in MCD12Q1, CGLS-LC, and GlobCover is relatively low.
3.2. Spatial Agreement Analysis
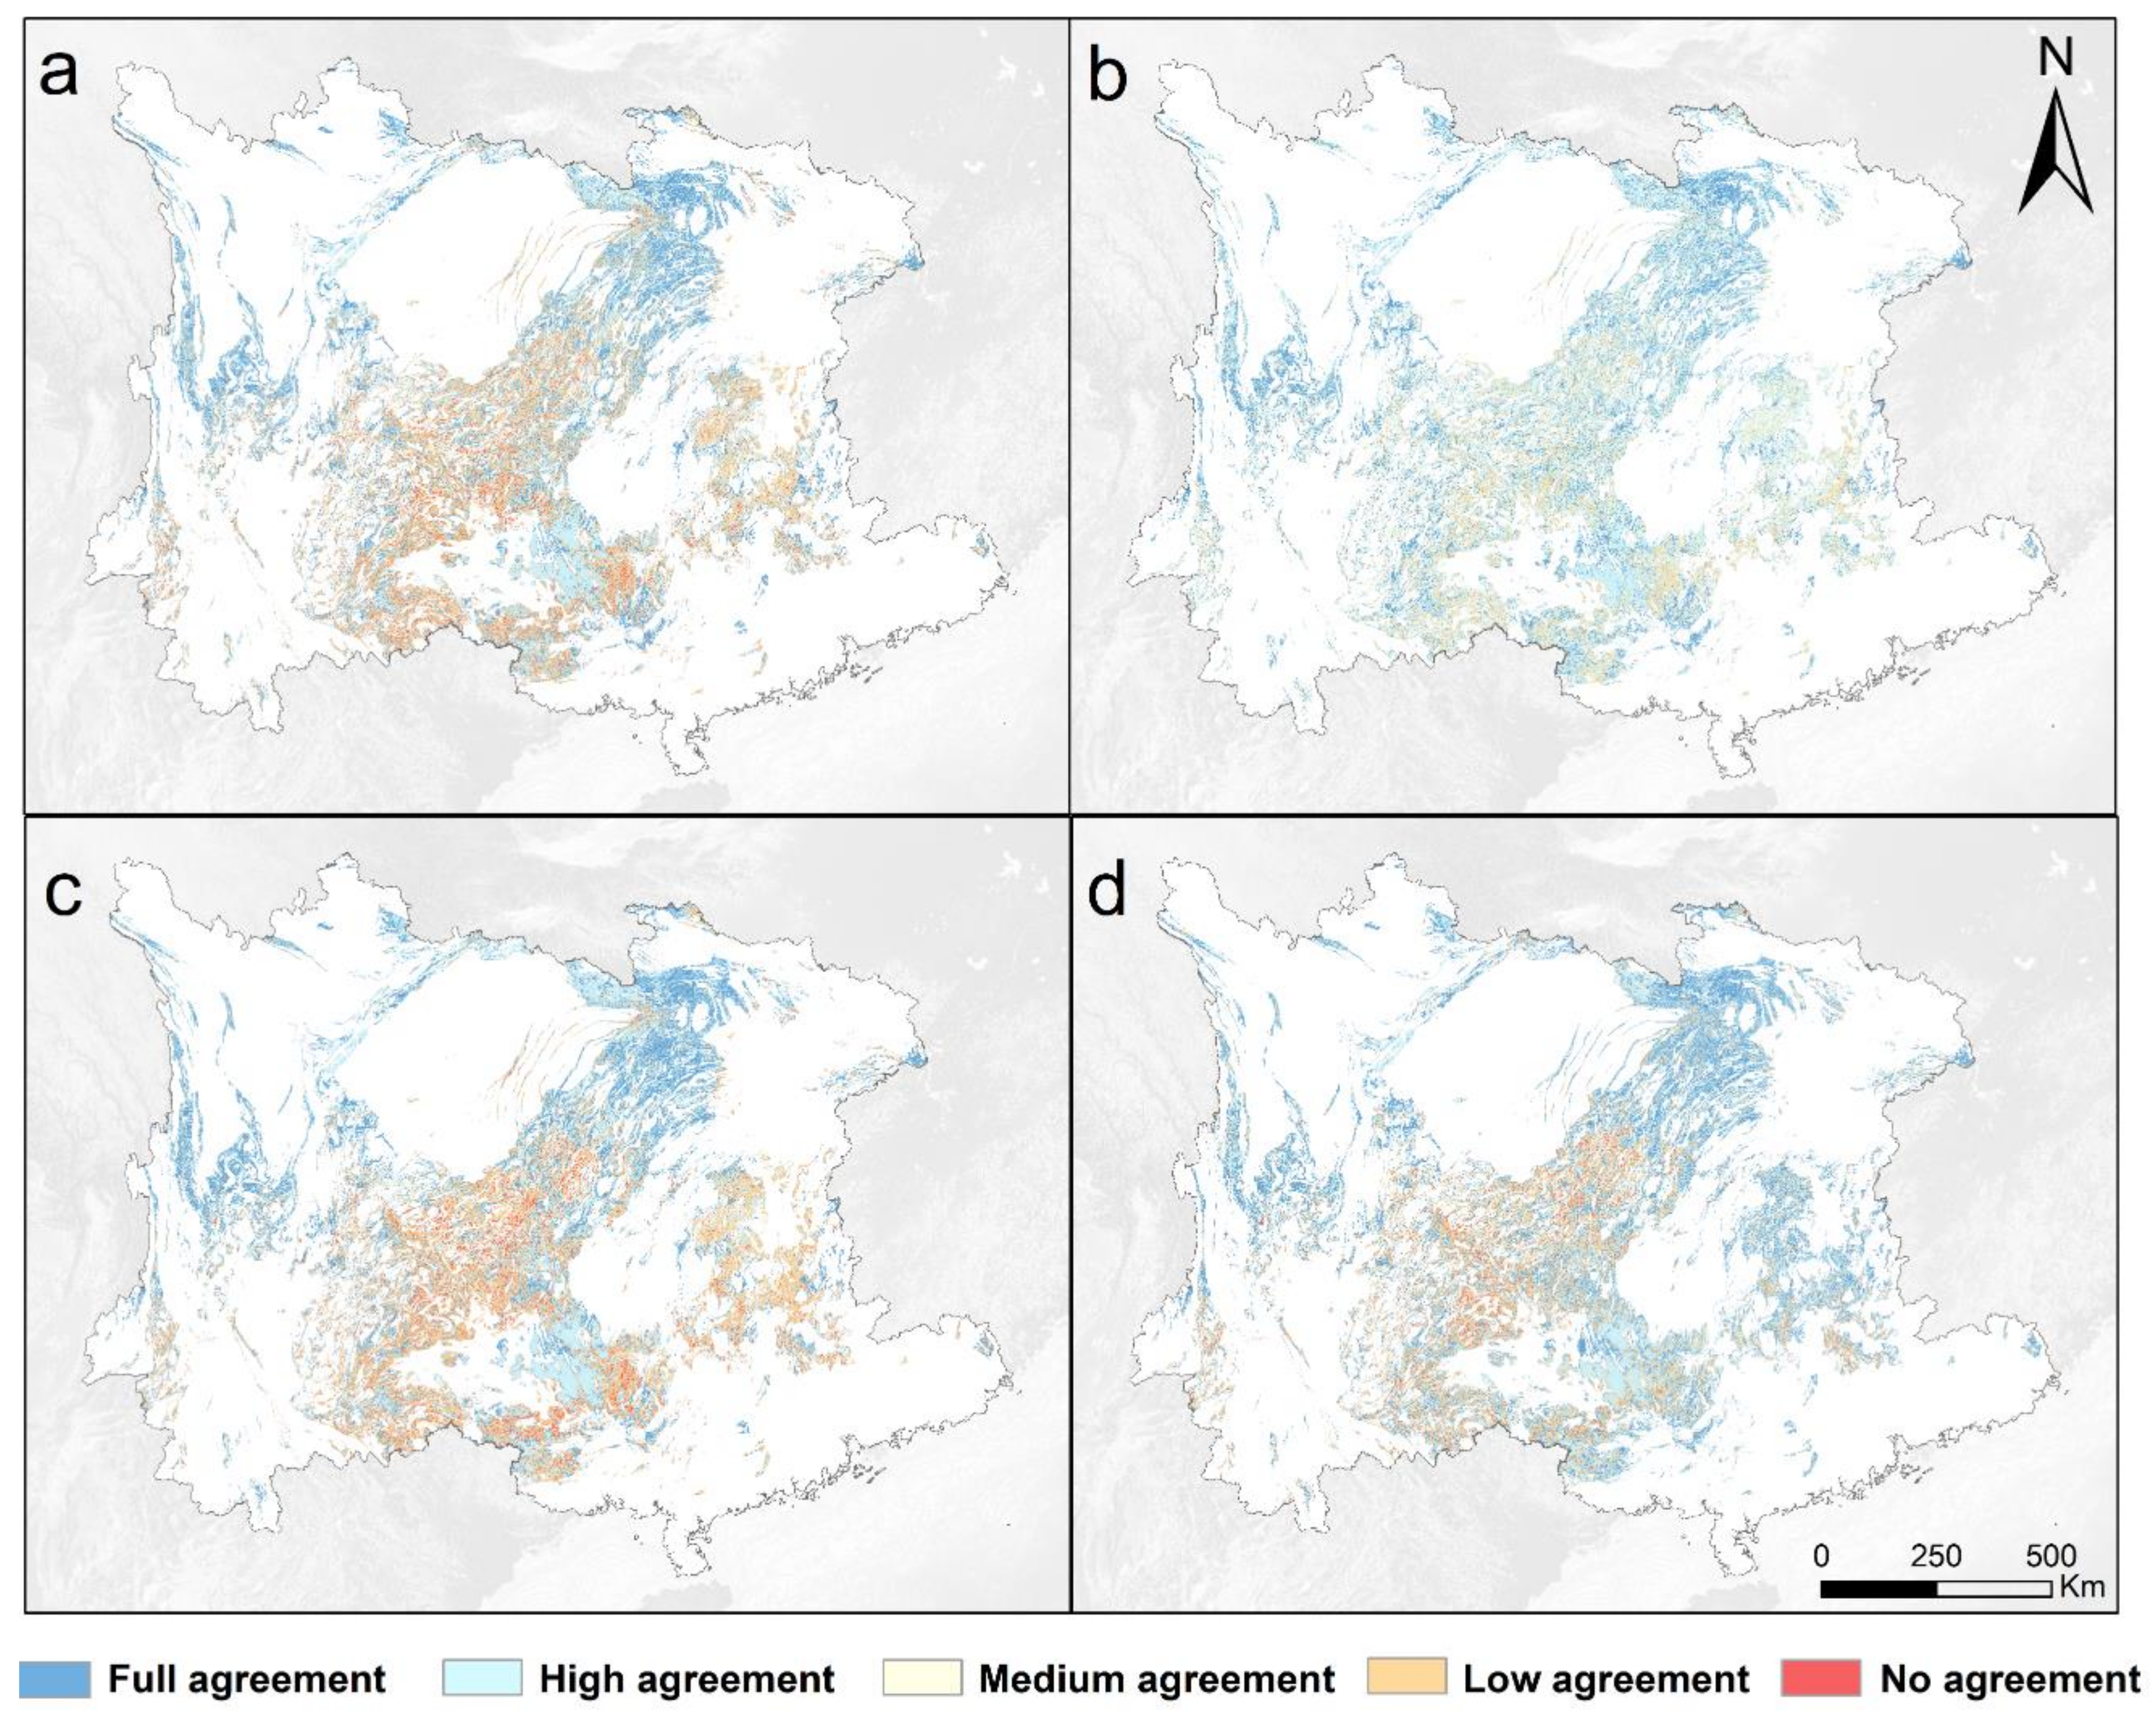
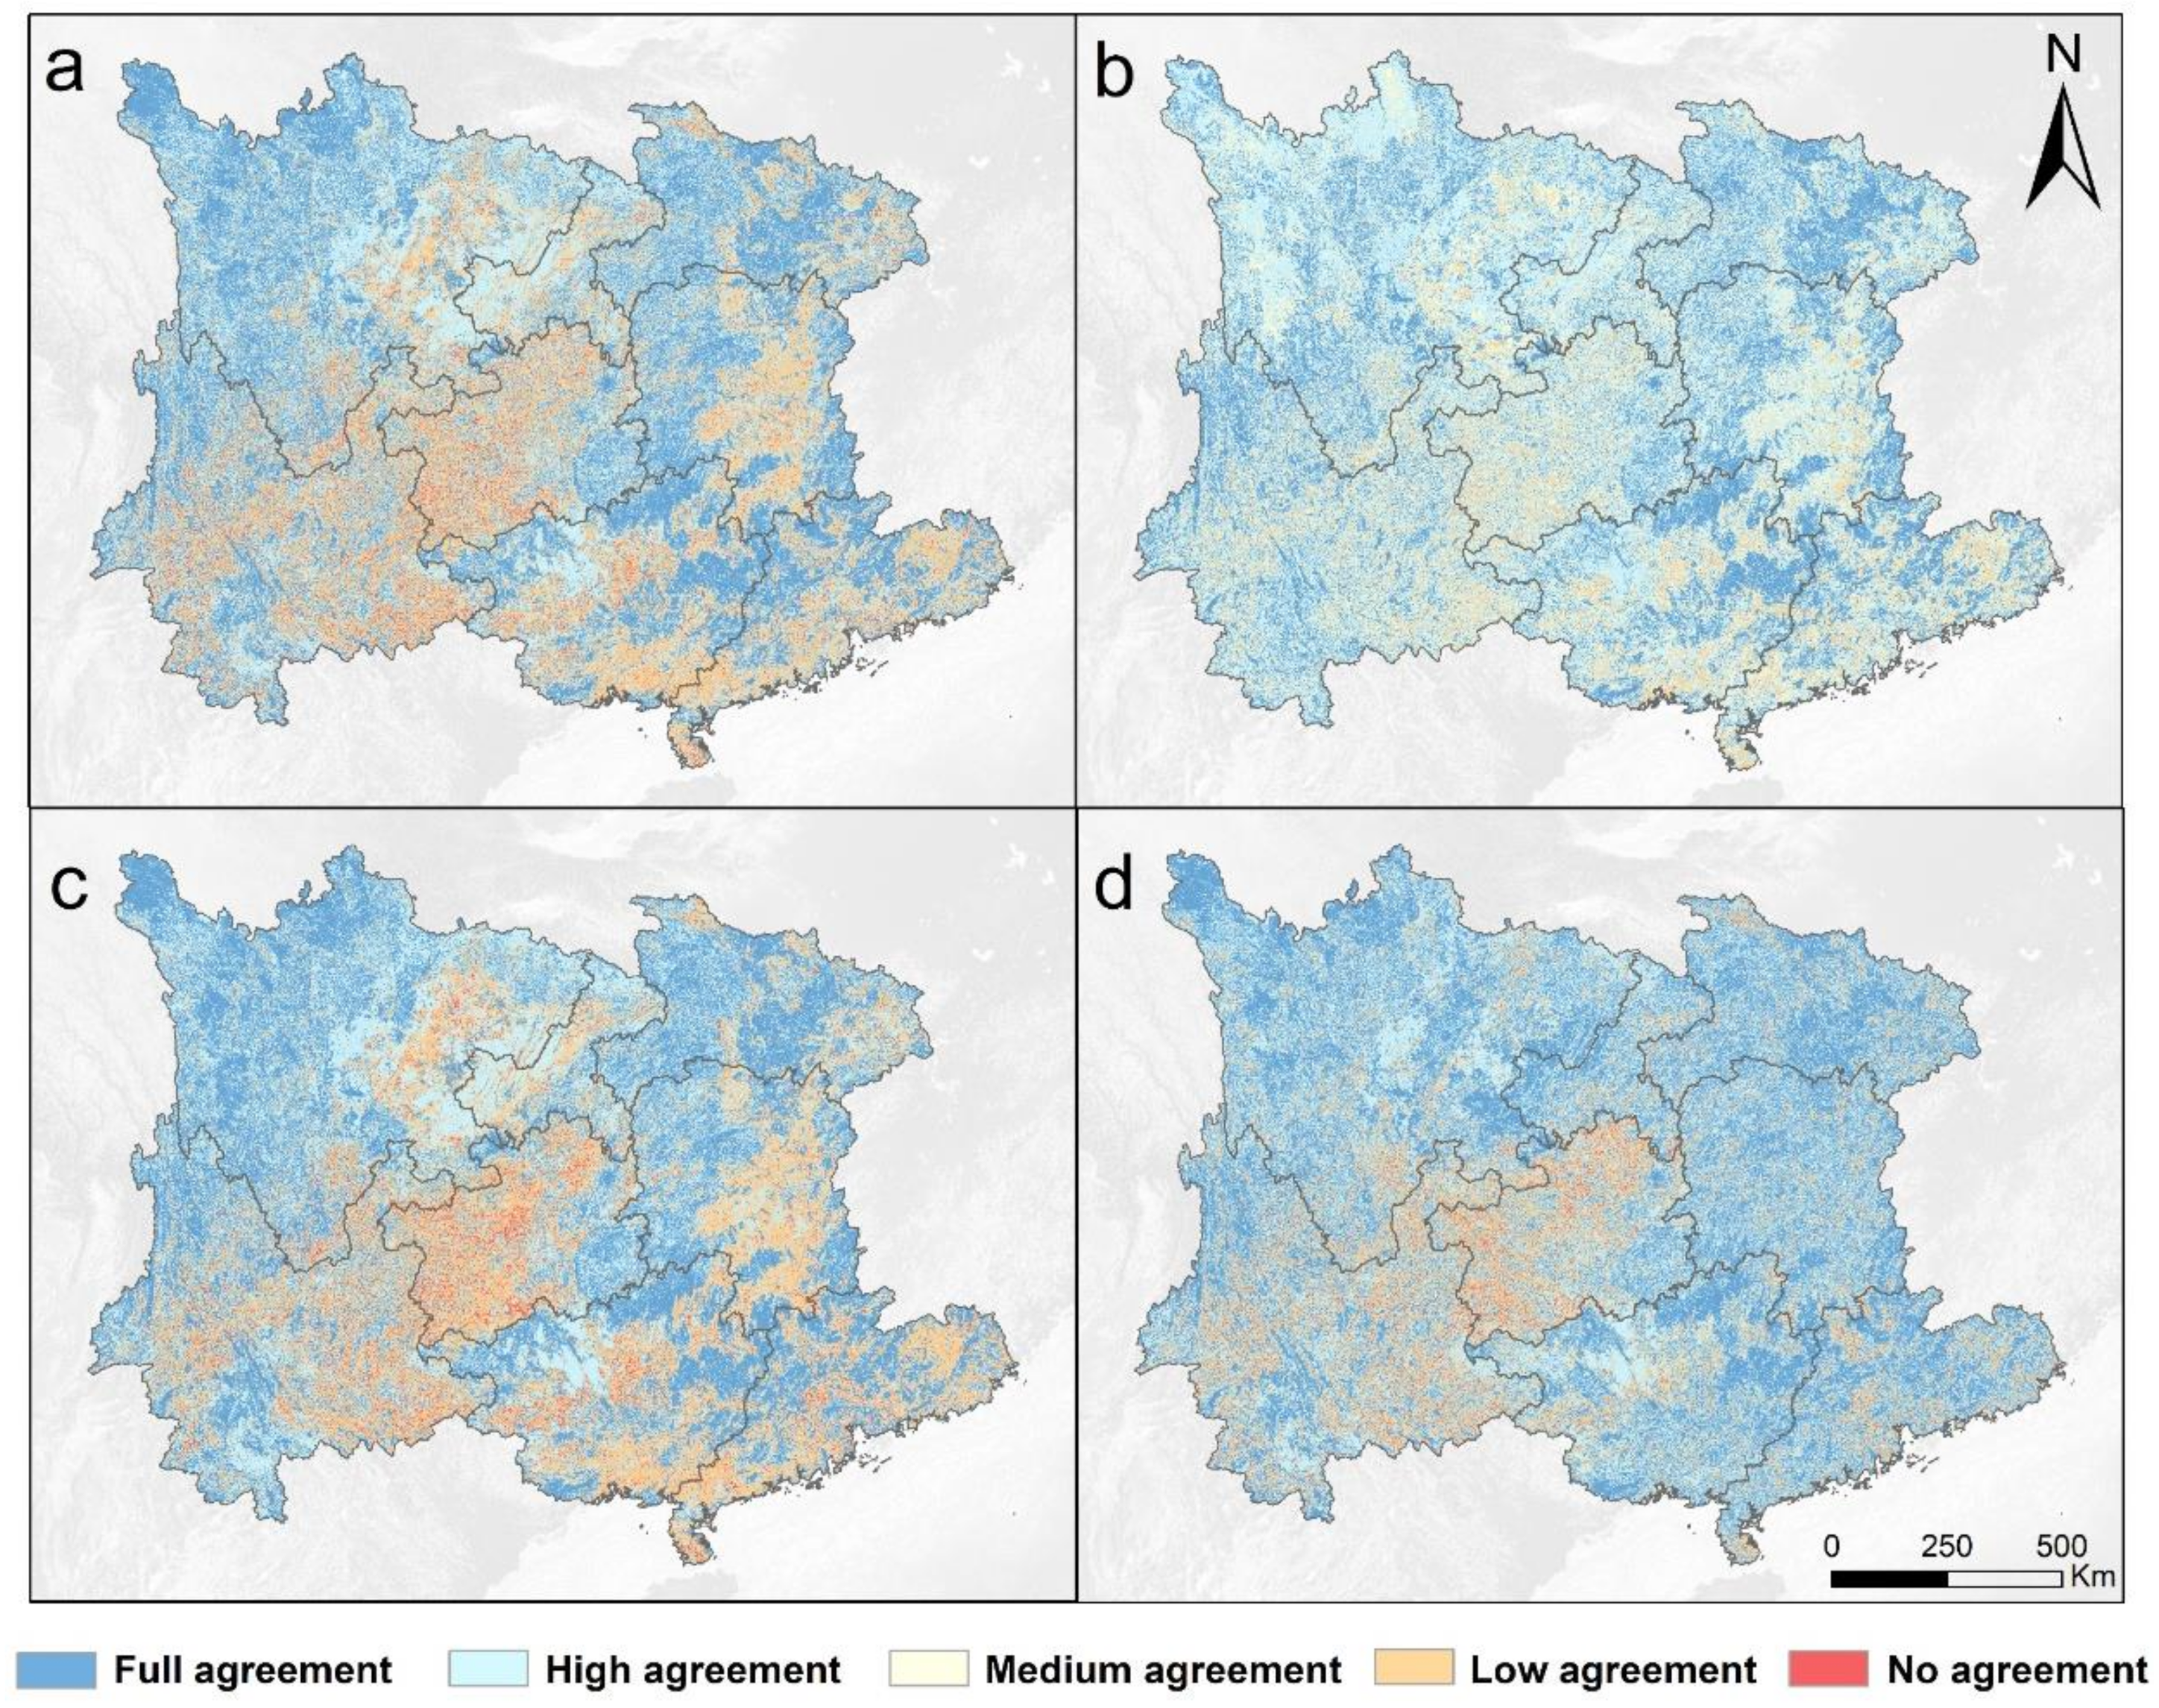
Figure 4 shows the spatial consistency of different LC datasets in southern China in four epochs. Additionally, Figure A1 shows the spatial consistency of LC datasets in the karst area of southern China. In general, the spatial consistency of LC datasets in the karst area is lower than that of the non-karst area. In 2000, 2010, and 2015, areas of full agreement and high agreement accounted for approximately 70% of the total area, rising to 78% in 2020. Areas with consistent land cover types are mainly located in homogeneous areas, e.g., regions covered by large areas of grasslands and croplands, such as the western Sichuan Plateau and the Plain of Hubei and Hunan. In contrast, areas with low spatial consistency in the datasets are mostly distributed in heterogeneous regions, e.g., the regions covered by cropland/natural vegetation mosaics, such as the Yunnan–Guizhou Plateau, and hilly and mountainous areas in the Guangxi and Guangdong provinces. The former is also the mostly concentrated area of karst landforms in southern China, with large topographic fluctuations, rugged surfaces, and complex LC types.
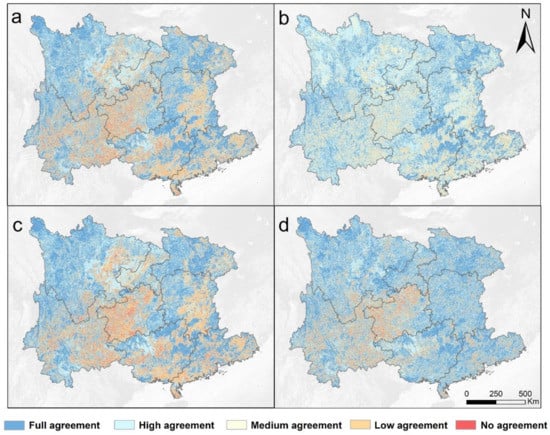
Figure 4.
Spatial agreement among different LC maps. Consistency is defined by the number of the LC dataset with the same cover type in each pixel for epochs (a) 2000, (b) 2010, (c) 2015, and (d) 2020.
3.3. Accuracy Analysis
3.3.1. Overall Accuracy Analysis
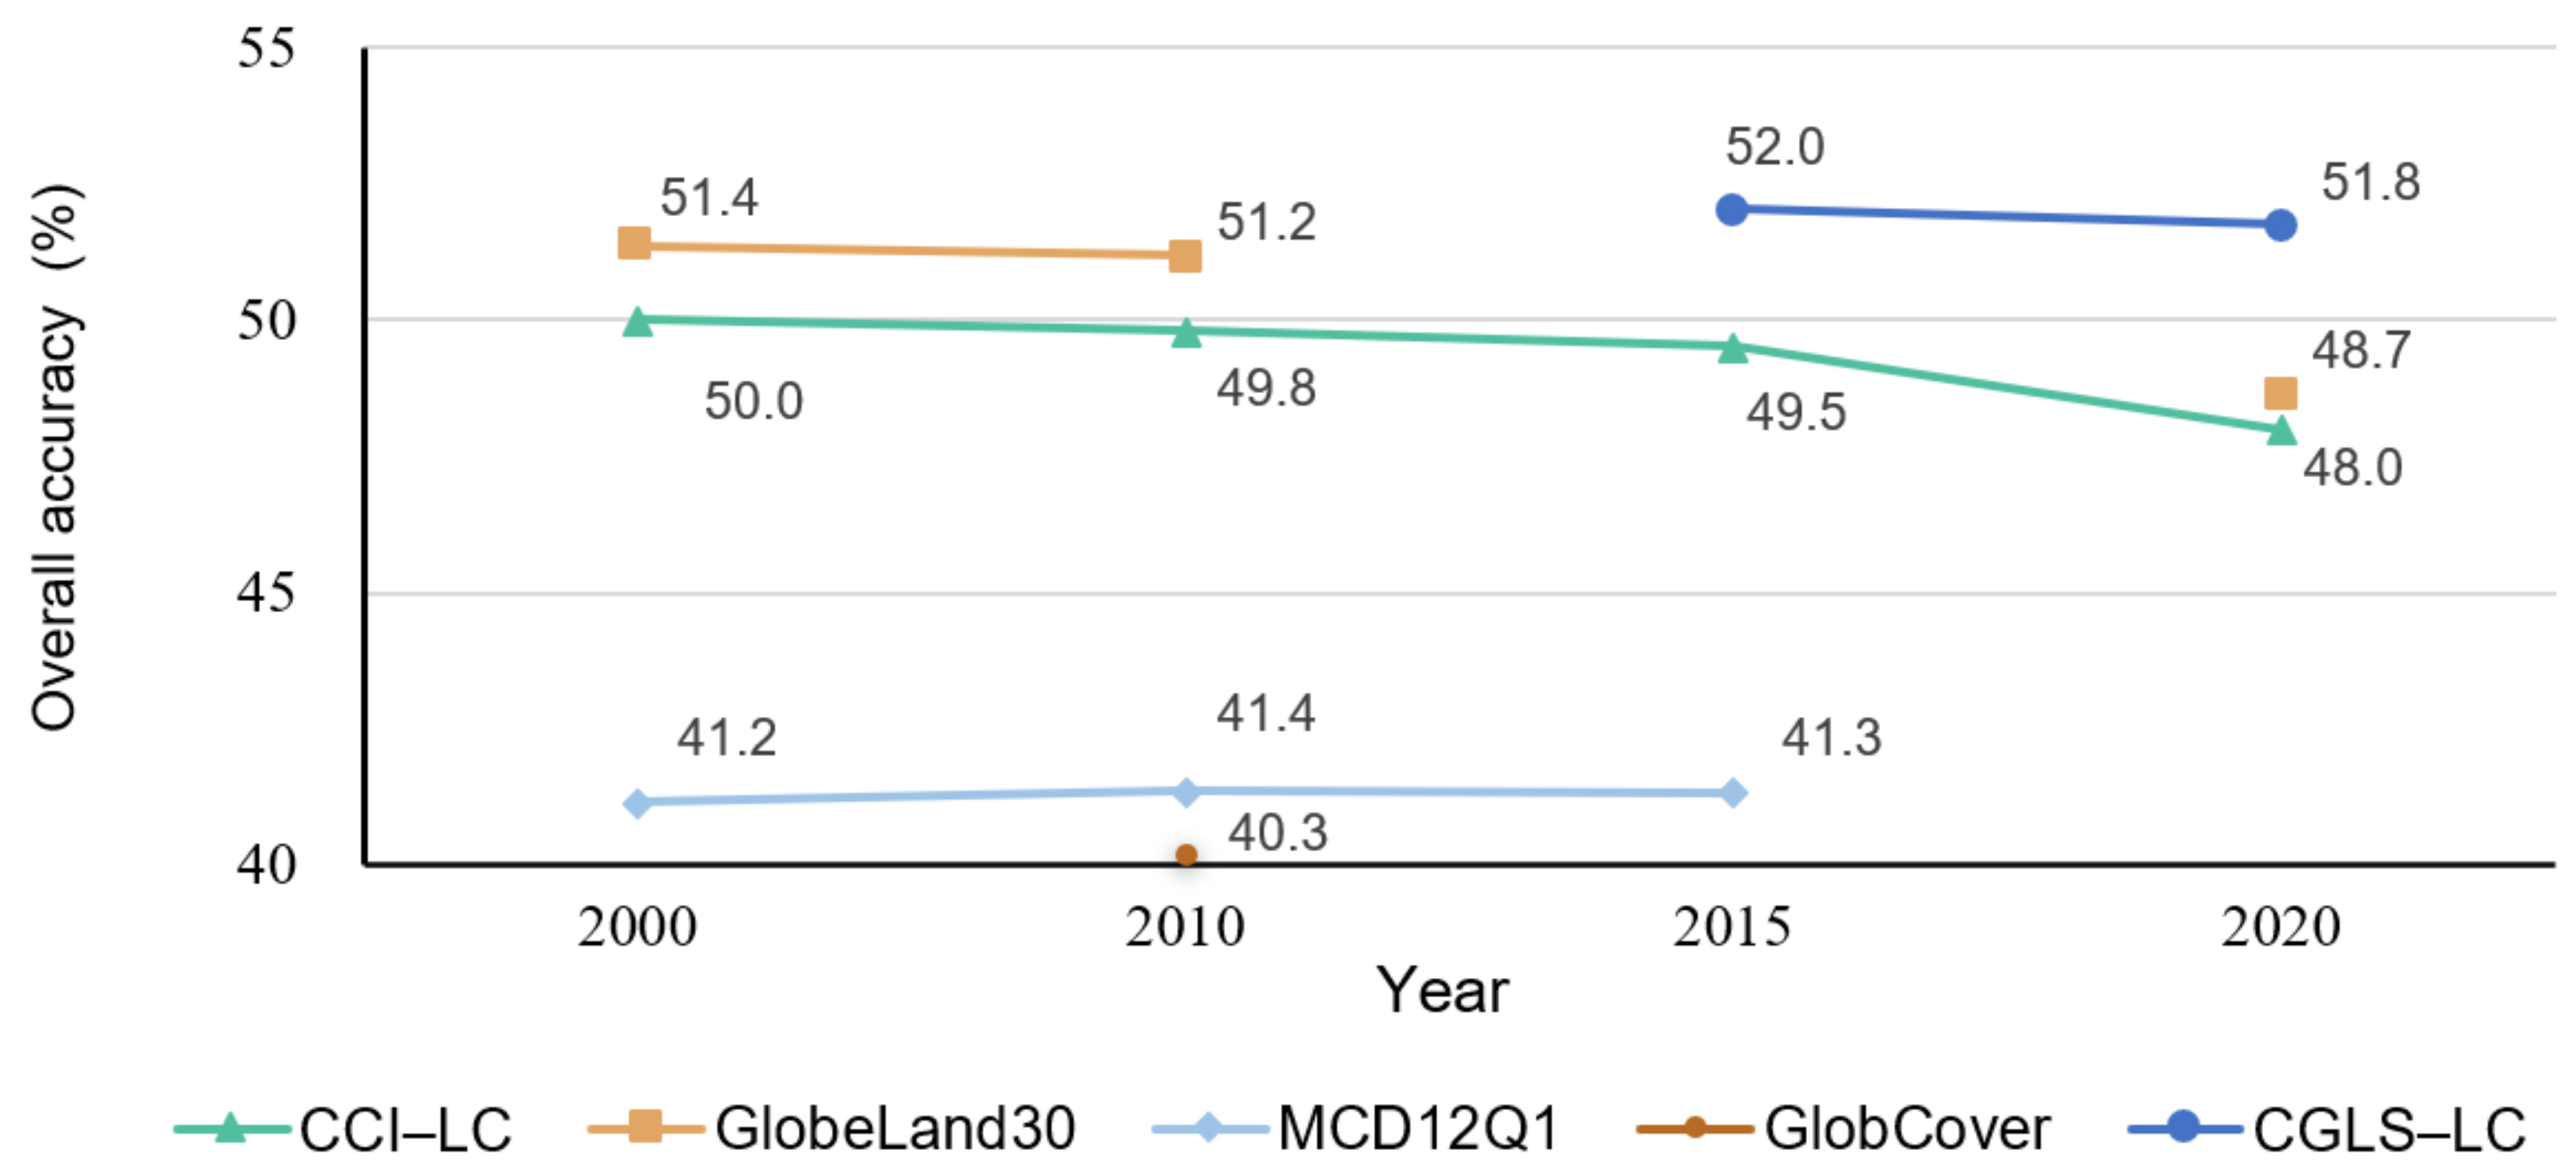
In general, the overall accuracy of different global LC datasets ranges from 40.3% to 52.0% in southern China, and presents a distinctive pattern as follows: CGLS-LC > GlobeLand30 > CCI-LC > MCD12Q1 > GlobCover (Figure 5). Specifically, CGLS-LC 2015 achieved the highest accuracy (52.0%) among all five global LC datasets, followed by CGLS-LC 2019 (51.8%) and GlobeLand30 2000 (51.4%). Surprisingly, the accuracy of the CGLS-LC dataset, with a spatial resolution of 100 m, is even higher than GlobeLand30 at 30 m resolution, although the gap is rather small. In addition, the CCI-LC dataset attained an overall accuracy of 48.0–50.0% during 2000–2020. Among all global LC maps, GlobCover 2009 gained the lowest accuracy (40.3%) in southern China. Except for the GlobCover dataset, the MCD12Q1 2001 has the lowest accuracy (41.2%). On the whole, fine-scale global LC datasets achieved higher overall accuracy in the region of southern China in comparison to LC datasets in coarse resolutions. Furthermore, from the perspective of temporal trends, GlobeLand30 and CCI-LC presented a decreasing trend in overall accuracy from 2000 to 2020, while the accuracy of MCD12Q1 remains relatively stable over time.

Figure 5.
Overall accuracy for the five studied global LC datasets over 2000–2020.
3.3.2. Accuracy Evaluation by Province
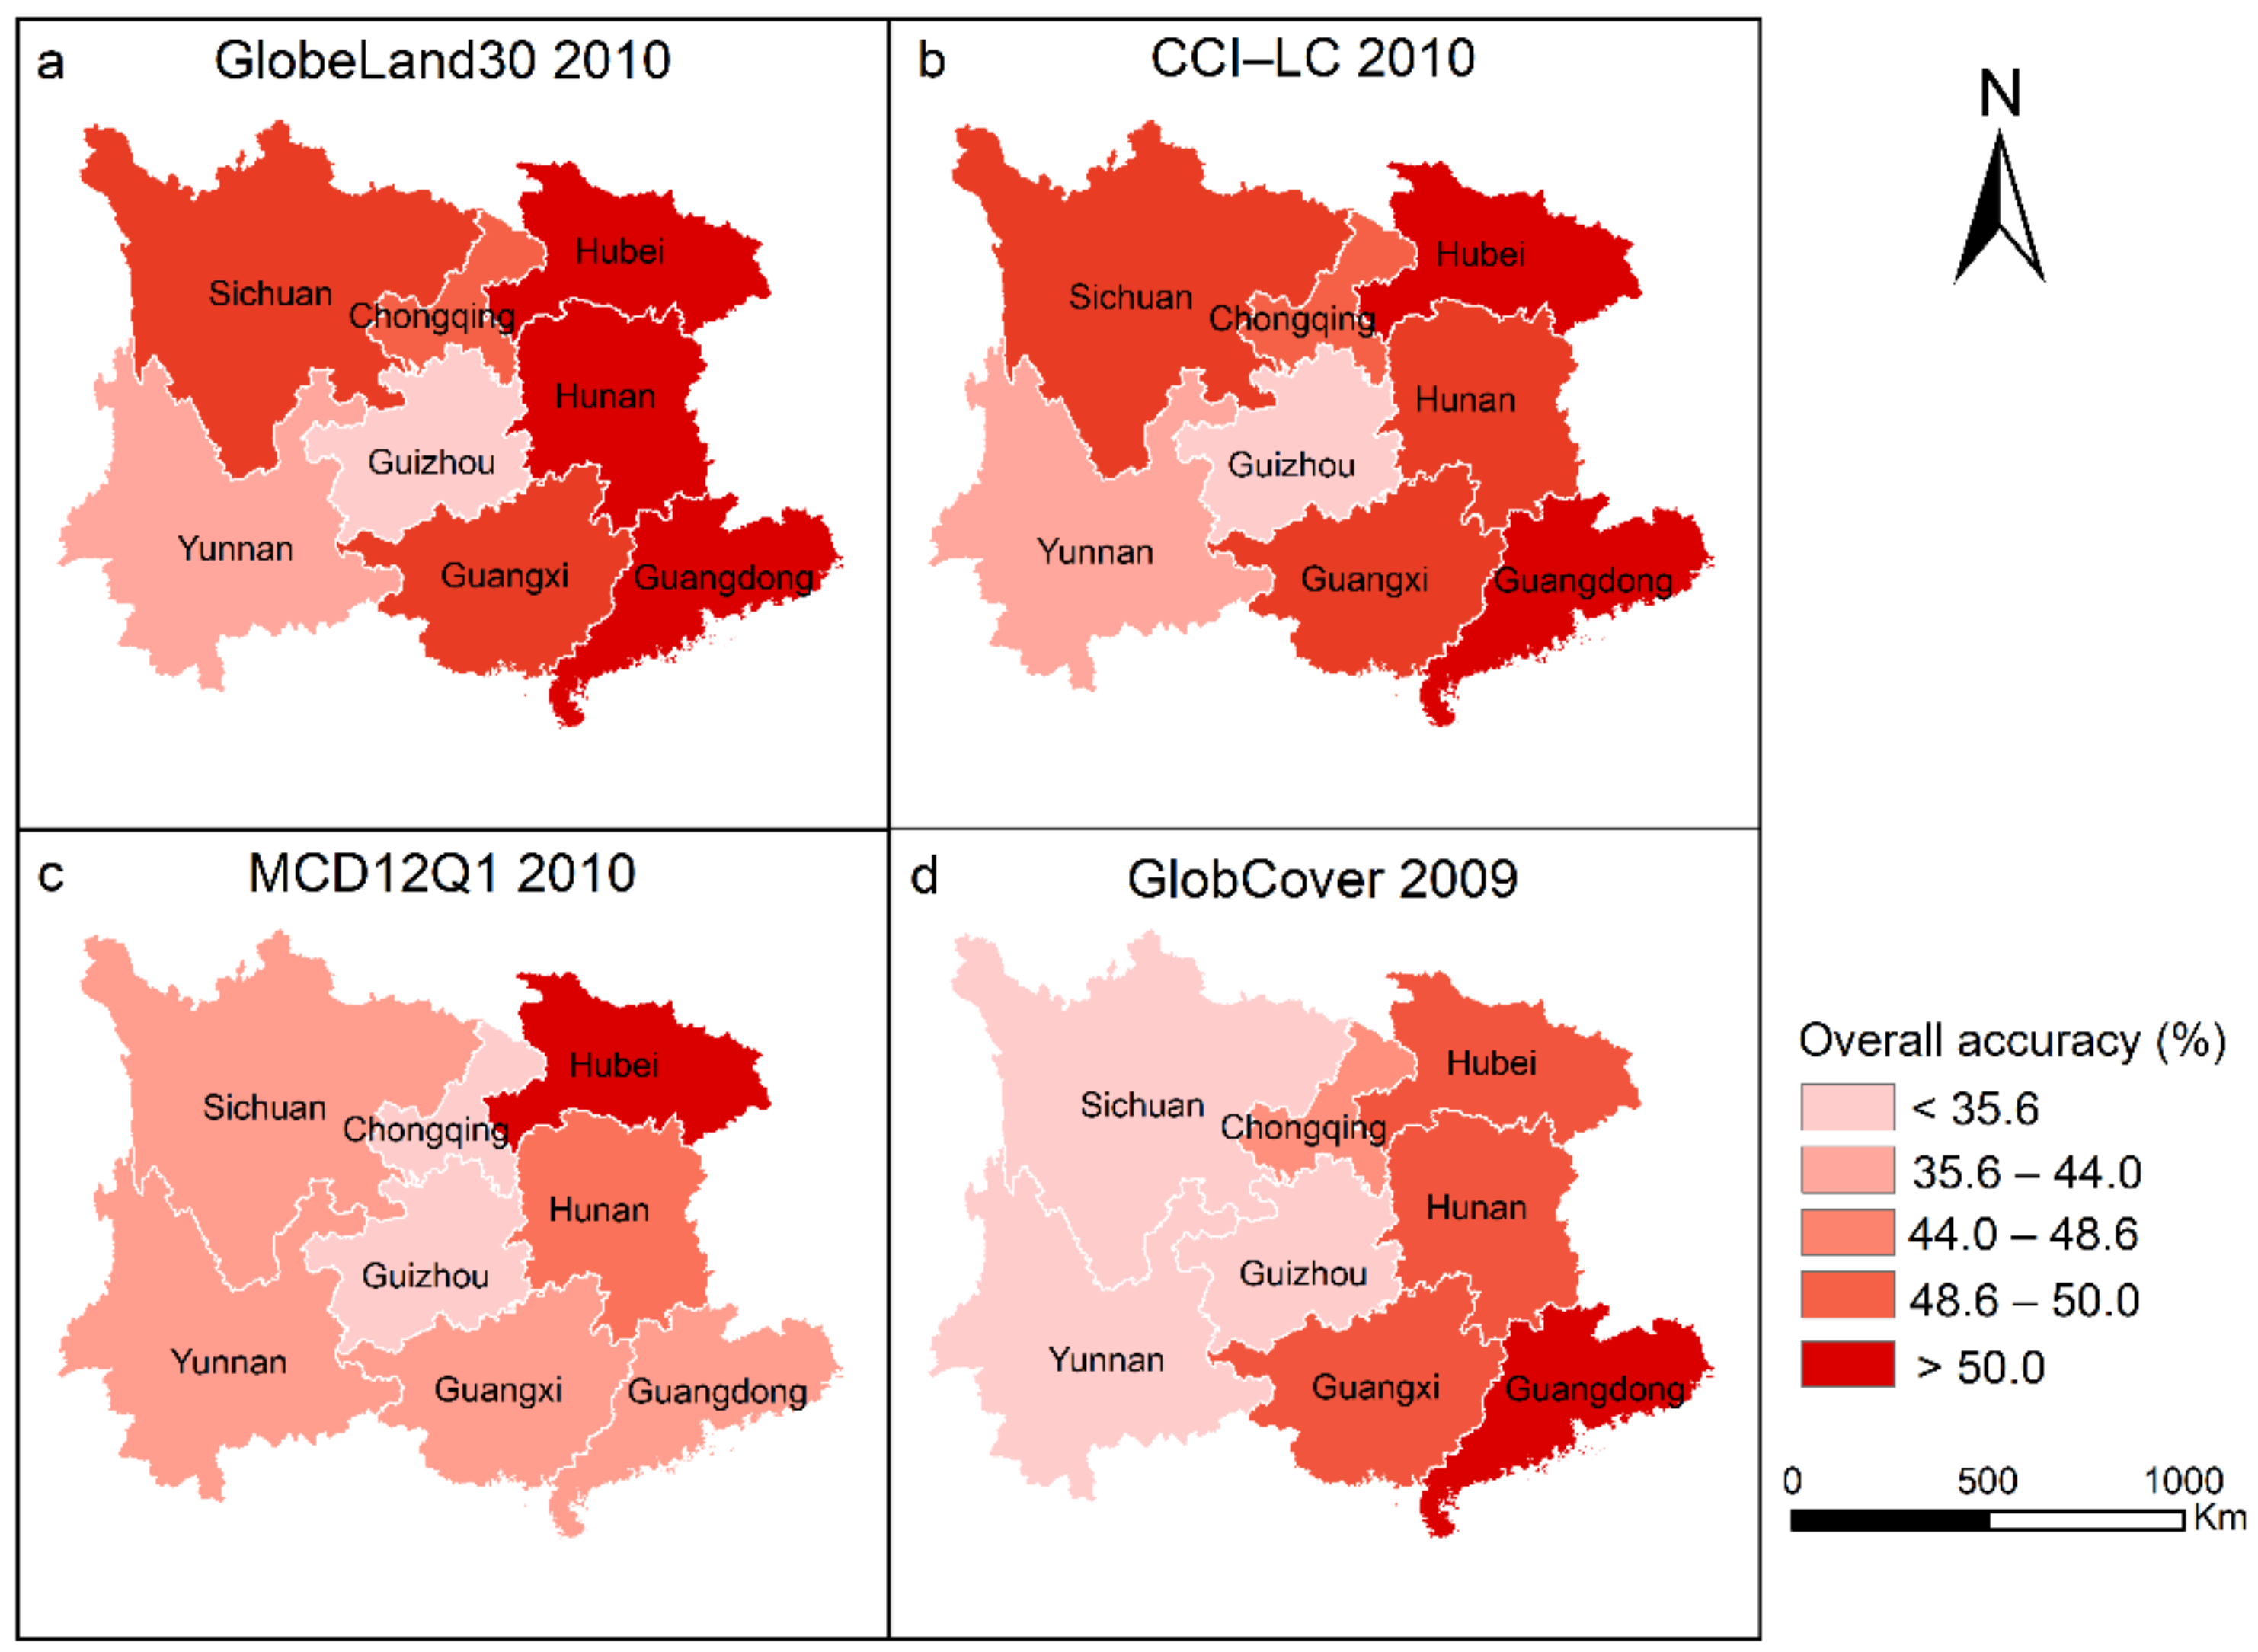
Provincial-scale accuracy maps were generated to indicate regional differences in the overall accuracy of various global LC datasets (Figure 6), ranging from 19.3% to 64.5%. In epoch 2010, the provinces with high accuracy are Hubei, Hunan, and Guangdong, where plains are widely distributed. The accuracy of the GlobeLand30 and CGLS-LC datasets in Hunan province is more than 60%, and the accuracy of CCI-LC, GlobeLand30, and CGLS-LC in Hubei province is also close to 60% (Table A2). In contrast, the Guizhou and Yunnan provinces are dominated by plateaus and karst landforms and feature varied land cover types; hence, the overall accuracy is among the lowest, with the average of all 13 LC maps in four epochs reaching 33.2% and 39.9%, respectively.

Figure 6.
Distribution maps of the overall accuracy of global LC datasets at the provincial scale in southern China in epoch 2010.
3.3.3. Producer’s and User’s Accuracy
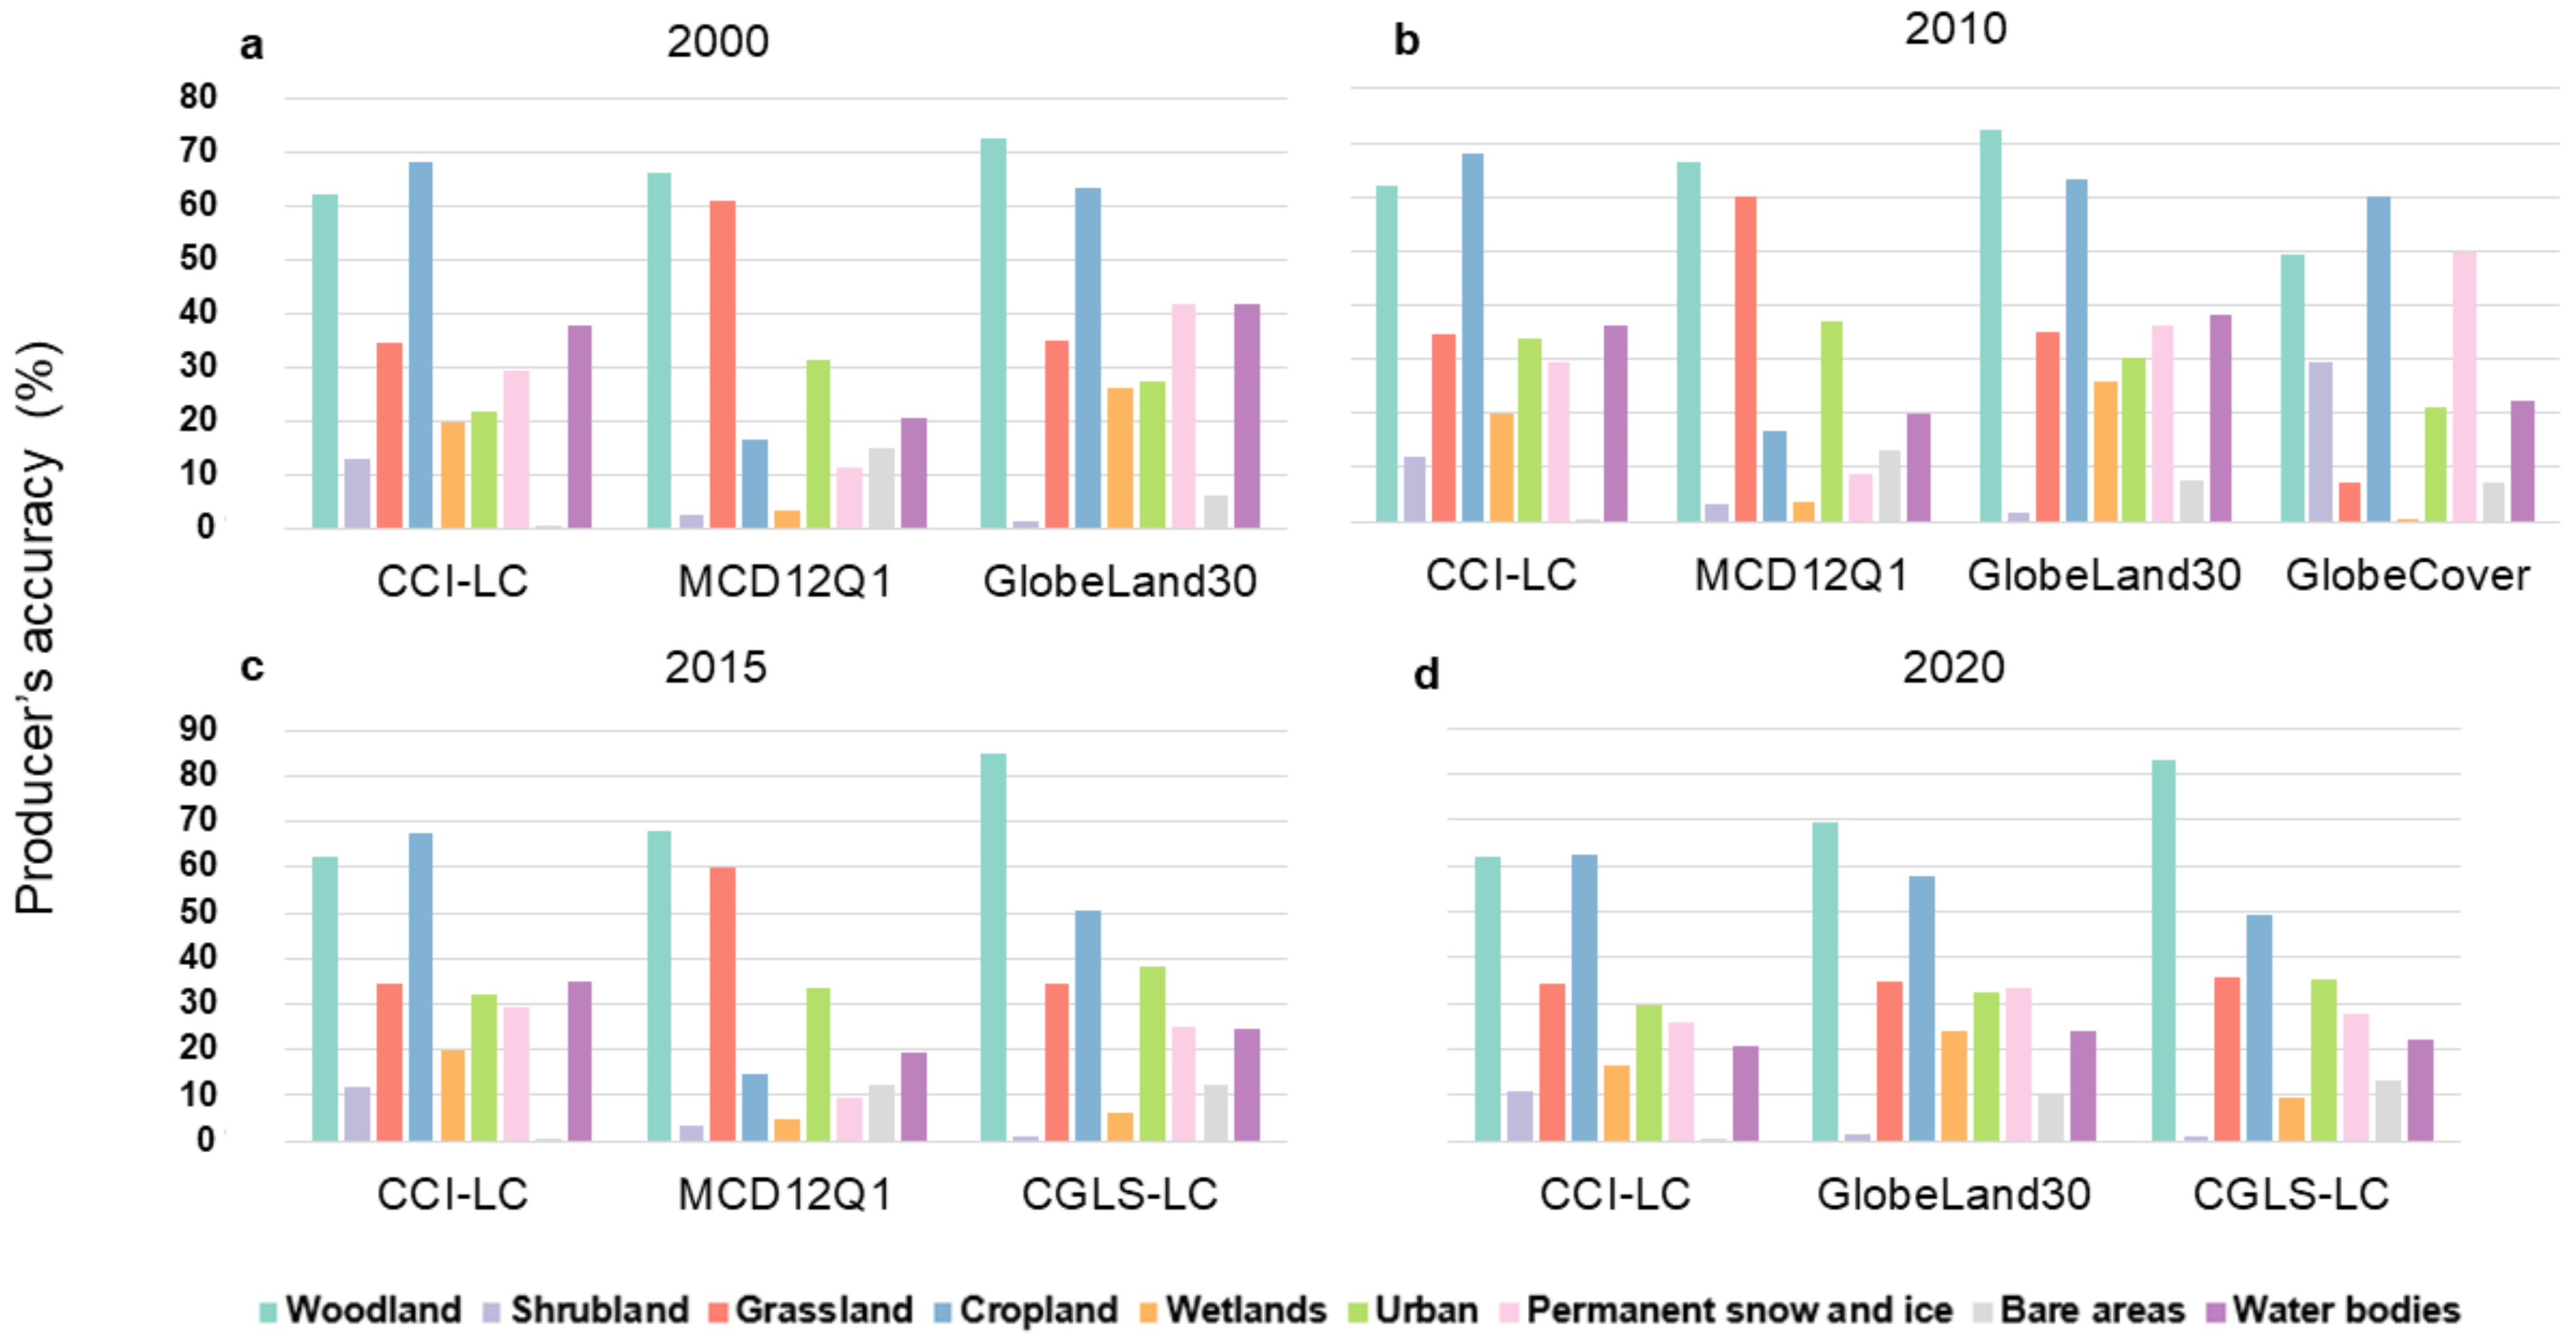
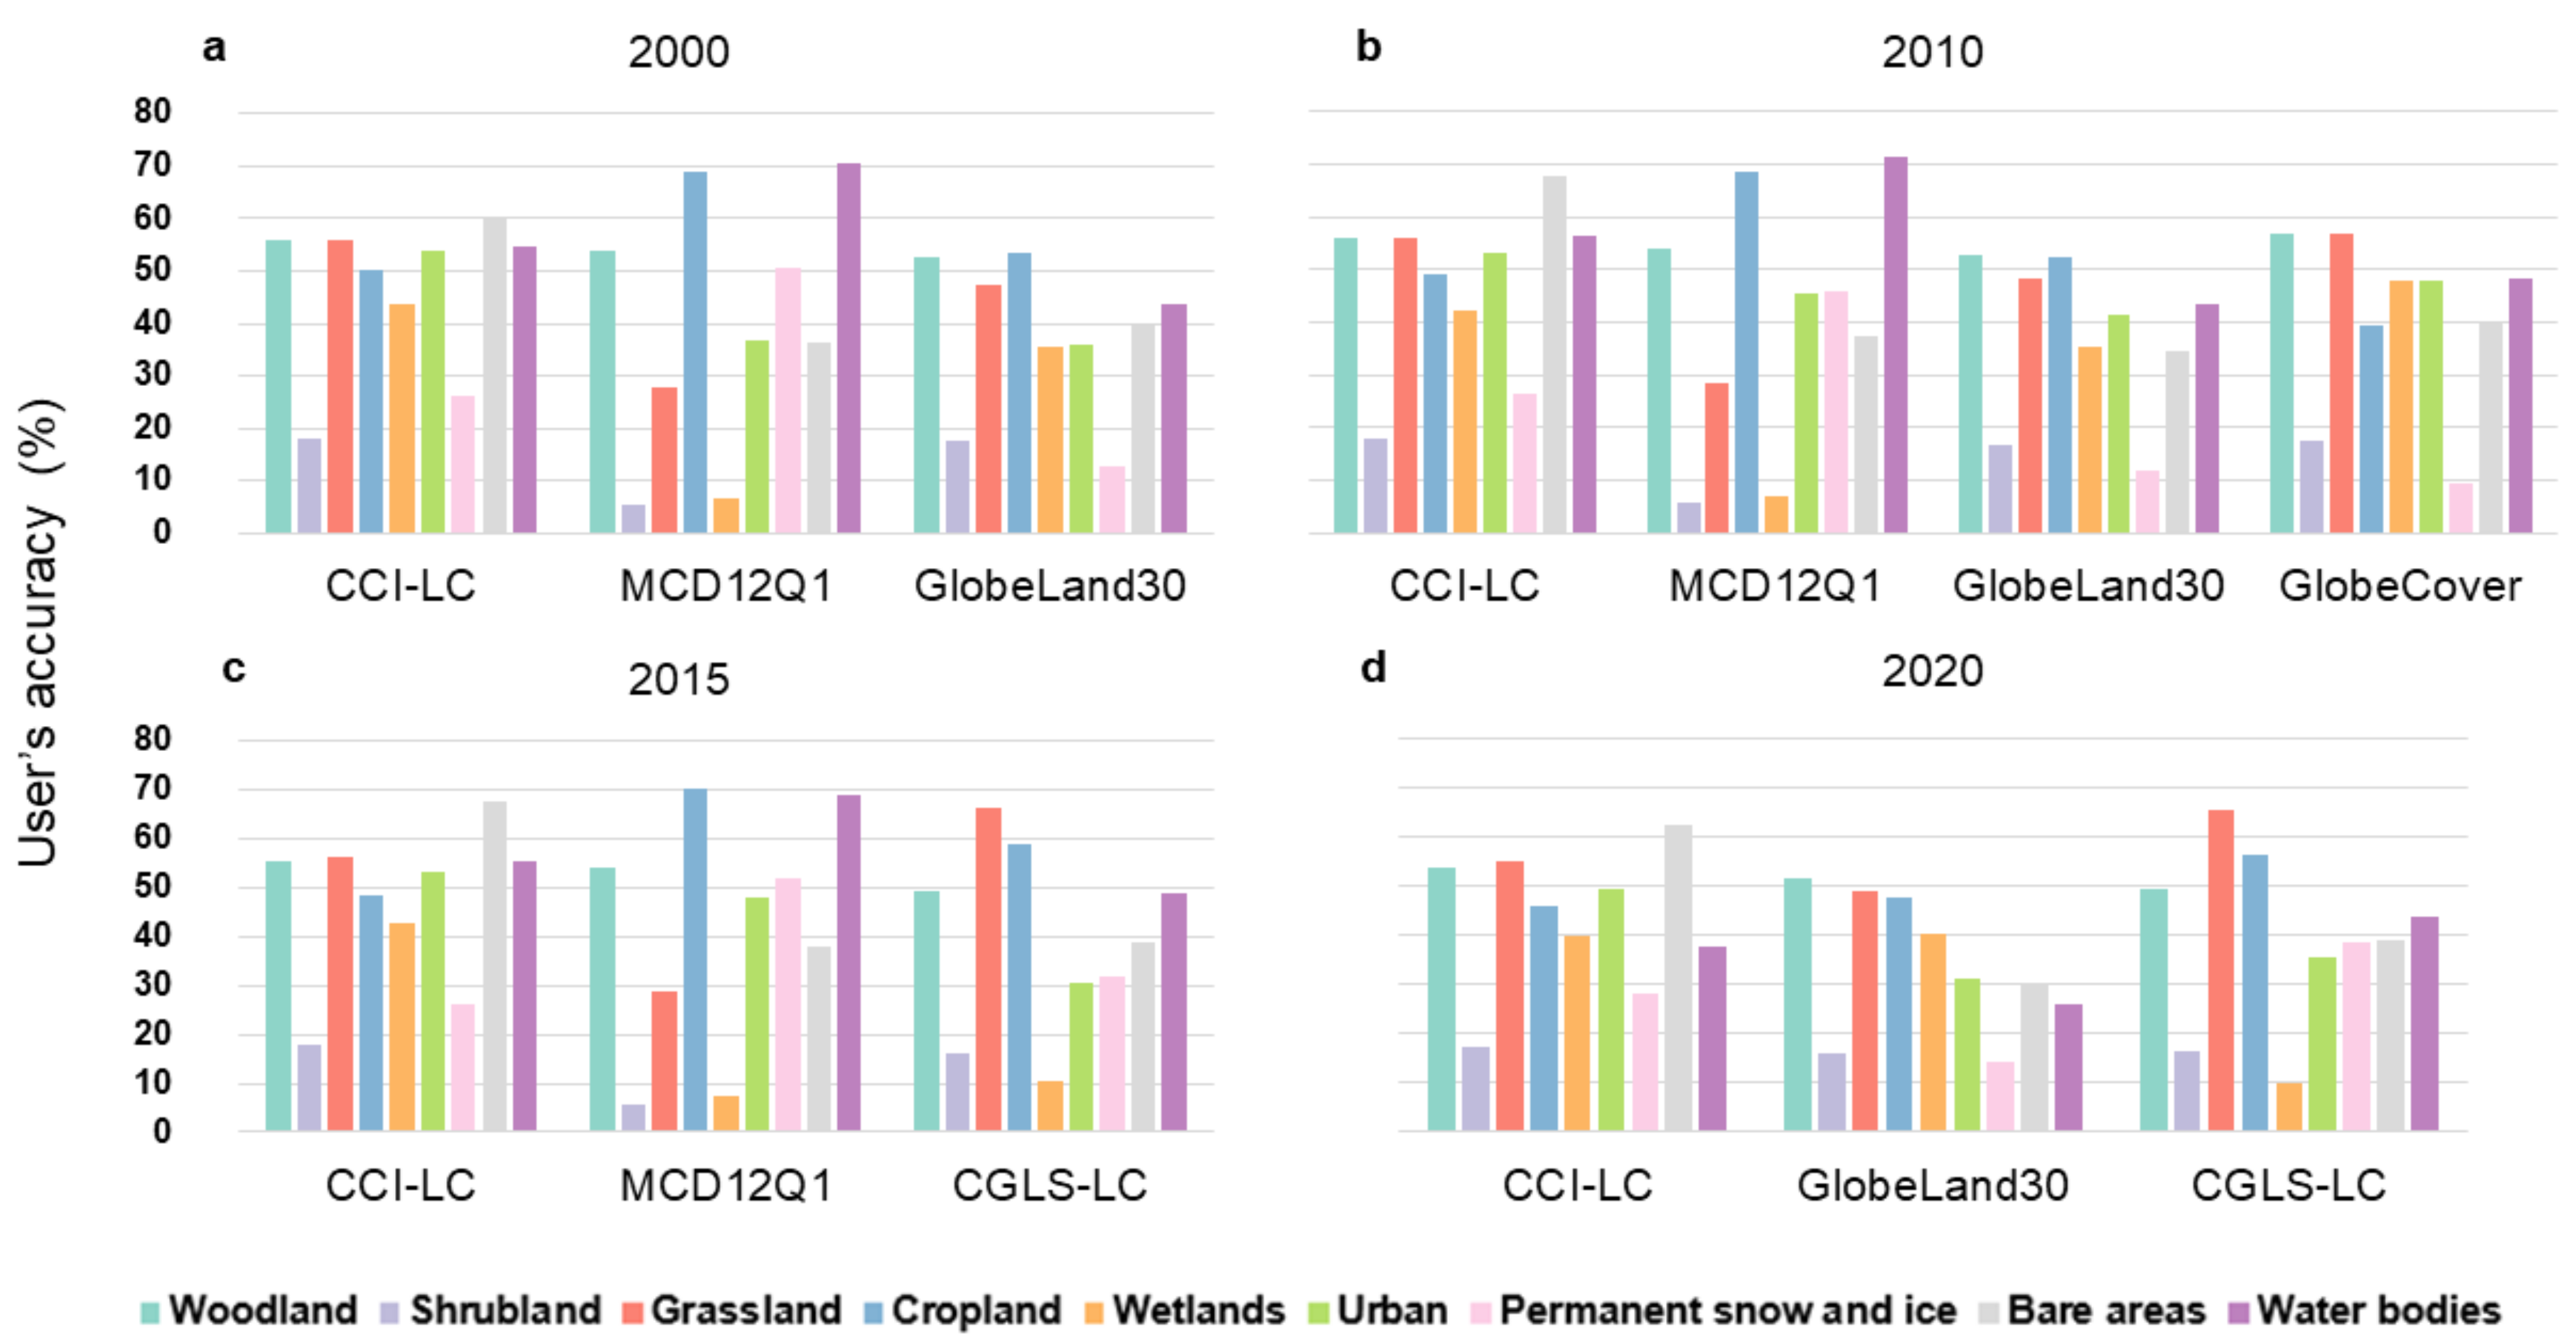
Producer’s accuracy indicates the probability of a particular land cover type on the ground being correctly classified in the map and measures errors of omission (Figure 7). Meanwhile, user’s accuracy is indicative of the likelihood that a class on the map actually matches the category of its corresponding real-world location and measures errors of commission (Figure 8).
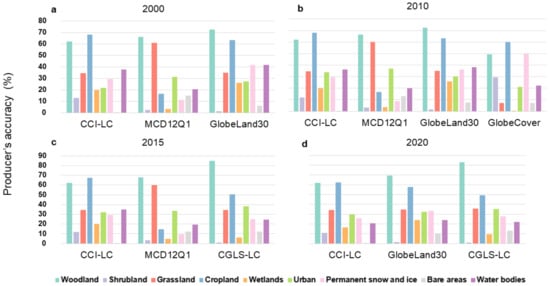
Figure 7.
Producer’s accuracy for various LC datasets in epochs (a) 2000, (b) 2010, (c) 2015, and (d) 2020.
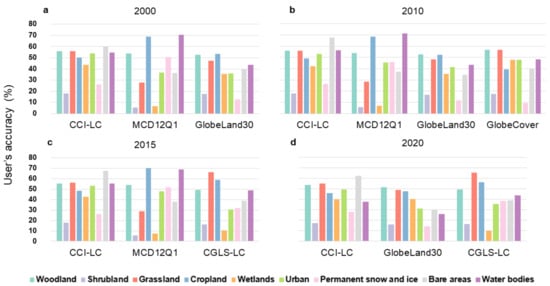
Figure 8.
User’s accuracy for various LC datasets in epochs (a) 2000, (b) 2010, (c) 2015, and (d) 2020.
In southern China, producer’s accuracy varies greatly. The producer’s accuracy of woodland, cropland, and grassland is significantly higher than that of bare areas and shrubland. In particular, the producer’s accuracy of woodland in GlobeLand30 and CGLS-LC is 70% and more than 80% respectively, which is better than other datasets. This is due to the high spatial resolution of Globeland30 and the proximity of the classification system to the reference CLUD. However, the CGLS-LC dataset overestimates the area of woodland, resulting in high producer’s accuracy.
Land cover classes with high user’s accuracy but low producer’s accuracy imply an under-mapping. Specifically, cropland and waterbodies in the MCD12Q1 in 2000, 2010, and 2015 have the highest user’s accuracy (>65%), but their producer’s accuracy is quite low (<20%). Bare areas in the Globeland30 and CGLS-LC datasets have comparatively high user’s accuracy (>30%) and low producer’s accuracy (<13%). Therefore, these classes have undergone under-mapping. On the contrary, high producer’s accuracy and low user’s accuracy indicate that these classes are over-mapped in the dataset. For instance, the producer’s accuracy of the woodland in CGLS-LC is more than 83%, but the user’s accuracy is less than 50%. In addition, the class with low producer’s accuracy and low user’s accuracy means that it is inaccurately mapped in the area. For example, the accuracy of shrubland and wetlands in MCD12Q1 is poor in the south China.
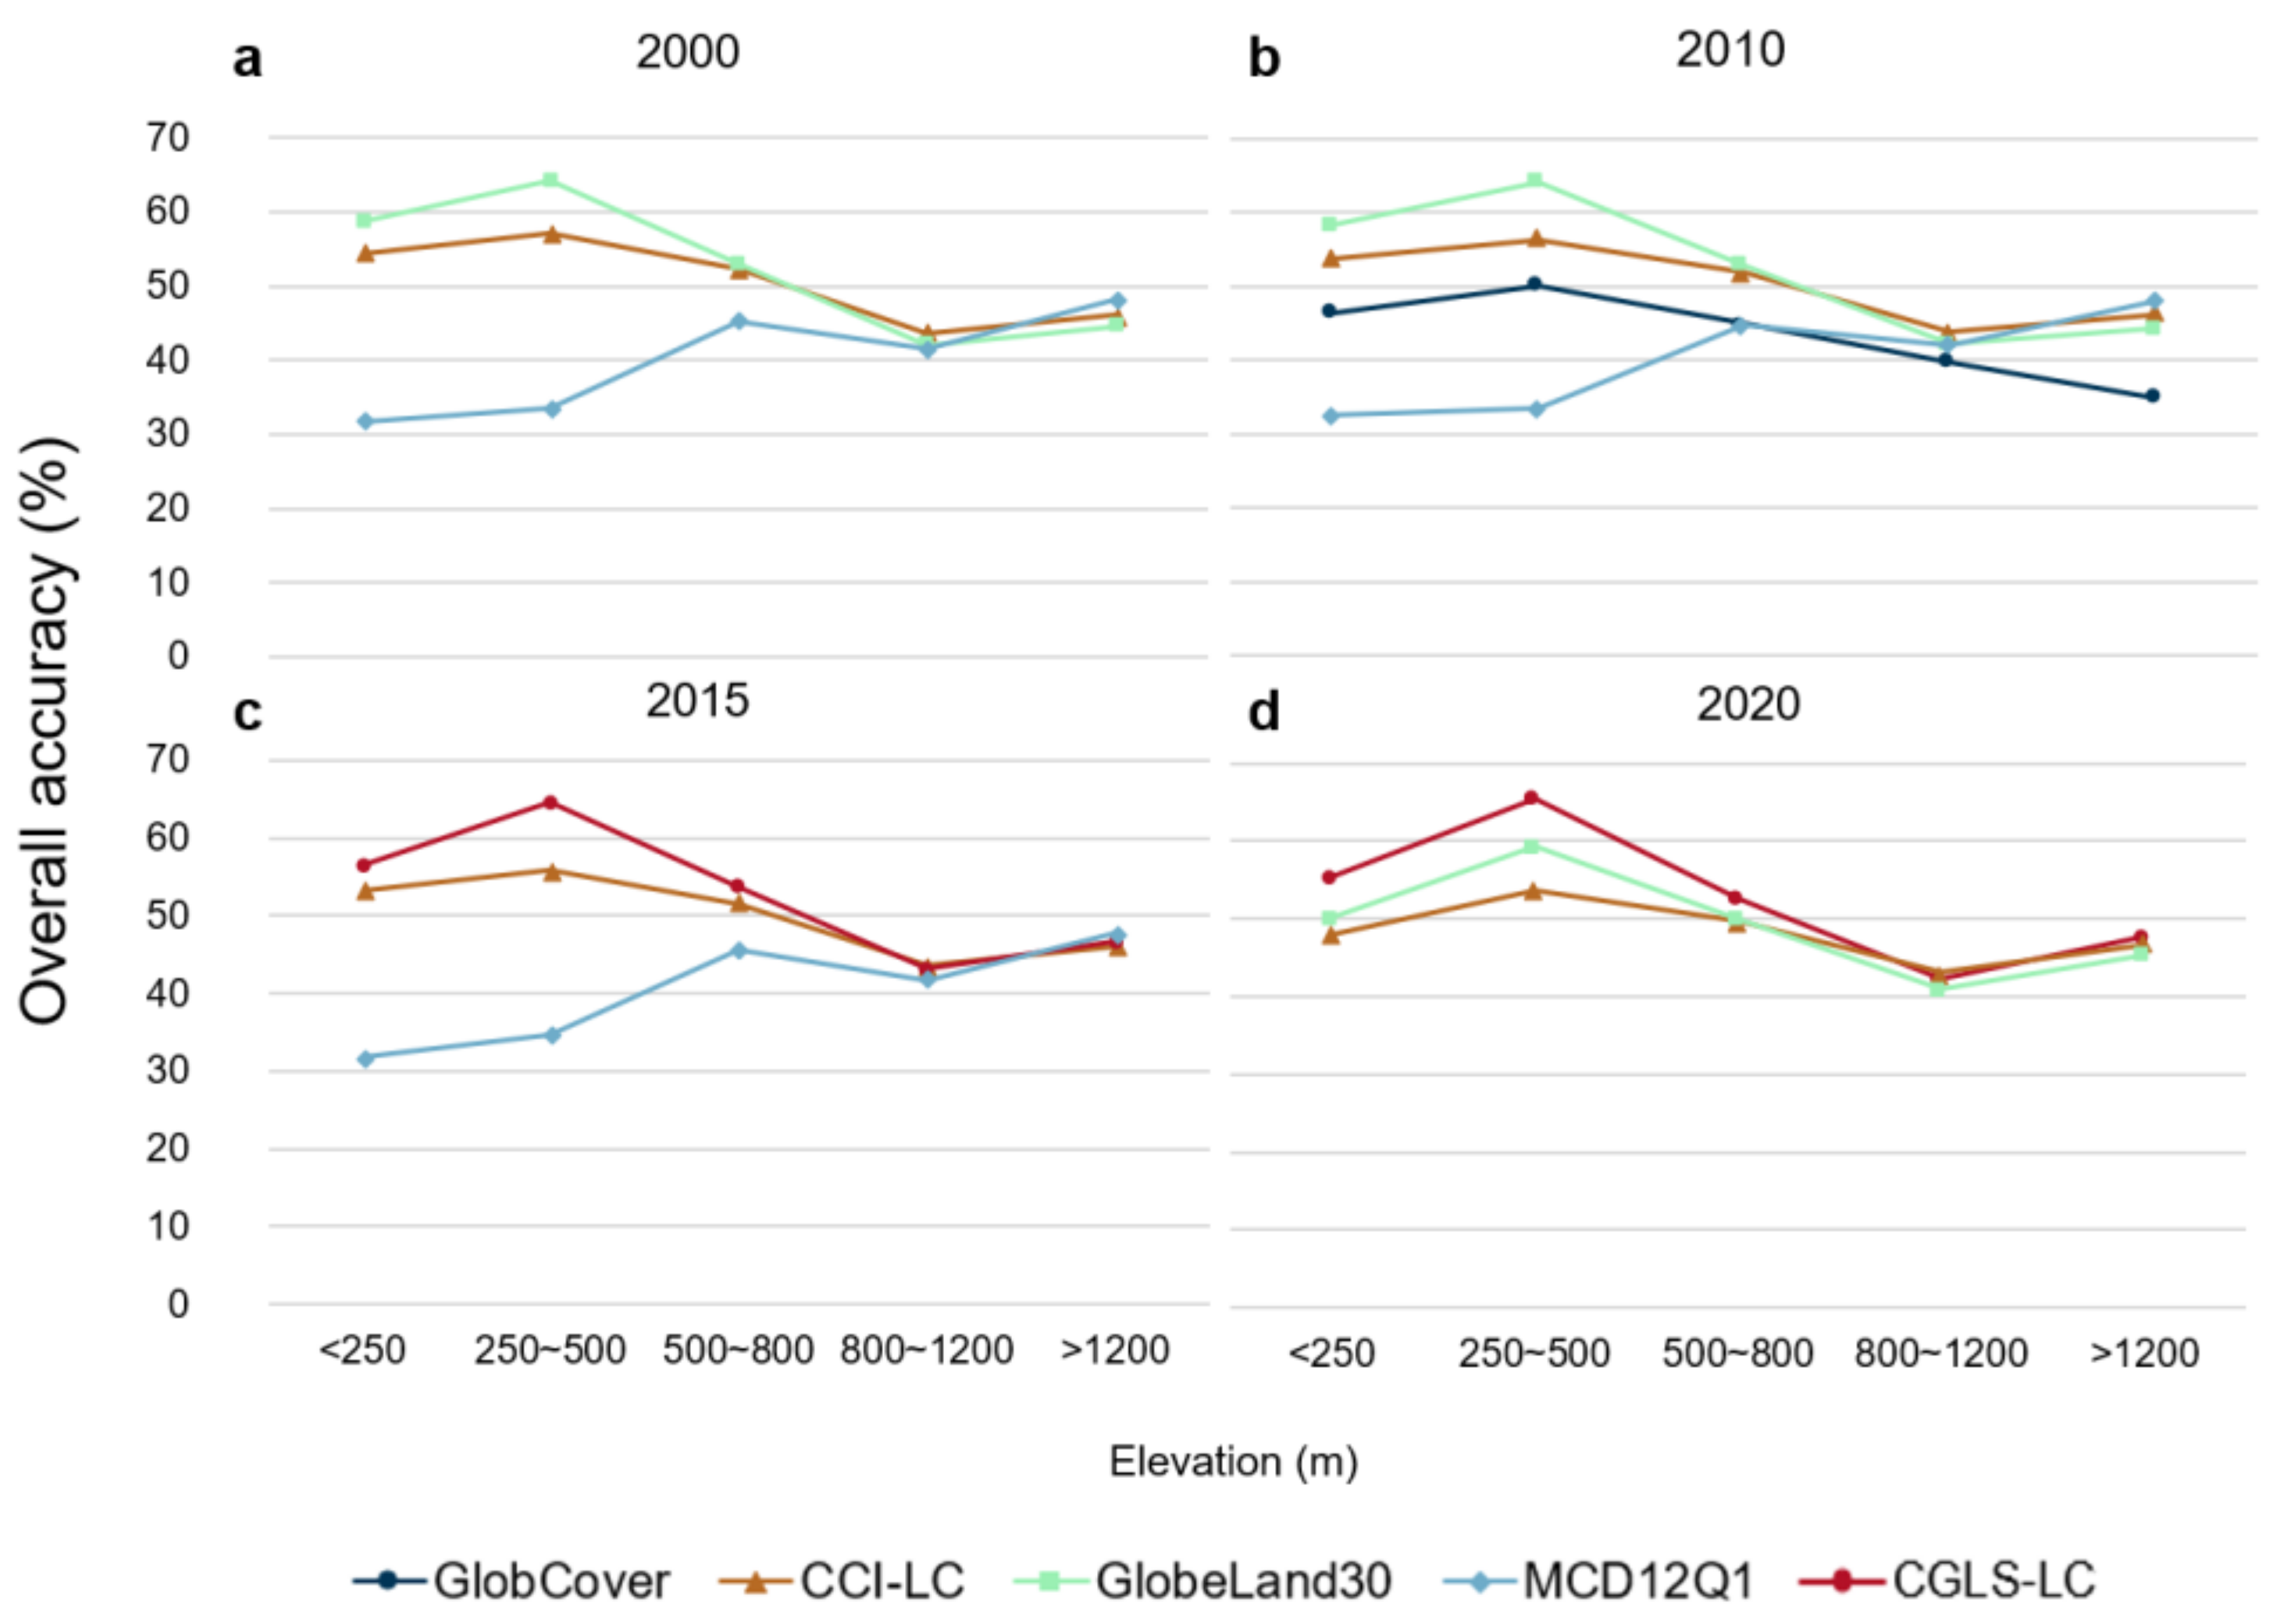
3.3.4. Overall Accuracy Evaluation under Different Elevations
To quantify the elevational patterns in the overall accuracy of different LC maps, the study area is divided into five elevation gradients (<250 m, 250–500 m, 500–800 m, 800–1200 m, and >1200 m). The results show that, except for MCD12Q1, the overall accuracy of the other four global LC datasets generally decreases with increases in elevation (Figure 9). In the study area, the overall accuracy is the highest (up to 65.5%) between 250 m and 500 m, that is, regions mainly covered by hills with low elevation. However, the accuracy is rapidly reduced to nearly 40% when the elevation rises to above 800 m. Moreover, it is found that the overall accuracy of CCI-LC, GlobeLand30, and CGLS-LC below 800 m in elevation is greater than 50%. Under elevation gradients below 800 m, GlobeLand30 has the highest accuracy in 2000 and 2010, while CGLS-LC gains the highest accuracy in epochs 2015 and 2020. By comparison, the overall accuracy of MCD12Q1 shows an upward trend with the increase in elevation. Furthermore, the accuracy of MCD12Q1 is lower than other LC datasets below 800 m but slightly higher than other datasets above 1200 m.
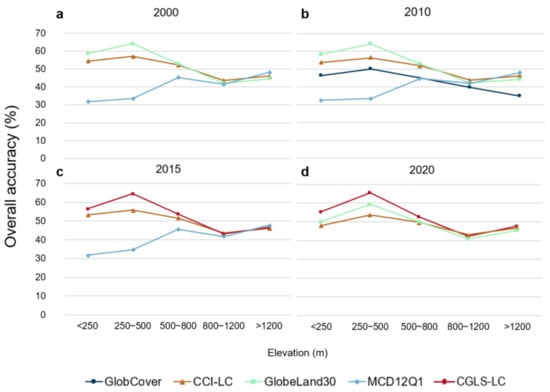
Figure 9.
Overall accuracy of land cover datasets with different elevation levels for epochs (a) 2000, (b) 2010, (c) 2015, and (d) 2020.
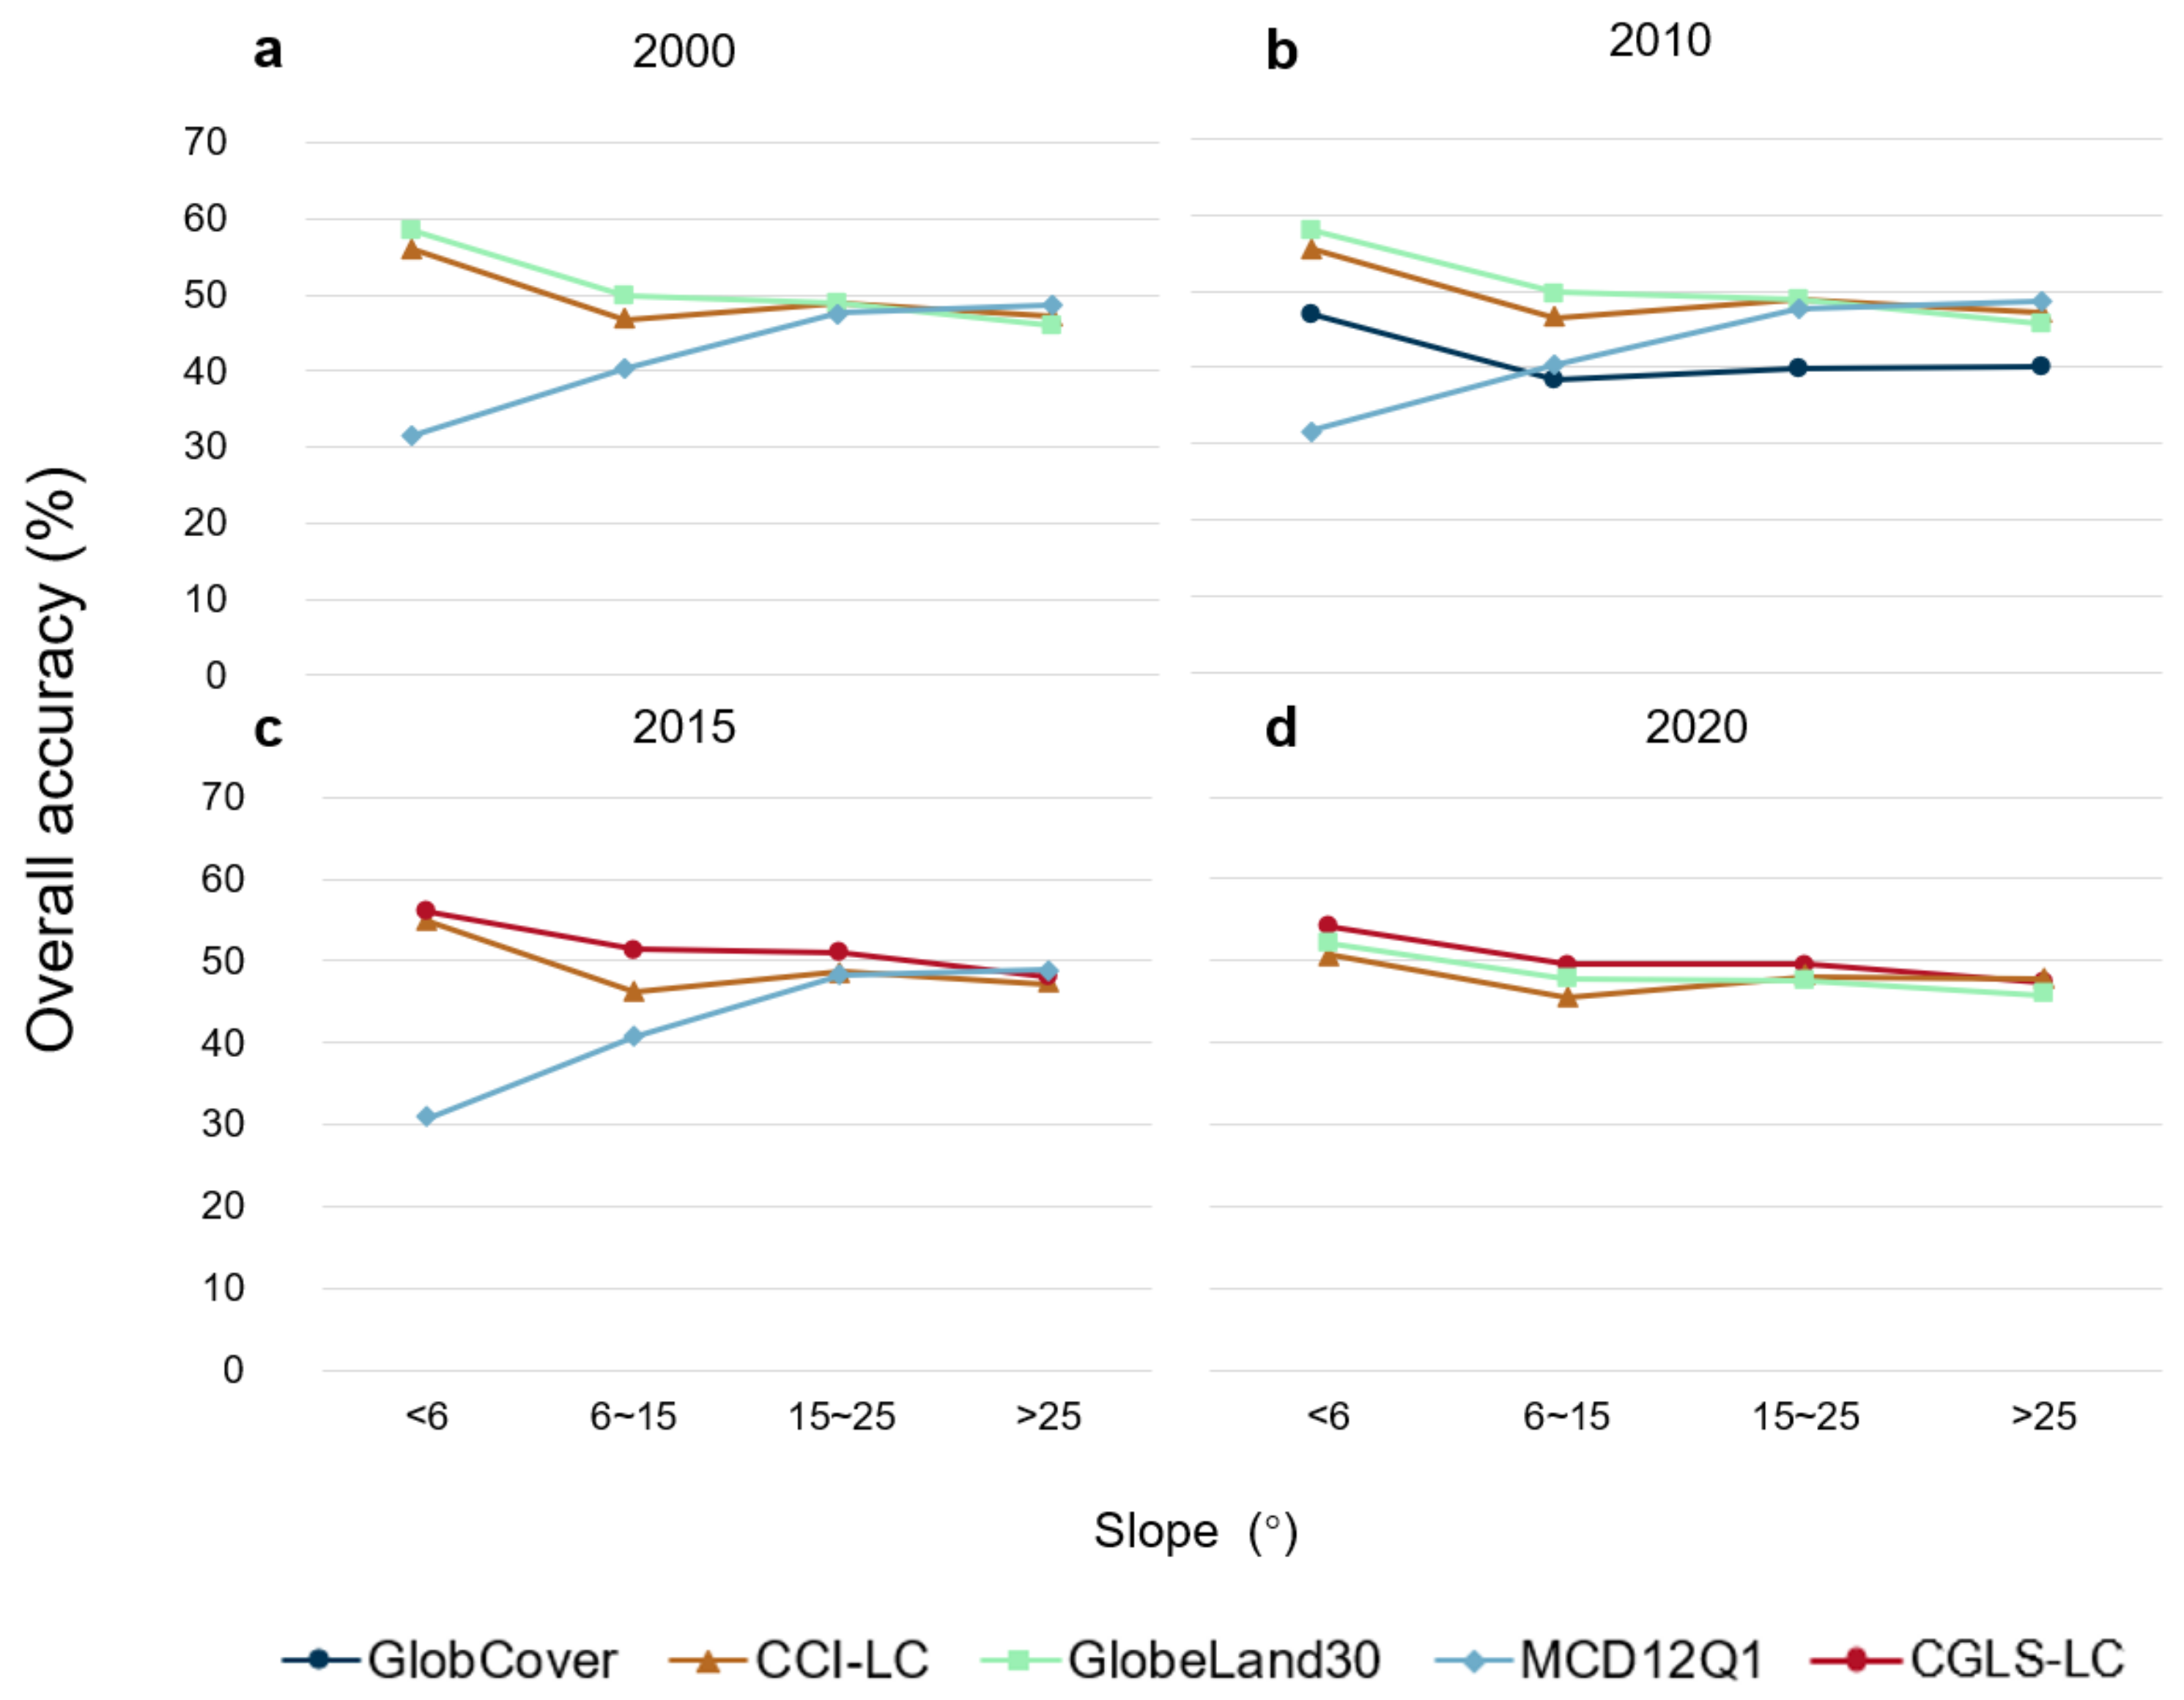
3.3.5. Overall Accuracy Evaluation under Different Slopes
In order to investigate the change patterns of overall accuracy with varied topographic slope gradients, the study area is divided into four slope grades (<6°, 6–15°, 15–25°, and >25°). The overall accuracy results are shown in Figure 10, in which GlobeLand30 had the best accuracy in 2000 and 2010 (58.5% and 58.0%, respectively) in a slope range below 25°. In epochs 2015 and 2020, CGLS-LC achieved the highest overall accuracy (56.1% and 54.2%, respectively) when the topographic slope is less than 25°. By comparison, MCD12Q1 has the highest overall accuracy (around 48.8%) in a slope range greater than 25° from 2000 to 2015. Overall, except for MCD12Q1, all global LC datasets present a general declining trend in overall accuracy with increases in topographic slope. Contrastingly, overall accuracy in MCD12Q1 shows an evident upward trend with rising slopes. In particular, the overall accuracy rose sharply from close to 31.0% in slopes below 6° to nearly 48.0% in slopes with a 15–25° range. This indicates that MCD12Q1 is more suited for steeply sloping areas, which are also the key areas of implementation of ecological restoration projects, e.g., the Grain for Green Project.
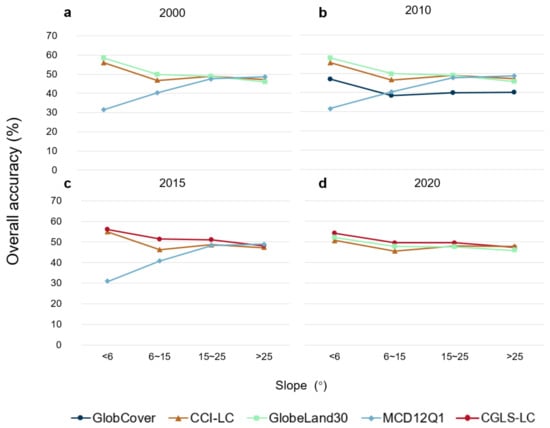
Figure 10.
Overall accuracy of land cover datasets with different slope levels for epochs (a) 2000, (b) 2010, (c) 2015, and (d) 2020.
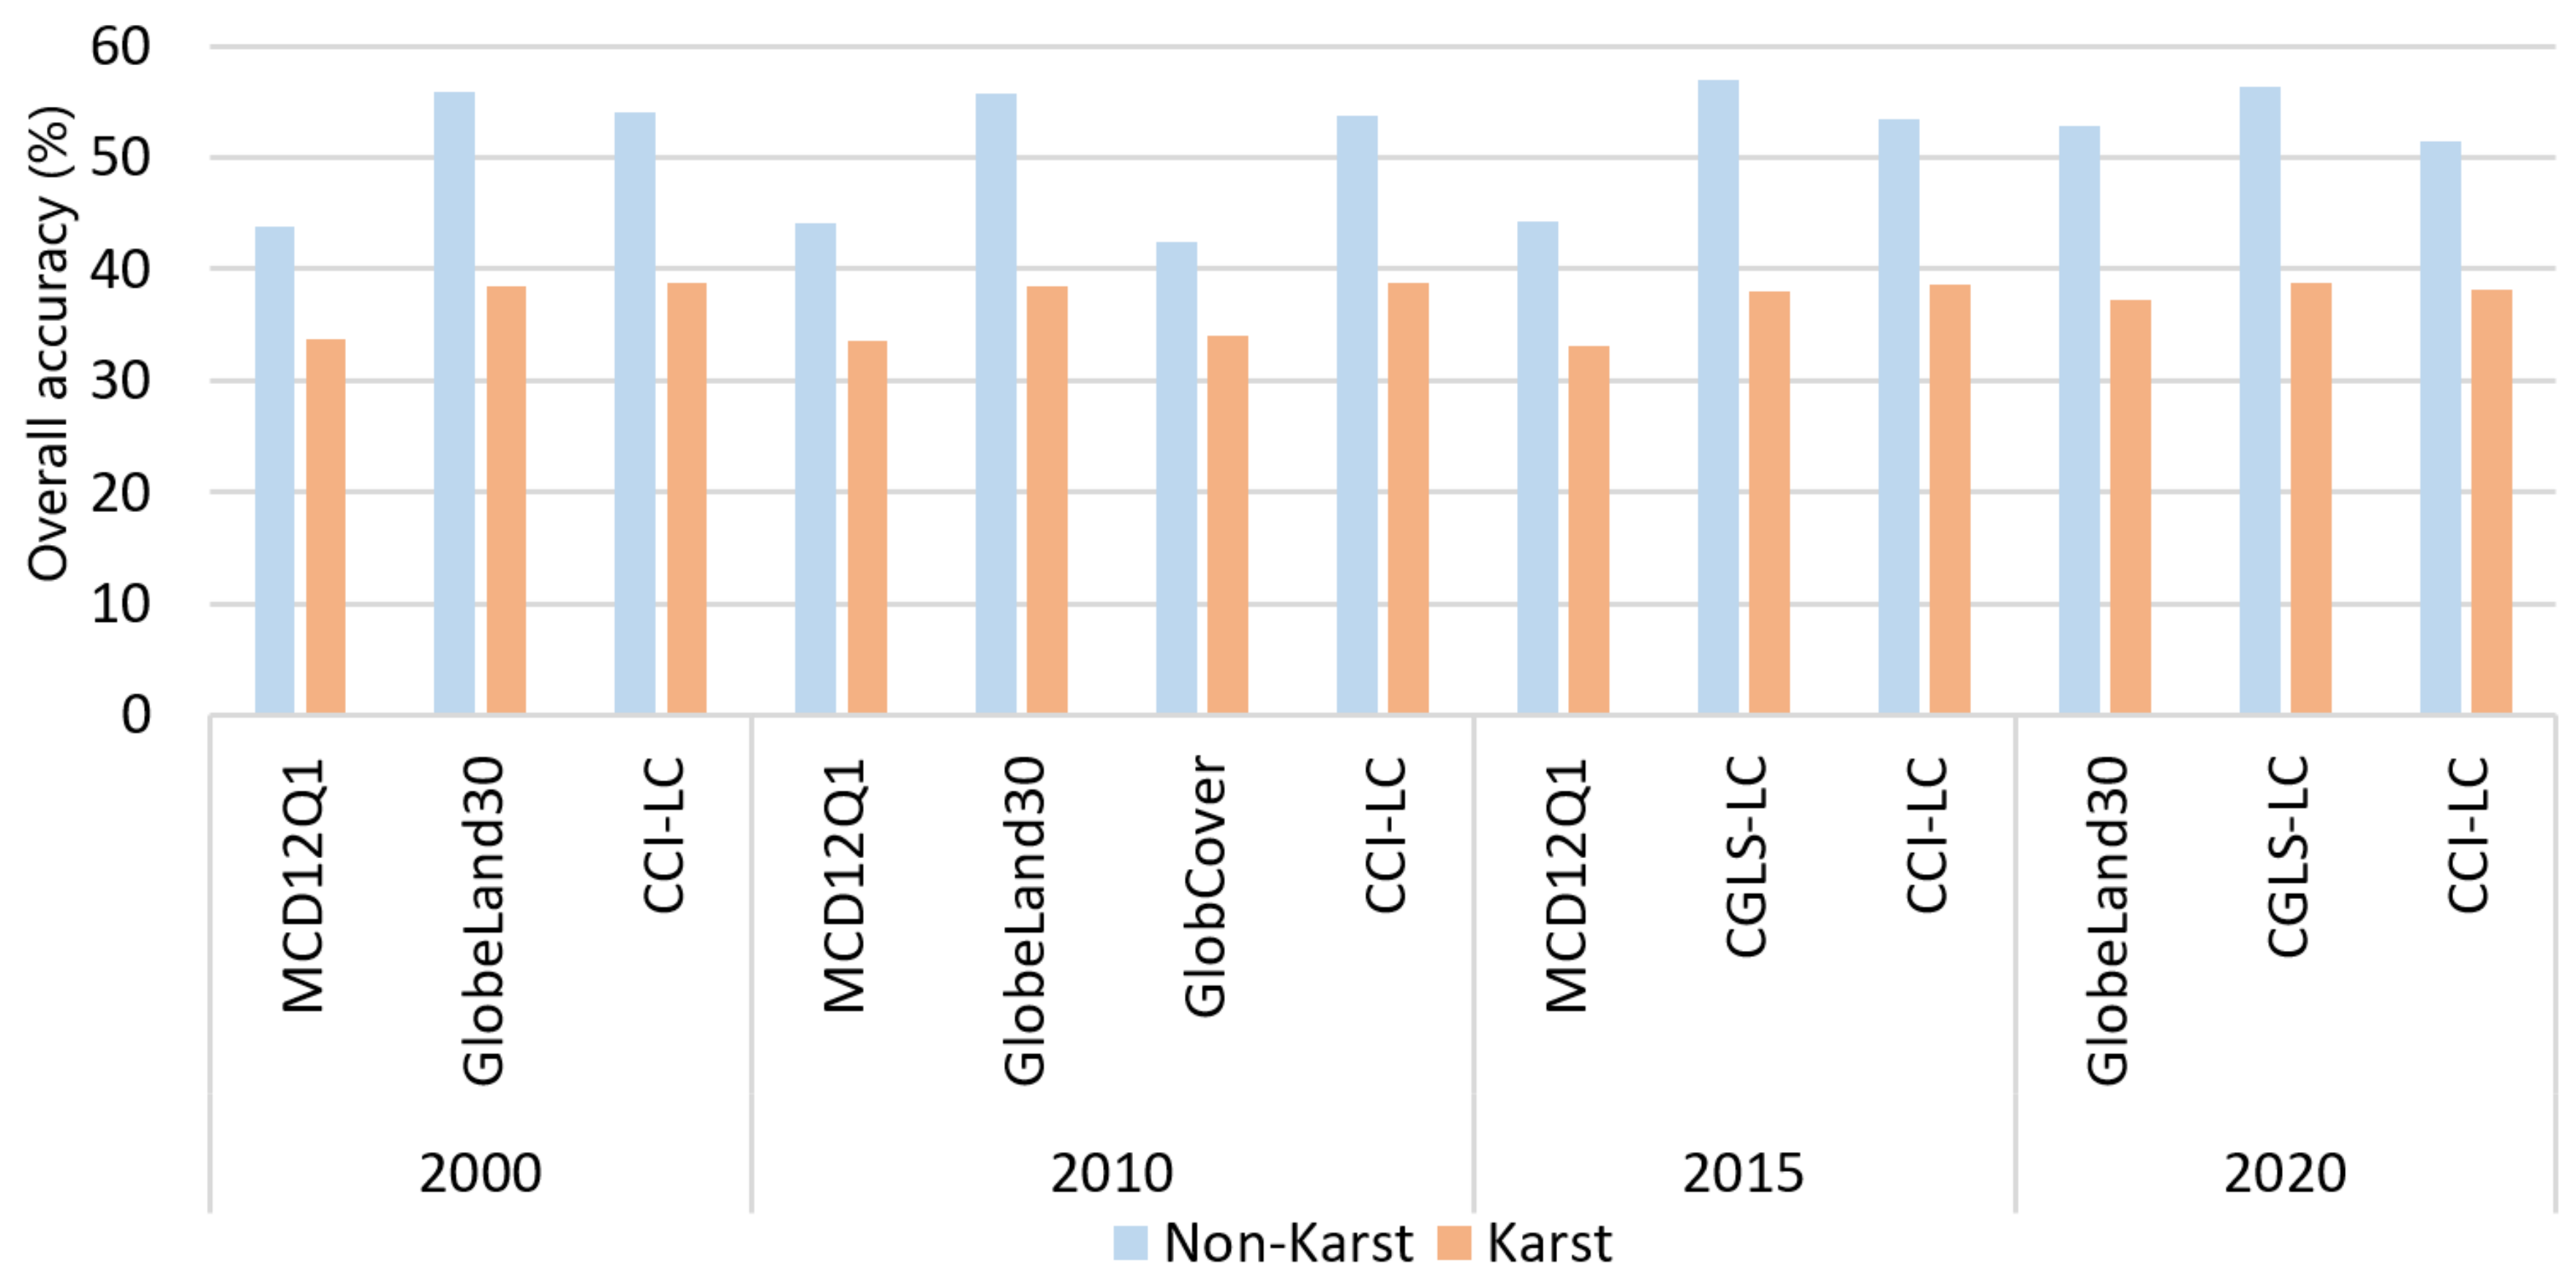
3.3.6. Accuracy Evaluation of Karst and Non-Karst Areas
As shown in Figure 11, the overall accuracy in karst areas is lower than that in non-karst areas. The average accuracy in non-karst areas is 51.2% and 36.9% in karst areas. In non-karst areas, CGLS-LC has the highest overall accuracy (56.7%), followed by GlobeLand30 (54.8%) and CCI-LC (53.2%). GlobCover and MCD12Q1 have the lowest accuracies (42.5% and 44.0%, respectively). In the karst areas, the overall accuracy of CCI-LC, GlobeLand30, and CGLS-LC is comparatively higher, with an average of about 38.3%, while the accuracy of MCD12Q1 and GlobCover is relatively low, with an average of about 33.6%.
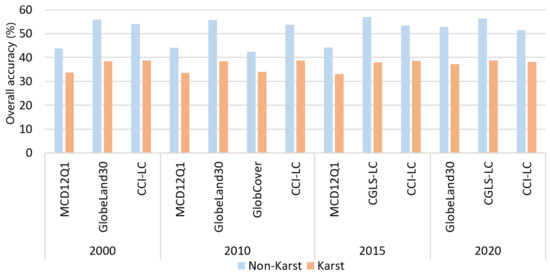
Figure 11.
Overall accuracy of various LC datasets in karst and non-karst areas during the four epochs.
4. Discussion
4.1. Comprehensive Evaluation of Five Recent Global Land Cover Datasets in the South China Karst
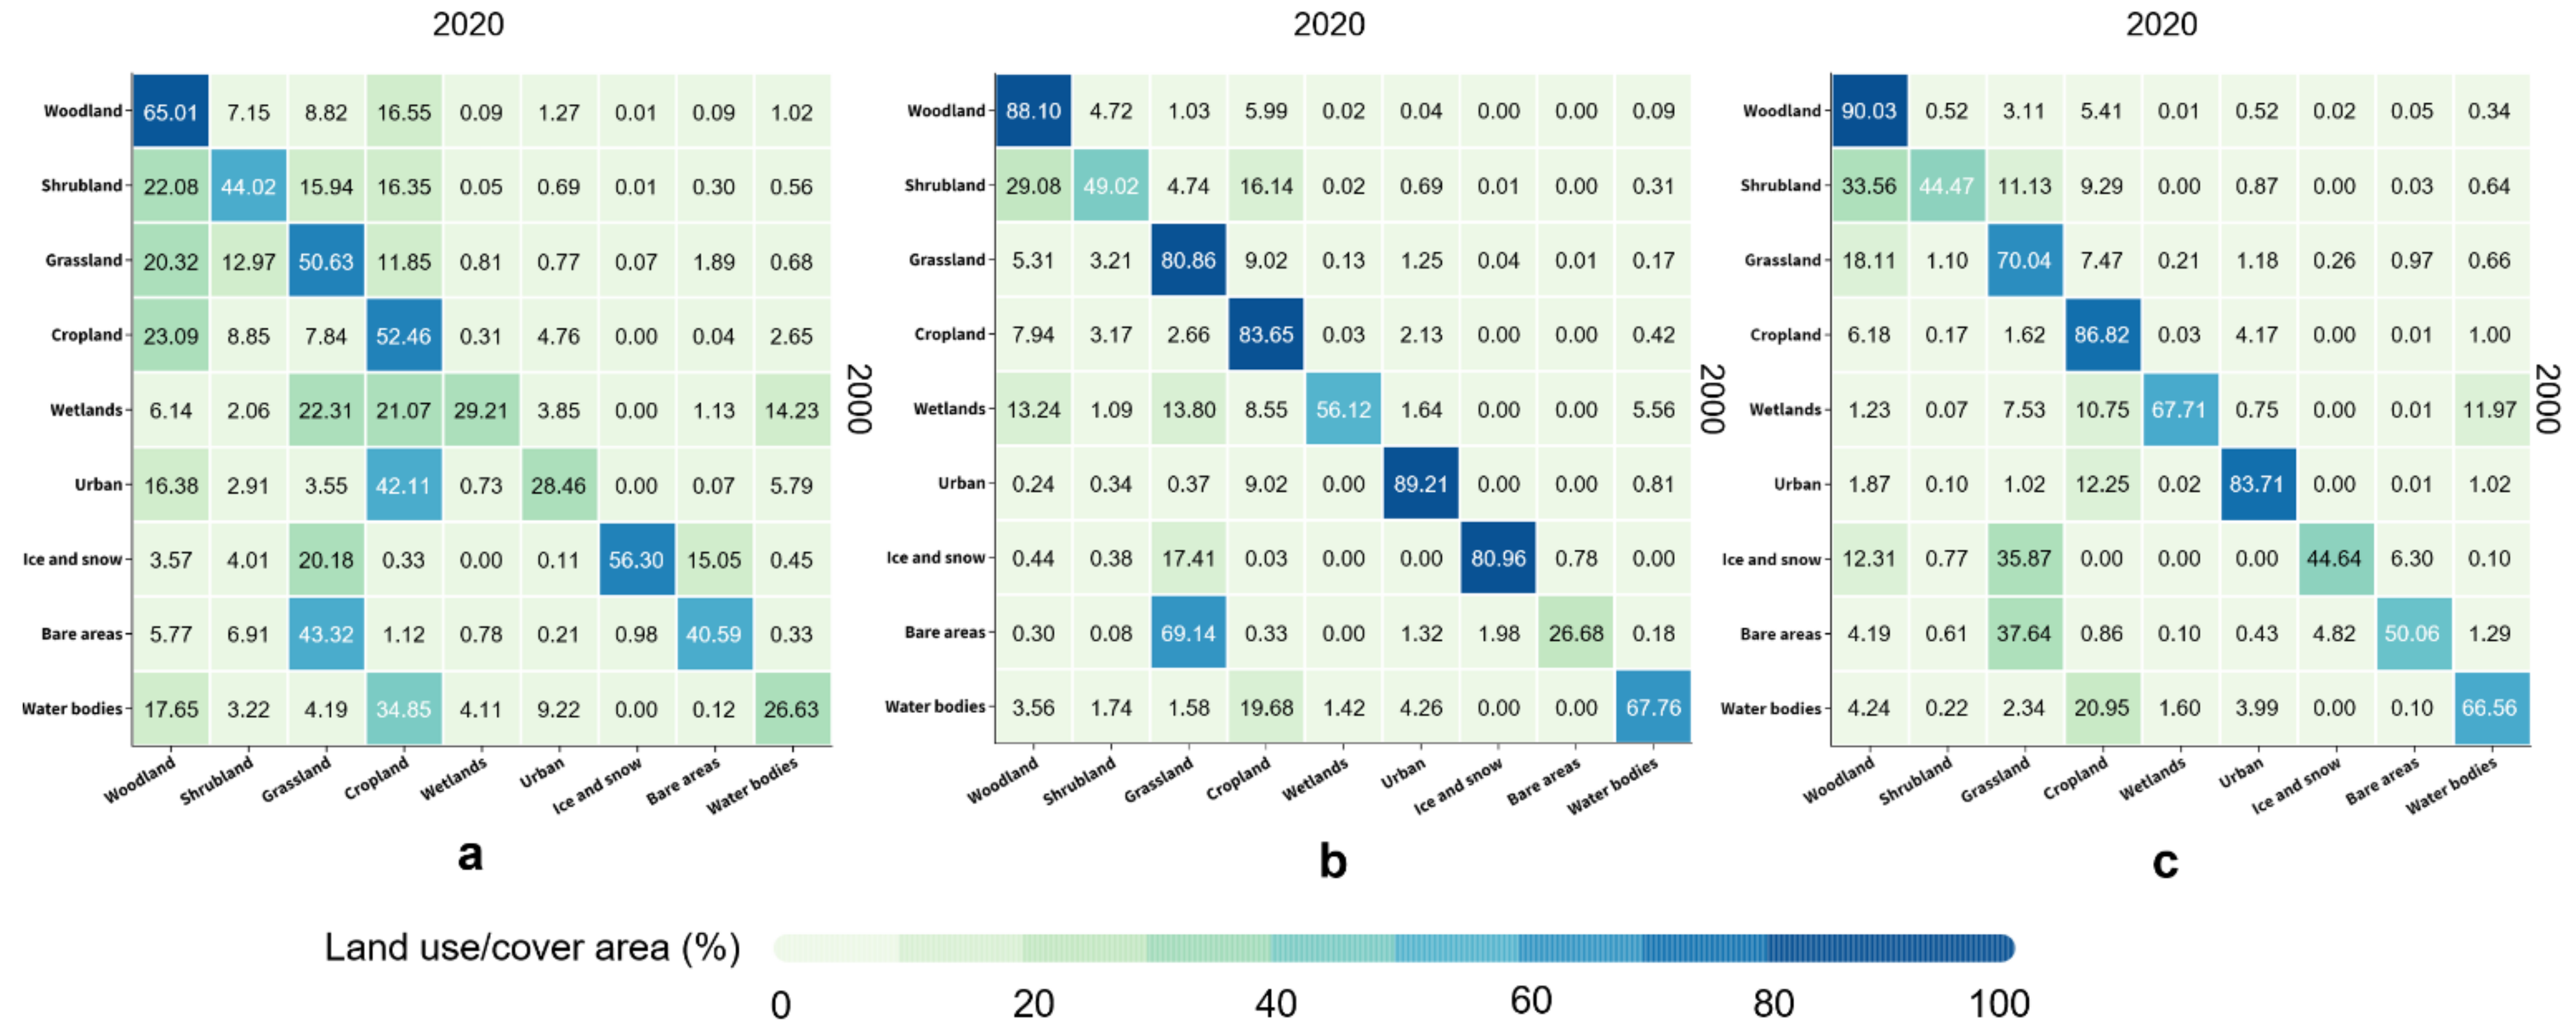
Land degradation neutrality has been listed as an important target of the UN Sustainable Development Goals (SDG 15.3). The South China Karst, as a typical land degradation area, has gained substantial attention. Accurate land cover datasets are the fundamental basis of regional land change monitoring. However, the application of different global LC datasets may lead to distinct results with regard to land use change when applied at the regional and local scales. Analyzing the land cover type conversion of the CLUD, CCI-LC, and GlobeLand30 LC datasets from 2000 to 2020 (Figure 12), it can be seen that the overall transfer pattern of the LC types is similar among the different LC datasets, but there are large differences in the specific transfer values. At present, widely used global LC datasets show large differences and poor overall accuracy in the karst areas of southern China (Figure 2 and Figure 5). On the one hand, this may be due to different sensor types, periods, classification methods, or classification schemes adopted by different datasets [52]. On the other hand, it may also be due to the terrain complexity, broken surfaces, and high spatial heterogeneity in the karst areas. This demonstrates that the application of global land cover maps in the South China Karst needs to be treated with caution.
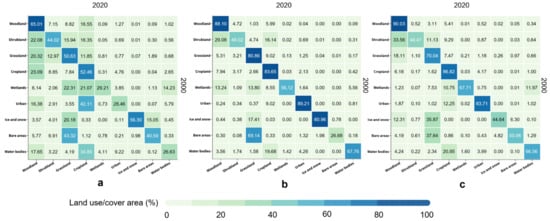
Figure 12.
The proportion of type conversion in land cover datasets from 2000 to 2020: (a) CLUD; (b) CCI-LC; (c) GlobeLand30.
Numerous studies have shown that there are large differences among different LC datasets with regard to the karst areas of southern China, especially the Yunnan–Guizhou Plateau [48,53,54,55]. For example, Zeng et al. [55] showed that the spectral features of the grasslands and shrublands could easily be confused. Classes that were misclassified as forests primarily consisted of croplands, shrublands, and grasslands distributed in southwestern China. In addition, due to the topographic relief and complex geomorphological types in this area, accurate LC datasets are required to support scientific research. It is convenient for scholars to select the most suitable LC products based on application, but only if they are well informed of the advantages and limitations of these LC datasets.
In this study, we systematically evaluated the accuracy of five commonly used global LC datasets in the South China Karst region from the aspects of the area, spatial consistency, accuracy in different terrains, and landforms. The study found that the spatial consistency of various datasets fits well in the northwestern plateau region and the eastern plain region of the Hunan and Hubei provinces (Figure 4). However, in areas with complex relief, such as the Yunnan–Guizhou Plateau, the spatial consistency is poor. Spatial consistency can provide users with an assessment of the accuracy of LC types. In addition, the inconsistency between different datasets indicates that the areas are easily misclassified and that data producers should focus on these areas, such as the aforementioned Yunnan–Guizhou Plateau and the mountainous areas of western Guangxi. Overall, the CGLS-LC dataset has the highest accuracy in 2015 and 2020 (52.0% and 51.8%, respectively) (Figure 5). In 2000 and 2010, the GlobeLand30 has the highest overall accuracy (51.4% and 51.2%). GlobCover has the worst accuracy in South China, only 40.3%. Ran et al. [54] used China’s 1:100,000 LC map to verify other global datasets and found that the accuracy of the MODIS dataset in China was 56.85%. In this study, the accuracy of MCD12Q1 in South China is only 41%. However, MCD12Q1 has the best accuracy compared to the other LC datasets in areas where the elevation is above 1200 m or the slope is above 25°. In the low elevation karst area of southern China, human activities are intense, and the surface is highly broken, so the coarse resolution is not able to reflect the feature well. However, there is little human activity in high elevation areas, so the LC type is relatively unique, and the accuracy is therefore better.
Through this accuracy evaluation of provinces in South China, it was found that the accuracy of the LC datasets is comparatively high in the Hubei, Hunan, and Guangdong provinces in the eastern plains and hilly regions (Figure 6). The Chongqing and Sichuan provinces, which are located in the Sichuan Basin and plateau areas, have significant topographic relief and poor accuracy in the LC datasets. The Yunnan and Guizhou provinces are located on the Yunnan–Guizhou Plateau, with widely distributed karst landforms and the lowest LC accuracy. This is consistent with previous research. Wu et al. [56] used China’s 1:100,000 LC dataset to verify global LC datasets. These datasets were found to exhibit high spatial heterogeneity and low spatial accuracy in the hilly and highly fragmented areas of southern China. Yang et al. [30] concluded that they have low accuracy in the hilly areas of Southeast China and the Sichuan Basin by checking the accuracy of different global LC datasets.
4.2. Impact of Landscape Heterogeneity on Dataset Accuracy
The local accuracy of LC datasets in mountainous or hilly areas is low. Due to the heterogeneity of the landscape, the ground spectral information will become complex, and the remote sensing images are not easy to distinguish, which affects the accuracy of LC classification and mapping. Therefore, landscape heterogeneity is considered to be one of the main factors affecting the mapping accuracy of LC datasets [57,58].
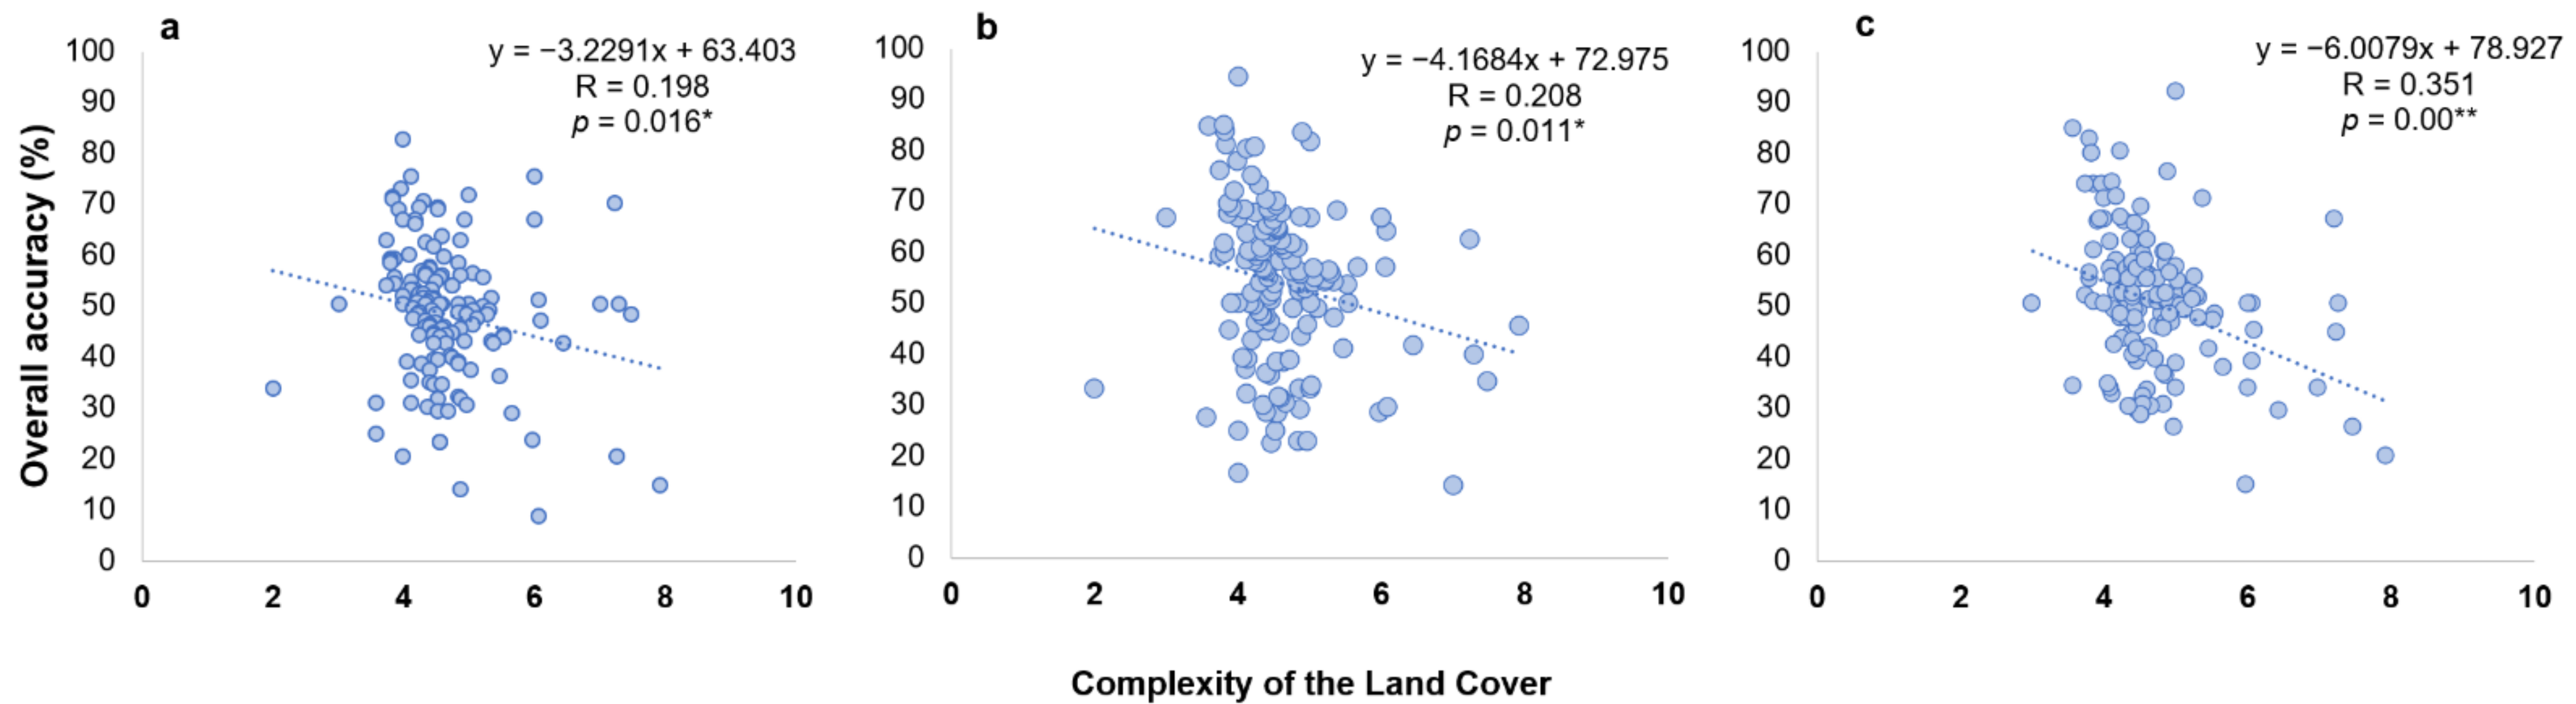
Using epoch 2020 as an example, this study examined the relationship between LC complexity and LC accuracy at the city scale (Figure 13). It was found that the more complex and heterogeneous, the poorer accuracy of the LC datasets. There is a significant negative correlation between LC complexity and accuracy. Yang et al. [30] also revealed that there is a clear correlation between local precision and the degree of landscape heterogeneity. Likewise, Liang et al. [33] found that the higher the landscape heterogeneity, the worse consistency among various LC datasets.
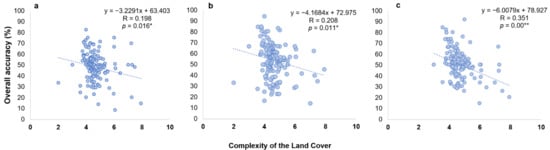
Figure 13.
Correlation between the weighted complexity of land cover types and overall accuracy in epoch 2020: (a) CCI-LC (b); CGLS-LC; (c) GlobeLand30. The asterisks * and ** denote the significance level of 95% and 99%, respectively.
4.3. Suggestions for Future Global Land Cover Mapping
Inconsistency in classification schemes across LC datasets and differentiability between categories is an important factor affecting the accuracy of LC datasets [59]. When the classification scheme of each dataset is converted, the uncertainty of LC is generated. In addition, the type of mixed feature lacks an exact threshold definition, which makes it challenging to accurately distinguish the types of mixed objects. In addition, for some global LC datasets, the classification scheme cannot accurately describe the land cover types of all countries and regions considering the diversity of ecosystems. When evaluating the accuracy of different datasets, the reclassification process will inevitably introduce errors and lead to incorrect statistics. Therefore, it is possible to classify land cover according to a uniform standard among various countries and institutions, and in this way, errors caused by inconsistent definitions can be avoided. Furthermore, the classification accuracy can be improved by integrating multiple LC datasets and combining the advantages of different datasets [60].
In this paper, it was found that the accuracy of high-resolution LC datasets is better than low-resolution datasets. High-resolution image data can finely distinguish spectral features among ground objects, and more fine-scale information can be obtained [61]. Accordingly, high-resolution datasets are more advantageous than low-resolution datasets. Nonetheless, the overall accuracy is not entirely determined by the spatial resolution of the dataset, but also the classification strategy and method [30]. In our study, the overall accuracy of the GlobeLand30 dataset, with 30 m resolution, and the CGLS-LC dataset, with 100 m resolution, is higher than other low-resolution datasets, but in 2020, the accuracy of the CGLS-LC dataset is even better than GlobeLand30. Due to the increasing resolution of remote sensing data, recently produced LC datasets are moving toward higher resolution development. For instance, Tsinghua University developed the global-scale FROM-GLC2017 land cover data at 10 m resolution [62], and the Esri company recently released the ESRI2020 Land Cover dataset (resolution of 10 m) [63]. In addition, the ESA has also published the WorldCover 2020 land cover dataset at 10 m resolution (https://esa-worldcover.org/en/data-access (accessed on 5 March 2022)). These global land cover datasets all use Sentinel satellite data and deep learning algorithms for classification. Additionally, the ESA dataset uses data both from the Sentinel-1 radar satellite and the Sentinel-2 optical satellite for fusion. Using radar satellite data can reduce the influence of clouds and gather more feature information to improve classification accuracy. In contrast, optical images are seriously affected by clouds and rain in areas like the South China Karst [22], and the small amount of image data may possibly lead to poor classification accuracy. Therefore, for cartographers, the fusion of radar and optical data is a future direction to focus on.
Moreover, datasets from different countries and institutions generally have higher accuracy in their regions due to the larger collection of training samples. However, considering the sampling cost and convenience, in some areas with large topographic relief and high landscape heterogeneity, the sampling points are sparse, so it is more difficult to accurately distinguish the land cover type in these areas [31]. In the future, researchers may consider using crowdsourcing data in the global LC mapping process and develop data collection software or websites with international cooperation so that global data volunteers can share local data to enrich the database sample [64,65]. Currently, the Chinese Academy of Sciences has adopted the “crowdsourcing-deep learning-expert knowledge” strategy to update the vegetation type map of China, which can effectively increase the sample size and greatly improve mapping accuracy [66]. Researchers may also consider applying deep learning techniques to geotagged photos for validation and thus increase the number of validation samples [67].
5. Conclusions
In recent years, with the development of advanced classification methods such as machine learning and deep learning, as well as the acquisition of high-quality remote sensing data, numerous global-scale LC datasets have been produced, which has greatly enriched users’ choices. The purpose of this paper was to investigate the applicability of commonly used global LC products in the karst region of southern China in order to make targeted dataset recommendations for potential users. To achieve this purpose, we comprehensively evaluated the accuracy of CCI-LC, MCD12Q1, GlobCover, GlobeLand30, and CGLS-LC datasets in the 2000, 2010, 2015, and 2020 epochs.
Our results demonstrate that the application of global land cover maps in the South China Karst needs to be treated with caution considering low accuracy in the region. Specifically, the CGLS-LC dataset has the highest overall accuracy (52.0% and 51.8%) in epochs 2015 and 2020. The GlobeLand30 dataset has the highest overall accuracy (51.4% and 51.2%) in 2000 and 2010. The least accurate dataset in 2000 and 2015 is MCD12Q1 (41.2% and 41.3%). GlobCover has the lowest accuracy, 40.3%, in epoch 2010, and CCI-LC has the lowest accuracy, 48.0%, in 2020. Overall, the accuracy of the CGLS-LC dataset is the best in the South China Karst, but the accuracy of MCD12Q1 and GlobCover is the worst.
This study further distinguishes the differences in the accuracy of global LC products under varied geomorphic types and topographic conditions. For karst areas, the CGLS-LC and CCI-LC datasets are recommended, while the CGLS-LC and GlobeLand30 datasets with high accuracy are recommended for non-karst areas. Furthermore, MCD12Q1 has the best accuracy compared to other datasets when the elevation is above 1200 m. In 2000 and 2010, GlobeLand30 has the best accuracy in the altitude range below 800 m. While in epochs 2015 and 2020, the overall accuracy of CGLS-LC is higher below 800 m. Furthermore, the accuracy of the MCD12Q1 from 2000 to 2015 increases with increasing topographic slopes, and the accuracy is best with a slope greater than 25°. In areas with slopes less than 25°, the GlobeLand30 and CGLS-LC datasets have the highest accuracy.
The karst area in southern China has significant topographic relief and complex and rugged terrain. For researchers studying this area, a more accurate LC dataset is the basis for conducting various studies. Although existing LC datasets are valuable data sources, their accuracy in the karst areas of southern China remains limited. With the development of high-quality data sources and more advanced algorithms, more attention should be paid to areas with complex landforms to improve the accuracy of LC datasets in the future.
Author Contributions
Conceptualization, J.P. and P.L.; methodology, P.L. and J.P.; software, P.L. and H.G.; validation, P.L. and H.G.; formal analysis, P.L., J.P., H.G., H.T., H.F. and L.W.; investigation, P.L.; resources, J.P. and L.W.; data curation, P.L. and J.P.; writing—original draft preparation, P.L. and J.P.; writing—review and editing, J.P., P.L., H.G., H.T., H.F. and L.W.; visualization, P.L.; supervision, J.P.; project administration, J.P.; funding acquisition, J.P. and L.W. All authors have read and agreed to the published version of the manuscript.
Funding
This research was funded by National Key Research and Development Program of China (2021YFE0117900), the Guangdong Basic and Applied Basic Research Foundation (2021A1515110442), the Foundation of President of the Zhongke-Ji’an Institute for Eco-Environmental Sciences (ZJIEES-2022-02), and the Science and Technology Project of Jinggangshan Agricultural High-Tech Industrial Demonstration Zone (No. 202151).
Acknowledgments
The authors would like to give the special gratitude to the contributors of the five global land cover datasets assessed in this research.
Conflicts of Interest
The authors declare no conflict of interest.
Appendix A
Table A1.
Area of each class type in each land cover dataset (unit: km2).
Table A1.
Area of each class type in each land cover dataset (unit: km2).
| Year | Woodland | Shrubland | Grassland | Cropland | Wetlands | Urban | Permanent Snow and Ice | Bare Areas | Waterbodies | |
|---|---|---|---|---|---|---|---|---|---|---|
| CLUD | 2000 | 728,715 | 278,529 | 347,244 | 499,276 | 8768 | 25,409 | 897 | 16,190 | 31,200 |
| 2010 | 730,111 | 278,909 | 345,097 | 492,068 | 8861 | 31,623 | 896 | 16,255 | 32,436 | |
| 2015 | 727,777 | 278,437 | 344,843 | 486,813 | 9081 | 39,047 | 896 | 16,261 | 33,099 | |
| 2020 | 746,628 | 263,644 | 332,866 | 489,709 | 9263 | 46,412 | 988 | 14,525 | 34,519 | |
| CCI-LC | 2000 | 801,173 | 217,686 | 216,016 | 659,080 | 5571 | 11,078 | 1095 | 341 | 24,380 |
| 2010 | 804,229 | 206,879 | 213,141 | 659,747 | 5891 | 21,407 | 1095 | 299 | 23,733 | |
| 2015 | 804,551 | 205,416 | 213,042 | 656,971 | 5952 | 25,331 | 1095 | 298 | 23,764 | |
| 2020 | 836,207 | 170,856 | 210,989 | 660,716 | 4138 | 29,348 | 1005 | 134 | 20,990 | |
| MCD12Q1 | 2001 | 877,823 | 141,215 | 745,231 | 124,007 | 6669 | 26,314 | 249 | 8037 | 11,225 |
| 2010 | 883,985 | 160,063 | 719,713 | 121,566 | 6689 | 30,172 | 207 | 7101 | 11,267 | |
| 2015 | 903,530 | 172,551 | 701,537 | 104,934 | 8301 | 31,615 | 188 | 6736 | 11,375 | |
| GlobeLand30 | 2000 | 971,701 | 34,746 | 288,020 | 576,385 | 6163 | 20,670 | 2938 | 2836 | 32,497 |
| 2010 | 969,796 | 36,642 | 281,248 | 581,056 | 6272 | 24,115 | 2716 | 3749 | 30,430 | |
| 2020 | 977,680 | 24,512 | 247,871 | 588,570 | 5616 | 51,384 | 2347 | 4989 | 33,871 | |
| GlobCover | 2009 | 631,519 | 502,346 | 57,643 | 705,992 | 100 | 13,538 | 5721 | 4157 | 18,069 |
| CGLS-LC | 2015 | 1,269,967 | 24,200 | 177,423 | 380,114 | 8041 | 59,542 | 717 | 6051 | 16,063 |
| 2019 | 1,241,843 | 14,629 | 179,212 | 416,680 | 10,154 | 51,335 | 749 | 5342 | 18,203 |
Table A2.
Overall accuracy of land cover datasets by province (unit: %).
Table A2.
Overall accuracy of land cover datasets by province (unit: %).
| Sichuan | Hubei | Chongqing | Hunan | Yunnan | Guizhou | Guangxi | Guangdong | ||
|---|---|---|---|---|---|---|---|---|---|
| 2000 | CCI-LC | 53.4 | 59.5 | 49.7 | 57.0 | 39.7 | 34.9 | 51.3 | 58.2 |
| GlobeLand30 | 53.5 | 57.6 | 48.5 | 62.0 | 38.9 | 35.1 | 56.0 | 64.5 | |
| MCD12Q1 | 42.8 | 52.9 | 19.3 | 46.0 | 41.4 | 30.9 | 41.3 | 38.6 | |
| 2010 | CCI-LC | 53.3 | 59.6 | 49.8 | 54.9 | 39.9 | 35.2 | 51.3 | 58.1 |
| GlobCover | 34.0 | 47.3 | 43.9 | 46.6 | 35.5 | 35.0 | 44.9 | 50.1 | |
| GlobeLand30 | 53.5 | 57.8 | 48.6 | 61.6 | 38.3 | 35.6 | 55.5 | 64.1 | |
| MCD12Q1 | 42.6 | 54.5 | 20.0 | 45.0 | 41.4 | 30.9 | 42.0 | 39.0 | |
| 2015 | CCI-LC | 53.2 | 59.0 | 49.3 | 54.2 | 39.8 | 35.0 | 51.0 | 57.7 |
| CGLS-LC | 55.2 | 61.6 | 45.1 | 63.0 | 40.4 | 32.6 | 55.9 | 63.1 | |
| MCD12Q1 | 43.2 | 53.1 | 20.4 | 44.5 | 41.0 | 30.3 | 41.7 | 40.8 | |
| 2020 | CCI-LC | 52.6 | 56.6 | 53.6 | 50.9 | 41.3 | 33.4 | 47.0 | 50.6 |
| CGLS-LC | 56.6 | 61.1 | 54.5 | 63.0 | 40.3 | 31.3 | 51.1 | 60.0 | |
| GlobeLand30 | 53.3 | 54.6 | 51.7 | 55.6 | 40.8 | 32.0 | 48.5 | 53.9 | |
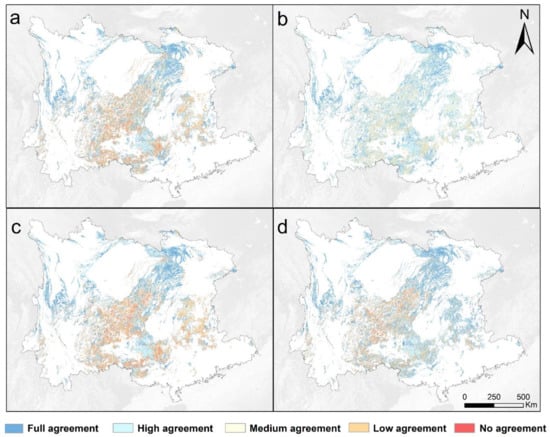
Figure A1.
Spatial agreement among different LC maps in the karst region. Consistency is defined by the number of the LC dataset with the same cover type in each pixel for epochs (a) 2000, (b) 2010, (c) 2015, and (d) 2020.
Figure A1.
Spatial agreement among different LC maps in the karst region. Consistency is defined by the number of the LC dataset with the same cover type in each pixel for epochs (a) 2000, (b) 2010, (c) 2015, and (d) 2020.
References
- Song, X.-P.; Hansen, M.C.; Stehman, S.V.; Potapov, P.V.; Tyukavina, A.; Vermote, E.F.; Townshend, J.R. Global land change from 1982 to 2016. Nature 2018, 560, 639–643. [Google Scholar] [CrossRef] [PubMed]
- Nguyen, L.H.; Joshi, D.R.; Clay, D.E.; Henebry, G.M. Characterizing land cover/land use from multiple years of Landsat and MODIS time series: A novel approach using land surface phenology modeling and random forest classifier. Remote Sens. Environ. 2020, 238, 111017. [Google Scholar] [CrossRef]
- Dosdogru, F.; Kalin, L.; Wang, R.Y.; Yen, H. Potential impacts of land use/cover and climate changes on ecologically relevant flows. J. Hydrol. 2020, 584, 124654. [Google Scholar] [CrossRef]
- Sterling, S.M.; Ducharne, A.; Polcher, J. The impact of global land-cover change on the terrestrial water cycle. Nat. Clim. Chang. 2013, 3, 385–390. [Google Scholar] [CrossRef]
- Zhang, Z.; Wang, X.; Zhao, X.; Liu, B.; Yi, L.; Zuo, L.; Wen, Q.; Liu, F.; Xu, J.; Hu, S. A 2010 update of National Land Use/Cover Database of China at 1:100000 scale using medium spatial resolution satellite images. Remote Sens. Environ. 2014, 149, 142–154. [Google Scholar] [CrossRef]
- Findell, K.L.; Berg, A.; Gentine, P.; Krasting, J.P.; Lintner, B.R.; Malyshev, S.; Santanello, J.A.; Shevliakova, E. The impact of anthropogenic land use and land cover change on regional climate extremes. Nat. Commun. 2017, 8, 989. [Google Scholar] [CrossRef]
- Friedl, M.A.; McIver, D.K.; Hodges, J.C.; Zhang, X.Y.; Muchoney, D.; Strahler, A.H.; Woodcock, C.E.; Gopal, S.; Schneider, A.; Cooper, A. Global land cover mapping from MODIS: Algorithms and early results. Remote Sens. Environ. 2002, 83, 287–302. [Google Scholar] [CrossRef]
- Friedl, M.A.; Sulla-Menashe, D.; Tan, B.; Schneider, A.; Ramankutty, N.; Sibley, A.; Huang, X. MODIS Collection 5 global land cover: Algorithm refinements and characterization of new datasets. Remote Sens. Environ. 2010, 114, 168–182. [Google Scholar] [CrossRef]
- Defourny, P.; Kirches, G.; Brockmann, C.; Boettcher, M.; Peters, M.; Bontemps, S.; Lamarche, C.; Schlerf, M.; Santoro, M. Land cover CCI. In Proceedings of the 3rd GOFC-GOLD Symposium, Wageningen, The Netherlands, 15–19 April 2013; Volume 2, p. 325. [Google Scholar]
- Bontemps, S.; Defournya, P.; Van Bogaert, E.; Weber, J.L.; Arino, O. GlobCorine—A joint EEA-ESA project for operational land dynamics monitoring at pan-European scale. In Proceedings of the 33rd International Symposium on Remote Sensing of Environment, Stresa, Italy, 4–8 May 2009. [Google Scholar]
- Chen, J.; Chen, J.; Liao, A.; Cao, X.; Chen, L.; Chen, X.; He, C.; Han, G.; Peng, S.; Lu, M. Global land cover mapping at 30 m resolution: A POK-based operational approach. ISPRS J. Photogramm. Remote Sens. 2015, 103, 7–27. [Google Scholar] [CrossRef] [Green Version]
- Marcel, B.; Bruno, S.; Luc, B.; Bert, D.R.; Myroslava, L.; Nandin-Erdene, T.; Linlin, L.; Tarko, A.J. Copernicus Global Land Service: Land Cover 100m: Version 3 Globe 2015–2019: Product User Manual; Laboratory of Geo-information Science and Remote Sensing: Wageningen, The Netherlands, 2020. [Google Scholar]
- Fritz, S.; See, L.; Rembold, F. Comparison of global and regional land cover maps with statistical information for the agricultural domain in Africa. Int. J. Remote Sens. 2010, 31, 2237–2256. [Google Scholar] [CrossRef]
- Foody, G.M. Assessing the accuracy of land cover change with imperfect ground reference data. Remote Sens. Environ. 2010, 114, 2271–2285. [Google Scholar] [CrossRef] [Green Version]
- Stehman, S.V.; Foody, G.M. Key issues in rigorous accuracy assessment of land cover products. Remote Sens. Environ. 2019, 231, 111199. [Google Scholar] [CrossRef]
- Zaldo-Aubanell, Q.; Serra, I.; Sardanyés, J.; Alsedà, L.; Maneja, R. Reviewing the reliability of Land Use and Land Cover data in studies relating human health to the environment. Environ. Res. 2021, 194, 110578. [Google Scholar] [CrossRef]
- Wang, K.; Zhang, C.; Chen, H.; Yue, Y.; Zhang, W.; Zhang, M.; Qi, X.; Fu, Z. Karst landscapes of China: Patterns, ecosystem processes and services. Landsc. Ecol. 2019, 34, 2743–2763. [Google Scholar] [CrossRef] [Green Version]
- National Forestry and Grassland Administration. China’s Third National Bulletin on Rocky Desertification; National Forestry and Grassland Administration: Beijing, China, 2018. [Google Scholar]
- Zhang, J.; Liu, M.; Liu, X.; Luo, W.; Wu, L.; Zhu, L. Spectral analysis of seasonal rock and vegetation changes for detecting karst rocky desertification in southwest China. Int. J. Appl. Earth Obs. Geoinf. 2021, 100, 102337. [Google Scholar] [CrossRef]
- Pei, J.; Wang, L.; Huang, N.; Geng, J.; Cao, J.; Niu, Z. Analysis of landsat-8 oli imagery for estimating exposed bedrock fractions in typical karst regions of southwest China using a karst bare-rock index. Remote Sens. 2018, 10, 1321. [Google Scholar] [CrossRef] [Green Version]
- Jiang, Z.; Lian, Y.; Qin, X. Rocky desertification in Southwest China: Impacts, causes, and restoration. Earth-Sci. Rev. 2014, 132, 1–12. [Google Scholar] [CrossRef]
- Pei, J.; Wang, L.; Wang, X.; Niu, Z.; Kelly, M.; Song, X.-P.; Huang, N.; Geng, J.; Tian, H.; Yu, Y. Time series of Landsat imagery shows vegetation recovery in two fragile karst watersheds in southwest China from 1988 to 2016. Remote Sens. 2019, 11, 2044. [Google Scholar] [CrossRef] [Green Version]
- Brandt, M.; Yue, Y.; Wigneron, J.P.; Tong, X.; Tian, F.; Jepsen, M.R.; Xiao, X.; Verger, A.; Mialon, A.; Al-Yaari, A. Satellite-observed major greening and biomass increase in south China karst during recent decade. Earths Future 2018, 6, 1017–1028. [Google Scholar] [CrossRef]
- Yue, Y.; Liao, C.; Tong, X.; Wu, Z.; Fensholt, R.; Prishchepov, A.; Jepsen, M.R.; Wang, K.; Brandt, M. Large scale reforestation of farmlands on sloping hills in South China karst. Landsc. Ecol. 2020, 35, 1445–1458. [Google Scholar] [CrossRef]
- Tong, X.; Brandt, M.; Yue, Y.; Ciais, P.; Rudbeck Jepsen, M.; Penuelas, J.; Wigneron, J.-P.; Xiao, X.; Song, X.-P.; Horion, S. Forest management in southern China generates short term extensive carbon sequestration. Nat. Commun. 2020, 11, 129. [Google Scholar] [CrossRef]
- Loveland, T.R.; Reed, B.C.; Brown, J.F.; Ohlen, D.O.; Zhu, Z.; Yang, L.; Merchant, J.W. Development of a global land cover characteristics database and IGBP DISCover from 1 km AVHRR data. Int. J. Remote Sens. 2000, 21, 1303–1330. [Google Scholar] [CrossRef]
- Gong, P.; Wang, J.; Yu, L.; Zhao, Y.; Zhao, Y.; Liang, L.; Niu, Z.; Huang, X.; Fu, H.; Liu, S. Finer resolution observation and monitoring of global land cover: First mapping results with Landsat TM and ETM+ data. Int. J. Remote Sens. 2013, 34, 2607–2654. [Google Scholar] [CrossRef] [Green Version]
- Hansen, M.C.; Potapov, P.V.; Moore, R.; Hancher, M.; Turubanova, S.A.; Tyukavina, A.; Thau, D.; Stehman, S.V.; Goetz, S.J.; Loveland, T.R. High-resolution global maps of 21st-century forest cover change. Science 2013, 342, 850–853. [Google Scholar] [CrossRef] [Green Version]
- Tsendbazar, N.-E.; De Bruin, S.; Fritz, S.; Herold, M. Spatial accuracy assessment and integration of global land cover datasets. Remote Sens. 2015, 7, 5804. [Google Scholar] [CrossRef] [Green Version]
- Yang, Y.; Xiao, P.; Feng, X.; Li, H. Accuracy assessment of seven global land cover datasets over China. ISPRS J. Photogramm. Remote Sens. 2017, 125, 156–173. [Google Scholar] [CrossRef]
- Hua, T.; Zhao, W.; Liu, Y.; Wang, S.; Yang, S. Spatial consistency assessments for global land-cover datasets: A comparison among GLC2000, CCI LC, MCD12, GLOBCOVER and GLCNMO. Remote Sens. 2018, 10, 1846. [Google Scholar] [CrossRef] [Green Version]
- Jokar Arsanjani, J. Characterizing and monitoring global landscapes using GlobeLand30 datasets: The first decade of the twenty-first century. Int. J. Digit. Earth 2019, 12, 642–660. [Google Scholar] [CrossRef]
- Liang, L.; Gong, P. Evaluation of global land cover maps for cropland area estimation in the conterminous United States. Int. J. Digit. Earth 2015, 8, 102–117. [Google Scholar] [CrossRef]
- Pérez-Hoyos, A.; Rembold, F.; Kerdiles, H.; Gallego, J. Comparison of global land cover datasets for cropland monitoring. Remote Sens. 2017, 9, 1118. [Google Scholar] [CrossRef] [Green Version]
- Shi, H.; Auch, R.F.; Vogelmann, J.E.; Feng, M.; Rigge, M.; Senay, G.; Verdin, J.P. Case study comparing multiple irrigated land datasets in arizona and colorado, USA. JAWRA J. Am. Water Resour. Assoc. 2018, 54, 505–526. [Google Scholar] [CrossRef]
- Sulla-Menashe, D.; Gray, J.M.; Abercrombie, S.P.; Friedl, M.A. Hierarchical mapping of annual global land cover 2001 to present: The MODIS Collection 6 Land Cover product. Remote Sens. Environ. 2019, 222, 183–194. [Google Scholar] [CrossRef]
- Chen, J. Remote Sensing Mapping of Global Land Cover; Science Press: Beijing, China, 2016. [Google Scholar]
- Sophie, B.; Pierre, D.; Eric, V.B.; ESA, T.; Olivier, A.; Vasileios, K.; Ramos, P.J. GLOBCOVER 2009 Products Description and Validation Report; Université Catholique de Louvain: Ottignies-Louvain-la-Neuve, Belgium, 2009. [Google Scholar]
- Buchhorn, M.; Smets, B.; Bertels, L.; De Roo, B.; Lesiv, M.; Tsendbazar, N.-E.; Herold, M.; Fritz, S. Copernicus Global Land Service: Land Cover 100m: Collection 3 Epoch 2015, Globe; Version V3. 0.1 [Data Set]; Copernicus Global Land Service: Brussels, Belgium, 2020. [Google Scholar]
- Buchhorn, M.; Smets, B.; Bertels, L.; De Roo, B.; Lesiv, M.; Tsendbazar, N.-E.; Herold, M.; Fritz, S. Copernicus Global Land Service: Land Cover 100m: Collection 3 Epoch 2019, Globe; Version V3. 0.1 [Data Set]; Copernicus Global Land Service: Brussels, Belgium, 2020. [Google Scholar]
- Liu, J.; Liu, M.; Tian, H.; Zhuang, D.; Zhang, Z.; Zhang, W.; Tang, X.; Deng, X. Spatial and temporal patterns of China’s cropland during 1990–2000: An analysis based on Landsat TM data. Remote Sens. Environ. 2005, 98, 442–456. [Google Scholar] [CrossRef]
- Deng, X.; Huang, J.; Rozelle, S.; Zhang, J.; Li, Z. Impact of urbanization on cultivated land changes in China. Land Use Policy 2015, 45, 1–7. [Google Scholar] [CrossRef]
- Liu, J.; Kuang, W.; Zhang, Z.; Xu, X.; Qin, Y.; Ning, J.; Zhou, W.; Zhang, S.; Li, R.; Yan, C. Spatiotemporal characteristics, patterns, and causes of land-use changes in China since the late 1980s. J. Geogr. Sci. 2014, 24, 195–210. [Google Scholar] [CrossRef]
- Zuo, L.; Zhang, Z.; Carlson, K.M.; MacDonald, G.K.; Brauman, K.A.; Liu, Y.; Zhang, W.; Zhang, H.; Wu, W.; Zhao, X. Progress towards sustainable intensification in China challenged by land-use change. Nat. Sustain. 2018, 1, 304–313. [Google Scholar] [CrossRef]
- Kuang, W.; Liu, J.; Dong, J.; Chi, W.; Zhang, C. The rapid and massive urban and industrial land expansions in China between 1990 and 2010: A CLUD-based analysis of their trajectories, patterns, and drivers. Landsc. Urban Plan. 2016, 145, 21–33. [Google Scholar] [CrossRef]
- Tian, H.; Wu, M.; Wang, L.; Niu, Z. Mapping early, middle and late rice extent using sentinel-1A and Landsat-8 data in the poyang lake plain, China. Sensors 2018, 18, 185. [Google Scholar] [CrossRef] [Green Version]
- Liang, L.; Liu, Q.; Liu, G.; Li, H.; Huang, C. Accuracy evaluation and consistency analysis of four global land cover products in the Arctic region. Remote Sens. 2019, 11, 1396. [Google Scholar] [CrossRef] [Green Version]
- Herold, M.; Mayaux, P.; Woodcock, C.; Baccini, A.; Schmullius, C. Some challenges in global land cover mapping: An assessment of agreement and accuracy in existing 1 km datasets. Remote Sens. Environ. 2008, 112, 2538–2556. [Google Scholar] [CrossRef]
- Foody, G.M. Status of land cover classification accuracy assessment. Remote Sens. Environ. 2002, 80, 185–201. [Google Scholar] [CrossRef]
- Comber, A.; Fisher, P.; Brunsdon, C.; Khmag, A. Spatial analysis of remote sensing image classification accuracy. Remote Sens. Environ. 2012, 127, 237–246. [Google Scholar] [CrossRef] [Green Version]
- Foody, G.M. What is the difference between two maps? A remote senser’s view. J. Geogr. Syst. 2006, 8, 119–130. [Google Scholar] [CrossRef]
- Bai, Y.; Feng, M.; Jiang, H.; Wang, J.; Zhu, Y.; Liu, Y. Assessing consistency of five global land cover data sets in China. Remote Sens. 2014, 6, 8739. [Google Scholar] [CrossRef] [Green Version]
- Giri, C.; Zhu, Z.; Reed, B. A comparative analysis of the Global Land Cover 2000 and MODIS land cover data sets. Remote Sens. Environ. 2005, 94, 123–132. [Google Scholar] [CrossRef]
- Ran, Y.; Li, X.; Lu, L. Evaluation of four remote sensing based land cover products over China. Int. J. Remote Sens. 2010, 31, 391–401. [Google Scholar] [CrossRef]
- Zeng, T.; Zhang, Z.; Zhao, X.; Wang, X.; Zuo, L. Evaluation of the 2010 MODIS collection 5.1 land cover type product over China. Remote Sens. 2015, 7, 1981. [Google Scholar] [CrossRef] [Green Version]
- Wu, W.; Shibasaki, R.; Yang, P.; Ongaro, L.; Zhou, Q.; Tang, H. Validation and comparison of 1 km global land cover products in China. Int. J. Remote Sens. 2008, 29, 3769–3785. [Google Scholar] [CrossRef]
- Smith, J.H.; Stehman, S.V.; Wickham, J.D.; Yang, L. Effects of landscape characteristics on land-cover class accuracy. Remote Sens. Environ. 2003, 84, 342–349. [Google Scholar] [CrossRef]
- Abdullah, A.M.; Masrur, A.; Adnan, M.S.G.; Al Baky, M.A.; Hassan, Q.K.; Dewan, A. Spatio-Temporal Patterns of Land Use/Land Cover Change in the Heterogeneous Coastal Region of Bangladesh between 1990 and 2017. Remote Sens. 2019, 11, 790. [Google Scholar] [CrossRef] [Green Version]
- Jung, M.; Henkel, K.; Herold, M.; Churkina, G. Exploiting synergies of global land cover products for carbon cycle modeling. Remote Sens. Environ. 2006, 101, 534–553. [Google Scholar] [CrossRef]
- Tsendbazar, N.-E.; de Bruin, S.; Herold, M. Integrating global land cover datasets for deriving user-specific maps. Int. J. Digit. Earth 2017, 10, 219–237. [Google Scholar] [CrossRef] [Green Version]
- Tian, H.; Chen, T.; Li, Q.; Mei, Q.; Wang, S.; Yang, M.; Wang, Y.; Qin, Y. A Novel Spectral Index for Automatic Canola Mapping by Using Sentinel-2 Imagery. Remote Sens. 2022, 14, 1113. [Google Scholar] [CrossRef]
- Gong, P.; Liu, H.; Zhang, M.; Li, C.; Wang, J.; Huang, H.; Clinton, N.; Ji, L.; Li, W.; Bai, Y. Stable classification with limited sample: Transferring a 30-m resolution sample set collected in 2015 to mapping 10-m resolution global land cover in 2017. Sci. Bull. 2019, 64, 370–373. [Google Scholar] [CrossRef] [Green Version]
- Karra, K.; Kontgis, C.; Statman-Weil, Z.; Mazzariello, J.C.; Mathis, M.; Brumby, S.P. Global land use/land cover with Sentinel 2 and deep learning. In Proceedings of the 2021 IEEE International Geoscience and Remote Sensing Symposium IGARSS, Brussels, Belgium, 11–16 July 2021; pp. 4704–4707. [Google Scholar]
- Chen, J.; Li, S.; Wu, H.; Chen, X. Towards a collaborative global land cover information service. Int. J. Digit. Earth 2017, 10, 356–370. [Google Scholar] [CrossRef]
- Su, W.; Sui, D.; Zhang, X. Satellite image analysis using crowdsourcing data for collaborative mapping: Current and opportunities. Int. J. Digit. Earth 2020, 13, 645–660. [Google Scholar] [CrossRef]
- Su, Y.; Guo, Q.; Hu, T.; Guan, H.; Jin, S.; An, S.; Chen, X.; Guo, K.; Hao, Z.; Hu, Y. An updated vegetation map of China (1:1,000,000). Sci. Bull. 2020, 65, 1125–1136. [Google Scholar] [CrossRef]
- Xing, H.; Meng, Y.; Wang, Z.; Fan, K.; Hou, D. Exploring geo-tagged photos for land cover validation with deep learning. ISPRS J. Photogramm. Remote Sens. 2018, 141, 237–251. [Google Scholar] [CrossRef]


Publisher’s Note: MDPI stays neutral with regard to jurisdictional claims in published maps and institutional affiliations. |
© 2022 by the authors. Licensee MDPI, Basel, Switzerland. This article is an open access article distributed under the terms and conditions of the Creative Commons Attribution (CC BY) license (https://creativecommons.org/licenses/by/4.0/).