Article

Investigation of the Sensitivity of Microwave Land Surface Emissivity to Soil Texture in MLEM

1
Collaborative Innovation Center on Forecast and Evaluation of Meteorological Disasters, Key Laboratory for Aerosol-Cloud-Precipitation of China Meteorological Administration, Nanjing University of Information Science & Technology, Nanjing 210044, China
2
School of Atmospheric Physics, Nanjing University of Information Science and Technology, Nanjing 210044, China
3
Department of Geography, Harokopio University of Athens, El. Venizelou 70, Kallithea, 17671 Athens, Greece
*
Author to whom correspondence should be addressed.
Remote Sens. 2022, 14(13), 3045; https://doi.org/10.3390/rs14133045
Submission received: 4 May 2022 / Revised: 14 June 2022 / Accepted: 19 June 2022 / Published: 24 June 2022

Abstract

:
This study analyzes the spectral characteristics of desert surface emissivity according to soil classification and the influence of mineral materials and soil texture information using simulation results from the microwave land emissivity model (MLEM). It also aims at exploring the feasibility of reducing the simulation error in MLEM by refining the soil classification characteristic parameters (such as soil composition content, distribution of particle size, etc.). The surface emissivity of the Taklimakan Desert is derived, to our knowledge for the first time, from FY-3B/MWRI (FengYun-3B Microwave Radiation Imager), and then the spectral characteristics of the study area for different soil types are further analyzed according to soil classification. In addition, emissivity spectra of the four most widely mineral materials in the desert area are reproduced using an MLEM under different conditions. Results showed that microwave land emissivity is highly correlated with the soil type and changes are markedly affected by the soil water content, soil texture, mineral composition, and soil particle size. For the desert soil, the emissivity of horizontal/vertical polarization is affected by the frequency in those soils dominated by large-size particles. However, for those dominated by smaller particles, the surface emissivity is almost constant or appears to be somehow dependent on the frequency. Moreover, the season effect on emissivity characteristics is clear, especially for soils composed of small-size particles. The emissivity of horizontal polarization shows stronger seasonal variation than that of vertical polarization. The study findings also showed that refining soil texture information (soil component content, distribution of particle size) improves the simulation accuracy in desert areas. For example, for the soil dominated by clay and clay loam, the simulation error is reduced from 6–9% to less than 6%. The latter is evident, especially for soil types containing a large number of small particles, such as clay and clay loam, for which the simulation error is reduced. All in all, our study contributes to a better understanding of the influencing factors of soil texture and stratification of the near-surface soil, helping to improve microwave land surface emissivity prediction by the studied here model. As MLEM consists of an important part of the global meteorological data assimilation and weather forecast system, results can also help towards increasing the use of satellite data in desert areas and in improving the accuracy of numerical weather forecast models.

1. Introduction

Surface emissivity represents the surface thermal radiation capacity and is an important physical quantity in understanding the surface energy budget and surface radiation process. The snow-free land surface emissivity can not only separate the surface information from satellite observations but also improve the inversion accuracy of atmospheric and land surface parameters (such as water vapor [1,2,3,4], precipitation [5,6,7,8], soil water content [9,10,11,12], vegetation moisture content [13], land surface temperature [14], snow and ice cover [15], etc.). In studying land surface emissivity, microwave (MW) and infrared (IR) regions of the electromagnetic spectrum are usually used. However, the MW region has become important in surface remote sensing owing to its long wavelength that can penetrate clouds and is affected less by the atmosphere. MW surface emissivity has a significant role in the global weather forecasting system and is needed to assimilate the MW radiation data of various satellites [16,17].
Recently, numerous studies have focused on exploring the use of MW land emissivity calculation methods from satellite measurements and physical models. Inversion methods are based on satellite data. Those studies employ methods that are empirical statistical [18], semi-empirical model [19], radiative transfer [20,21,22,23], exponential analysis [24], neural networks [25], one-dimensional variational [26,27,28], parameterized [29,30] and so on. Comparisons of emissivity inversions by the various methods (physical modeling, statistical modeling, and hybrid of physical and statistical modeling) indicate that results are highly dependent upon the method used [31,32]. Those methods can directly calculate the land surface emissivity at large spatial and temporal scales. However, due to regional and seasonal influences as well as those of the input parameters, it is difficult to guarantee the results’ accuracy and stability.
For example, Jones and Vonder Haar [33] retrieved MW land emissivity in the central United States. Prigent et al. [20] calculated the Special Sensor Microwave Imager (SSM/I) emissivity of the land surface in most parts of Europe and analyzed its variation characteristics under different surface conditions. More recently, Zhang et al. [34] analyzed the characteristics of MW emissivity for a variety of surfaces and the seasonal variation of the different surface types under different wavebands and polarization conditions. In another study, Prakash et al. [35] found that the surface emissivity at horizontal polarization generally increases with the increase in frequency under clear-sky conditions. In particular, the surface emissivity of vegetation-covered areas showed obvious seasonal variations. More recently, Wu et al. [36] used the radiative transfer equation to invert the surface emissivity of the Qinghai-Tibet Plateau.
The radiative transfer model (RTM) is basically used as a forward operator to simulate observation equivalents and to calculate the difference between these and the observations [37]. Observations of brightness temperature (TB) that deviate too far from the simulated values are usually excluded from the assimilation. Therefore, the accuracy of forwarding TB simulation plays an important role in data utilization and subsequent assimilation effects. Numerous studies have also focused on physical surface emissivity models. Development of such models includes the simulation of bare land surfaces [38,39], vegetation-covered land surfaces [40,41,42], snow cover [43,44], and complex land surface types [45]. These physical models of MW emissivity for different surface types all possess certain physical meanings. However, some of the surface parameters in those models are often difficult to obtain, and inevitably, the high uncertainty of those parameters ultimately affects the accuracy of retrievals.
The uncertainty associated with land surface emissivity greatly reduces the use of spaceborne MW radiometer data. Thus, it is a requirement to improve existing MW land surface emissivity models further and develop new algorithms. At present, the largest spatial variability of surface emissivity occurs in bare rock or soil regions. However, these regions are simply divided into a wasteland, desert, and bare soil, affecting studies on the spectral response characteristics of the soil structure or rock minerals to the satellite-borne sensor. The deviation caused by the uncertainty of model parameters greatly affects the assimilation of MW observation data in desert areas. The latter seriously hinder any effective use of these data for this type of land surface. Therefore, it should improve MW observation data assimilation in the desert (or bare soil) areas and improve the utilization of MW data. To do this, it is necessary to provide further systematic and quantitative analysis of existing surface parameters and the physical properties of the bare soil emissivity model itself.
In view of the above, the present study analyzes the spectral characteristics of surface emissivity according to soil classification over the desert. A further objective has been to analyze the influence of mineral materials and soil texture information (e.g., soil component content, distribution of particle size) on the Microwave Land Emissivity Model (MLEM) simulation results. In this study, Microwave Radiation Imager (MWRI) data is used, to our knowledge for the first time, to invert the surface emissivity spectrum over the Taklimakan Desert. According to the Food and Agriculture Organization (FAO) [46] and State Soil Geographic (STATSGO) dataset definitions of soil type, the desert surface emissivity spectra calculated by inversion are classified and analyzed. Following this, an MLEM [45] is employed to calculate the emissivity spectra of the four most widely used materials in the desert area—namely, quartz, sandstone, granite, and limestone [47]—under different particle sizes, soil components, and soil water content. The results are discussed, analyzing the main factors contributing to the error in calculating the MW emissivity of the desert area from the examined herein model. Also, possible ways to improve models’ predictions are proposed. As the MLEM is an important part of the global meteorological data assimilation and weather forecast system, this study’s findings can be valuable for improving the utilization of satellite data in desert areas and also expanding the models in numerical weather forecasting.

2. Data

2.1. Satellite Data

The FY-3B/MWRI Leval 1B TB data from the year 2017 used in this study came from FENGYUN Satellite Data Center (http://satellite.nsmc.org.cn/PortalSite/Default.aspx (accessed on 10 January 2020)). Fengyun-3 is China’s second-generation polar-orbiting weather satellite, equipped with 11 remote sensing instruments and with a spectral range from ultraviolet to MW. Fengyun-3B is an afternoon satellite that has been orbiting since 2010–2011. The MWRI mounted on the FY-3B satellite provides MW observations at five frequencies (10.65, 18.7, 23.8, 36.5, and 89.0 GHz), with dual polarization and 10 channels. MWRI data can be used to retrieve global precipitation, cloud and atmospheric water content, liquid water content, soil moisture, and sea ice cover, etc., providing information for weather forecast and environmental monitoring. The specific channel characteristics are shown in Table 1.

2.2. NCEP/FNL Data

The atmospheric profile and surface parameters of the National Centers for Environmental Prediction final analysis (NCEP/FNL) can be used as inputs to the Community Radiative Transfer Model (CRTM) to calculate the atmospheric transmittance in Equation (1), as well as the upward and downward radiation of the atmosphere (https://rda.ucar.edu/#!lfd?nb=y&b=topic&v=Land%20Surface (accessed on 1 February 2020)). NCEP/FNL data are generated through the Global Data Assimilation System (GDAS). The latter is capable of continuously collecting observations from the Global Telecommunications System and a number of other systems by assimilating ground observations, radiosondes, sounding balloons, aircraft, and satellite observations. It can also generate operational NCEP/FNL analysis and forecast data for four hours per day (00:00, 06:00, 12:00, 18:00 UTC). NCEP/FNL reanalysis data are characterized by many times, high density, strong continuity, and high resolution. This offers significant advantages in the analysis of mesoscale and synoptic-scale weather phenomena and can effectively make up for the deficiency of conventional observation data in the analysis of catastrophic weather.

2.3. Global Soil Texture Classification Database

Herein the FAO and STATSGO Global Soil Texture Classification Database (https://ldas.gsfc.nasa.gov/gldas/soils (accessed on 20 March 2020)) is used to analyze the surface emissivity variation characteristics of different soil types in the Taklimakan Desert (Figure 1b). This database includes twelve soil types and four other land types worldwide. According to the triangular classification of soil texture of the USDA [48], different soil textures are defined by different contents of sand, silt, and clay, where the sizes of sand particles (0.05–2 mm) are larger than those of silt particles (0.002–0.05 mm) and clay particles (<0.002 mm).

3. Methods

3.1. Inversion Method for MW Land Emissivity

There are some MW bands with weak atmospheric absorption, called atmospheric MW window regions. The commonly used atmospheric MW window areas include frequencies of 10 GHz, 19.4 GHz, 31~37 GHz, and 90 GHz. Because the observed values of the channel in the MW window region are least affected by atmospheric absorption, scattering, and emission, the inversion of surface emissivity is more accurate than results from non-window channels. Assuming that the surface is flat and the atmosphere is a plane parallel model and non-scattering medium, the Rayleigh-Jeans approximation can be employed for calculating the surface emissivity by using the satellite TB through the radiative transfer equation [21,45]:
ε = T b T u T d Γ Γ ( T s T d )
where Tb is the satellite TB and TS is the temperature of the land surface, which can be obtained from NCEP/FNL datasets. Tu is the satellite’s upward radiation and can be written as [49]:
T u = τ s τ 0 B ( τ , T ) exp ( τ s τ ) μ d τ / μ
Td is the atmosphere downward radiation and can be written as [49]:
T d = τ 0 τ s B ( τ , T ) exp ( τ τ 0 ) μ d τ / μ
Γ is the transmittance of the atmosphere and can be written as [48]:
Γ = exp ( τ s / μ )
In Equations (2) and (3), B is the brightness temperature of each layer with optical depth τ, τ0 is the optical depth at the top, τs is the optical depth at the bottom of the layer, μ = cos(θ), where θ is the satellite view angle. Tu, Td, and Γ are calculated from the NCEP-FNL temperature and water vapor profiles as inputs to the MW absorption model. Equation (1) indicates that the deviation of Tb, TS, and the atmospheric temperature/humidity profile may affect the accuracy of the inversion [50]. It is known from the literature that an error of 1% in Tb may lead to an emissivity error of more than 1%, depending upon the upwelling and downwelling radiative components [49]. Furthermore, a 1% error in TS would result in a 1% error in land emissivity. Moreover, the error in TS is the main error source for emissivity at frequencies less than 19 GHz [50]. In addition, the error in atmospheric profiles has a greater impact at higher frequencies, where emission-based radiative transfer could be more problematic.

3.2. Microwave Land Surface Emissivity Model

Weng et al. [45] developed an MLEM using a two-stream approximation. In the model, the surface of Earth is depicted as a multi-layered medium on an irregular surface. The top and bottom layers are taken to be interstitially homogeneous, while the intermediate layers are interstitially heterogeneous and contain scatterers such as snow, sand, and vegetation. At present, MLEM already contains most of the important radiative transfer processes on the land surface so that it can be applied to most of the land surface conditions around the world.
Although this model can simulate the emissivity well for a variety of surface conditions, the level of deviation in the calculation for desert areas is quite large. One of the reasons for this is the uncertainty attached to some of the important parameters in the model. For example, the geometric scale (the shape and size of sand grains and snow crystals, the height of vegetation canopy, blade shape and inclination, the shape of branches and vegetation fraction) of the scatterers (e.g., snow, sand, and vegetation) is very difficult to obtain from conventional observation data. For those parameters, therefore, the model generally assumes them to be constants. For example, the contents of clay and sand of different types of soil are set to a fixed value in the model. Actually, for each type of soil, there is a range of sand content or clay. However, it is difficult to obtain accurate sand content of different types of soil. In addition, the particle radius for different types of soil was set as a fixed value in the model. Nevertheless, there is a radius range of sand or clay particles. Therefore, the same type of soil may have a different distribution of particle size. Evidently, such set values for those model parameters do not apply to all types of soil and thus become the main error source in the current model. To reduce the impact of parameter uncertainty on the model and use the model more effectively to analyze the influence of soil texture on surface MW emissivity in more detail, herein information on soil texture, particle sizes, and sand/clay content are obtained from the FAO/STATSGO soil texture database. Then, it is used the U.S. Department of Agriculture’s (USDA) classification scheme to define the ratios of clay, silt and sand to different soil types and adjust the parameter values corresponding to different soil types in the model.

3.3. Verification of MLEM Simulation Results

A key study objective has been to analyze the correlation between emissivity and different soil textures and further verify that the addition of soil texture information (such as sand fraction, clay fraction, distribution of particle size, and so on) improves the accuracy of the model simulation results. To do this, the emissivity retrieved from satellite data is used as the “true value” to calculate the deviation between the retrieved emissivity value and the simulated value. The MLEM simulates the emissivity of the Taklimakan Desert combined with GDAS data. The simulation results are compared with the emissivity retrieved by FY-3B/MWRI measurements. The roughness of the satellite remote sensing is actually related to the spatial resolution of the remote sensor. According to different frequency ranges, the model gives the dependence functions of horizontal and vertical polarization emissivity on surface roughness. The output of GDAS provides global surface characteristic parameters (such as surface temperature, soil temperature, surface vegetation type, canopy moisture content, etc.) for the model. If the emissivity deviation after considering the difference in soil texture is smaller than that of the original model, it suggests that the refinement of soil texture information in the model can improve the model’s accuracy.

4. Results

In this section, MWRI TB data is used to retrieve the surface emissivity under clear sky conditions in the Taklimakan desert area. According to the soil classification information provided by FAO/STATSGO, the variation and seasonal variation of microwave emissivity of different soil types in the Taklimakan Desert are analyzed. In addition, the emissivity spectra of different minerals in the desert area under different particle sizes, sand/clay content, and soil water content are simulated by the model. On this basis, those are evident that further verify the feasibility of soil classification characteristic parameters in the refinement model to reduce the simulation error.

4.1. Variation Characteristics of Surface Emissivity

In theory, Equation (1) can be used to calculate emissivity for any surface type. The desert is basically a kind of bare land. What is more, the desert soil has a wide variety of textures. This paper only discusses the relationship between desert surface emissivity and soil type. The codes for the various soil textures are listed in Table 2 according to the FAO/STATSGO dataset (see Figure 1). It is found that there are only six types of soil in the study area: sand, loam, sandy clay loam, clay loam, sandy clay, and clay.
Group-based calculations are performed for the MWRI land surface emissivity of different soil types at different seasons in the Taklimakan Desert. Actually, the MWRI sensor measures at five frequencies between 10 GHz and 90 GHz, and these emissivity spectrum lines are interpolated using Bezier curve interpolation between the discrete values. As shown in Figure 2, the surface emissivity of the desert varies considerably with different soil compositions. In general, the vertical polarization emissivity of different surface types gradually decreases with increasing frequency, the horizontal polarization emissivity gradually increases with frequency, and the polarization difference gradually decreases with increasing frequency. Evidently, clay has the lowest emissivity in summer, whereas the emissivity of sandy clay is almost constant at frequencies above 30 GHz.
It should be noted that the usual frequency spectrum of land surface emissivity has generally been found to follow a smooth curve [45,51,52], which is different from the curves in Figure 2, especially between 18 GHz and 23 GHz, which may be caused by some uncertain factors in the inversion calculation process [50].
Although the desert area is dominated by dry, bare soil, there is some sparse vegetation in the study area. These desert vegetation types also exhibit a certain degree of variation with the seasons and limited rainfall.
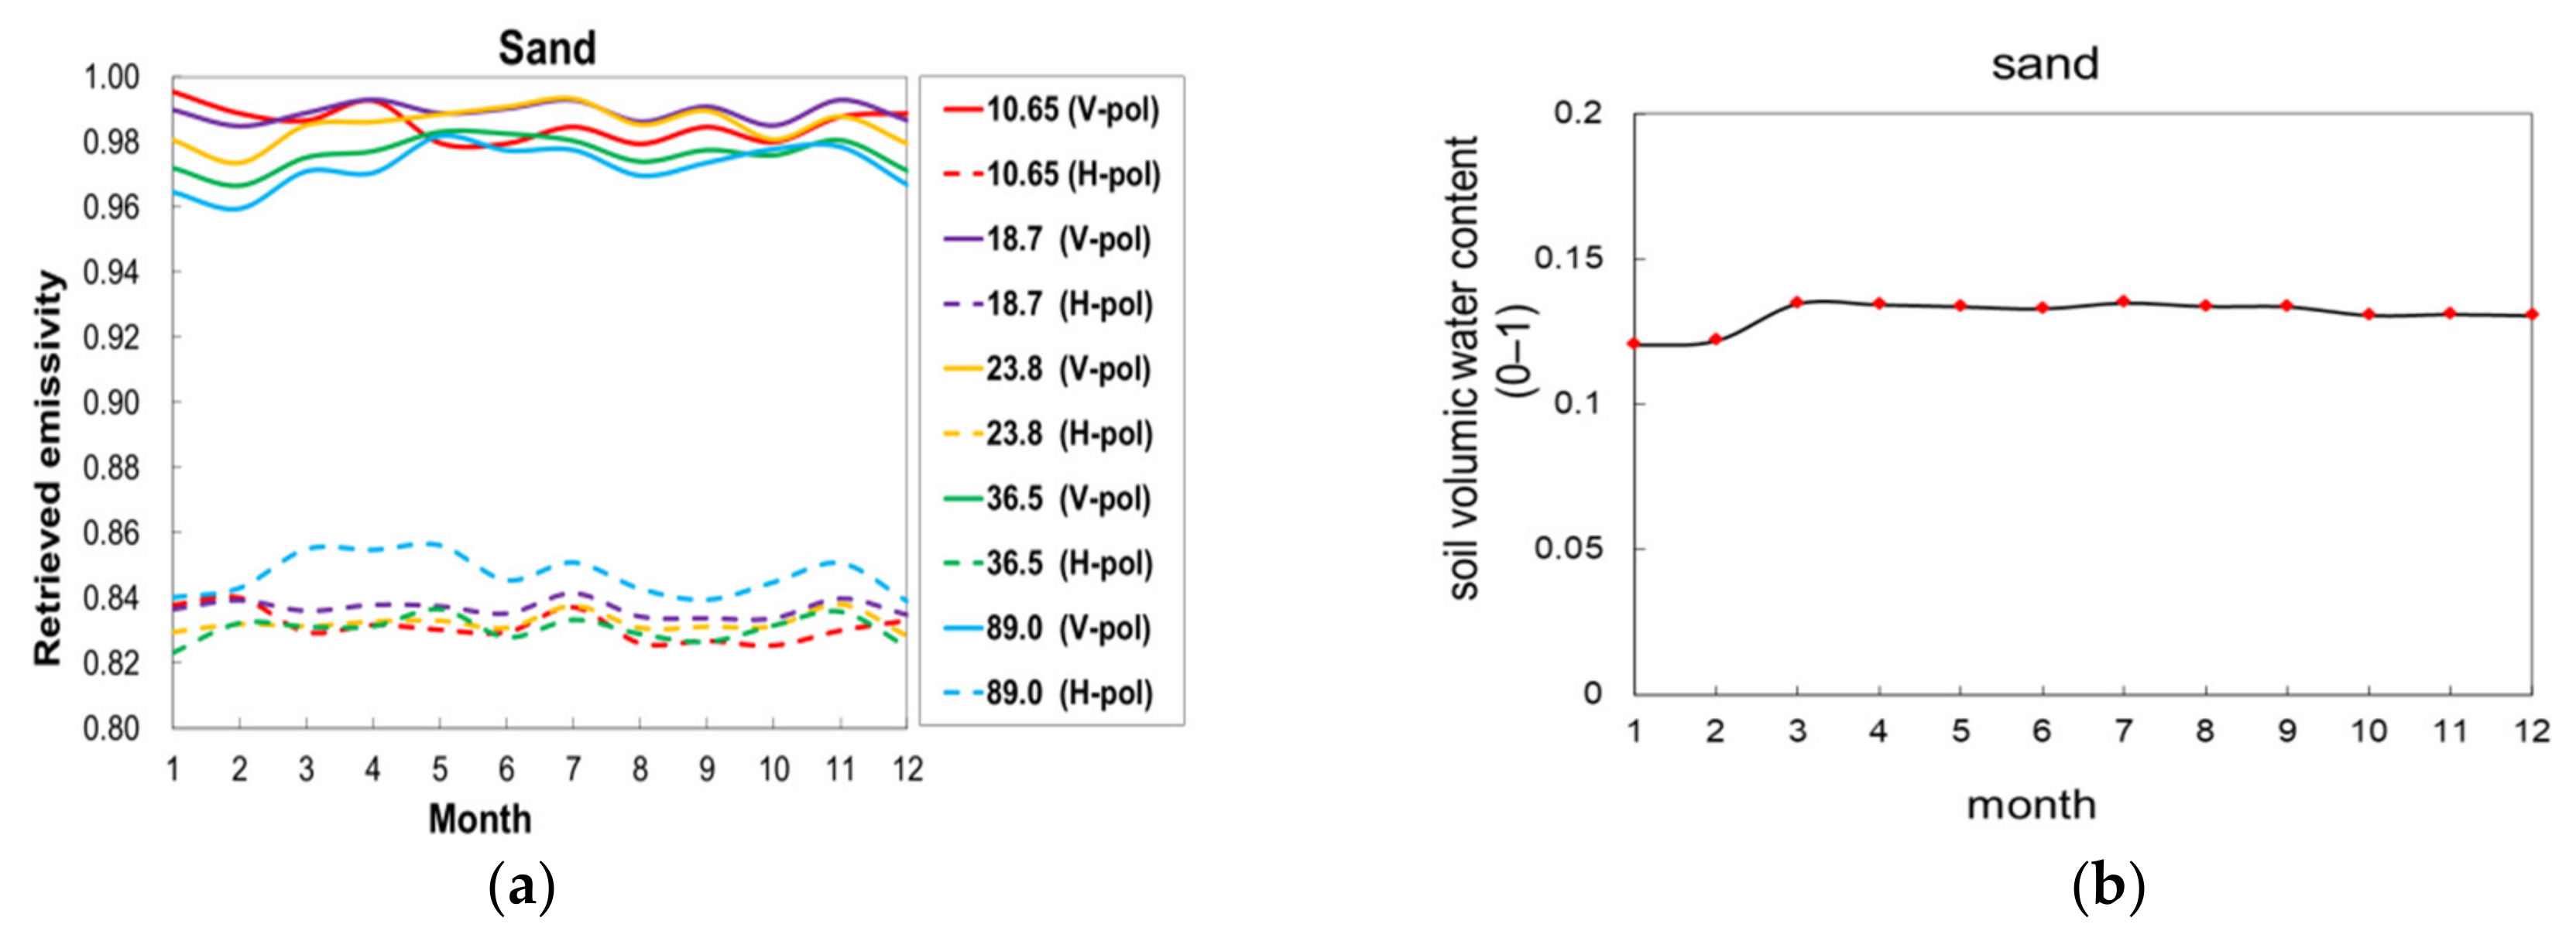
Figure 3 represents mean emissivity retrievals and mean soil volumetric water content for different soil types over the Taklimakan Desert. Mean emissivity retrievals are the average of retrieved emissivity at all pixels of the same soil type in the study area. Mean soil volumetric water content is the average soil volumetric water content at all pixels of the same soil type in the study area. As results showed (Figure 3), the retrieved emissivity of soil in which the main component are sand and clay (i.e., sandy clay and sandy clay loam) varies greatly throughout the year, reaching about 0.07, followed by the soil in which the main component is clay (i.e., clay and clay loam), and thirdly the soil in which the main component is sand. The emissivity of sandy surfaces clearly does not vary obviously with the seasons. Soil moisture is the largest component of emissivity variability, which will be discussed in more detail in Section 5.

4.2. Emissivity Spectra Simulation of Different Mineral Surface Minerals

In arid and semi-arid regions, where the land surface is mostly covered with sand and gravel (commonly known as desert), the exposed rocks or soil minerals greatly change the surface emissivity. Due to the lack of vegetation cover and perennial drought in desert areas, the soil and surface conditions of the desert rarely change. From the perspective of satellite remote sensing applications, the desert area’s surface can be considered relatively stable, which can be deemed unchanging in the short term. Moreover, the desert has almost no vegetation, so that satellite radiometers can observe the emissivity of different minerals. For instance, the Electrically Scanning Microwave Radiometer aboard NASA’s Nimbus-5 and Nimbus-6 satellites is the first instrument to observe different minerals [53]—namely, quartz with high surface emissivity and limestone with low surface emissivity.
According to the USDA’s definition of soil texture [54], different soil textures can be defined in terms of the proportions of sand, silt, and clay. Sand particle sizes (0.05–2 mm) are larger in comparison to silt particles (0.002–0.05 mm) and clay particles (<0.002 mm). Therefore, it can be considered that the smaller the soil sand content, the smaller the size of soil particles.
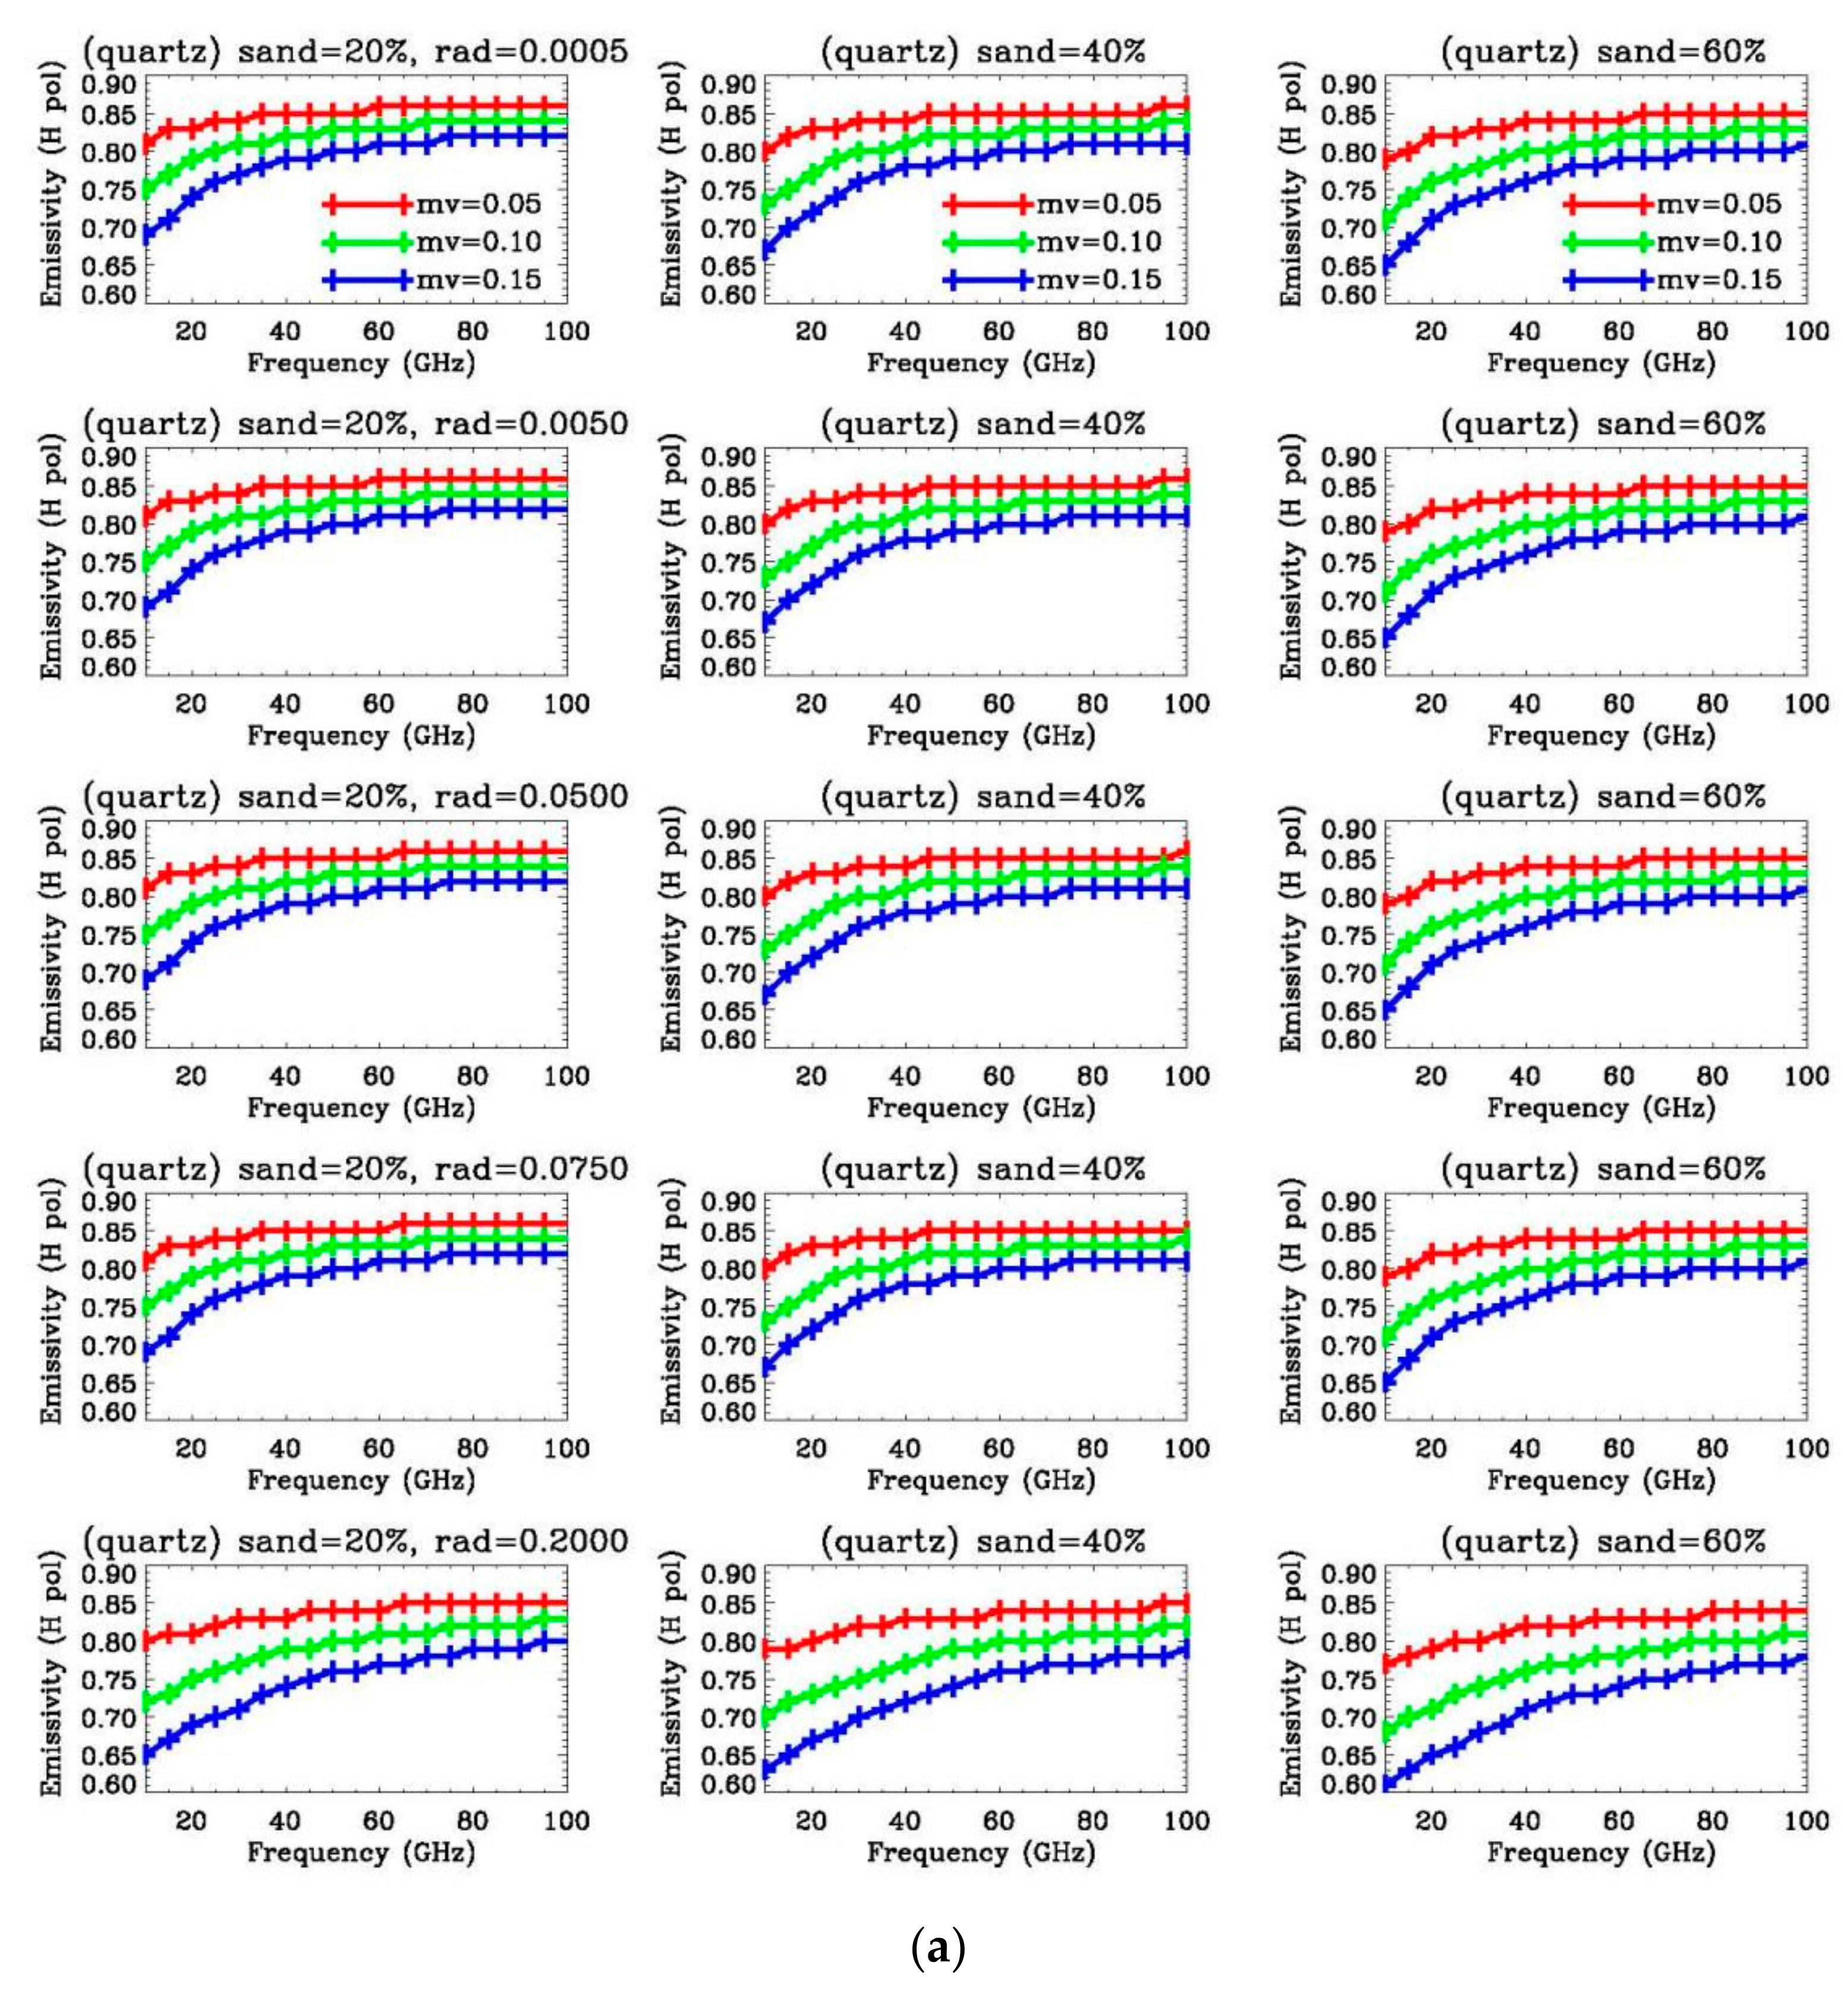
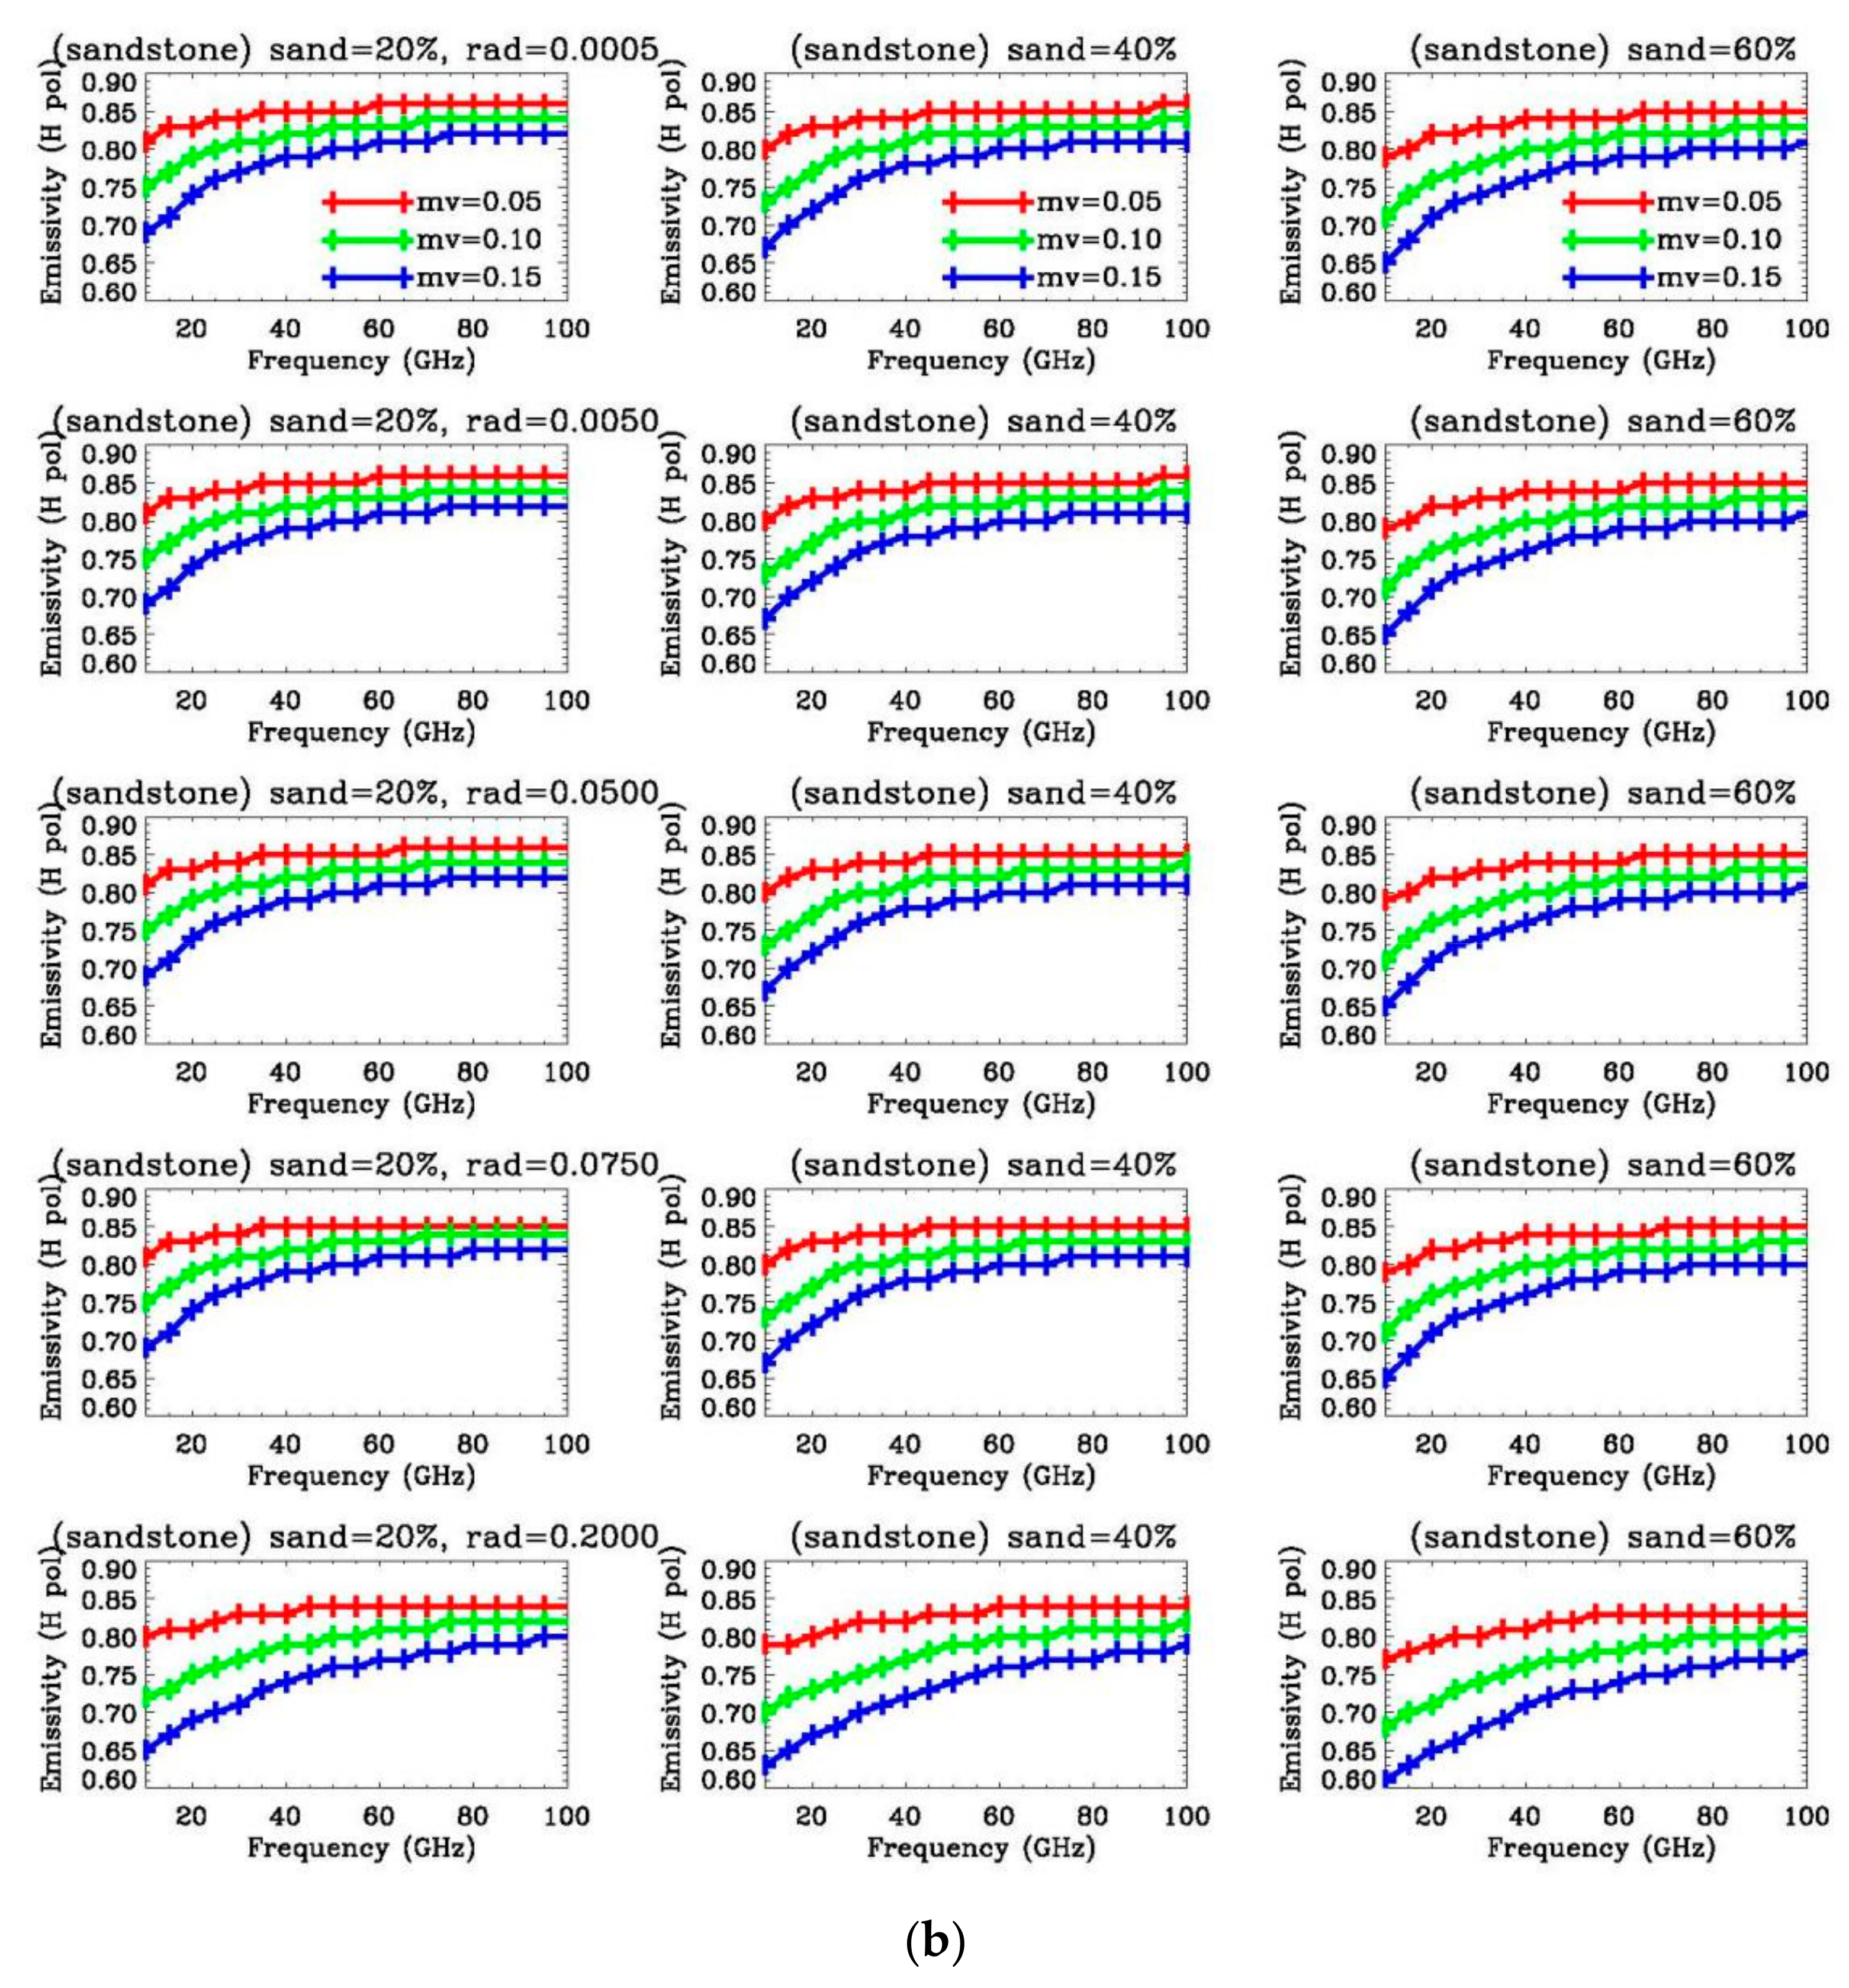
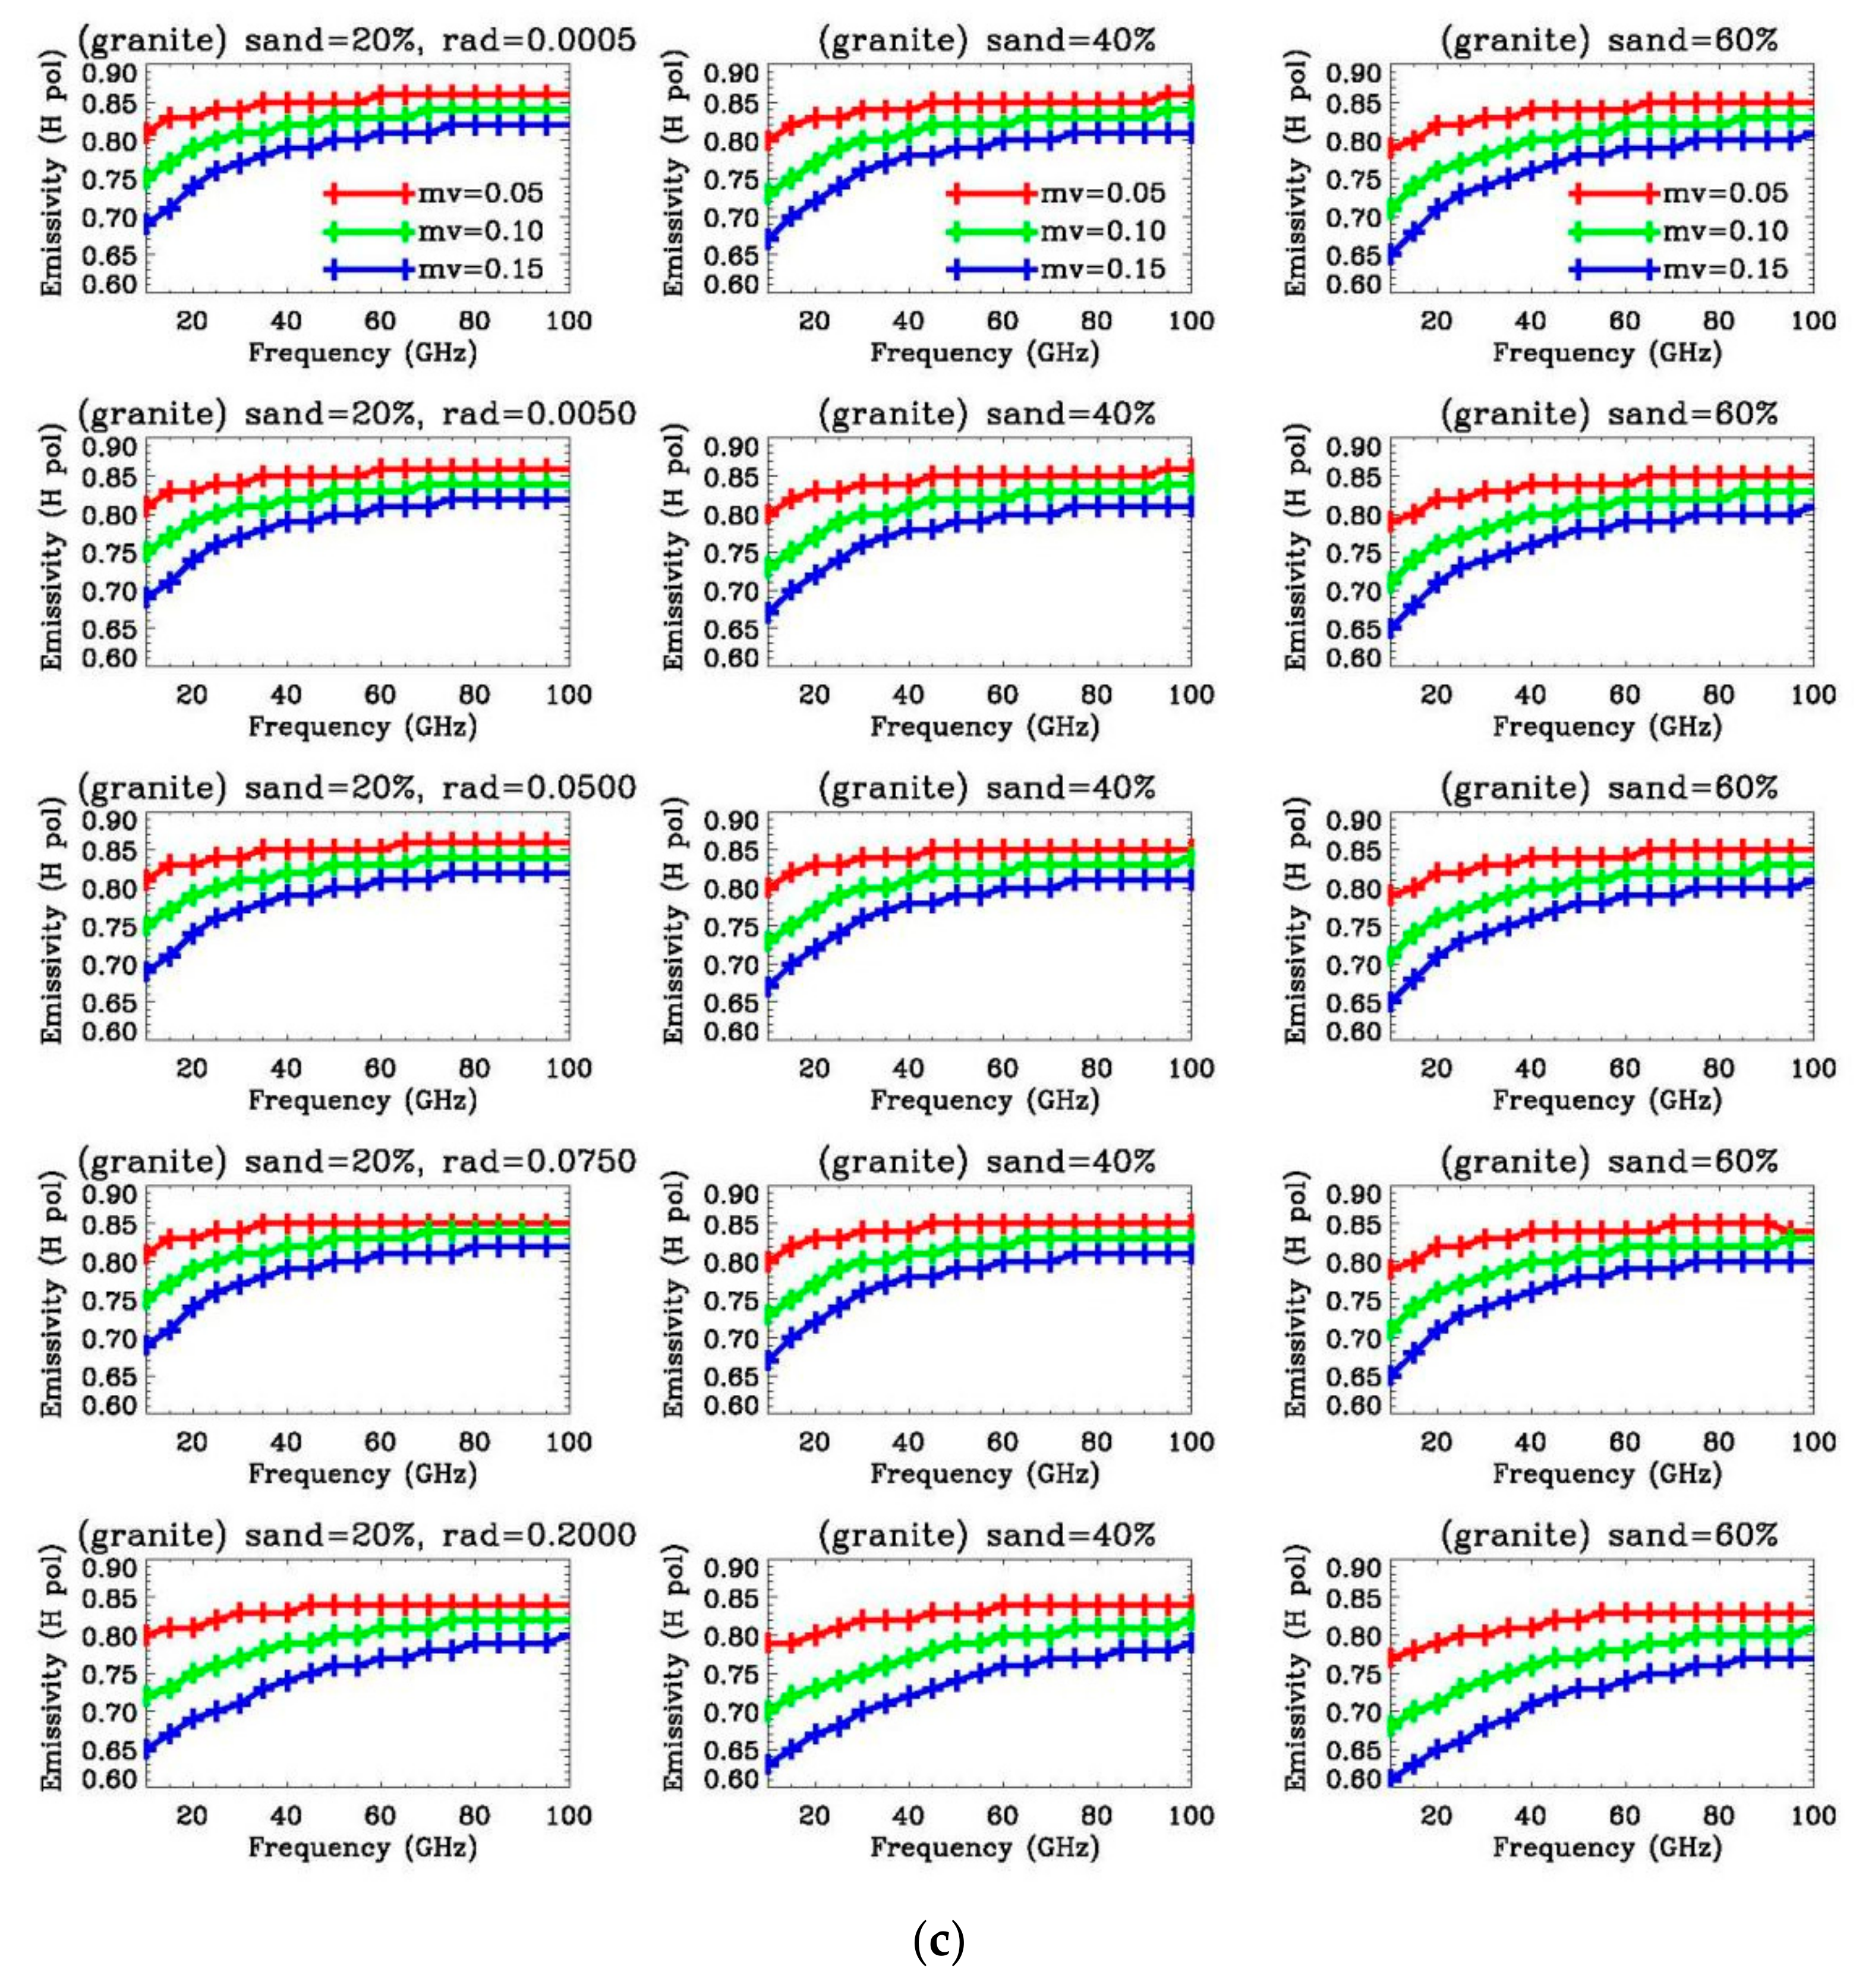
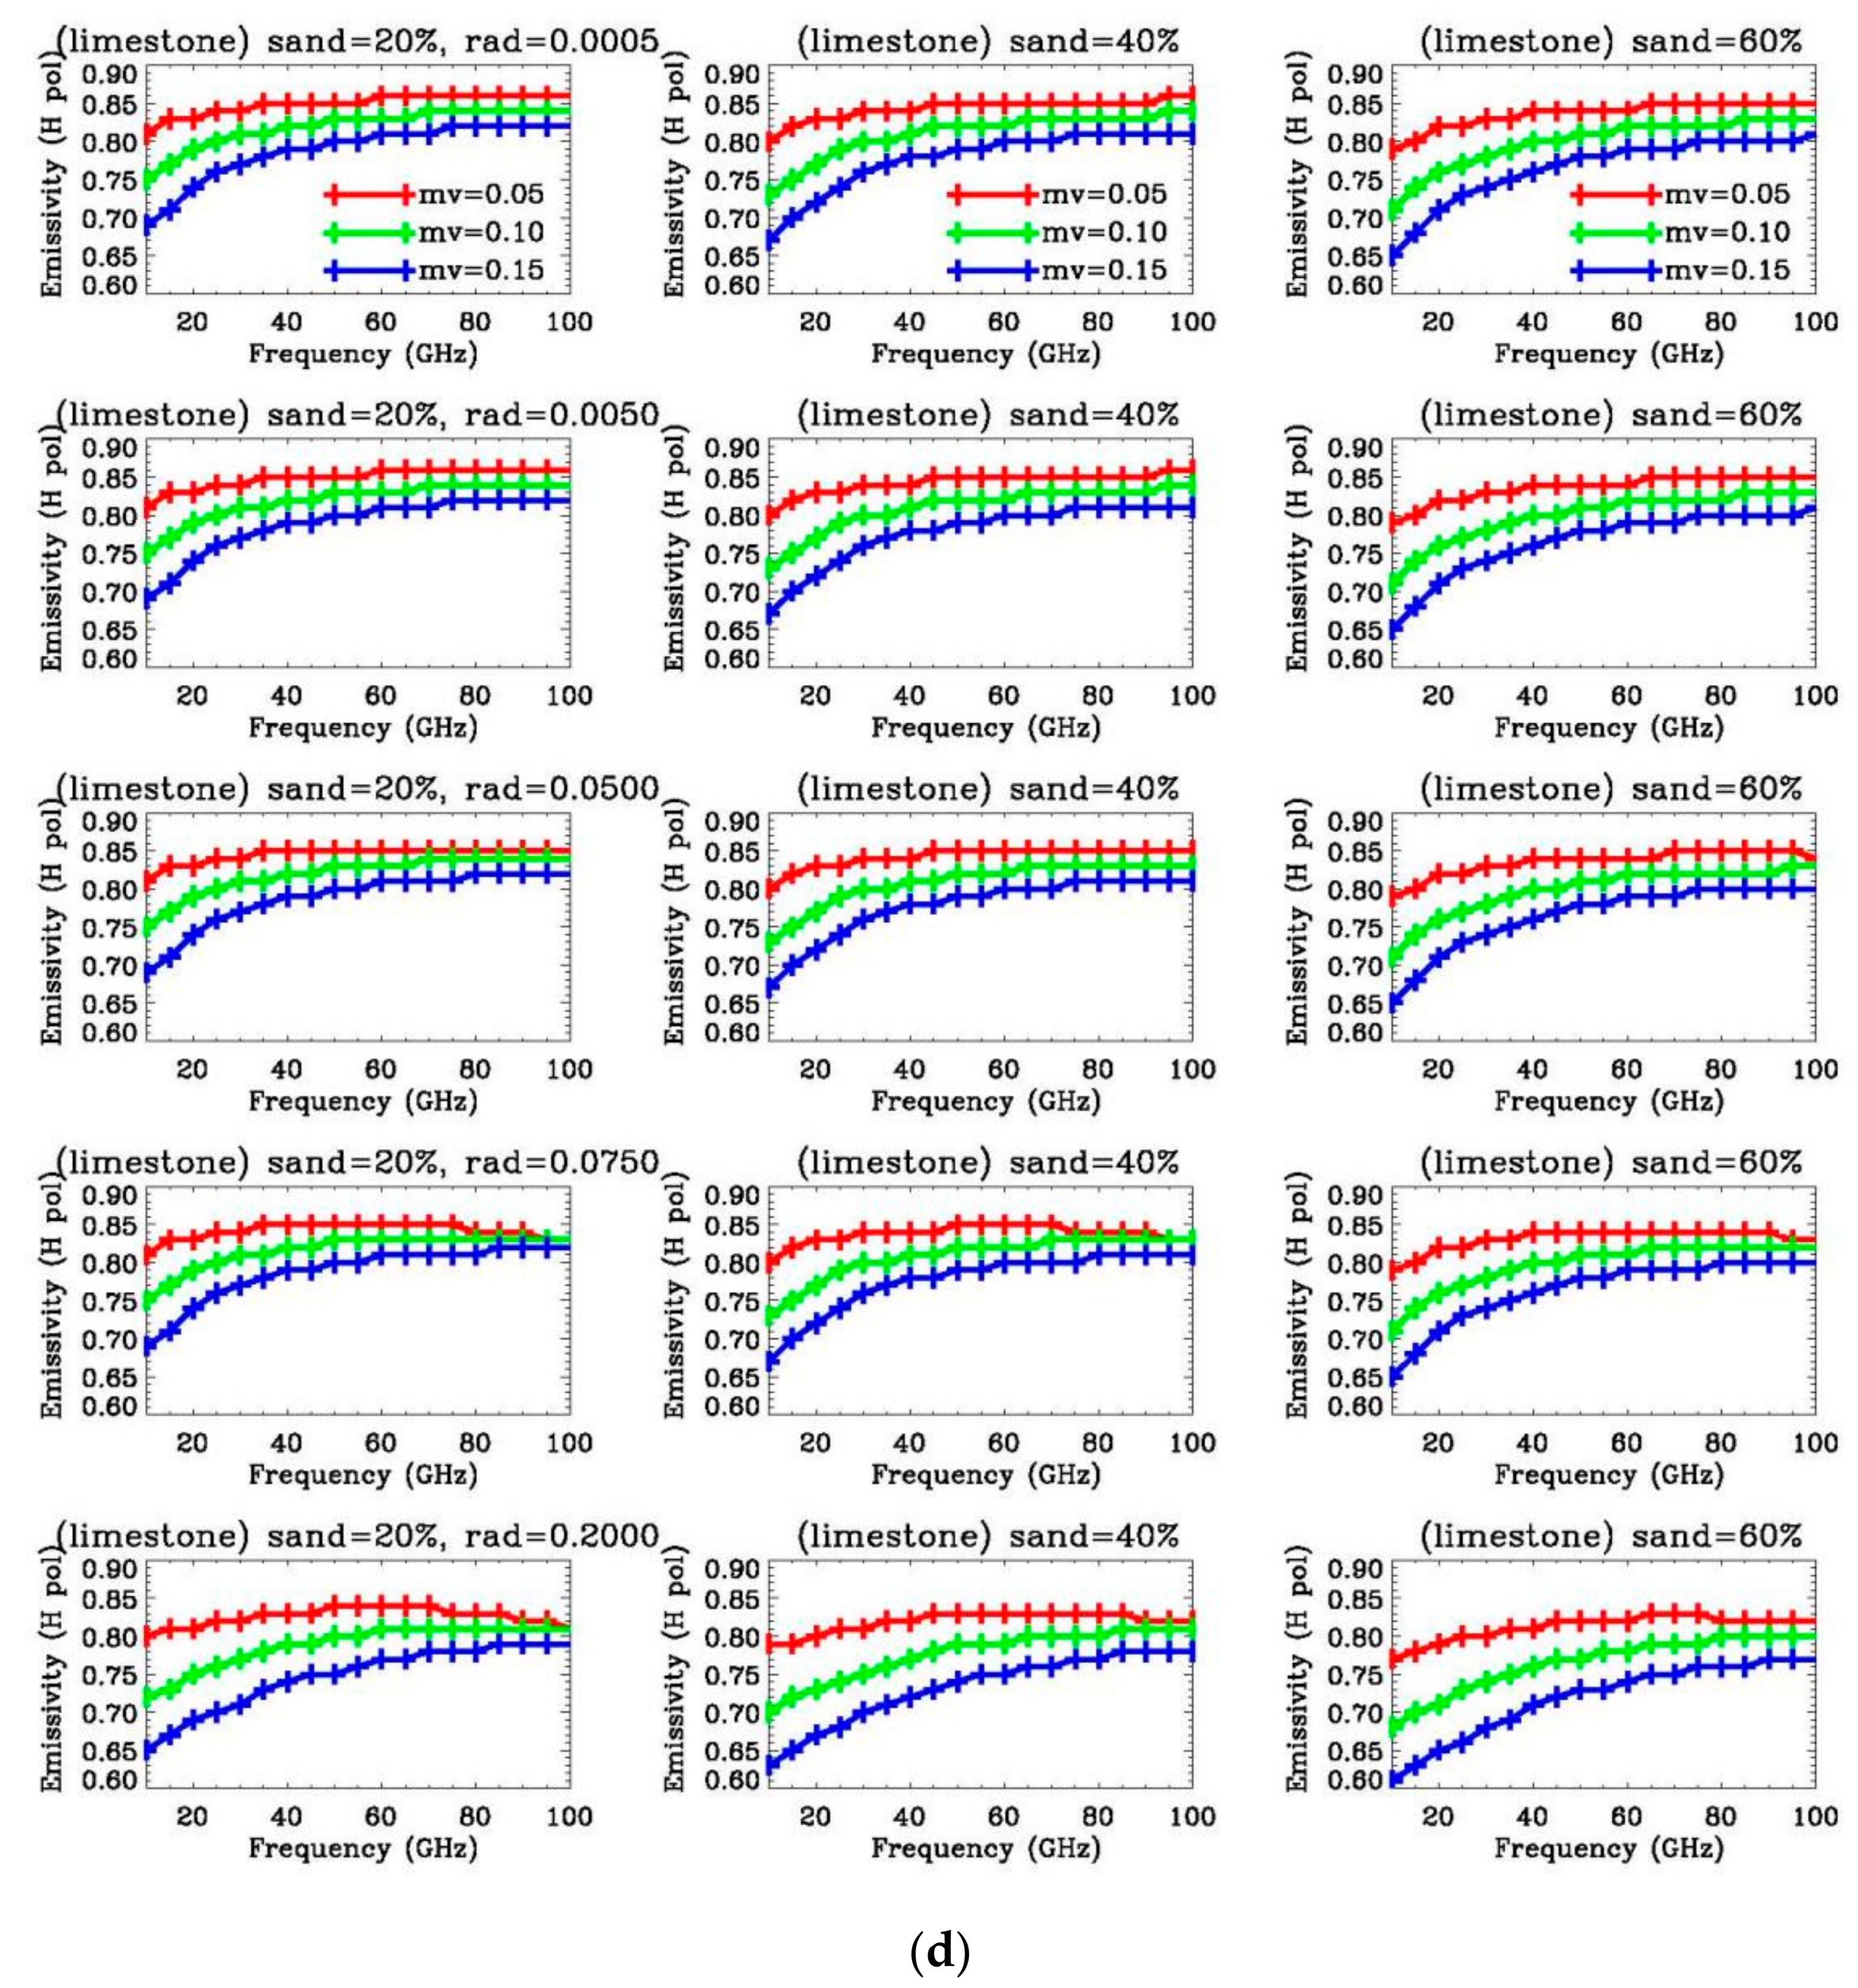
Herein, MLEM is used to simulate the emissivity spectra of the four main desert material components (sandstone, quartz, granite, limestone) [47] with dissimilar particle sizes, sand content, and soil moisture content. The emissivity of sandstone, quartz, granite, and limestone is calculated by MLEM, in which the mineral dielectric constant is set according to a reference [47]. Figure 4a–d illustrates the horizontally polarized emissivity of quartz, sandstone, granite, and limestone, respectively. In each 5-row × 3-column graph, the particle radii in the first to the fifth row are 0.0005 mm, 0.005 mm, 0.05 mm, 0.075 mm, and 0.2 mm, respectively. The sand content of the first to the third column is 20%, 40%, and 60%, respectively. In each figure, the red, green, and blue lines represent the soil water content (numerical range: 0–1.0) of 0.05, 0.10, and 0.15, respectively.
The broad trend difference of emissivity spectra is generally a function of grain size, soil moisture [50], and mineral type [47]. As can be seen from the calculation results in Figure 4, in general, the horizontally polarized emissivity increases with the increase in frequency and decreases with the increase in soil moisture content. According to the formula for surface MW emissivity [45], it can be concluded that important parameters affecting the emissivity calculation are optical thickness and the reflectivity coefficient of the interface. The reflectivity of a smooth contact surface can be obtained by the Fernsel equation, which is the equation of incident angle and dielectric constant of the medium. For bare soil, the empirical dielectric constant is approximated by a model of the soil-water mixed dielectric [55]. Therefore, the conclusion drawn in Section 4.1 is verified—that is, there is relatively more rain in summer, vegetation grows vigorously, and the surface soil contains relatively more water, which makes the surface emissivity slightly lower. In addition, surface emissivity is more sensitive to soil moisture at low frequencies than at high frequencies. When the soil water content is low (e.g., 0.05), the change in surface emissivity with sand content is not obvious. In cases where the soil water content is high (e.g., 0.15), the surface emissivity decreases with the increase in sand content. When the content of sand is low (e.g., 20%), the change in surface emissivity with particle size is minor. When the content of sandy soil is high (e.g., 60%), the surface emissivity decreases with the increase in particle size. Among the four desert minerals, the emissivity of all minerals changes with particle size. However, there is a small difference in the emissivity of different minerals, only in the high-frequency band (80–100 GHz). On this basis, the influence of minerals on emissivity could be regarded as marginal. In fact, in the shallow earth of the desert, particle sizes range across a wide scale. However, in most climate models and numerical weather models, the surface emissivity value is set at a constant value when the model is parameterized in arid or semi-arid regions. In addition, the surface emissivity of bare rock or soil across the observation area has huge spatial variability. As a result, researchers simply classify these areas as wasteland, desert, or bare soil without studying the spectral response characteristics of the soil structure or rock mineral composition to the spaceborne sensor.

4.3. Comparison of Surface Emissivity Inversion and Simulation

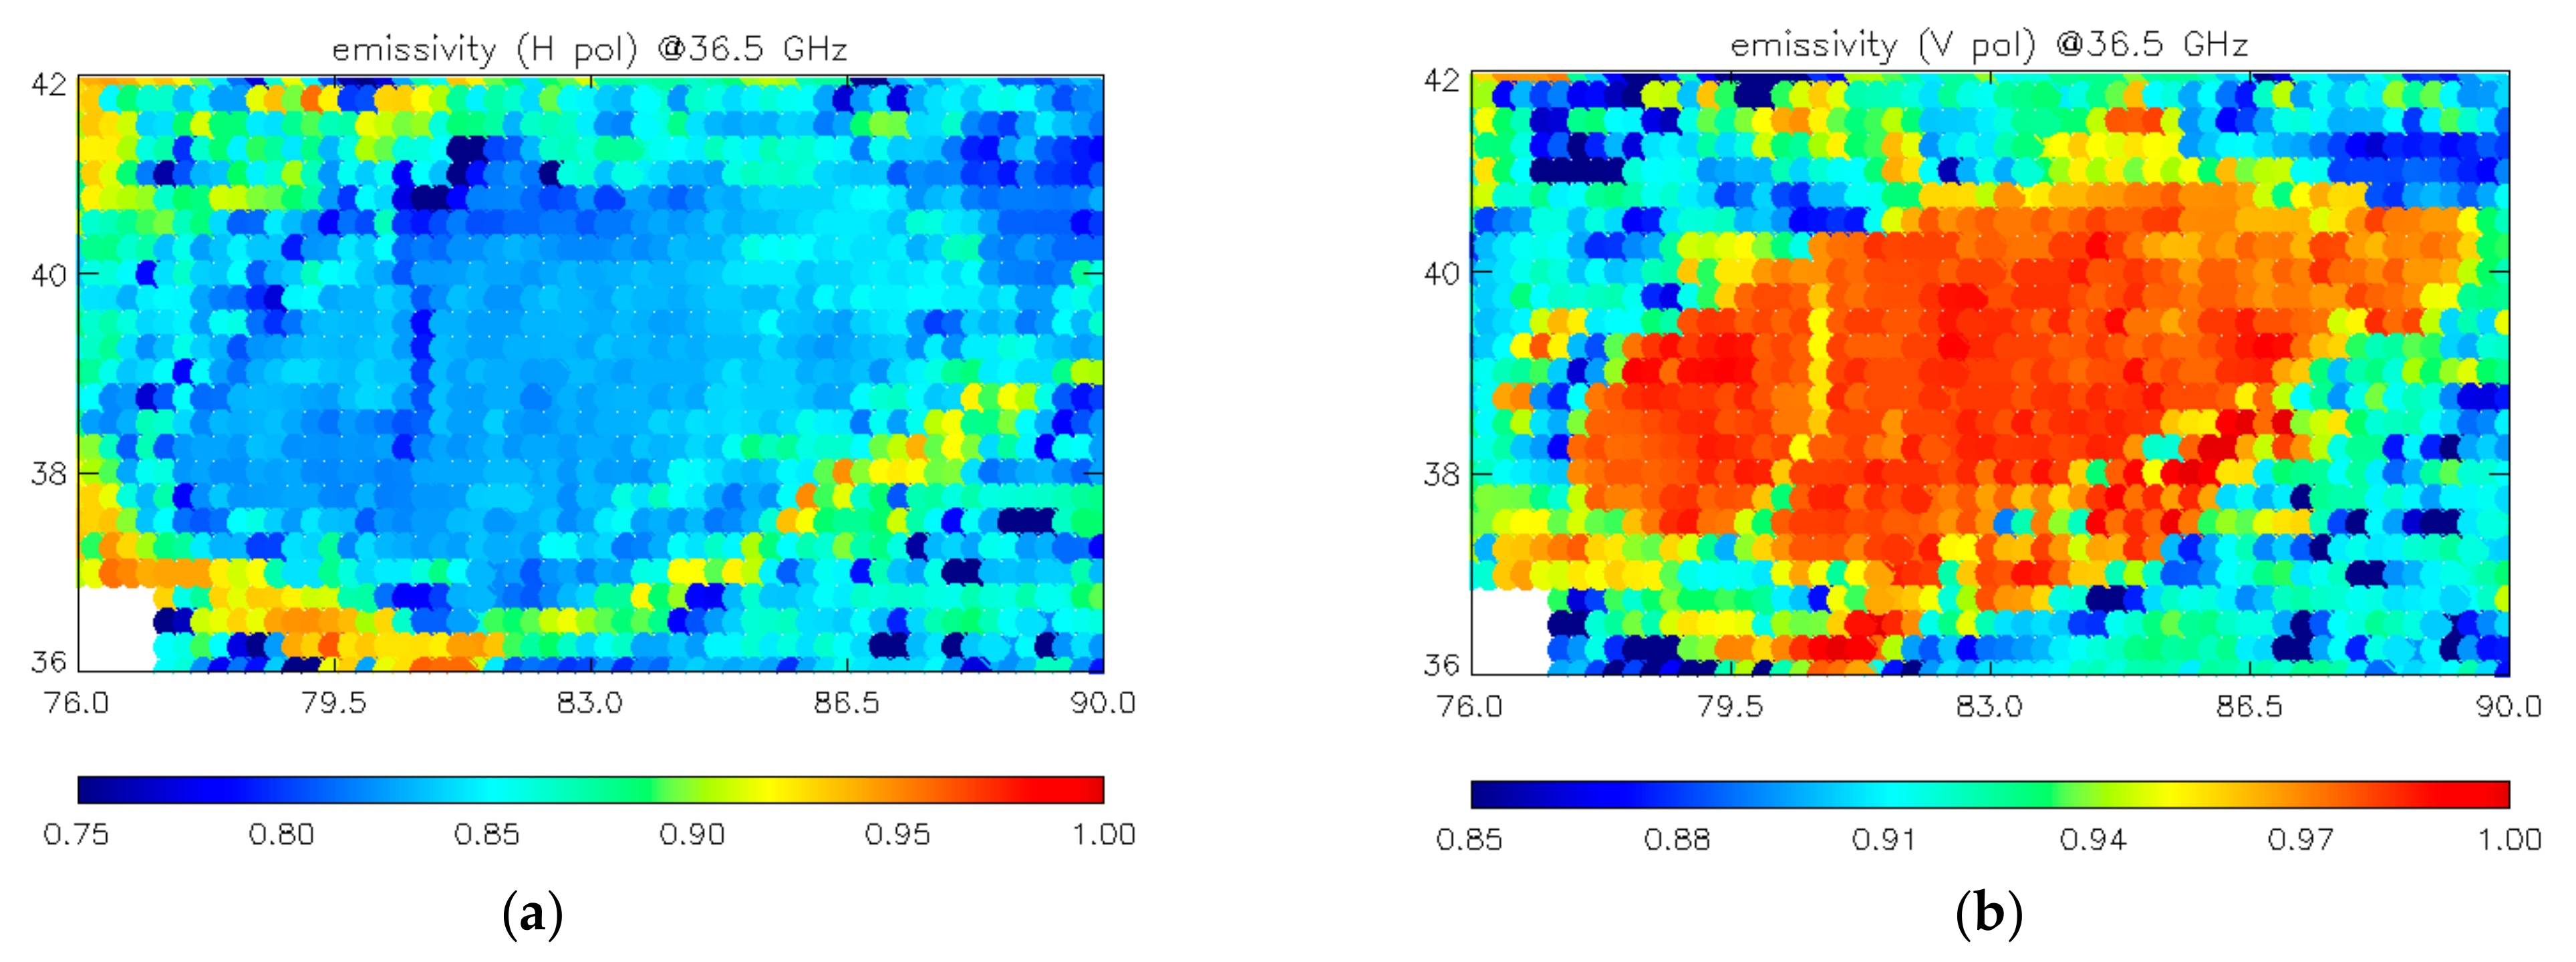
As can be observed from Figure 5, the surface emissivity is low in the river basins due to the dielectric effects of the water content in these areas. Soils with higher sand content generally show greater polarization differences at lower frequencies, while soils with higher clay or silt content show smaller polarization differences. This is consistent with the conclusion reached from the results in Figure 2.
Based on the FAO/STATSGO dataset that provides global soil texture information, such as soil grain-size scale, soil component (i.e., sand, silt, and clay) percentage, and so on, the related parameters in the model [45] are adjusted with that information. It should be noted that the particle sizes, sand content, and clay content of the various soil types used in this study are all average values of the corresponding soil types. In fact, these values occupy a range for the various soil types. For example, in sandy soil, the sand-content range exceeds 85%, and the particle size distribution ranges from 0.05 mm to 2 mm. According to the particle size, from small to large, it can be sub-divided into five types of sand particles: very fine, fine, medium, coarse, and very coarse. Therefore, the particle size distribution and soil composition used herein deviated from the actual soil type.
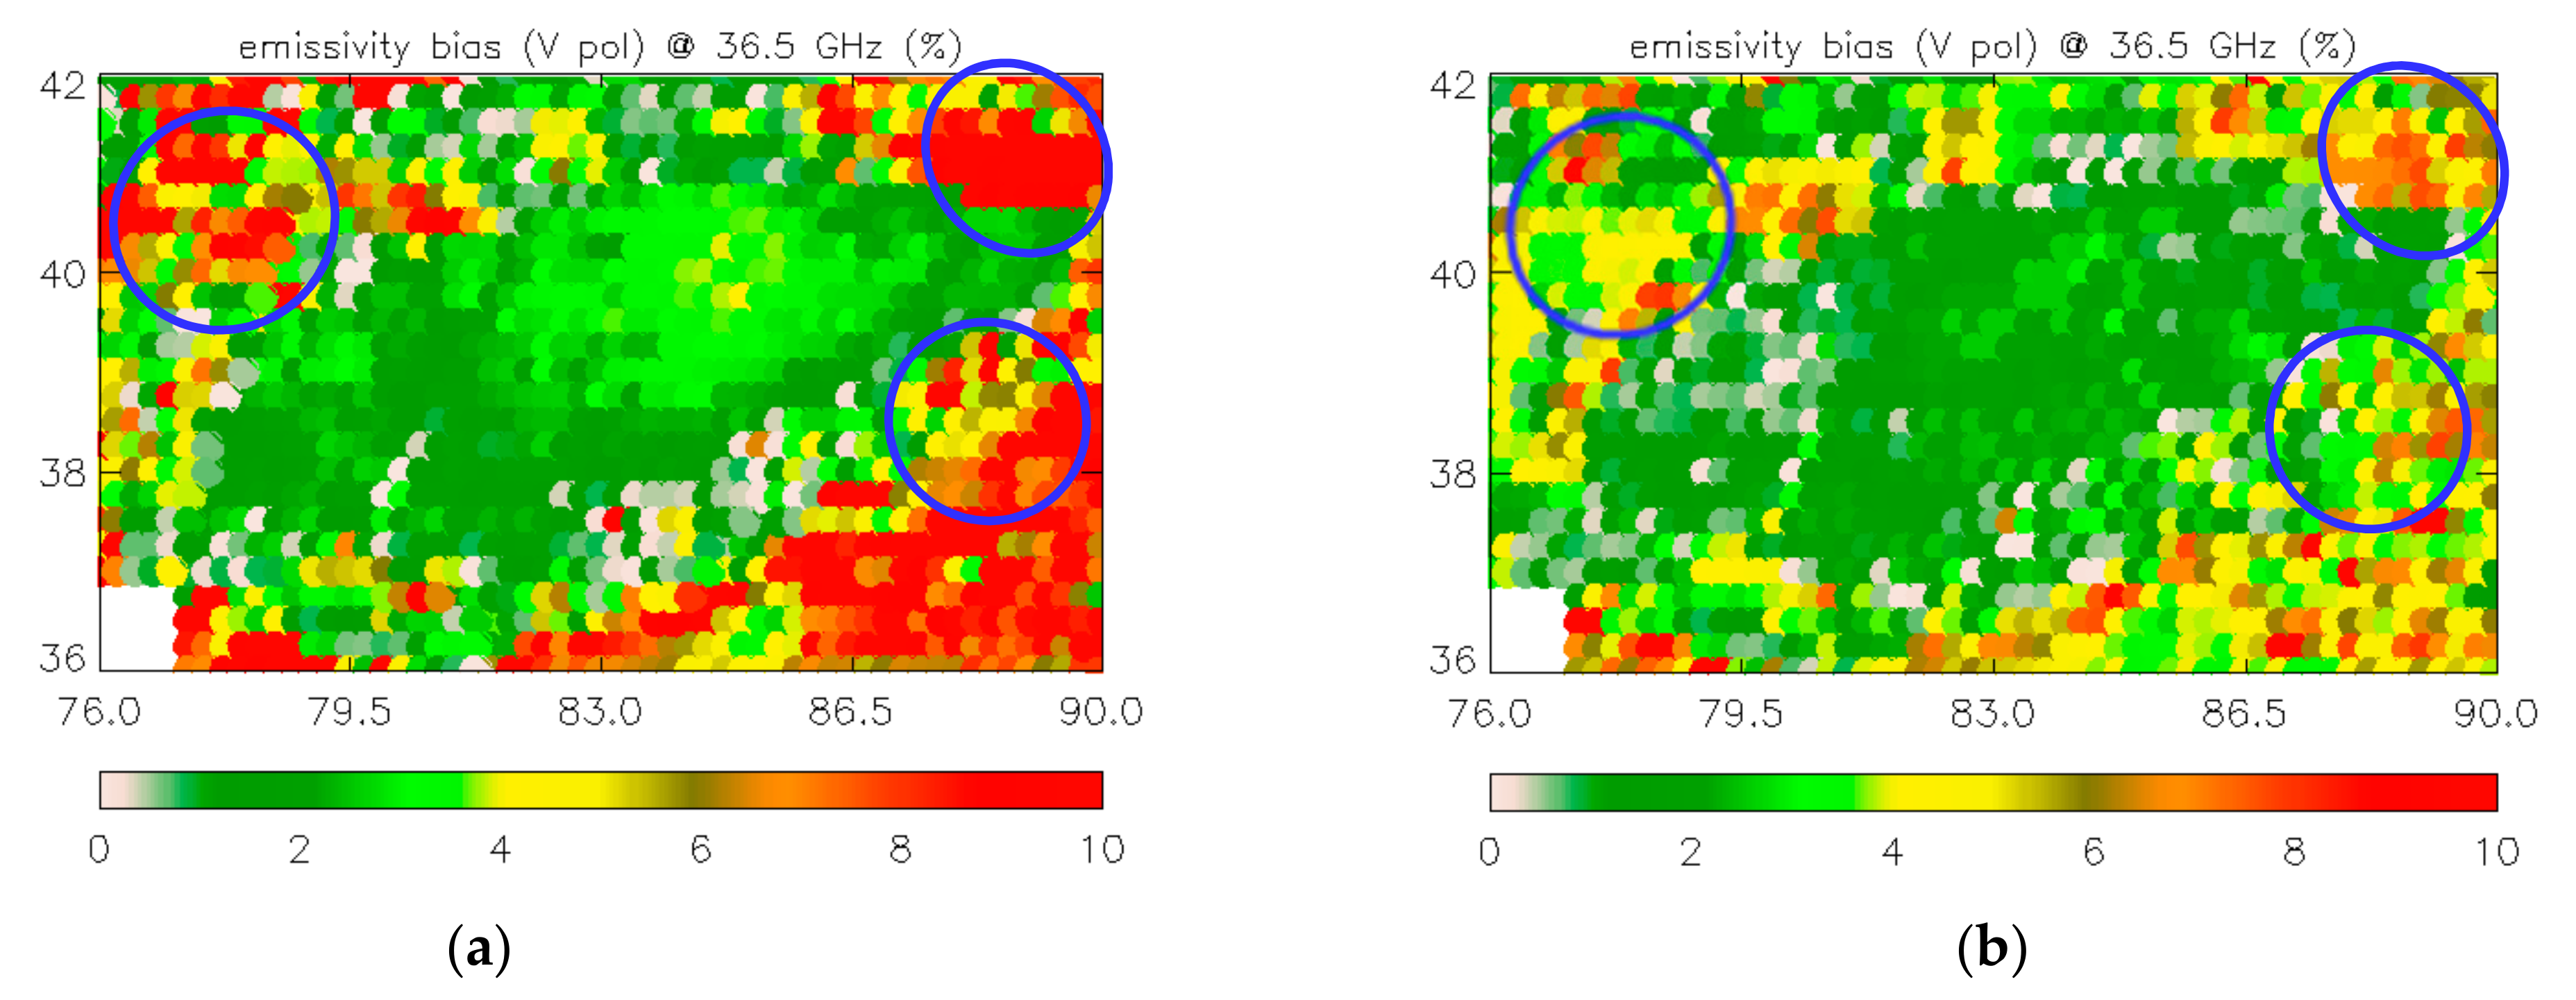
To analyze the correlation between the emissivity and different soil textures, the model combined with GDAS data is used to simulate the emissivity in the Taklimakan Desert, and the simulation results are compared with the satellite-retrieved emissivity. To better depict the relationship between emissivity and different soil textures, snow-covered areas are removed. The emissivity retrieved from the satellite observations is taken as the “true value” to compute the deviation in the simulated emissivity. Figure 6a,b shows the emissivity deviation calculated by the original model and the emissivity deviation of the model adjusted after considering the differences of different types of soil textures, respectively.
Large deviations can be observed (e.g., larger than 8% of the inner region of the ellipse in Figure 6a) in regions of soil types containing a large number of small particles, such as loam, clay loam, and clay. In the area highlighted by the ellipse in Figure 6a, the deviation of the original simulation is 7–10%, whereas the modified simulation deviation is 4–8% or even less (Figure 6b). It can be seen that, in the desert area, the model error largely stems from the uncertainty in particular parameter values. After adjustment of the model parameters, the level of deviation in the simulation decreases accordingly. The emissivity deviation shown in Figure 6b is generally much smaller than that in Figure 6a, especially for soils containing more clay or silt. For example, in the region of Figure 6a highlighted by the ellipse (in the lower right-hand corner), which has the greatest deviation, loam, and sandy clay are mainly composed of small particles. Here, desert soil is still assumed to be composed of sand and clay, and the average content and distribution of particle size of each soil are taken. In fact, there is a range of components and particle diameters for each soil. For instance, in loamy, sandy soil, the clay content is 10–20%, the silt content is 0–15%, and the sand content is 70–90%. The diameter of clay particles is less than 0.002 mm; silt particles are between 0.002 mm and 0.05 mm; sand particles are between 0.05 mm and 2 mm. In addition, the deviation is also related to the dielectric properties of the material (e.g., quartz has a higher emissivity than limestone).

5. Discussion

5.1. Characteristics of Different Desert Soil Surface Emissivity

Soils with higher sandy content, such as sand, generally show greater polarization differences at lower frequencies, while soils with higher clay or silt content, such as clay, sandy clay, and sandy clay loam, show smaller polarization differences. These characteristics may be related to the delamination and dielectric properties of materials [4]. Moreover, the emissivity of horizontal polarization reflects stronger seasonal characteristics than that of vertical polarization. This is because horizontally polarized emissivity is more sensitive to surface-related parameters than vertically polarized emissivity. Maybe this is due to the influence of moisture and roughness. In addition, it is clear that on vertical polarization, due to the Brewster angle, there are small changes in radiation. Moreover, on the horizontal polarization of radiation, a change in the moisture content and roughness of the soil surface follows due to the significant contribution of the reflection coefficient. Therefore, land skin temperature, soil temperature, soil moisture, vegetation water content, and leaf thickness (vegetation cover and its growth conditions) play an important role in the seasonal variation of surface emissivity [45].
In general, the annual fluctuation range of soil temperature is somewhat lower than that of surface temperature [56]. The soil surface temperature reaches its highest value in July and August and lowest value in January and February. Yet, the peak value and minimum value of soil temperature are about one month later than those of land surface temperature. In summer, both soil and surface temperature tends to be almost the same, while in autumn and winter, the soil temperature is higher than the land skin temperature.
For most soil types, generally, surface emissivity in summer is slightly lower than that in spring, autumn, and winter. This is because soil MW radiation is closely related to the soil’s MW dielectric constant, which is usually determined by the soil moisture content [38]. The complex permittivity of a ground object depends on its water content, and this changes linearly with respect to the liquid water content per unit volume of the medium. In general, the higher the complex permittivity, the stronger the effect of reflected electromagnetic waves, and the smaller the penetration. From the surface polarization emissivity, the emissivity of the soil surface (equal to 1) minus the sum of scattering coefficients in all aspects. When the soil water content increases, this scattering is mainly reflected, and the reflectivity increases, so the emissivity will decrease. That is, the dielectric properties of water in the soil will cause the surface emissivity to decrease with the increase in soil water content, and this trend is particularly obvious in the low-frequency range [30,55,57,58]. This is one of the important reasons behind the seasonal variation of surface emissivity with changes in soil water content and vegetation water content. When the precipitation reaches its peak in July and August, the soil moisture and vegetation coverage both appear to be higher. Similarly, when the precipitation reaches its minimum value in January and February, the soil moisture and vegetation coverage both appear to be smaller values. Therefore, soil volumetric water content is affected by precipitation to a certain extent, and soil volumetric water content is closely related to vegetation coverage and canopy water content.
In addition, higher clay or silt content soils generally have better water storage capacity, so soil moisture and vegetation coverage are higher [59,60]. Therefore, among the above six soil types, clayey soils—such as sandy clay loam and clay loam—have higher soil moisture and vegetation coverage. On the contrary, sandy desert surfaces have extremely low soil moisture and sparse vegetation all year round, and the emissivity of the four seasons shows little difference and is relatively stable. In summer, there is relatively more rain, vegetation growth is vigorous, and the surface soil contains relatively more water, making its surface emissivity slightly lower. The soil surface roughness directly affects the reflectance and reflectivity and then affects the MW emissivity, especially the horizontal polarization [61,62].

5.2. Effect of Different Mineral Composition on Surface Emissivity

As can be observed in Figure 4, the horizontally polarized emissivity generally increases with the frequency and decreases with the increase in soil moisture content. According to the three-layer medium model, optical thickness and the reflectivity coefficient of the interface have a significant role in the calculation of emissivity [45]. The reflectivity of a smooth contact surface can be obtained by the Fernsel equation, which is the equation of incident angle and dielectric constant of the medium. For bare soil, the empirical dielectric constant is approximated by a model of the soil-water mixed dielectric [63]. Therefore, the conclusion already drawn in Section 4.1 is verified—that is, there is relatively more rain in summer, vegetation grows vigorously, and the surface soil contains relatively more water, which makes the surface emissivity slightly lower. In addition, surface emissivity is more sensitive to soil moisture at low than high frequencies. When the soil water content is low (e.g., 0.05), the change in surface emissivity with sand content is not obvious. When the soil water content is high (e.g., 0.15), the surface emissivity decreases with the increase in sand content. When the sand content is low (e.g., 20%), the change in surface emissivity with particle size is minor. In cases where sandy soil content is high (e.g., 60%), the surface emissivity decreases with the increase in particle size. Among the four desert minerals, the emissivity of different minerals only has some differences in the high-frequency band (80–100 GHz). In fact, on the shallow surface of the desert, particle sizes range across a wide scale. However, in most climate and numerical weather models, the surface emissivity value is set at a constant value when the model is parameterized in arid or semi-arid regions. In addition, the huge spatial variability of surface emissivity across observation areas of bare rock or soil has led researchers to simply classify this type of area as wasteland, desert, or bare soil without studying the spectral response characteristics of the soil structure or rock mineral composition of these surfaces to the spaceborne sensor [47,64].
In practice, for the Taklimakan Desert, sand particle size varies with desert stratification. In the profile, the lower clay (clay particles less than 0.002 mm) has many interlayers, or the sand layer and the clay layer are interbedded with unequal thickness [65,66]. Also, the upper sand layer increases or thickens, often presenting some coarse sand layers (particle size greater than or equal to 0.5 mm). Therefore, if (as expected) more specific model input parameters could be obtained, e.g., soil component fraction, mineral composition, soil particle size, and even stratifying the near-surface soil into multiple layers, it should be beneficial to analyze the radiative transfer process, thus helping further to improve the existing surface emissivity, calculation model.

6. Conclusions

In this study, MWRI TB data is used, to our knowledge for the first time, to calculate the surface emissivity under clear-sky conditions in the Taklimakan Desert region. Combined with soil texture classification information from the FAO and STATSGO, the variations of MW emissivity for different soil types in the Taklimakan Desert are analyzed. In addition, using the MLEM, the emissivity spectra of the four most abundant materials in the desert area—namely, quartz, granite, sandstone, and limestone—under different particle sizes, soil components, and soil moisture content are calculated. Then, on this basis, the soil texture error sources used in the current MLEM’s calculations in desert areas are discussed. Moreover, according to the soil texture information, the feasibility of reducing the MLEM simulation error in the desert area by refining the soil classification characteristic parameters in the model has also been verified. The key study findings are summarized below:
  • The MW emissivity in desert areas is highly correlated with the soil type and the seasonal variation of land surface emissivity for different soil types differs considerably. The seasonal variation of surface MW emissivity of clay-rich soil is more obvious than that of sand-rich soil.
  • Soil moisture is affected by precipitation to some extent but is also restricted by soil type. This is because the water content of different types of soil is different on the whole due to the difference in water storage capacity.
  • The surface emissivity changes considerably with a difference in the soil distribution of particle size. For the same mineral, the horizontal polarization emissivity generally decreases with the increase in soil particle radius. Furthermore, the emissivity of soil composed of small-size particles has marked seasonal characteristics, and the emissivity of the horizontal polarization shows stronger seasonal variation than that of the vertical polarization.
  • In the desert surface layer, where the soil is mainly sandy in type, the surface emissivity is affected by the depth of the desert to some extent. Because soil moisture in desert areas is very low throughout the year, the penetration depth of soil is an important factor affecting the surface emissivity.
  • The fact that surface emissivity is dependent on soil texture requires the theoretical model to consider the influence of soil texture in its practical application. The increase in soil texture information, including finer details regarding the soil composition content and distribution of particle size, improved MLEM’s simulation in the desert region—especially for desert soil containing a large number of small particles. The simulation error of the model after adjusting the parameters is considerably reduced.
It is important to acknowledge that in this study, data from one calendar year are used to study the MW emissivity of the land surface in the Taklimakan Desert. Therefore, further analyses over longer time ranges should be carried out as it would allow for providing more comprehensive emissivity variation characteristics in this area. At the same time, the specific reasons behind the spatial and temporal variations of the emissivity and the differences between ascending and descending orbits need to be analyzed and verified by combining more observational and experimental data. It is possible to improve the existing model by analyzing the radiative transfer process by stratifying the near-surface soil. From the preliminary results of this study, it is clearly evidenced that the MLEM will be improved since it can be seen that soil composition (e.g., sand fraction, clay fraction), mineral dielectric constant (e.g., quartz, sandstone, granite, limestone, etc.) and soil particle size all affect the simulation results of the emissivity. As the MLEM is an important part of the global meteorological data assimilation and weather forecast system, the model’s prediction improvement will enhance the use of satellite data in desert areas and will improve the accuracy of the numerical weather forecast. These aspects remain to be seen.

Author Contributions

Conceptualization: Y.W.; methodology: Y.W.; software: Y.W., J.B. and Z.L.; validation: Y.W., J.B. and Z.L.; formal analysis: Y.W., Y.B. and G.P.P.; investigation: J.B. and Z.L.; resources: Y.B.; data curation: J.B. and Z.L.; writing—original draft preparation: Y.W.; writing—review and editing: Y.B. and G.P.P.; visualization: J.B. and Z.L.; supervision: Y.B.; Project administration: Y.B. All authors have read and agreed to the published version of the manuscript.

Funding

This study was supported by the National Natural Science Foundation of China (41975046) and the National Key Research and Development Program of China (2017YFC1501704, 2018YFC1407200). GPP’s contribution was supported by the FP7-People project ENViSIoN-EO “Enhancing our Understanding of Earth’s Land Surface InteractiONs at Multiple Scales Utilising Earth Observation” (project reference number 752094).

Data Availability Statement

The data supporting this research can be found at the hyperlinks: http://satellite.nsmc.org.cn/PortalSite/Data/Satellite.aspx (accessed on 10 January 2020), https://rda.ucar.edu/#!lfd?nb=y&b=topic&v=Land%20Surface (accessed on 1 February 2020), https://ldas.gsfc.nasa.gov/data (accessed on 20 March 2020).

Acknowledgments

We thank the anonymous reviewers for the comments that helped improve our manuscript.

Conflicts of Interest

The authors declare no conflict of interest.

References

  1. Liu, H.; Li, H.; Tang, S.; Duan, M.; Zhang, S.; Deng, X.; Hu, J. A physical algorithm for precipitable water vapour retrieval over land using passive microwave observations. Int. J. Remote Sens. 2020, 41, 6288–6306. [Google Scholar] [CrossRef]
  2. Perro, C.; Duck, T.J.; Lesins, G.; Strong, K.; Drummond, J.R. Arctic surface properties and their impact on microwave satellite water vapor column retrievals. IEEE Trans. Geosci. Remote Sens. 2020, 58, 8332–8344. [Google Scholar] [CrossRef]
  3. Zhou, F.-C.; Song, X.; Leng, P.; Wu, H.; Tang, B.-H. An algorithm for retrieving precipitable water vapor over land based on passive microwave satellite data. Adv. Meteorol. 2016, 2016, 4126393. [Google Scholar] [CrossRef] [Green Version]
  4. Zhou, S.; Cheng, J. An improved temperature and emissivity separation algorithm for the Advanced Himawari Imager. IEEE Trans. Geosci. Remote Sens. 2020, 58, 7105–7124. [Google Scholar] [CrossRef]
  5. Chen, K.; Fan, J.; Xian, Z. Assimilation of MWHS-2/FY-3C 183 GHz channels using a dynamic emissivity retrieval and its impacts on precipitation forecasts: A southwest vortex case. Adv. Meteorol. 2021, 2021, 6427620. [Google Scholar] [CrossRef]
  6. Ringerud, S.; Peters-Lidard, C.; Munchak, J.; You, Y. Applications of dynamic land surface information for passive microwave precipitation retrieval. J. Atmos. Ocean. Technol. 2021, 38, 167–180. [Google Scholar] [CrossRef]
  7. You, Y.; Peters-Lidard, C.; Wang, N.; Turk, J.; Ringerud, S.; Yang, S.; Ferraro, R. The instantaneous retrieval of precipitation over land by temporal variation at 19 GHz. J. Geophys. Res. Atmos. 2018, 123, 9279–9295. [Google Scholar] [CrossRef]
  8. You, Y.; Munchak, S.J.; Peters-Lidard, C.; Ringerud, S. Daily rainfall estimate by emissivity temporal variation from 10 Satellites. J. Hydrometeorol. 2021, 22, 623–637. [Google Scholar] [CrossRef]
  9. Njoku, E.G.; Jackson, T.J.; Lakshmi, V.; Chan, T.K.; Nghiem, S.V. Soil moisture retrieval from AMSR-E. IEEE Trans. Geosci. Remote Sens. 2003, 41, 215–229. [Google Scholar] [CrossRef]
  10. Pellerin, T.; Wigneron, J.P.; Calvet, J.C.; Waldteufel, P. Global soil moisture retrieval from a synthetic L-band brightness temperature data set. J. Geophys. Res. 2003, 108, 4364. [Google Scholar] [CrossRef]
  11. Shi, J.; Chen, K.S.; Li, Q.; Jackson, T.J.; O’Neill, P.E.; Tsang, L. A parameterized surface reflectivity model and estimation of bare-surface soil moisture with L-band radiometer. IEEE Trans. Geosci. Remote Sens. 2002, 40, 2674–2686. [Google Scholar]
  12. Wigneron, J.P.; Calvet, J.C.; Pellarin, T.; Griend, A.A.V.D.; Berger, M.; Ferrazzoli, P. Retrieving near-surface soil moisture from microwave radiometric observations: Current status and future plans. Remote Sens. Environ. 2003, 85, 489–506. [Google Scholar] [CrossRef]
  13. Calvet, J.C.; Wigneron, J.P.; Mougin, E.; Kerr, Y.H.; Brito, J.L.S. Plant water content and temperature of amazon forest from satellite microwave radiometry. IEEE Trans. Geosci. Remote Sens. 1994, 32, 397–408. [Google Scholar] [CrossRef]
  14. Prigent, C.; Aires, F.; Rossow, W.B. Land surface skin temperatures from a combined analysis of microwave and infrared satellite observations for an all-weather evaluation of the differences between air and skin temperatures. J. Geophys. Res. 2003, 108, 4310. [Google Scholar] [CrossRef]
  15. Kelly, R.E.; Chang, A.T.; Tsang, L.; Foster, J.L. A prototype AMSR-E global snow area and snow depth algorithm. IEEE Trans. Geosci. Remote Sens. 2003, 41, 230–242. [Google Scholar] [CrossRef] [Green Version]
  16. Weng, F.; Liu, Q. Satellite data assimilation in numerical weather prediction models, Part I: Forward radiative transfer and Jacobian modeling in cloudy atmospheres. J. Atmos. Sci. 2003, 60, 2633–2646. [Google Scholar] [CrossRef]
  17. Errico, R.M.; Ohring, G.; Weng, F.; Bauer, P.; Ferrier, B.; Mahfouf, J.F.; Turk, J. Assimilation of satellite cloud and precipitable observations in numerical weather prediction models. J. Atmos. Sci. 2007, 64, 3737–3741. [Google Scholar] [CrossRef]
  18. Grody, N.C. Severe storm observations using the microwave sounding unit. J. Appl. Meteorol. 1983, 22, 609–625. [Google Scholar] [CrossRef] [Green Version]
  19. Ringerud, S.; Kummerow, C.D.; Peters-Lidard, C.D. A semi-empirical model for computing land surface emissivity in the microwave region. IEEE Trans. Geosci. Remote Sens. 2015, 53, 1935–1946. [Google Scholar] [CrossRef]
  20. Prigent, C.; Rossow, W.B.; Matthews, E. Microwave land surface emissivities estimated from SSM/I observations. J. Geophys. Res. 1997, 102, 21867–21890. [Google Scholar] [CrossRef]
  21. Prigent, C.; Liang, P.; Tian, Y.; Aires, F.; Moncet, J.L.; Boukabara, S.A. Evaluation of modeled microwave land surface emissivities with satellite-based estimates. J. Geophys. Res. Atmos. 2015, 120, 2706–2718. [Google Scholar] [CrossRef]
  22. He, W.Y. Comparisons of radiative transfer models for GMI assimilationin WRF. In Proceedings of the SPIE 10782, Remote Sensing and Modeling of the Atmosphere, Oceans, and Interactions VII, Honolulu, HI, USA, 24–26 September 2018. [Google Scholar]
  23. Hu, J.H.; Fu, Y.Y.; Zhang, P.; Min, Q.L.; Gao, Z.T.; Wu, S.L.; Li, R. Satellite retrieval of microwave land surface emissivity under clear and cloudy skies in China using observations from AMSR-E and MODIS. Remote Sens. 2021, 13, 3980. [Google Scholar] [CrossRef]
  24. Morland, J.C.; Grimes, D.I.F.; Hewison, T.J. Satellite observations of the microwave emissivity of a semi-arid land surface. Remote Sens. Environ. 2001, 77, 149–164. [Google Scholar] [CrossRef]
  25. Aires, F.; Prigent, C.; Rossow, W.B.; Rothstein, M.A. New neural network approach including first-guess for retrieval of atmospheric water vapor, cloud liquid water path, surface temperature and emissivities over land from satellite microwave observations. J. Geophys. Res. Atmos. 2001, 106, 14887–14907. [Google Scholar] [CrossRef]
  26. Ruston, B.; Weng, F.; Yan, B. Use of a one-dimensional variational retrieval to diagnose estimates of infrared and microwave surface emissivity over land for atovs sounding instruments. IEEE Trans. Geosci. Remote Sens. 2008, 46, 393–402. [Google Scholar] [CrossRef]
  27. Boukabara, S.A.; Garrett, K.; Chen, W.; Iturbide-Sanchez, F.; Grassotti, C.; Kongoli, C.; Chen, R.; Liu, Q.; Yan, B.; Weng, F. MiRS: An All-Weather 1DVAR Satellite Data Assimilation and Retrieval System. IEEE Trans. Geosci. Remote Sens. 2011, 49, 3249–3272. [Google Scholar] [CrossRef]
  28. Wu, Y.; Weng, F. Applications of an AMSR-E RFI detection and correction algorithm in 1-DVAR over land. J. Meteorol. Res. 2014, 28, 645–655. [Google Scholar] [CrossRef]
  29. Aires, F.; Prigent, C.; Bernardo, F.; Jiménez, C.; Saunders, R.; Brunel, P. A tool to estimate land-surface emissivities at microwave frequencies (TELSEM) for use in numerical weather prediction. Q. J. R. Meteorol. Soc. 2011, 137, 656. [Google Scholar] [CrossRef] [Green Version]
  30. Xie, Y.; Shi, J.; Ji, D.; Zhong, J.; Fan, S. A parameterized microwave emissivity model for bare soil surfaces. Remote Sens. 2017, 9, 155. [Google Scholar] [CrossRef] [Green Version]
  31. Ferraro, R.R.; Peters-Lidard, C.D.; Hernandez, C.; Turk, F.J.; Aires, F.; Prigent, C.; Lin, X.; Boukabara, S.A.; Furuzawa, F.A.; Gopalan, K. An evaluation of microwave land surface emissivities over the continental United States to benefit GPM-Era precipitation algorithms. IEEE Trans. Geosci. Remote Sens. 2013, 51, 378–398. [Google Scholar] [CrossRef]
  32. Tian, Y.; Peters-Lidard, C.D.; Harrison, K.W.; You, Y.; Ringerud, S.; Kumar, S.; Turk, F.J. An examination of methods for estimating land surface microwave emissivity. J. Geophys. Res. Atmos. 2015, 120, 11114–11128. [Google Scholar] [CrossRef] [Green Version]
  33. Jones, A.S.; Vonder Haar, T.H. Retrieval of surface emittance over land using coincident microwave and infrared satellite measurements. J. Geophys. Res. Atmos. 1997, 102, 13609–13626. [Google Scholar] [CrossRef]
  34. Zhang, Y.P.; Jiang, L.M.; Qiu, Y.B.; Wu, S.L.; Zhang, L.X. Study of the microwave emissivity characteristics over different land cover types. Spectrosc. Spectr. Anal. 2010, 30, 1446–1451. [Google Scholar]
  35. Prakash, S.; Norouzi, H.; Azarderakhsh, M.; Blake, R.A.; Tesfagiorgis, K. Global land surface emissivity estimation from amsr2 observations. IEEE Geosci. Remote Sens. Lett. 2016, 13, 1270–1274. [Google Scholar] [CrossRef]
  36. Wu, Y.; Qian, B.; Bao, Y.; Petropoulos, P.G.; Liu, X.; Li, L. Microwave land emissivity calculations over the Qinghai-Tibetan Plateau using FY-3B/MWRI measurements. Remote Sens. 2019, 11, 2206. [Google Scholar] [CrossRef] [Green Version]
  37. Weng, F.; Zhu, T.; Yan, B. Satellite data assimilation in numerical weather prediction models. Part II: Uses of rain affected microwave radiances for hurricane vortex analysis. J. Atmos. Sci. 2007, 64, 3910–3925. [Google Scholar] [CrossRef] [Green Version]
  38. Wang, J.R.; Schmugge, T.J. An empirical model for the complex dielectric permittivity of soils as a function of water content. IEEE Trans. Geosci. Remote Sens. 1980, GE-18, 288–295. [Google Scholar] [CrossRef] [Green Version]
  39. Fung, A.K.; Li, Z.; Chen, K.S. Backscattering from a randomly rough dielectric surface. IEEE Trans. Geosci. Remote Sens. 1992, 30, 356–369. [Google Scholar] [CrossRef]
  40. Mo, T.; Choudhury, B.J.; Schmugge, T.J.; Wang, J.R.; Jackson, T.J. A model for microwave emission from vegetation-covered fields. J. Geophys. Res. Ocean. 1982, 87, 11229–11237. [Google Scholar] [CrossRef]
  41. Wegmuller, U.; Mfitzler, C.; Njoku, E.G. Canopy Opacity Models, Passive Microwave Remote Sensing of Land-Atmosphere Interactions; VSP BV: Utrecht, The Netherlands, 1995; pp. 380–384. [Google Scholar]
  42. Vecchia, A.D.; Saleh, K.; Ferrazzoli, P.; Guerriero, L.; Wigneron, J.P. Simulating l-band emission of coniferous forests using a discrete model and a detailed geometrical representation. IEEE Geosci. Remote Sens. Lett. 2006, 3, 364–368. [Google Scholar] [CrossRef]
  43. Fung, A.K. Microwave Scattering and Emission Models and Their Applications; Artech House: Norwood, MA, USA, 1994; pp. 419–423. [Google Scholar]
  44. Santi, E.; Paloscia, S.; Pampaloni, P.; Pettinato, S.; Brogioni, M.; Xiong, C. Analysis of microwave emission and related indices over snow using experimental data and a multilayer electromagnetic model. IEEE Trans. Geosci. Remote Sens. 2017, 55, 2097–2110. [Google Scholar] [CrossRef]
  45. Weng, F.Z.; Yan, B.H.; Grody, N.C. A microwave land emissivity model. J. Geophys. Res. Atmos. 2001, 106, 20115–20123. [Google Scholar] [CrossRef]
  46. FAO (United Nations Food and Agriculture Organization). 1971–1981. Soil Map of the World. Vols.1–10 (1:5 M Scale Maps and Accompanying Texts); FAO: Paris, France, 1996. [Google Scholar]
  47. Grody, N.C.; Weng, F. Microwave emission and scattering from deserts: Theory compared with satellite measurements. IEEE Trans. Geosci. Remote Sens. 2008, 46, 361–375. [Google Scholar] [CrossRef]
  48. FAO/STATSGO Soil Type, United Nations Food and Agriculture Organization, National Cartography and GIS Center, United States Department of Agriculture [EB/OL]. 1995. Available online: https://www.emc.ncep.noaa.gov/mmb/gcp/sfcimg/soiltex/index.html (accessed on 10 June 2020).
  49. Rosenkranz, P.W. Absorption of Microwave by Atmospheric Gases in Atmospheric Remote Sensing by Microwave Radiometry; Janssen, M.A., Ed.; Wiley: New York, NY, USA, 1993; pp. 84–90. [Google Scholar]
  50. Yang, H.; Weng, F.Z. Error sources in remote sensing of microwave land surface emissivity. IEEE Trans. Geosci. Remote Sens. 2011, 49, 3437–3442. [Google Scholar] [CrossRef]
  51. Ulaby, F.T.; Moore, R.K.; Fung, A.K. Microwave Remote Sensing: Active and Passive; Artech House: Norwood, MA, USA, 1986; Volume II, p. 02062. [Google Scholar]
  52. Ferrazzoli, P.; Guerriero, L. Passive microwave remote sensing of forests: A model in investigation. IEEE Trans. Geosci. Remote Sens. 1996, 34, 433. [Google Scholar] [CrossRef]
  53. Allison, L.J. Geologic Applications of Nimbus Radiation Data in the Middle East; NASA Tech. Note, NASA, TND-8469; NASA: Washington, DC, USA, 1977.
  54. Noorallah, G.J. The Pedosphere and Its Dynamics: A Systems Approach to Soil Science, Vol 1: Introduction to Soil Science and Soil Resources; Salman Productions Inc.: Edmonton, AB, Canada, 2001. [Google Scholar]
  55. Wilheit, T. Radioactive transfer in a plan stratified dielectric. IEEE Trans. Geosci. Remote Sens. 1978, 16, 138–143. [Google Scholar]
  56. Zhang, H.X.; Yuan, N.M.; Ma, Z.G.; Huang, Y. Understanding the soil temperature variability at different depths: Effects of surface air temperature, snow cover, and the soil memory. Adv. Atmos. Sci. 2021, 38, 493–503. [Google Scholar] [CrossRef]
  57. Newton, R.W.; Black, Q.R.; Makanvand, S.; Blanchard, A.J.; Jean, B.R. Soil moisture information and thermal microwave emission. IEEE Trans. Geosci. Remote Sens. 1982, 3, 275–281. [Google Scholar] [CrossRef]
  58. Ulaby, F.T.; Batlivala, P.P. Optimum parameters for mapping soil moisture. IEEE Trans. Geosci. Remote Sens. 1976, 14, 81–93. [Google Scholar] [CrossRef]
  59. Schapel, A.; Davenport, D.; Marschner, P. Increases in organic carbon concentration and stock after clay addition to sands: Validation of sampling methodology and effects of modification method. Soil Res. 2017, 55, 124–133. [Google Scholar] [CrossRef]
  60. Yost, J.L.; Hartemink, A.E. Effects of carbon on moisture storage in soils of the Wisconsin Central Sands, USA. Eur. J. Soil Sci. 2019, 70, 565–577. [Google Scholar] [CrossRef]
  61. Wang, J.R.; O’Neill, P.E.; Jackson, T.J.; Engman, E.T. Multifrequency measurements of the effects of soil moisture, soil texture, and surface roughness. IEEE Trans. Geosci. Remote Sens. 1983, GE-21, 44–51. [Google Scholar] [CrossRef]
  62. Mo, T.; Schmugge, T.J. A Parameterization of the effect of surface roughness on microwave emission. IEEE Trans. Geosci. Remote Sens. 1987, GE-25, 481–486. [Google Scholar] [CrossRef]
  63. Dobson, M.C.; Ulaby, F.T.; Hallikainen, M.T.; El-rayes, M.A. Microwave dielectric behavior of wet soil-Part II: Dielectric mixing models. IEEE Trans. Geosci. Remote Sens. 1985, GE-23, 35–46. [Google Scholar] [CrossRef]
  64. Zhao, S.P.; Yu, Y.; Xia, D.S.; Yin, D.Y.; He, J.J.; Liu, N.; Li, F. Urban particle size distributions during two contrasting dust events originating from Taklimakan and Gobi Deserts. Environ. Pollut. 2015, 207, 107–122. [Google Scholar] [CrossRef]
  65. Guan, Q.Y.; Zhang, J.D.; Wang, L.J.; Pan, B.T.; Gui, H.J.; Zhang, C. Discussion of the relationship between dustfall grain size and the desert border, taking the southern border of the Tengger Desert and the southern dust deposit area as an example. Palaeogeogr. Palaeoclimatol. Palaeoecol. 2013, 386, 1–7. [Google Scholar] [CrossRef]
  66. Jia, W.R.; Zhang, C.L.; Li, S.Y.; Wang, H.F.; Ma, X.X.; Wang, N.B. Grain size distribution at four developmental stages of crescent dunes in the hinterland of the Taklimakan Desert, China. J. Arid Land. 2016, 8, 722–733. [Google Scholar] [CrossRef] [Green Version]
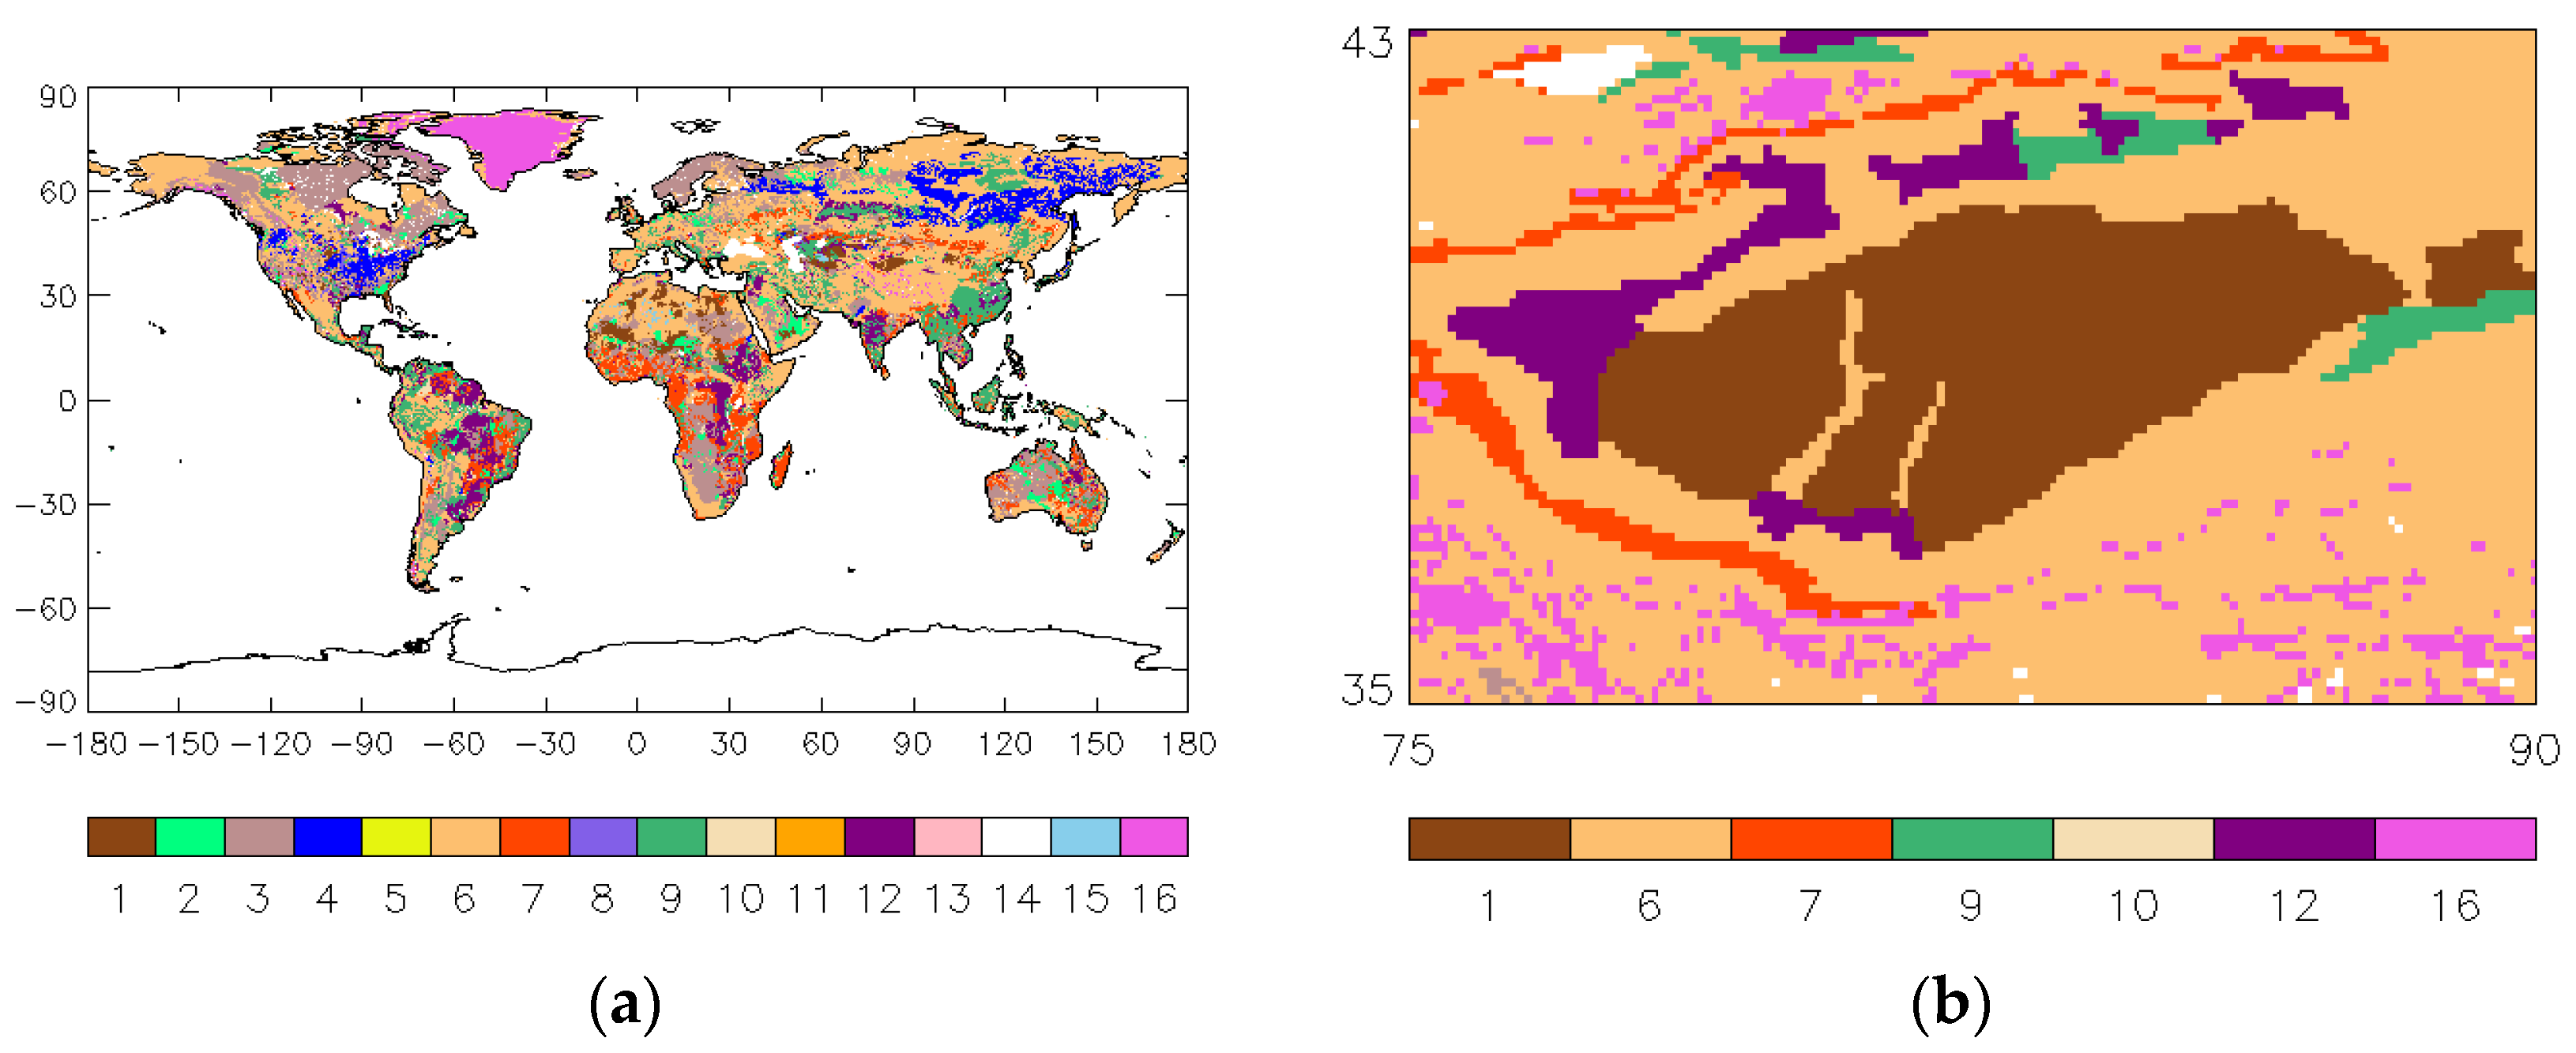
Figure 1. Soil texture (a) globally and (b) in the Taklimakan Desert study area (see Table 2 for the soil texture codes).
Remotesensing 14 03045 g001
Figure 2. MWRI retrievals of mean land surface emissivity vs. soil types in (a,b) winter, (c,d) spring, (e,f) summer, and (g,h) autumn: (a,c,e,g) Horizontal-polarization (H-pol); (b,d,f,h) Vertical-polarization (V-pol).
Remotesensing 14 03045 g002aRemotesensing 14 03045 g002b
Figure 3. MeanRetrieved emissivity retrievals and mean soil volumic water content for different soil types over the Taklimakan Desert: (a,b) sand; (c,d) loam; (e,f) sandy clay loam; (g,h) clay loam; (i,j) clay.
Remotesensing 14 03045 g003aRemotesensing 14 03045 g003b
Figure 4. MLEM modeled emissivity spectra from different minerals with different distributions of particle size, sand fraction, and soil moisture: (a) quartz; (b) sandstone; (c) granite; (d) limestone.
Remotesensing 14 03045 g004aRemotesensing 14 03045 g004bRemotesensing 14 03045 g004cRemotesensing 14 03045 g004d
Figure 5. Retrieved emissivity from MWRI at 36.5 GHz on 1–7 August 2017: (a) H-pol; (b) V-pol.
Remotesensing 14 03045 g005
Figure 6. Comparison of emissivity bias between the retrievals and simulations (37.5 GHz, V-pol): (a) emissivity bias between the emissivity retrievals and original simulations; (b) emissivity bias between the emissivity retrievals and new simulations.
Remotesensing 14 03045 g006
Table 1. MWRI channel characteristics.
Center Frequency/GHzPolarizationBand Width/MHzInstantaneous FOV/kmNEΔT/KCalibration Error (K)
10.65H/V18051 × 850.51.5
18.7H/V20030 × 500.51.5
23.8H/V40027 × 450.51.5
36.5H/V90018 × 300.51.5
89.0H/V30009 × 150.82.0
Table 2. Soil texture codes.
CodeSoil Type
GlobeTaklimakan Desert
1SandSand
2Loamy sand/
3Sandy loam/
4Silt loam/
5Silt/
6LoamLoam
7Sandy clay loamSandy clay loam
8Silty clay loam/
9Clay loamClay loam
10Sandy claySandy clay
11Silty clay/
12ClayClay
13Organic materials/
14Water/
15Bedrock/
16OtherOther
Publisher’s Note: MDPI stays neutral with regard to jurisdictional claims in published maps and institutional affiliations.