Article

Modelling of Greek Lakes Water Quality Using Earth Observation in the Framework of the Water Framework Directive (WFD)

by
Vassiliki Markogianni
1,*,
Dionissios Kalivas
2,
George P. Petropoulos
3 and
Elias Dimitriou
1
1
Institute of Marine Biological Resources and Inland Waters, Hellenic Centre for Marine Research, 46.7 km of Athens-Sounio Avenue, 19013 Attica, Greece
2
Department of Natural Resources Management and Agricultural Engineering, Agricultural University of Athens, 75 Iera Odos, 11855 Athens, Greece
3
Department of Geography, Harokopio University of Athens, El. Venizelou 70, Kallithea, 17671 Athens, Greece
*
Author to whom correspondence should be addressed.
Remote Sens. 2022, 14(3), 739; https://doi.org/10.3390/rs14030739
Submission received: 9 December 2021 / Revised: 1 February 2022 / Accepted: 1 February 2022 / Published: 4 February 2022

Abstract

:
Given the great importance of lakes in Earth’s environment and human life, continuous water quality (WQ) monitoring within the frame of the Water Framework Directive (WFD) is the most crucial aspect for lake management. In this study, Earth Observation (EO) data from Landsat 7 Enhanced Thematic Mapper Plus (ETM+) and Landsat 8 Operational Land Imager (OLI) sensors have been combined with co-orbital in situ measurements from 50 lakes located in Greece with the main objective of delivering robust WQ assessment models. Correlation analysis among in situ co-orbital WQ data (Chlorophylla, Secchi depths, Total phosphorus-TP-) contributed to distinguishing their inter-relationships and improving the WQ models’ accuracy. Subsequently, stepwise multiple regression analysis (MLR) of the available TP and Secchi depth datasets was implemented to explore the potential to establish optimal quantitative models regardless of lake characteristics. Then, further MLR analysis concerning whether the lakes are natural or artificial was conducted with the basic aim of generating different remote sensing derived models for different types of lakes, while their combination was further utilized to assess their trophic status. Correlation matrix results showed a high and positive relationship between TP and Chlorophyll-a (0.85), whereas high negative relationships were found between Secchi depth with TP (−0.84) and Chlorophyll-a (−0.83). MLRs among Landsat data and Secchi depths resulted in 3 optimal models concerning the assessment of Secchi depth of all lakes (Secchigeneral; R = 0.78; RMSE = 0.24 m), natural (Secchinatural; R = 0.95; RMSE = 0.14 m) and artificial (Secchiartificial; R = 0.62; RMSE = 0.1 m), with reliable accuracy. Study findings showed that TP-related MLR analyses failed to deliver a statistically acceptable model for the reservoirs; nevertheless, they delivered a robust TPgeneral (R = 0.71; RMSE = 1.41 mg/L) and TPnatural model (R = 0.93; RMSE = 1.43 mg/L). Subsequently, trophic status classification was conducted herein, calculating Carlson’s Trophic State Index (TSI) initially throughout all lakes and then oriented toward natural-only and artificial-only lakes. Those three types of TSI (general, natural, artificial) were calculated based on previously published satellite-derived Chlorophyll-a (Chl-a) assessment models and the hereby specially designed WQ models (Secchi depth, TP). The higher deviation of satellite-derived TSI values in relation to in situ ones was detected in reservoirs and shallower lakes (mean depth < 5 m), indicating noticeable divergences among natural and artificial lakes. All in all, the study findings provide important support toward the perpetual WQ monitoring and trophic status prediction of Greek lakes and, by extension, their sustainable management, particularly in cases when ground truth data is limited.

1. Introduction

Surface freshwater is one of the most essential resources for the terrestrial ecosystem and the predominant source of drinking water on Earth [1]. Over the past few decades, climate change and human activities have deteriorated water quality (WQ) [2]. Some factors responsible for it include rapid development, as well as changes in land use/land cover (LULC) patterns, industrialization, and urbanization [3]. The close proximity of water reservoirs to settlements may reduce the price of water to consumers. However, it may also prevent the sustainable management of water resources against deteriorating activities and inappropriate disposal of urban sewage generated within drainage basins [4].
Deterioration of lake systems’ WQ has resulted in many lake eutrophication problems; therefore, environmental scientists have tried to monitor, manage, and limit it for more than two decades [5]. WQ monitoring is the most crucial aspect for lake management [6] and particularly includes the monitoring of certain WQ properties through in situ sampling and field work. The aforementioned WQ properties include Chl-a concentration, total suspended matter (TSM), Secchi depth (SD), and nutrient concentrations [7].
However, conventional WQ measurements and in situ sampling are laborious, costly and time consuming [3]. Moreover, those techniques are characterized by limited ability to provide a synoptic spatiotemporal view of WQ [8,9] since the condition of an entire water body cannot be fully represented. Furthermore, patchy distribution of nutrients, algal blooms, and TSM define those methods as unsuitable for monitoring a large number of water bodies at a regional or national scale [10,11].
Recent developments in geoinformation technologies and in particular of Remote Sensing (RS) and Geographical Information Systems (GIS), concerning pollution loads and WQ, offer a number of advantages that practically address the limitations of traditional water sampling [12,13,14]. Among the key advantages of RS is the ability to cover large areas [15] and to collect spectral information at variable spatial scales and at dramatically lower cost compared to field measurements [16].
According to [17], there are three well-documented methodologies to estimate the concentration of WQ elements in inland waters: empirical, semi-empirical, and physical or analytical methodology. Empirical methods attempt to establish relationships between in situ water quality measurements and water leaving radiance measured by the sensor without the precondition of prior understanding of the complex water and light interactions. Those relationships imply effective data improvement but limited transferability [18]). Moreover, empirical methods incorporate machine learning techniques, which are differentiated by their robust ability to handle complicated non-linear relationships, typical of WQ remote sensing data [19,20]. Machine learning algorithms include artificial neural networks (ANN), genetic algorithms (GA), support vector machines (SVM), random forest regression trees, and empirical orthogonal functions [20]. On the other hand, through semi-empirical techniques, spectral and physical knowledge are combined and then correlated to the in situ concentrations. Regarding physical or analytical approaches, the acquisition of certain biogeochemical parameter values (e.g., Chl-a, CDOM) is required, as well as inherent and apparent optical properties, and are based on radiative transfer within the water column. Then, the in situ concentrations are assessed by modeling the reflectance of surface water. Although analytical methods, including fuzzy logic and Principal Component Analysis (PCA), have already been extensively used, empirical and semi-empirical predicting models are still widely utilized [21]. Analytical methods’ complexity in terms of their theory and calculation difficulties [21] and the non-availability of required detailed spectral information of the optically active water constituents (optical properties, radiometric quantities) have contributed to the maintenance and development of empirical models. This trend is further observed especially in cases where machine learning models are utilized, as most of them reduce overall error and maximize model fit [20]. However, it should be noted that empirical algorithms are more specific to certain water types, regional or optical [22].
The classification of waters in Case 1 (oceanic) and Case 2 (coastal regions, rivers, and lakes, refined by [23], is characterized by great importance when remote sensing techniques are utilized to monitor their WQ. The distinction between the two cases has some significant effects on the interpretation and modeling of optical data. In particular, according to this classification scheme, the optical properties of Case 1 waters are determined by phytoplankton and co-varying substances, while Chl-a is considered a proxy of phytoplankton concentration. This assumption has facilitated the implementation of large-scale optical models and the development of Chl-a predicting algorithms for Case 1 waters. On the other hand, single variable models should be abandoned when Case 2 waters should be studied. It is, on the whole, acknowledged that Case 2 waters are more complex than Case 1 concerning their composition and optical properties. Monitoring the WQ of Case 2 waters is a more sophisticated task since phytoplankton, suspended material, yellow substances, and perhaps bottom reflectance vary independently of each other. The main difficulty lies in the fact that the alterations in optical signal and the concentrations of the dissolved constituents are often so small that they hinder the ability to extract reliable information or the optical signal may be affected in a similar way by more than one substance, which results in an inability to discriminate the different materials [21]. Moreover, of principal value is the choice of the appropriate wavelengths, as well as their number in a Case 2 adopted algorithm. Hence, given the difficulty that WQ monitoring of Case 2 waters constitutes a multi-variable, non-linear problem, it is more realistic to establish a series of algorithms rather than a single all-purpose one. In this way, more than one algorithm will attempt to capture and solve the problem for all variables and over several and different ranges of concentrations [24].
In parallel, the Case 1/Case 2 classification can substantially improve remote sensing products when associated with individual optical water types (OWTs). In particular, coastal regions and inland waters are characterized by such optical diversity that any further information about their variability in IOPs and biogeochemical significance would be particularly valuable. Some OWTs can be hypereutrophic waters, turbid waters with high organic content, sediment-laden waters, CDOM-rich waters, or even very clear blue waters. Several hierarchical, partitional, and hybrid clustering techniques have been utilized to further discriminate distinct OWTs within and between Case 1 and Case 2 waters [25]. After all, a reliable OWT classification optimizes the selection of the finest constituent algorithms when simpler approaches cannot yield reliable results.
Inland waters, and especially lakes, are small water bodies that are not detected by current ocean color satellites, and even though this lack prevents the monitoring and estimation of their WQ components, it has been replenished by the use of Landsat sensors. A recent review of state-of-the-art RS-based approaches by [21] underpins the use of Landsat sensors, TM (Thematic Mapper), MSS (Multi-Spectral Scanner), ETM (Enhanced Thematic Mapper), and OLI (Operational Land Imager) as fairly successful choices to assess the important WQ parameters, including Chl-a, SDD, TP, and trophic status [4,26,27,28,29,30,31].
RS has been widely demonstrated as an effective solution for detecting the relationship between algae concentration and corresponding nutrients [32]. Nitrogen (N) and phosphorus (P) are vital micronutrients for algae, while P (existing either in a particulate or dissolved phase) is the key limiting nutrient responsible for eutrophication in most lakes [33]. In general, special attention should be paid depending on which nutrient is growth limiting, as in one water body the correlation with Chl-a might be with N, while in a different water body the correlation might be with P [19]. Total phosphorus (TP) estimation via RS has been explored due to its high correlation with optically active constituents [34,35,36] since it cannot be measured directly using optical RS instruments. The chlorophyll-a (Chl-a) and TP relationship has been investigated in individual lakes [37,38], and it is well documented to be accompanied by a strong and positive correlation among lakes [39,40]. The authors of [9] performed routine WQ monitoring on the slightly-polluted Guanting Reservoir in China using Landsat-5 TM and retrieved WQ data with eight variables, namely algae, turbidity, concentrations of chemical oxygen demand (COD), total nitrogen (TN), ammonia nitrogen (NH3–N), nitrate nitrogen (NO3–N), total phosphorus (TP), and dissolved phosphorus (DP). Their results indicated a statistically significant correlation (10–30% mean relative error) among all estimated parameters and reflectance regression algorithms. Landsat-5 TM data was also used by [41], who predicted TP among other water quality components of different sources across Alberta and managed to classify lakes into four trophic states indicating low to very high productivity. In another study, [42] established both a regression model and an empirical neural network to simulate the relationship between TP and Landsat TM radiances for Chagan Lake, China. As TP is highly correlated to Chl-a concentration, and TSM usually reflects TP loading, TP is also closely related to Secchi depth (SD) with an exponential equation according to Carlson’s findings [43]. Based on the same rationale, [44] estimated TP empirically through associated Chl-a, TSM, and Secchi depth across three reservoirs in Indiana, US, with R2 values between in situ and spectral data ranging from 0.55 to 0.72.
Water clarity, commonly reflected by SD, is reduced by the increased presence of suspended sediment, organic matter, and zooplankton [43]. The stimulating production of algae in a lake usually originates from increased nutrients, in particular, phosphorus [40]. As the algae and suspended inorganic matter increase in a lake, the depth to which light can penetrate [45] is reduced. Therefore, SD is often used as a trophic state indicator [43]. In general, there are two methodologies followed to retrieve SDT based on remote sensing data. Empirical approach estimating SD through regression analysis and semi-analytical approach retrieving SD based on an underwater visibility theory [46]. Regarding empirical models, reflectance at the red spectrum has been almost globally used to retrieve water clarity [47,48,49,50,51] since increased brightness is accompanied by decreased water clarity [52]. Moreover, further studies have also documented the usefulness of spectral response of the blue, green, and near-infrared spectral bands in combination with in situ measurements of SD and Chl-a concentrations in predicting water clarity for inland lakes [45,53]. It should also be noted that semi-analytical methods are superior to empirical ones mainly concerning the reliability of results and the fact that no in situ data are required afterwards for recalibrating the retrieval algorithm. On the other hand, those approaches require the utilization of a spectroradiometer and the collection of in situ-measured Rrs spectra including the radiance of skylight, radiance from a standard gray board, and the total upwelling radiance from the water [46].
Since water clarity has long been proven to interact with nutrient availability and Chl-a concentrations within lakes [43,54], remote sensing studies frequently use it to assess overall lake trophic status (oligotrophic, mesotrophic, or eutrophic) [55,56]. WQ monitoring programs (such as WFD) have been implemented worldwide to acquire large datasets of several WQ parameters, while several methods (such as cluster and discriminant analysis) have been efficiently utilized to manage those complex data and interpret the underlying patterns of trophic status. However, these methods need continuous in situ measurements, while the classical and most widely used method to characterize a lake’s trophic status is Carlson’s Trophic State Index (TSI) [43]. This approach includes equations employing Secchi depth, Chl-a, and P measurements [57].
The hereby adopted methodological scheme includes the implementation of stepwise multiple regression (MLR) analyses among in situ measurements and satellite data. In situ data concern Secchi depths and TP concentrations along 50 lakes, included in the National Lake Monitoring of Greece (WFD), and since the majority of those data were recorded during 2013–2015, images of sensors Landsat 7 ETM+ and Landsat 8 were the exclusive choice for the implementation of this research. According to a previous study conducted by the authors [31], a principal component analysis (PCA) indicated that the variance of Chl-a concentrations of the same lakes was affected by whether the lakes were natural or artificial, while the rest of the tested parameters were the climatic type, typology, and the sampling season. Hence, based on those PCA’s results, hereby MLR analyses concerned: (a) all in situ measurements of TP and Secchi depth during 2015–2016 and 2013–2016, respectively, and (b) in situ TP and Secchi depth datasets of the same years, including natural-only and artificial-only lakes. Correlation analyses were additionally conducted to explore and detect the existing interrelationships among TP, Chl-a concentrations, and SD of monitored lakes and improve the effectiveness of the WQ assessment models by indicating further significant predictors. Subsequently, Chl-a regression models developed by [31], and hereby established TP and Secchi depth’s models were utilized to calculate the water trophic index of the studied lakes.
In purview of the above and taking advantage of the large in situ dataset derived from the application of National Lake Monitoring in Greece (WFD), the present study aims to: (1) explore the complicated relationships among TP, Chl-a concentrations, and Secchi depth measurements throughout 50 lakes, substantially representing Case 2 waters, (2) generate accurate quantitative TP and Secchi depth models by incorporating satellite images with concurrent in situ measurements, and (3) derive the Carlson Trophic Index for assessing water trophic state spatially over all monitored waterbodies.

2. Study Area

The study area includes 50 natural and artificial lakes (Figure 1; Table 1). These waterbodies comprise the National Monitoring Network of Waters in Greece, which is implemented by the Goulandris Natural History Museum, Greek Biotope/Wetland Centre (EKBY). More information about the general characteristics of the monitored lakes can be found in the study conducted by [31], or more detailed data can be retrieved from the EKBY’s site (Goulandris Natural History Museum, Greek Biotope/Wetland Centre; http://biodiversity-info.gr/index.php/el/lakes-data#!IMGP4731; accessed date 5 February 2020).

3. Materials and Methods

3.1. Data Acquisition

3.1.1. In Situ Data

Data used in this study were collected in the framework of the Greek Water Monitoring Network for lakes (WFD). All data is freely accessible and was downloaded from the EKBY’s site (Goulandris Natural History Museum, Greek Biotope/Wetland Centre (http://biodiversity-info.gr/index.php/el/lakes-data#!IMGP4731; in Greek; accessed date 5 February 2020). The network incorporates 50 lakes, natural and reservoirs. At the majority of the lakes, only one sampling station is detected, except for trans-boundary lakes (Megali Prespa, Mikri Prespa, and Doirani), where two sampling stations are located (Table 1; Figure 1). From the total of 53 sampling sites, there are 27 surveillance sites and 26 operational sites. Surveillance stations operate in water bodies of good status, for a certain period of time (one year), while operational stations are monitored on a monthly or seasonal basis in water bodies that fail to achieve good status [31]. The selected data used herein include the Secchi depth measurements on several dates from 2013 to 2018 and TP concentrations from 2015 to 2018 throughout the monitored lake stations. Secchi depth measurements were conducted with a Secchi disk, measuring the transparency of water, while in situ Chl-a data was already available in the framework of our last study [31].
Particularly, Chl-a concentrations were measured from 2013 to 2018 and determined spectrophotometrically (Method 10200 H [59]). TP concentrations include all inorganic, organic, and dissolved forms of phosphorus, and the available dataset incorporates measurements analyzed during the years 2015, 2016, and 2018. During 2013 and 2014 (i.e., since the beginning of the WFD), analysis of orthophosphates resulted in low concentrations, lower than the quantitation limit (LOQ) of the respective adopted method; hence, no measurement was available during this period. Therefore, the following years (i.e., 2015, 2016, 2018) analyses of orthophosphates were replaced by total phosphorus, which resulted in the acquisition of actual measurements during this period.
Further investigation of in situ data included a seasonal statistical analysis by incorporating dates of the same season of all lakes during the monitored years. The seasons were determined as: summer (June, July, and August), autumn (September, October, and November), winter (December, January, and February), and spring (March, April, and May). More information about the sampling periods, sampling, and analysis methodologies can also be found on the EKVY’ site.
Exploratory statistics among the Secchi depth measurements of 2013, 2014, 2015, 2016, and 2018 and TP concentrations of 2015, 2016, and 2018 were calculated incorporating the estimation of mean, median, standard deviation, and min-max. Skewness, Kurtosis, and Kolmogorov–Smirnov and Shapiro–Wilk tests were conducted to explore the data normality. Furthermore, SPSS Statistical Package (v. 24.0) was used to group and categorize the under-studied WQ parameters based on the sampling season, year, and whether the lakes are natural or artificial. Moreover, a correlation matrix among simultaneous in situ measurements of TP, Chl-a, and Secchi depths was conducted to explore their existent interrelationships and further contribute to indicating the most significant predictors.

Exploratory Statistical Analyses

Secchi depths throughout the monitored Greek lakes were measured during the years 2013, 2014, 2015, 2016, and 2018 (Table 2). Minimum values ranged from 0.03 (2014, 2015) to 0.2 m (2013), while maximum values ranged from 11 (2015) to 15.5 m (2018). Mean values of Secchi depth are similar during all years and equal to around 3.2 m. Secchi depths are higher in artificial than in natural lakes, while the highest values are observed during summer months for both natural and artificial lakes (Figure 2). The temporal distribution of Secchi depths was categorized on the criterion of whether the lakes were artificial or natural; values were also higher in artificial lakes during all sampling years, with some exceptions (e.g., Trichonida Lake; Figure 2).
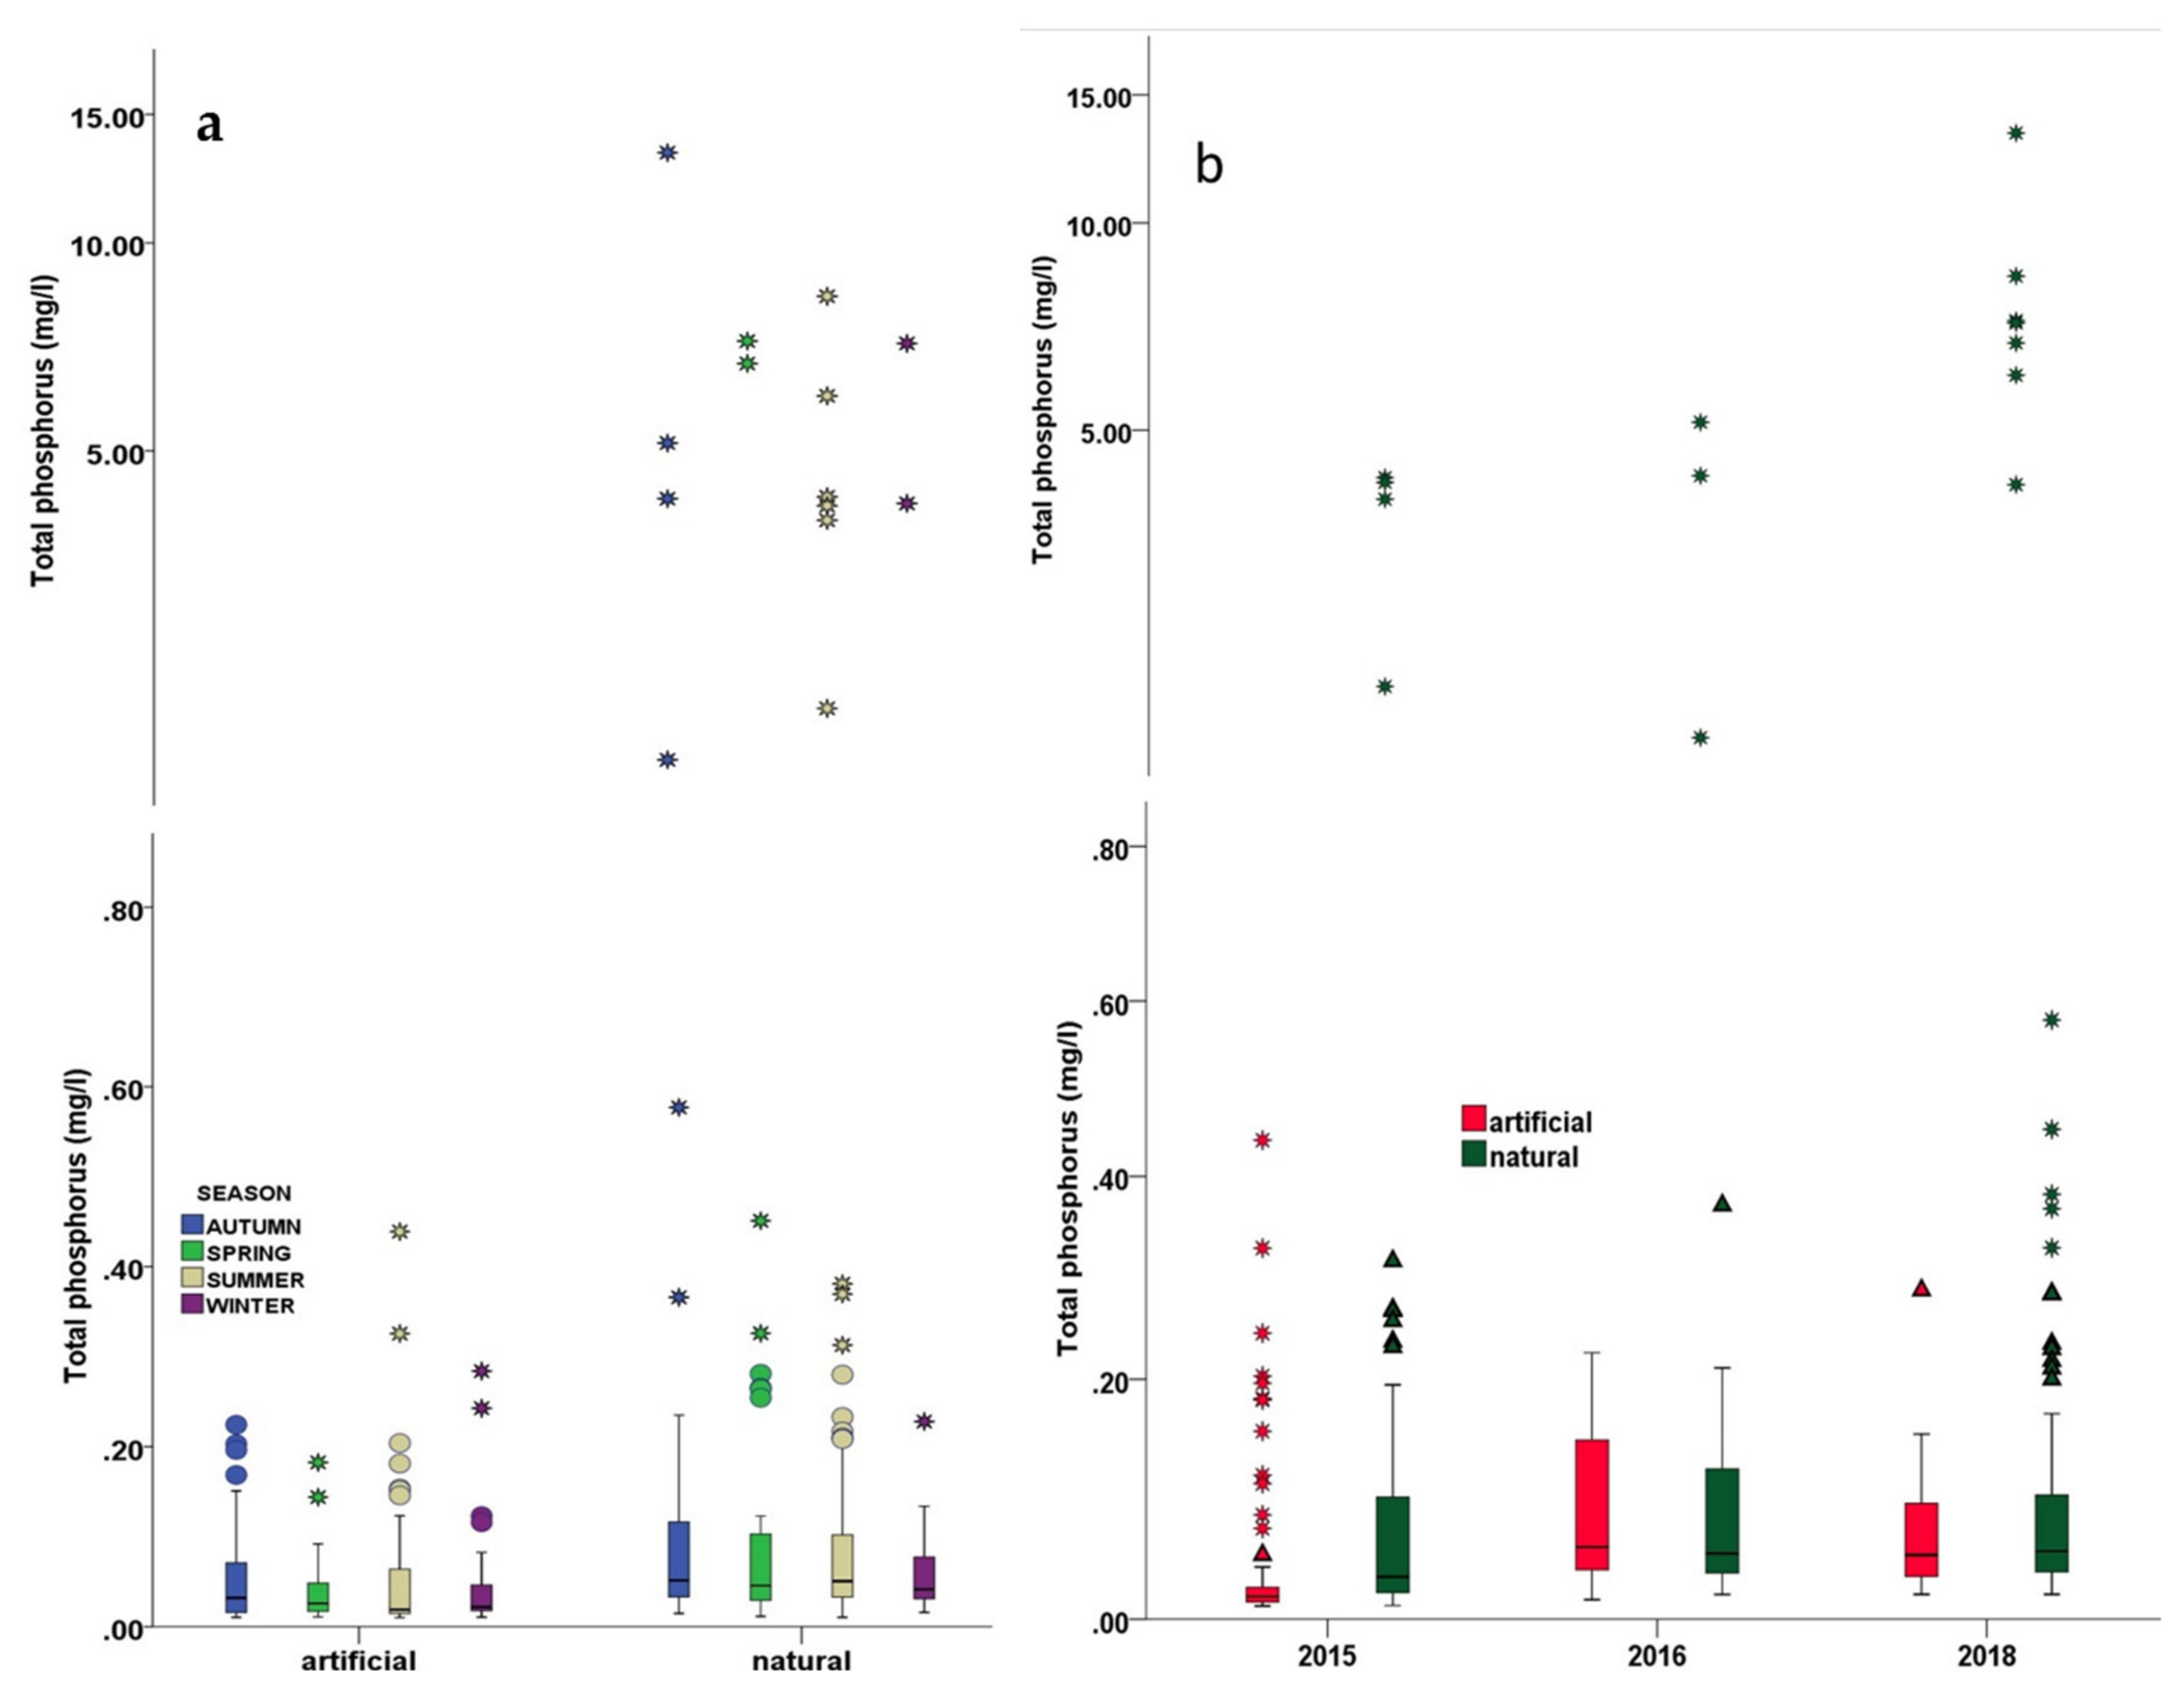
Total measurements of TP concentrations are 370, including the years 2015, 2016, and 2018 (Table 3). Minimum TP values are similar during all years (around 0.01 mg/L), while maximum values increase during these years. The same tendency is reflected based on average values, with the mean TP value of 2018 being double compared to the respective value of 2016. Higher TP concentrations are detected in natural lakes, particularly during autumn sampling months, while water sampling analysis in summer revealed the greatest TP concentrations in artificial lakes (Figure 3). As far as the yearly distribution of TP concentrations in Greek lakes is concerned, it is confirmed that natural lakes are more affected by TP pollution sources than the artificial ones with an increasing tendency throughout the years (Figure 3).

3.1.2. EO Data Acquisition and Pre-Processing

Landsat 8 OLI and Landsat 7 ETM+ images used herein covered the 50 monitored lakes throughout Greece. These data had been previously acquired in the framework of our previous study [31]. In particular, a 2013–2016 and 2018 time series of 296 Landsat images—with a mean time window between the satellite overpass and the in situ measurements equal to 4 days—were downloaded from the USGS (United States Geological Survey) Data Centre (https://earthexplorer.usgs.gov/ (accepted date 5 February 2020)) for Chl-a estimations. More specifically, total in situ Chl-a data include 702 measurements, and the time window between sampling and satellite dates ranges from −21 to 17 days. Moreover, since not all monitored WQ parameters were sampled on simultaneous dates, Secchi depth data were aligned with a total of 304 images (2013–2018) and the TP concentrations with 122 images (2015–2018), including some newly downloaded extra images. Secchi depth measurements are equal to 578, and the time window difference ranges between −16 to 19 days with a mean time gap of approximately 4 days. As far as the TP measurements are concerned, 268 total values were recorded during the years 2015, 2016, and 2018, accompanied by satellite images with overpass dates ranging from 21 to 14 days before and after the field work, respectively and the mean time gap is equal to 4 days. Moreover, it should be noted that the majority of the satellite images have been used for the monitoring of more than one of the studied WQ parameters, and the statistical analysis eventually included those that met certain criteria (e.g., images that portrayed lakes with mean depth greater than 5 m; images of dates coincident with sampling dates of all the three parameters- Chl-a; TP; Secchi depth for the TSI calculation, etc.). Concerning the great time window between sampling and satellite dates in some cases, it should be noted that only a few images are temporally far from the field work’s date. It has been proven that a time-window up to ±7 days yields reasonable results and is not considered a problem when lake water quality, especially in non-tidal systems, is monitored [60,61,62]. Therefore, concerning the Chl-a training dataset (general model), only 15.4% of records surpassed the ±7 days’ time gap. The respective percentages for Secchi depth and TP training datasets are 13.2% and 15%, while 50% and 71% of those records, respectively, constitute artificial lakes that have been separately elaborated in a restricted time gap of ±5 days. The percentages are similarly low concerning the development of WQ models for natural lakes. The Chl-a natural model was developed by employing 12 out of 85 records (14.1%) with a date difference greater than ±7 days from the satellite overpass, while the Secchi natural model included 5 out of 65 (7.7%) records characterized by the same time window. As far as the TP natural model is concerned, only 2 out of 29 measurements have been aligned with Images acquired at dates greater than ±7 days from the sampling date. Given the low percentage rates of those records utilized in the development of WQ models, it is assumed that their effect is insignificant on the models’ performance and prediction accuracy.
The pre-processing steps that were adopted herein are identical to the ones described in our earlier study [31]. More particularly, semi-automatic classification plugin (SCP) of the free and open-source cross-platform desktop geographic information system Q-GIS v. 3.6.3-Noosa was employed to perform: (a) conversion of images from digital numbers (DN) to top-of-atmosphere reflectance (TOA), (b) atmospheric correction by using the DOS1 method (applied to all bands except for thermal ones), and (c) the creation of a band stack set for each image. The band stack set of L7 ETM+ includes bands B1 (blue), B2 (green), B3 (red), B4 (NIR), B5 (SWIR1), and B7 (SWIR2), while L8 incorporates bands B2 (blue), B3 (green), B4 (red), B5 (NIR), B6 (SWIR1), and B7 (SWIR2).
Since 2003, sensor ETM+ has acquired and delivered data with gaps caused by Scan Line Corrector (SLC) failure. In order to retrieve the data that concurred with those line gaps, several calculations were conducted by employing focal statistics through ArcMap. Those line gaps are approximately 205 m in length on the vertical axis, and in combination with the spatial resolution of the Landsat sensor (30 m), the mean value within a circle of 7 cells was determined among several trials as the most optimal neighborhood to include the coincident sampling station everywhere within this line. Through the focal statistics tool, an output raster (focal raster) for each input one (satellite band) was calculated, and then the Con and IsNull functions were applied (Equation (1)) in order only the no-values cells to be replaced while the rest preserved their values.
C o n   ( I s N u l l S a t e l l i t e   b a n d   w i t h   g a p s ,   f o c a l R a s t e r ,   S a t e l l i t e   b a n d   w i t h   g a p s )
The implementation of the DOS1 atmospheric correction method was not validated in order to ensure that atmosphere biases were completely removed. However, this method is widely used by the EO community [63,64] and proved useful when no atmospheric measurements are available and correcting historical imagery. In the framework of the effort of [65] to develop WQ empirical algorithms across certain Spanish lakes and ponds, they evaluated three different atmospheric correction methods (DOS; ATCOR3; MODTRAN5). Those methods were applied to Landsat 7 ETM+ bands, and the results indicated that the DOS method performed better than the others, reporting the lowest errors.
Moreover, to further ensure the use of only cloud-free pixels over the sampled lakes, the Cloud Masking QGIS plugin (https://smbyc.github.io/CloudMasking; accessed date 10 March 2020) was used. By using this tool, clouds, cloud shadow, cirrus, aerosols, and ice/snow were masked for all Landsat images using the combination of the Fmask and Blue Band processes.

3.2. Statistical Approach

3.2.1. Establishment of Relationships between Landsat Data, Secchi Depths, and TP

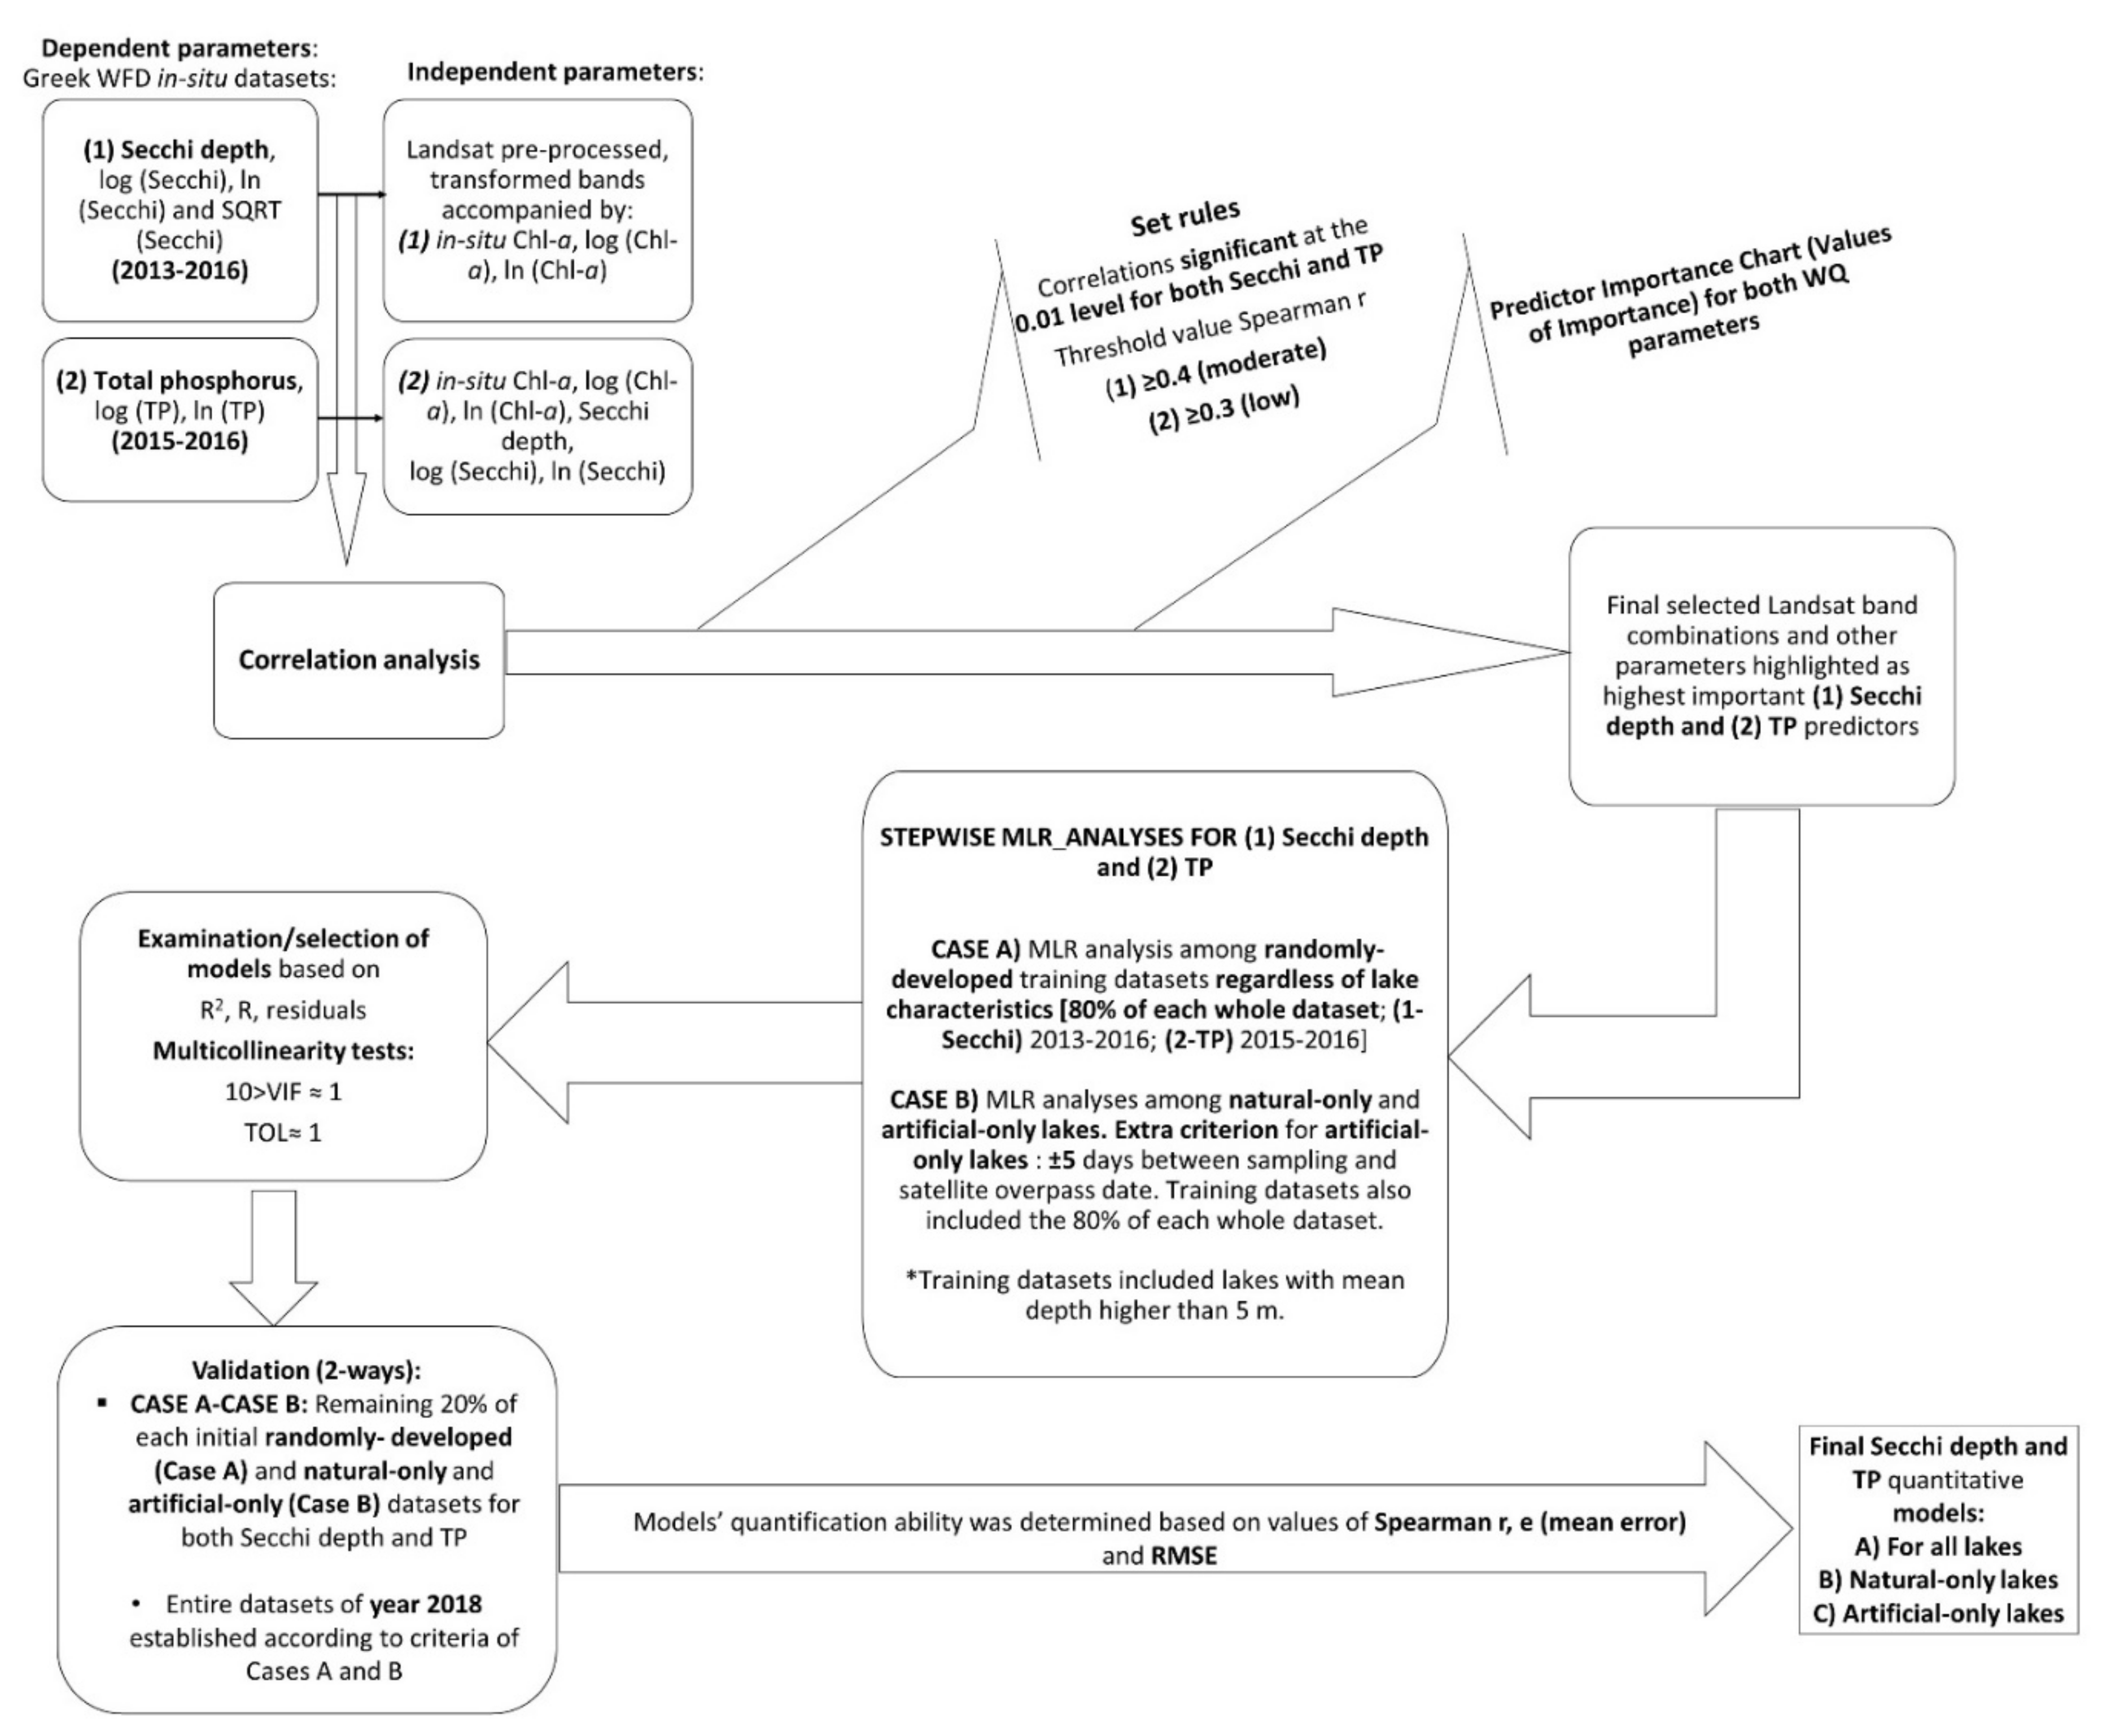
The hereby available in situ data include Secchi depth and TP lake measurements, recorded in the framework of the WFD application in Greece during the years 2013–2016 and 2018. Especially in situ data of 2018 was used as an independent validation dataset for both of the WQ elements. Visible (blue, green, and red), NIR, and SWIR spectral bands, combined with their ratios, additions, subtractions, and ln- and log-transformations were employed in multiple combinations, including transformations from the respective scientific literature (Table 4) with the basic aim of exploring and developing statistically significant relationships between them and in situ Secchi depths and TP measurements of coincident dates. Figure 4 illustrates the discrete methodological steps followed herein regarding the two in situ datasets indicated by numbers (1) and (2) for Secchi depths and TP values, respectively.
As far as the Secchi depth dataset (1) is concerned, a correlation analysis between several band transformations and Secchi depths’ measurements, as well as log, ln, and SQRT Secchi depths, was conducted, including previously published band combinations (Table 4). In those independent variables, in situ Chl-a was also included, as this parameter has been previously proved to affect lake water clarity [44]. Correlation analysis results and the selection of certain significant predictors of Secchi depth were determined based on specific rules. Setting initially a threshold value of the significant correlations at the 0.01 level and a Spearman value equal to or higher than ±0.4 (which indicates a moderate relationship, according to [66]) resulted in the distinction of the initial wide group of Secchi depth’s predictors. Furthermore, those predictors were also enriched and confirmed based on the results of the predictor importance chart (IBM SPSS software Statistics v. 23.0, Armonk, NY, USA). This chart indicates the relative importance of each predictor in estimating a model, while the predictor importance relates to the importance of each predictor in making a prediction, not whether or not the prediction is accurate. Additional criteria including multi-collinearity and values of tolerance factor, variance inflation factor (VIF), and R2 were also applied to explore statistical performance and residuals and resulted in a subset of the initial predictors. According to [31], a factor analysis was implemented to obtain an indication of underlying common factors (components) that explain the interrelationships among Chl-a concentrations, lake nature (natural/artificial), sampling season, and climatic type. The rotated component matrix results indicated that the lake characteristics (natural/artificial), followed by the sampling season, were the variables that mostly affect the variance of Chl-a concentrations in the same—as in this work—studied lakes during the same period (2013–2018). In the effort of the authors [31] to further enhance the efficiency of Chl-a regression models, a confined time window of ±5 days between field measurements and satellite overpass was used, in cases with statistically significant results. Those results were indeed further improved when artificial lakes were the case, regardless of the sampling season. Hence, since a) the herein research concerns the same lakes being monitored during the same period and b) the ultimate goal is the assessment of their trophic status, it was decided to conduct MLR analyses based on the same rationale as in [31]. Consequently, the two basic scenarios employed concern: Case A) MLR analysis among attributes originating from a randomly developed training dataset. Total Secchi depth measurements were divided into training and validation datasets, including 80% (228 out of 286 Secchi depth measurements) and 20% of the entire dataset, respectively. This analysis constitutes an effort to develop a Secchi depth quantitative model for lakes when no information is available (e.g., regardless of the sampling season, natural/artificial etc.), and Case B) MLR analysis focused separately on attributes concerning natural-only or artificial-only lakes, with the latter being accompanied by a time window of ±5 days between sampling and satellite date, as proposed by [31]. Furthermore, the addition of Chl-a values in the possible Secchi depth’s predictors further shortened the initial total in situ dataset, as only the records of dates characterized by simultaneous sampling of Secchi depths and Chl-a were included in the analysis.
The same methodology was also adopted in the TP concentrations (2 in Figure 4). The in situ dataset of TP is narrower than the one concerning Secchi depths, as it includes only values sampled during the years 2015 and 2016 (the dataset of 2018 was utilized as an independent validation dataset). Correlation analysis was also conducted among satellite band transformations (Table 4) and in situ TP values, while in situ Chl-a concentrations, Secchi depths, and their logarithmic transformations were also included since they have been proven to interact and affect TP concentrations in lakes [34,35,36]. Due to fewer TP available measurements, the threshold value of Spearman r was set to 0.3 to avoid the loss of possible significant TP predictors, and the proposed TP predictors were also confirmed by the significance predictor chart. Hence, according to Figure 4, multiple datasets with simultaneous measurements of all three parameters or combinations of them were established and constituted the randomly made datasets (Case A). Those multiple datasets were further divided into training (80% of each total record) and validation ones (the rest 20%). Then, concerning MLR analyses of B case (Figure 4), the aforementioned datasets were further divided into cases including natural-only and artificial-only lakes (with a data acquisition time window of ±5 days), while they were additionally separated into training (80%) and validation (20%) datasets, respectively.
Training datasets regarding the in situ Secchi depths and TP include measurements of 2013–2016 and 2015–2016, respectively. It should also be noted that training and validation datasets contained lakes with mean depths higher than 5 m to surely avoid the bottom reflectance noise [67]. In particular, [67] recommended that any pixel with a water column depth of 5 m or less should be characterized as optically shallow and omitted from the analysis in order to avoid any unwanted optically shallow effects apparent in satellite-derived products; WQ models and their efficiency in our case. The final results of the MLRs should be the development of rigorous quantitative algorithms regarding: (a) Secchi depth and TP for all the lakes, (b) Secchi depth and TP for natural lakes, and (c) Secchi depth and TP for artificial lakes.
Table 4. Published band combinations utilized in remotely estimating TP and Secchi depth values.
ReferenceParametersBand Combinations and Sensors
[68]TPBlue, Green, Red, NIR, NIR/Green (L8)
[42,44]TPBlue, Green, Red, and NIR (L5)
[36]Ln (TP)Blue, Red/Green, Blue/Red (L5)
[4]TPBlue,
Green, Red, NIR, SWIR1, and SWIR2 (L5)
[48](1) TP(2) Secchi depth(1) Red,
Green, Red/Blue, (Green + Red)/2, Green2, (Blue + Green)/2 (L5)
(2) Red/Blue, Red2, Blue, (Blue+Green)/2, (Blue + Red)/2 (L5)
[69](1) SQRT (TP)
(2) Secchi depth
(1) Red, SWIR2 (L7 ETM+)
(2) LOGRed, LOGSWIR2 (L7 ETM+)
[70]PhosphorusBlue, Green, Red, NIR (L5)
[71]LOG (P)NIR/Visible light (GOCI)
[72](1) Phosphates
(2) TP
(1) Red, MIR
(2) Red IRS P6 (LISS III)
[5]TPLOG (Green/Red to NIR), (CASI)
[27](1) Secchi depth (m)
(2) LN Secchi depth
(1) Blue/Red, (Blue-Red)/Green, LN [(Blue-Red)/Green] (L7 ETM+)
(2) NIR, (Blue-Red)/Green, LN Red
[73]LN Secchi depthBlue, Blue/Red (L5)
[74]Secchi depthBlue, Green, Red (IRS-1A)
[75]Secchi Depth Green, Red, Blue, Vegetation red edge (B5), Water Vapour (Sentinel 2)
[76]Secchi depthGreen, Blue (MODIS-Aqua)
[77]Secchi depthBlue, Red (MERIS)

3.2.2. Validation Approach

WQ quantitative models were validated in two ways. The basic statistical metric selected to verify efficiency is the Spearman’s (r) correlation coefficient, which was selected based on the Kolmogorov–Smirnov and Shapiro–Wilk tests of normality. Additionally, the mean error (e) and the Root-Mean-Square Error (RMSE) indices were also applied. Initially, each validation dataset, including 20% of the total values during the years 2013–2016 for Secchi depths and 2015–2016 for TP, respectively, constituted the first validation process (the remaining 80% were used as training datasets). Then those values were linked with the respective images in order to acquire the predicted parameters’ values and further assure the good performance of the selected models. The second validation process included the utilization of the independent in situ datasets sampled during 2018 (Figure 4).

3.3. Carlson’s Trophic State Index (TSI) and Validation

Carlson’s Trophic State Index (TSI) is the most widely used tool for characterizing a lake’s health or its trophic state, while the latter is defined as the biological reaction of water bodies to nutrient additions [57]. Carlson’s method [43] uses Secchi depth in meters, a logarithmic transformation (Ln) of chlorophyll-a concentration in micrograms per liter, and total phosphorus measurements in micrograms per liter, while it concerns an index represented as a numerical scale to categorize lakes into classes related to their trophic status.
Equations (2)–(4), derived from [43], have been widely used to compute the TSIs according to TP, Chl-a, and SD, respectively, while an average (Equation (5)) is estimated to produce the final trophic state as follows:
T S I T P = 10 [ 6 L N 48 T P L N 2 ]
T S I C h l a = 10 [ 6 2.04 0.68 ln C h l a L N 2 ]
T S I S D T = 10 [ 6 L N S D T L N 2 ]
T S I a v e r a g e = T S I T P + T S I C h l a + T S I S D T / 3
The trophic status classification system categorizes lakes as oligotrophic (TSI value < 30), mesotrophic (TSI value 40–50), eutrophic (TSI value 60–70), and hypereutrophic (TSI value > 70; Table 5) and since the scale of the index is arithmetic, it can describe trophic changes and a larger number of transitional individual lake classes (e.g., oligotrophic-mesotrophic, mesotrophic-eutrophic).
Based on these equations, the in situ TSI for all cases accompanied by available simultaneous in situ measurements of TP, Chl-a, and Secchi depths were also calculated. In the framework of the study conducted by [31], through the harmonization of Landsat 7 ETM+ and 8 OLI images, three Chl-a quantitative models were developed, including the ratios of blue to green and red, red to green and blue, and the ln-transformed bands SWIR1 and SWIR2. Those models were established based on the same period and same lakes as the ones developed herein; Equation (6) concerns the calculation of Chl-a concentrations across all lakes, while Equations (7) and (8) regard the Chl-a assessment of natural-only and artificial-only lakes, respectively. Hence, taking into consideration those Chl-a models, we calculated TSI (Chl-a; Equation (3)) by using the equation being established regardless of the lake characteristics (Equation (6)), TSI (Chl-a) of natural lakes by employing the respective equation (Equation (7)) and TSI (Chl-a) of reservoirs by using the Chl-a equation, respectively developed (Equation (8)). Then we used the hereby developed models concerning the TP and Secchi depths for the calculation of satellite-derived TSI (TP; Equation (2)) and TSI (SDT; Equation (4)), respectively. After implementing Equations (2)–(5), satellite-derived TSI values were calculated and trophic state classification was conducted initially for the cases concerning all the lakes and then separately for the natural-only and artificial-only cases (by using the independent models). Validation of satellite TSI was carried out based on statistical analysis and the resulting deviation from the respective in situ TSI values.
l o g C h l a = 3.599 0.63 b l u e r e d 2.183 l n r e d l n s w i r 2
l o g C h l a = 4.443 1.421 b l u e g r e e n 3.454 l n r e d l n s w i r 2 + 1.304 r e d g r e e n
l o g C h l a = 2.919 2.011 l n r e d l n s w i r 1 + 1.449 r e d g r e e n 1.441 l n r e d l n b l u e

4. Results

4.1. Secchi Depth and Total Phosphorus Quantitative Models for Greek Lakes

4.1.1. Secchi Depth Models

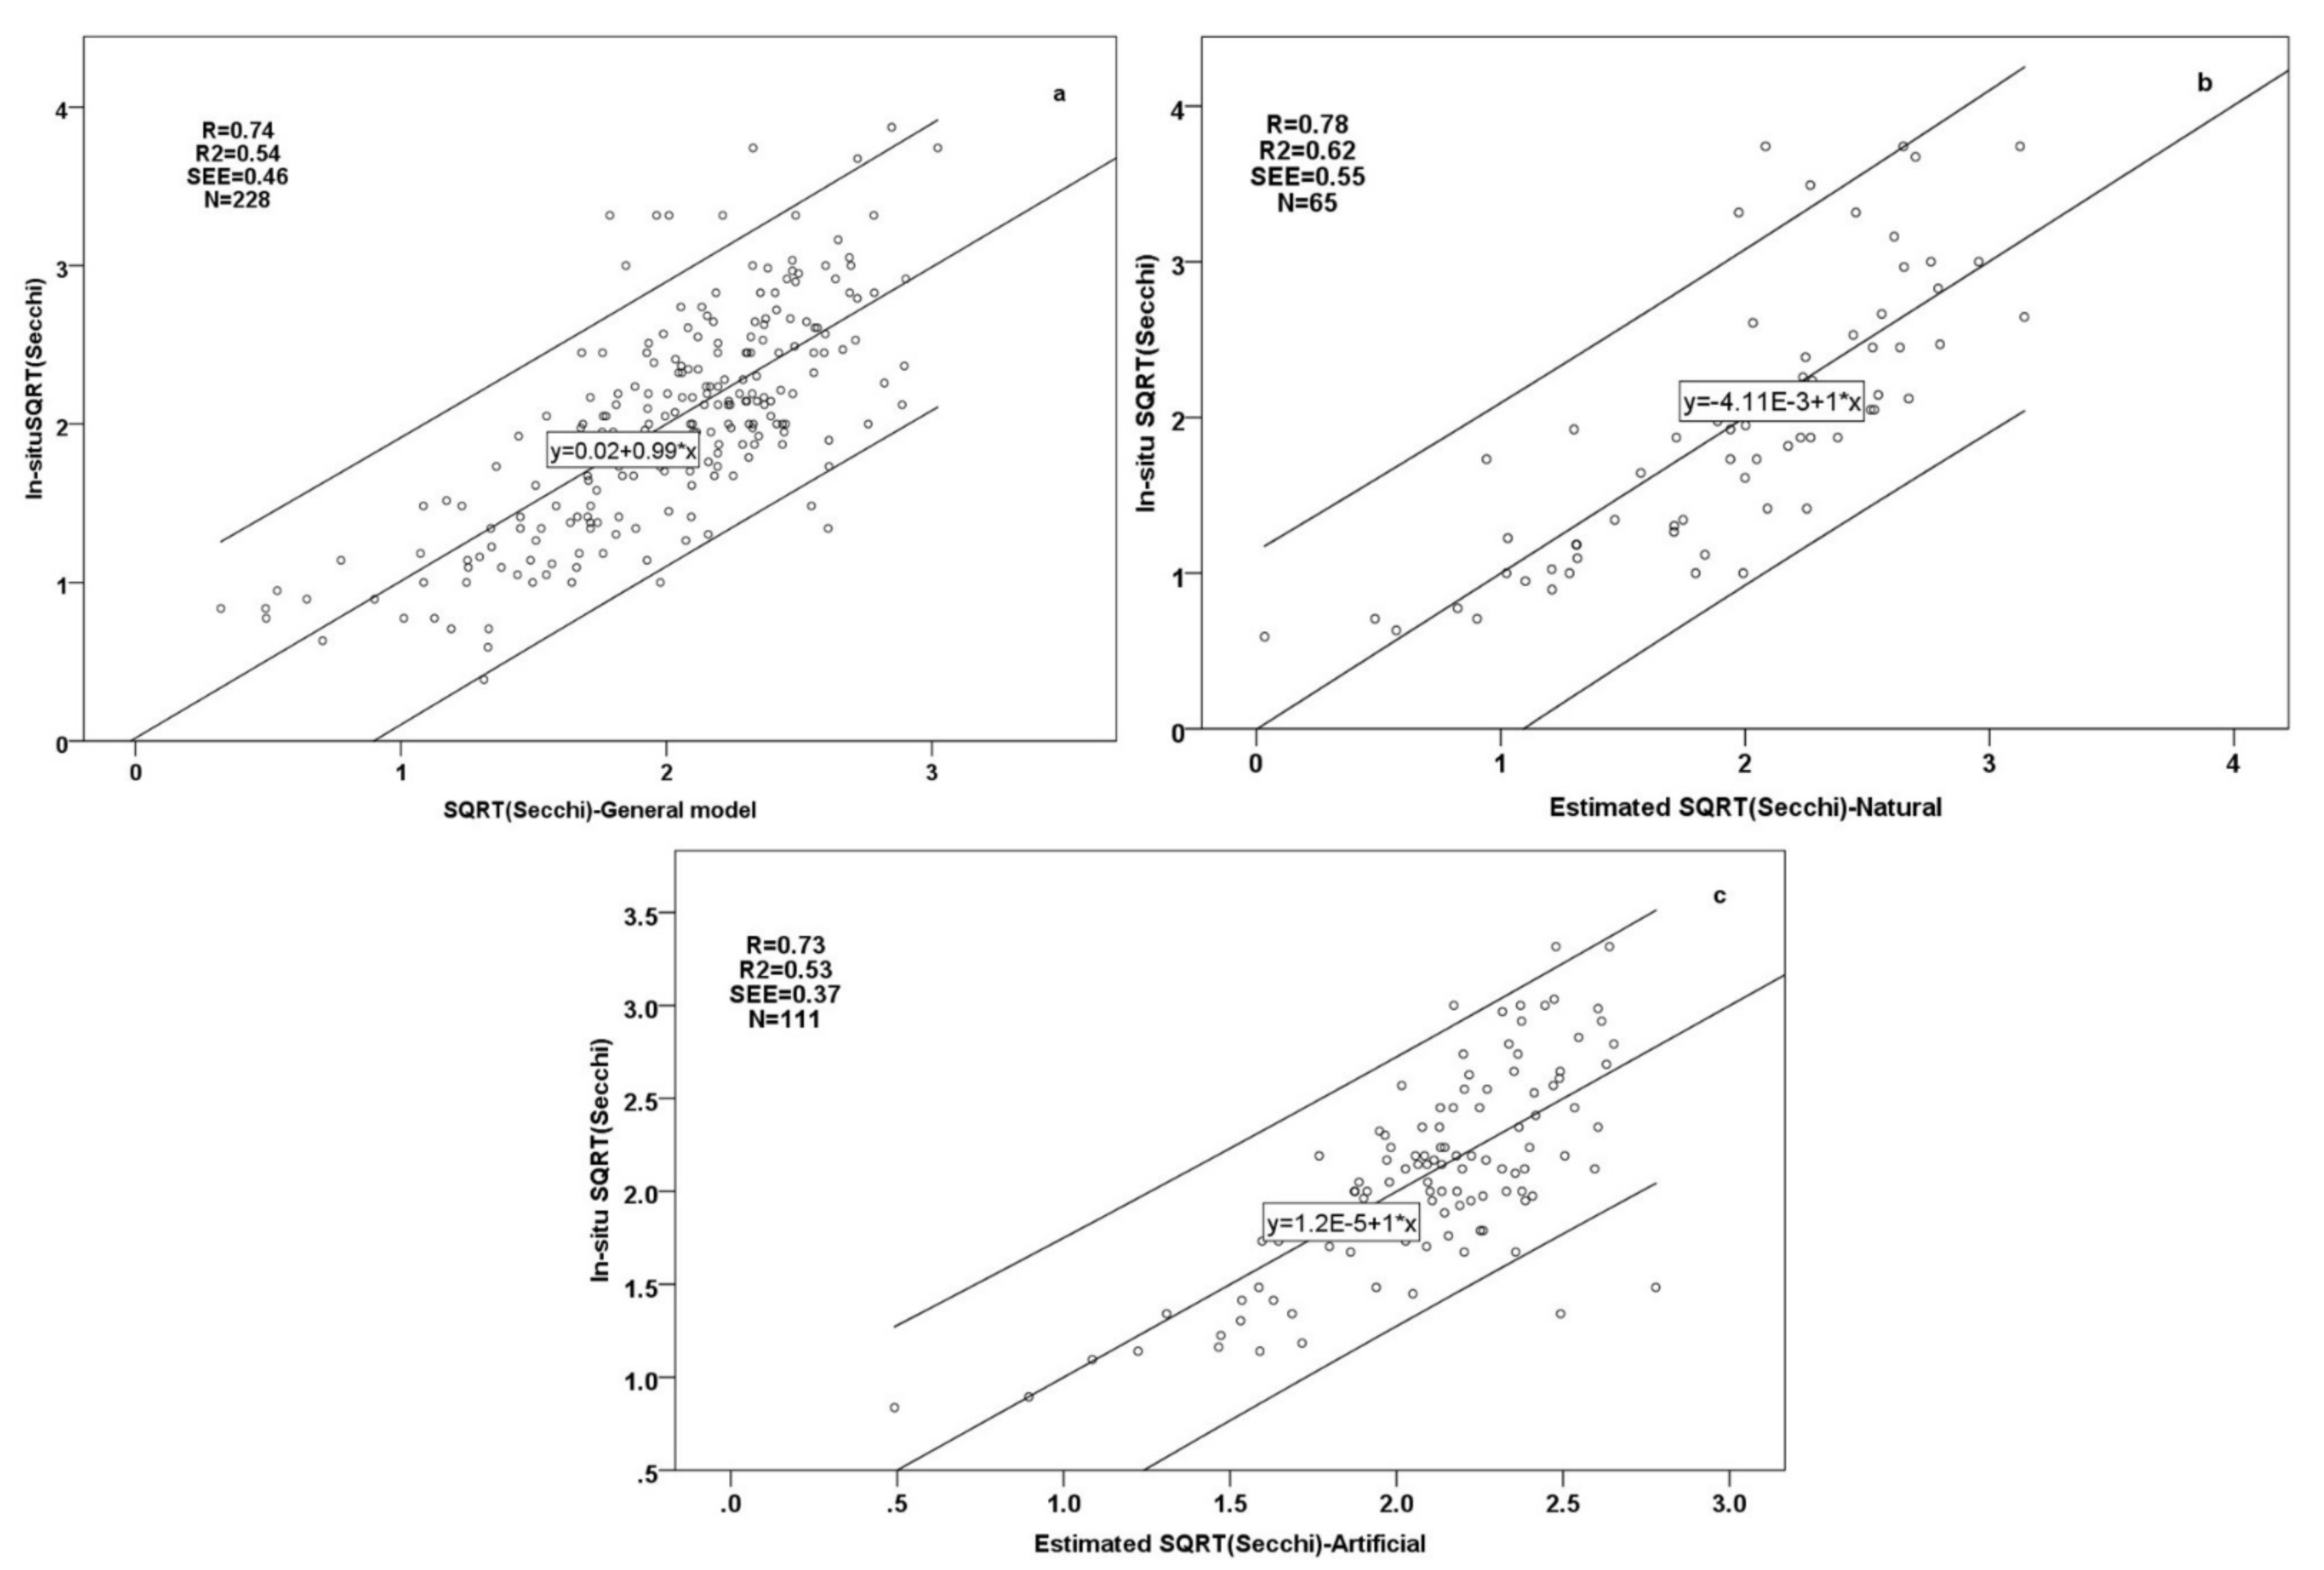
Spearman r values that resulted from the correlation analysis among all available band transformations and Secchi depth values, log, ln, and SQRT Secchi depth values ranged from −0.56 to +0.56. Correlation matrix in combination with the predictor importance chart (IBM SPSS software Statistics v. 23.0, Armonk, NY, USA) indicated the highest important predictors. Values of importance for the same variables varied depending on the dependent parameter (Secchi, SQRTSecchi, etc.); some variables were common for all the Secchi transformations (Table 6), whereas each Secchi transformation (e.g., SQRT, LOG, LN) also indicated some different variables that were important concerning their prediction. Those variables/predictors were further inserted in several combinations in numerous stepwise linear regressions. Application of multi-collinearity tests (i.e., Variance Inflation Factor-VIF with values higher than 1 and less than 10 and Tolerance higher than 0.1) and R2 values indicated the optimal Secchi quantitative models, which included as dependent variables the ln-, log- and SQRT Secchi transformations, with the latter proven to be the most satisfactory (Equation (9); Table 7; Figure 5a). The selected SQRT(Secchi)general model incorporated ratios of bands blue, red, and green from the visible spectrum and the second band from the short-wave infrared part of spectrum, while collinearity statistics suggested an absence of autocorrelation.
To ensure that further independent special models are essential to be developed for natural and artificial lakes to gain higher accuracy, the Secchigeneral model (Equation (9)) was also separately applied to natural-only and artificial-only lakes. Even though some statistical indices were acceptable, special models for the different types of lakes proved to perform better compared to the general one, particularly concerning artificial lakes. Statistical and verification results derived from the application of the general model to natural and artificial lakes are presented in the validation section.
S Q R T S e c c h i g e n e r a l = 1.215 2.479 b l u e + r e d + r e d b l u e + 3.394 l n g r e e n l n s w i r 2
Subsequently, after the conduction of multiple MLR analyses employing natural-only and artificial-only lakes separately, the SQRT Secchi transformation also proved to perform better in both cases and reflected adequate and reliable Secchi depths. It should be noted that autonomous elaboration of natural and artificial lakes signified the log-chl-a transformation as a Secchi predictor accompanied by a high beta coefficient, especially for natural lakes (Table 8). Hence, the models that met the aforementioned criteria and were finally selected to calculate Secchi depth in natural (Equation (10); Figure 5b) and artificial (Equation (11); Figure 5c) lakes, included except for the logchl-a, visible bands as well: red, green, and blue, while Equation (11) (artificial lakes) additionally incorporated the SWIR1 band.
S Q R T S e c c h i n a t u r a l = 1.172 1.003 l o g c h l a 1.031 l o g r e d
S Q R T S e c c h i a r t i f i c i a l = 3.927 1.365 g r e e n b l u e 0.318 r e d s w i r 1 0.361 l o g c h l a

4.1.2. Total Phosphorus Models

The correlation matrix among all variables, including all the lakes with mean depths higher than 5 m resulted in slightly weaker correlations than those regarding Secchi depths. In this case, the Spearman threshold value was reduced to ±0.3 to discriminate and incorporate more phosphorus variables/predictors. Furthermore, the coefficients of determination among phosphorus, chlorophyll-a, and Secchi depths were very high, with values equal to 0.85 and −0.84, respectively. Optimal predictors with Spearman values higher than ±0.3 were further enriched and confirmed based on the calculation of their significance according to the significance predictor chart. Final selected predictors (Table 9) were inserted in manifold stepwise MLRs. The insertion of Chl-a and Secchi depth data as independent variables in MLRs improved the results and yielded some statistically acceptable models employing some of those predictors.
Among the most optimal models, Equation (12) is the one selected for TP quantification in Greek lakes, employing, except for the Chl-a, the band ratio of Ln-Red and Ln-SWIR1 bands. Both predictors are accompanied by equally high beta coefficient values, while Durbin–Watson’s statistic test is fully acceptable (Table 10; Figure 6a).
L o g T P g e n e r a l = 1.425 + 0.452 l o g C h l a 0.573 l n r e d l n s w i r 1
MLRs that concerned artificial lakes resulted in weak models characterized by poor statistical performance; R2 values ranged from 0.13 up to 0.3, while TP models concerning the natural lakes managed to deliver highly acceptable results based on given statistical indices. Since no special model was delivered for TP quantification in artificial lakes, the LogTPgeneral model’s further efficiency was explored by applying it to natural and artificial lakes (dataset of 2018), while the results are presented in the validation section. Concerning natural lakes, the log Secchi proved to be a strong TP predictor, followed by the band ratio of green and red (Equation (13); Figure 6b). The best quantitative TPnatural model is characterized by high Pearson’s and coefficient of determination values, while no autocorrelation problem is detected (Table 11).
L o g T P n a t u r a l = 0.633 0.704 l o g S e c c h i 0.392 g r e e n r e d

4.2. Models’ Validation

This section presents the results of the analysis concerning the evaluation of the general models’ (Secchigeneral,TPgeneral) performance after their application separately on natural-only and artificial-only lakes. Since those two general models were developed based on data from 2013–2016, their validation was conducted based only on data from 2018. Regarding the Spearman value, all correlations selected and presented are significant at the 0.01 level.

4.2.1. Secchi Depth Models

The Secchigeneral model was developed based on 228 cases and validated twice based on 57 and 115 cases, while RMSE are quite low, equal to 0.24 m (1st validation) and 0.37 m (2018 validation), respectively (Table 12). RMSE was additionally expressed as a percentage based on both maximum Secchi depth and average Secchi depth values. Even though the percentage based on the average Secchi depth is greater than the one based on the maximum Secchi depth value, as expected, the numbers are relatively low, indicating the good performance of the developed models. Application of the Secchigeneral model to natural lakes resulted in acceptable and reliable results and similar values regarding the examined statistical indices as those derived by the Secchinatural model. Nevertheless, the Spearman value of the Secchinatural model (2018 data) is higher than the general one; hence, Secchinatural is selected as the optimum method to quantify Secchi depths in natural lakes.
As far as the artificial lakes are concerned, Secchiartificial model is selected compared to the Secchigeneral, since both average residuals and the RMSE values are lower (0.002 compared to 0.06 m and RMSE 0.14 m compared to 0.44 m).

4.2.2. Total Phosphorus Models

The LogTPgeneral model performed well concerning both validation procedures (Table 13). High Spearman values derived from datasets of 12 and 33 cases and similar average in situ and satellite LogTP values characterize both validations. RMSE is 1.41 mg/L (1st validation) and 1.46 mg/L (validation of 2018). Application of the LogTPgeneral model to artificial lakes yielded acceptable results since RMSE equals 1.51 mg/L.
Concerning the application of the general model to natural lakes, it is clear that the specially developed model for natural lakes is superior since the values of average residuals and RMSE are quite lower (0.93 compared to 1.21 mg/L; RMSE = 1.63 compared to 3.2 mg/L). Moreover, the higher Spearman value (0.68) and larger size of the validation dataset (n = 49) also indicate the advantage of this model in the assessment of the TP concentrations in natural lakes.
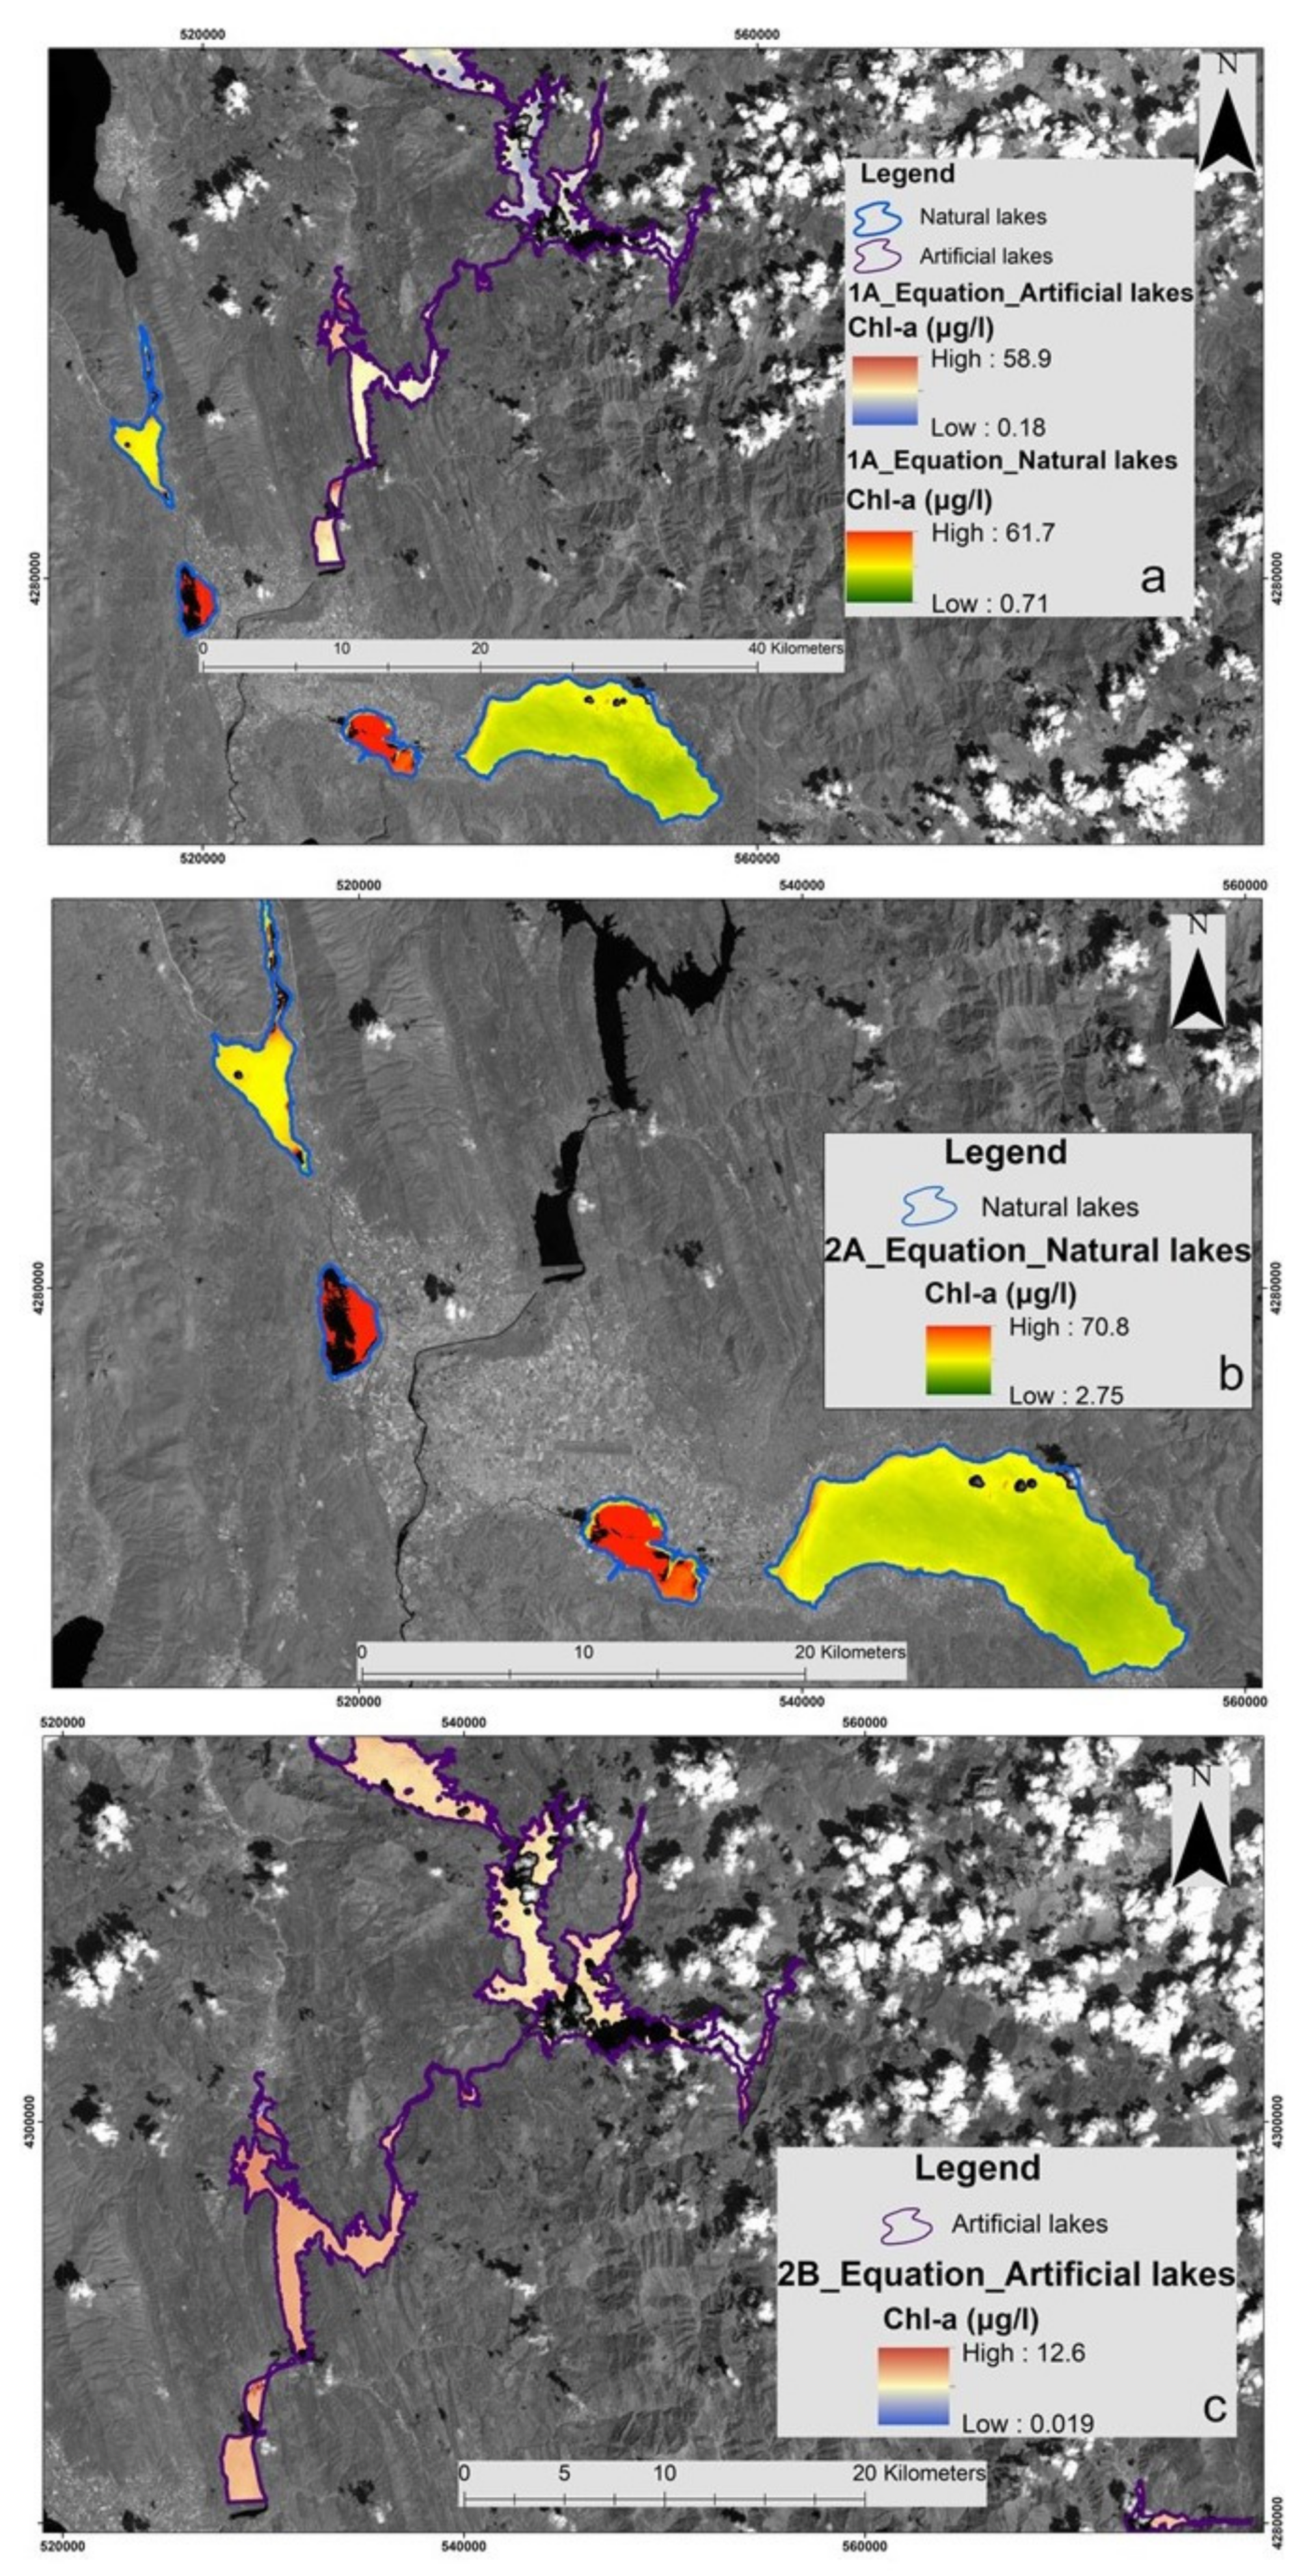
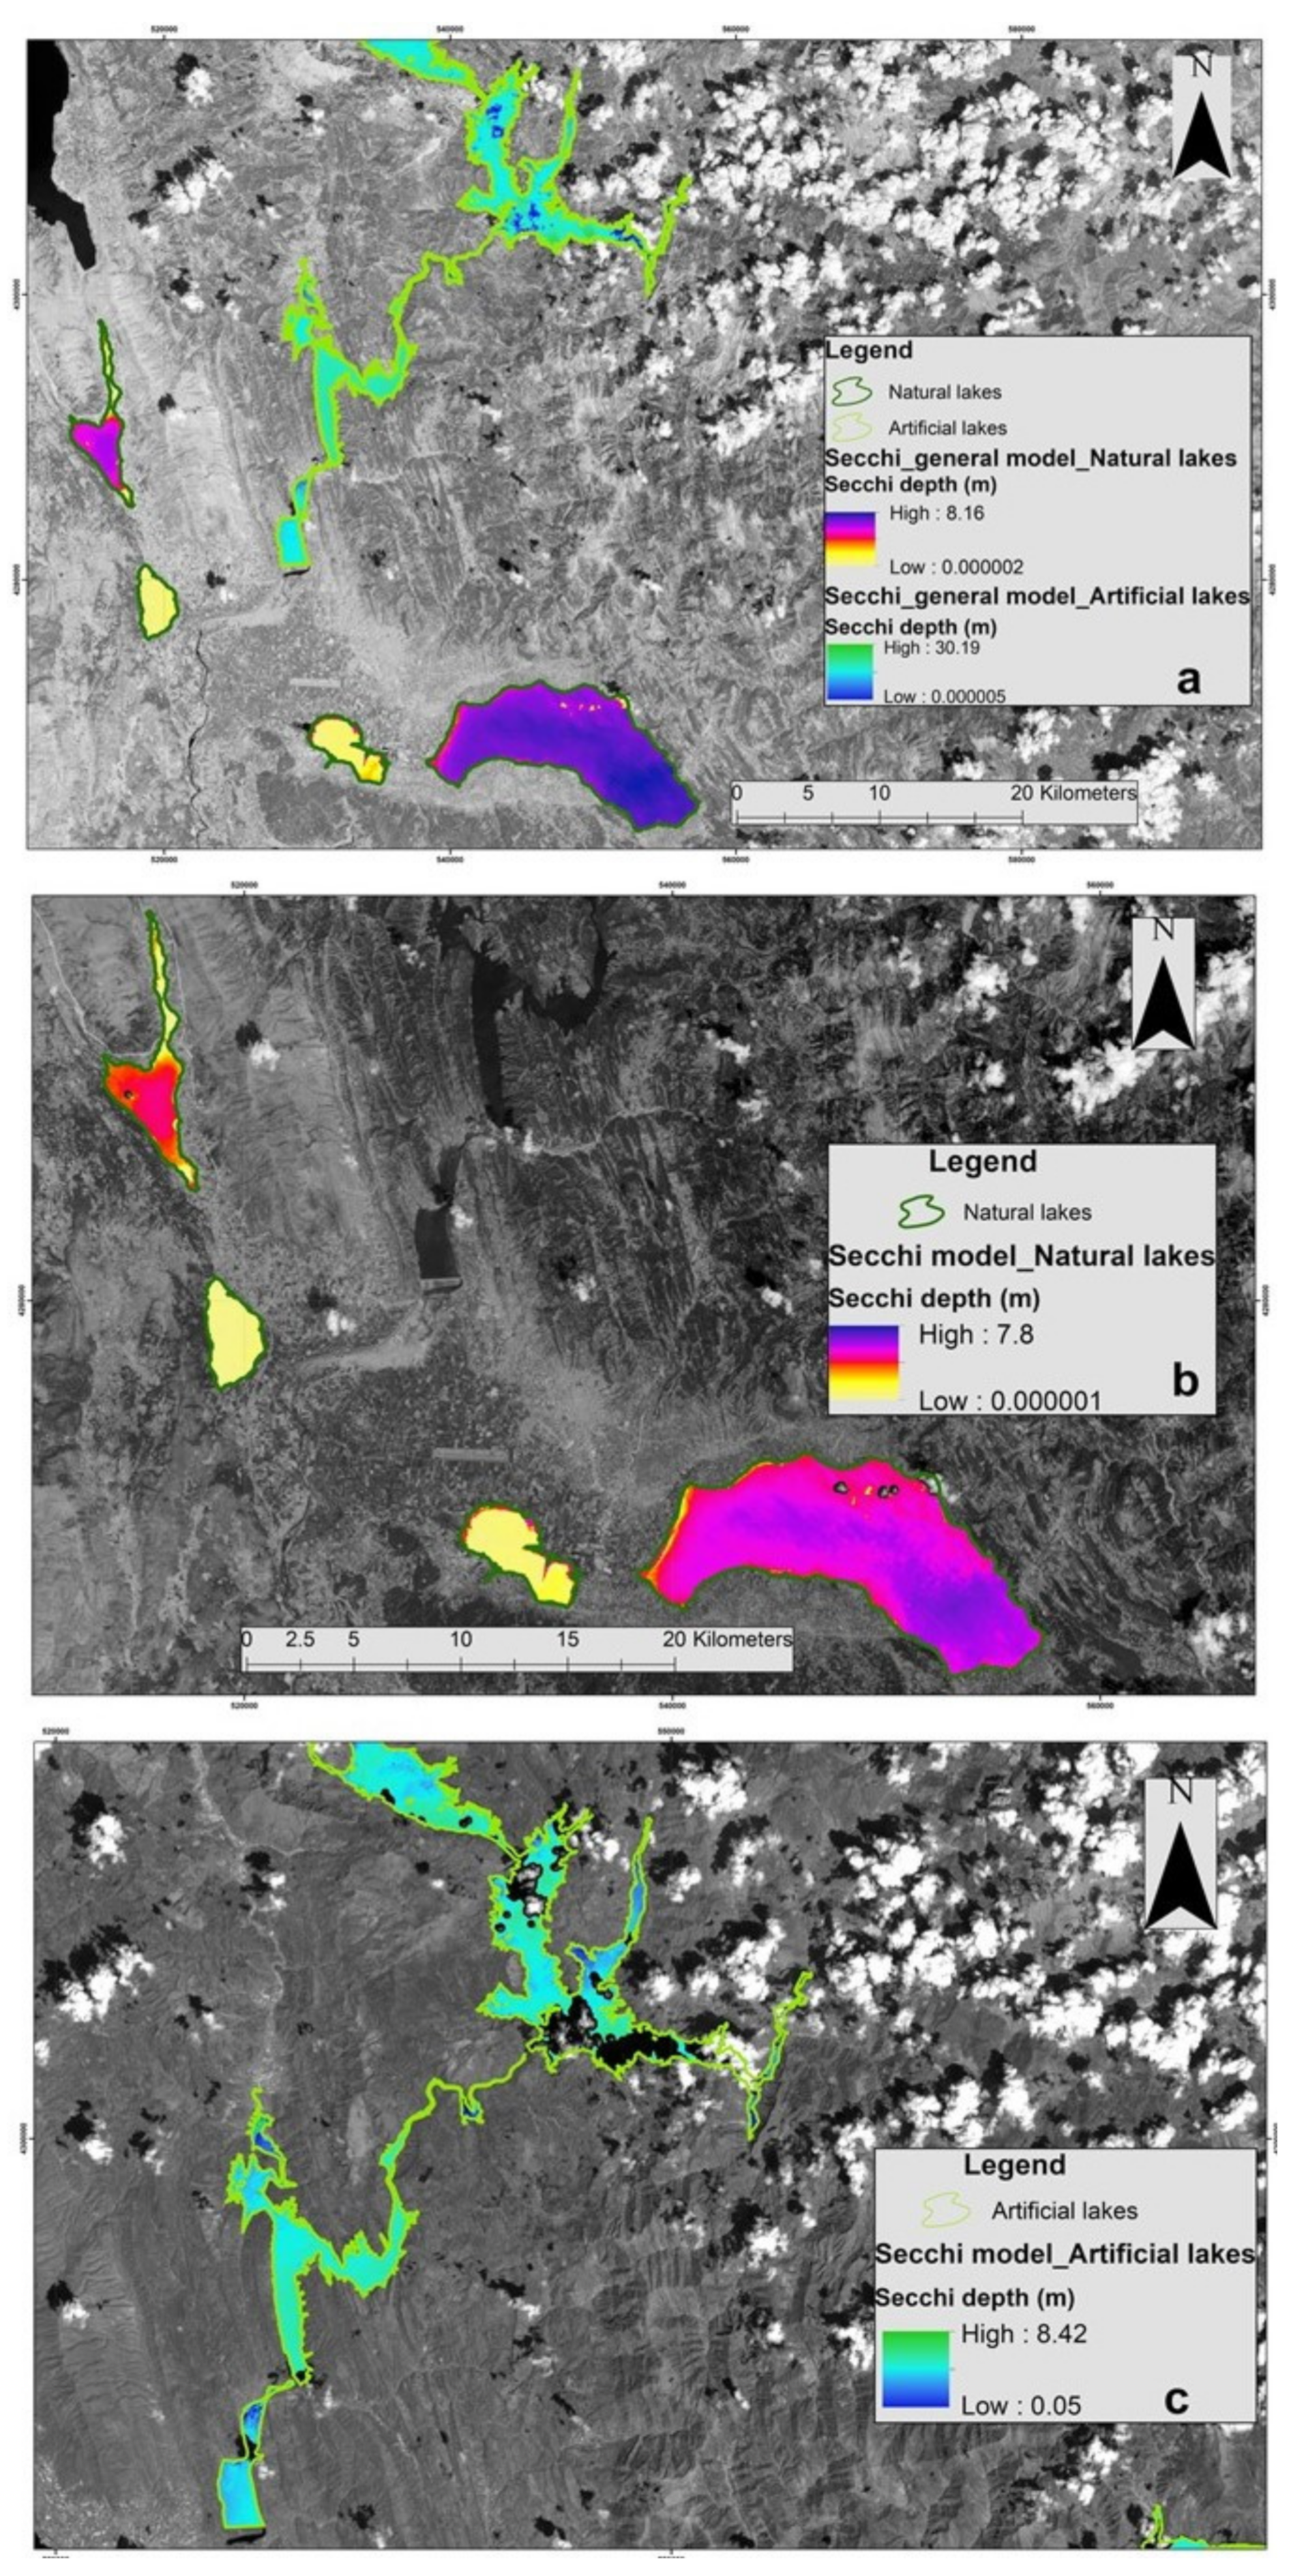
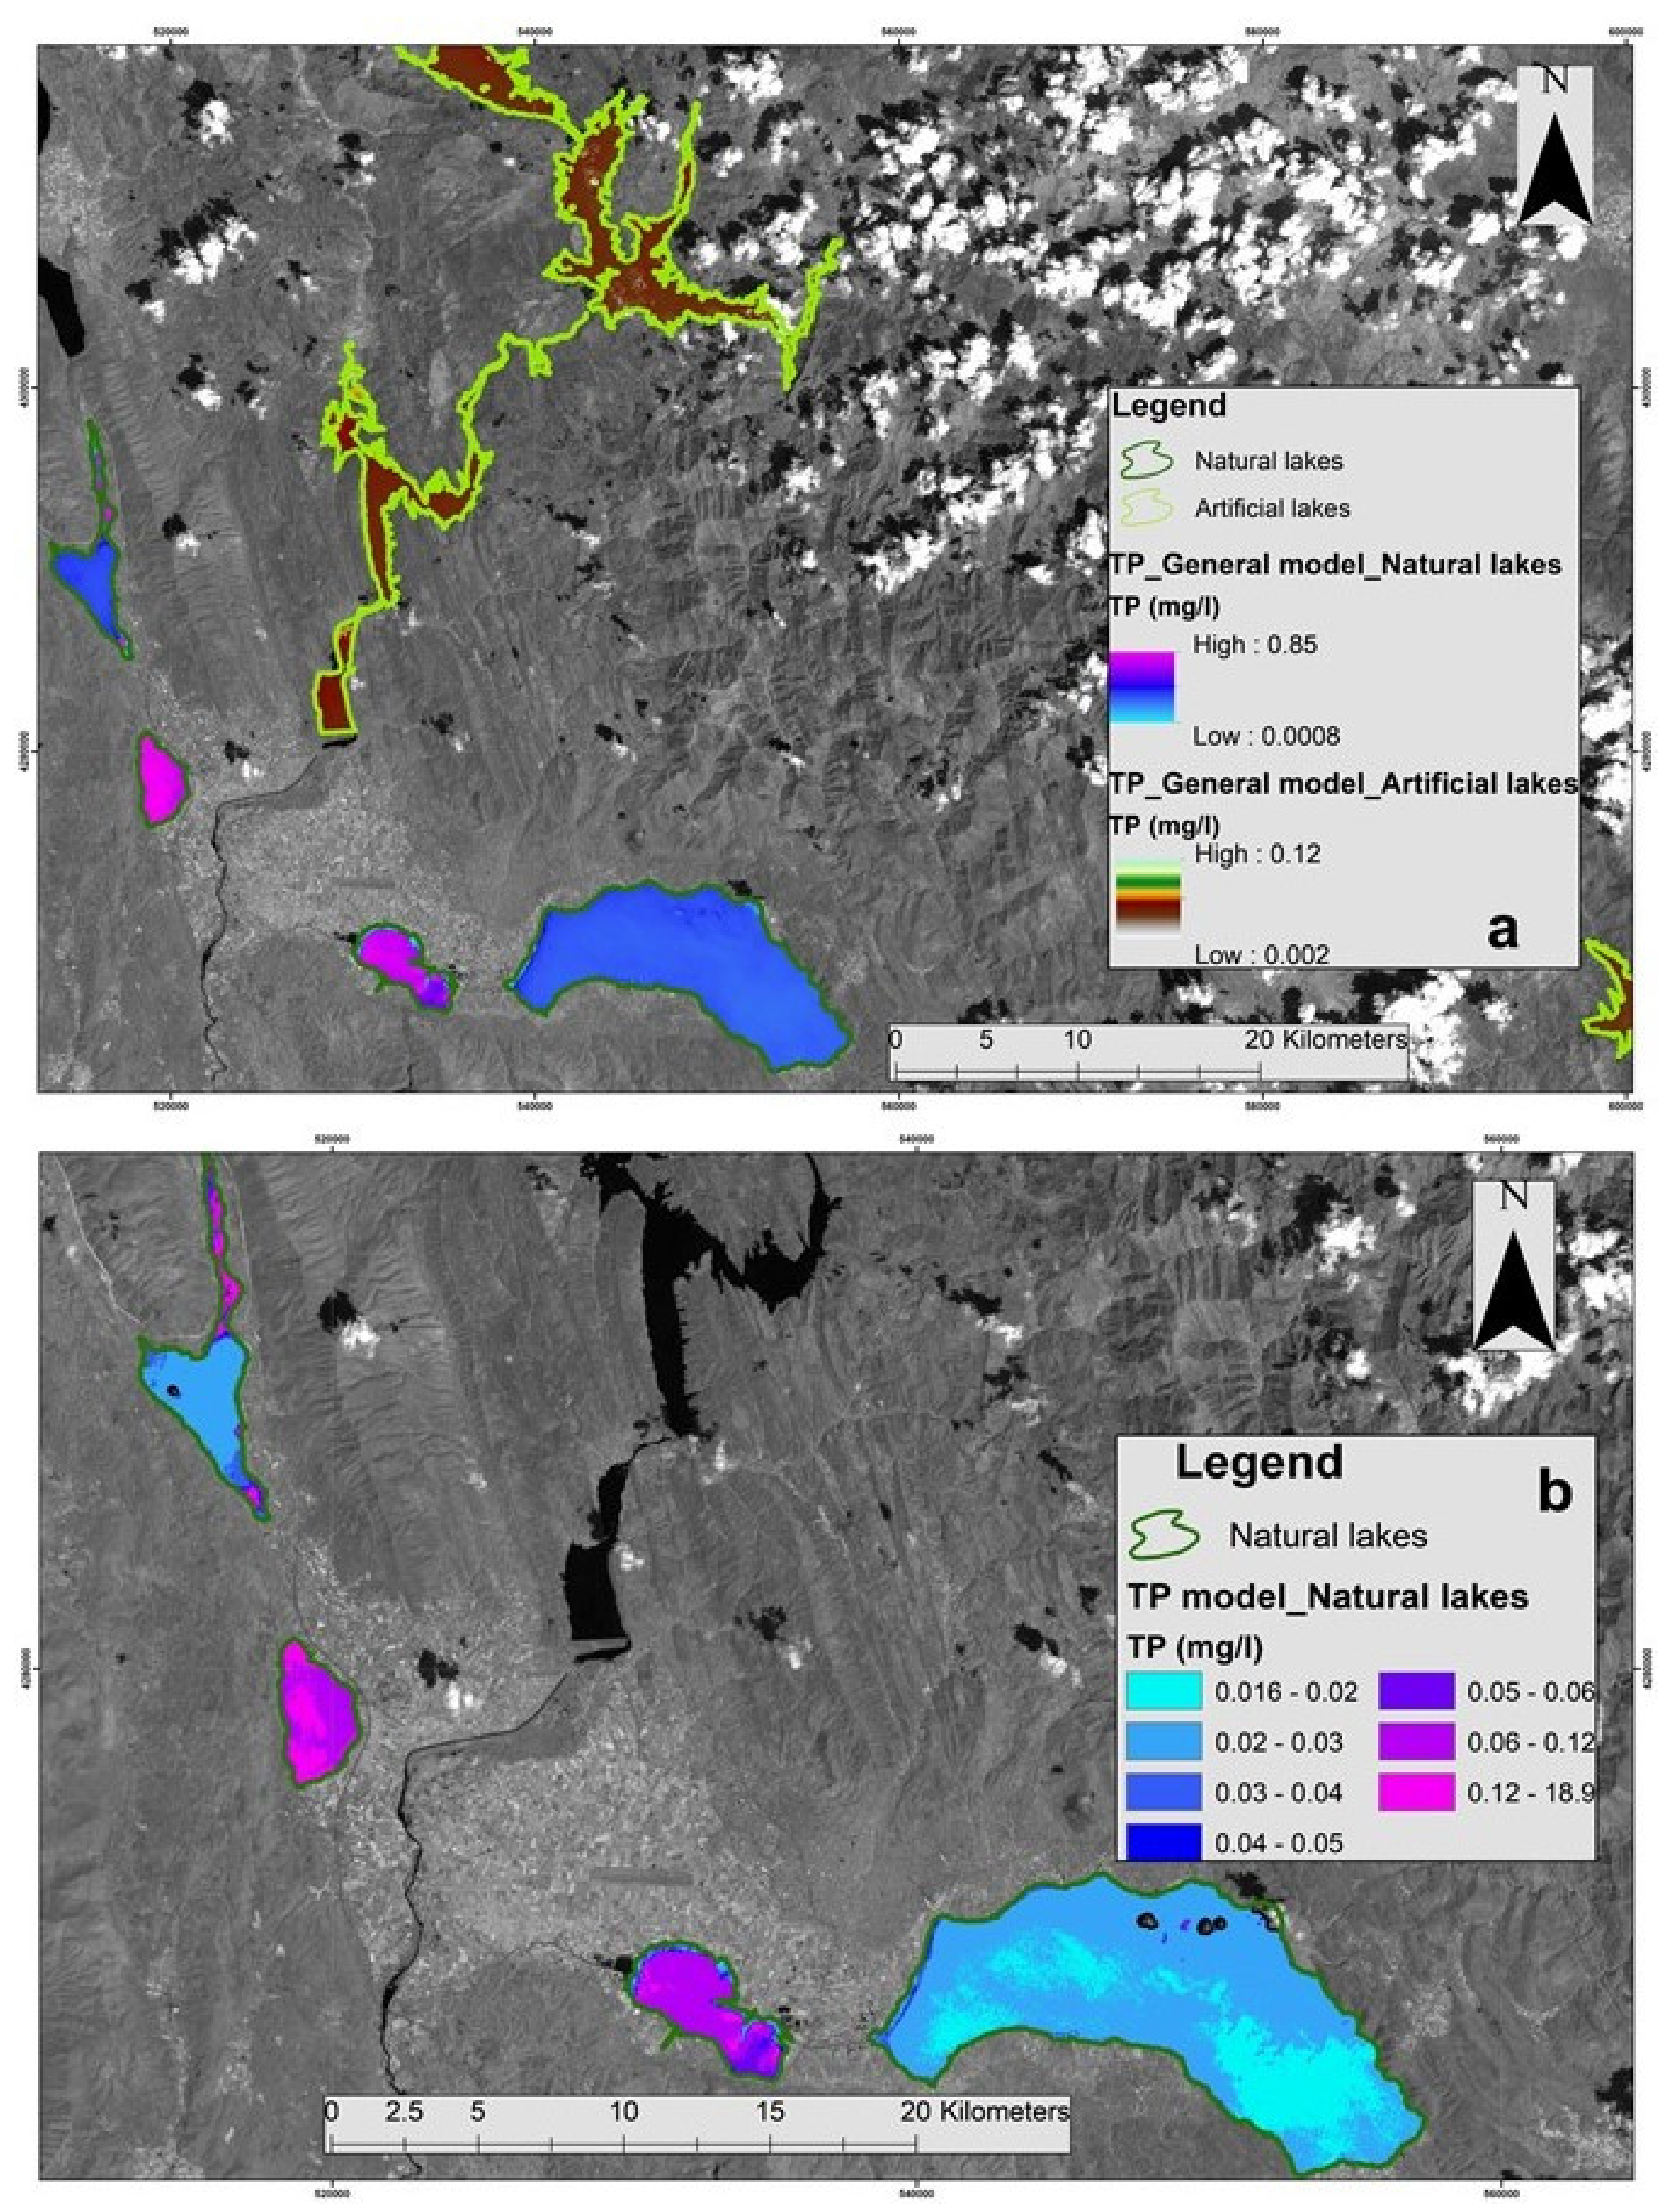
Furthermore, Chl-a, Secchi depth and TP maps of selected lakes were created after application of the Chl-a (Figure 7) algorithms derived by [31] and the herein developed Secchi (Figure 8) and TP algorithms (Figure 9). The Landsat 8 OLI satellite image of 11 August 2013 was used in order to produce the satellite-derived spatial distribution of the studied WQ parameters of this day, while the respective in-situ values of those lakes were sampled with −2 and +5 days (Chl-a) and −5 and +5 days (Secchi depth) of difference from the aforementioned date, while there is no available in situ data for their TP concentrations. Application of the Secchi general model resulted in Secchi depth values ranging from 0.000002 to 8.2 m and from 0.000005 to 30.2 m for natural and artificial lakes, respectively (Figure 8a). Application of the Secchi natural model in natural lakes yielded Secchi depths ranging between 0.000001 and 7.8 m (Figure 8b), while the Secchi artificial model resulted in Secchi depth values varying from 0.05 to 8.4 m (Figure 8c), as far as the artificial lakes are concerned. The Secchi general model (Equation (9)) was applied by using the aforementioned band combinations, while the Secchi natural (Equation (10)) and Secchi artificial (Equation (11)) models were applied, including the respective Chl-a equations specially designed for the natural (Equation (7) [31]) and artificial (Equation (8) [31]) lakes, respectively. Concerning the application of TP general model, which also includes Chl-a, Equation (12) was used, whereas the TP model of natural lakes employed the Secchi natural model in order to be applied. TP general model resulted in values ranging from 0.0008 to 0.85 mg/L and from 0.002 to 0.12 mg/L for natural and artificial lakes, respectively (Figure 9a). Values of the specially designed TP model for natural lakes vary from 0.016 to 19 mg/L, while only a few values are greater than 0.2 mg/L (Figure 9b). Furthermore, since the variance of TP estimated values is small, it was decided to present those values by grouping them in classes, as stretching values resulted in low-quality results. Furthermore, it should be noted that all parameters’ values have been converted in actual units, e.g., Chl-a in μg/l, Secchi depth in meters, and TP in mg/L, to facilitate the understanding and the comparison among the concentrations.

4.3. Satellite Derived Assessment of Trophic Status of Greek Lakes Based on Carlson’s Trophic State Index

4.3.1. Evaluation of the Lake Trophic Status’s Assessment Based on the Whole Dataset

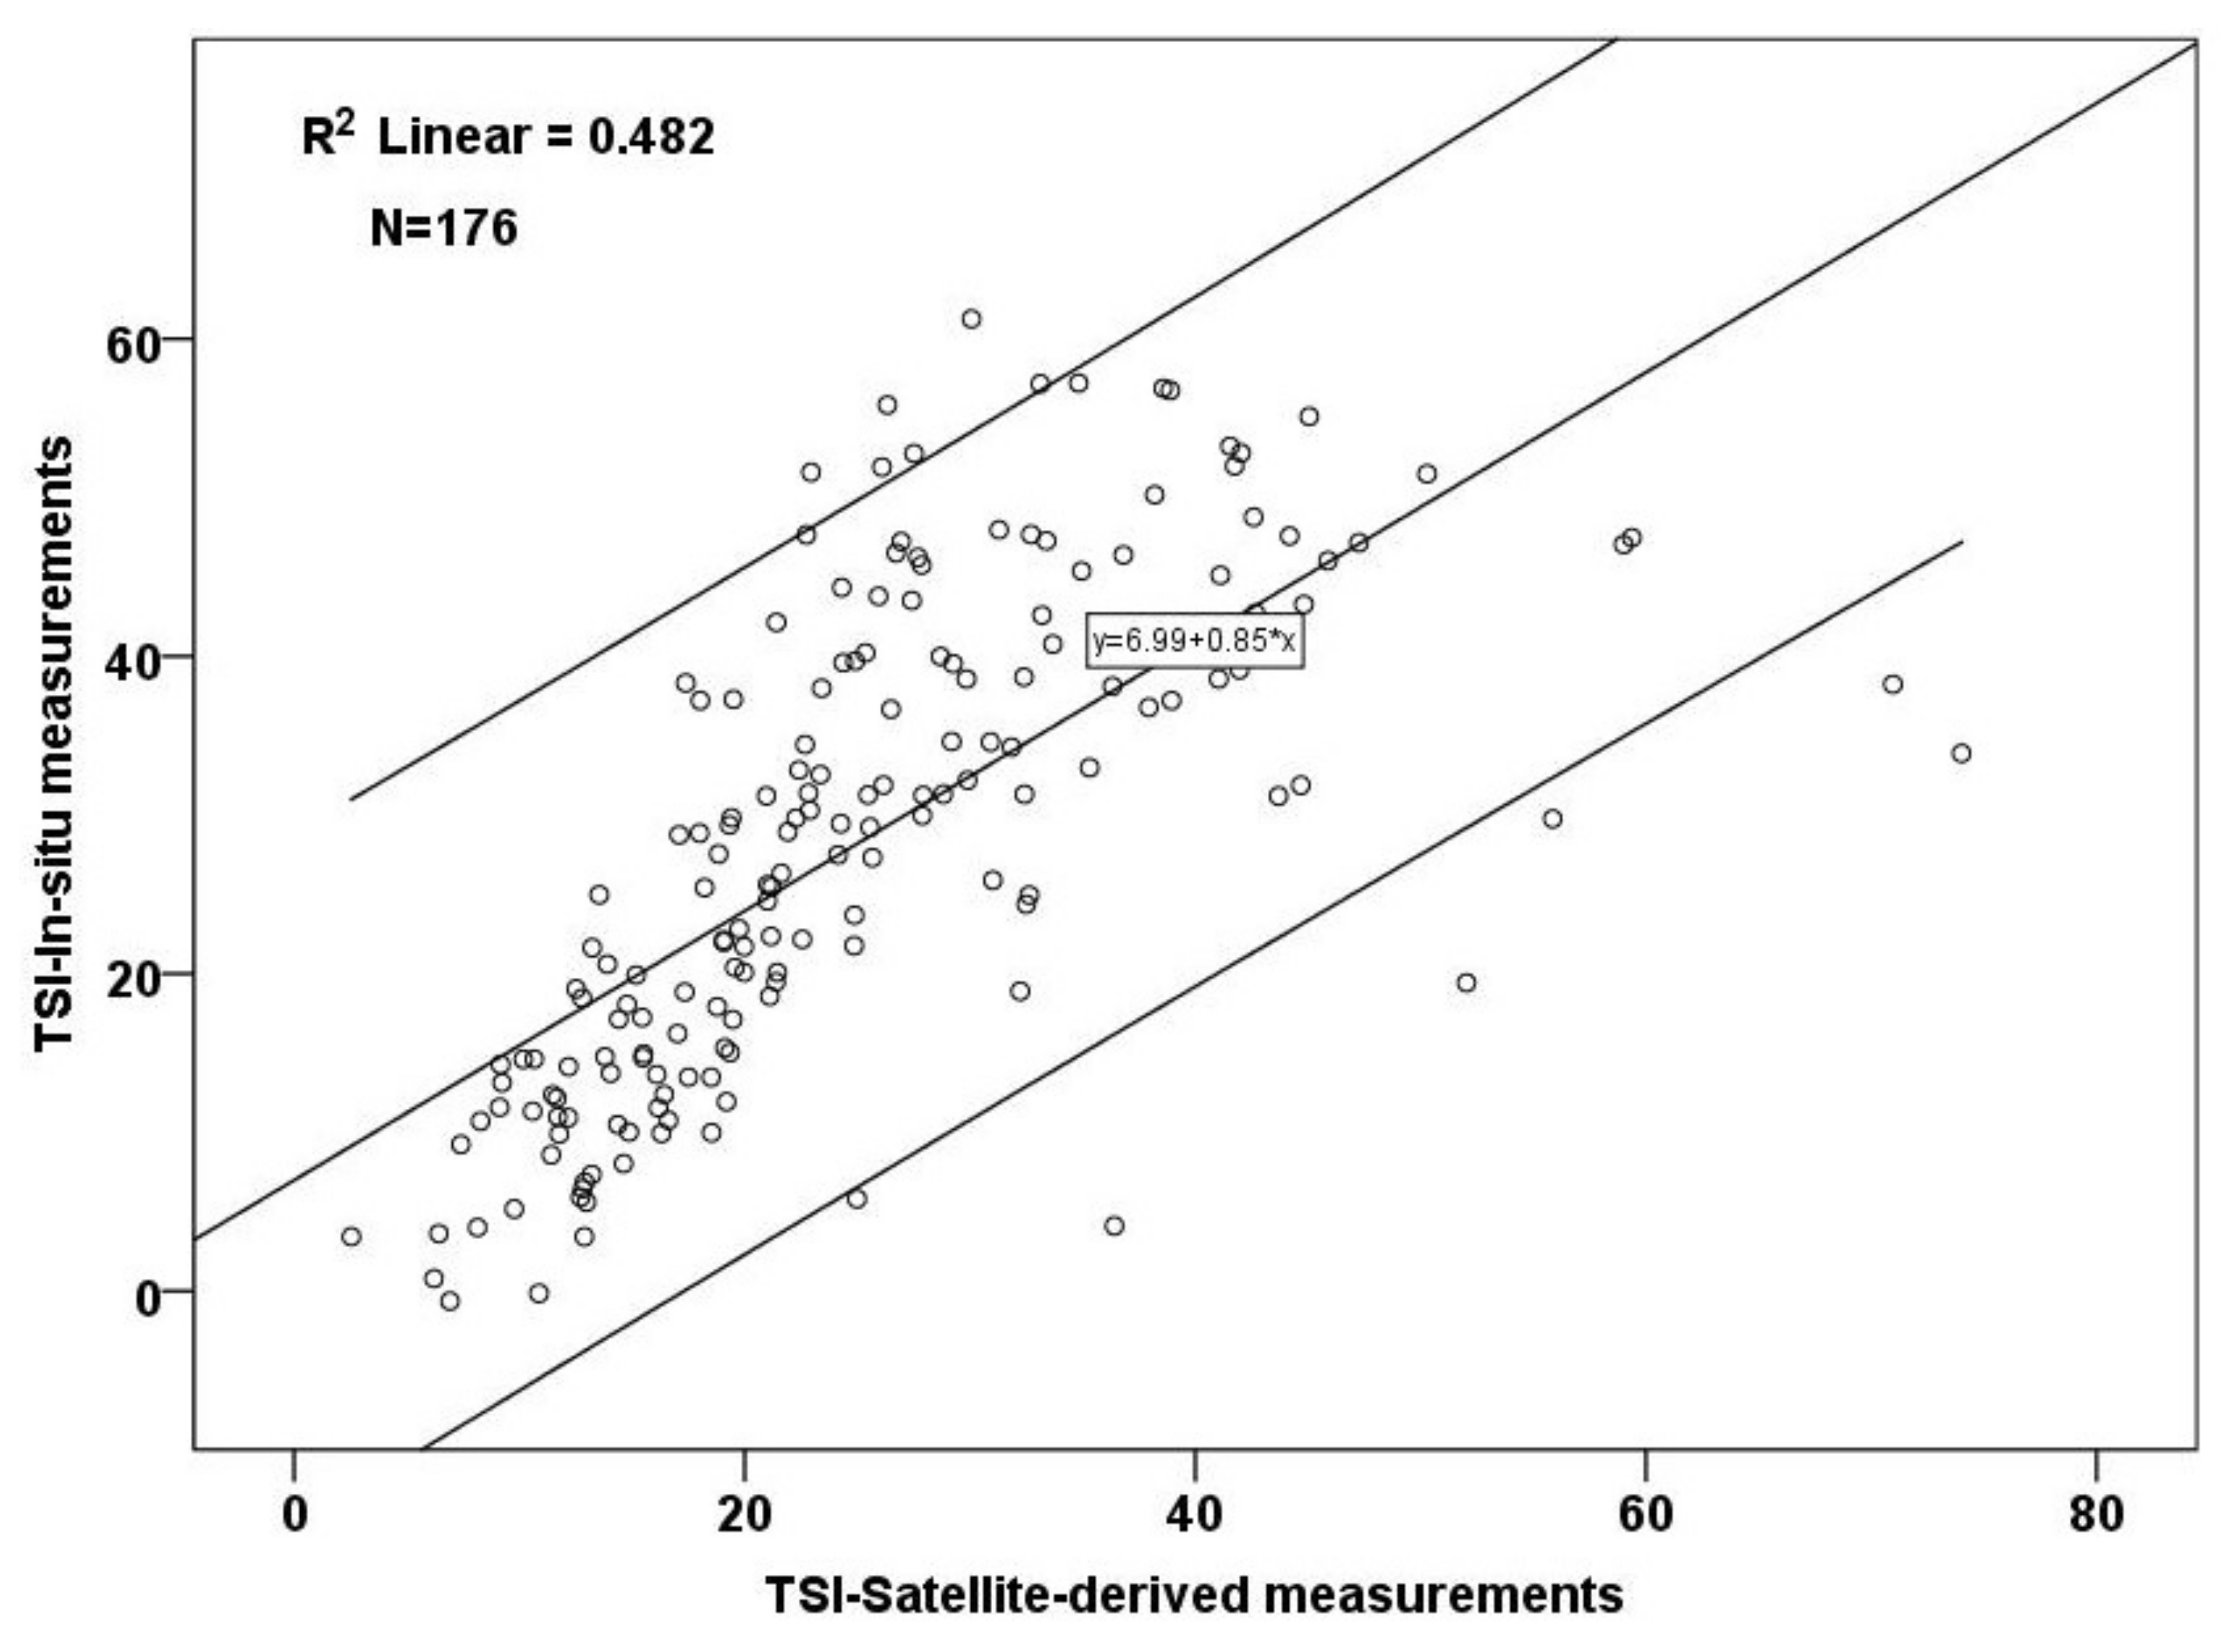
Calculation of both types of TSI using in situ only data and models based on satellite data concerns the attributes that were accompanied by available simultaneous in situ measurements of TP and Chl-a concentrations and Secchi depth measurements (176 total cases). Since in situ available TP data are those analyzed during the years 2015–2016 and 2018, both calculated TSIs concern the same period. Furthermore, the application of Equations (2)–(5) concerning both the in situ only data and the models resulted in categorizing the under-study attributes (and by extension the lakes) in 5 classes regarding their trophic status (Table 14; Figure 10). The main difference is that in situ measurements indicated 1 eutrophic case and no hypereutrophic cases, while remote sensing detected 2 hypereutrophic cases and no eutrophic cases. In both analyses, cases that are characterized as oligotrophic comprise the majority of the entire dataset, and cases with a tendency to mesotrophy and mesotrophic ones occupy the next positions.
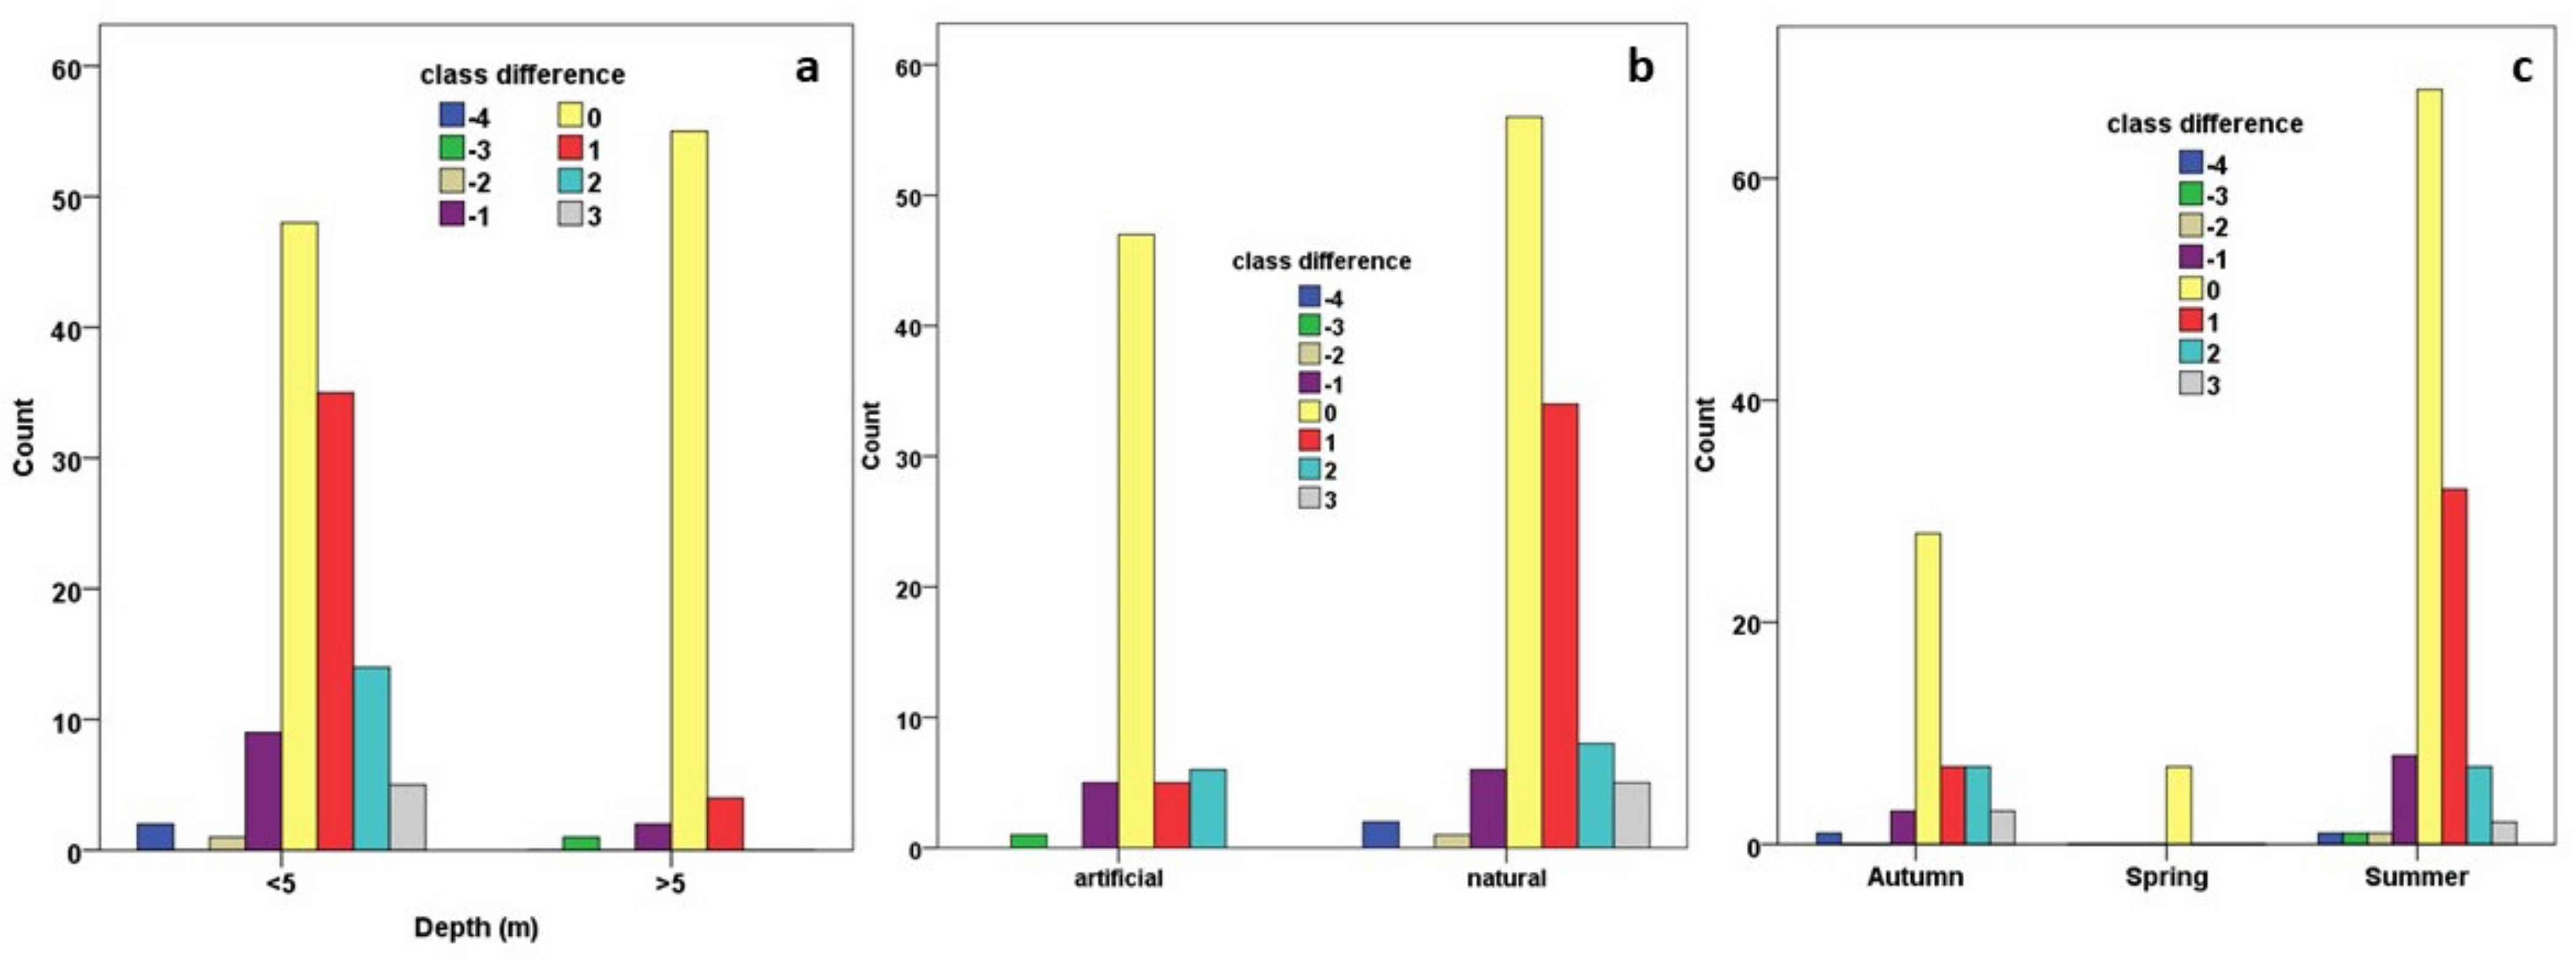
Further statistical analysis suggested that 103 of 176 attributes (58.5%) were identically classified based on the two TSI calculations, while 50 cases out of 73 that were classified differently, were allied to the right previous or next class (−1, +1) in relation to the in situ results. Furthermore, attributes that were misclassified in 3 or 4 classes away from the in situ ones are in total 8, which correspond to a 4.5% of the misclassified dataset. Considering the mean depth of the lakes (Figure 11a), it is proven that cases concerning deeper lakes (>5 m) were more successfully classified than the shallow ones verifying the effect of the bottom reflectance as an obstacle in the remote sensing elaboration. Records belonging to natural lakes were the majority of those that were either identically (56 out of 112) or by-one-class misclassified (40 out of 112; Figure 11b). Concerning the sampling season (Figure 11c), results of summer months resulted in 68 attributes that were identically classified by both TSI calculations, while 40 out of 120 were misclassified in the previous or next trophic status class. All records regarding spring-monitored lakes were identically classified, while remote sensing concerning autumn season indicated a slight weakness in properly classifying the trophic status of lakes compared to summer. The total number of 176 attributes is divided into 49 sampled in autumn, 7 sampled in spring, and 120 cases sampled in summer months. Those sampling dates are accompanied by 26 images during autumn, 6 images during spring, and 51 images during summer months.

4.3.2. Evaluation of the Lake Trophic Status Assessment concerning Natural and Artificial Lakes

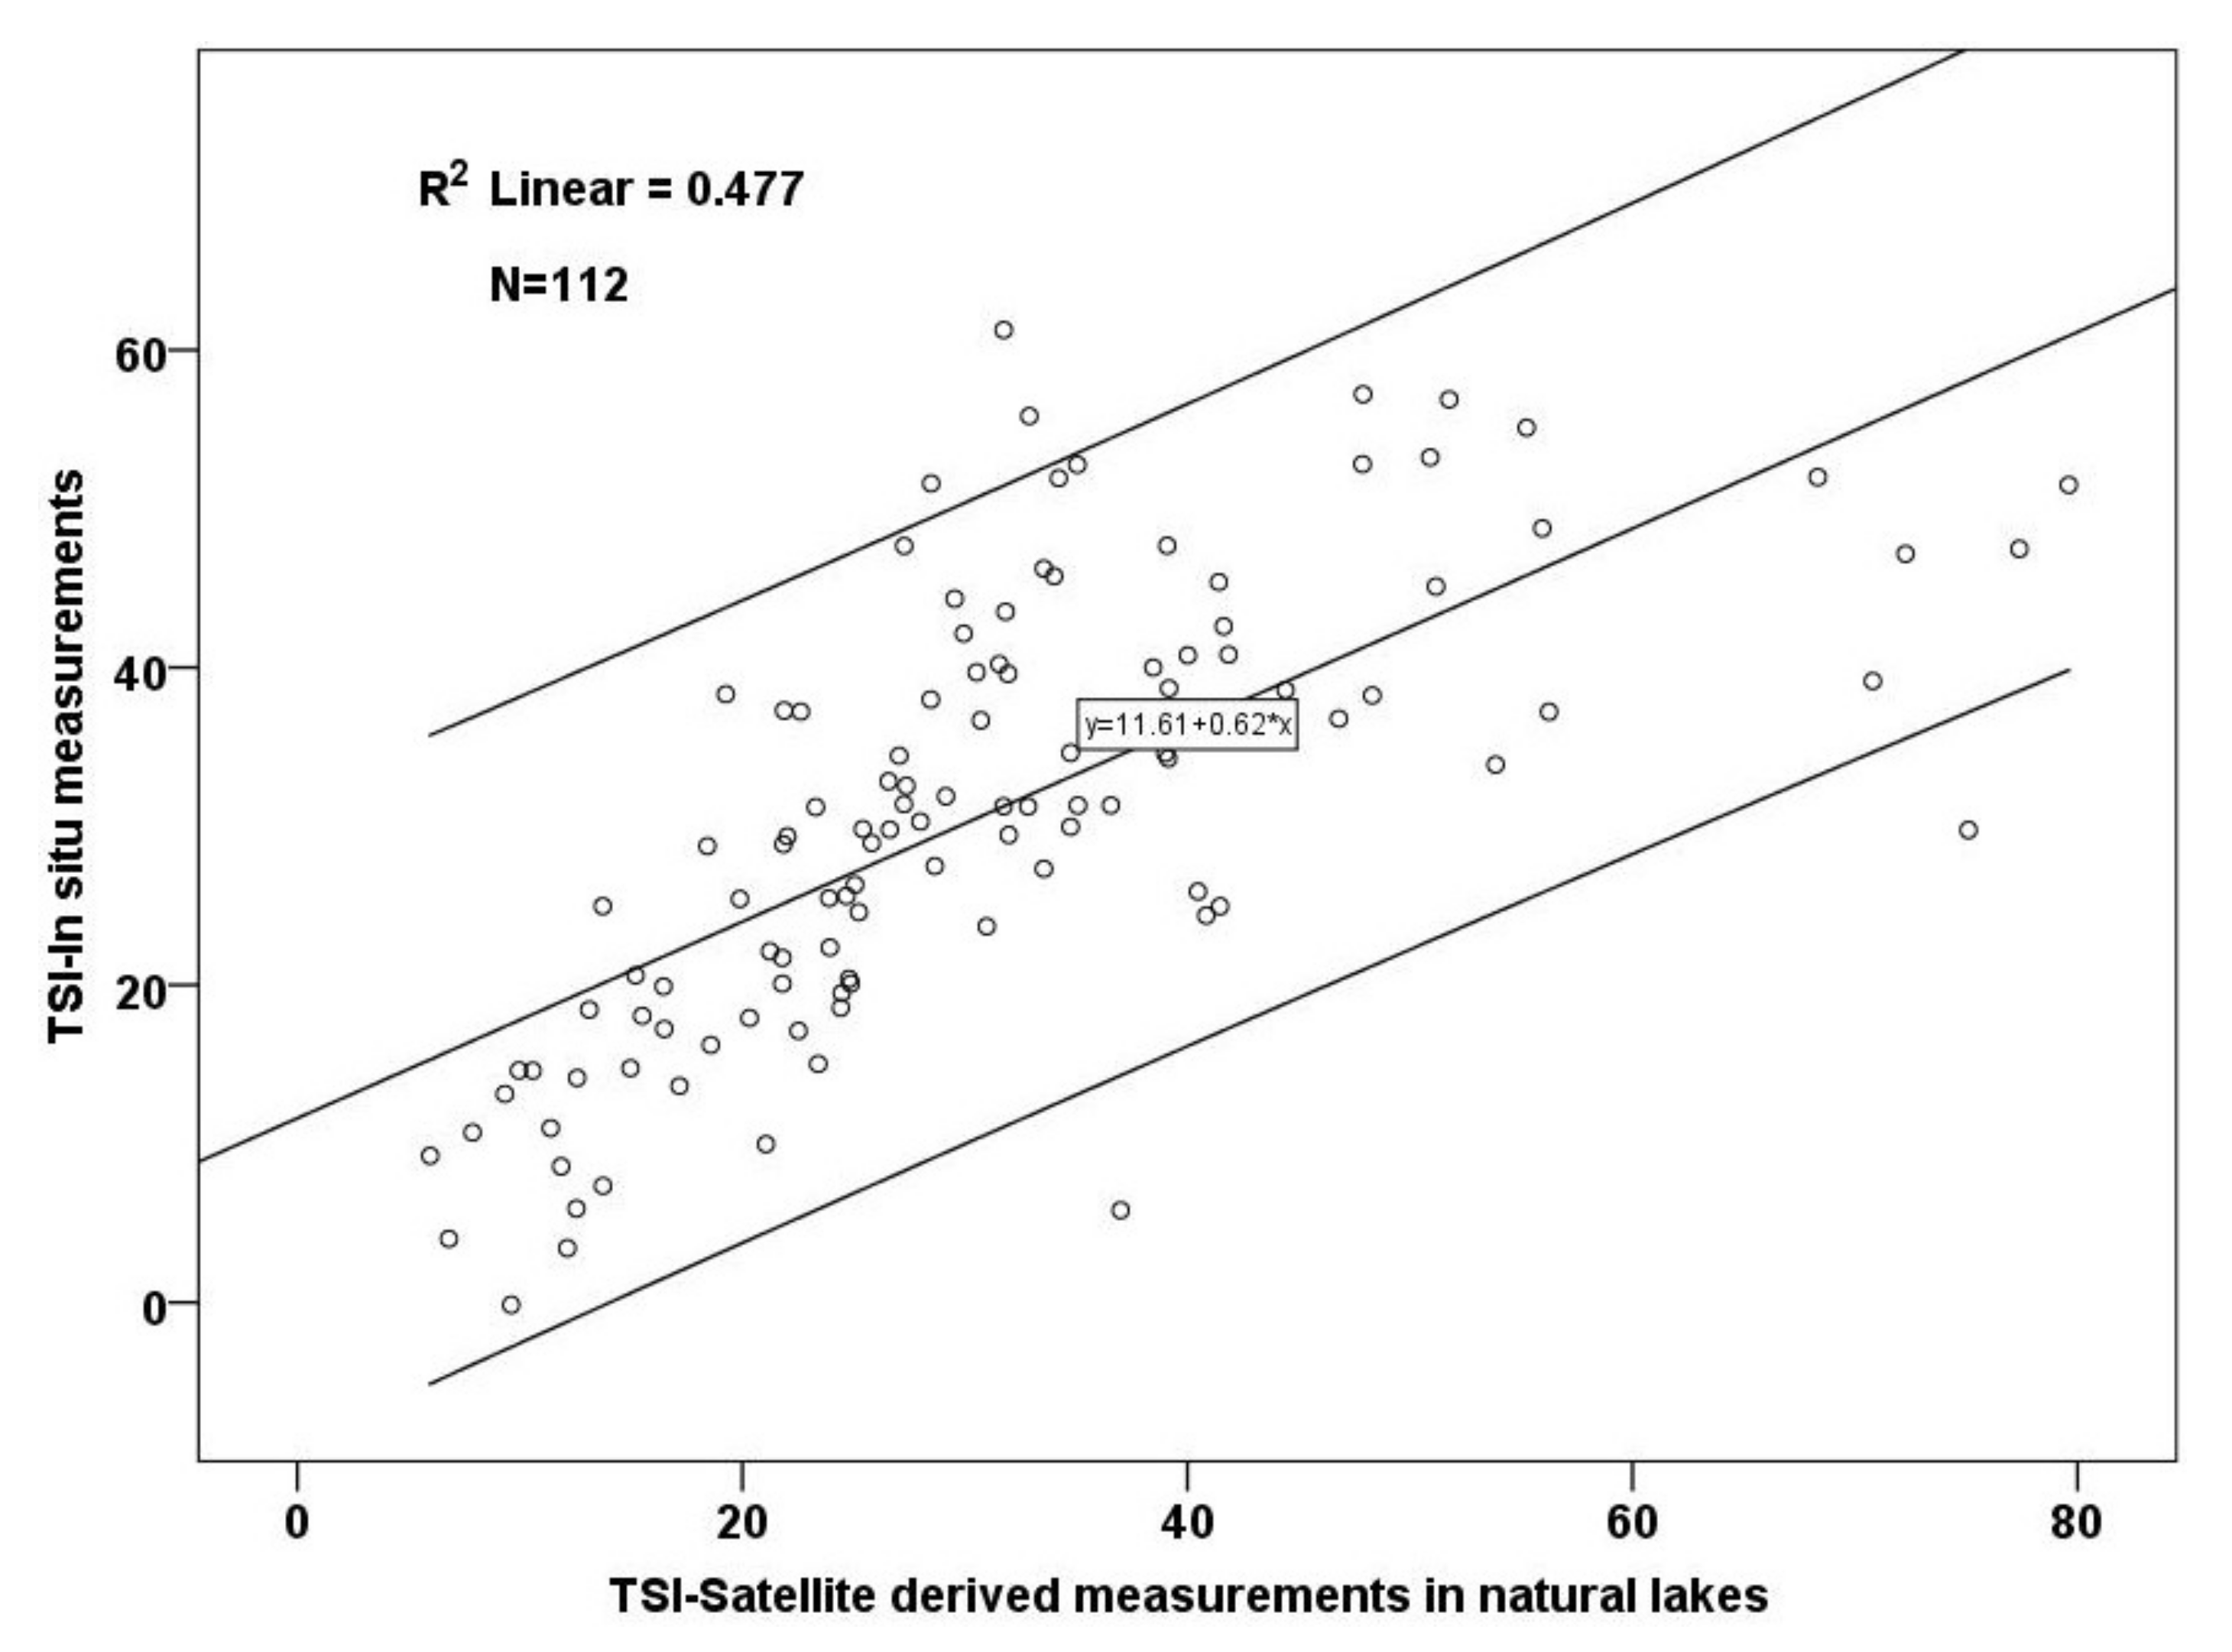
The calculation of in situ TSI values of records belonging to natural lakes categorized them in 5 trophic status classes (1–5), while satellite TSI resulted in 6 classes (1–6), characterizing 5 cases as hypereutrophic (Table 15; Figure 12). Furthermore, the majority of those attributes were characterized as oligotrophic and oligotrophic–mesotrophic based on both calculations, while one case was classified as eutrophic by both calculations.
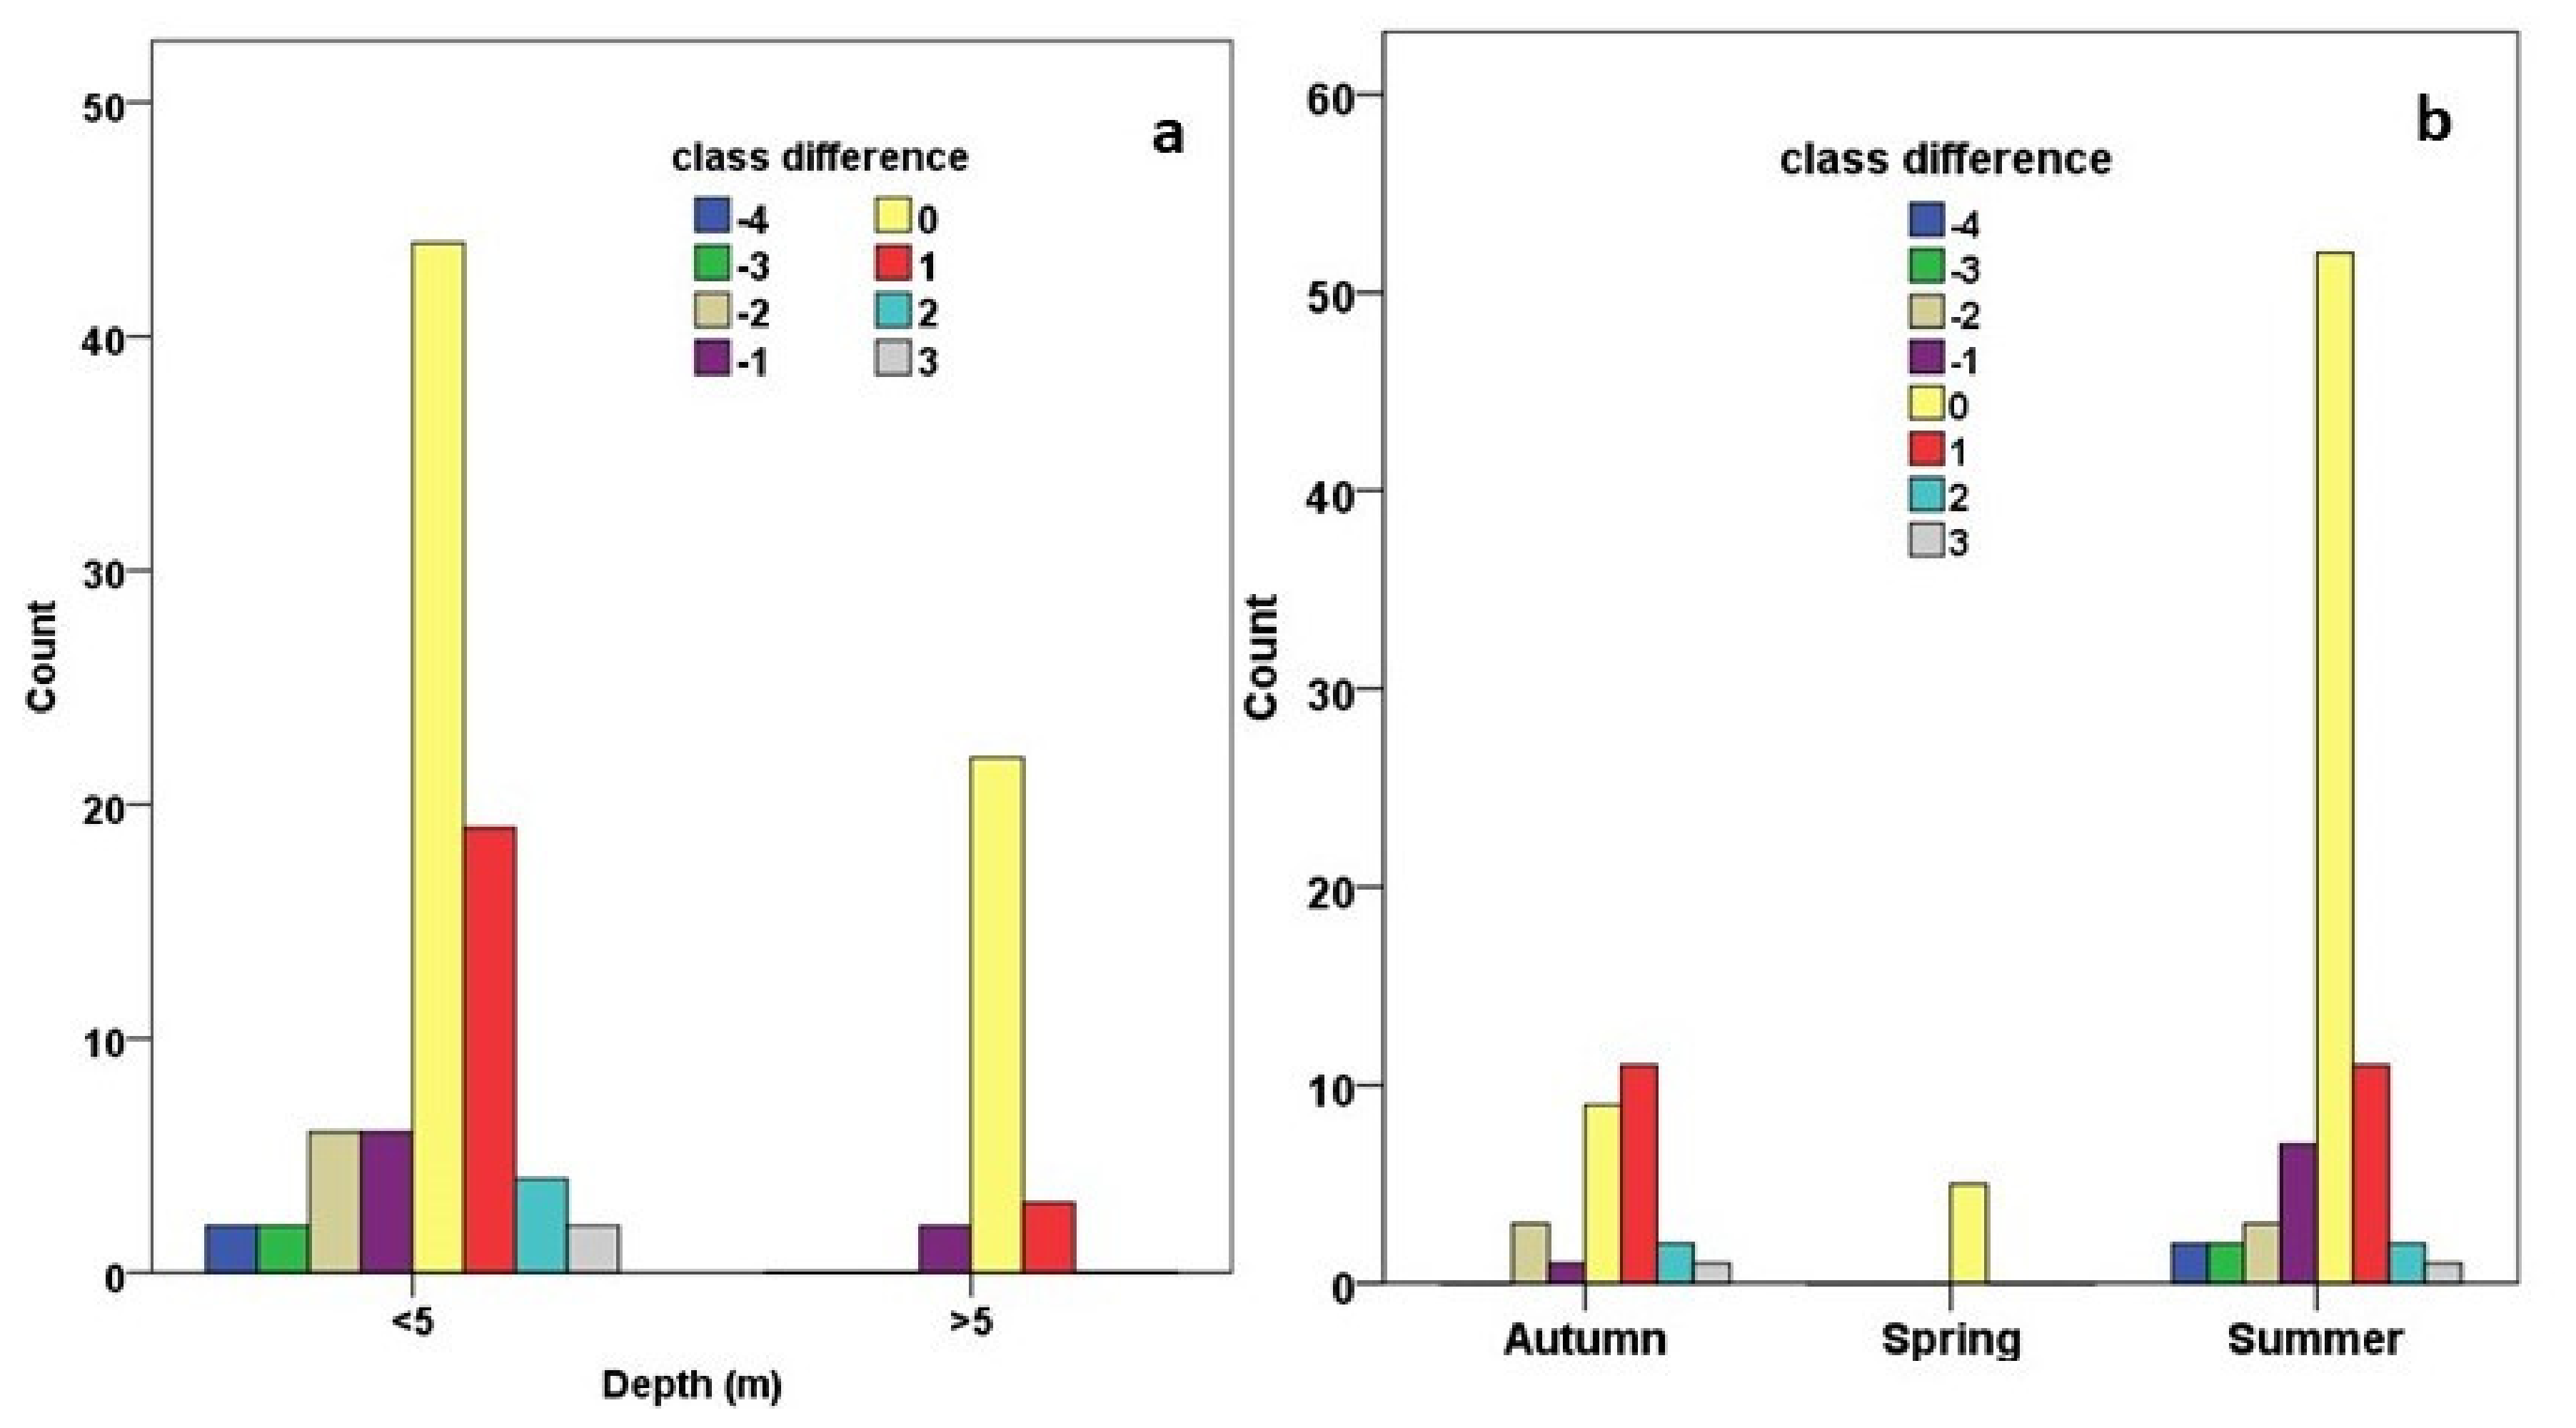
From the total of 112 records concerning the natural lakes, 66 of them were identically classified in the same class, while the 46 that presented differences concern mostly cases that were misclassified by only one class (30 out of 46). Furthermore, 6 cases out of 46 were misclassified by three or four classes away from the respective in situ ones. Trophic status classification of deep natural lakes (average depth > 5 m) was particularly successful since 22 out of 27 cases were identically classified according to both TSI calculations and the remaining 5 cases were misclassified by only one class deviation (Figure 13a). Trophic status classification of shallower natural lakes was also satisfactory since 44 out of 85 cases have no difference regarding their classification; 25 were misclassified by only one class deviation while 10 cases were misclassified by 2-classes from the respective in situ ones. As far as the water sampling seasons are concerned (Figure 13b), calculation of satellite derived average TSI during summer months was also proved successful since 52 out of 80 cases presented no difference compared to respective in situ TSI, while 18 presented misclassifications by one category deviation. Furthermore, all 5 cases concerning spring-monitored lakes were identically classified based on both in situ and satellite TSI values. The calculation of TSI throughout the natural lakes was based on the acquirement of 19 images, while 4 and 36 images were used for calculating the spring and summer TSI, respectively including 5 and 80 attributes.
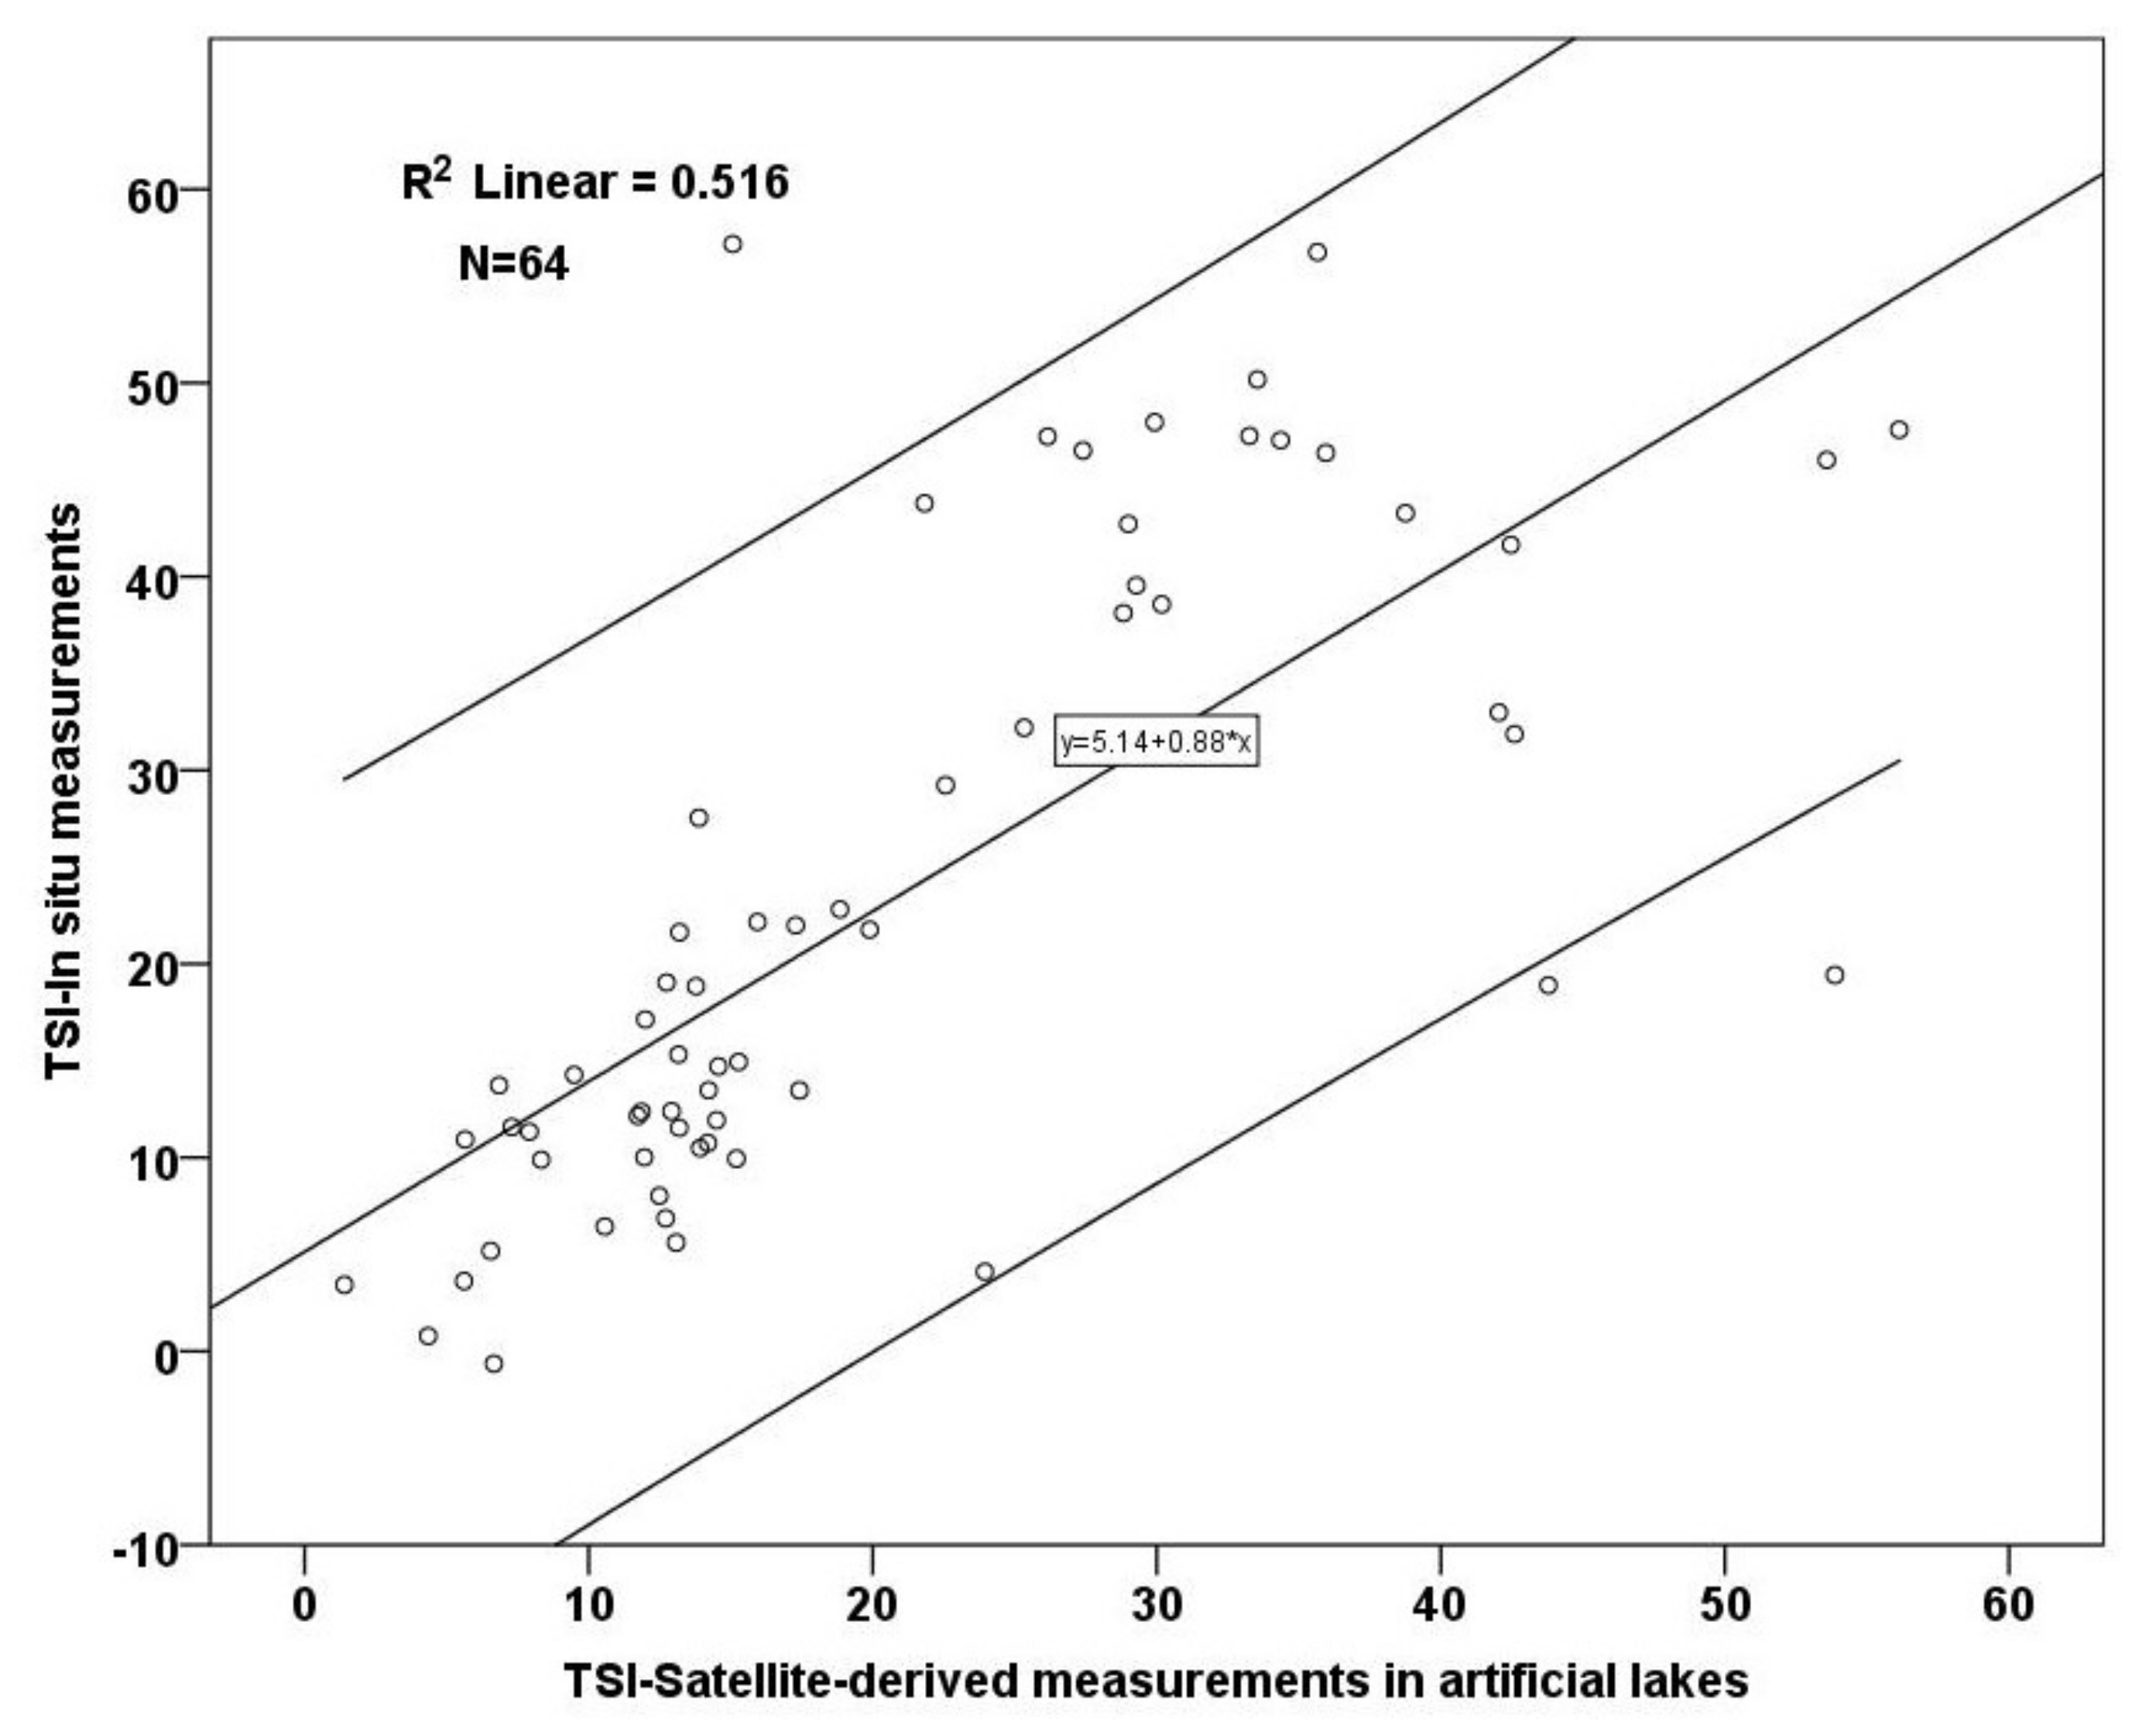
As far as the artificial lakes are concerned, both in situ and satellite TSI calculations resulted in similar trophic status classifications and identical classes (1–4; Table 16; Figure 14). The majority of records concerning artificial lakes are characterized as oligotrophic and oligotrophic–mesotrophic while 3 cases were classified as mesotrophic–eutrophic based on both TSI values (in situ only, models).
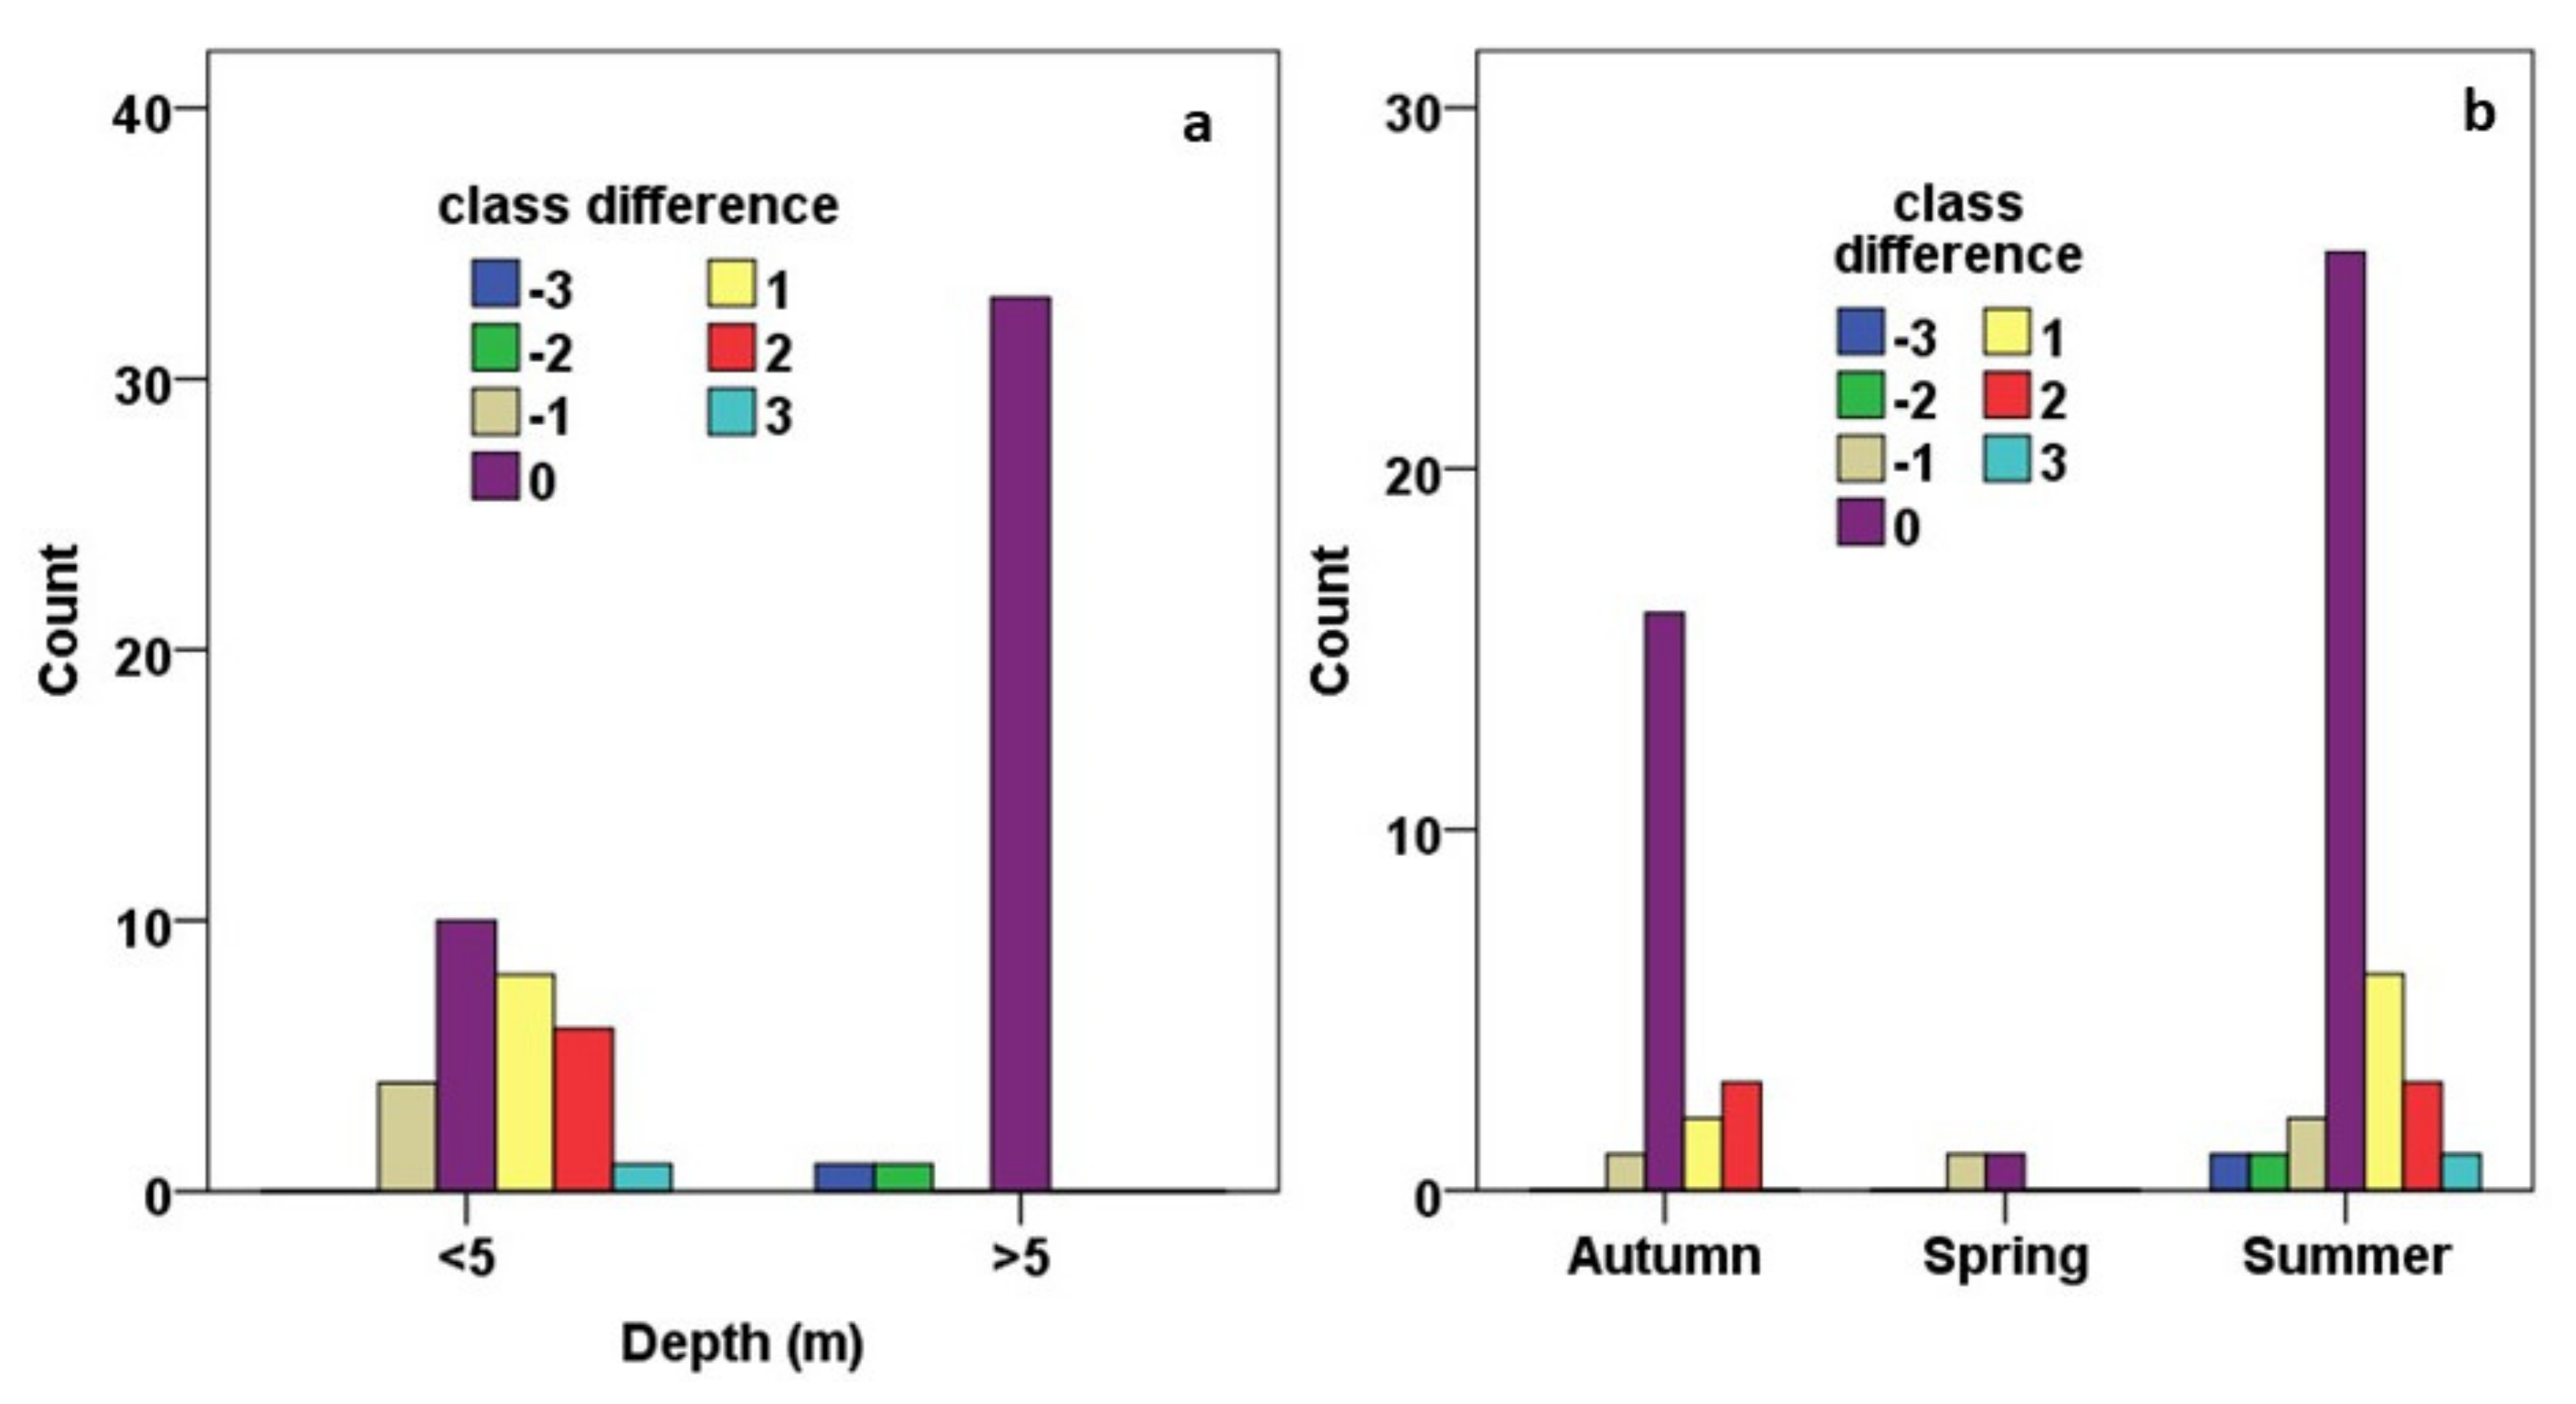
Regarding the trophic status misclassifications of artificial lakes, only 21 out of 64 records were misclassified, and 12 out of 21 were classified in categories that deviated only 1 class away from the respective in situ ones. Observing artificial lakes based on their mean depth (Figure 15a), it is proven that attributes regarding deeper artificial lakes were successfully classified concerning their trophic status since 33 out of 35 presented no classification differentiation and two (2) of them were misclassified in classes that deviated 3 and 2 classes from the in situ ones, respectively. Additionally, cases belonging to shallower artificial lakes were also satisfactorily classified, as 10 out of 29 showed no differentiation and 12 were misclassified by one class difference. Observing the classification of artificial lakes based on the sampling season (Figure 15b), it is clear that not only are summer trophic status classifications successful (26 out of 40 cases presented no differentiation), but also TSI calculations during spring and autumn seasons managed to classify records with great accuracy. TSI classification throughout the artificial lakes during autumn was conducted by using 15 Landsat images, while 2 and 28 images were used for spring and summer seasons, respectively.

5. Discussion

Increasing human activities and industrialization have dramatically degraded lake water quality [79]. Therefore, implementation of WFD in Greece, as well as in other European countries, has as a main aim to ensure sustainable management of lakes. The use of geoinformation technologies—and, in particular, RS and GIS—with conventional in situ water samplings has been proven to be the most efficient, cheap, and reliable tool to monitor WQ parameters in lakes. WFD has been implemented in Greece for at least the last seven years, while numerous in situ measurements of WQ elements provide valuable means to scientists and public authorities to assess and monitor Greek lake WQ. In particular, in situ measurements of Secchi depths and TP concentrations combined with Landsat data have been utilized in this study framework to assess the trophic status of monitored Greek lakes.

5.1. The Significance of Lakes’ Nature concerning the Constituents’ Variance

Exploratory statistical analysis of the available datasets indicated higher Secchi depth values in artificial lakes than in natural lakes during all sampling years (2013–2018), whereas the greatest TP concentrations were detected in natural lakes, illustrating accumulating TP loadings and an increasing tendency throughout the years (2015–2018). Moreover, [31] reported that natural lakes also presented notably higher Chl-a concentrations in relation to reservoirs. The present study findings are also in accordance with those reported in other similar studies. For example, [80] documented that chlorophyll-a concentrations tend to be lower in reservoirs than in natural lakes because higher inorganic turbidity and high flushing rates (low hydraulic residence times) in reservoirs limit the development of phytoplankton biomass. In this way, higher Secchi depth values in artificial lakes indicate clearer water. This is once again interpreted by a higher presence of non-algal turbidities in this type of lake compared to natural lakes [81]. Concerning the TP values, it should be noted that artificial lakes lose nutrients (in particular P) by settling in a downstream direction. The sampling station’s location plays a major role in WQ monitoring. One of the main differences between artificial and natural lakes is that artificial lakes characteristically exhibit a trophic gradient [80], as it may grade from eutrophic (in its upper reaches) to oligotrophic (close to the dam) [82].
Correlation matrix among in situ measurements of monitored WQ parameters throughout all lakes resulted in high and positive correlation between TP and Chl-a (0.85) and high negative relationship between Secchi depth with TP and Chl-a with values of coefficient of determination equal to −0.84 and −0.83, respectively. This finding agrees with results reported in other studies studying natural and artificial lakes around the world [81,83]. For most lakes, chlorophyll a was highly correlated with SD, phosphorus was directly correlated with chlorophyll a and inversely correlated with SD. This is mainly due to the fact that increases in nutrient concentrations (in particular TP) result directly in higher algal growth (Chl-a concentration) and decreased water transparency (Secchi depth) [82]. An additional explanation for the fact that Secchi depth decreases with increasing TP concentration was given by [84], who proved that a proportion of phosphorus may be linked to suspended particles resulting from soil erosion and carried through the river’s downslope.

5.2. MLR Analysis and Resulted Proxies of Studied WQ Parameters

MLR analyses among in situ Secchi depth measurements and Landsat 7 ETM+ and 8 OLI data yielded three (3) optimal Secchi estimation models concerning the assessment of Secchi depth of all lakes (Secchigeneral), natural (Secchinatural) and artificial (Secchiartificial) ones. The Secchigeneral model incorporated a combination of blue, red, green, and SWIR2 bands, while models developed for natural and artificial lakes were accompanied by the insertion of logchl-a as a significant Secchi predictor. The Secchigeneral model was also independently applied to natural and artificial lakes to further explore its effectiveness regarding the nature of lakes. The abovementioned model proved to perform better concerning the natural lakes than the reservoirs, since water transparency in artificial lakes is notably influenced by non-algal sources of turbidity. This rationale is equally supported by [85], who documented that the use of Chl-a to estimate Secchi depth is inappropriate for waters where even moderate amounts of non-algal turbidity are present. On the other hand, [86] proposed taking into consideration this type of turbidity when reservoirs are evaluated. However, many scientists argue that Secchi depth data are calibrated for each lake or reservoir; hence, they may be used for WQ monitoring. Numerous algorithms have been developed for Secchi depth assessment. Relevant literature is enriched with studies that demonstrated strong relationships between Landsat data and in situ Secchi depths by employing mostly the blue, green, red, NIR bands and their ratios of the visible spectrum [8,53,55,87] while in the framework of this paper we also tried and managed to combine other water quality indicators and remotely sensed spectral reflectance. Even more models based on Landsat series data have been empirically developed to map SD for inland and coastal waters [55,65,88]. However, in contrast to our work, those studies utilized calibration and validation datasets sampled from one, two, or a few lakes within a small geographical region, failing to generate a uniform model for the systematic assessment of SD at a greater scale [89]. On the other hand, [89] constructed a general SD power function model (based on red band) established on extensive in situ SD and Landsat reflectance from 225 China lakes, exploring SD spatial variation from 1986 to 2018. This study, in agreement with ours, not only performed regression-related efforts but also confirmed that Landsat series data can result in an accurate long-term estimation of the SD. Another effort to develop a 20-year water clarity census on a broad regional and spatial scale has been conducted by [53], who studied over 10500 lakes of Minnesota state. In particular, a regression model incorporating the blue and red bands of several Landsat series (4 MSS, 7 ETM+, 5 TM) demonstrated that satellite imagery is an accurate method to assess water clarity over a long period of time. Moreover, one of the latest studies that developed a unified model mapping global lake clarity using Landsat imagery was conducted by [90]. In the framework of this research, the combination of trained in situ SD data (3586 data points; 2235 lakes across the world) and match-up Landsat images (TOA; L5-TM; L7-ETM+; L8-OLI) were used to establish various regression models. The proposed model based on the blue/green and red/blue bands demonstrated its applicability to monitor SD in inland bodies across the globe and its stability to variations in the time and space of the optical properties of lakes.
MLR analyses among TP concentrations and Landsat band transformations yielded statistically weak models, whereas further insertion of in situ Chl-a and Secchi depth data improved the results. A general TP assessment model with application on all lakes was produced, including the logarithmic transformation of Chl-a and the band ratio of Ln-Red and Ln-SWIR1 bands with reliable values of tested statistical indices. The fact that no statistically acceptable model was generated for artificial lakes may partly be attributed to the time lag that has been observed for phytoplankton to consume TP in this type of lake. This fact makes the relationship between TP and Chl-a or SD more complicated [44] in reservoirs, and further limnological research is needed to additionally penetrate into the functions of those lakes’ systems. On the other hand, as far as the natural lakes are concerned, Secchi depth proved to be a strong TP predictor. The TP model developed for natural lakes also incorporated the ratio of green and red bands and was accompanied by a high coefficient of determination value. The weakness of MLRs in producing an optimal TP model for artificial lakes urged us to further explore the efficiency of the TP general model on artificial and natural lakes as well. Application of the TPgeneral model to artificial lakes (2018 data) yielded acceptable results, a fact that characterizes it as reliable enough to be used at this type of lake. On the other hand, the specially developed TP model for natural lakes was superior compared to the general one based on basic statistical indices (Spearman and RMSE values).
The authors of [91] suggested that TP could not be assessed using RS techniques because it represents dissolved constituents and is characterized by weak optical characteristics and a low signal noise ratio. Nevertheless, it has been investigated based on its high correlation with optically active constituents [40,42], such as phytoplankton [48] and Secchi depth [92]. Furthermore, data from the Landsat series, among many other satellite sensors, has been widely used for TP assessment in inland waters and especially lakes [34,36]. The authors of [68] selected an MLR model (R = 0.57) using blue, green, red, and NIR Landsat 8 bands to estimate TP among other WQPs in the Nakdong River with weak accuracy. Further TP studies have detected similar correlations between the NIR band and the 3 visible bands (blue, green, and red) and Chl-a [93,94]. Another study that utilized SWIR data for the assessment of phosphate concentrations in Akkulam–Veli Lake, Kerala, India was conducted by [72]. They produced an equation (R2 = 0.5) accompanied, except for the red band, by the MIR (middle infrared; band that followingly was replaced by the SWIR) [95].

5.3. Contribution of SWIR Bands in WQ Monitoring of Case 2 Waters

The results accrued by the herein MLR analyses and the observed weight of SWIR bands regarding the calculation of Secchi depth and TP concentrations constitute a topic that needs further exploration and explanation. The main interpretation is based on the fact that lakes belong to Case 2 waters, which are optically complex. Since those waters are also influenced by inorganic and yellow substances—except for phytoplankton and related particles—it is well recognized that sediment reflectance exceeds the absorptive properties in the NIR and SWIR wavelengths [24,96], and the standard algorithms in use today in Case 1 waters (especially for chlorophyll retrieval from satellite data) break down [24]. Furthermore, according to [72], in cases where there is even a small quantity of impurities, significant changes are caused in the refractive index of a substance with substances containing more polarizer groups. Hence, since, for example, TP is a pollutant with more polarity, it changes the refractive index of water, which in turn changes the reflectance of NIR and MIR in water. In accordance with this theory, there are several studies that have widely used SWIR bands concerning the monitoring of WQ elements in Case 2 waters. The authors of [63] studied the WQ of lakes in eastern Oklahoma and indicated the existence of a relationship between SWIR reflection and algae/plant production by including at least one of the short-wave infrared bands (SWIR) in all of their significant band combinations for chlorophyll-a. The SWIR band of a Sentinel 2A/MSI image was proven once again important for Chl-a estimation (R2 = 0.7) in Chebara Dam (Kenya) [97] and in particular, a second-order polynomial fit was found to be suitable using the reflectance from the difference between the green (B3) and the SWIR-1 (B11) band. Furthermore, [98] studied 11 representative lakes of Greece (included in our dataset) regarding their Chl-a concentrations and managed to establish high correlations between the red and SWIR bands of Landsat 8 images. The authors of [9] also generated a Chl-a three-variable predictive model employing green and SWIR-1 bands and the ratio red/green using EMT+ sensor (R2 = 0.91) in Río Tercero reservoir (Argentina).

5.4. Lakes’ TSI Classification and Exploration of the Factors Affecting Its Accuracy

In the framework of this study, assessment models of the studied WQPs (TP, Secchi depth) were developed. Then, Carlson’s Trophic State Index (TSI) was applied to assess the trophic status initially of all studied lakes and afterwards separately of natural and artificial ones. TSI can be successfully monitored for lakes using satellite techniques, and this methodology has been documented in numerous studies [99,100,101]. Trophic status classification based on satellite-derived TSI of all cases was coincident with the respective in situ at a percentage of 58.5%, while 28.5% of the misclassified cases concerned a deviation at only one (1) trophic class. Satellite TSI calculation independent of cases regarding natural and artificial lakes yielded results that were highly coincident with the in situ derived classes (58.9% and 67.2%, respectively). Considering the mean depth and nature of the lakes, deeper (>5 m) and natural lakes were more successfully classified compared to shallow and artificial ones. Deeper lakes are less affected by the bottom reflectance, a fact that is once more verified based on the hereby findings. Light bottom reflection in shallow waters may be a result of the above-water remotely sensed reflectance spectra; hence, it cannot be very reliable. Therefore, the estimation of WQPs in shallow waters should be validated using in situ data [102].
Concerning the higher TSI misclassification in artificial lakes, it should be noted that TP and Secchi depth are far more variable in reservoirs than in natural lakes [81]. Most models have been developed with the assumption that phosphorus is the primary factor limiting algal growth [103]. Nevertheless, there are other nutrients, such as nitrogen, or other factors (e.g., incident light) that may also limit algal production, particularly in reservoirs [82]. The above-mentioned rationales in combination with the fact that in this study TP concentration of artificial lakes has been assessed based on the TPgeneral model, may partly explain the fact that TSI evaluation is less robust in those impoundments.
A significant aspect concerning the contribution of the present study lies in the fact that the study area includes 50 different lake systems of varied chemistry, trophic level, from different regions of Greece, and WQ elements collected over different seasons. WQ assessment models have been developed concerning a wide range of limnological conditions with emphasis on whether the lakes are natural or artificial, deep (>5 m mean depth), or shallow. WQ empirical models are priceless means for trophic status classification for the majority of Greek lakes, especially when in situ data are limited. In addition to their proven predictive performance, it should be noted that, based on the validation processes, they exhibited spatial and temporal stability to variations of the optical properties of the lakes. Furthermore, according to [104], Landsat OLI and ETM+ have similar wavelength ranges, and based on the results yielded by [44], excellent consistency was also found between those sensors in the blue, green, red, and NIR regions. Hence, the developed models also accommodate the spectral configuration differences among the Landsat sensors used. However, those empirical models are accompanied by several restrictions, such as the accuracy of sampling points’ geolocation and the incorporation of many sampling seasons, while the latter plays a crucial role in TP loadings and Secchi depth values. Moreover, additional and deeper limnological research is needed, mostly oriented toward the primary limiting factors of Chl-a production and the predominant sources of turbidity (algal/non-algal), particularly in reservoirs. A wider limnological research study would provide valuable information about the lake-wide stratification effects, water movement, and other ecosystem-interaction effects on lake water quality, especially for areas that cannot be accessed and sampled.

6. Conclusions

This study developed an approach to modeling Greek lakes’ water quality by combining EO data (Landsat 7 ETM+ and 8 OLI) with in situ measurements of TP and Secchi depths derived from the application of WFD in Greece. Furthermore, based on our previous study [31] and the derived Chl-a empirical models, the WQ assessment models developed herein contribute to the evaluation of the trophic status of all monitored lakes (N = 50; National Monitoring Lake Network) by applying Carlson’s trophic index.
Stepwise MLR analyses incorporated, except for Landsat reflectance bands, in situ measurements of water constituents that, according to the relevant literature, play a role as a proxy of other WQ parameters. Even though estimation of non-optically active constituents of WQ remains a complex challenge for remote sensing, those enhanced analyses managed to explore and highlight the most significant predictors of TP and Secchi depth’s values of all lakes but also separately of artificial and natural ones.
According to recent literature, even though physical and bio-optical models are considered more robust, they require deep knowledge, collection, and parameterization of certain spectral features. Furthermore, even deep learning approaches (belonging to empirical/non-linear methods) still hide issues regarding the appropriate balance between the depth of the network and computational efficiency [19]. On the other hand, empirical methods (mostly linear approaches) have the benefit of being easy to implement and straightforward for data processing, and in some cases, as in [105], proved to outperform a range of bio-optical methods when applied to regional datasets. Based on this perspective, empirical separate models’ development (general, natural, artificial) for the assessment of certain WQ parameters (TP, Secchi depth) provides a great opportunity for water resources managers to gain information at any time about the trophic status of any lake in Greece. A reliable prediction of lake trophic status, as the one proposed herein, will further support the monitoring of eutrophication and the drivers of its dynamics, especially nowadays that lakes are undergoing the dual influence of human activities and climate change.
Current approaches for modeling WQ elements in lakes have limited transferability (in space and time). The hereby delivered WQ models may be applicable and deliver fairly acceptable results in lakes outside Greece. However, even though there is a strong possibility that those models will be effective only within the borders of Greece, eutrophication has evolved into such a growing public concern that its investigation and monitoring is considered essential and important even at a country level. In this way, this study supports the aims of WFD and facilitates the continuous water quality monitoring of Greek lakes.
The present study can be extended in different directions; the ultimate goal is the development of a robust tool monitoring WQ parameters in various scales and of a direct and reliable assessment of trophic status for all Greek lakes. However, future work initially includes the harmonization of Sentinel and Landsat images with the main aims of investigating the performance of the hereby developed models if combined with Sentinel images and the minimization of the great time windows (>±7 days) between in situ and satellite data. Moreover, based on the continuous operation of WFD in Greece, at least until 2023, ongoing quality control tests will be conducted to further improve those models’ efficiency. Furthermore, since the DOS1 atmospheric correction method has not been validated, one more key priority future action is the application of alternative atmospheric correction methods with the principle goal of exploring their wider effect on models’ predictive ability. In addition to the utilized methodology, and given the nature of the available data, which is non-parametric, the authors intend to employ non-linear methods in the near future. These methods offer, according to the literature, great potential for WQ parameter estimation, and a sensitivity analysis among several empirical methods would contribute to a better understanding of WQ constituents’ behavior and possibly to their more accurate assessment. The authors hope that successfully accomplishing all aforementioned research tasks, on condition of the continuous updating of wide WQ datasets, will provide the best opportunity for researchers and public authorities to guide and eventually manage sustainably public safety decisions and effective protection measures.

Author Contributions

Conceptualization, V.M.; methodology, V.M., E.D., G.P.P. and D.K.; data elaboration, V.M.; writing—original draft preparation V.M.; writing—review and editing V.M., G.P.P., E.D. and D.K.; supervision, G.P.P., D.K. and E.D. All authors have read and agreed to the published version of the manuscript.

Funding

This research received no external funding.

Data Availability Statement

In situ data utilized in the study is available upon request.

Acknowledgments

The authors wish to thank for the freely shared data used in this study. Those data were collected in the framework of the National Water Monitoring Network for lakes, according to the Joint Ministerial Decision 140384/2011, implemented by The Goulandris Natural History Museum, Greek Biotope/Wetland Center (EKBY). The network is supervised by the Directorate for the Protection and Management of Water Resources of the Special Secretariat for Waters of the Ministry of Environment and Energy.

Conflicts of Interest

The authors declare no conflict of interest.

References

  1. Whyte, A.; Feredinos, K.; Petropoulos, G.P. A new synergistic approach for monitoring wetlands using Sentinels -1 and 2 data with object-based Machine Learning algorithms. Environ. Model Softw. 2018, 104, 40–57. [Google Scholar] [CrossRef] [Green Version]
  2. Michalak, A. Study role of climate change in extreme threats to water quality. Nature 2016, 535, 349–350. [Google Scholar] [CrossRef] [PubMed]
  3. El-Alem, A.; Chokmani, K.; Laurion, I.; El-Adlouni, S.E. Comparative analysis of four models to estimate chlorophyll—A concentration in case-2 waters using MODerate resolution imaging spectroradiometer (MODIS) imagery. Remote Sens. 2012, 4, 2373–2400. [Google Scholar] [CrossRef] [Green Version]
  4. Alparslan, E.; Coskun, H.G.; Alganci, U. Water quality determination of Küçükçekmece Lake, Turkey by using multispectral satellite data. Sci. World J. 2009, 9, 1215–1229. [Google Scholar] [CrossRef] [PubMed] [Green Version]
  5. Shafique, N.A.; Fulk, F.A.; Autrey, B.C.; Flotemersch, J.E. Hyperspectral remote sensing of water quality parameters for large rivers in the Ohio river basin. In Proceedings of the Ohio River Basin Consortium for Research and Education, Marietta, OH, USA, 5–7 November 2003. [Google Scholar]
  6. Bonansea, M.; Rodriguez, C.; Pinotti, L. Assessing the potential of integrating Landsat sensors for estimating chlorophyll-a concentration in a reservoir. Hydrol. Res. 2018, 49, 1608–1617. [Google Scholar] [CrossRef]
  7. Moore, T.S.; Dowell, M.D.; Bradt, S.; Verdu, A.R. An optical water type framework for selecting and blending retrievals from bio-optical algorithms in lakes and coastal waters. Remote Sens. Environ. 2014, 143, 97–111. [Google Scholar] [CrossRef] [Green Version]
  8. Giardino, C.; Pepe, M.; Brivio, P.A.; Ghezzi, P.; Zilioli, E. Detecting chlorophyll, Secchi disk depth and surface temperature in a sub-alpine lake using Landsat imagery. Sci. Total Environ. 2001, 268, 19–29. [Google Scholar] [CrossRef]
  9. He, W.; Chen, S.; Liu, X.; Chen, J. Water quality monitoring inland water body through remote sensing—A case study of Guanting Reservoir in Beijing, China. Front. Environ. Sci. Engin. China 2008, 2, 163–171. [Google Scholar] [CrossRef]
  10. Dekker, A.G.; Malthus, T.J.; Seyhan, E. Quantitative modeling of inland water quality for high resolution MSS system. IEEE Trans. Geosci. Remote Sens. 1991, 29, 89–95. [Google Scholar] [CrossRef]
  11. Poor, N.D. Effect of lake management efforts on the trophic state of a subtropical shallow lake in Lakeland, Florida, USA. Water Air Soil Pollut. 2010, 207, 333–347. [Google Scholar] [CrossRef]
  12. Brivio, P.A.; Giardino, C.; Zilioli, E. Determination of chlorophyll concentration changes in Lake Garda using an image-based radiative transfer code for Landsat TM images. Int. J. Remote Sens. 2001, 22, 487–502. [Google Scholar] [CrossRef]
  13. Pozdnyakov, D.; Shuchman, R.; Korosov, A.; Hatt, C. Operational algorithm for the retrieval of water quality in the Great Lakes. Remote Sens. Environ. 2005, 97, 352–370. [Google Scholar] [CrossRef]
  14. Tyler, A.N.; Svab, E.; Preston, T.; Presing, M.; Kovacs, W.A. Remote sensing of the water quality of shallow lakes: A mixture modeling approach to quantifying phytoplankton in water characterized by high suspended sediment. Int. J. Remote Sens. 2006, 27, 1521–1537. [Google Scholar] [CrossRef]
  15. Chatziantoniou, A.; Petropoulos, G.P.; Psomiadis, E. Co-Orbital Sentinel 1 and 2 for LULC mapping with emphasis on wetlands in a Mediterranean setting based on Machine Learning. Remote Sens. 2017, 9, 1259. [Google Scholar] [CrossRef] [Green Version]
  16. Haddad, K.D.; Harris, B.A. Use of remote sensing to assess estuarine habitats. In Proceedings of the 4th Symposium on Coastal and Ocean Management; Magoom, O.T., Converse, H., Miner, D., Clark, D., Tobin, L.T., Eds.; American Society of Civil Engineers: New York, NY, USA, 1985; pp. 662–675. [Google Scholar]
  17. Morel, A.; Gordon, H.R. Report of the working group on water colour. Bound. -Layer Meteorol. 1980, 18, 343–355. [Google Scholar] [CrossRef]
  18. Austin, R.W.; Petzold, T.J. Water Colour Measurements. In Oceanography from Space; Gower, J., Ed.; Plenum: New York, NY, USA, 1981; pp. 239–256. [Google Scholar]
  19. Sagan, V.; Peterson, T.K.; Maimaitijiang, M.; Sidike, P.; Sloan, J.; Greeling, A.B.; Samar, M.; Adams, C. Monitoring inland water quality using remote sensing: Potential and limitations of spectral indices, bio-optical simulations, machine learning, and cloud computing. Earth-Sci. Rev. 2020, 205, 103187. [Google Scholar] [CrossRef]
  20. Topp, S.; Pavelsky, T.; Jensen, D.; Simard, M.; Ross, M. Research trends in the use of remote sensing for inland water quality science: Moving towards multidisciplinary applications. Water 2020, 12, 169. [Google Scholar] [CrossRef] [Green Version]
  21. Gholizadeh, M.; Melesse, A.; Reddi, L. A comprehensive review on water quality parameters estimation using remote sensing techniques. Sensors 2016, 16, 1298. [Google Scholar] [CrossRef] [Green Version]
  22. Odermatt, D.; Gitelson, A.; Vittorio, E.V.; Schaepman, M. Review of constituent retrieval in optically deep and complex waters from satellite imagery. Remote Sens. Environ. 2012, 118, 116–126. [Google Scholar] [CrossRef] [Green Version]
  23. Gordon, H.R.; Morel, A. Remote Assessment of Ocean Color for Interpretation of Satellite Visible Imagery. A Review, Lecture Notes on Coastal and Estuarine Studies; Barber, R.T., Mooers, N.K., Bowman, M.J., Zeitzschel, B., Eds.; Springer: New York, NY, USA, 1983; p. 114. [Google Scholar]
  24. IOCCG. Remote Sensing of Ocean Colour in Coastal, and Other Optically-Complex, Waters; Reports of the International Ocean-Colour Coordinating Group, No. 3; Sathyendranath, S., Ed.; IOCCG: Dartmouth, NH, Canada, 2000. [Google Scholar]
  25. Spyrakos, E.; O’donnell, R.; Hunter, P.D.; Miller, C.; Scott, M.; Simis, S.G.; Neil, C.; Barbosa, C.C.; Binding, C.E.; Bradt, S.; et al. Optical types of inland and coastal waters. Limnol. Oceanogr. 2018, 63, 846–870. [Google Scholar] [CrossRef] [Green Version]
  26. Giardino, C.; Bresciani, M.; Cazzaniga, I.; Schenk, K.; Rieger, P.; Braga, F.; Matta, E.; Brando, V.E. Evaluation of multi-resolution satellite sensors for assessing water quality and bottom depth of lake garda. Sensors 2014, 14, 24116–24131. [Google Scholar] [CrossRef] [PubMed] [Green Version]
  27. Allan, M.G.; Hamilton, D.P.; Hicks, B.J.; Brabyn, L. Landsat remote sensing of chlorophyll a concentrations in central north island lakes of New Zealand. Int. J. Remote Sens. 2011, 32, 2037–2055. [Google Scholar] [CrossRef]
  28. Kim, S.I.; Kim, H.C.; Hyun, C.U. High resolution ocean color products estimation in Fjord of Svalbard, arctic sea using Landsat-8 oli. Korean J. Remote Sens. 2014, 30, 809–816. [Google Scholar] [CrossRef] [Green Version]
  29. Markogianni, V.; Dimitriou, E.; Karaouzas, I. Water quality monitoring and assessment of an urban Mediterranean lake facilitated by remote sensing applications. Environ. Monit. Assess. 2014, 186, 5009–5026. [Google Scholar] [CrossRef] [PubMed]
  30. Markogianni, V.; Kalivas, D.; Petropoulos, G.; Dimitriou, E. An appraisal of the potential of Landsat 8 in estimating chlorophyll-a, ammonium concentrations and other water quality indicators. Remote Sens. 2018, 10, 1018. [Google Scholar] [CrossRef] [Green Version]
  31. Markogianni, V.; Kalivas, D.; Petropoulos, G.P.; Dimitriou, E. Estimating Chlorophyll-a of Inland Water Bodies in Greece Based on Landsat Data. Remote Sens. 2020, 12, 2087. [Google Scholar] [CrossRef]
  32. Hans, H.; Haan, J.; Jordans, R.; Vos, R.; Peters, S.; Rijkeboer, M. Towards airborne remote sensing of water quality in The Netherlands—Validation and error analysis. ISPRS J. Photogramm. Remote Sens. 2002, 57, 171–183. [Google Scholar]
  33. Correll, D.L. Phosphorus: A rate limiting nutrient in surface waters. Poult. Sci. 1999, 78, 674–682. [Google Scholar] [CrossRef]
  34. Kutser, T.; Arst, H.; Miller, T.; Käärmann, L.; Milius, A. Telespectrometrical estimation of water transparency, chlorophyll-a and total phosphorus concentration of Lake Peipsi. Int. J. Remote Sens. 1995, 16, 3069–3085. [Google Scholar] [CrossRef]
  35. Wang, Y.P.; Xia, H.; Fu, J.; Sheng, G.Y. Water quality change in reservoirs of Shenzhen, China: Detection using LANDSAT/TM data. Sci. Total Environ. 2004, 328, 195–206. [Google Scholar] [CrossRef]
  36. Wu, C.F.; Wu, J.P.; Qi, J.G.; Zhang, L.S.; Huang, H.Q.; Lou, L.P.; Chen, Y. Empirical estimation of total phosphorus concentration in the mainstream of the Qiantang River in China using Landsat TM data. Int. J. Remote Sens. 2010, 31, 2309–2324. [Google Scholar] [CrossRef]
  37. Smith, V.H. The nitrogen and phosphorus dependence of algal biomass in lakes: An empirical and theoretical analysis. Limnol. Oceanogr. 1982, 27, 1101–1112. [Google Scholar] [CrossRef]
  38. Malve, O.; Qian, S.S. Estimating nutrients and chlorophyll a relationships in Finnish lakes. Environ. Sci. Technol. 2006, 40, 7848–7853. [Google Scholar] [CrossRef] [PubMed]
  39. Healey, F.P.; Hendzel, L.L. Indicators of phosphorus and nitrogen deficiency in five algae in culture. Can. J. Fish Aquat. Res. 1979, 36, 1364–1369. [Google Scholar] [CrossRef]
  40. Busse, L.B.; Simpson, J.C.; Cooper, S.D. Relationships among nutrients, algae, and land use in urbanized southern California streams. Can. J. Fish. Aquat. Sci. 2006, 63, 2621–2638. [Google Scholar] [CrossRef]
  41. Akbar, T.A.; Hassan, Q.K.; Achari, G. A remote sensing based frame work for predicting water quality of different source waters. Int. Arch. Photogramm. Remote Sens. Spat. Inf. Sci. 2010, 34, 1–4. [Google Scholar]
  42. Song, K.; Zhang, B.; Wang, Z.; Li, F.; Duan, H.; Guo, Y. Water TOC and TP concentration estimation using Landsat TM data with empirical algorithms in Chagan lake, China. In Proceedings of the 2006 IEEE International Symposium on Geoscience and Remote Sensing, Denver, CO, USA, 31 July–4 August 2006; pp. 3438–3442. [Google Scholar]
  43. Carlson, R.E. A trophic state index for lakes. Limnol. Oceanogr. 1977, 22, 361–369. [Google Scholar] [CrossRef] [Green Version]
  44. Song, K.; Li, L.; Li, S.; Tedesco, L.; Hall, B.; Li, L. Hyperspectral Remote Sensing of Total Phosphorus (TP) in Three Central Indiana Water Supply Reservoirs. Water Air Soil Pollut. 2012, 223, 1481–1502. [Google Scholar] [CrossRef]
  45. Fuller, L.M.; Aichele, S.S.; Minnerick, R.J. Predicting Water Quality by Relating Secchi-Disk Transparency and Chlorophyll a Measurements to Satellite Imagery for Michigan Inland Lakes, August 2002; US Geological Survey Scientific Investigations Report; US Geological Survey: Denver, CO, USA, 2004.
  46. Jiang, D.; Matsushita, B.; Setiawan, F.; Vundo, A. An improved algorithm for estimating the Secchi disk depth from remote sensing data based on the new underwater visibility theory. ISPRS J. Photogramm. Remote Sens. 2019, 152, 13–23. [Google Scholar] [CrossRef]
  47. McCullough, I.M.; Loftin, C.S.; Sader, S.A. Combining lake and watershed characteristics with Landsat TM data for remote estimation of regional lake clarity. Remote Sens. Environ. 2012, 123, 109–115. [Google Scholar] [CrossRef]
  48. Baban, S.M.J. Detecting water quality parameters in the norfolk broads, U.K., using landsat imagery. Int. J. Remote Sens. 1993, 14, 1247–1267. [Google Scholar] [CrossRef]
  49. Nelson, S.A.C.; Soranno, P.A.; Cheruvelil, K.S.; Batzli, S.A.; Skole, D.L. Regional Assessment of lake water clarity using satellite remote sensing. J. Limnol. 2003, 62, 27–32. [Google Scholar] [CrossRef] [Green Version]
  50. Hicks, B.J.; Stichbury, G.A.; Brabyn, L.K.; Allan, M.G.; Ashraf, S. Hindcasting water clarity from Landsat satellite images of unmonitored shallow lakes in the Waikato region, New Zealand. Environ. Monit. Assess. 2013, 185, 7245–7261. [Google Scholar] [CrossRef]
  51. Wu, G.; de Leeuw, J.; Skidmore, A.K.; Prins, H.H.T.; Liu, Y. Comparison of MODIS and Landsat TM5 images for mapping tempo-spatial dynamics of Secchi disk depths in Poyang Lake National Nature Reserve, China. Int. J. Remote Sens. 2008, 29, 2183–2198. [Google Scholar] [CrossRef]
  52. Matthews, M.W. A current review of empirical procedures of remote sensing in Inland and near-coastal transitional waters. Int. J. Remote Sens. 2011, 32, 6855–6899. [Google Scholar] [CrossRef]
  53. Olmanson, L.G.; Kloiber, S.M.; Bauer, M.E.; Brezonik, P.L. Image Processing Protocol for Regional Assessments of Lake Water Quality; University of Minnesota: St. Paul, MN, USA, 2001. [Google Scholar]
  54. Megard, R.O.; Settles, J.C.; Boyer, H.A.; Combs, W.S. Light, Secchi Disks, and Trophic States. Limnol. Oceanogr. 1980, 25, 373–377. [Google Scholar] [CrossRef]
  55. Olmanson, L.G.; Bauer, M.E.; Brezonik, P.L. A 20-year Landsat water clarity census of Minnesota’s 10,000 lakes. Remote Sens. Environ. 2008, 112, 4086–4097. [Google Scholar] [CrossRef]
  56. Peckham, S.D.; Chipman, J.W.; Lillesand, T.M.; Dodson, S.I. Alternate stable states and the shape of the lake trophic distribution. Hydrobiologia 2006, 571, 401–407. [Google Scholar] [CrossRef]
  57. Nauman, E. The Scope of chief problems of regional limnology. Int. Rev. Ges. Hydrobiol. 1929, 21, 423. [Google Scholar] [CrossRef]
  58. Mavromati, E.; Kagalou, I.; Kemitzoglou, D.; Apostolakis, A.; Seferlis, M.; Tsiaoussi, V. Relationships among land use patterns, hydromorphological features and physicochemical parameters of surface waters: WFD lake monitoring in Greece. Environ. Process. 2018, 5, 139–151. [Google Scholar] [CrossRef]
  59. American Public Health Association (APHA). Standard Methods for the Examination of Water and Wastewater, 17th ed.; American Public Health Association: Washington, DC, USA, 1989. [Google Scholar]
  60. Kloiber, S.M.; Brezonik, P.L.; Olmanson, L.G.; Bauer, M.E. A procedure for regional lake water clarity assessment using Landsat multispectral data. Remote Sens. Environ. 2002, 82, 38–47. [Google Scholar] [CrossRef]
  61. Hellweger, F.L.; Schlosser, P.; Lall, U.; Weissel, J.K. Use of satellite imagery for water quality studies in New York Harbor. Estuar. Coast. Shelf Sci. 2004, 61, 437–448. [Google Scholar] [CrossRef]
  62. Chu, H.-J.; Kong, S.-J.; Chang, C.-H. Spatio-temporal water quality mapping from satellite images using geographically and temporally weighted regression. Int. J. Appl. Earth Obs. Geoinf. 2018, 65, 1–11. [Google Scholar] [CrossRef]
  63. Barrett, D.C.; Frazier, A.E. Automated Method for Monitoring Water Quality Using Landsat Imagery. Water 2016, 8, 257. [Google Scholar] [CrossRef] [Green Version]
  64. Japitana, M.; Burce, M. A Satellite-based Remote Sensing Technique for Surface Water Quality Estimation. Eng. Technol. Appl. Sci. Res. 2019, 9, 3965–3970. [Google Scholar] [CrossRef]
  65. Doña, C.; Sánchez, M.J.; Caselles, V.; Domínguez, J.A.; Camacho, A. Empirical Relationships for Monitoring Water Quality of Lakes and Reservoirs Through Multispectral Images. IEEE J. Sel. Top. Appl. Earth Obs. Remote. Sens. 2014, 7, 1632–1641. [Google Scholar] [CrossRef]
  66. Dancey, C.P.; Reidy, J. Statistics without Maths for Psychology, 4th ed.; Pearson Education: Harlow, UK, 2007. [Google Scholar]
  67. McKinna, L.; Werdell, P. Approach for identifying optically shallow pixels when processing ocean-color imagery. Opt. Express 2018, 26, A915–A928. [Google Scholar] [CrossRef]
  68. Lim, J.; Choi, M. Assessment of water quality based on Landsat 8 operational land imager associated with human activities in Korea. Environ. Monit. Assess. 2015, 187, 384. [Google Scholar] [CrossRef]
  69. Isenstein, E.M.; Park, M.-H. Assessment of nutrient distribution in Lake Champlain using satellite remote sensing. J. Environ. Sci. 2014, 26, 1831–1836. [Google Scholar] [CrossRef]
  70. Chen, J.; Quan, W. Using Landsat/TM imagery to estimate nitrogen and phosphorus concentration in Taihu Lake, China. IEEE J. Sel. Top. Appl. Earth Obs. Remote Sens. 2012, 5, 273–280. [Google Scholar] [CrossRef]
  71. Huang, C.; Guo, Y.; Yang, H.; Li, Y.; Zou, J.; Zhang, M.; Lyu, H.; Zhu, A.; Huang, T. Using remote sensing to track variation in phosphorus and its interaction with chlorophyll-a and suspended sediment. IEEE J. Sel. Top. Appl. Earth Obs. Remote Sens. 2015, 8, 4171–4180. [Google Scholar] [CrossRef]
  72. Moses, A.S.; Janaki, L.; Joseph, S.; Kizhur, K.R. Determining the spatial variation of phosphorus in a lake system using remote sensing techniques. Lakes Reserv. Res. Manag. 2014, 19, 24–36. [Google Scholar] [CrossRef]
  73. Brezonik, P.L.; Menken, K.; Bauer, M.E. Landsat-based remote sensing of lake water quality characteristics, including chlorophyll and colored dissolved organic matter (CDOM). Lake Reserv. Manag. 2005, 2, 373–382. [Google Scholar] [CrossRef]
  74. Choubey, V.K. Laboratory experiment, field and remotely sensed data analysis for the assessment of suspended solids concentration and secchi depth of the reservoir surface water. Int. J. Remote Sens. 1998, 19, 3349–3360. [Google Scholar] [CrossRef]
  75. Zhou, Y.; Liu, H.; He, B.; Yang, X.; Feng, Q.; Kutser, T.; Chen, F.; Zhou, X.; Xiao, F.; Kou, J. Secchi Depth estimation for optically-complex waters based on spectral angle mapping—Derived water classification using Sentinel-2 data. Int. J. Remote Sens. 2021, 42, 3123–3145. [Google Scholar] [CrossRef]
  76. Ohammad, M.M.; Alsahli, M.N. Spatiotemporal variability of Secchi depths of the North Arabian Gulf over the last two decades. Estuar. Coast. Shelf Sci. 2021, 260, 107487. [Google Scholar]
  77. Kratzer, S.; Kyryliuk, D.; Edman, M.; Philipson, P.; Lyon, S.W. Synergy of Satellite, In Situ and Modelled Data for Addressing the Scarcity of Water Quality Information for Eutrophication Assessment and Monitoring of Swedish Coastal Waters. Remote Sens. 2019, 11, 2051. [Google Scholar] [CrossRef] [Green Version]
  78. Prasad, A.D.; Siddaraju, P. Carlson’s Trophic State Index for the assessment of trophic status of two lakes in Mandya district. Adv. Appl. Sci. Res. 2012, 3. [Google Scholar]
  79. Zheng, L.; An, Z.; Chen, X.; Liu, H. Changes in Water Environment in Erhai Lake and Its Influencing Factors. Water 2021, 13, 1362. [Google Scholar] [CrossRef]
  80. Søballe, D.M.; Kimmel, B.L.; Kennedy, R.H.; Gaugush, R.F. Reservoirs. In Biodiversity of the Southeastern United States: Aquatic communities; Hackney, C.T., Adams, S.M., Martin, W.H., Eds.; John Wiley and Sons: New York, NY, USA, 1992; pp. 421–474. [Google Scholar]
  81. Canfield, D., Jr.; Bachmann, R. Prediction of total phosphorus concentrations, chlorophyll a, and secchi depths in natural and artificial lakes. Can. J. Fish. Aquat. Sci. 1981, 38, 414–423. [Google Scholar] [CrossRef]
  82. Virginia Water Resources Research Institute; State University Blacksburg. Nutrients in Lakes and Reservoirs-Aliterature Review for Use in Nutrient Criteria Development. VWRRC Special Report SR34–2007. Virginia. 2007. Available online: http://www.vwrrc.vt.edu (accessed on 10 October 2020).
  83. Canfield, D.E.; Hodgson, L.M. Prediction of Secchi disc depths in Florida lakes: Impact of algal biomass and organic color. Hydrobiologia 1983, 99, 51–60. [Google Scholar] [CrossRef]
  84. Heiskary, S.; Wilson, B. Minnesota Lake Water Quality: Developing Nutrient Criteria, 3rd ed.; Minnesota Pollution Control Agency: St. Paul, MN, USA, 2005. [Google Scholar]
  85. Lind, O.T. The effect of non-algal turbidity on the relationship of Secchi depth to chlorophyll a. Hydrobiologia 1986, 140, 27–35. [Google Scholar] [CrossRef]
  86. Lorenzen, M.W. The use of chlorophyll-secchi disk relationships. Limnol. Oceanogr. 1980, 25, 371–372. [Google Scholar] [CrossRef]
  87. Allee, R.; Johnson, J. Use of satellite imagery to estimate surface chlorophyll a and Secchi disc depth of Bull Shoals Reservoir, Arkansas, USA. Int. J. Remote Sens. 1999, 20, 1057–1072. [Google Scholar] [CrossRef]
  88. Page, B.P.; Olmanson, L.G.; Mishra, D.R. A harmonized image processing work-flow using Sentinel-2/MSI and Landsat-8/OLI for mapping water clarity in opti-cally variable lake systems. Remote Sens. Environ. 2019, 231, 111284. [Google Scholar] [CrossRef]
  89. Zhang, Y.; Zhang, Y.; Shi, K.; Zhou, Y.; Li, N. Remote sensing estimation of water clarity for various lakes in China. Water Res. 2021, 192, 116844. [Google Scholar] [CrossRef] [PubMed]
  90. Dekker, A.; Zamurović-Nenad, Ž.; Hoogenboom, H.; Peters, S. Remote sensing, ecological water quality modelling and in situ measurements: A case study in shallow lakes. Hydrolog. Sci. J. 1996, 41, 531–547. [Google Scholar] [CrossRef]
  91. Uusitalo, R.; Yli-Halla, M.; Turtola, E. Suspended soil as a source of potentially bioavailable phosphorus in surface runoff waters from clay soils. Water Res. 2000, 34, 2477–2482. [Google Scholar] [CrossRef]
  92. Ritchie, J.C.; Cooper, C.M.; Schiebe, F.R. The relationship of MSS and TM digital data with suspended sediments, chlorophyll, and temperature in Moon Lake, Mississippi. Remote Sens. Environ. 1990, 33, 137–148. [Google Scholar] [CrossRef]
  93. Lathrop, R. Landsat Thematic Mapper monitoring of turbid inland water quality. Photogramm. Eng. Remote Sens. 1992, 58, 465–470. [Google Scholar]
  94. Lillesand, T.M.; Kiefer, R.W. Remote Sensing and Image Interpretation, 4th ed.; John Wiley and Sons: New York, NY, USA, 2000; p. 724. [Google Scholar]
  95. Buiteveld, H.; Hakvoort, J.H.M.; Donze, M. The optical properties of pure water. SPIE Ocean. Opt. XII 1994, 2258, 174–183. [Google Scholar]
  96. Ouma, O.Y.; Noor, K.; Herbert, K. Modelling Reservoir Chlorophyll-a, TSS, and Turbidity Using Sentinel-2A MSI and Landsat-8 OLI Satellite Sensors with Empirical Multivariate Regression. J. Sens. 2020, 2020, 8858408. [Google Scholar] [CrossRef]
  97. Kontopoulou, E.; Kolokoussis, P.; Karantzalos, K. Water quality estimation in Greek lakes from Landsat 8 multispectral satellite data. In Proceedings of the 10th World Congress of the European Water Resources Association (EWRA) on Water Resources and Environment (EWRA2017), European Water 2017 No.58, Athens, Greece, 5–9 July 2017; pp. 191–196. [Google Scholar]
  98. Tripathi, N.K.; Patil, A.A. Spectral characterization of aquatic nutrients and water quality parameters in marine environment. Bibliogr. Inform. 2004, 15, 25–31. [Google Scholar] [CrossRef] [Green Version]
  99. Membrillo-Abad, A.S.; Torres-Vera, M.A.; Alcocer, J.; Prol-Ledesma, R.M.; Oseguera, L.A.; Ruiz-Armenta, J.R. Trophic State Index estimation from remote sensing of lake Chapala, México. Rev. Mex. Cienc. Geol. 2016, 33. [Google Scholar]
  100. Papoutsa, C.; Akylas, E.; Hadjimitsis, D. Trophic State Index derivation through the remote sensing of Case-2 water bodies in the Mediterranean region. Cent. Eur. J. Geosci. 2014, 6, 67–78. [Google Scholar] [CrossRef] [Green Version]
  101. Rivani, A.; Wicaksono, P. Water trophic status mapping of tecto-volcanic maninjau lake during algae bloom using landsat 8 OLI satellite imagery. In Proceedings of the 2018 IEEE International Conference on Aerospace Electronics and Remote Sensing Technology (ICARES), Bali, Indonesia, 20–21 September 2018. [Google Scholar] [CrossRef]
  102. Chen, Q.; Zhang, Y.; Hallikainen, M. Water quality monitoring using remote sensing in support of the EU water framework directive (WFD): A case study in the Gulf of Finland. Environ. Monit. Assess. 2007, 124, 157–166. [Google Scholar] [CrossRef]
  103. Kimmel, B.L.; Lind, O.T.; Paulson, L.J. Reservoir primary production. In Reservoir Limnology: Ecological Perspectives; Thorton, K.W., Kimmel, B.L., Payne, F.E., Eds.; John Wiley and Sons: New York, NY, USA, 1990; pp. 133–193. [Google Scholar]
  104. Loveland, T.R.; Dwyer, J.L. Landsat: Building a strong future. Remote Sens. Environ. 2012, 122, 22–29. [Google Scholar] [CrossRef]
  105. Brewin, R.J.; Sathyendranath, S.; Müller, D.; Brockmann, C.; Deschamps, P.Y.; Devred, E.; Doerffer, R.; Fomferra, N.; Franz, B.; Grant, S.M. Groom the Ocean Colour Climate Change Initiative: III. A round-robin comparison on in-water bio-optical algorithms. Remote Sens. Environ. 2015, 162, 271–294. [Google Scholar] [CrossRef] [Green Version]
Figure 1. National Lake Network Monitoring in Greece (numbers of sampling stations coincide with the numbers presented in Table 1).
Remotesensing 14 00739 g001
Figure 2. Boxplots presenting basic statistics of Secchi depths (a) grouped by the lake’s nature and categorized by the sampling season, and (b) grouped by sampling year and categorized by the lake’s nature.
Remotesensing 14 00739 g002
Figure 3. Boxplots presenting basic statistics of TP concentrations (a) grouped by the lake’s nature and categorized by the sampling season, and (b) grouped by sampling year and categorized by the lake’s nature (top and bottom panels illustrate the range of in situ TP measurements in a logarithmic scale divided in 0–0.8 mg/L and 1–15 mg/L extents, respectively).
Remotesensing 14 00739 g003
Figure 4. Flow diagram describing the methodology followed regarding the WQ models’ establishment and validation.
Remotesensing 14 00739 g004
Figure 5. Scatter plots between in situ and estimated SQRT Secchi depths derived from (a) general model, (b) model established for natural lakes, and (c) model established for reservoirs (lines set at confidence intervals 95%).
Remotesensing 14 00739 g005
Figure 6. Scatter plots between in situ and estimated LOG TP values derived from (a) general model and (b) model established for natural lakes (lines set at confidence intervals 95%).
Remotesensing 14 00739 g006
Figure 7. Satellite-derived Chl-a maps (on 11 August 2013) of selected lakes after the application of General (a), Natural (b), and Artificial (c) models (WGS_1984, UTM Zone 34 N Coordinate system), derived by [31].
Remotesensing 14 00739 g007
Figure 8. Satellite-derived Secchi maps (on 11 August 2013) of selected lakes after the application of Secchi General (a), Secchi Natural (b), and Secchi Artificial (c) models (WGS_1984, UTM Zone 34 N Coordinate system).
Remotesensing 14 00739 g008
Figure 9. Satellite-derived TP maps (on 11 August 2013) of selected lakes after the application of TP General-(a), and TP natural (b) models (WGS_1984, UTM Zone 34 N Coordinate system).
Remotesensing 14 00739 g009
Figure 10. Scatter plot between in situ and satellite-derived TSI values, based on the whole dataset (lines set at confidence intervals 95%).
Remotesensing 14 00739 g010
Figure 11. Count of satellite-classified/misclassified cases concerning all monitored lakes grouped by (a) the lake’s mean depth, (b) lakes’ nature, and (c) sampling season. Numbers from −4 up to 3 represent the class deviation between the satellite and in situ derived TSIs, while 0 indicates no differentiation. Positive and negative signs represent the direction of the deviation from oligotrophy to hypereutrophy and vice versa, respectively, based on the corresponding in situ TSI value (reference value).
Remotesensing 14 00739 g011
Figure 12. Scatter plot between in situ and satellite-derived TSI values of natural lakes (lines set at confidence intervals 95%).
Remotesensing 14 00739 g012
Figure 13. Count of satellite-classified/misclassified cases belonging to natural lakes grouped by (a) the lake’s mean depth and (b) sampling season. Numbers from −4 up to 3 represent the class deviation between the satellite and in situ derived TSIs, while 0 indicates no differentiation. Positive and negative signs represent the direction of the deviation from oligotrophy to hypereutrophy and vice versa, respectively, based on the corresponding in situ TSI value (reference value).
Remotesensing 14 00739 g013
Figure 14. Scatter plot between in situ and satellite-derived TSI values of artificial lakes (lines set at confidence intervals 95%).
Remotesensing 14 00739 g014
Figure 15. Count of satellite-classified/misclassified cases belonging to artificial lakes grouped by (a) the lake’s mean depth and (b) sampling season. Numbers from −3 up to 3 represent the class deviation between the satellite and in situ derived TSIs while 0 indicates no differentiation. Positive and negative signs represent the direction of the deviation from oligotrophy to hypereutrophy and vice versa, respectively, based on the corresponding in situ TSI value (reference value).
Remotesensing 14 00739 g015
Table 1. Main characteristics of the lakes included in the National Lake Network Monitoring in Greece (WFD) [58,31].
NoNational Name StationSurface (km2)(N)atural/
(A)rtificial
Mean Depth (m)NoNational Name StationSurface (km2)(N)atural/
(A)rtificial
Mean Depth (m)
1Lake Ladona-A-28Lake Petron11.91N3.1
2Lake Pineiou19.64A15.129Lake Zazari2.98N3.95
3Lake Stymfalia-N1.3130Lake Cheimaditida9.82N1.01
4Lake Feneou0.47A10.531Lake Kastorias30.87N3.7
5Lake Kremaston68.43A47.232Lake Sfikias3.96A23.2
6Lake Kastrakiou25.58A33.233Lake Asomaton2.46A20.8
7Lake Stratou7.02A9.634Lake Polyfytou63.49A22.4
8Lake Tavropou21.46A15.035Lake Mikri Prespa A-N3.95
9Lake Lysimacheia10.87N3.536Lake Mikri Prespa B N-
10Lake Ozeros10.57N3.837Lake Megali Prespa A-N17
11Lake Trichonida93.53N29.638Lake Megali Prespa B N-
12Lake Amvrakia13.14N23.439Lake Doirani 133.25N4.6
13Lake Voulkaria7.38N0.9640Lake Doirani 2 N-
14Lake Saltini-N-41Lake Pikrolimni6.30N1.2
15Lake Mornou17.50A38.542Lake Koroneia-N3.8
16Lake Evinou2.68A31.543Lake Volvi70.36N12.3
17Lake Pigon Aoou11.44A20.844Lake Kerkini-A2.19
18Lake Pournariou19.28A29.845Lake Leukogeion0.83A4.05
19Lake Pamvotida21.82N5.346Lake Ismarida-N0.9
20Lake Pournariou II0.56A11.747Lake Platanovrysis2.99A26.4
21Lake Marathona2.17A15.848Lake Thisavrou13.43A38.4
22Lake Dystos-N-49Lake Gratinis0.80A14.2
23Lake Yliki19.96N20.150Lake N. Adrianis-A-
24Lake Paralimni9.96N2.9951Lake Kourna-N15
25Lake Karlas-A0.952Lake Bramianou-A10.1
26Lake Smokovou-A-53Lake Faneromenis0.33A9.98
27Lake Vegoritida47.67N26.52
Table 2. Summary of descriptive statistics of in situ Secchi depth values during years 2013–2016 and 2018.
Secchi Depth (m) in Year:NMinMaxMeanStd. DeviationSkewnessKurtosis
20131340.2014.03.12.81.53.3
20141250.03014.03.83.10.90.2
20151400.03011.03.22.60.8−0.2
2016640.05015.03.033.21.73.1
20183140.10015.53.042.71.42.4
all years7770.0315.53.22.81.31.7
Table 3. Summary of descriptive statistics of in situ TP concentrations during years 20152016 and 2018.
Total Phosphorus (mg/L) in YearNMinMaxMeanStd. DeviationSkewnessKurtosis
20151690.014.20.140.566.745.4
2016690.025.10.230.85.529.9
20181320.0213.30.481.84.925.98
all years3700.0113.30.281.26.954.2
Table 5. Carlson’s trophic state index values and classification of lakes [43,78].
TSI
Values
Trophic
Status
Attributes
<40<30OligotrophicTransparent water
30–40Oligotrophic-Mesotrophic
41–5041–48MesotrophicHigher turbidity, higher algae abundance and macrophytes
49–50Mesotrophic-Eutrophic
51–7051–60Mesotrophic-Eutrophic
61–70EutrophicUsually blue-green algae blooms
>70HypereutrophicExtreme blue-green algae blooms
Table 6. Common variables with the highest value of importance concerning the prediction of Secchi, SQRTSecchi, and LOG/LN Secchi, derived from the predictor importance chart.
Value of Importance
VariableSecchiSQRT(Secchi)LOG-LN(Secchi)
Green/SWIR10.0140.0080.011
LOG(Blue/Red)0.0330.0440.041
(Blue − Red)/(Blue + Red)0.0340.0450.042
LN Green/LN Blue0.0350.0410.045
Red/Blue0.0350.0450.046
LOG Blue/LOG Green0.0370.0430.047
LN((Blue − SWIR2)/(Green − SWIR1))0.0390.0320.038
(Blue − Red)/Green0.0460.0540.050
Blue + Red + Red/Blue0.0460.0500.047
Green/Blue0.0520.0520.058
(Blue − Green)/(Blue + Green)0.0560.0550.059
LOG (Blue/Green)0.0560.0550.059
Table 7. Regression analysis statistics and Secchigeneral model’s summary.
ModelRR2Adjusted R2Std. Error of the EstimateChange StatisticsDurbin-Watson
R2 ChangeF Changedf1df2Sig. F Change
Secchigeneral0.740.540.540.460.24115.812220.02.24
Predictors: (Constant), Blue + Red + Red/Blue, LN Green/LN SWIR2.
Table 8. Regression analysis statistics and Secchinatural and Secchiartificial models’ summaries.
Scenario/ModelRR2Adjusted R2Std. Error of the EstimateChange StatisticsDurbin-Watson
R2 ChangeF Changedf1df2Sig. F Change
Secchinatural0.780.60.590.550.068.61590.0052.14
Secchiartificial0.730.530.510.370.071611050.02.12
Predictorsnatural: (Constant), Log Chl-a, Log Red. Predictorsartificial: Green/Blue, Red/SWIR1, Log Chl-a.
Table 9. Common variables with the highest value of importance concerning the prediction of TP and LOG/LN TP, derived from the predictor importance chart.
Value of Importance
VariableTPLOG-LN (TP)
Red/SWIR10.26720.3283
Green/SWIR10.22960.2973
LN Green/LNSWIR10.1308
Green/Red0.12490.1525
LOG Chl-a0.09530.1848
LOG (Red/Green)0.0776
LN Red/LN Green0.0344
LN Secchi 0.1315
Table 10. Regression analysis statistics and TPgeneral model’s summary.
ModelRR2Adjusted R2Std. Error of the EstimateChange StatisticsDurbin-Watson
R2 ChangeF Changedf1df2Sig. F Change
LogTPgeneral0.850.730.710.180.057.61430.0082.34
Predictors: (Constant), LogChl-a, LN Red/LN SWIR1.
Table 11. Regression analysis statistics and TPnatural model’s summary.
ModelRR2Adjusted R2Std. Error of the EstimateChange StatisticsDurbin-Watson
R2 ChangeF Changedf1df2Sig. F Change
LogTPnatural0.910.820.810.170.068.11260.0091.9
Predictors: (Constant), LogSecchi, Green/Red.
Table 12. Statistical indices used to validate the Secchi selected algorithms (** correlation significant at the 0.01 level (two-tailed). RMSE—root-mean-square error. * All values concern SQRT Secchi depths).
1st Validation (20%)2nd Validation (2018 Data)
ModelsSpearman r Average in situ * Average Satellite * Average Residuals (m)RMSE (Secchi; m/% of Max Secchi/% of Average Secchi)Spearman r Average In Situ * Average Satellite * Average Residuals (m) RMSE (Secchi; m/% of Max Secchi/% of Average Secchi)
Secchigeneral Training dataset
N = 228
0.78 **
N = 57
2.12.10.00001 0.24/1.7%/5.1%0.58 **
N = 115
2.021.860.030.37/2.39%/8.2%
Secchigeneral applied on natural 0.65 **
N=44
1.931.860.0050.3
Secchigeneral applied on artificial 0.51 **
N = 57
2.11.820.060.44
Secchinatural Training dataset
N = 65
0.95 **
N = 27
1.761.740.0002 0.14/0.93%/3.6%0.73 **
N = 28
1.91.80.0080.3/1.92%/7.1%
Secchiartificial
Training dataset
N = 111
0.62 **
N = 28
2.012.040.001 0.1/1.18%/2.3%0.56 **
N = 40
2.132.170.0020.14/1.43%/3.3%
Table 13. Statistical indices used to validate the TP selected algorithms (** correlation significant at the 0.01 level (two-tailed). RMSE—root-mean-square error. * All values concern LogTP.
1st Validation (20%)2nd Validation (2018 Data)
ModelsSpearman r Average In Situ * Average Satellite * Average Residuals (mg/L)RMSE (TP; mg/L)Spearman r Average In Situ * Average Satellite * Average Residuals (mg/L)RMSE (TP; mg/L)
LogTPgeneral
Training dataset
N = 46
0.71 **
N = 12
−1.79−1.780.951.410.81 **
N = 33
−1.22−1.180.911.46
LogTPgeneral applied on natural 0.55 **
N = 40
−1.1−1.21.213.2
LogTPgeneral applied on artificial 0.86 **
N = 11
−1.33−1.210.761.51
LogTPnatural Training dataset
N = 29
0.93 **
N = 7
−1.61−1.540.861.430.68 **
N = 49
−1.26−1.220.931.63
Table 14. In situ and satellite derived TSIs’s frequencies and percentages of all cases.
Whole DatasetTSI (In Situ)TSI (Satellite)TSI (In Situ)TSI (Satellite)
FrequencyValid Percent
1 (Oligotrophic)9212452.370.5
2 (Oligotrophic-Mesotrophic)423023.917
3 (Mesotrophic)261514.88.5
4 (Mesotrophic-Eutrophic)1558.52.8
5 (Eutrophic) 1-0.6-
6 (Hypereutrophic)-2 1.1
Total176176100.0100.0
Table 15. In situ and satellite derived TSIs’s frequencies and percentages of cases belonging to natural lakes.
Natural LakesTSI (In Situ)TSI (Satellite)TSI (In Situ)TSI (Satellite)
FrequencyValid Percent
1 (Oligotrophic)505944.652.7
2 (Oligotrophic-Mesotrophic)352931.325.9
3 (Mesotrophic)141112.59.8
4 (Mesotrophic-Eutrophic)12710.76.3
5 (Eutrophic) 110.90.9
6 (Hypereutrophic)-5-4.5
Total112112100.0100.0
Table 16. In situ and satellite derived TSIs’s frequencies and percentages of cases belonging to artificial lakes.
Artificial LakesTSI (In Situ)TSI (Satellite)TSI (In Situ)TSI (Satellite)
FrequencyValid Percent
1 (Oligotrophic)424865.675
2 (Oligotrophic-Mesotrophic)7910.914.1
3 (Mesotrophic)12418.86.3
4 (Mesotrophic-Eutrophic)334.74.7
Total6464100.0100.0
Publisher’s Note: MDPI stays neutral with regard to jurisdictional claims in published maps and institutional affiliations.