Article

Rockfall Hazard Assessment in the Taihang Grand Canyon Scenic Area Integrating Regional-Scale Identification of Potential Rockfall Sources

1
College of Geological Engineering and Geomatics, Chang’an University, Xi’an 710054, China
2
Key Laboratory of Western China’s Mineral Resources and Geological Engineering, Ministry of Education, Chang’an University, Xi’an 710054, China
3
College of Construction Engineering, Jilin University, Changchun 130026, China
*
Author to whom correspondence should be addressed.
Remote Sens. 2022, 14(13), 3021; https://doi.org/10.3390/rs14133021
Submission received: 10 May 2022 / Revised: 20 June 2022 / Accepted: 21 June 2022 / Published: 23 June 2022

Abstract

:
Frequent rockfall events pose a major threat to the safe operation of the Taihang Grand Canyon Scenic Area (GCSA) in China. The traditional techniques for identifying potential rockfall sources and hazard assessment methods are often challenged in the alpine canyon landform. This study aims to establish an early identification framework for regional potential rockfall sources applicable to the canyon region and to assess rockfall hazards in potentially hazardous areas using unmanned aerial vehicle (UAV) photogrammetry. Specifically, by incorporating high-precision topographic information and geotechnical properties, the slope angle distribution method was used for static identification of potential rockfall sources. Moreover, SBAS-InSAR technology was used to describe the activity of potential rockfall sources. Finally, taking the key potentially hazardous area of the Sky City scenic spot as an example, the Rockfall Analyst tool was used to analyze the rockfall frequency, bounce height and energy characteristics based on the high-precision UAV 3D real scene model, and the analytic hierarchy process was introduced to achieve quantitative rockfall hazard assessment. The results show that the potential rockfall source areas in the Taihang GCSA is 33.47 km2 (21.47%), mainly distributed in strips on the cliffs on both sides of the canyon, of which the active rockfall source area is 2.96 km2 (8.84%). Taking the scenic spot of Sky City as example, the proposed UAV-based real scene modeling technology was proven to be able to quickly and accurately construct a 3D high-precision model of the canyon area. Moreover, the 3D rockfall simulation showed that the high-energy rockfall area was mainly distributed at the foot of the steep cliff, which mainly threatens the tourist distribution center below. The early identification and quantitative evaluation scheme of rockfall events proposed in this study can provide technical reference for the prevention and control of rockfall hazards in similar alpine valley areas.

Graphical Abstract

1. Introduction

A rockfall refers to the collapse of rock blocks on the surface of steep cliffs and slopes under the action of gravity, with volumes ranging from a few cubic centimeters to thousands of cubic meters [1,2,3,4]. A rockfall is an extremely rapid process and can travel long distances in the form of free-falling, bouncing, rolling and sliding, eventually depositing on talus cones or as individual debris [4,5]. Rockfalls are characterized by suddenness, unpredictability, rapidity, high energy and being catastrophic, being one of the hot issues in geological disaster research [5,6]. Due to its unique natural scenery and cultural landscape, Taihang Grand Canyon Scenic Area (GCSA) is considered one of the “top ten most beautiful grand canyons in China”, attracting more than four million tourists every year. Due to the unique geomorphic conditions in the Taihang GCSA, frequent rockfall events pose a major threat to the safe operation of the scenic spot [7,8,9,10].
Identifying the potential rockfall source area is the first step to assessing the rockfall susceptibility and hazard and determining the prevention and control measures for rockfall events [11,12,13,14]. Due to the widespread distribution of potential rockfall points in the canyon area and most of them being located on the high, steep slopes, traditional manual survey methods are often limited in this situation. Technologies such as unmanned aerial vehicle (UAV) photogrammetry and 3D laser scanning have been successively applied to the early identification of rockfall hazards [15,16,17,18]. However, these techniques are generally not applicable to the regional-scale identification of potential rockfall source areas, and their application has certain requirements for the site environment. Therefore, their applications are seriously limited by the rugged and complex terrain in alpine canyon regions. In addition, some scholars have used multi-temporal imagery data acquired by optical satellites and aircrafts to identify potential rockfall source areas at the regional scale [11,19,20,21]. Considering the high and steep topographic conditions as the primary intrinsic factor for rockfall events [22], researchers have explored various empirical and statistical models for identifying potential rock sources based on a high-precision digital elevation model (DEM). Guzzetti et al. [23] proposed that DEM units with a slope angle greater than 60° are potential rockfall source areas, based on the statistics of historical rockfall locations. Frattini et al. [24] delineated the rockfall source area by constructing a 3D rockfall trajectory model and considered DEM units with slope angles greater than 37° as potential rockfall source areas based on the experience of the study area. Previous studies have shown that a threshold angle of 45°~60° is sufficient to detect potential rockfall source areas [25,26]. It should be emphasized that the threshold angles are generally determined based on field observations, historical data and theoretical assumptions, so the threshold angles are usually different in different study areas [27]. Loye et al. [27] proposed the application of slope angle distribution (SAD) decomposition to identify regional potential rockfall sources, which showed good applicability in different geomorphic regions. Due to the advantages of high precision, working in all weather and a large scale, the interferometric synthetic aperture radar (InSAR) technology has been widely used for surface deformation monitoring, especially for the early identification of landslides [28]. Hosseini et al. [29] used TerraSAR-X Staring Spotlight InSAR data to achieve the detection of active rockfall source areas. Ground-based InSAR has the characteristics of a small scale, high flexibility and high temporal-spatial resolution, showing great potential in the deformation monitoring of key potentially hazardous areas [30,31,32].
Rockfall hazard assessment aims to identify and characterize potential rockfall events and estimate the corresponding occurrence frequency and damage degree [33]. For rockfall hazard assessment, the most commonly used method is to simulate the rockfall trajectory based on physical-mechanical models to obtain the relevant physical and mechanical parameters for rockfall hazard analysis [34,35]. At present, various mechanical models for rockfall trajectory simulation have been widely used in engineering practice, and corresponding mature commercial software solutions have been developed. As the most widely used statistical analysis software for rockfalls, RocFall 5.0 software (Rocscience Inc., Toronto, ON, Canada) calculates the 2D rockfall trajectory based on probability analysis, including motion characteristics such as the bounce height, speed and energy [36]. The RockyFor3D model combines a physics-based deterministic algorithm with a stochastic method to calculate the rockfall trajectory [37]. Lan et al. [38] proposed and built the first 3D spatially distributed rockfall analyst model (RA model) based on the ArcGIS platform, realizing the coupled analysis of the dynamic physical process and the spatial statistics of rockfalls. Using the high-performance parallel computing offered by GPUs, the program STONE established a 3D coupled discrete element model to realize the whole process simulation of large-scale rockfall movement [39]. Acquiring hazard factors such as the rockfall trajectory, kinematic energy and spatial probability and then conducting comprehensive multi-indicator analysis and hazard zoning is the mainstream method for evaluating the hazard of a single rockfall event. For example, Lan et al. [40] applied RA software to evaluate the rockfall hazard by comprehensively considering the characteristics of rockfall source areas and rockfall movement. Wang et al. [41] used RocFall software to carry out rockfall hazard assessment on the rock slope near the Cangjing Cave in Shijing Mountain. To the best of the authors’ knowledge, the current rockfall hazard assessment is often limited to a rough regional assessment or a targeted single rockfall evaluation, lacking an integrated solution from regional-scale rockfall identification to single rockfall hazard assessment.
The main purpose of this study is to establish a technical framework for rockfall hazard assessment in the canyon region based on the accurate identification of potential rockfall source areas and activities at the regional scale. First, the geological and environmental background and the distribution and development characteristics of rockfall events in the Taihang GCSA are introduced. Second, the SAD method is used for static identification of the potential rockfall source areas at the regional scale, and the activity of potential rockfall source areas is identified using the InSAR technology, which facilitates the identification of key potentially hazardous areas. Third, taking the scenic spot of Sky City as an example, the RA 1.1 software (Lan H.X., Alberta, Canada) is used to simulate and analyze the characteristics of rockfall movements, and then a quantitative hazard assessment for rockfall events in key potentially hazardous areas in canyon regions is proposed. Finally, we draw our conclusions and discuss future work.

2. Study Area

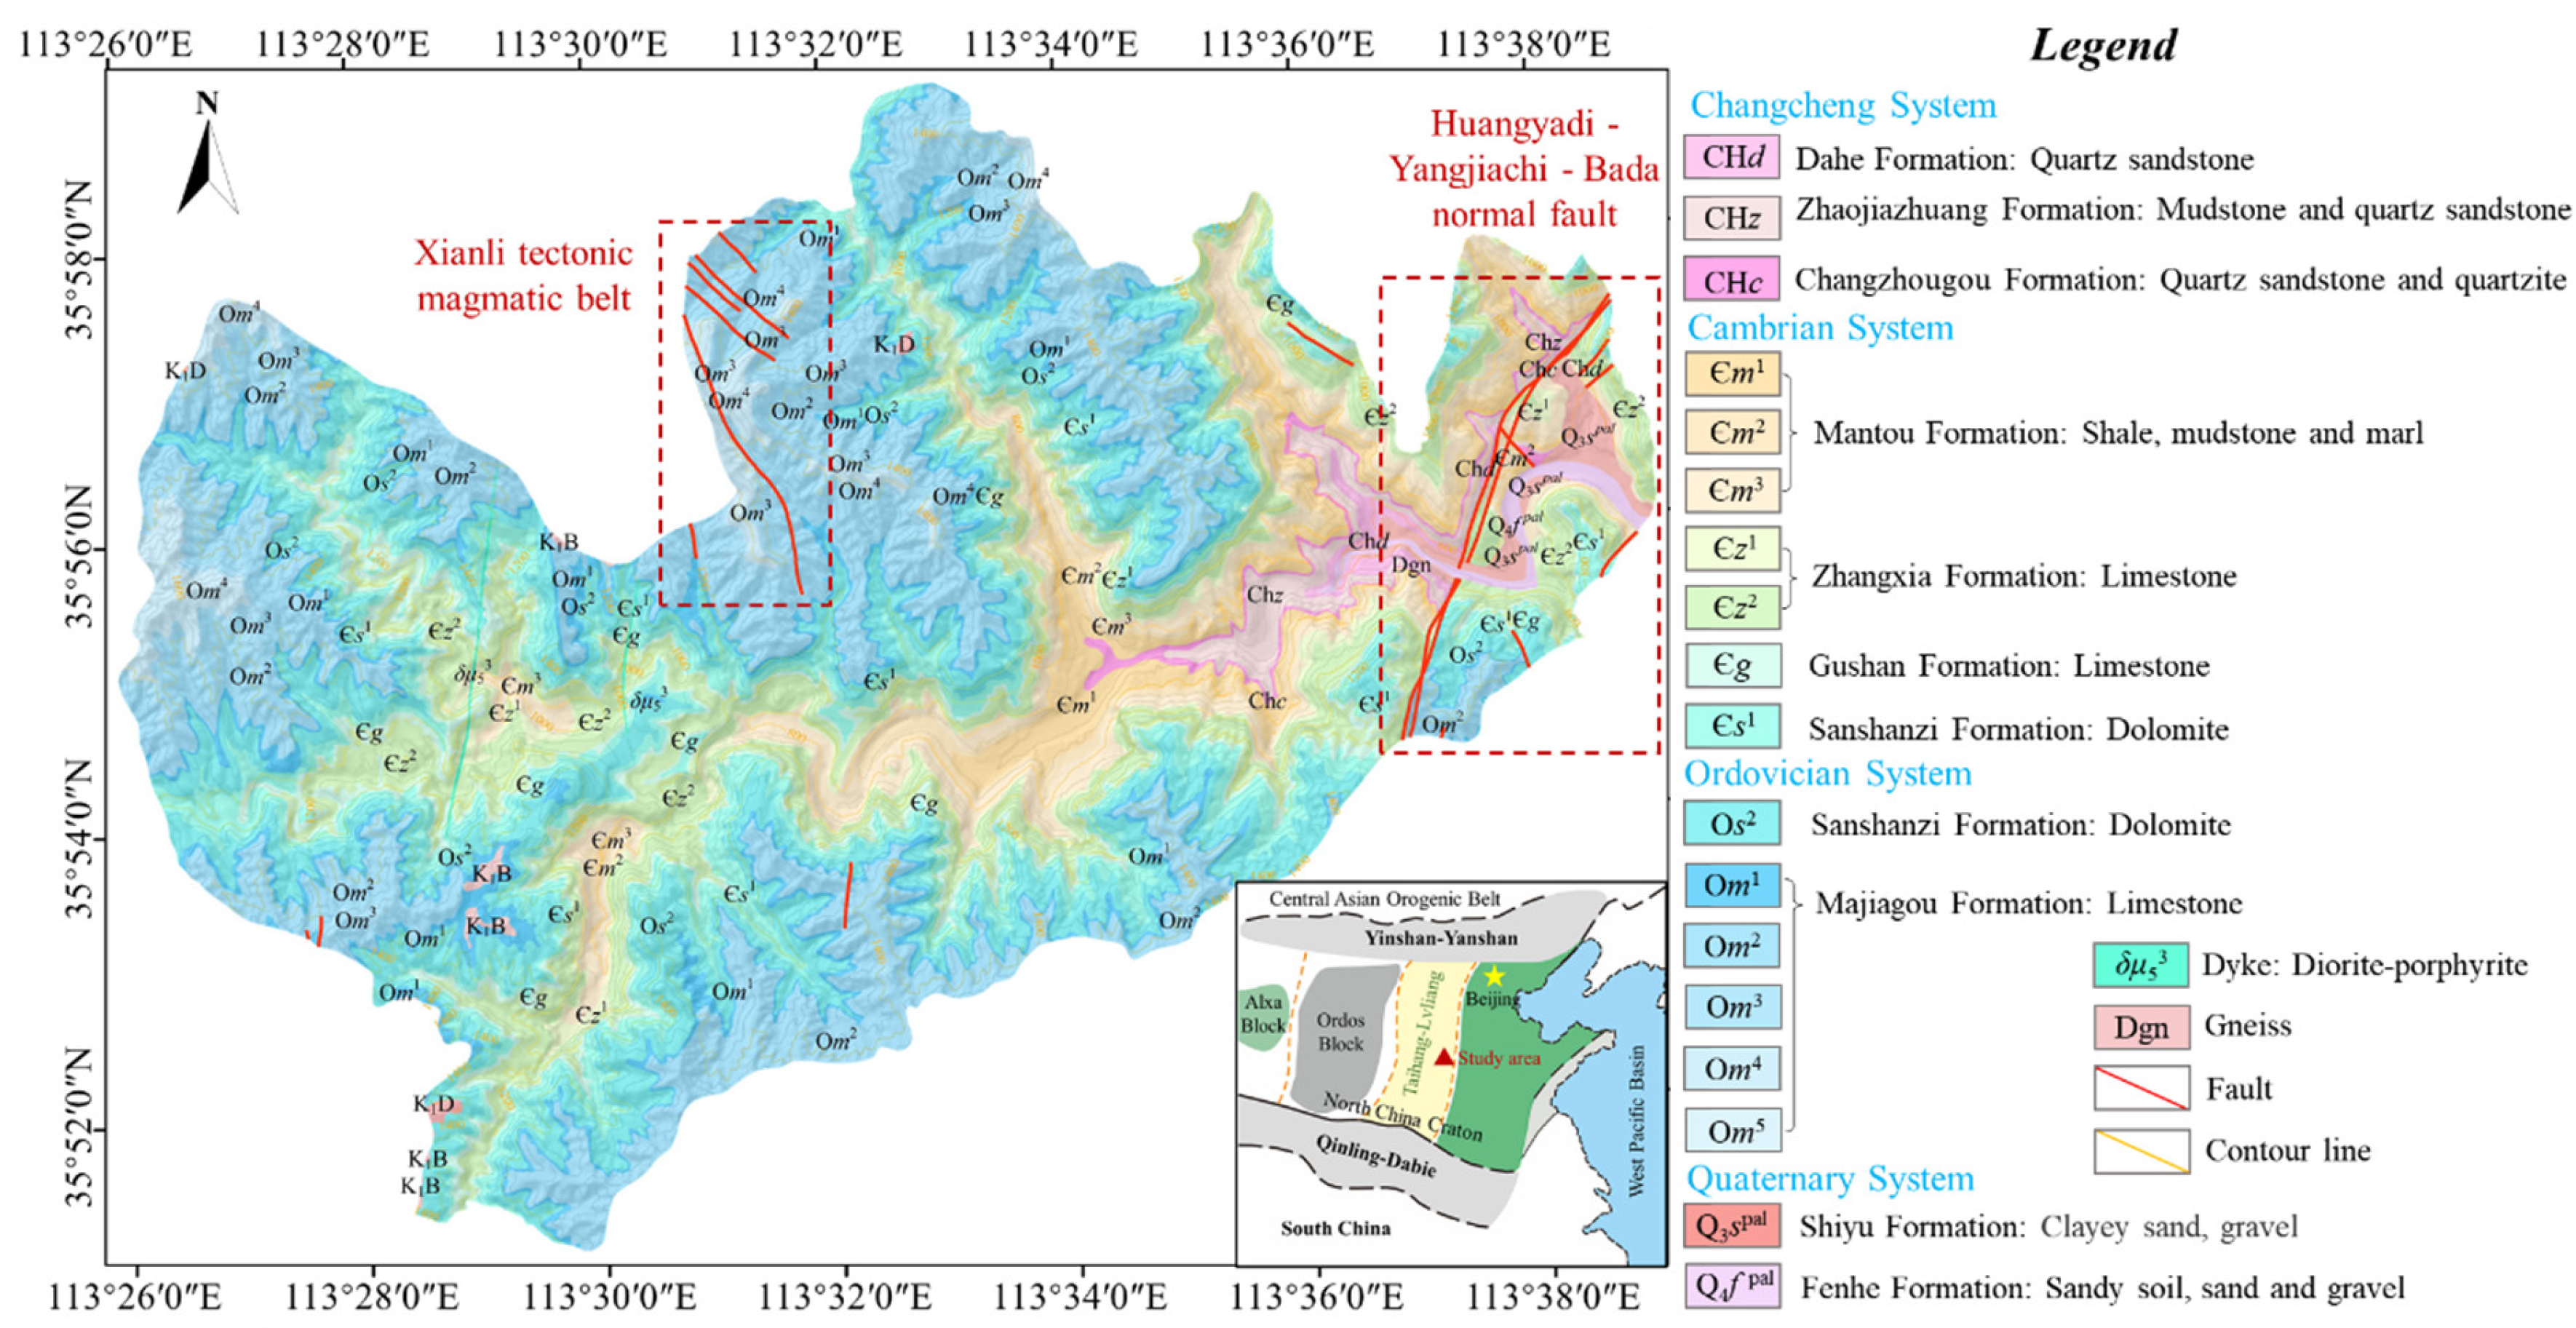
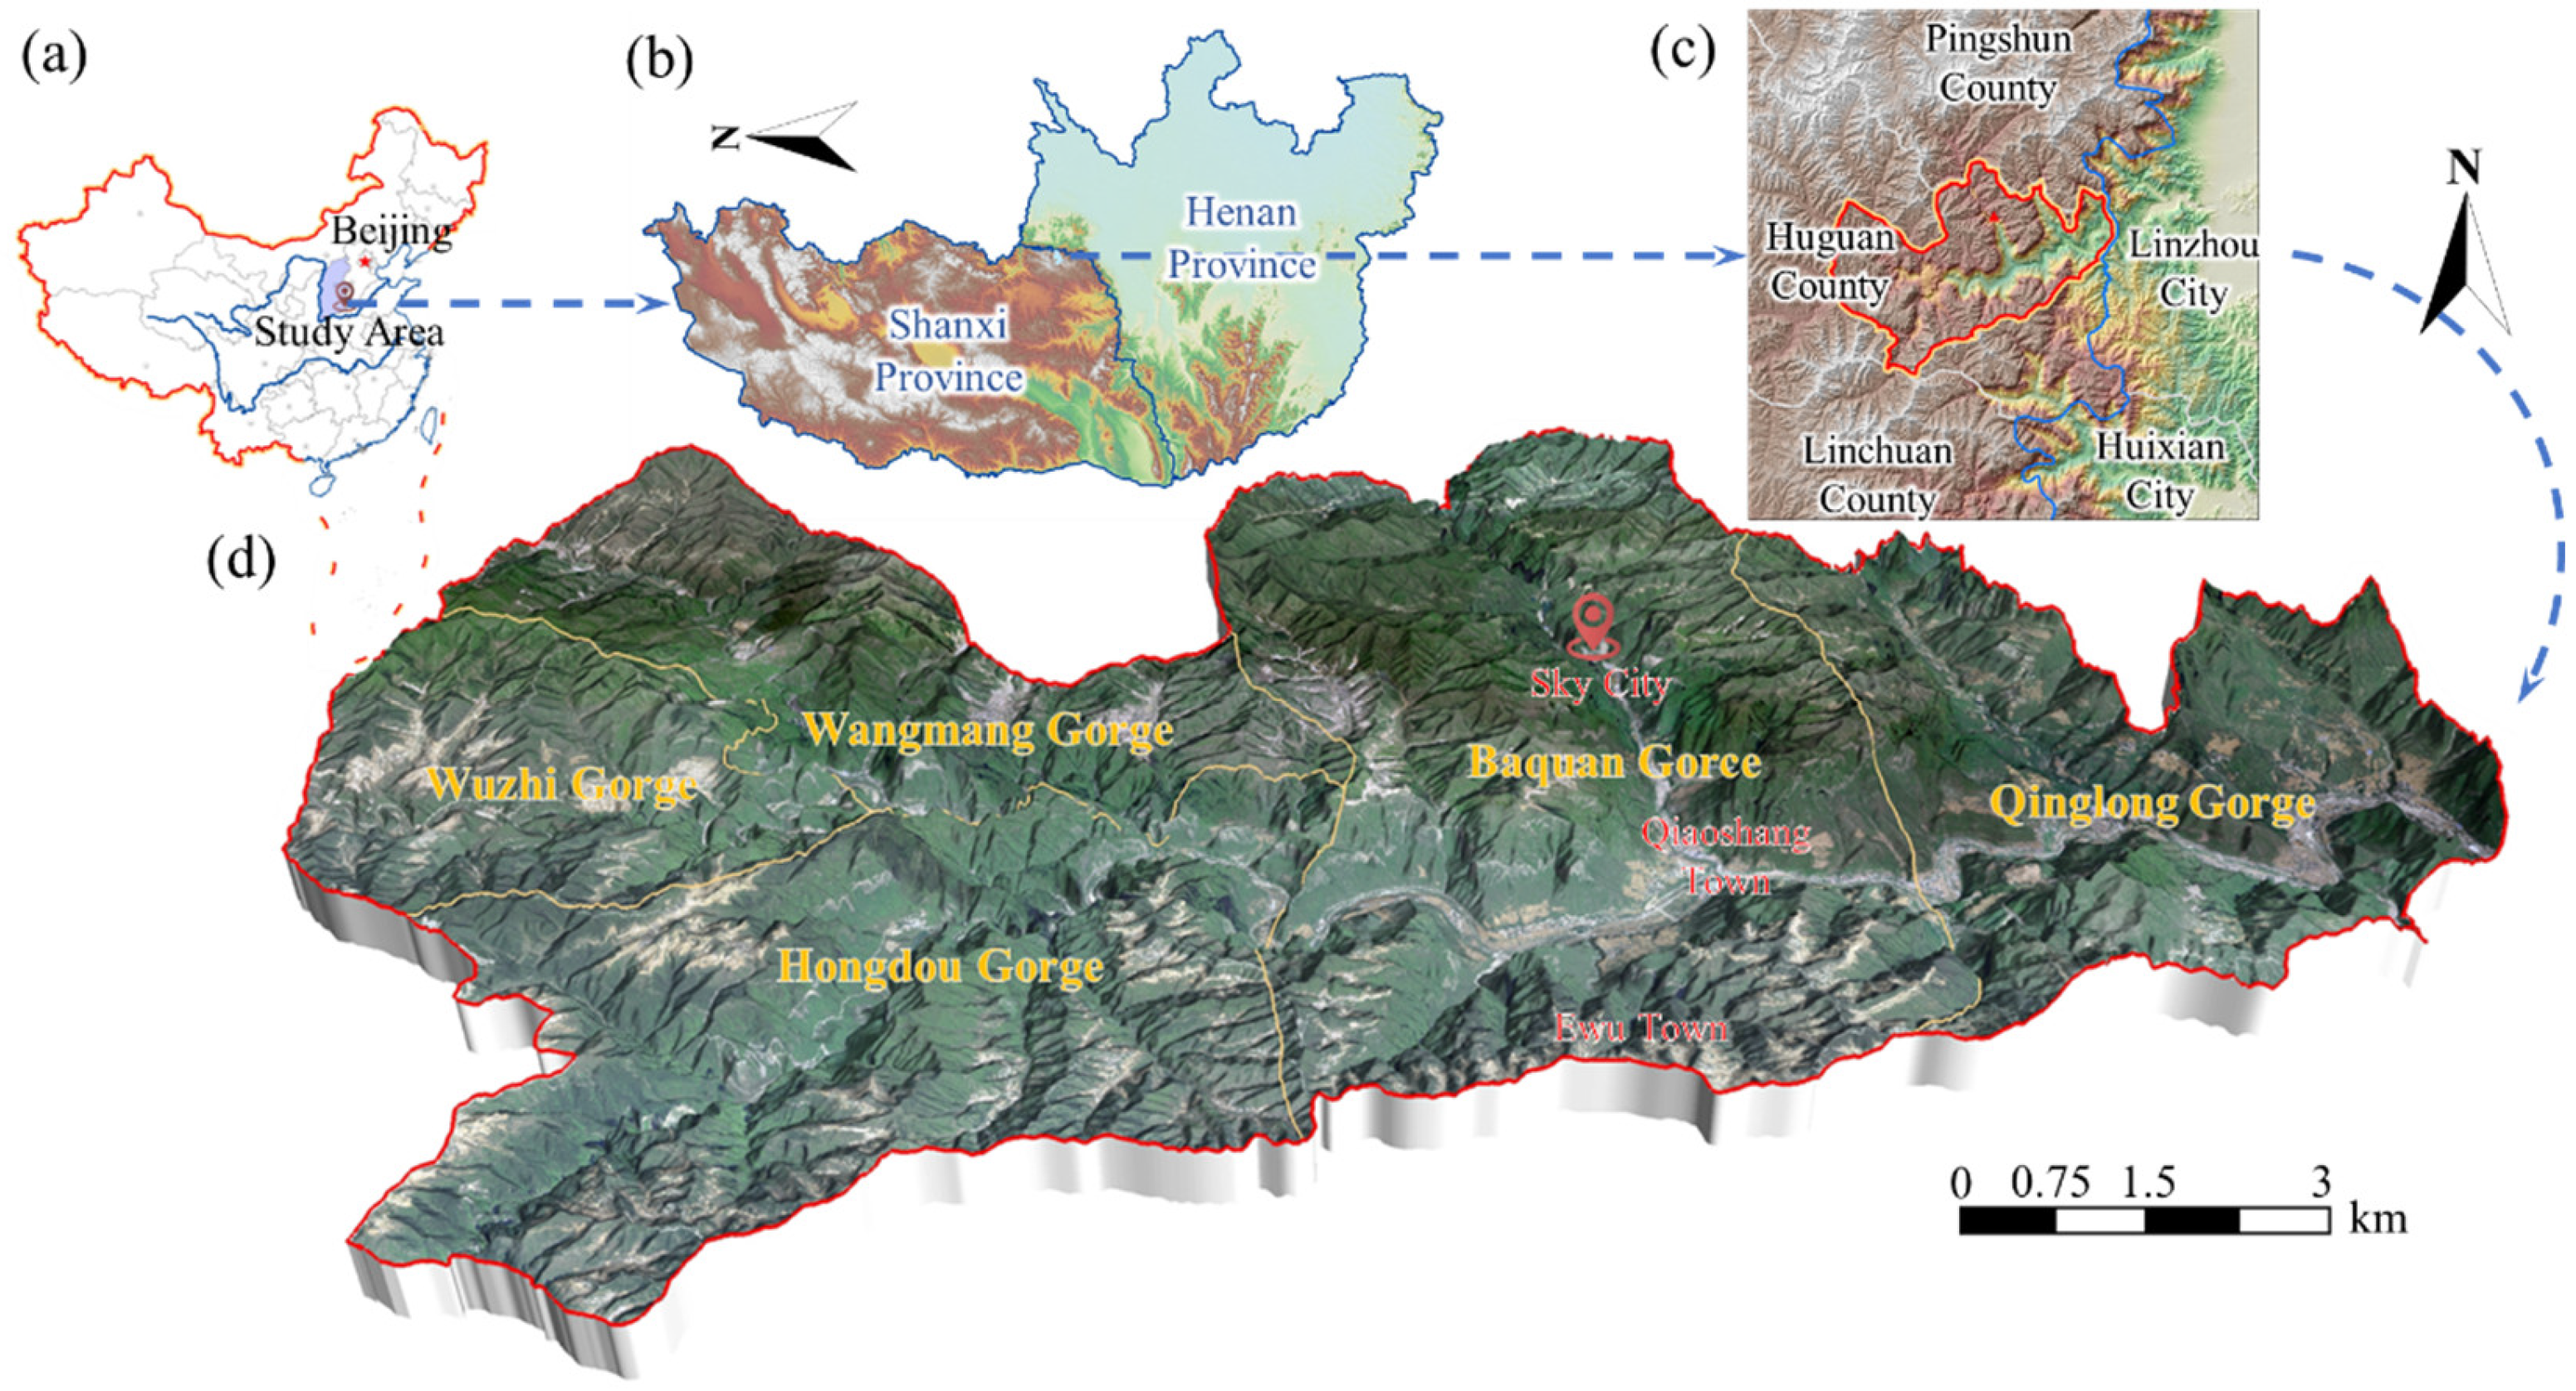
2.1. Environmental Geological Background

Taihang GCSA is located in the eastern part of Huguan County, Shanxi Province, China. The total area of the scenic area is 155.9 km2, including Baquan Gorge, Qinglong Gorge, Hongdou Gorge, Wuzhi Gorge and Wangmang Gorge (Figure 1).
Under the influence of the rapid uplift of the Taihang Mountains and the intensification of river undercutting erosion during neotectonic movement, an alpine and canyon landform with crisscrossing mountains and valleys was formed in the study area. The topography of the study area is dominated by steep cliffs and steep slopes, with an average slope of more than 40°. The terrain of the study area is generally high in the west and low in the east, with elevations of 1300~1600 m and cutting depths of 400~700 m. The study area has a continental monsoon climate with an average annual precipitation of 543.8 mm. The precipitation is mainly concentrated from June to October, accounting for 75% of the annual precipitation.
The study area is located at the southern edge of the Taihang Mountains uplift belt in the south of the North China Plate, and the tectonics in the study area is dominated by the Mesozoic Yanshanian structures [42]. As shown in Figure 2, the faults in the study area mainly extend along the north-northeast direction, and a few faults extend along the north-northwest direction. The main fault in the eastern part of the study area is the Huangyadi-Yangjiachi-Bada normal fault with a strike of 10°~18°. The fault group in the north of the study area belongs to the Xianli tectonic magmatic belt with a strike of 310°~340°. The strata exposed in the study area mainly include the Changcheng system, Cambrian system, Ordovician system, Quaternary system and locally exposed Yanshanian diorite intrusions (Figure 2). The lithology of the exposed strata is mainly quartzite sandstone, mudstone, limestone and dolomite.

2.2. Development Characteristics of Rockfall Events

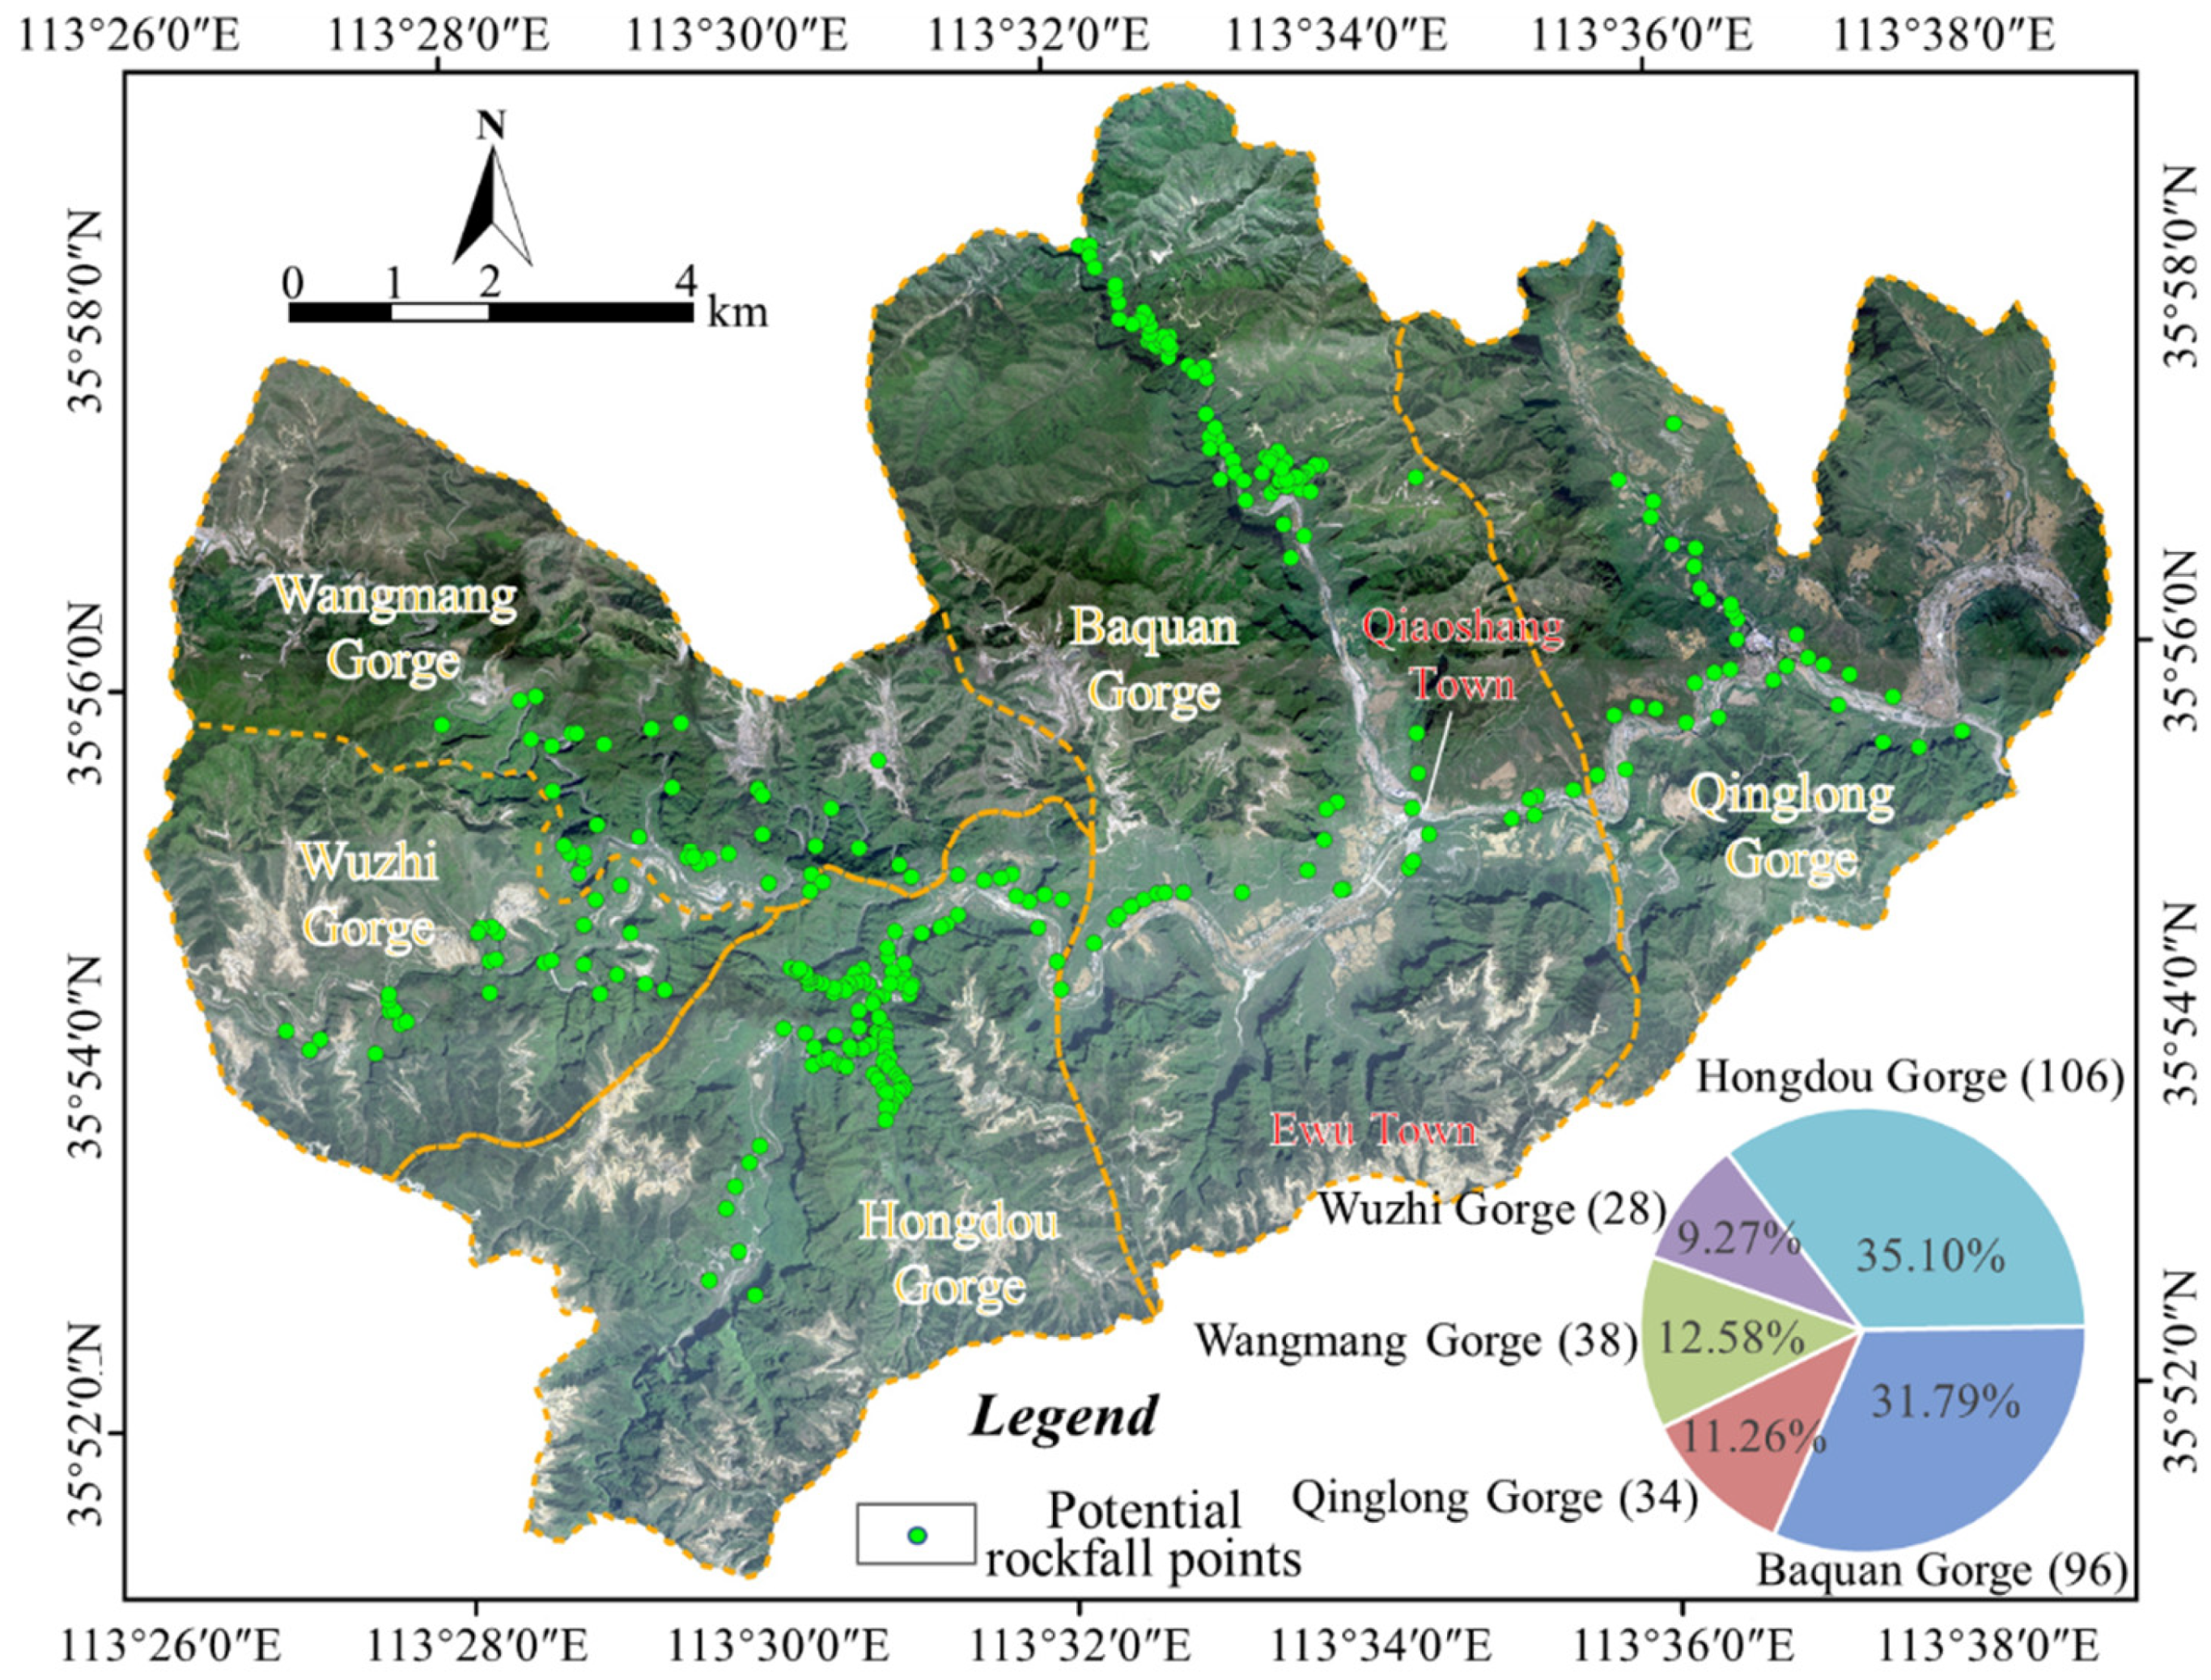
2.2.1. Spatial Distribution of Rockfall Events

While incorporating a DEM with a resolution of 5 m, the remote sensing interpretation was performed by using 1:10,000 aerial photographs and Google Earth satellite imagery to identify the distribution characteristics of the typical rockfall source areas [19]. Then, these characteristics were used to identify other potential rockfall points in the Taihang GCSA in the ArcGIS platform [21]. In addition, these potential rockfall points have been validated by field investigations.
As shown in Figure 3, a total of 302 potential rockfall points have been identified, including 38 in Wangmang Gorge, 28 in Wuzhi Gorge, 106 in Hongdou Gorge, 96 in Baquan Gorge and 34 in Qinglong Gorge. Potential rockfall points are mainly distributed on both sides of gullies, rivers and roads. The rockfall hazard-prone strata are mainly the quartzite sandstones of the Dahe formation and Zhaojiazhuang formation (7.95%), mudstones of the Mantou formation (10.93%) and limestones of the Zhangxia formation and Gushan formation (60.26%). Moreover, it should be noted that the canyon region is dominated by high and steep cliffs, which severely limits the remote sensing interpretation and field identification of high-locality potential rockfall points.

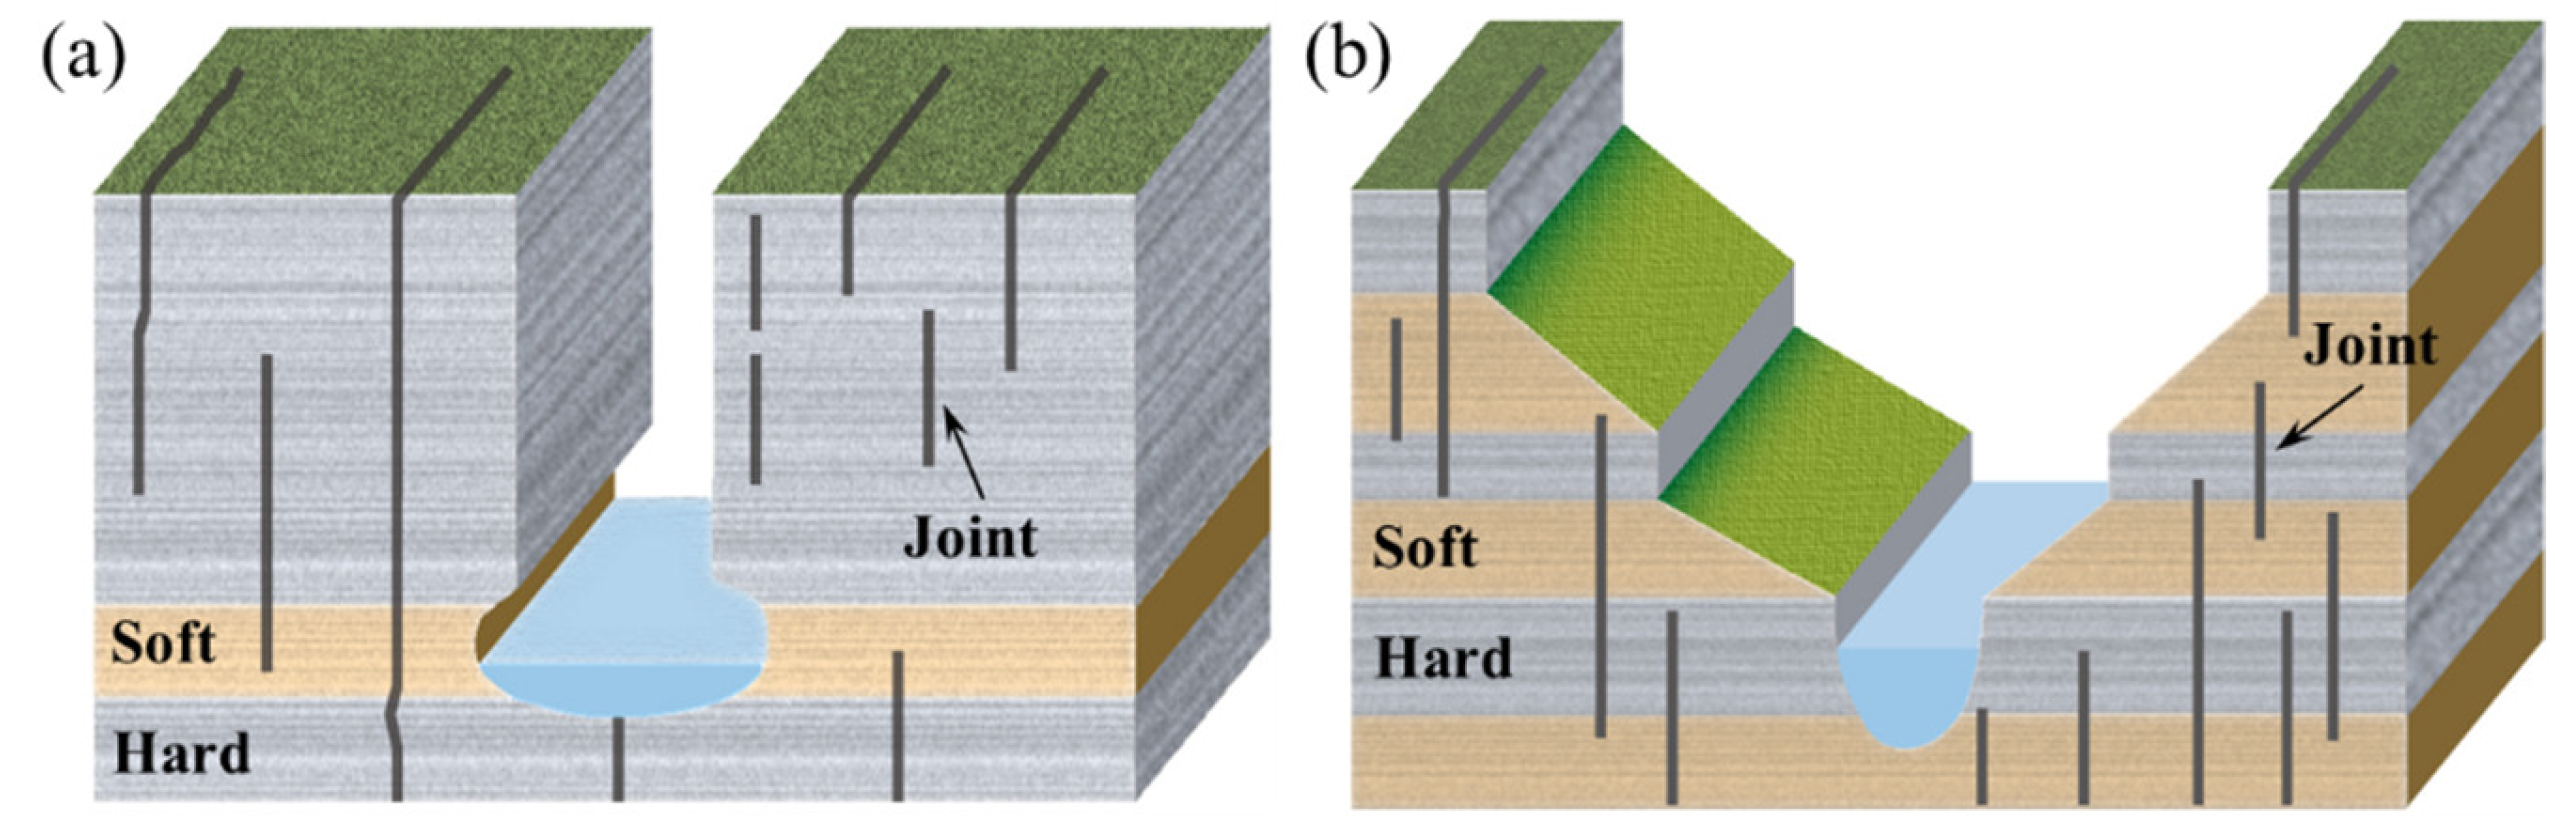
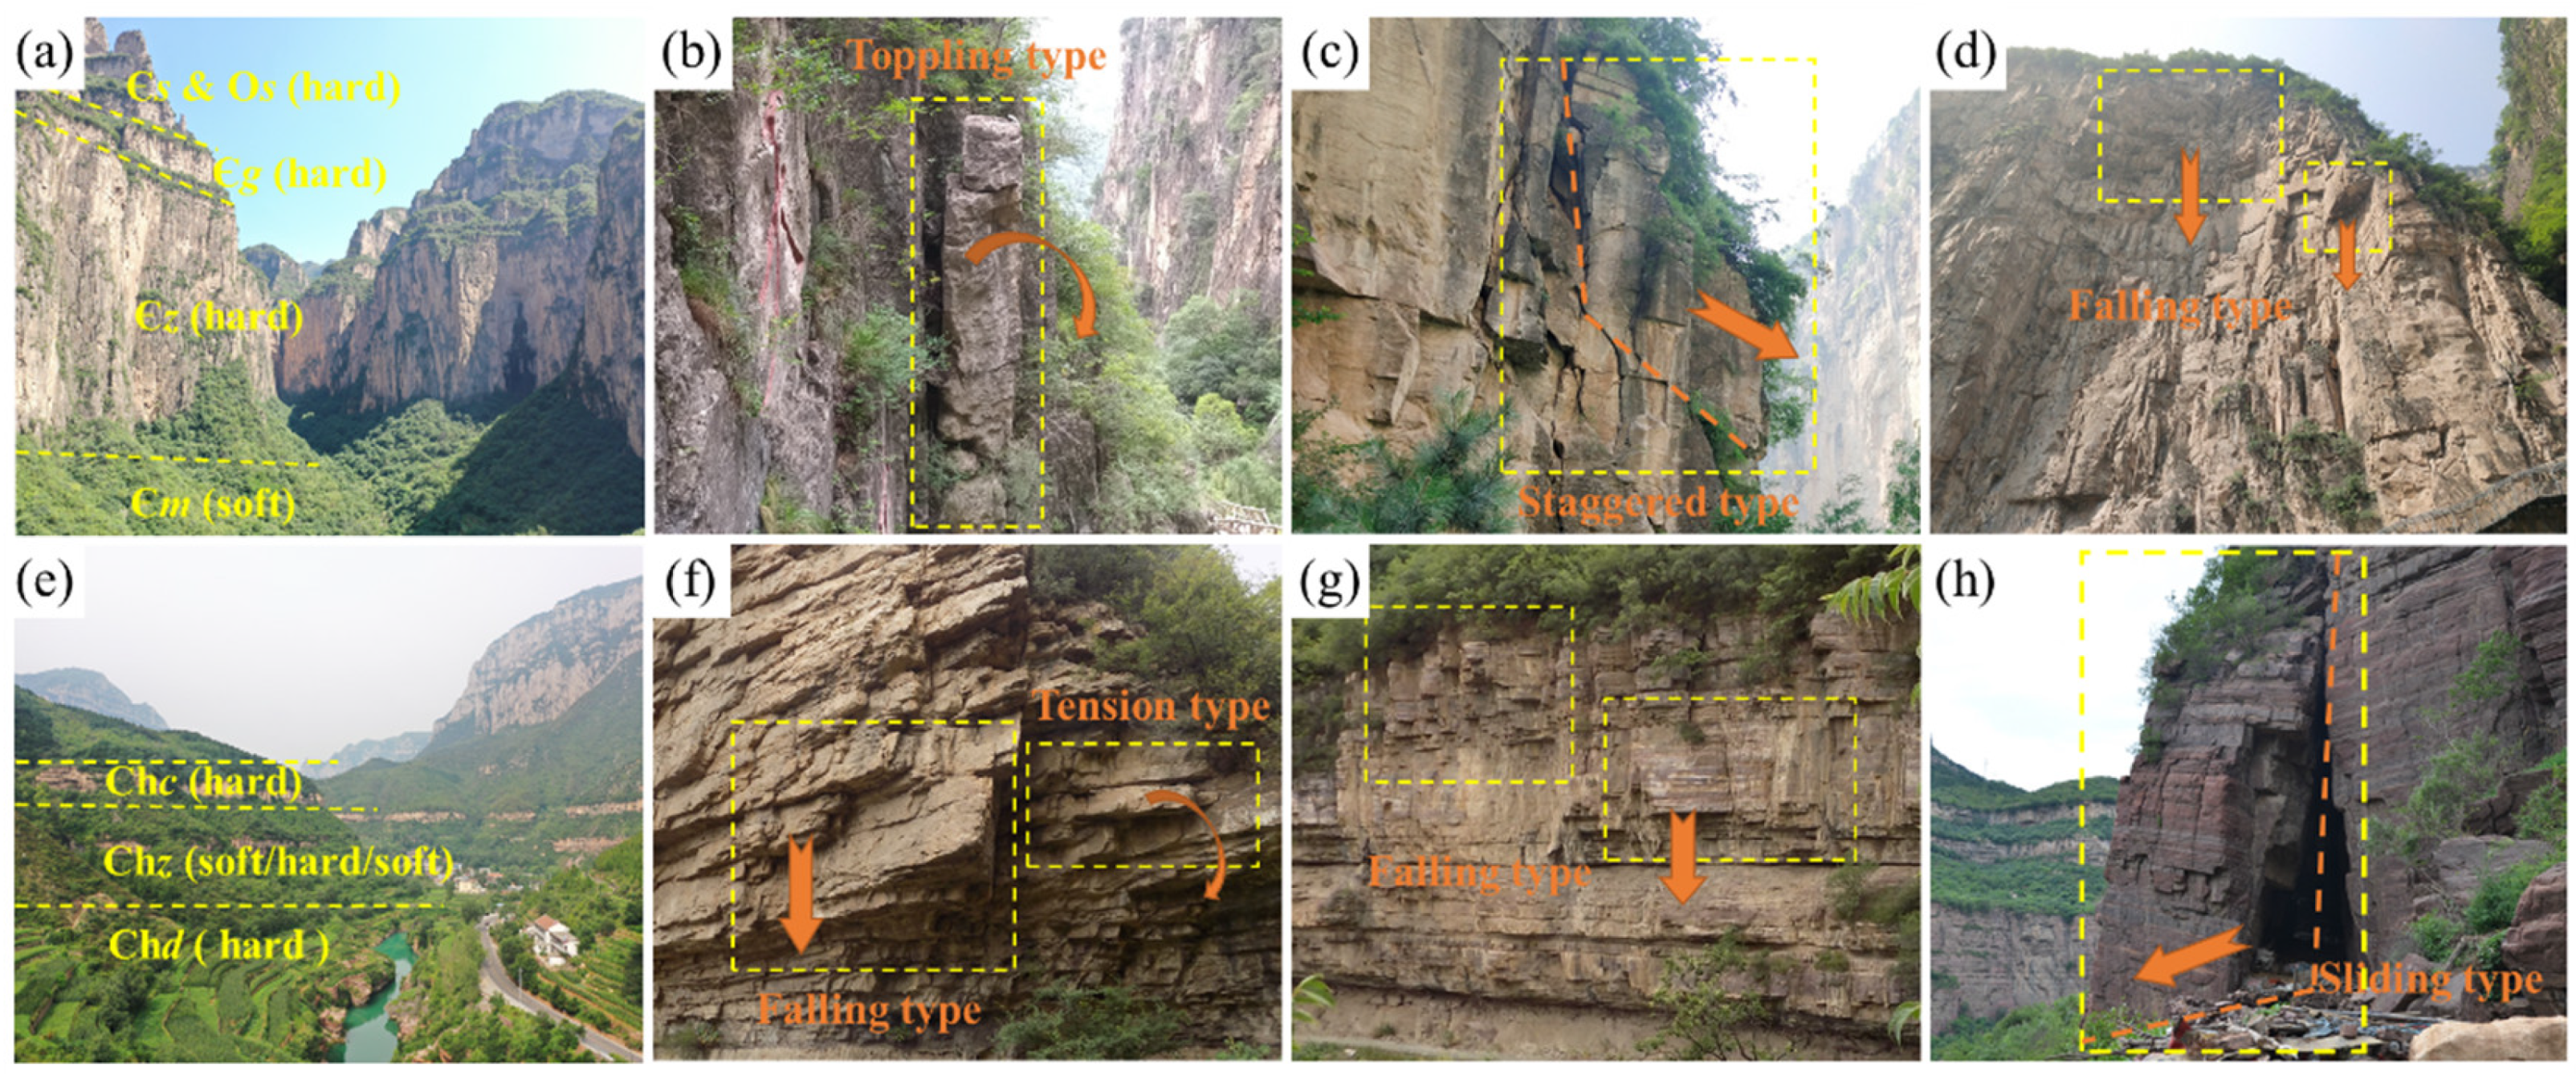
2.2.2. Types and Characteristics of Rockfall Events

Bedrock slopes are subject to various degrees of weathering, which may lead to fracturing, opening of joints and fissures [22,43]. The strata in the study area are generally characterized by soft-hard alternating structures (Figure 4), and the differences in lithology lead to a difference in the weathering resistance capabilities of the rock masses. Specifically, the underlying weak layers, such as mudstone and shale, are easily eroded to form rock cavities, which provide space for the development of rockfalls (Figure 5). Simultaneously, it also intensifies the propagation and opening of vertical joint sets and fissures in hard strata. Finally, a rockfall occurs under the action of the predisposing factors.
The exposed strata in Wangmang Gorge, Wuzhi Gorge, Hongdou Gorge in the west and Baquan Gorge in the middle of the study area are characterized by an upper hard and lower soft structure (Figure 4a and Figure 5a). The bottom part is soft mudstone and shale, and the upper part is hard limestone and dolomite. The exposed thickness of the limestone and dolomite in the upper part is large, which constitutes the main part of the canyon region. Moreover, two sets of vertical joints are usually developed, so tensile and unloading failure along the joints can easily occur. Therefore, the rock mass structures are considered the predisposing factors of rockfalls. As shown in Figure 5a–d, the failure modes of the rockfalls in this area are dominated by the falling type, toppling type and staggered type [44].
The exposed strata of the Qinglong Gorge in the east of the study area are characterized by a soft-hard alternating structure (Figure 4b and Figure 5e). The bottom part is hard quartzite sandstone of the Dahe formation with two sets of vertical joints, and the failure modes of rockfalls are mainly of the falling type and tension type (Figure 5f). The middle part is the stratum of the Zhaojiazhuang formation with soft-hard alternating sandwich structures, and the rockfall failure mode is mainly of the tensile type and falling type (Figure 5g). The upper part is hard quartzitic sandstone of the Changzhougou formation, and the failure mode is mainly of the sliding type and falling type (Figure 5h). Due to the presence of underlying weak layers and differential weathering, the upper part of the underlying weak layers in this region is prone to the development of large-scale, unstable, tower-shaped rock masses [43].
In addition, the unloading disturbance to the rock slopes caused by human engineering activities, such as road cutting, excavation and blasting, further intensifies the risk of rockfall events in the Taihang GCSA, and the failure mode of these rockfalls is mainly of the local small falling type and tension type (Figure 6).

3. Materials and Methods

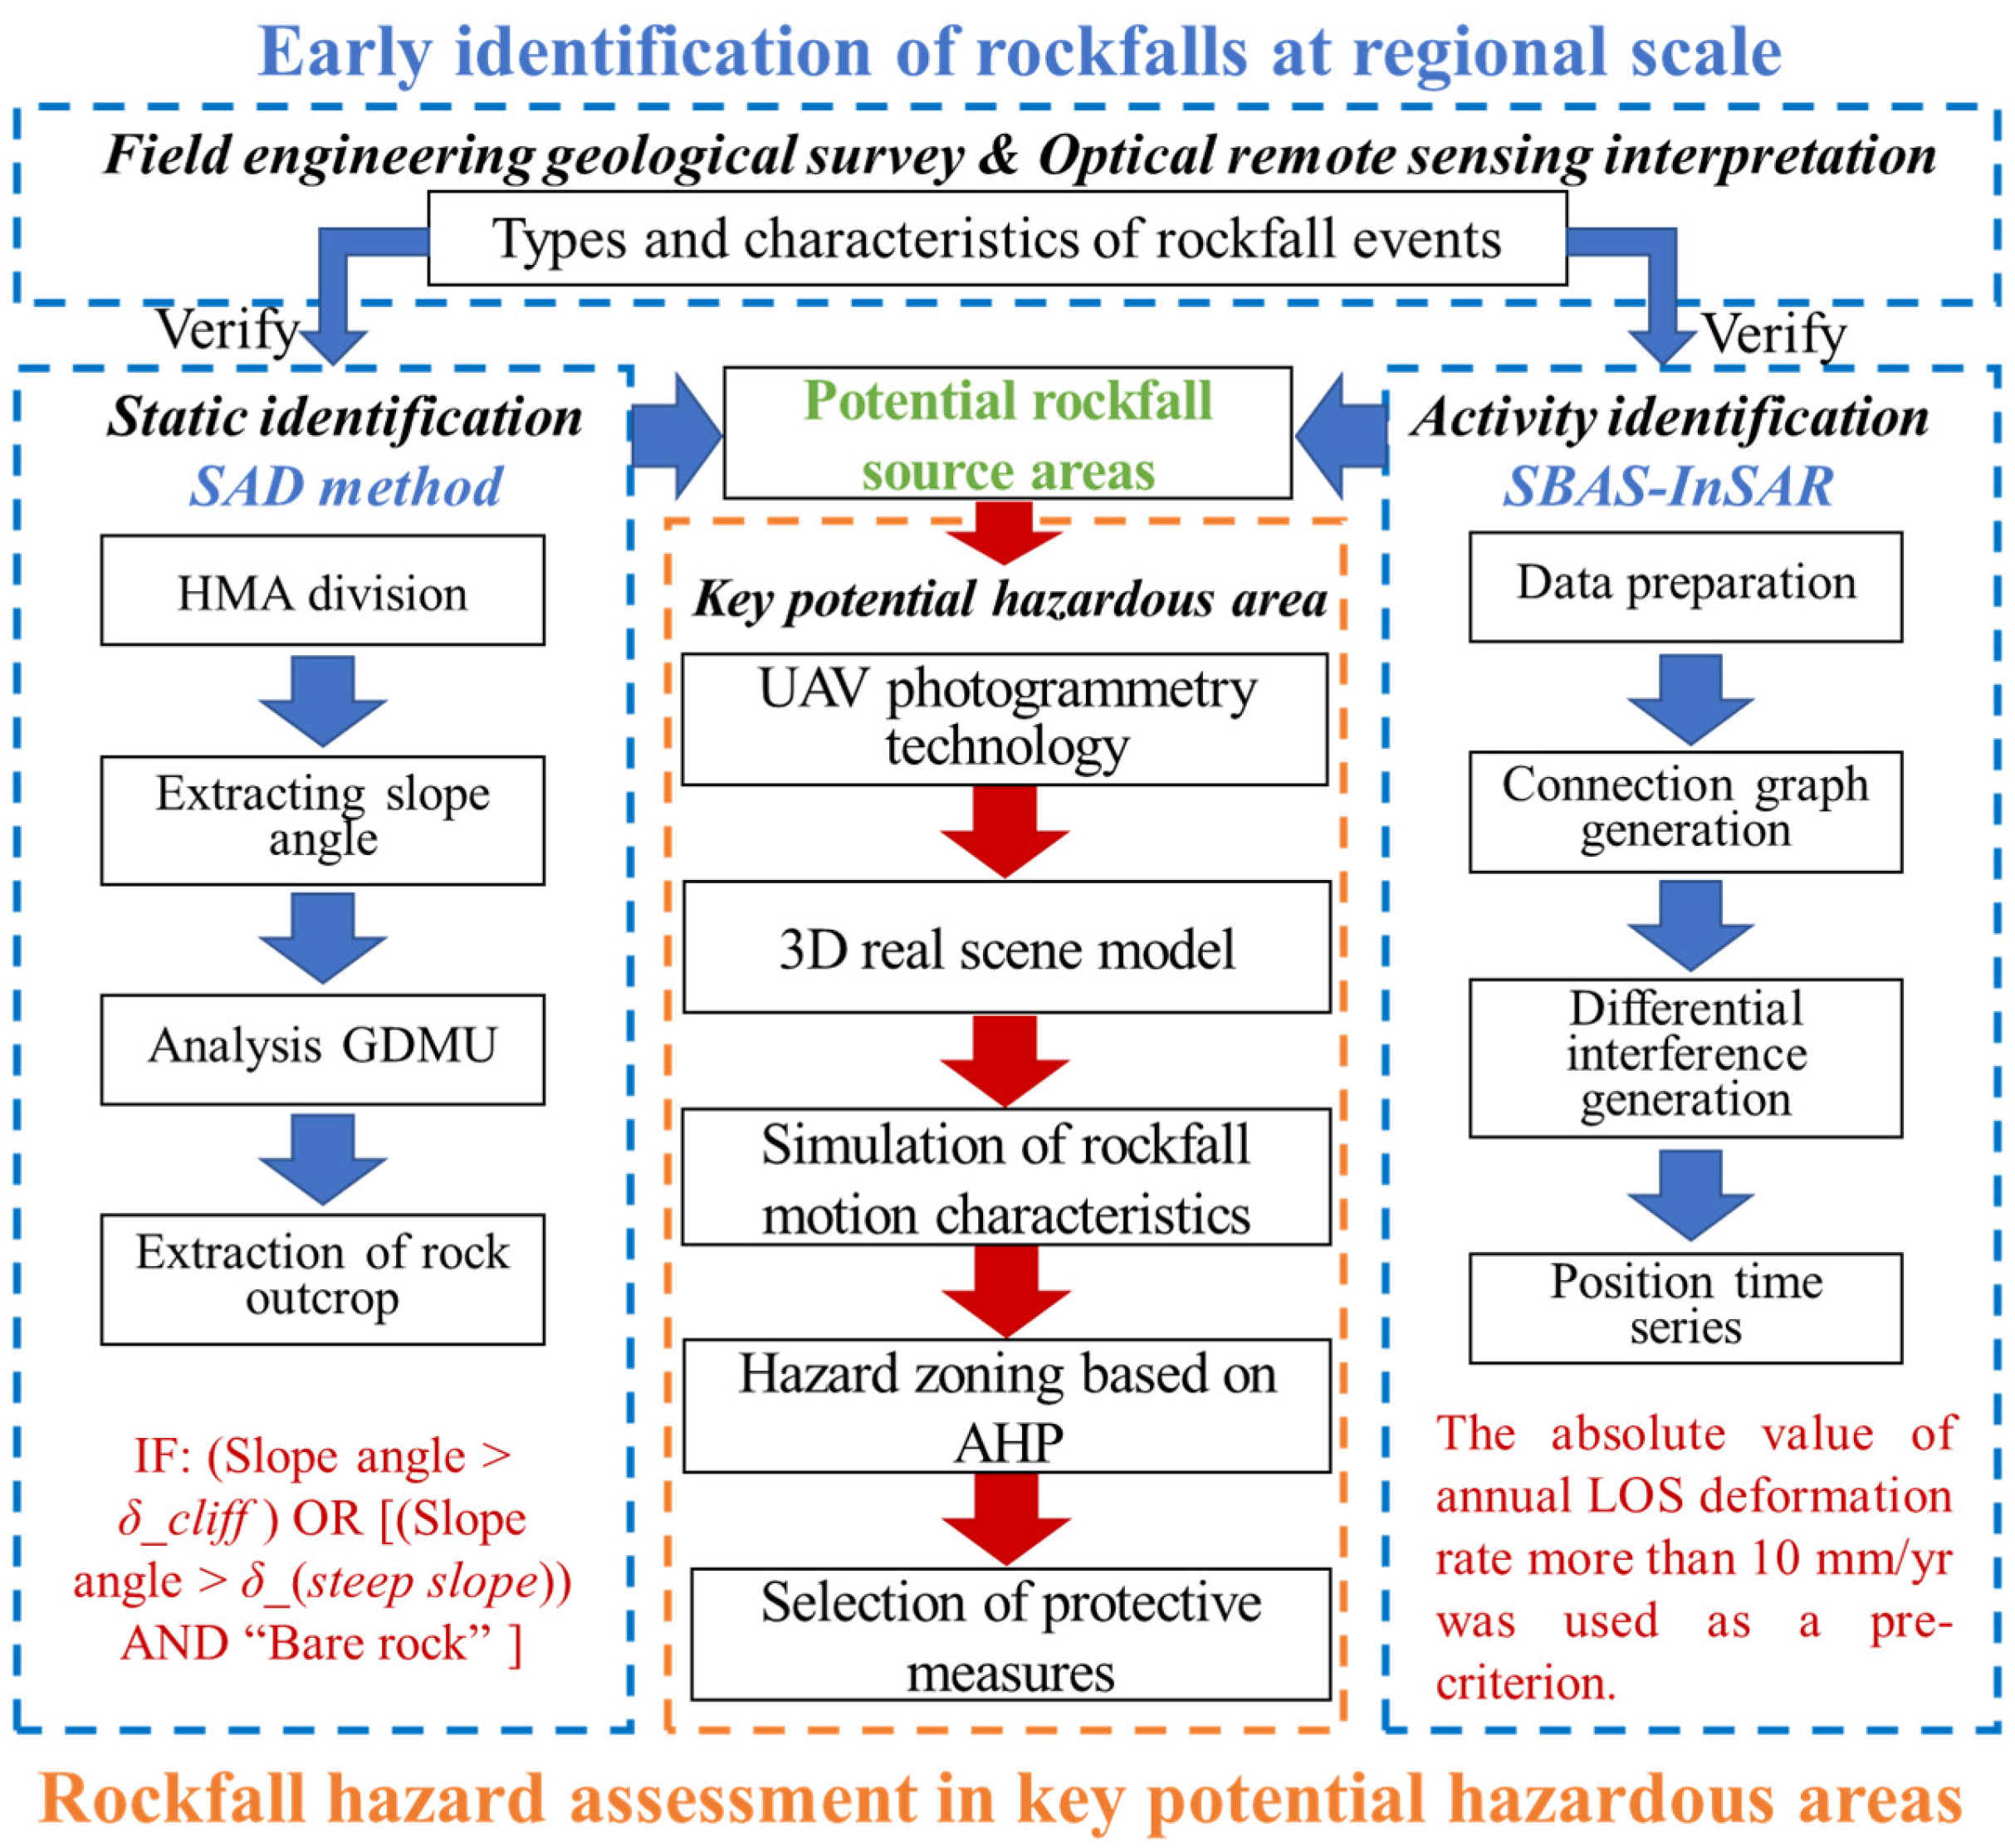
3.1. Identification of Potential Rockfall Sources at the Regional Scale

To assess the hazard of rockfall events and formulate effective prevention and control measures, the primary task is to accurately identify the potential rockfall source areas. Since the study area is a typical alpine canyon landform with high and steep cliffs (Figure 1), traditional optical remote sensing image interpretation and field investigation are often limited. To solve this issue, this study proposed an identification scheme for identifying potential rockfall sources at the regional scale suitable for alpine canyon regions (Figure 7). The scheme includes two parts: static identification and activity detection of rockfall source areas. Specifically, based on the high-precision topographic information and geotechnical properties, the SAD method is used for static identification of potential rockfall sources to preliminarily determine the possible location of rockfalls at the regional scale. In addition, it is assumed that the occurrence of rockfall events is related to the deformation of the rock surface [32,45]. Then, the small baseline subset InSAR (SBAS-InSAR) time series technique is used to detect the active deformation zone at hard-to-reach locations in the study area and determine the activity of the potential rockfall source areas.

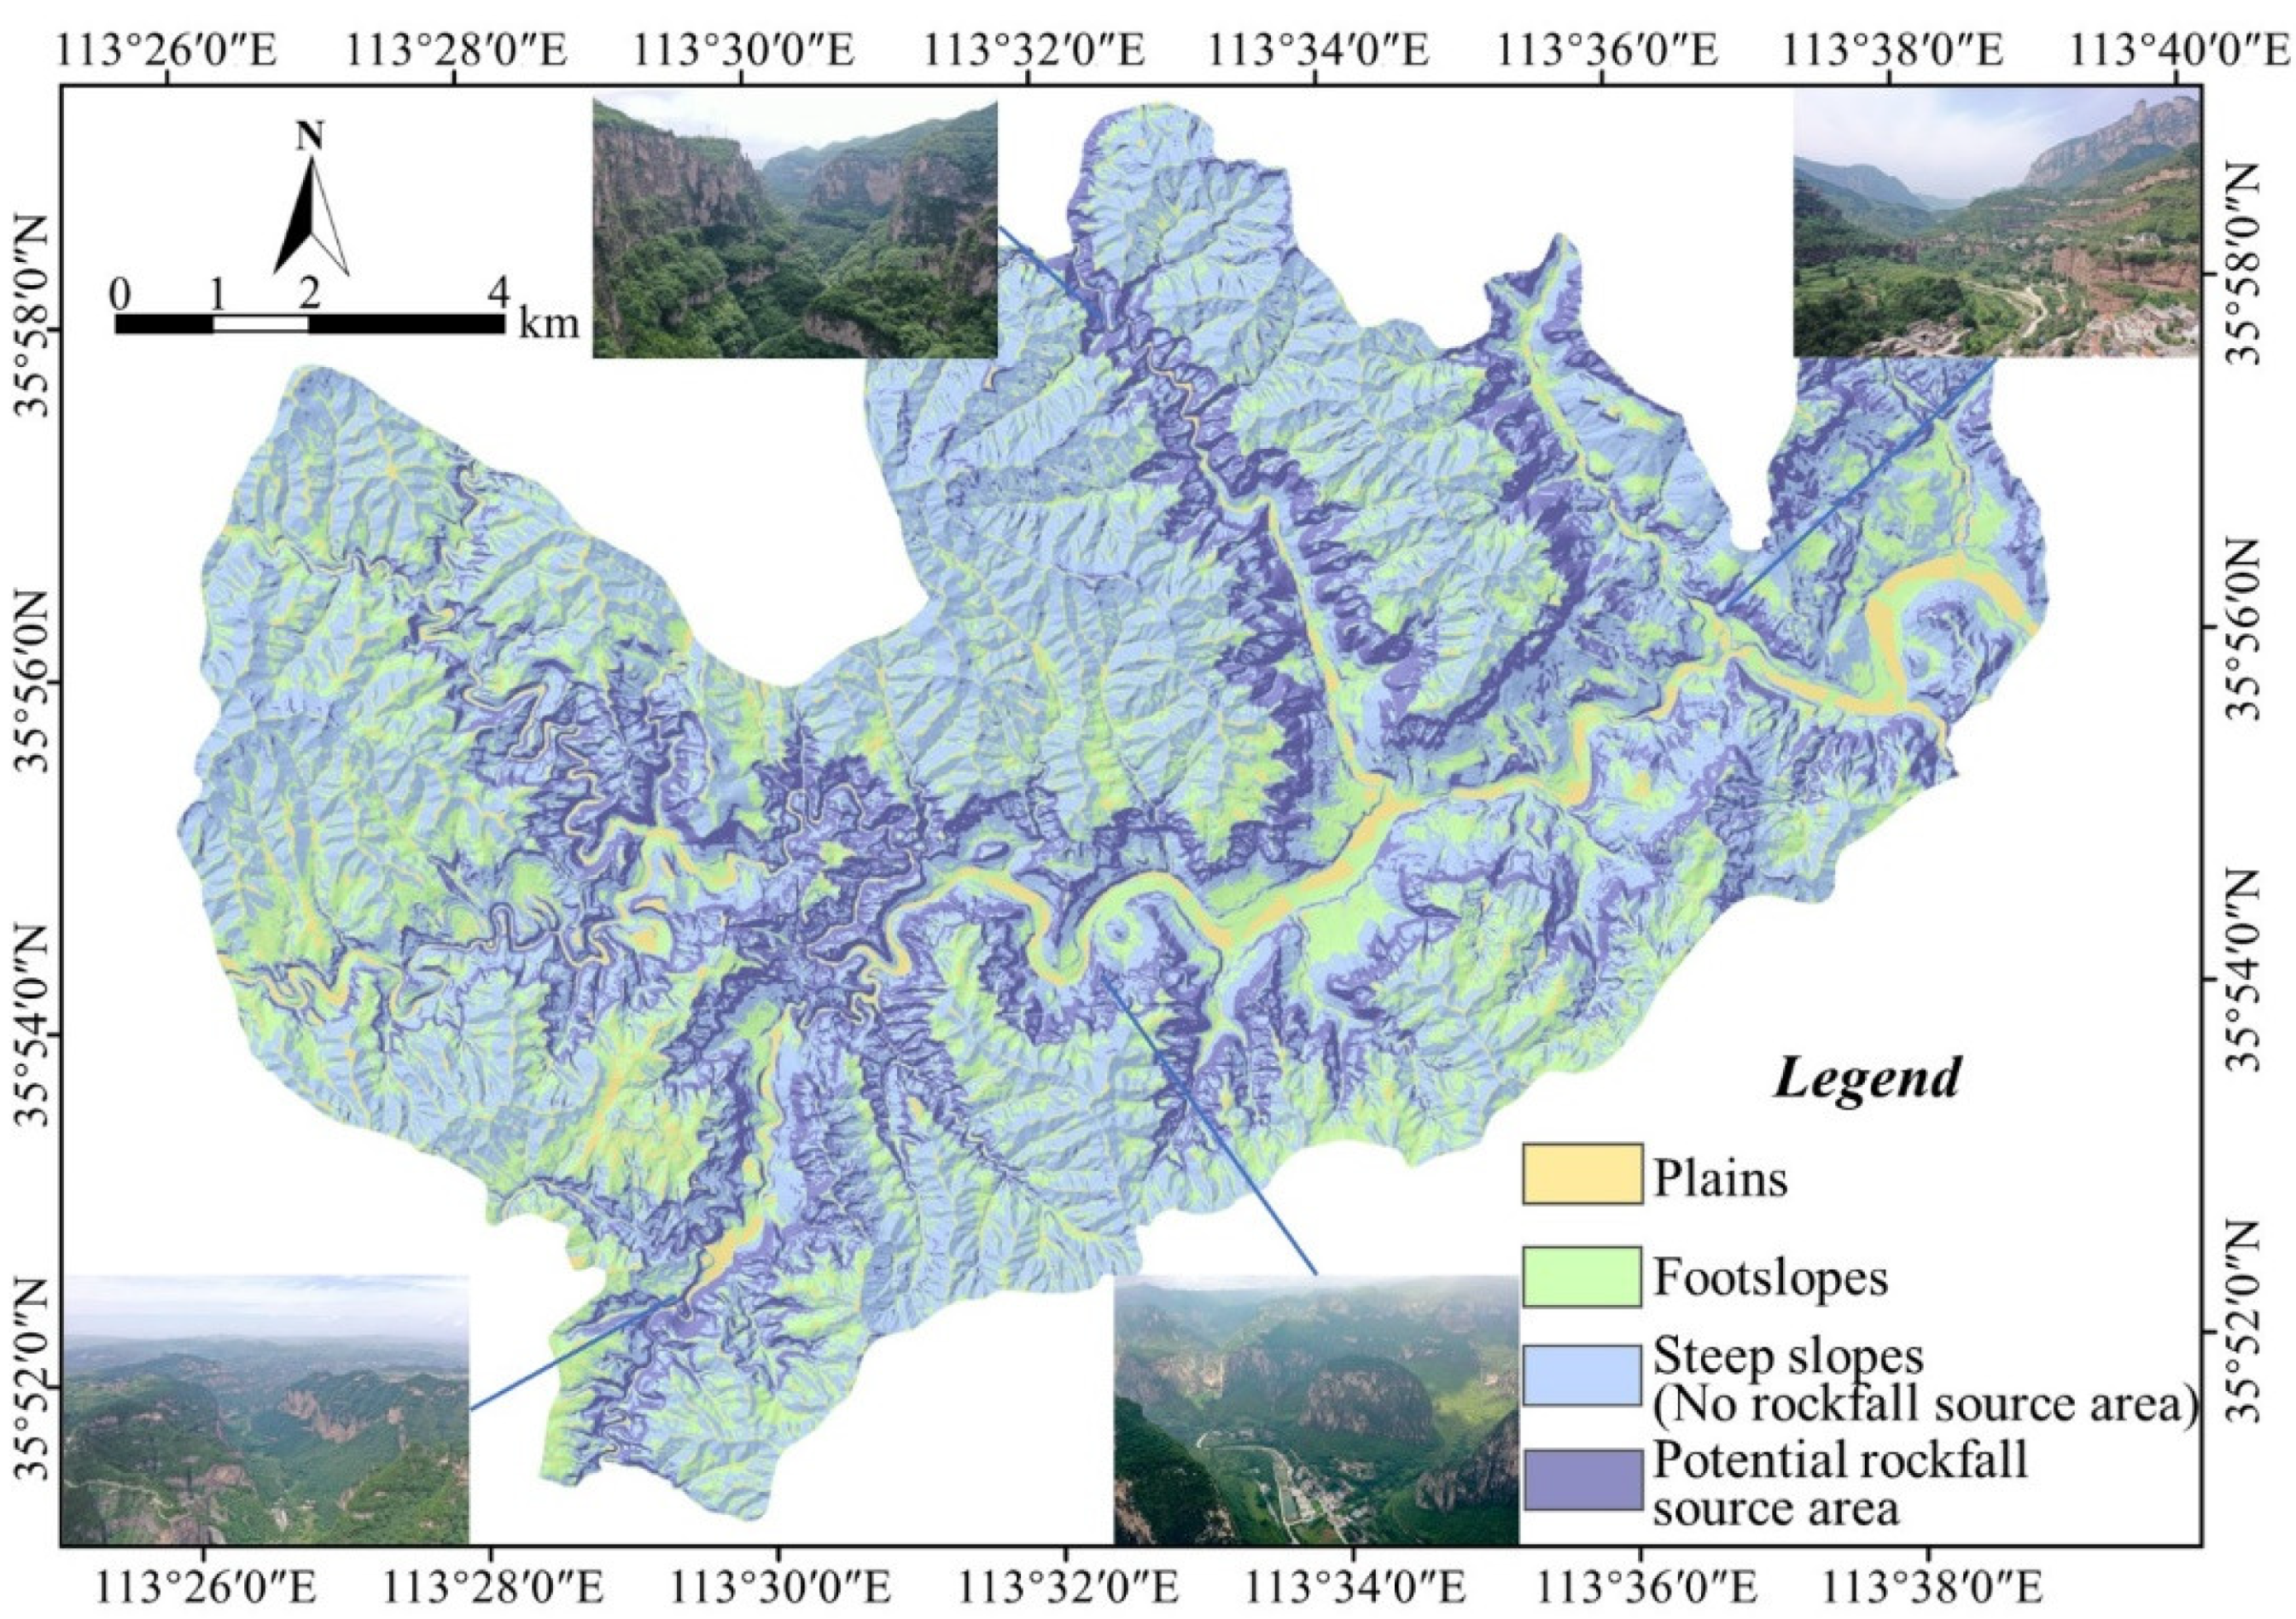
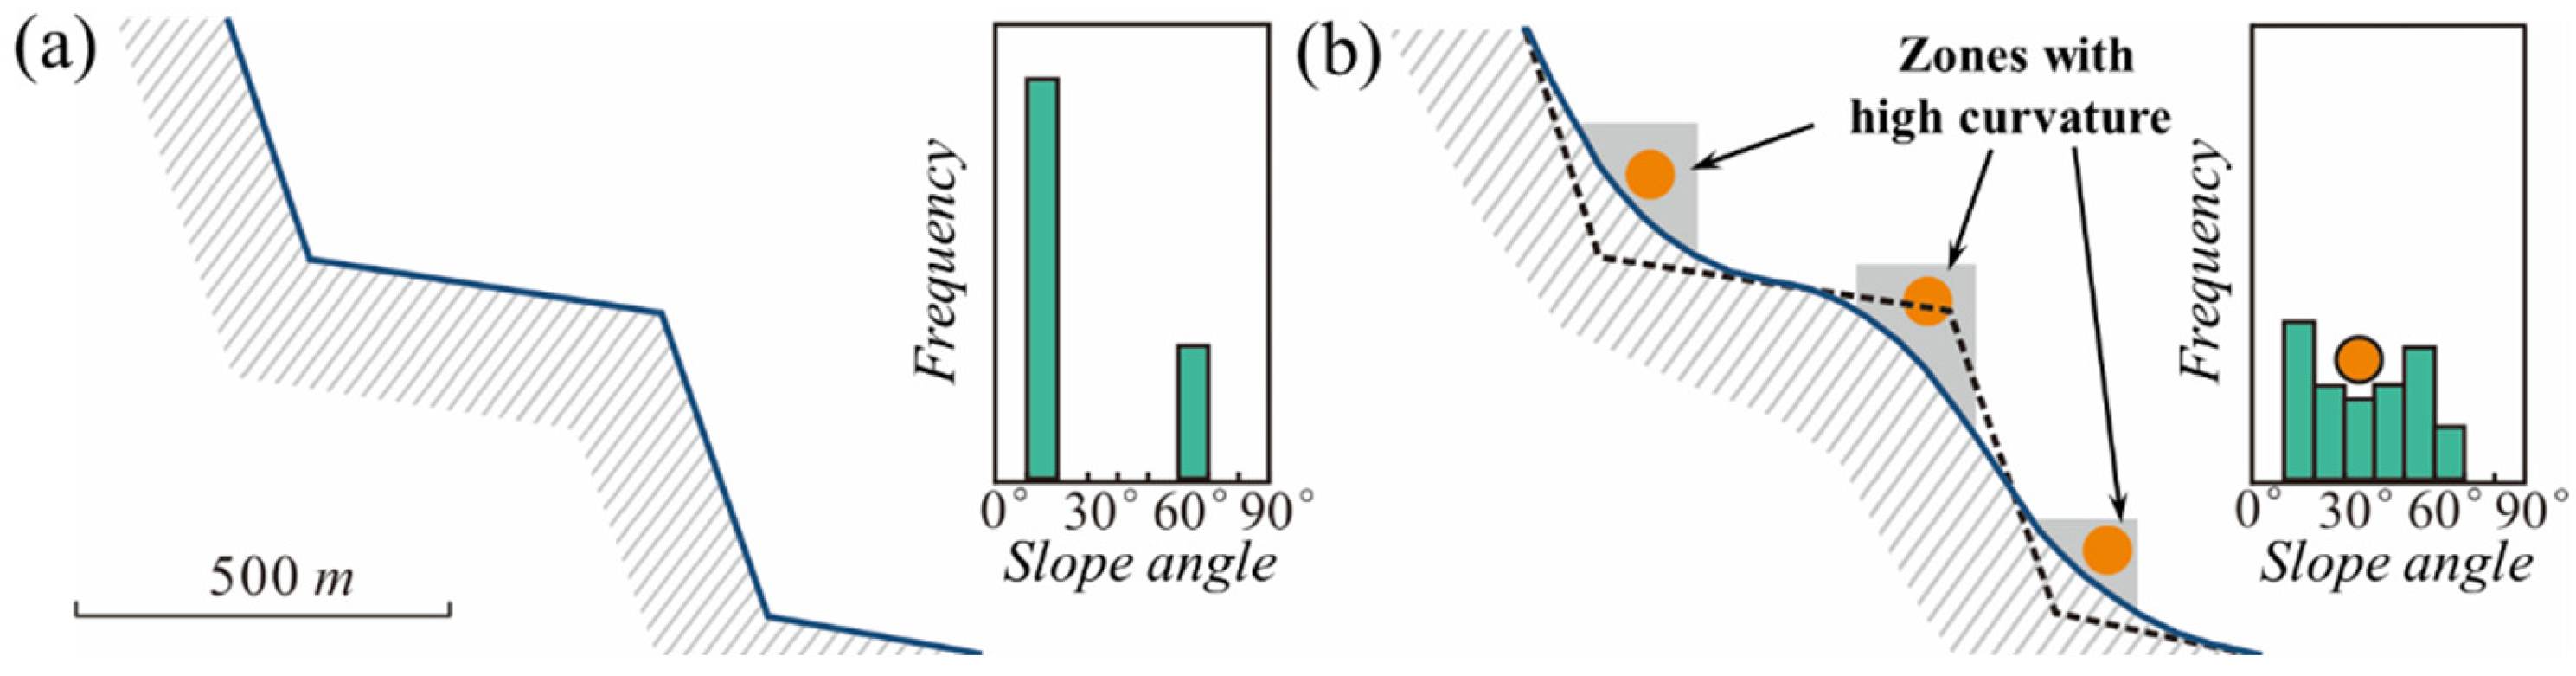
3.1.1. Static Identification of Potential Rockfall Sources at the Regional Scale

The core idea of the SAD method is to divide the geomorphologic units using the slope angle thresholds. Strahler (1950) [46] proposed that in an area with uniform lithology, soil, vegetation, climate and morphotectonic history, the SAD of each geomorphologic unit basically conforms to a Gaussian distribution with a low dispersion degree. Moreover, the mean slope angle is determined by a combination of the drainage density, topography and slope profile curvature.
Using the above assumptions, the study area is first divided into several homogeneous morphological areas (HMAs) following identical characteristics. Then, the SAD of each HMA is decomposed into the sum of several Gaussian distributions, in which each Gaussian distribution represents a specific morphological unit (MU). Since the SAD of each MU conforms to a Gaussian distribution, it is also called a GDMU. Finally, the slope angle range of the potential rockfall source area can be determined by analyzing the slope angle threshold of each GDMU [27]. The classification of MUs generally includes the following four types:
(1)
Plain: an area of low slope angles corresponding to the fluvial and fluvio-glacial deposits;
(2)
Footslope: an area of gentle slope angles at the lower part of a hillslope characterized by alluvial fans, debris flows and landslide deposits;
(3)
Steep slope: an area of steep slopes in till deposits and rocky outcrops covered with vegetation;
(4)
Cliff: an area of very steep slopes containing rocky outcrops.
As shown in Figure 8, a valley profile consists of two MUs (footslope and cliff) whose corresponding SAD varies randomly around their mean slope angles (20° for the footslope and 60° for the cliff). This indicates that the SAD of each MU conforms to a Gaussian distribution.
The SAD method mainly utilizes the high-resolution DEM (HRDEM). Since the effective surface area of each raster cell in the DEM depends on its slope angle, the actual terrain area represented by raster cells is determined by weighting each raster cell according to slope angle β. Specifically, the frequency of the slope angle distribution (wβ) is determined by the following equation:
w β = A h β A H M A cos β
where A is the total horizontal area of the DEM cells with a slope angle β and AHMA is the total area of the HMA considered. The weighted slope angle frequency obtained was used in the subsequent SAD decomposition.
The slope angles of each HMA were extracted from the 1:10,000 topographic map of the study area using the ArcGIS 10.1 software (ESRI Inc., Redlands, CA, USA), and the slope angles were reclassified at intervals of 1°. Then, the frequency of the slope angles was corrected based on Equation (1) and normalized. In this study, the decomposition of GDMUs was performed using the Excel-based application Histofit [27]. Histofit requires manual adjustment of the mean and standard deviation of each GDMU and then iteratively calculates the most likely Gaussian curves, whose sum is close to the SAD of the HMA.
The key of the SAD method for identifying potential rockfall source areas is the selection of slope angle thresholds. For the SAD decomposition obtained through the above process (Figure 9), the slope angle range of each MU is determined by the intersection point between each GDMU on the graph. Specifically, the rules for determining the potential rockfall source areas in this study are as follows (Figure 9) [47,48]:
(1)
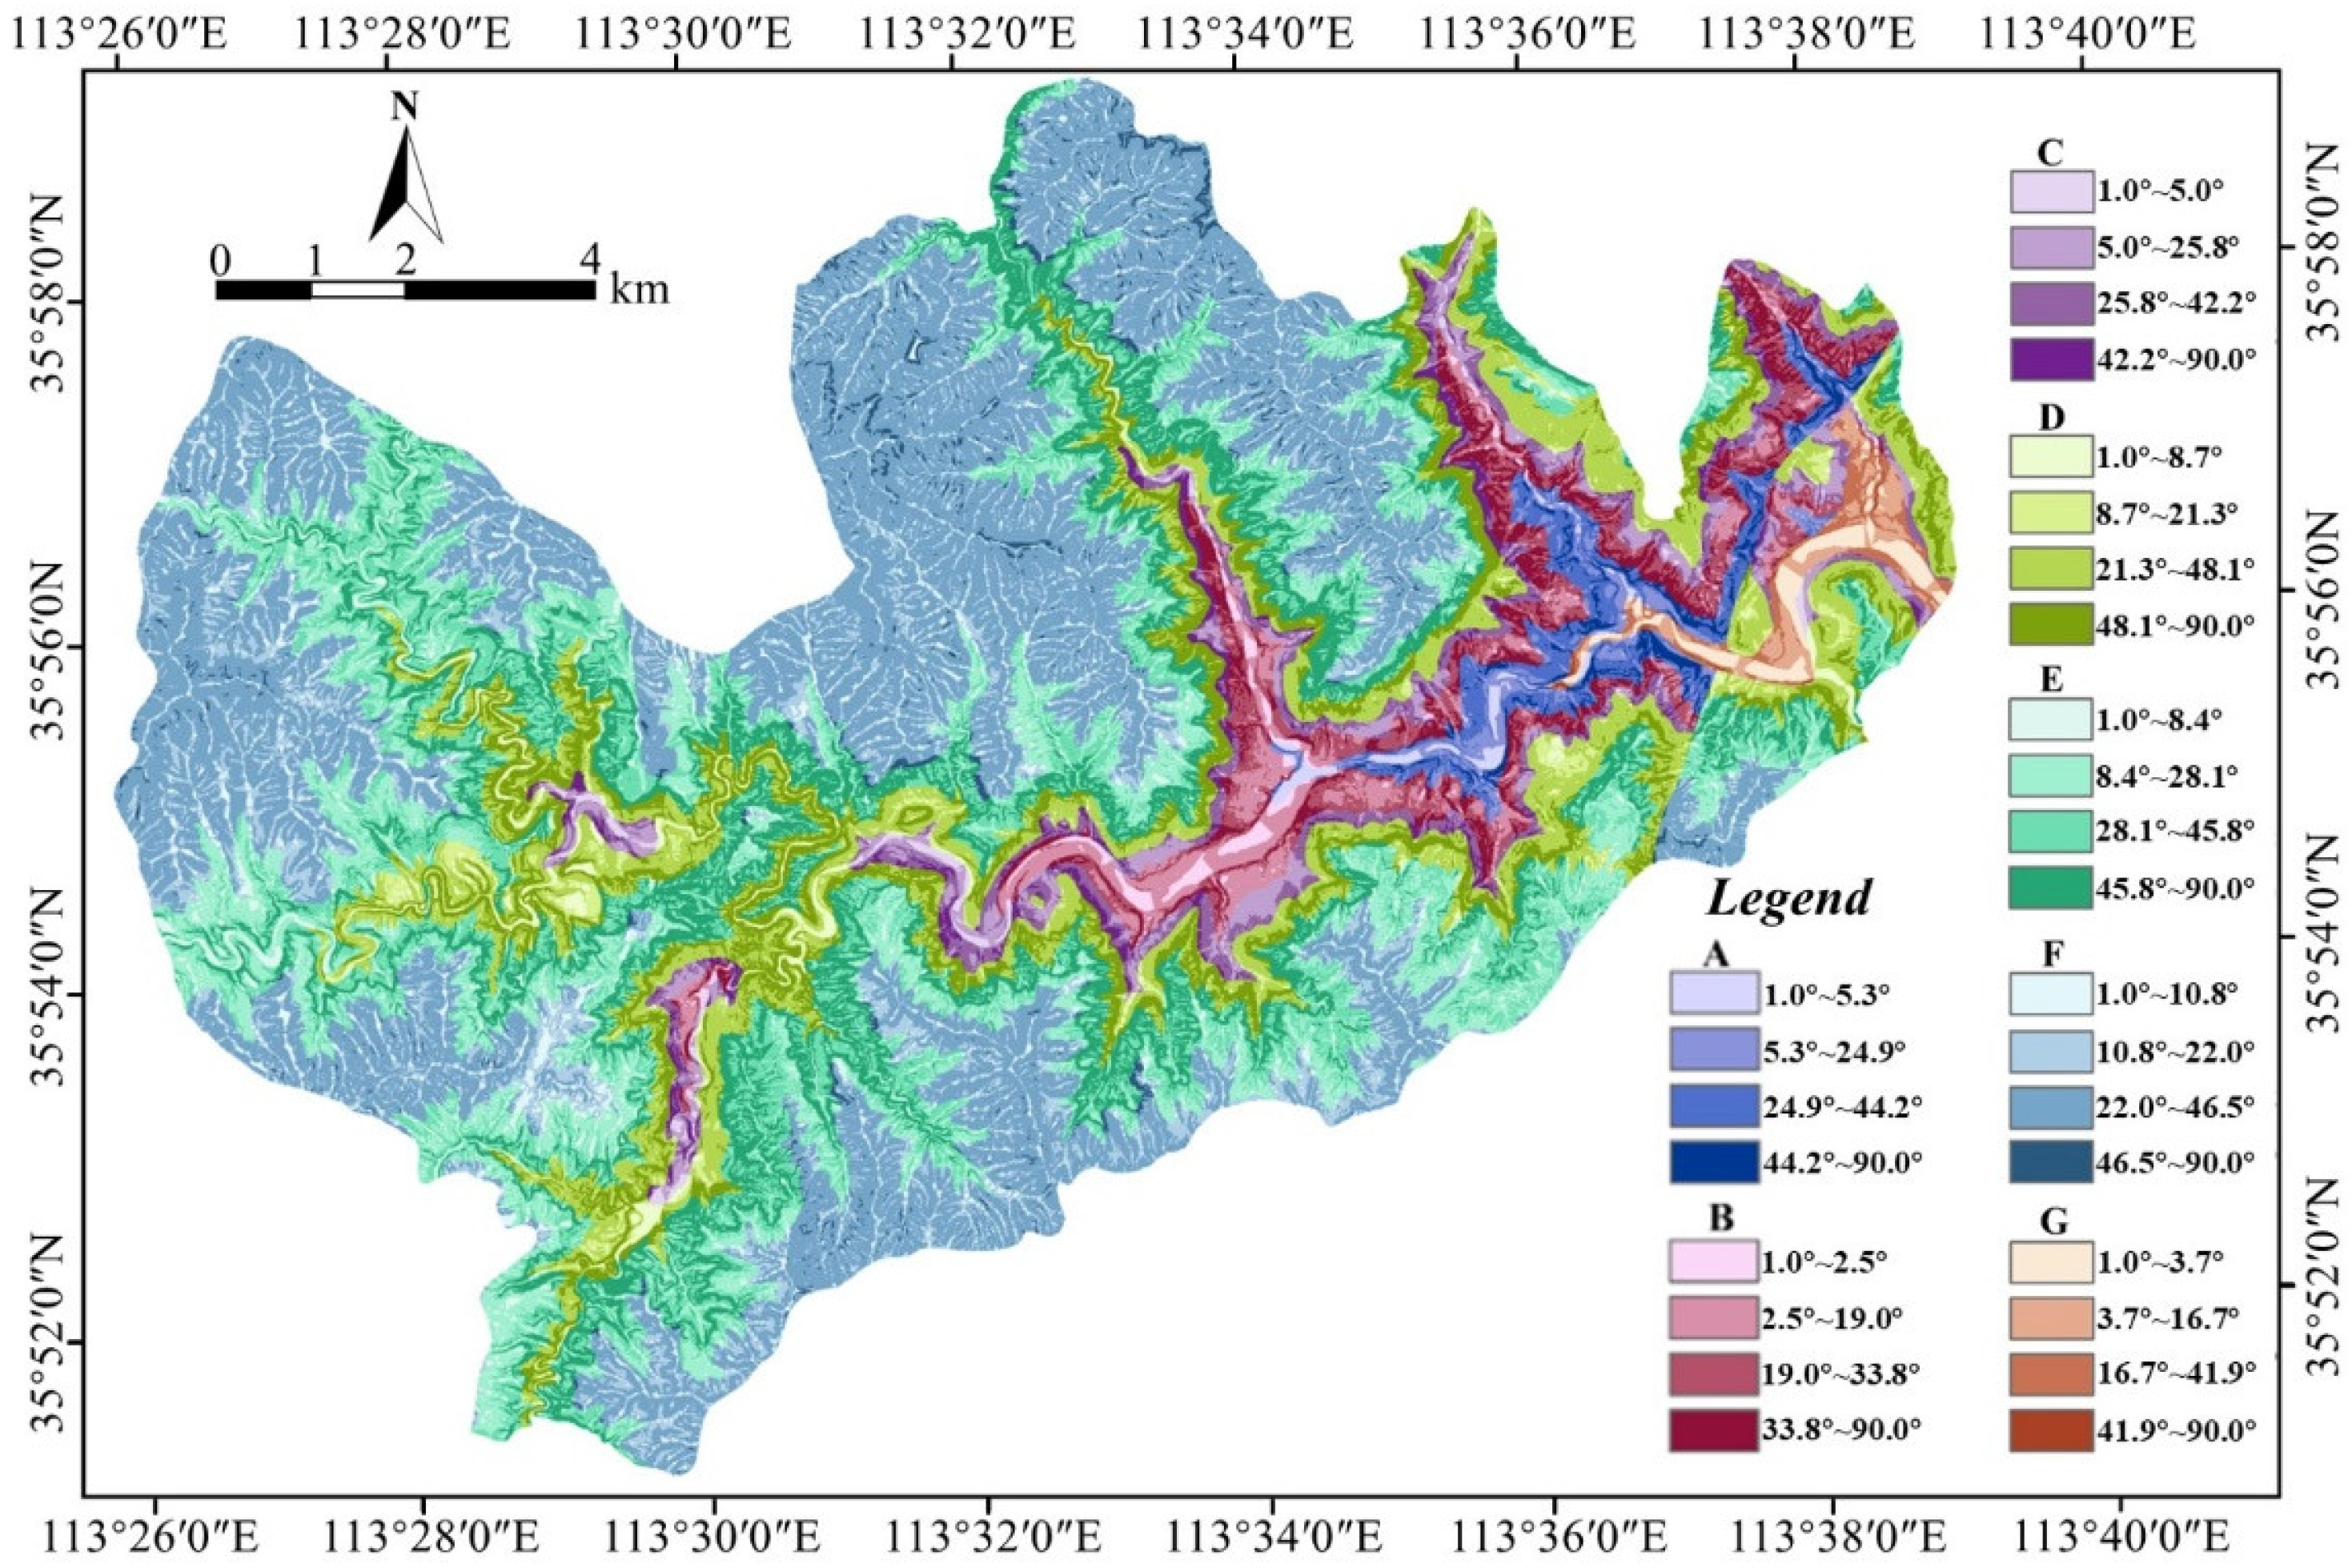
The intersection between the GDMU cliffs and the GDMU steep slopes is defined as the threshold slope angle (noted as A). All areas with slope angles greater than this threshold are considered potential rockfall source areas;
(2)
In some cases, the SAD decomposition does not contain the GDMU cliffs. At this time, the highest GDMU is specified as the steep slope MU;
(3)
In very steep terrain conditions, the SAD decomposition may contain two GDMU cliffs. In this case, the lower GDMU cliff is selected in step 1 to obtain the threshold value A;
(4)
Rockfalls may occur not only in GDMU cliffs but also in less steep terrain. In addition, if all of the GDMU steep slopes are lumped into the potential rockfall source area, especially when the slope is covered by vegetation or quaternary sediments, the potential source area will be overestimated. Thus, the potential rockfall sources are defined as zones above the mode of the GDMU steep slopes (noted as B) with bare surfaces.
In summary, the potential rockfall source area is identified by all DEM cells above the slope angle (point A), defined by the intersection of the GDMU steep slopes and GDMU cliffs and the rocky exposed areas steeper than point B. Notably, the thresholds of points A and B are directly controlled by the topographic and geomorphological conditions of the study area [27]. The literature review results indicate that the threshold ranges of points A and B are (25°, 61°) and (18°, 44°), respectively [19,47,48,49]. As the SAD method only uses the topographic information embedded in the HRDEM to identify the potential rockfall source areas, the above method is referred to as static identification of the rockfall source areas, and the results obtained are the static rockfall source areas.

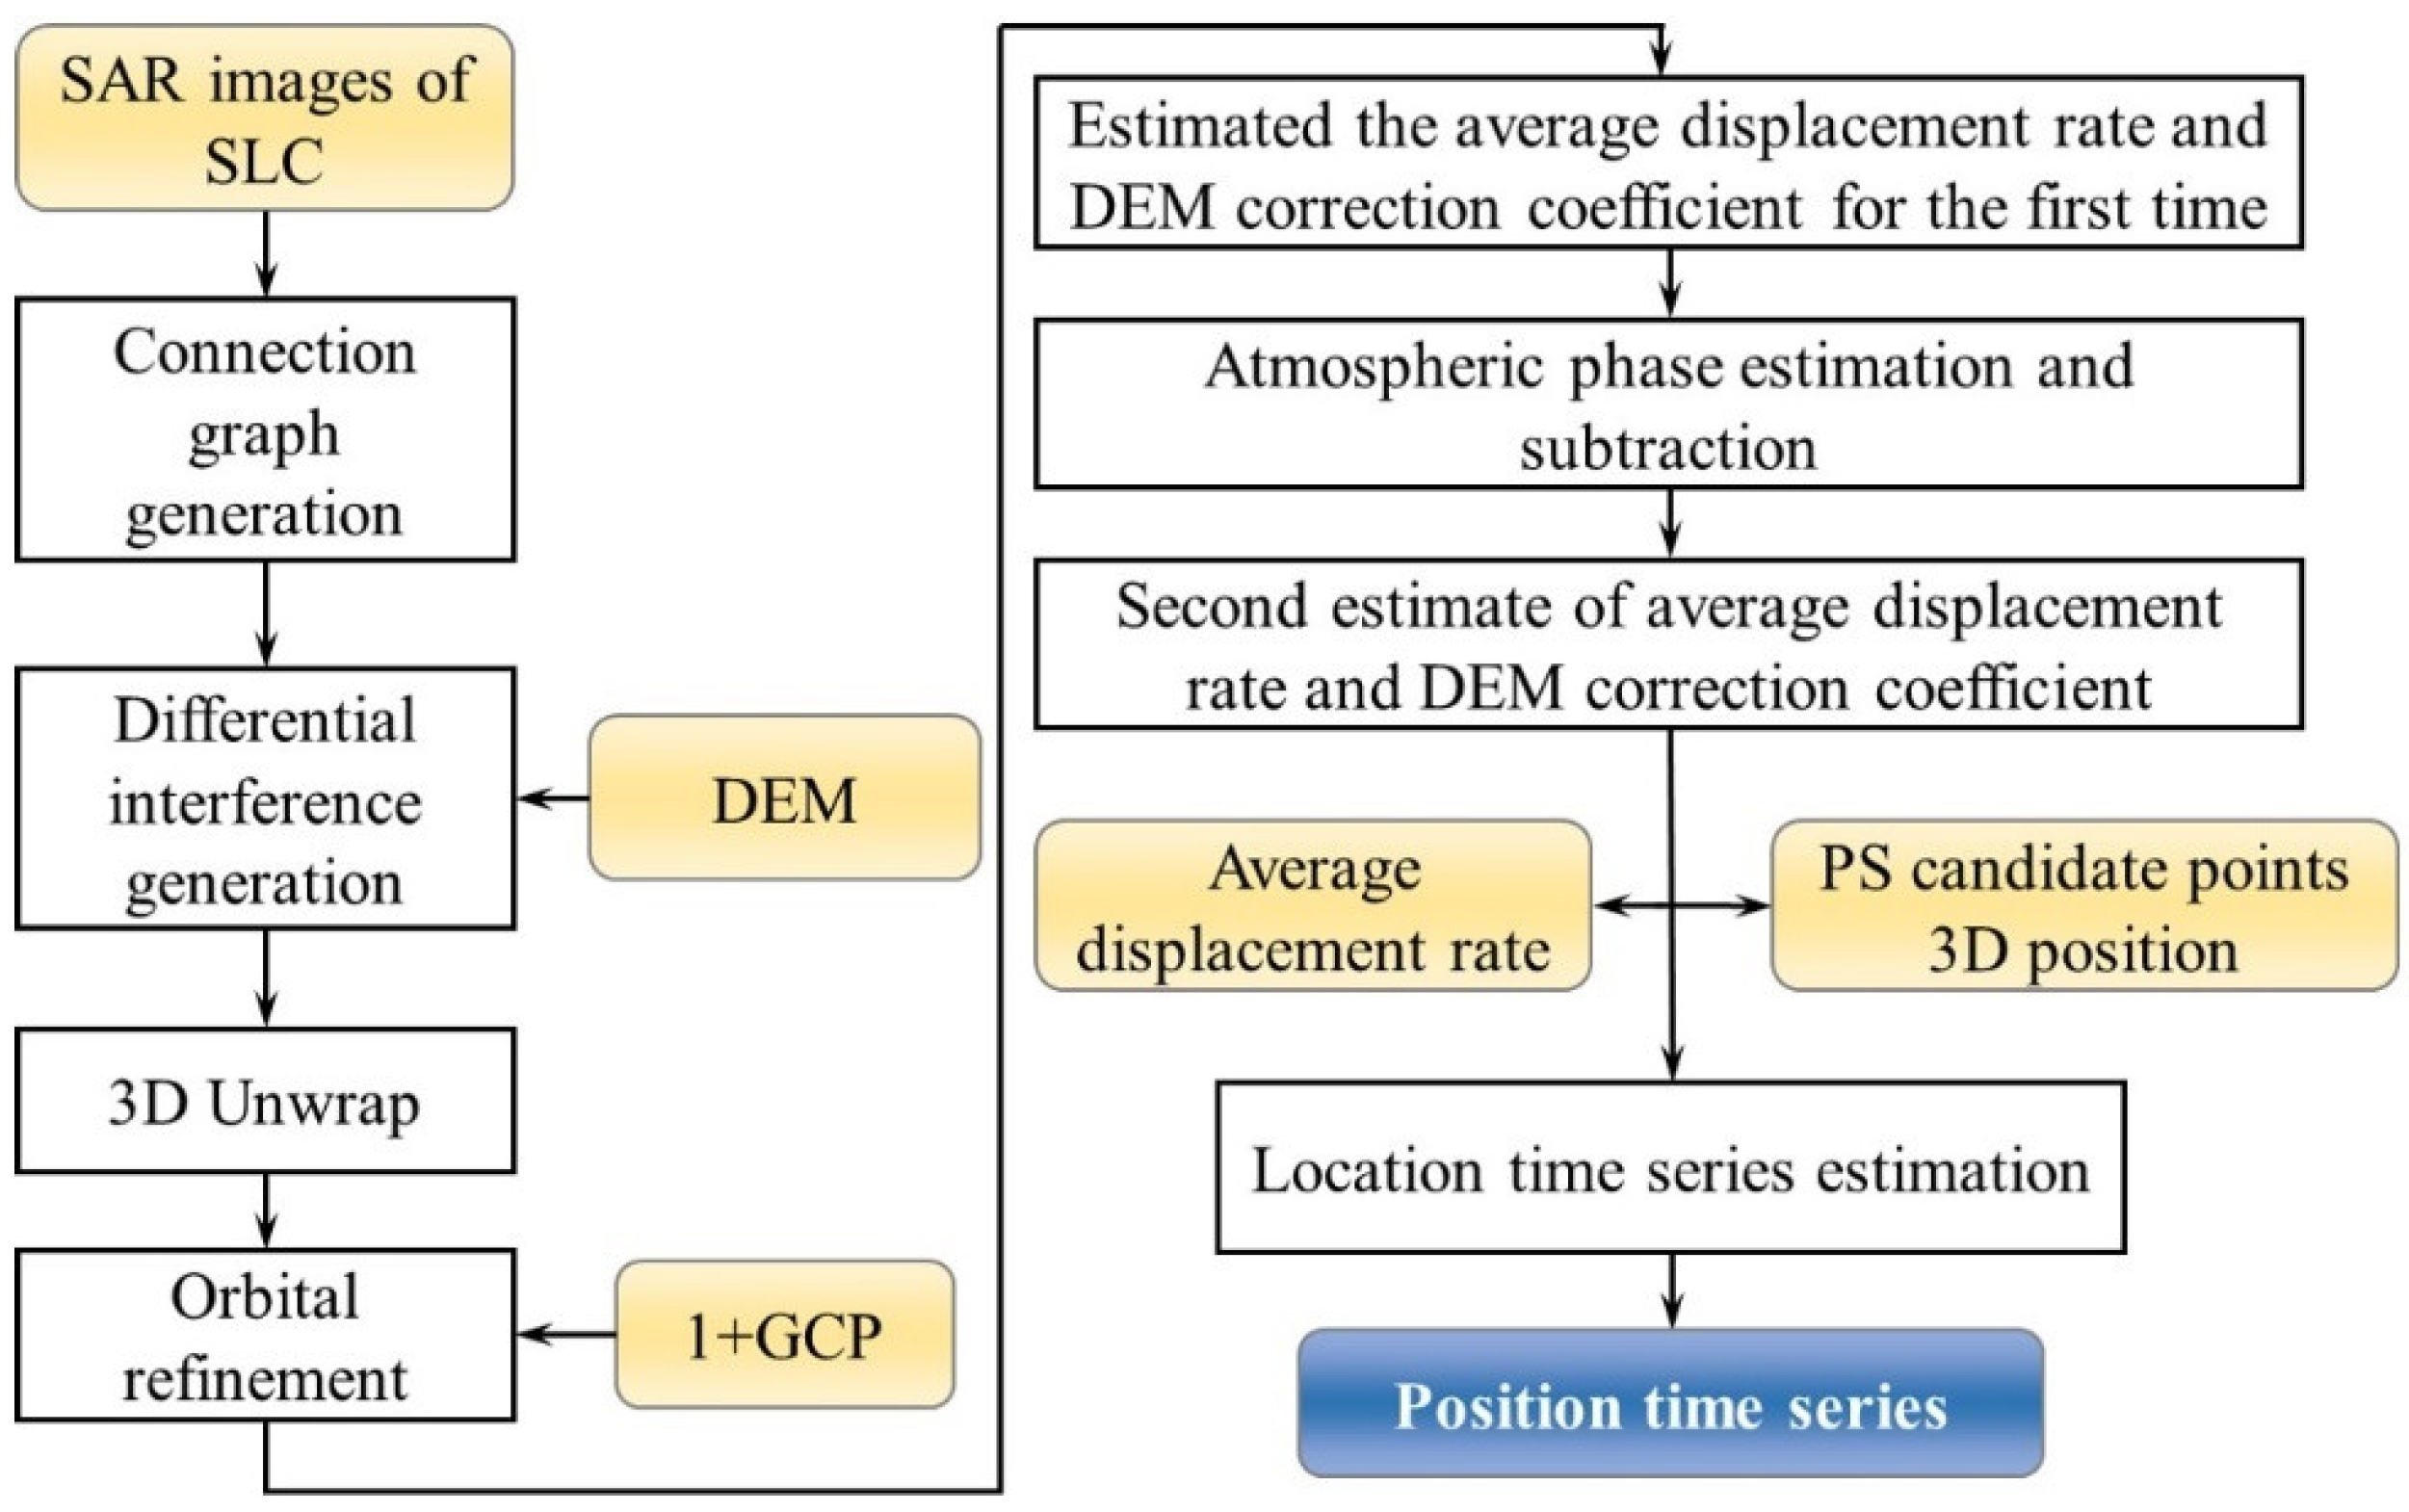
3.1.2. Activity Identification of Potential Rockfall Source Areas at the Regional Scale

To obtain more reliable deformation results, Berardino et al. [50] proposed the SBAS-InSAR technique, which can effectively reduce the influence of spatiotemporal decoherence and atmospheric delay and increase the temporal sampling frequency. The basic principle of the SBAS-InSAR technique is to use image pairs with short spatiotemporal baselines to generate interferograms to improve interferometry and then perform the phase-unwrapping of the SAR interferograms [51]. The specific technical flowchart of the SBAS-InSAR technique is shown in Figure 10.
Assuming that N + 1 phase SAR data were obtained in chronological order (t0, … , tN), one of them was selected as the main image, and the other N phase images were registered with the main image. By setting reasonable thresholds for the spatial-temporal baselines, M differential interferograms with good coherence were formed, and M satisfied the following inequality (N is odd):
N + 1 2 M N N + 1 2
For the interferogram j obtained from two SAR images at tA and tB (tA < tB), the interference phase of the pixel with the azimuth and range coordinates (x, r) can be expressed as
δ ϕ j ( x , r ) = ϕ ( t B , x , r ) ϕ ( t A , x , r ) Δ ϕ d i s p + Δ ϕ t o p o + Δ ϕ a t m + Δ ϕ o r b + Δ ϕ n o i s e
where ϕ(tB, x, r) and ϕ(tA, x, r) represent the phase value of the SAR image at moments tB and tA, respectively, ∆ϕdisp is the deformation phase along the line-of-sight (LOS) direction between tA and tB, ∆ϕtopo is the residual topographic phase caused by the inaccuracy of the reference DEM, ∆ϕatm is atmospheric phase error, ∆ϕorb is the phase error caused by the baseline orbit and ∆ϕnoise is the random phase noise error. Therefore, the LOS deformation ∆ϕdisp can be obtained by removing the residual component in the interferometric phase. In addition, positive LOS displacement indicates the ground moved toward the satellite, while a negative value indicates moving away from the satellite.
For M differential interferograms, a set of M equations with N unknowns can be defined as
A ϕ = δ ϕ
where A is a matrix of dimensions M × N and ϕ = (ϕ(t1), ϕ(t2),…, ϕ(tN))T is the unknown deformation phase N × 1 vector based on the measurement point. Therefore, the vector of the unwrapped phase values associated with differential interferograms can be expressed as δϕ = (δϕ(t1), δϕ(t2),…, δϕ(tN))T. To obtain the deformation velocity, Equation (4) can be rewritten as follows:
B v = δ ϕ
where B is a matrix of dimensions M × N and v is the mean phase velocity, which can be expressed as
v = [ v 1 , v 2 , , v N ] T = [ ϕ 1 t 1 t 0 , ϕ 2 ϕ 1 t 2 t 1 , , ϕ N ϕ N 1 t N t N 1 ] T
If the matrix B is a column rank-full matrix (i.e., MN), the deformation velocity can be obtained using Equation (5) by applying the least square method. In addition, when the rank of matrix B is deficient (i.e., MN), the deformation velocity can be estimated using the singular value decomposition (SVD) method. After solving for the deformation velocity, the velocity of each period can be integrated to estimate the shape variable of each period.
The InSAR data used in this study were from the European Space Agency observation satellite Sentinel-1A launched on 3 April 2014. The time span of the data used was from 4 January 2021 to 30 December 2021, with a total of 31 views (see Table 1 for detailed parameters). In this study, the 30-m resolution DEM from the NASA Shuttle Radar Topography Mission was used for removing the topographic phase from interferograms.
Considering the undulating terrain and extensive vegetation coverage in the alpine canyon areas, the Delaunay minimum cost flow method [52] was employed for phase unwrapping to reduce the influence of vegetation and other factors. Then, multi-view and Goldstein filters were applied to remove noise, where the multi-view ratio was 1:6 [53]. Considering that the reliability of SBAS-InSAR results can be effectively improved by using stable ground control points (GCPs) [54], this study extracted permanent scatterers [55] as GCPs and introduced them into the processing flow of the SBAS-InSAR method (Figure 10). The GCPs were used for estimating and removing the residual constant phases and phase ramps that still existed after unwrapping [56].
To estimate the deformation rate and residual topography, a linear model of the deformation coefficient and elevation coefficient for each coherent point was established and solved by the SVD method. Finally, the atmospheric phase at each time point was estimated and removed using time domain high-pass filtering and low-pass filtering techniques to obtain the final deformation results for the time series.

3.2. Rockfall Hazard Assessment in Key Potential Hazardous Areas

After locating the potential rockfall source area at the regional scale, a high-precision 3D real scene model can be built for the high and steep cliffs in the canyon region to simulate the rockfall movement process and obtain the disaster-causing factors, such as rockfall trajectory, frequency, bounce height, speed and kinematic energy. Then, the rockfall hazard assessment scheme can be established, which can lay the foundation for the subsequent refined prevention and control of rockfall events.

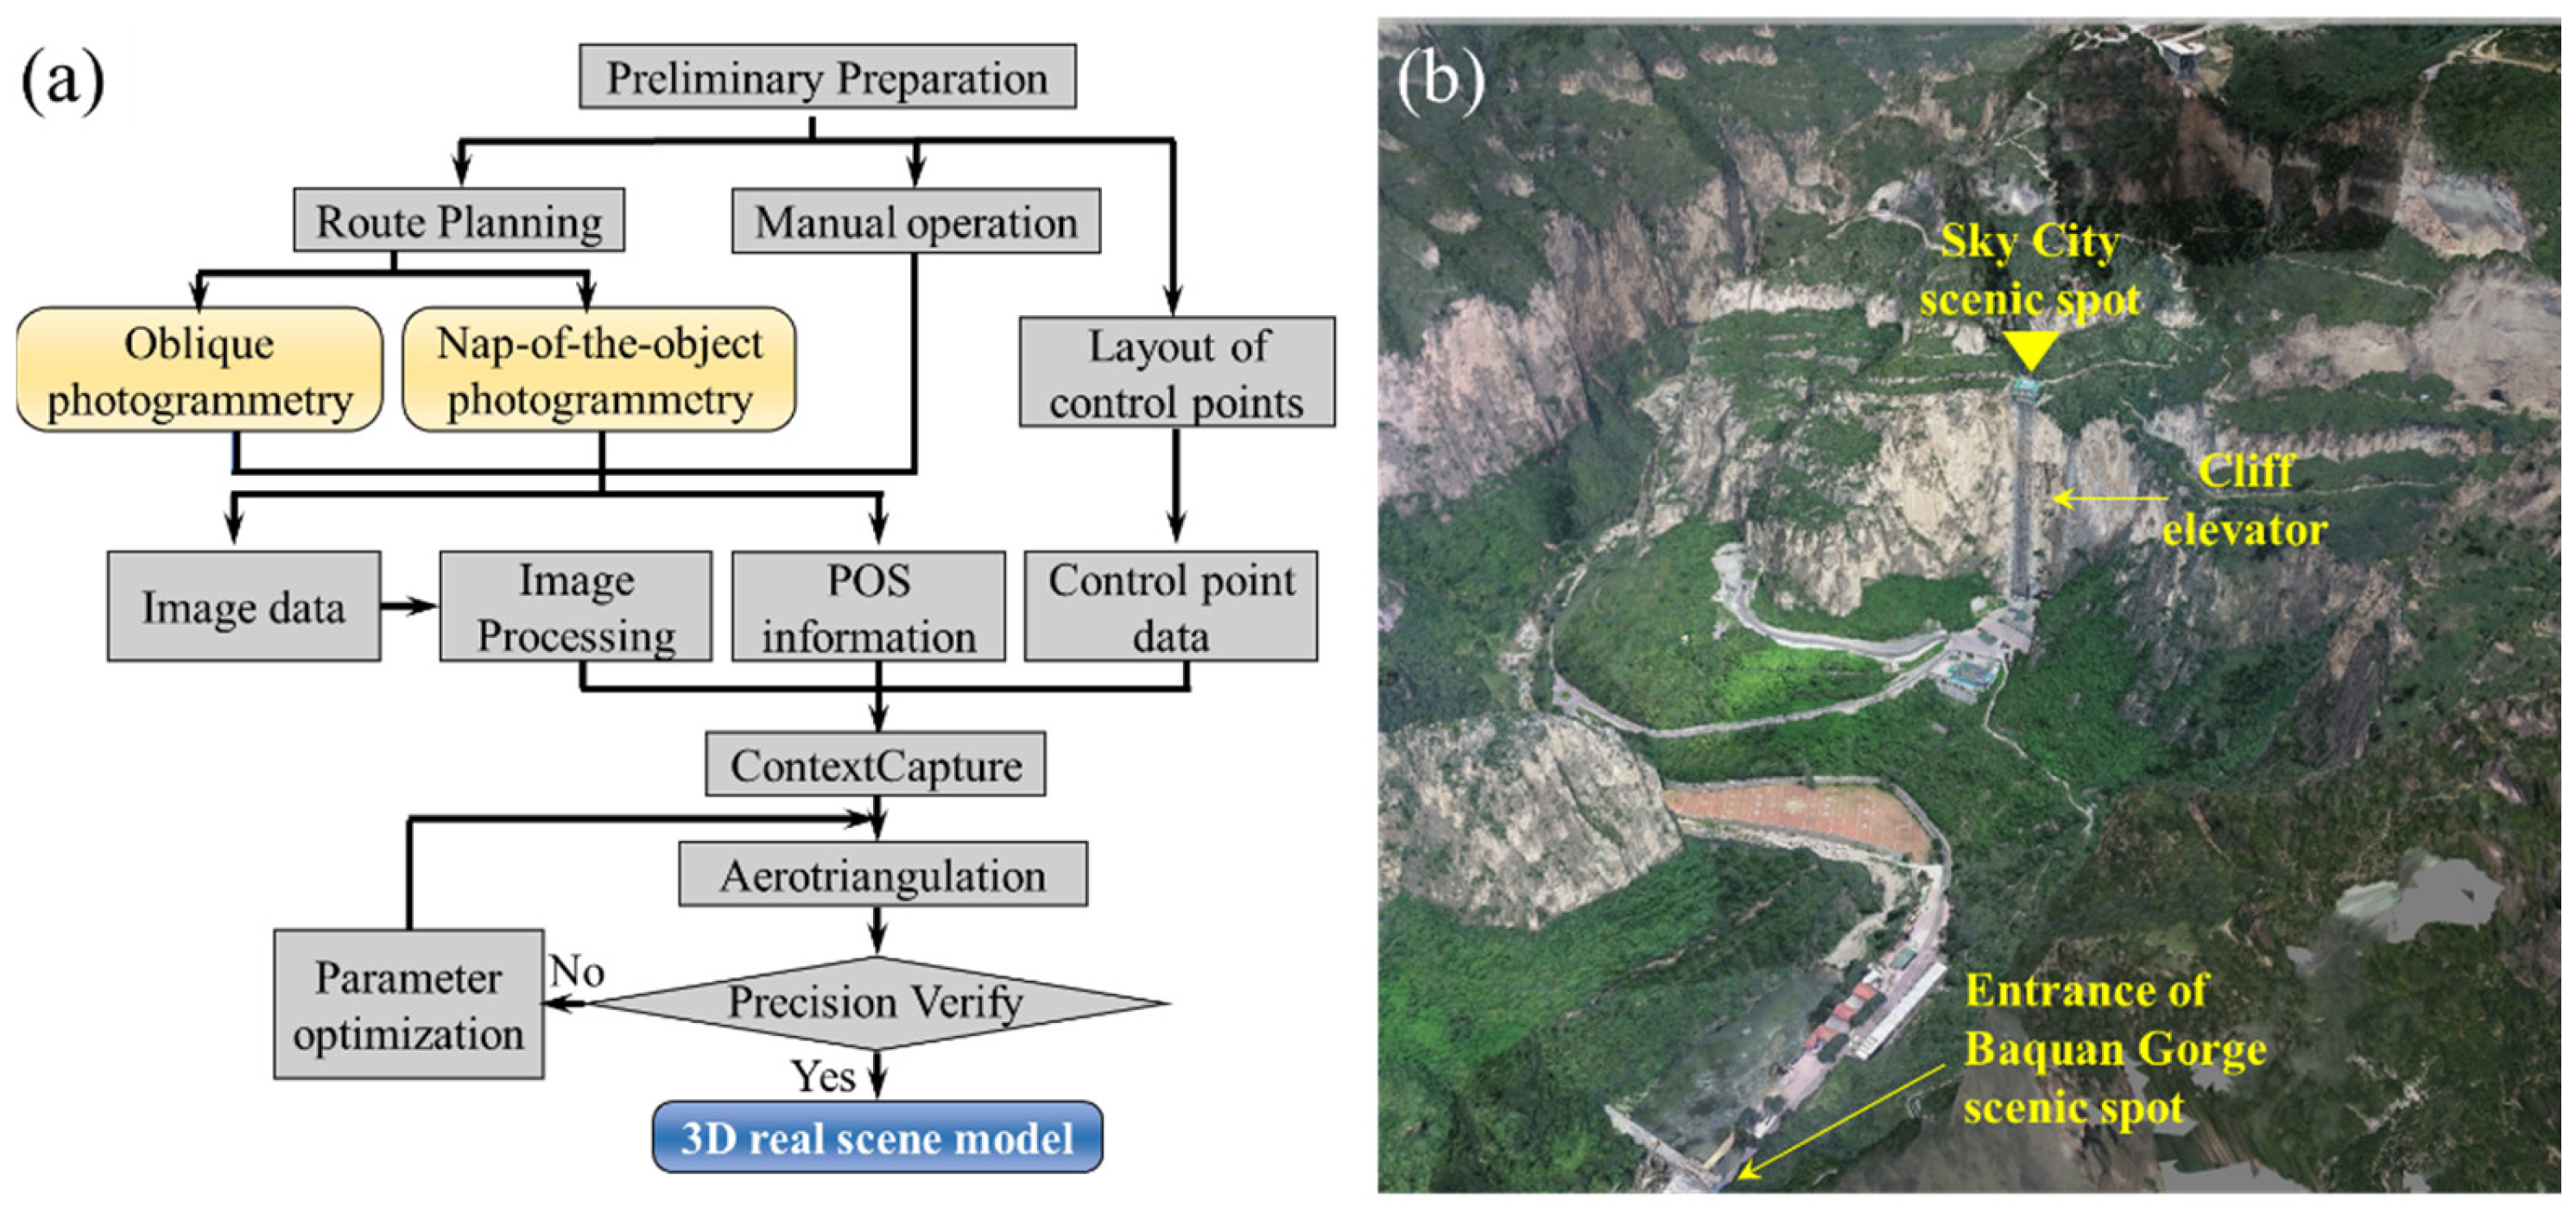
3.2.1. Construction of a 3D Real Scene Model in the Canyon

Rockfall hazard assessment in key potentially hazardous areas in the canyon region often relies on high-precision georeferenced data, such as the DEM [23]. To solve the problem of constructing 3D models of key potential rockfall hazardous areas in the canyon region, this study integrated UAV oblique photography and nap-of-the-object photogrammetry technology to construct a high-precision 3D real scene model in the canyon region (Figure 11). The survey used the DJI Phantom 4 RTK, which was equipped with a GPS/GLONASS dual-mode satellite positioning system and inertial measurement unit. The images collected by this UAV contained high-precision coordinate information.
Considering the actual situation that the UVA flight is restricted in the narrow canyons, the UAV image acquisition adopted the combination of route flight and manual operation. The level flight route was arranged over the key potentially hazardous areas, and efficient UAV low-altitude oblique photogrammetry was used to realize the data acquisition of large-scale 3D scenes. Specifically, image data were collected from the vertical and four oblique views by the UAV. Considering the undulating terrain and inconspicuous features in the alpine canyon regions, the flight route was set with a heading overlap rate of 85% and a side overlap rate of 80% to ensure the accuracy of the data post-processing. However, the image resolution of the cliffs in the canyon is often low due to the inappropriate shooting distance or angle. Therefore, this study further adopted nap-of-the-object photogrammetry technology to carry out image acquisition for the steep cliffs in the canyon. Due to the poor GPS signal and limited flight space in the canyon, the UAV was manipulated to fly vertically close to the cliff to obtain image data on the cliff walls.
The UAV images require basically reflecting the detailed contour and texture information of the ground objects, which can provide a data basis for the subsequent construction of 3D real scene models. To ensure the accuracy of the post-processing results, the original image data was first subjected to distortion correction and color matching. Then, the processed images and their corresponding coordinate information were imported into ContextCapture 10.16 software (Bentley Systems Inc., Exton, PA, USA), and ground control points were added. Finally, the images were encrypted by aerial triangulation to realize the construction of 3D real scene models.

3.2.2. Modeling of Rockfall Trajectories

In this study, RA 1.1 software based on the ArcGIS platform was used to simulate the rockfall movement characteristics [38]. RA 1.1 software can realize direct interaction with ArcGIS functions and can simulate 3D rockfall trajectories. In addition, the geostatistical analysis function in ArcGIS can be coupled with the 3D rockfall trajectories to create a distributed raster model of rockfalls. Compared with other rockfall motion simulation software, RA 1.1 software considers the offset of the motion space when simulating the rockfall trajectory, which is consistent with the actual uneven terrain.
The geometrical and geostructural characteristics of rock masses determine the kinematic conditions of rockfall events, and the slope morphology determines the rockfall motion mode [2,44]. In this study, a 1:2000 topographic map was used to create HRDEM data to extract high-precision information on the elevation, aspect and slope angle. The identification of potential rockfall source areas is the prerequisite for simulating the initiation mode and trajectory of a rockfall. Considering that the potential rockfall source areas in the study area are concentrated on the nearly vertical steep cliff walls, the rockfall source areas with the highest threat at the top of the cliff were selected to simulate the rockfall movement characteristics. In addition, the morphology and properties of the underlying slope surface have an important influence on the barrier effect produced by the falling rocks after collision, which directly determines the characteristics of a rockfall’s trajectory, bounce height, kinematic energy and accumulation position. Considering the unique geomorphic characteristics of the canyon area, the supervised classification on the 3D real scene model were used to classify the ground surface material. Moreover, the geotechnical parameters were calibrated for each surface material through back analysis between the case histories and rockfall trajectories.
The RA 1.1 software performed the modeling of rockfall trajectories based on the lumped mass method, which considers the mass of the rock block to be concentrated in one point [57,58]. Rockfall sources (seeders) can be defined as points or polyline or polygon features which are stored in shape files. Notably, the rockfall source area drawn by polylines and polygons is actually represented by uniformly distributed points in space. In this study, the simulated rockfall source area was input into RA in the form of a polyline, and the interval of the point seeders was set to 5 m. In addition, 10 point seeders were positioned separately at each location with a direction interval of 6°. The weight of a rockfall is determined by the lithology of the stratum where the rockfall source is located. After determining the parameters required for calculation, the RA 1.1 software could be used to simulate the rockfall frequency, bounce height, speed and energy and create the corresponding raster model.

3.2.3. Rockfall Hazard Assessment Process

Using the three raster models of rockfall frequency, bounce height and kinematic energy obtained by the RA simulation, the rockfall hazard assessment mapping could be achieved by the following equation:
D i = a × R f i + b × R h i + c × R e i
where the hazard degree Di of each raster cell was obtained by the weighted superposition of the rockfall frequency Rfi, bounce height Rhi and kinematic energy Rei in the cell, and their corresponding weights are a, b and c, respectively. In this study, the analytic hierarchy process (AHP) was used to determine the weights of the dominating factors.
The AHP is a multi-objective evaluation decision-making approach that combines qualitative and quantitative methods [59]. The AHP involves a matrix-based pair-wise comparison of the contributions of different factors in rockfalls, which can help decision makers filter a preferred one from a set of alternatives. Specifically, the AHP includes the following five steps: (1) decompose a complex decision problem into several component factors (i.e., frequency, flying or bouncing height and kinematic energy in this study), (2) establish the AHP model according to the affiliation relationship, (3) assign numerical values to determine the relative importance of each factor based on subjective correlation (Table 2), (4) construct a judgment matrix and (5) compute the eigenvector value of the judgment matrix to obtain the weights of each factor.
To avoid logical errors in constructing the judgment matrix, the consistency test needs to be satisfied. The consistency ratio (CR) value was used to determine the random generation probability of the judgment matrix in this study [60]:
C R = C I R I
where RI is the random consistency index (Table 3) and CI is the consistency index of the judgment matrix, defined as follows:
C I = λ m a x n n 1
where n is the order of the judgment matrix and λmax is the maximum eigenvalue of the judgment matrix. In this study, it is considered that the judgment matrix has satisfactory consistency when CR < 0.1.
Finally, combined with the natural breakpoint method, the final result of the hazard assessment was reclassified into five levels [62]: very low hazard area, low hazard area, medium hazard area, high hazard area and very high hazard area.

4. Results

4.1. Identification Results of Regional Potential Rockfall Sources

4.1.1. Results of Static Identification

Since the local geomorphology of Taihang GCSA is mainly controlled by the geological structure and rock mass properties, it was necessary to consider different combinations of lithology and tectonic units in dividing the HMAs. Based on the 1:50,000 geological map (Figure 2) and the uniaxial compressive strength of the rocks obtained from field point load tests, the study area was divided into seven main HMAs (Table 4 and Figure 12). Figure 9 shows the results of the SAD decomposition of HMA A.
The specific thresholds of the seven HMAs in the Taihang GCSA were selected as shown in Table 5, and the final static identification results of the potential rockfall source areas are shown in Figure 13. The results show that the potential rockfall source areas are mainly concentrated in the canyon region, accounting for 19.91% of the total area of the study area (Table 5). The HMAs with the largest potential rockfall source areas are zone E and zone D, whose lithology is dominated by hard limestone and dolomite. Due to the high and steep cliffs and developed unloading joints in HMAs E and D, rockfall events occur frequently in this region. The HMAs with the smallest potential source areas are zone F and zone G. The potential source area is mainly distributed in the artificial outcrops in the quaternary alluvium near the valley terraces.
To verify the accuracy of the static identification results, the static source areas of rockfalls identified by the SAD method were compared with the distribution of potential rockfall points determined by field investigation (Figure 14a). In addition, the 3D colored digital terrain model generated using 1:10,000 contours and aerial photographs was used to visually check the accuracy of the identification results. For the key potentially hazardous areas in the canyon area, visual verification was performed on the 3D real scene model constructed by UAV photogrammetry (5-cm ground sampling distance). The validation results show that the potential rockfall source areas identified by the SAD method had good inclusiveness, which was basically consistent with the actual field investigation.

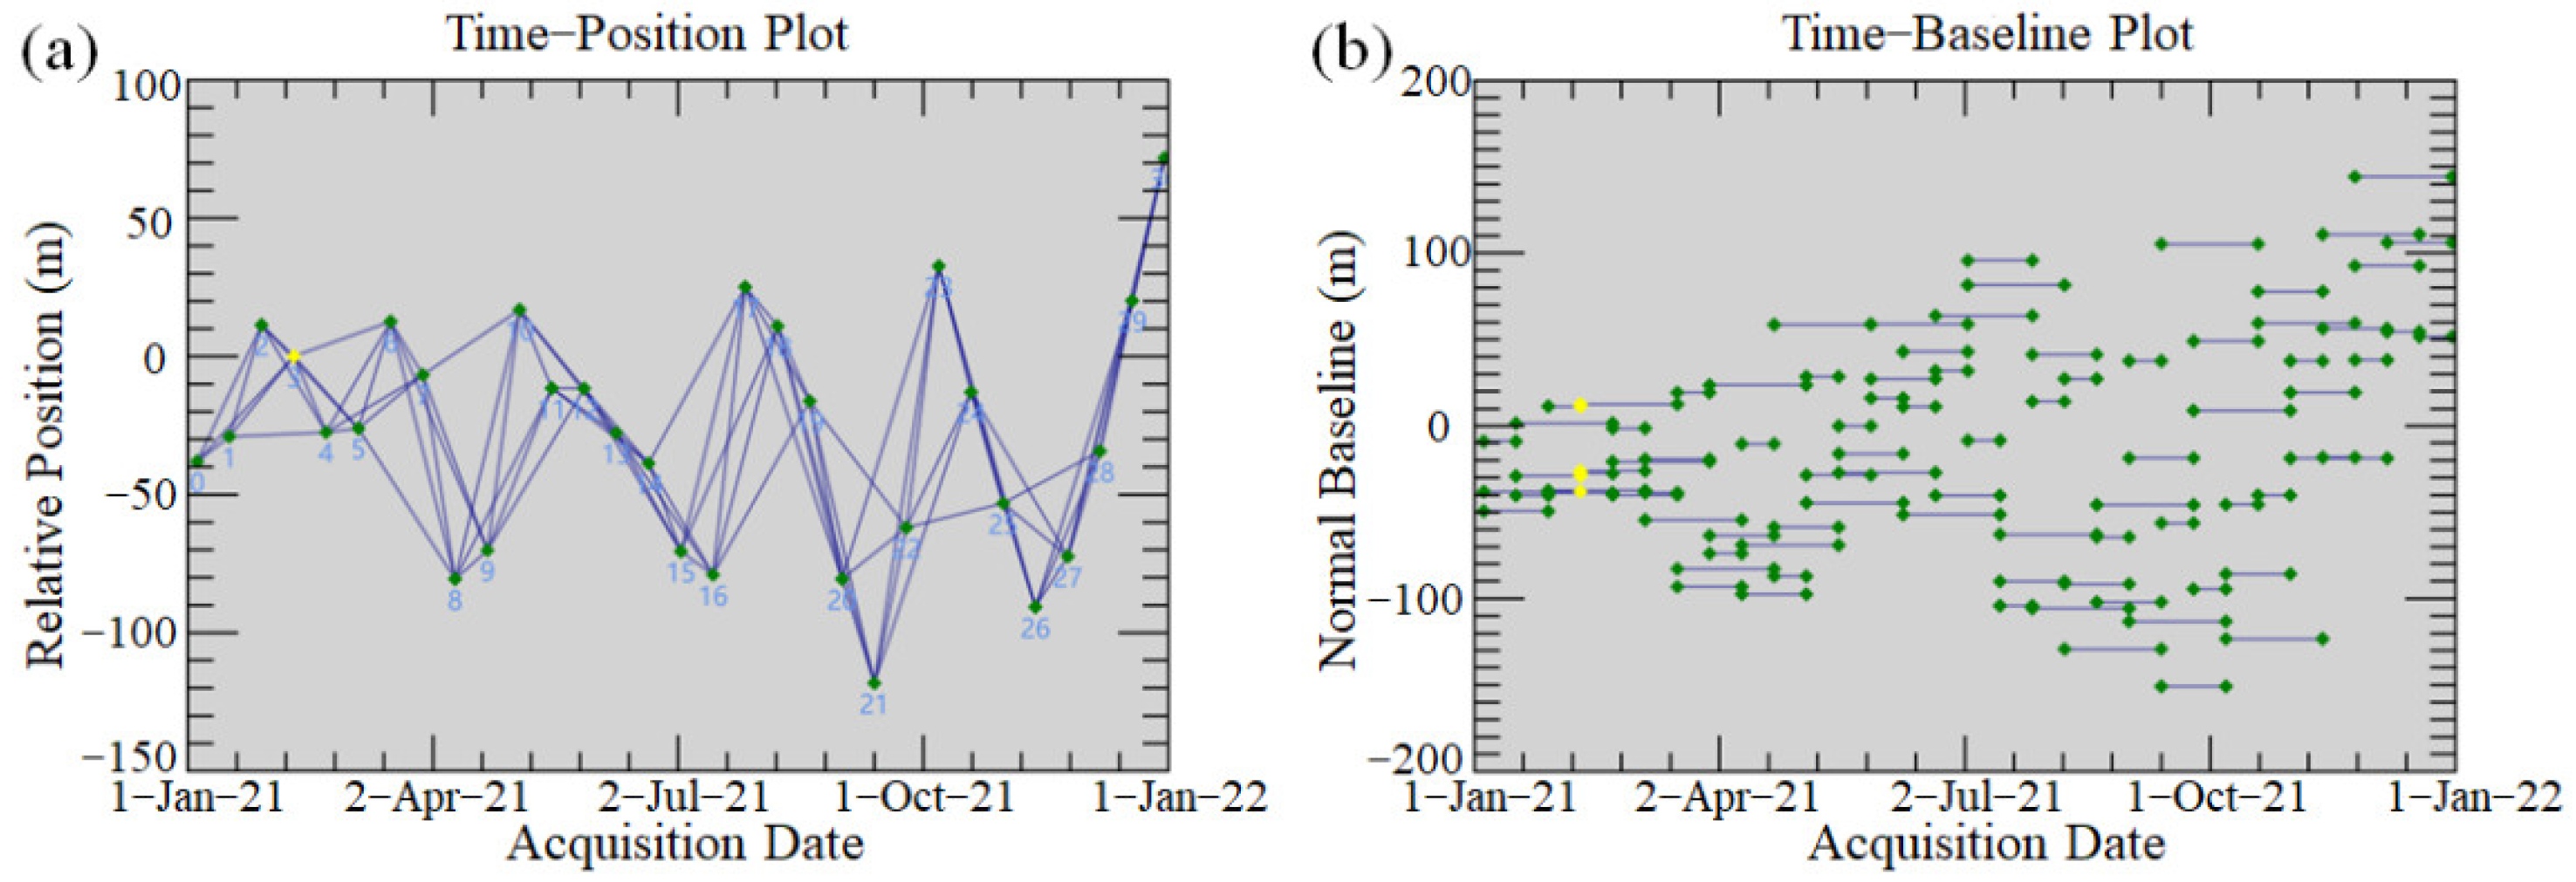
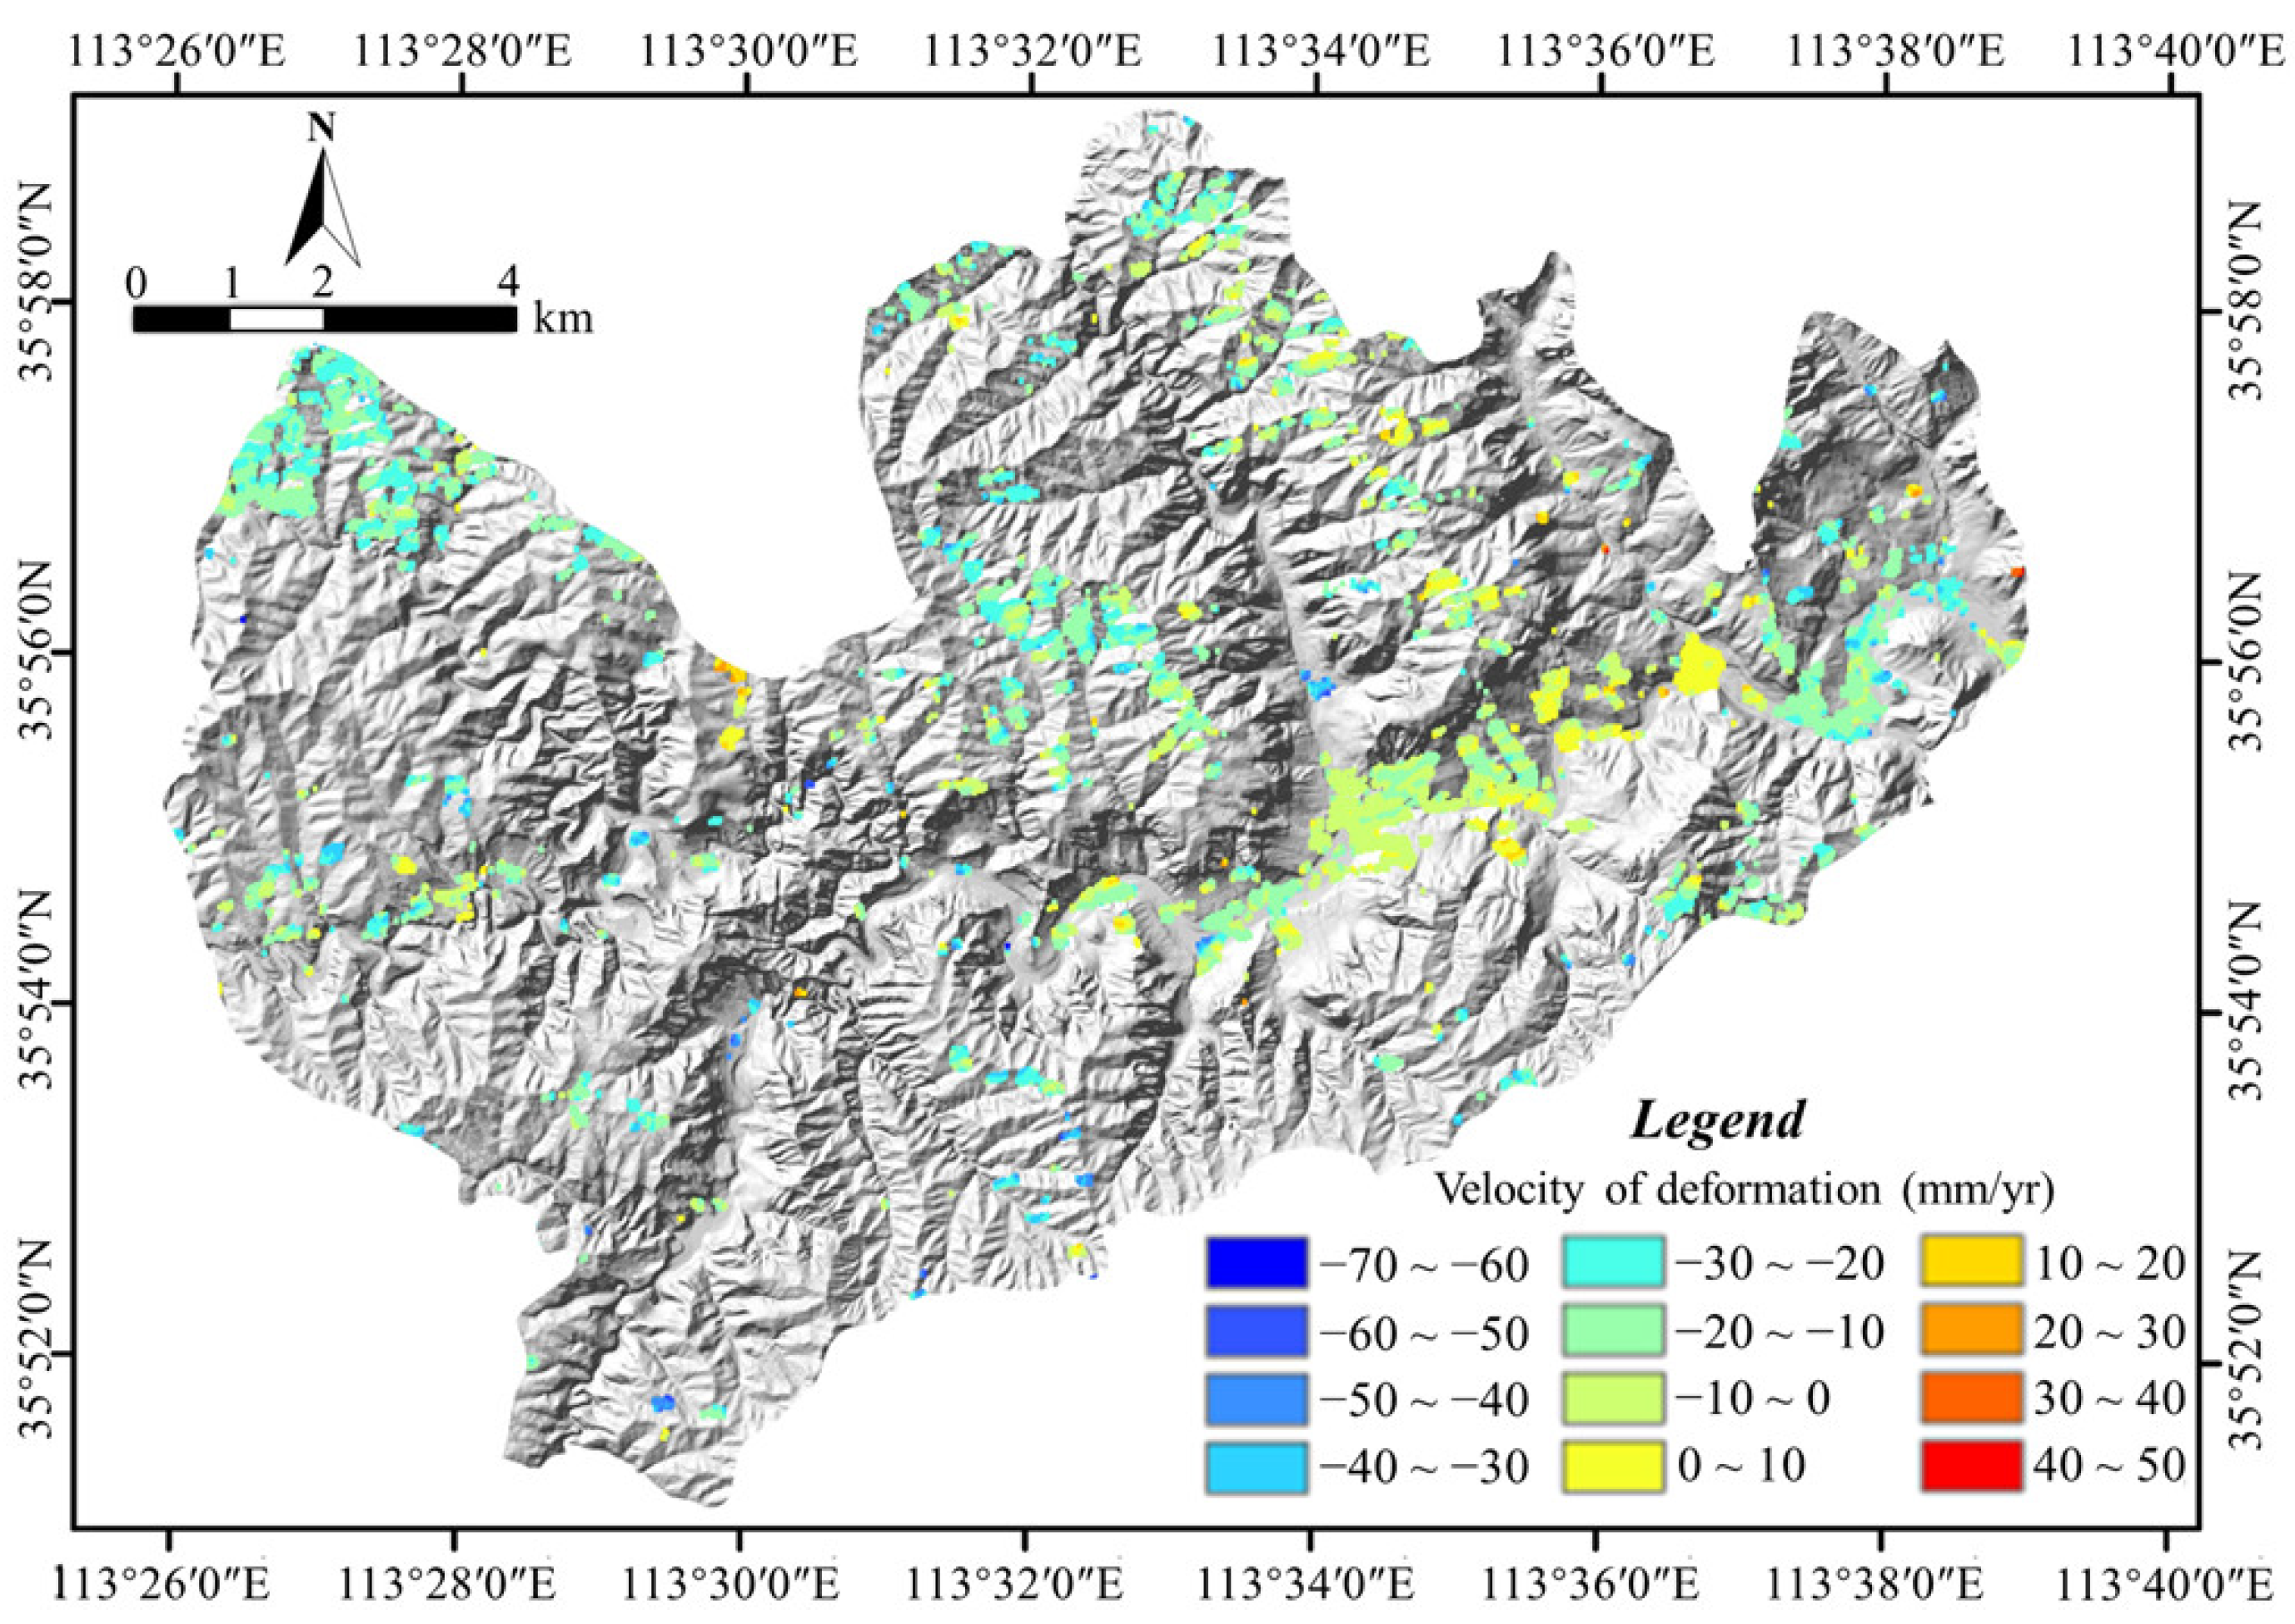
4.1.2. Results of Activity Identification

In this study, the ENVI SARscape module was used for interferometric processing of the SAR image data. The thresholds of the spatial baseline and temporal baseline were set to be 45% and 40d, respectively. A total of 87 interference pairs were eventually generated, and the interferograms were connected as shown in Figure 15, with the yellow dot (9 February 2021) image as the super main image. Using the SBAS-InSAR method introduced in Section 3.1.2, the final deformation results for the time series could be obtained (Figure 16).
Referring to the technical specification of InSAR monitoring for geohazards (T/CAGHP 013-2018) in China [63] and the monitoring results of rockfall pre-failure deformation rates [32,64,65,66], an absolute value of the annual LOS deformation rate more than 10 mm/year was used as a pre-criterion to identify the active source areas of rockfalls. Then, we manually used the aerial and satellite image data to further exclude some raster cells that obviously did not have the conditions for rockfall development or have abnormalities [3,22]. For example, the raster cells distributed in loose deposits, plains, river channels and engineering construction areas were excluded to obtain the interpretation results of active rockfall sources in the study area (Figure 17). Figure 17 shows that the active source areas of rockfalls are concentrated in Wangmang Gorge in the northwest and Baquan Gorge in the middle, with a total area of 2.96 km2, accounting for 1.9% of the total area of the study area. Most of the active rockfall source areas in the Taihang GCSA are located on the mountaintop slope, and a small part are located in the canyon region. As listed in Table 6, the LOS deformation rate of active rockfall source areas was mainly −20~−10 mm/year (59.39%), and the local deformation rate could reach −70~−60 mm/year (0.05%).
To verify the accuracy of the active identification results, the active rockfall source areas identified by SBAS-InSAR technology were compared and analyzed with the potential rockfall points with high hazard areas determined by field investigation (Figure 17). In addition, the identified active source areas were visually checked again using the high-precision 3D real scene model obtained by UAV photogrammetry. The validation results show that the active rockfall source areas identified by SBAS-InSAR technology were basically consistent with the field situation.

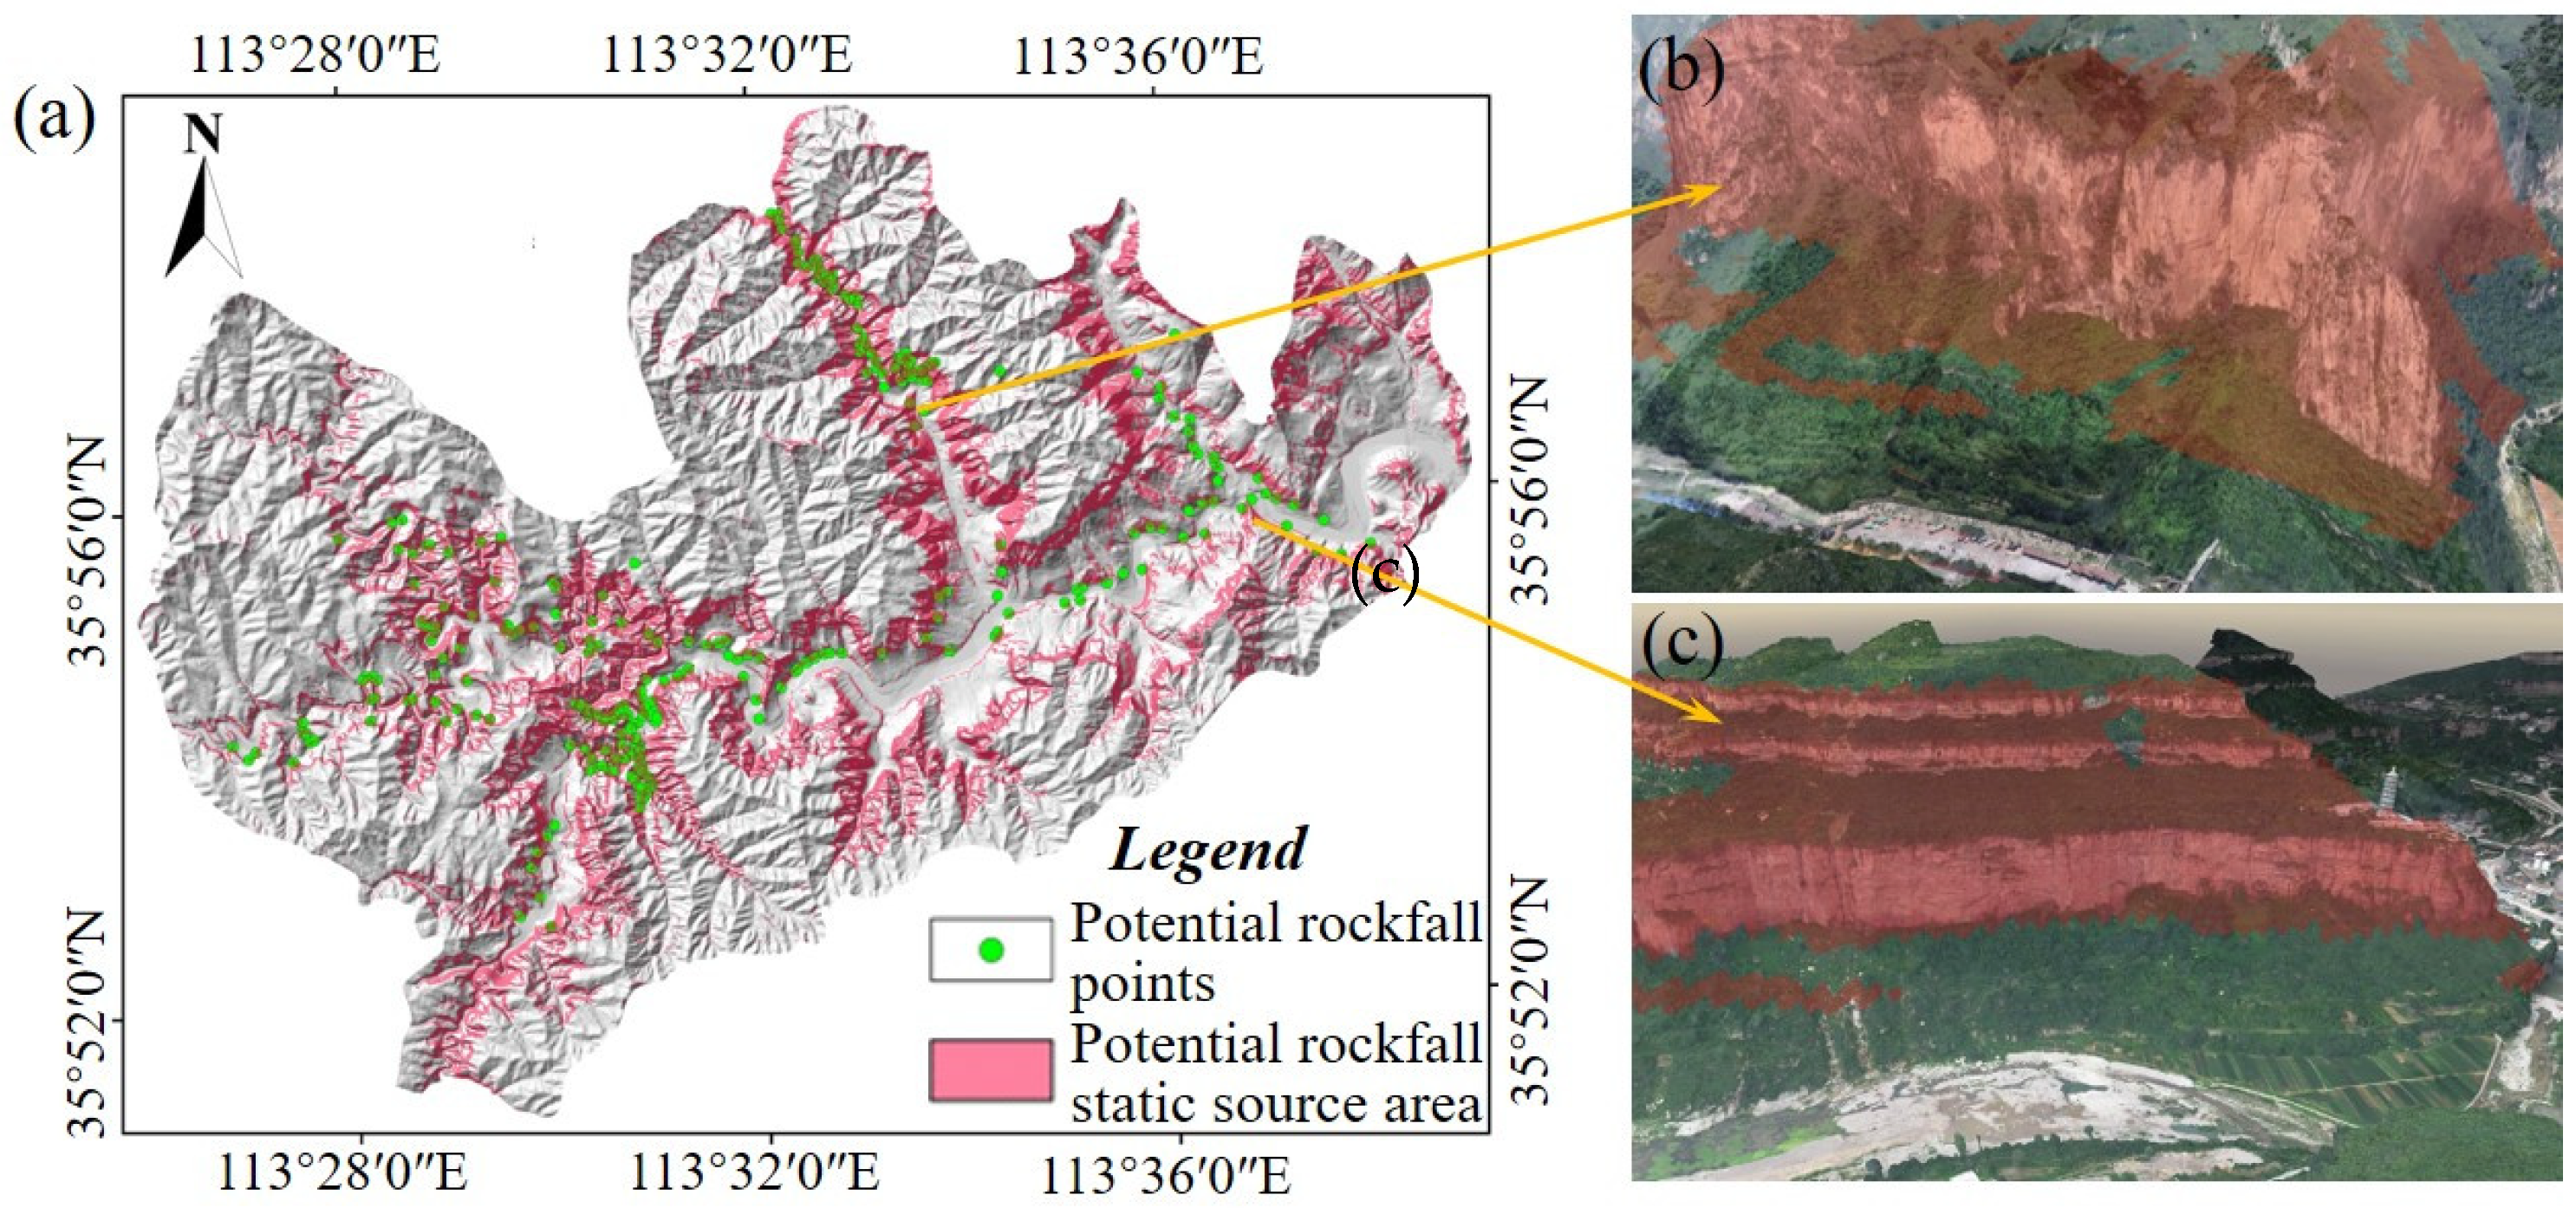
4.1.3. Identification Results of Potential Rockfall Sources at the Regional Scale

The distribution map of potential rockfall sources in the study area was obtained by summarizing the static source areas determined by the SAD method and the active source areas drawn by the SBAS-InSAR technique. As shown in Figure 18, the total area of the potential rockfall source areas finally determined in the study area was 33.47 km2, accounting for 21.47% of the study area. Among them, the static source area was 31.04 km2, accounting for 92.74% of the identified source area, and the active source area was 2.96 km2, accounting for 8.84% of the identified source area. In this study, we identified the overlapped area of the static source area and active source area as the key potentially hazardous area, with an area of 0.53 km2, accounting for 17.91% of the active rockfall source area.

4.2. Rockfall Hazard Assessment in the Sky City Scenic Spot

The Sky City scenic spot is a must-see attraction in the Baquan Gorge (Figure 1), with 10,000s tourist per day during the peak season. As shown in Figure 19, the cliff wall where the outdoor sightseeing elevator is located is nearly upright, with a vertical height difference of 208 m. The stratum exposed on the cliff wall is huge, thick oolitic limestone with a weakly weathered surface. Since the bedding orientation of the rock layers in this region is nearly horizontal, and the vertical joints are developed, the rock cavities formed by falling rock blocks of different sizes can be seen everywhere on the steep cliff wall (Figure 19c). Historical observation data since 2015 indicate that the Sky City scenic spot is a highly prone area for rockfall events.

4.2.1. Construction of the 3D Real Scene Model

In this study, a total of 2758 images were collected through the combination of oblique photography and nap-of-the-object photogrammetry technology from the scenic spot of Sky City. The final 3D real scene model constructed by ContextCapture 10.16 software is shown in Figure 11b. Combined with the 3D model, five underlying surface materials were finally identified, and their corresponding average values of the coefficients of restitution and friction are listed in Table 7.

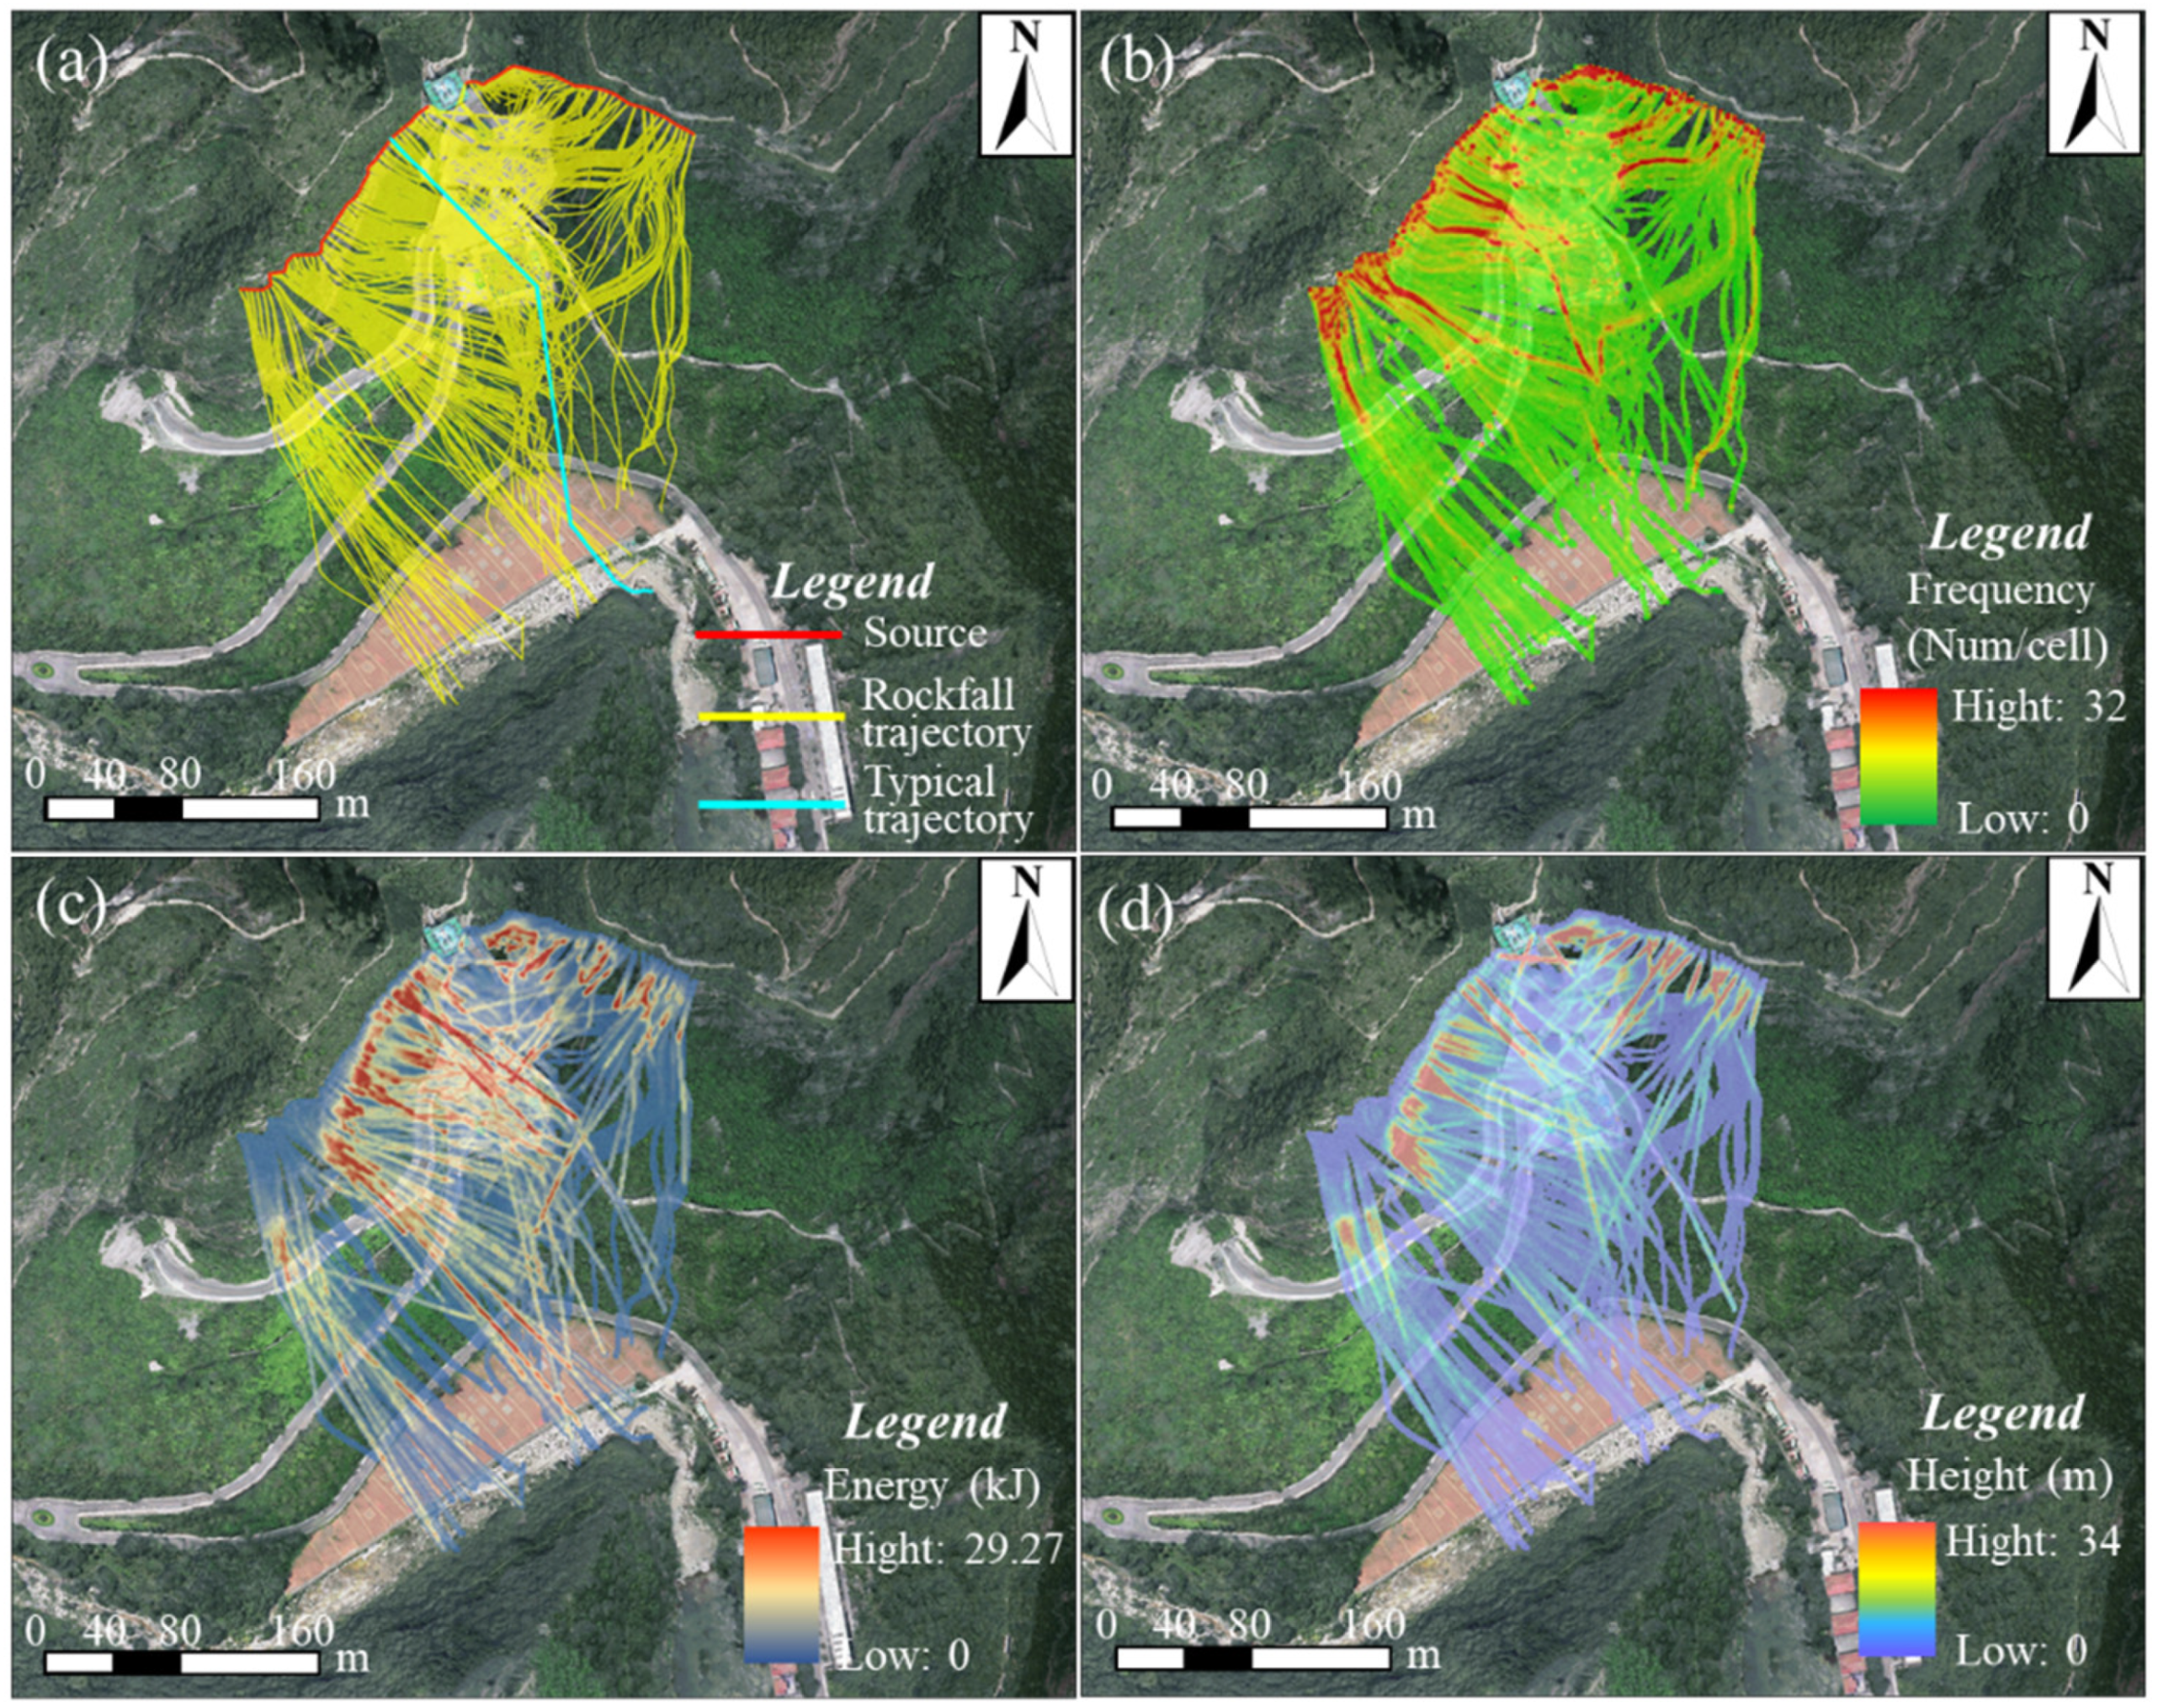
4.2.2. Simulation Results of Rockfall Trajectories

The statistical data show that the falling rocks at the Sky City scenic spot are dominated by small rock blocks with a mass of 5–10 kg, with many fresh smash marks visible at the elevator entrance steps and ticket gates (Figure 19d,e). Therefore, the average mass of the falling rocks was set as 10 kg in the simulation. The rockfall trajectory obtained by the RA 1.1 software is shown in Figure 20a.
Figure 20a shows that the rockfall trajectories endangered the tourist distribution center, footway, scenic road and parking lot. Due to the obstruction of the southern mountain, the falling rock blocks could move farthest to the foot of the front mountain. The statistical analysis of the 920 simulated rockfall trajectories in this study shows that the numbers for the falling rock blocks stopped and accumulated in the rivers, roads, distribution centers and shrubs were 35 (3.8%), 72 (7.8%), 375 (40.8%) and 438 (47.6%), respectively. This shows that the falling rock blocks deposited in the range of crowd activities reached more than half of the total number of simulated falling rock blocks.
Figure 21 shows a typical rockfall trajectory, with a horizontal movement distance of 323.9 m and a falling height of 285.4 m. After the start of the falling rock block, due to its small initial horizontal velocity, the rock block mainly rolls down under its own gravity. In the falling process, the gravitational potential energy is constantly converted into kinematic energy. When suddenly encountering the platform or obstacle, the falling rock block collides and bounces. Finally, the kinematic energy of the falling rock block continues to decrease under the barrier effect of the underlying slope surface, and the movement mode is converted from bouncing to rolling until it stops.
In the RA 1.1 software, the rockfall frequency was the number of rockfall trajectories passing through the same raster cell. Since the cliff wall at the scenic spot of Sky City is nearly upright, the falling rock blocks will produce a lateral offset after colliding with the underlying slope surface. This results in the dispersed distribution of rockfall trajectories and the frequency of rockfalls gradually decreasing along the trajectory (Figure 20b). Figure 20c shows that the high-energy areas are mainly distributed in the front part of the rockfall trajectory. This is mainly due to the steep slope and large height difference of the steep cliff, and thus the potential energy of falling rock blocks is rapidly converted into kinematic energy during free fall. The kinematic energy of a falling block reaches its maximum near the foot of the cliff. The bounce height of a rockfall refers to the relative height of the rock trajectory above the slope surface. Figure 20d shows that the area with the largest bounce height at the scenic spot of Sky City is concentrated near the foot of the cliff. In addition, with the continued occurrence of rockfall collisions, the energy of a rockfall is gradually lost, resulting in the subsequent rockfall motion being dominated by rolling and sliding.

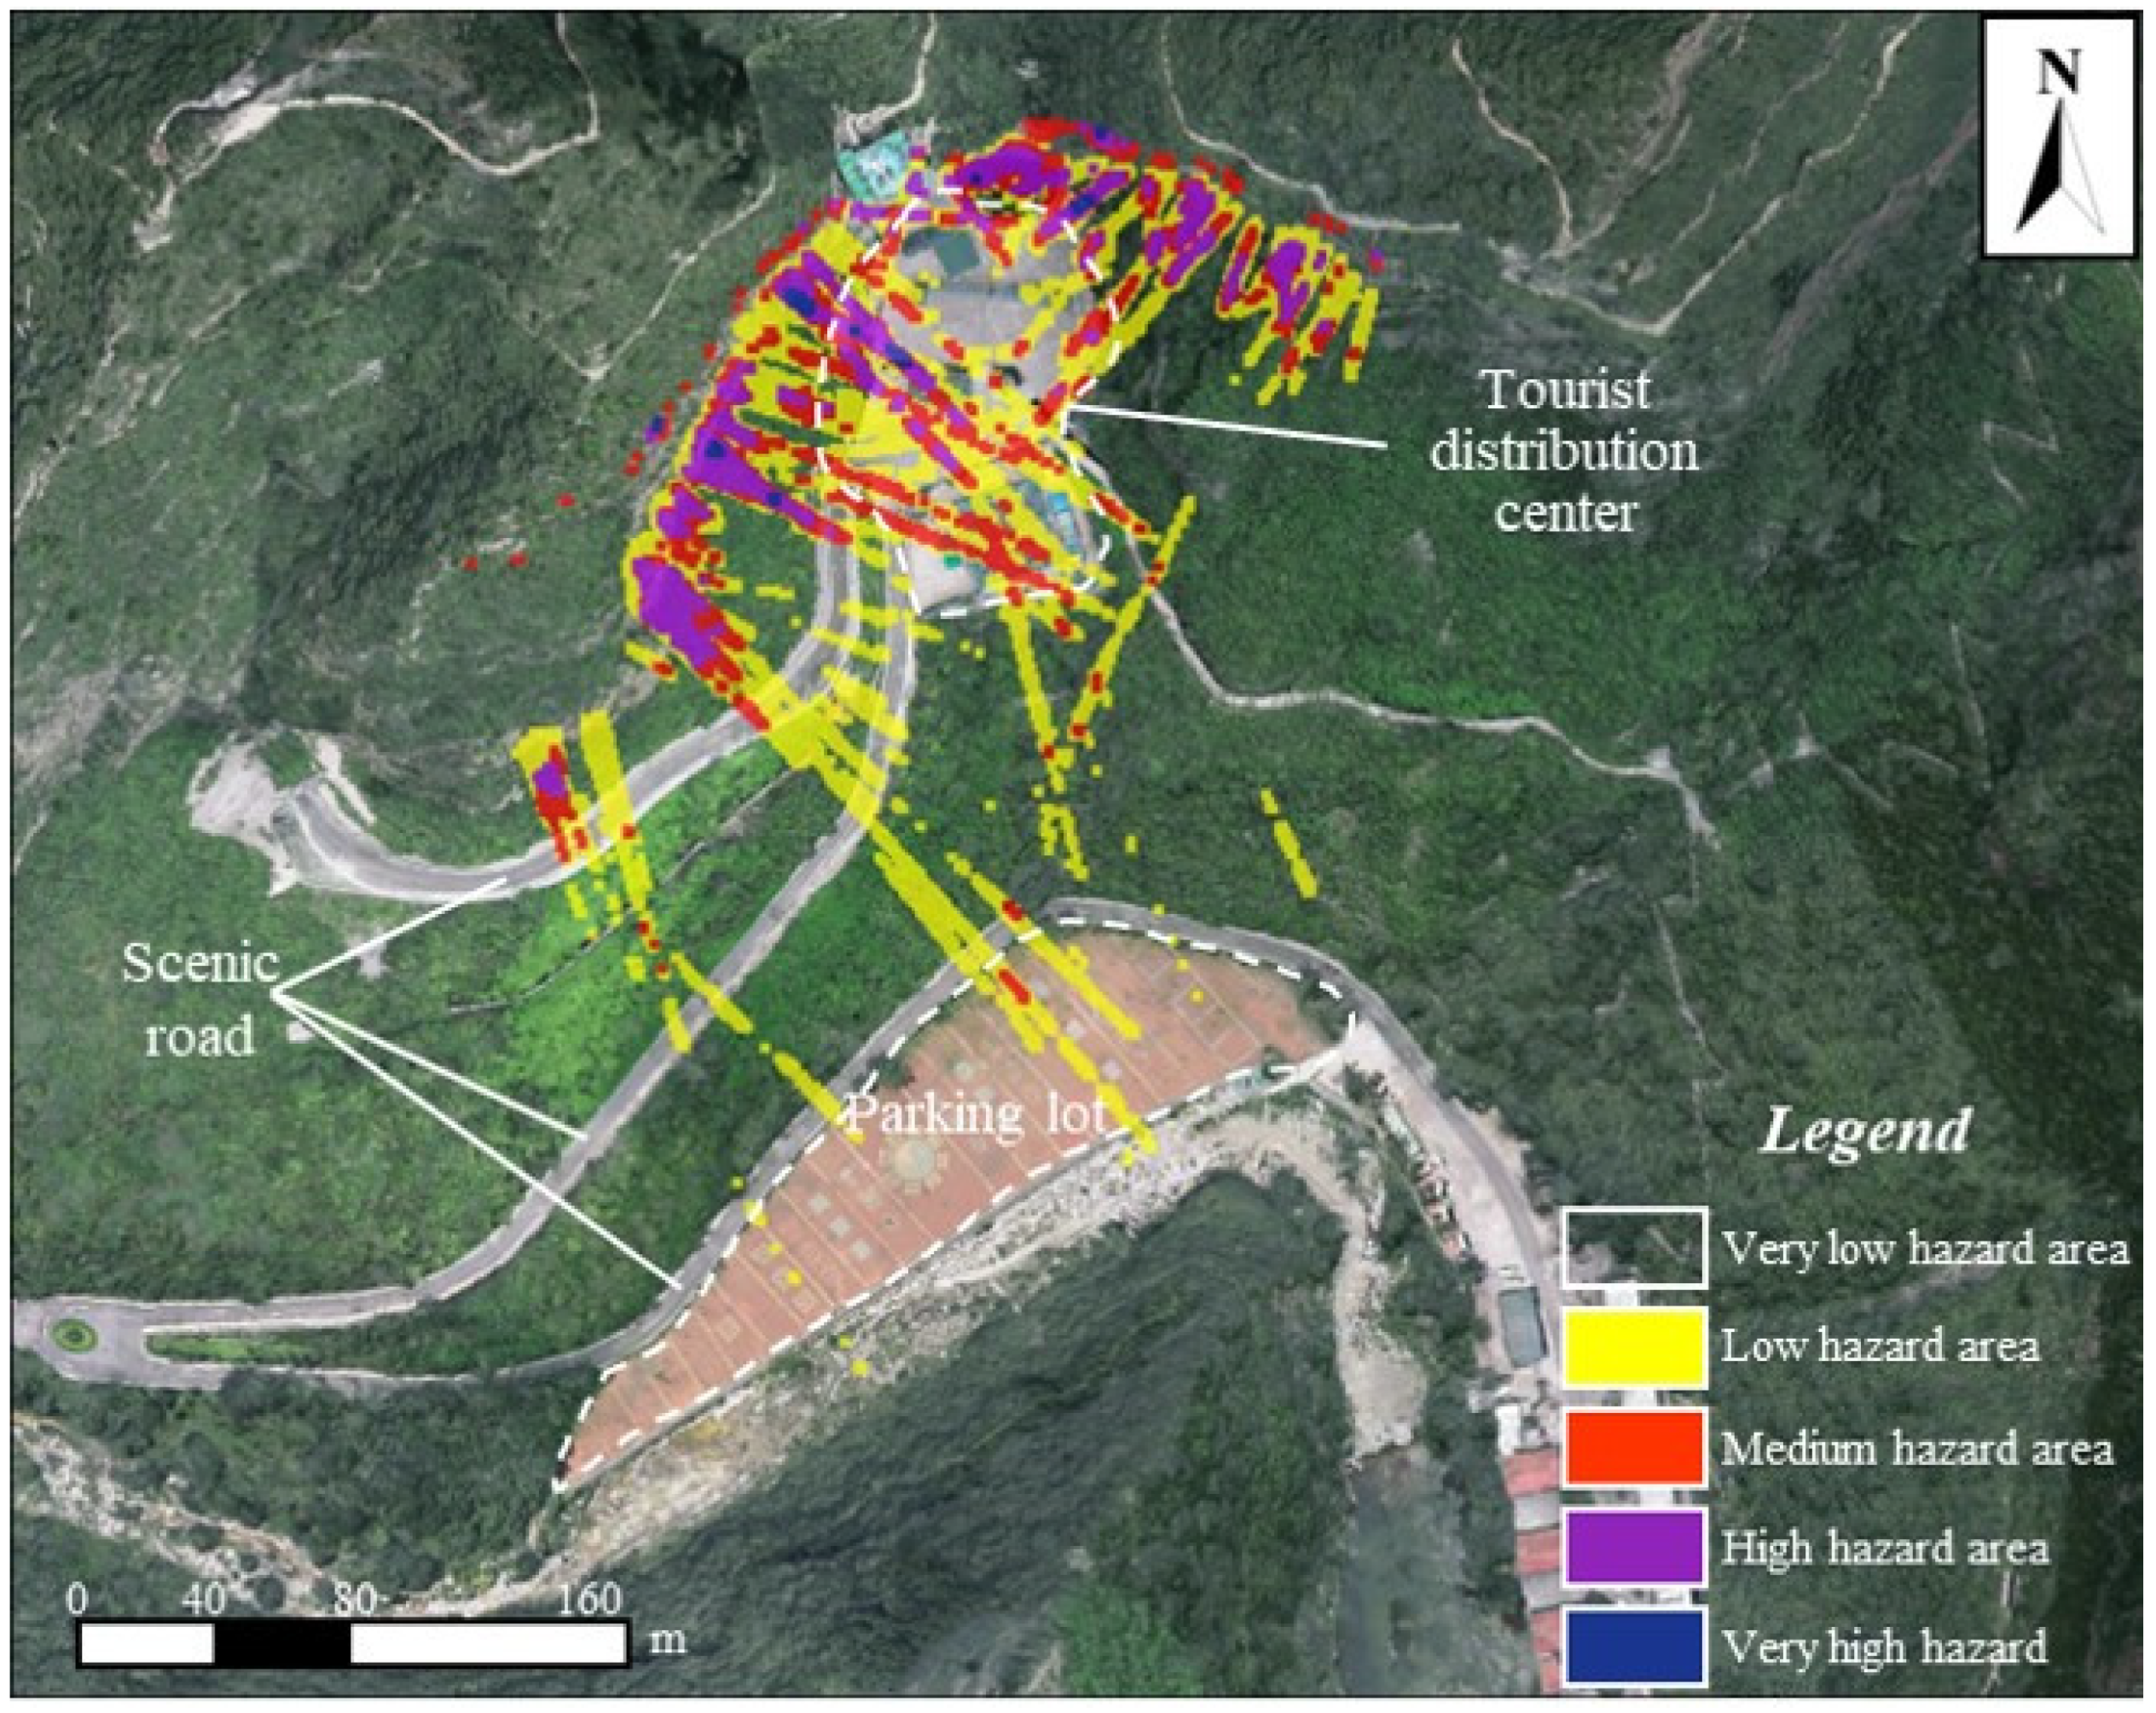
4.2.3. Results of Hazard Assessment

The rockfall hazard assessment for the scenic spot of Sky City used the method proposed in Section 3.2 of this study. The results of the AHP method show that the weights of the rockfall frequency, kinematic energy and bounce height were 0.5400, 0.2971 and 0.1629, respectively. Moreover, the judgment matrix passed the consistency test (CR = 0.0048 < 0.1) (Table 8). As shown in Figure 22, the RA simulation results show that the high hazard areas and the very high hazard areas are mainly located in the tourist distribution center at the bottom of the cliff, which directly threatens the safety of tourists. The area of the threat area is 3199 m2, and the frequency, energy and bounce height of the most dangerous area are 12, 17.6 kJ and 34 m, respectively. Although the parking lots and scenic roads are low hazard areas, attention is still needed to ensure the safe operation of scenic spots.
The cliff wall at the scenic spot in Sky City is a natural geological relic with great ornamental value. Large unstable rock blocks have been removed from the region near the cliff elevator. However, to preserve the view of the cliff face, only localized areas are protected with shotcrete (Figure 19), which does not provide sufficient protection for the tourist activity area. To preserve the ornamental value of the cliff, it is recommended to set up passive protective nets to intercept the falling rock blocks above the gentle slope at the bottom of the cliff. For example, the RA simulation results show that the falling rock blocks can be effectively blocked by placing a 3-m-high passive protection net at the top of the rockfall deposit (Figure 21). In addition, the monitoring and early warning equipment is suggested to be arranged for continuous observation.

5. Discussion

5.1. Early Identification of Potential Rockfall Source Areas at the Regional Scale

For the early identification of potential rockfall source areas in the canyon region, this study used the SAD method to extract the angle threshold of each MU to achieve the static identification of potential rockfall source areas and also applied the SBAS-InSAR technique to calculate the small deformation in the study area and identify the activity of potential rockfall source areas, both of which achieved good results. The SAD method is a fast, efficient and systematic global method for identifying potential rockfall sources at a regional scale without considering the influence of the rock mass structure [27]. Moreover, the results of this study also show its excellent application value in evaluating the rockfall susceptibility and hazard. The SBAS-InSAR technique has the advantage of acquiring small deformations and long time series of slow surface displacements [67,68]. Hence, applying it to the activity monitoring of rockfall source areas can effectively identify dangerous rock blocks. In this study, the combination of the above two methods can greatly improve the efficiency and accuracy of the identification of potential rockfall sources, which can provide a reference for the early identification of rockfall events.
However, the above framework for identifying potential rockfall sources mainly provides an easy-to-use solution for the rapid identification and delineation of potential rockfall hazard areas at the regional scale [49]. The proposed framework can be used to identify key potentially hazardous areas and clarify the priorities for subsequent more detailed hazard assessment. It should be noted that the SAD method identifies potential rockfall source areas on a morphological basis, thus leading to a rough identification of source area boundaries. In addition, the SBAS-InSAR technique is affected by the high vegetation coverage and steep slope in the alpines canyon region, resulting in reduced accuracy of the identification results, especially for the weak signals in the canyon regions. Moreover, the deformation of the rock surface does not always correspond to the occurrence of rockfall events [3]. Although good results have been obtained by using a threshold of 10 mm/year to determine the active rockfall source areas, the selection of the threshold still needs to be further discussed and verified in future studies. Therefore, the early identification framework of rockfall events proposed in this study cannot completely replace field investigation.

5.2. The Influence of the DEM Precision

The previous studies indicate that the identification of static source areas is greatly affected by the precision of the DEM [27]. Since the DEM’s surface is a simplification of the real topography, some morphological features may be missing. Specifically, the lower the DEM resolution, the lower the slope angle of steep slopes, which leads to small slopes in the study area often being ignored. Therefore, a larger-scale topographic map can be used in subsequent studies to further improve the accuracy of the identification of potential rockfall sources at the regional scale. In addition, the precision of the DEM also affects the simulation results of the RA 1.1 software [40]. The trajectory and velocity of rockfalls simulated by high-resolution DEMs are more complex and variable, and the falling rock blocks will have a larger lateral offset after collision. In contrast, due to some microgeomorphic features being absent in the low-resolution DEM, the obtained kinematic energy and bounce height of rockfalls are too large, which leads to the predicted rockfall threat range not being able to be applied in practice. The results of this study show that the high-precision topographic data constructed by UAV photogrammetry technology can basically meet the needs of rockfall movement simulation. However, the influence of the DEM’s precision on the simulation of rockfall movements should be further studied in combination with the monitoring of data for rockfall events.

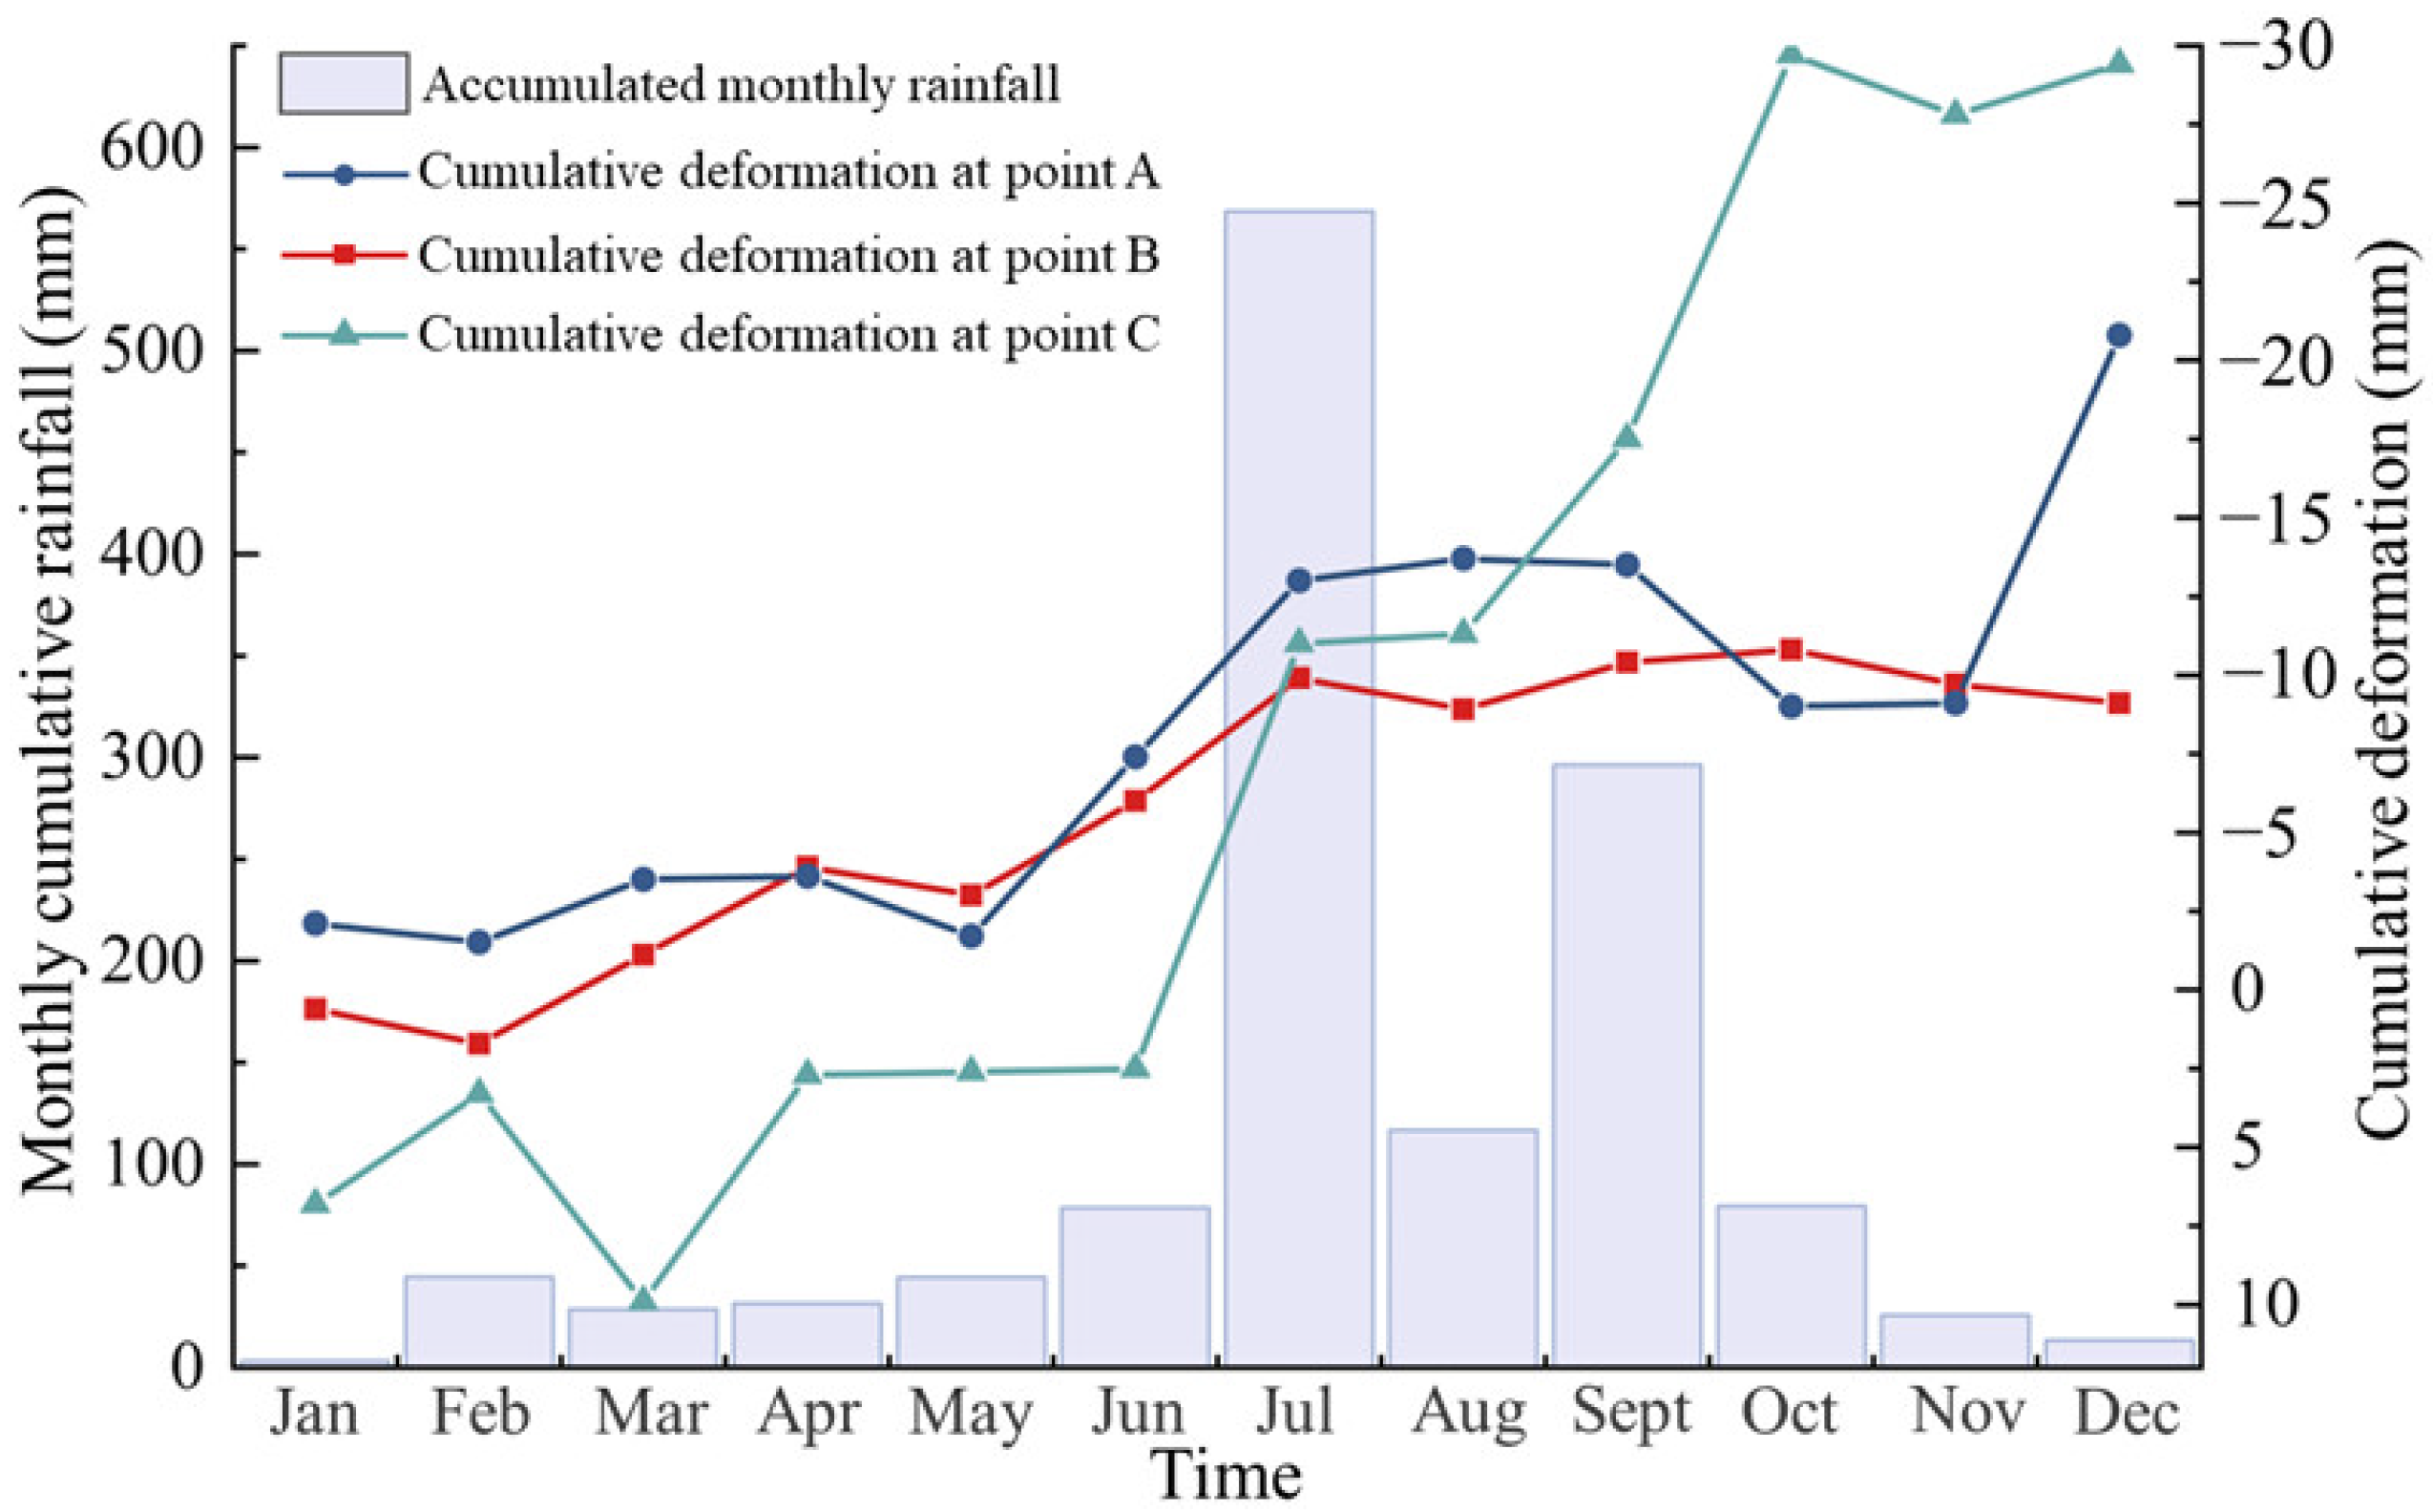
5.3. Response Relationship between Rainfall and Rockfall Events

Many scholars have shown the influence of rainfall on the rockfall frequency [44]. Field surveys and historical statistics found a significant increase in rockfall events in the study area in 2021, especially during the extreme rainfall event in July [69]. As shown in Figure 23, cumulative displacement curves of the three active rockfall source areas in the study area were constructed and compared with the histogram of monthly cumulative rainfall in 2021. Figure 23 shows that the rainfall in the study area increased sharply in July 2021. In addition, the signs of accelerated deformation growth in the three active rockfall source areas can be clearly observed. Therefore, the good correspondence between the deformation trend and rainfall further illustrates the accuracy of the activity identification results. Among them, the deformation at point C in Baquan Gorge increased most significantly. Notably, the occurrence of rockfall events is controlled by a combination of internal and external factors [3]. The field survey found that the topographic and geostructural characteristics of point C made it more prone to rockfalls under rainfall conditions. Therefore, the deformation of point C continuously increases during the rainy season from July to September.
The influence of the rainfall intensity on rockfalls can be explained by different processes, such as water pressure, strength weakening, accelerated weathering and the erosion of supporting material [3]. Although many scholars have shown the influence of rainfall on the rockfall frequency [22], rainfall is not the only causal factor. The geometrical properties and geostructural characteristics of the rock mass conditions also directly control the frequency of rockfall events. Therefore, the correlation between rainfall and rockfall frequency revealed by the SBAS-InSAR technique in this study is only a preliminary result, and further analysis is needed in future studies.

6. Conclusions

Taking the Taihang GCSA as an example, this study applied the SAD method to achieve the static identification of potential rockfall source areas at a regional scale and then identified the activity of potential rockfall source areas with the help of SBAS-InSAR technology. On this basis, a typical potential rockfall point, named Sky City, was selected to analyze the rockfall movement characteristics by using RA 1.1 software. Finally, a rockfall hazard assessment in the canyon region was demonstrated. The main conclusions obtained are as follows:
(1)
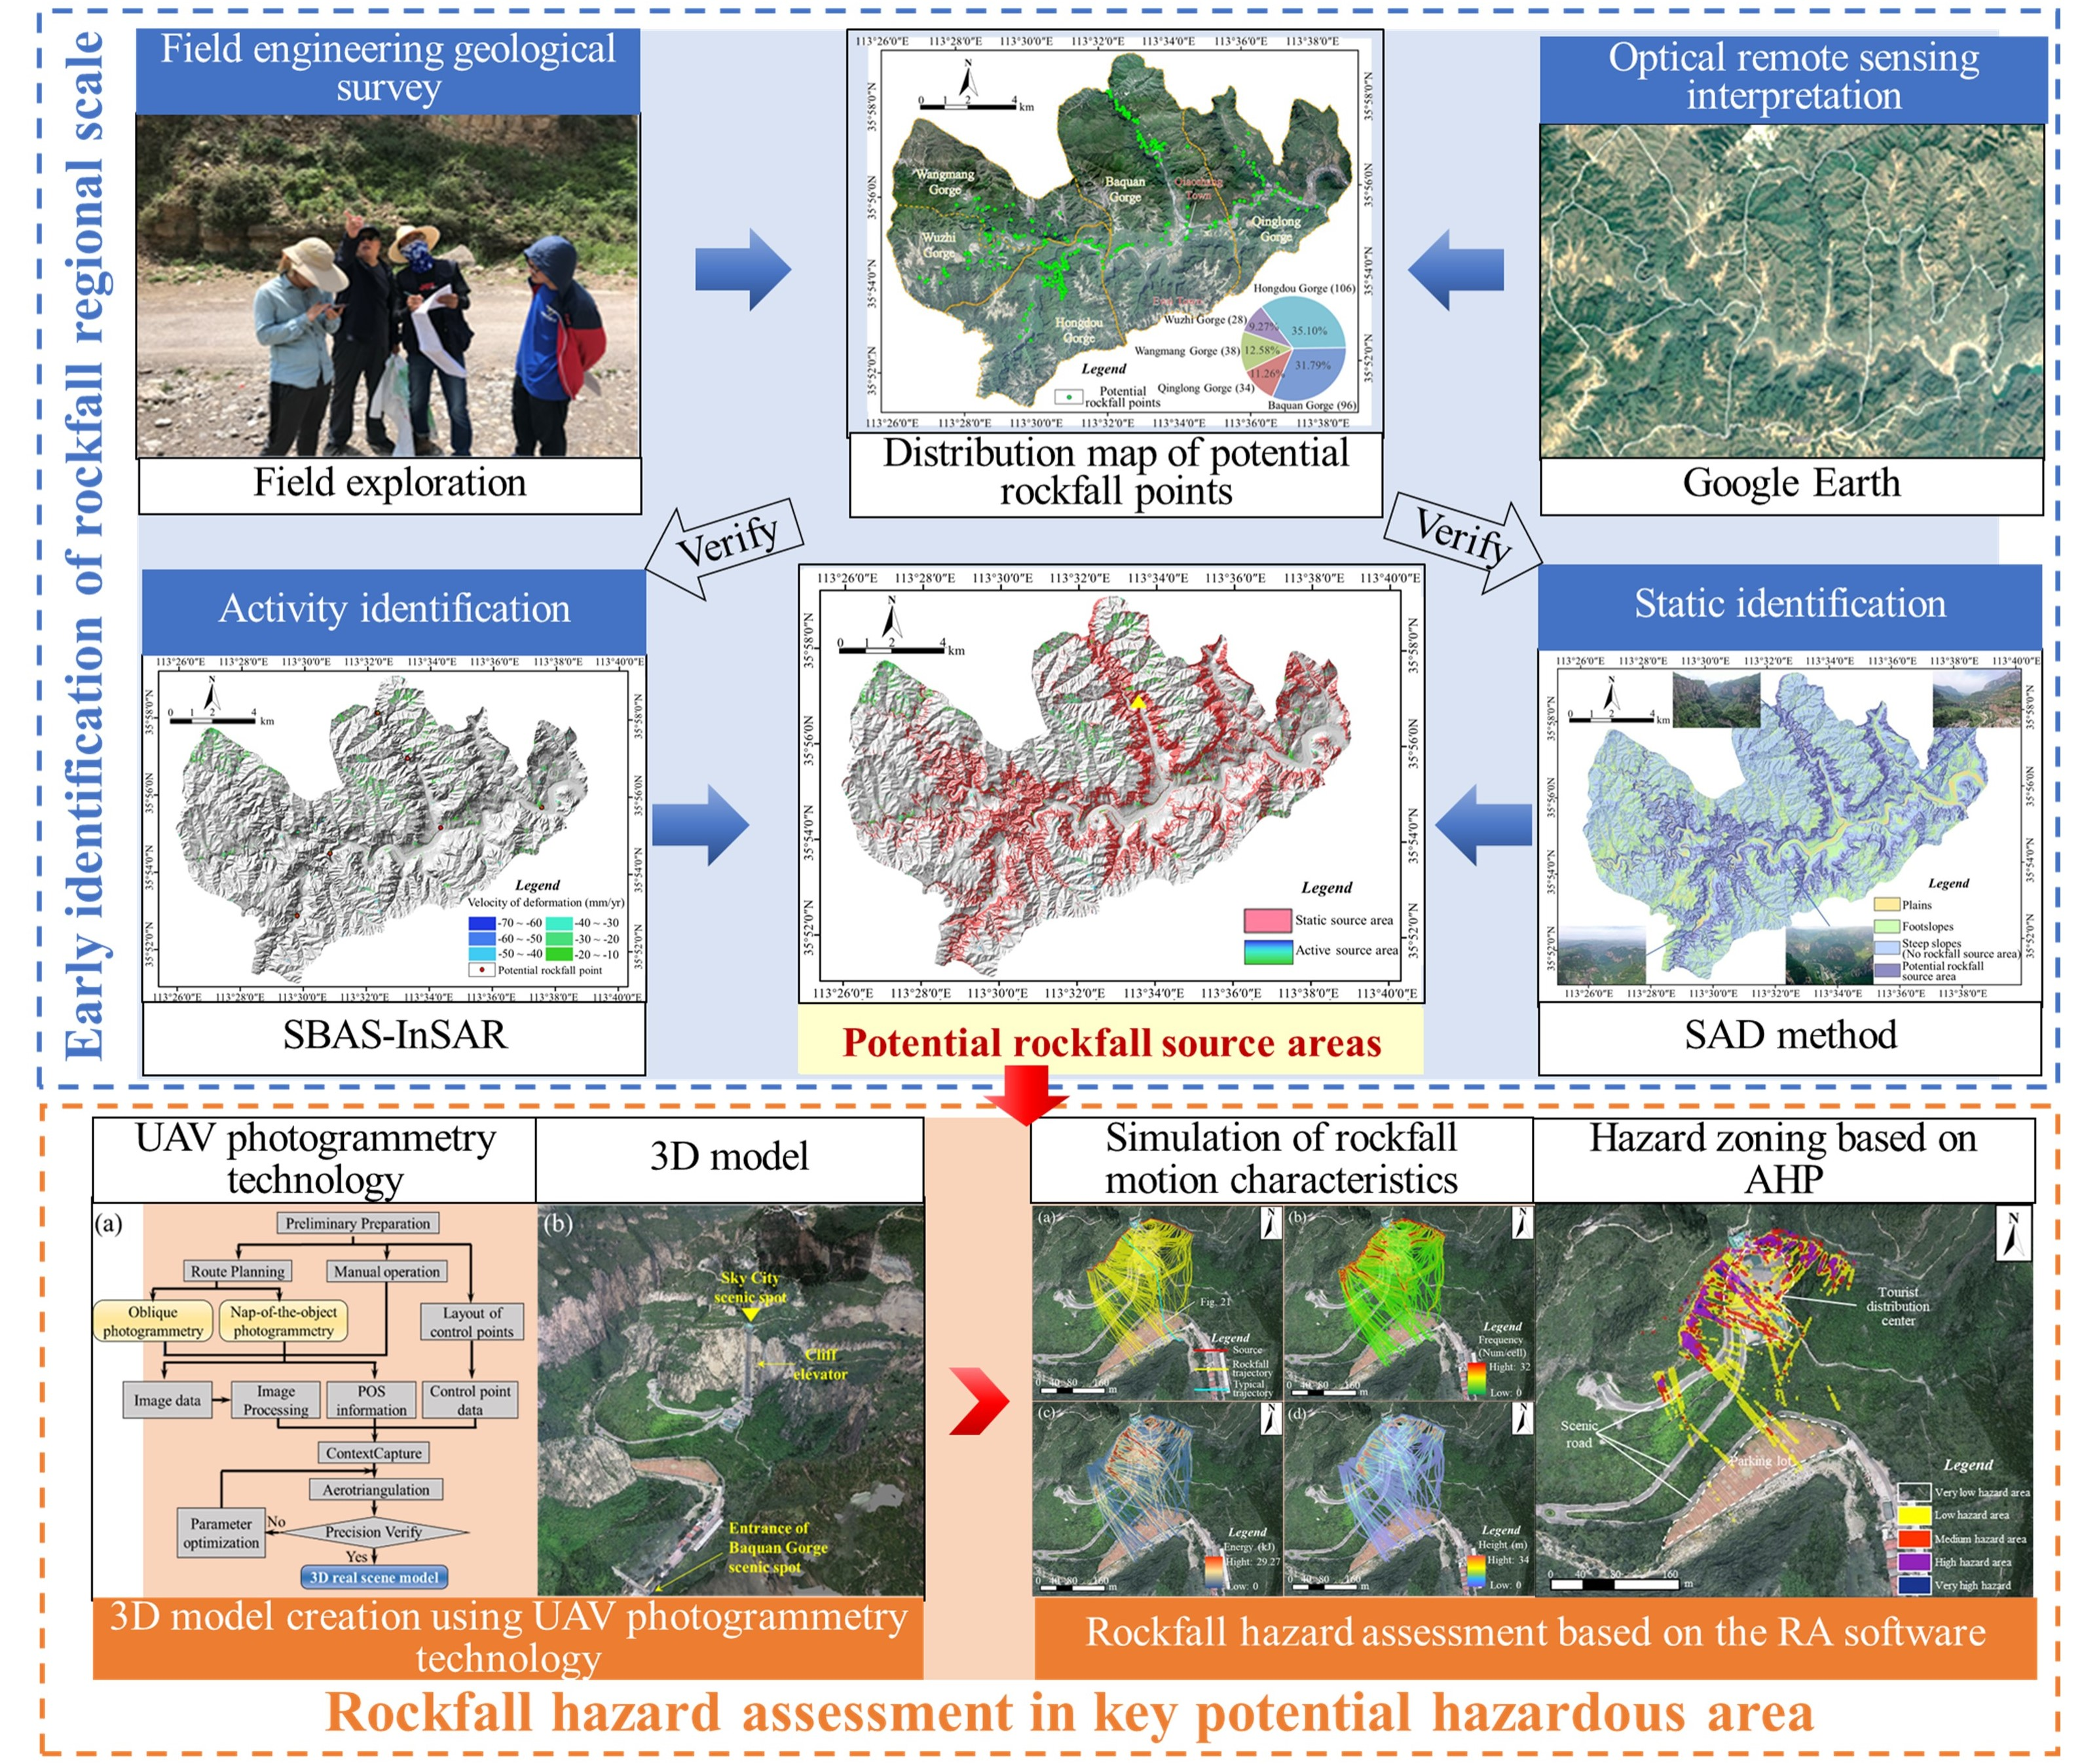
For the early identification of potential rockfall source areas in alpine canyon regions, a region-scale identification framework combining static identification and dynamic detection was proposed in this study. The proposed framework was proven to be efficient and accurate.
(2)
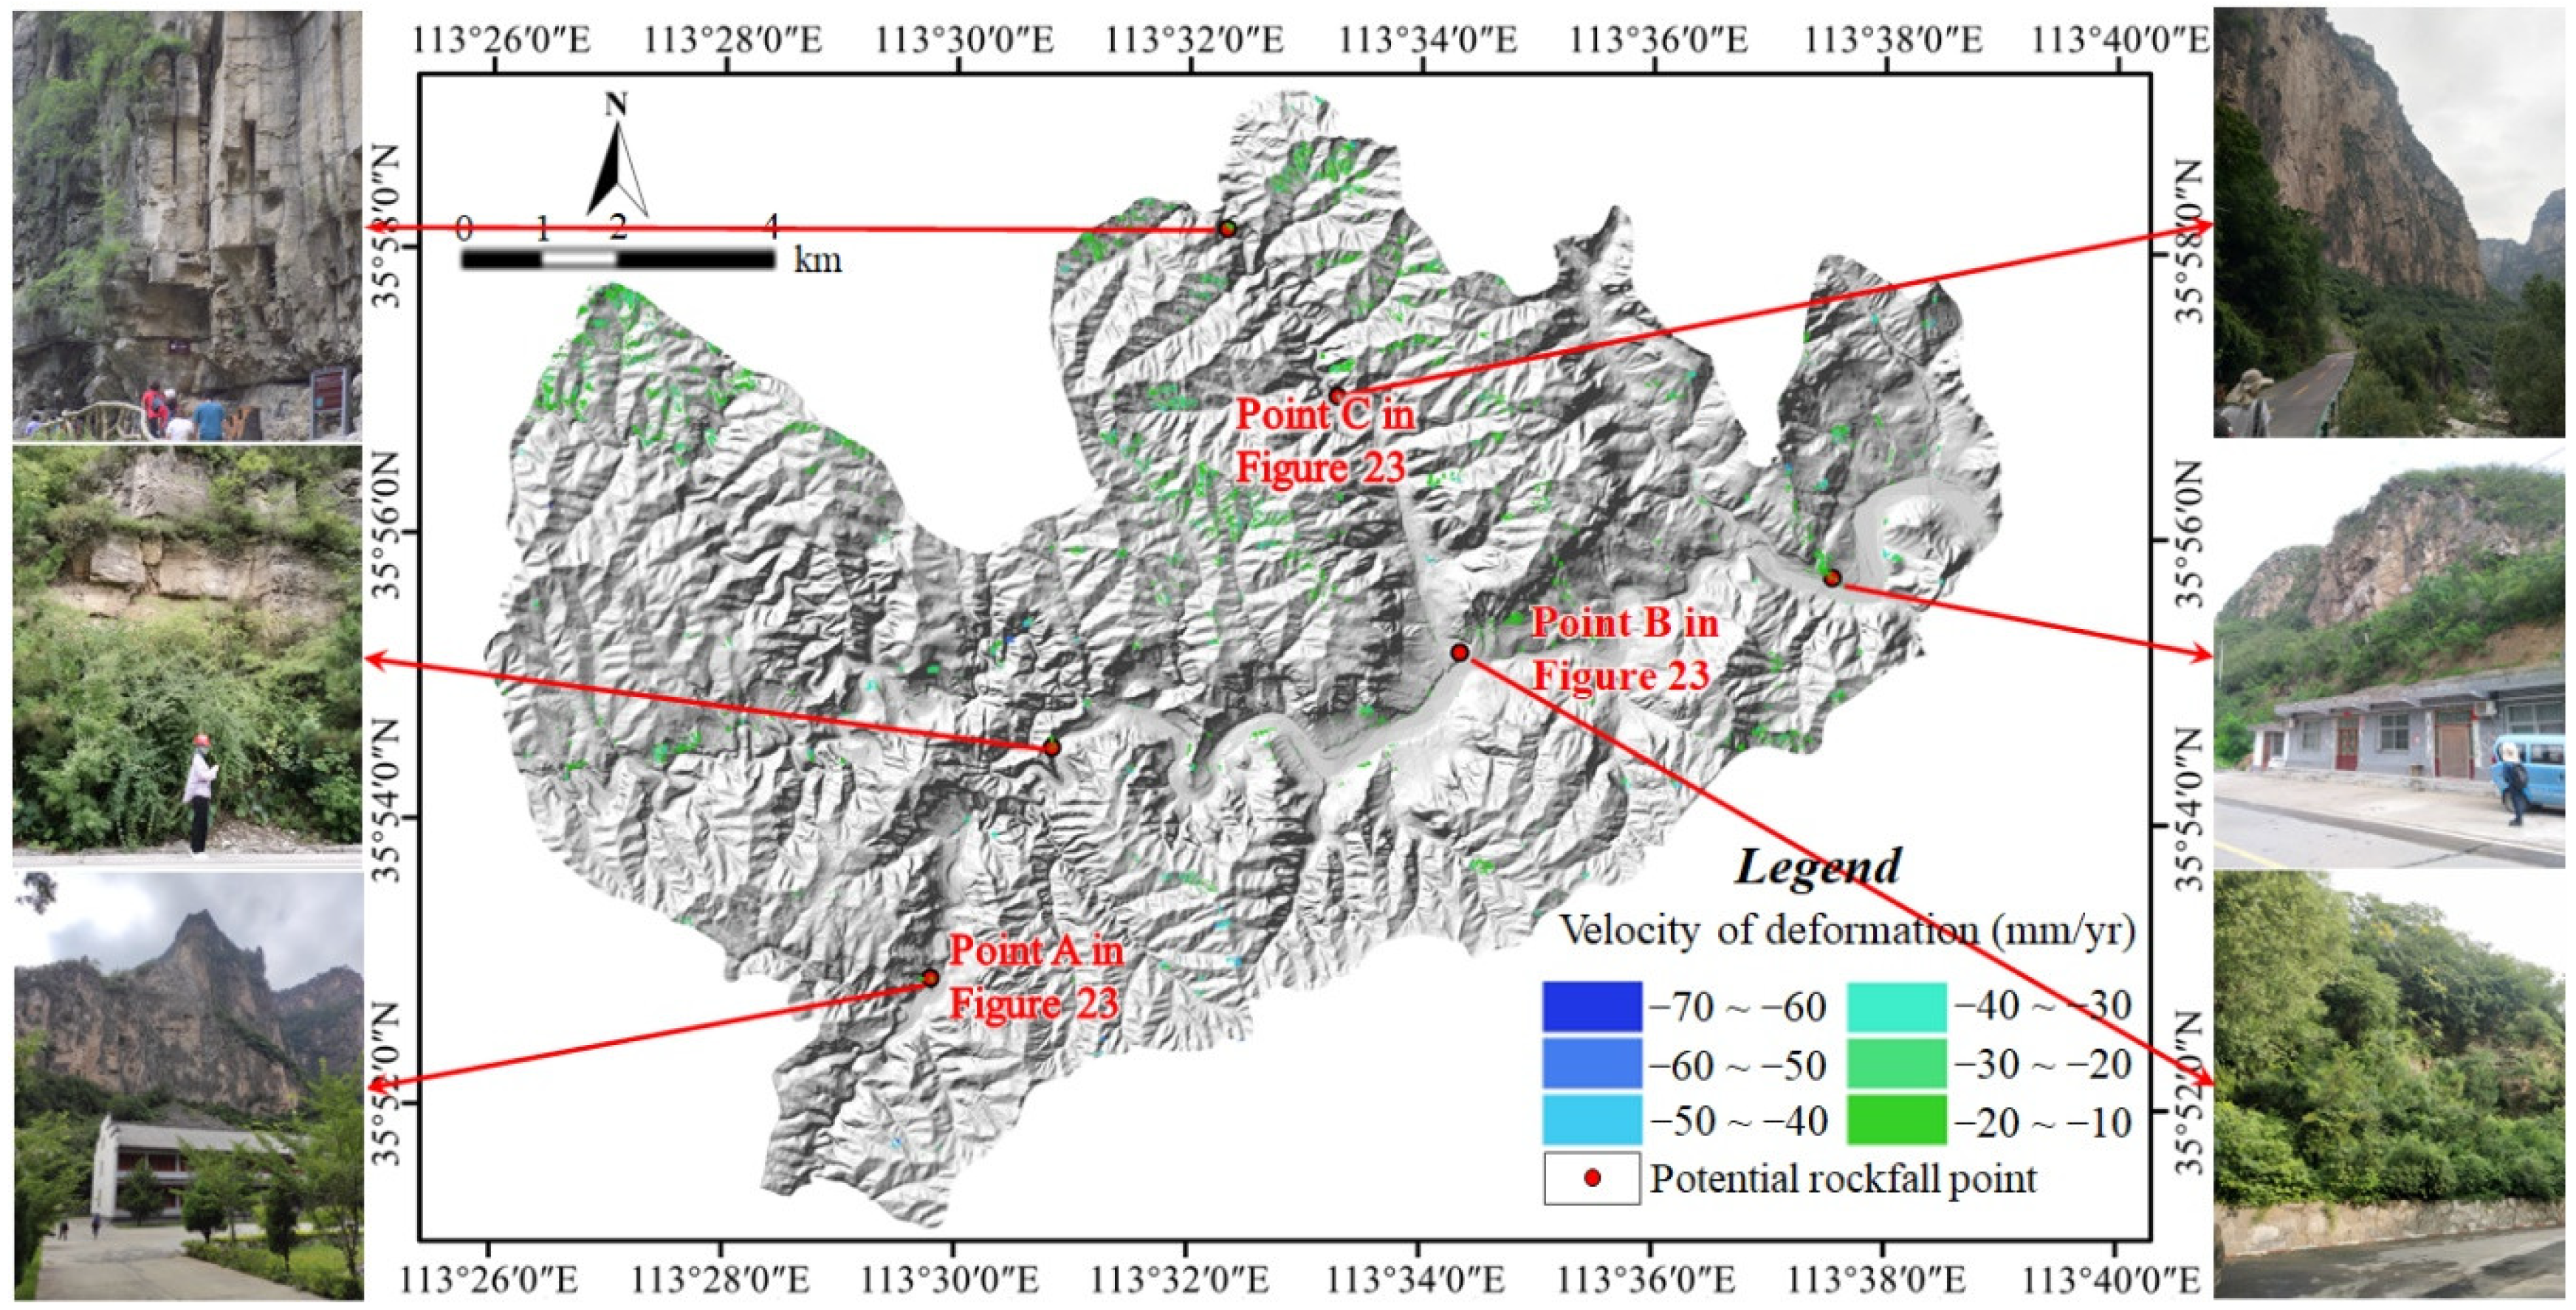
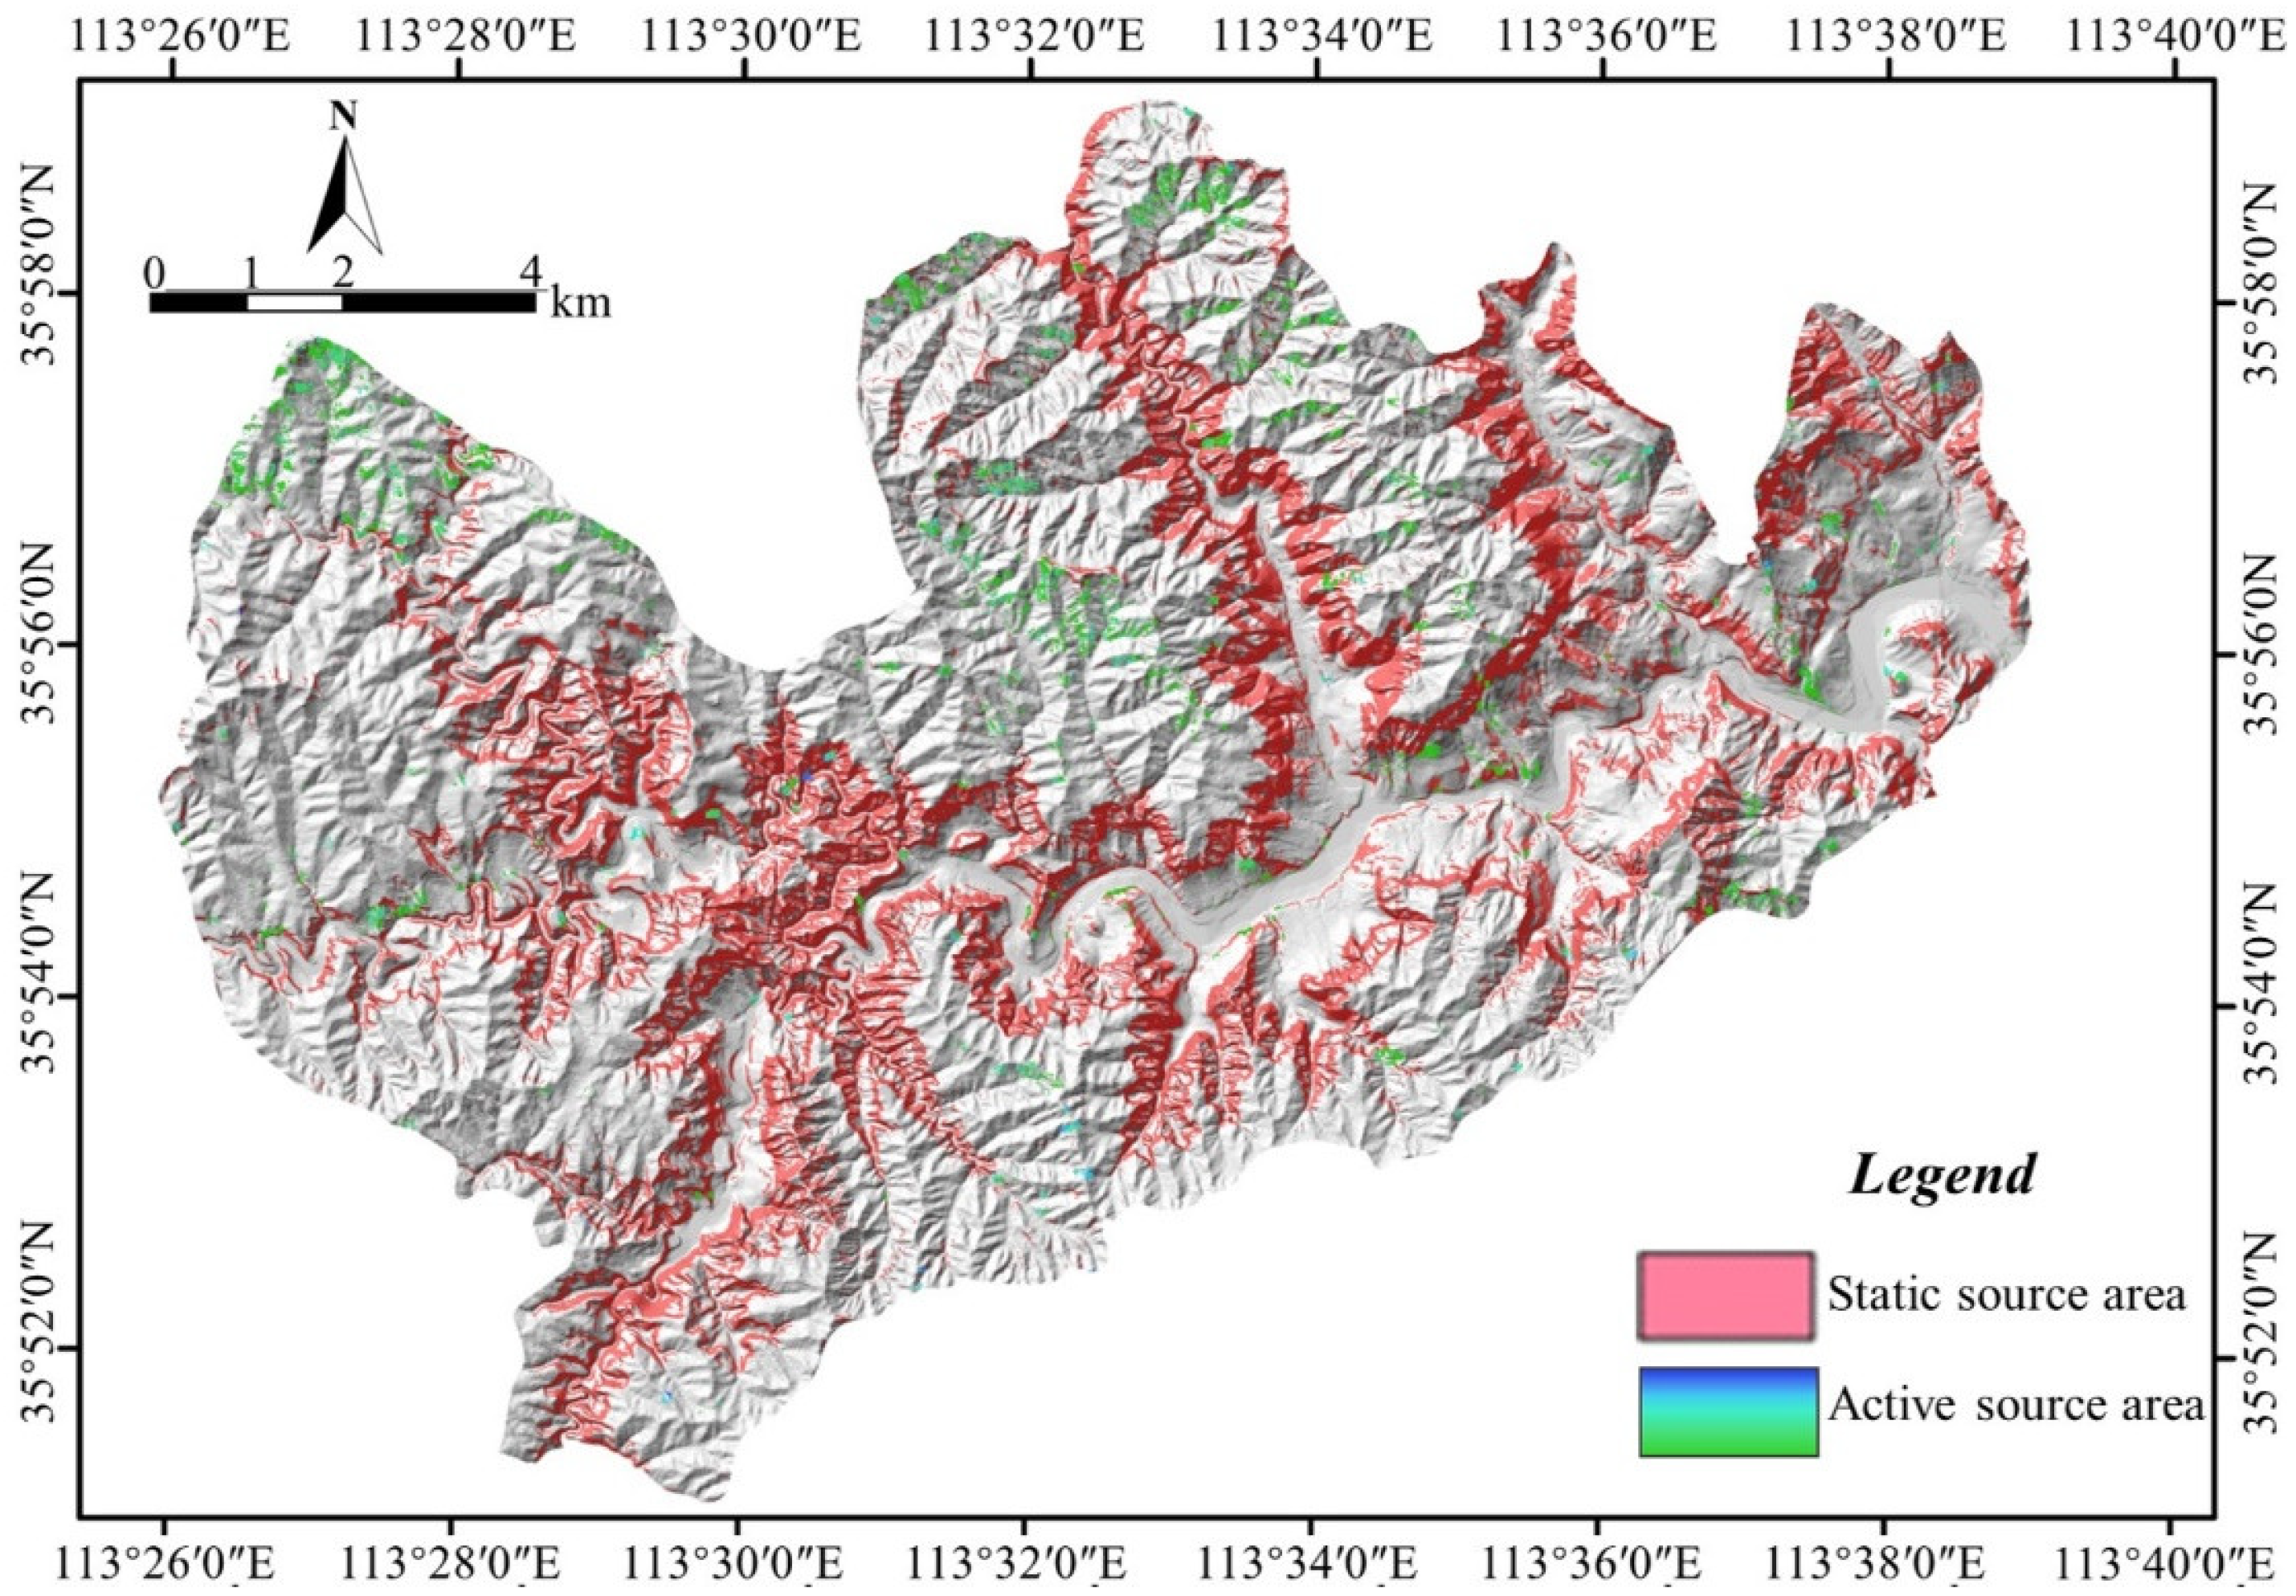
The total area of potential rockfall sources in the Taihang GCSA is 33.47 km2, accounting for 21.47% of the study area, which is mainly distributed in strips on the cliffs on both sides of the canyon. Among them, the active source area determined by SBAS-InSAR technology is 2.96 km2, and their deformation rates are mainly −20~−10 mm/year. The field verification shows that the identification results were basically consistent with the field situation.
(3)
To meet the needs of high-locality rockfall hazard assessment in the key potential hazardous area of the canyon region, this study proposed a scheme to construct a high-precision 3D real scene model of the canyon region by integrating UAV oblique photogrammetry and nap-of-the-object photogrammetry technology.
(4)
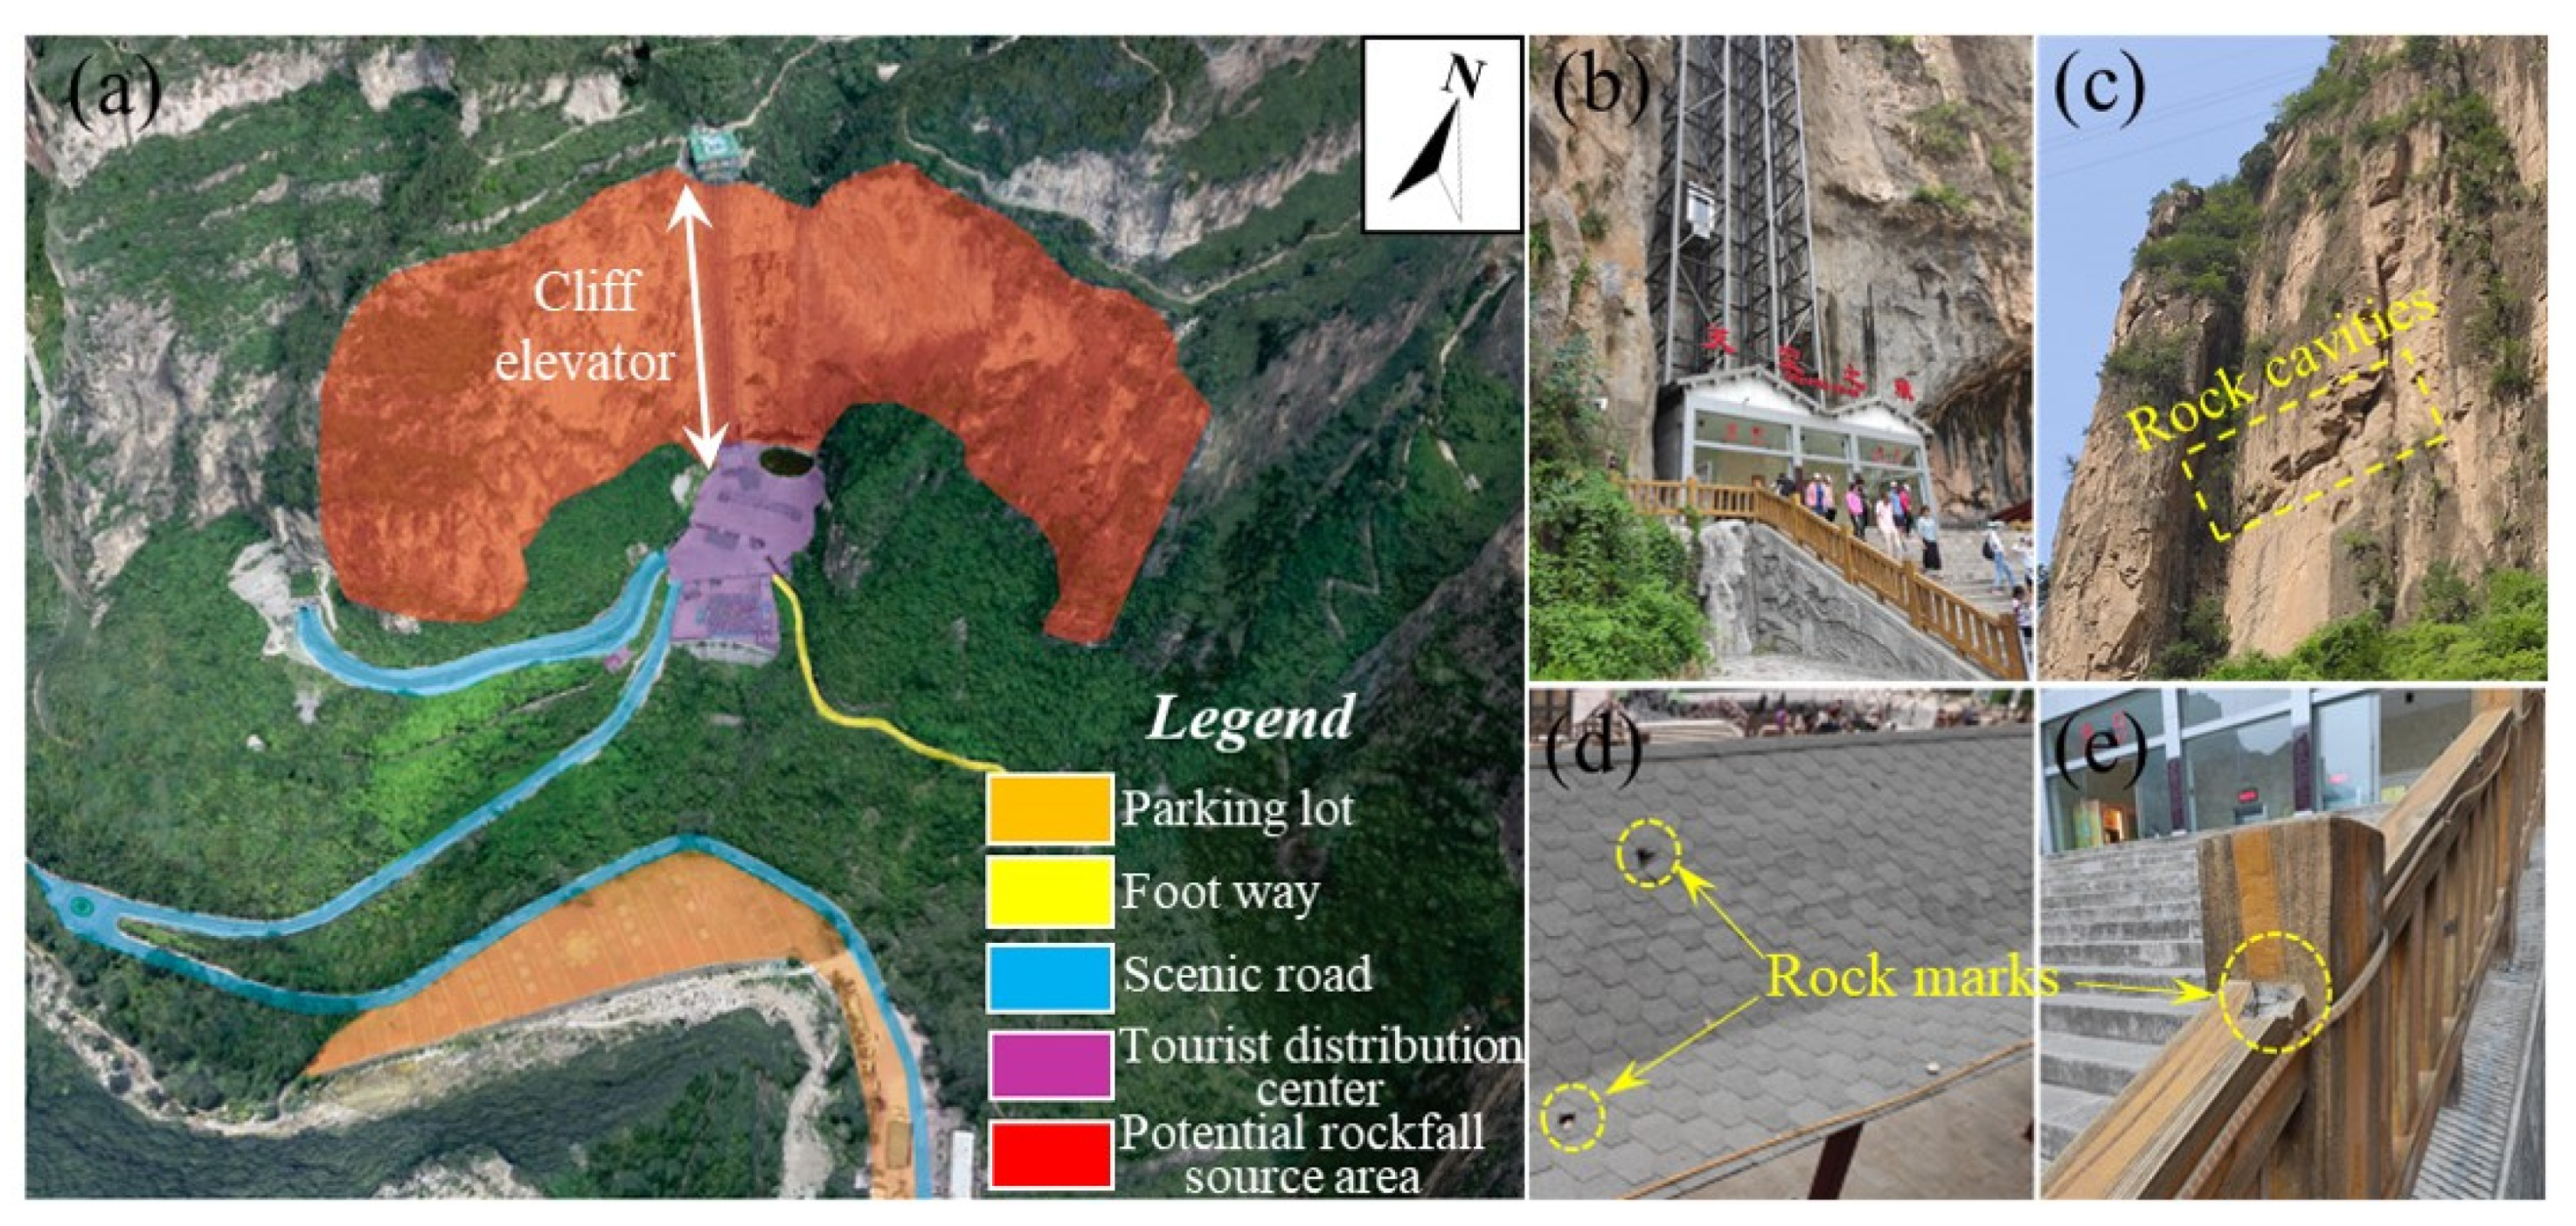
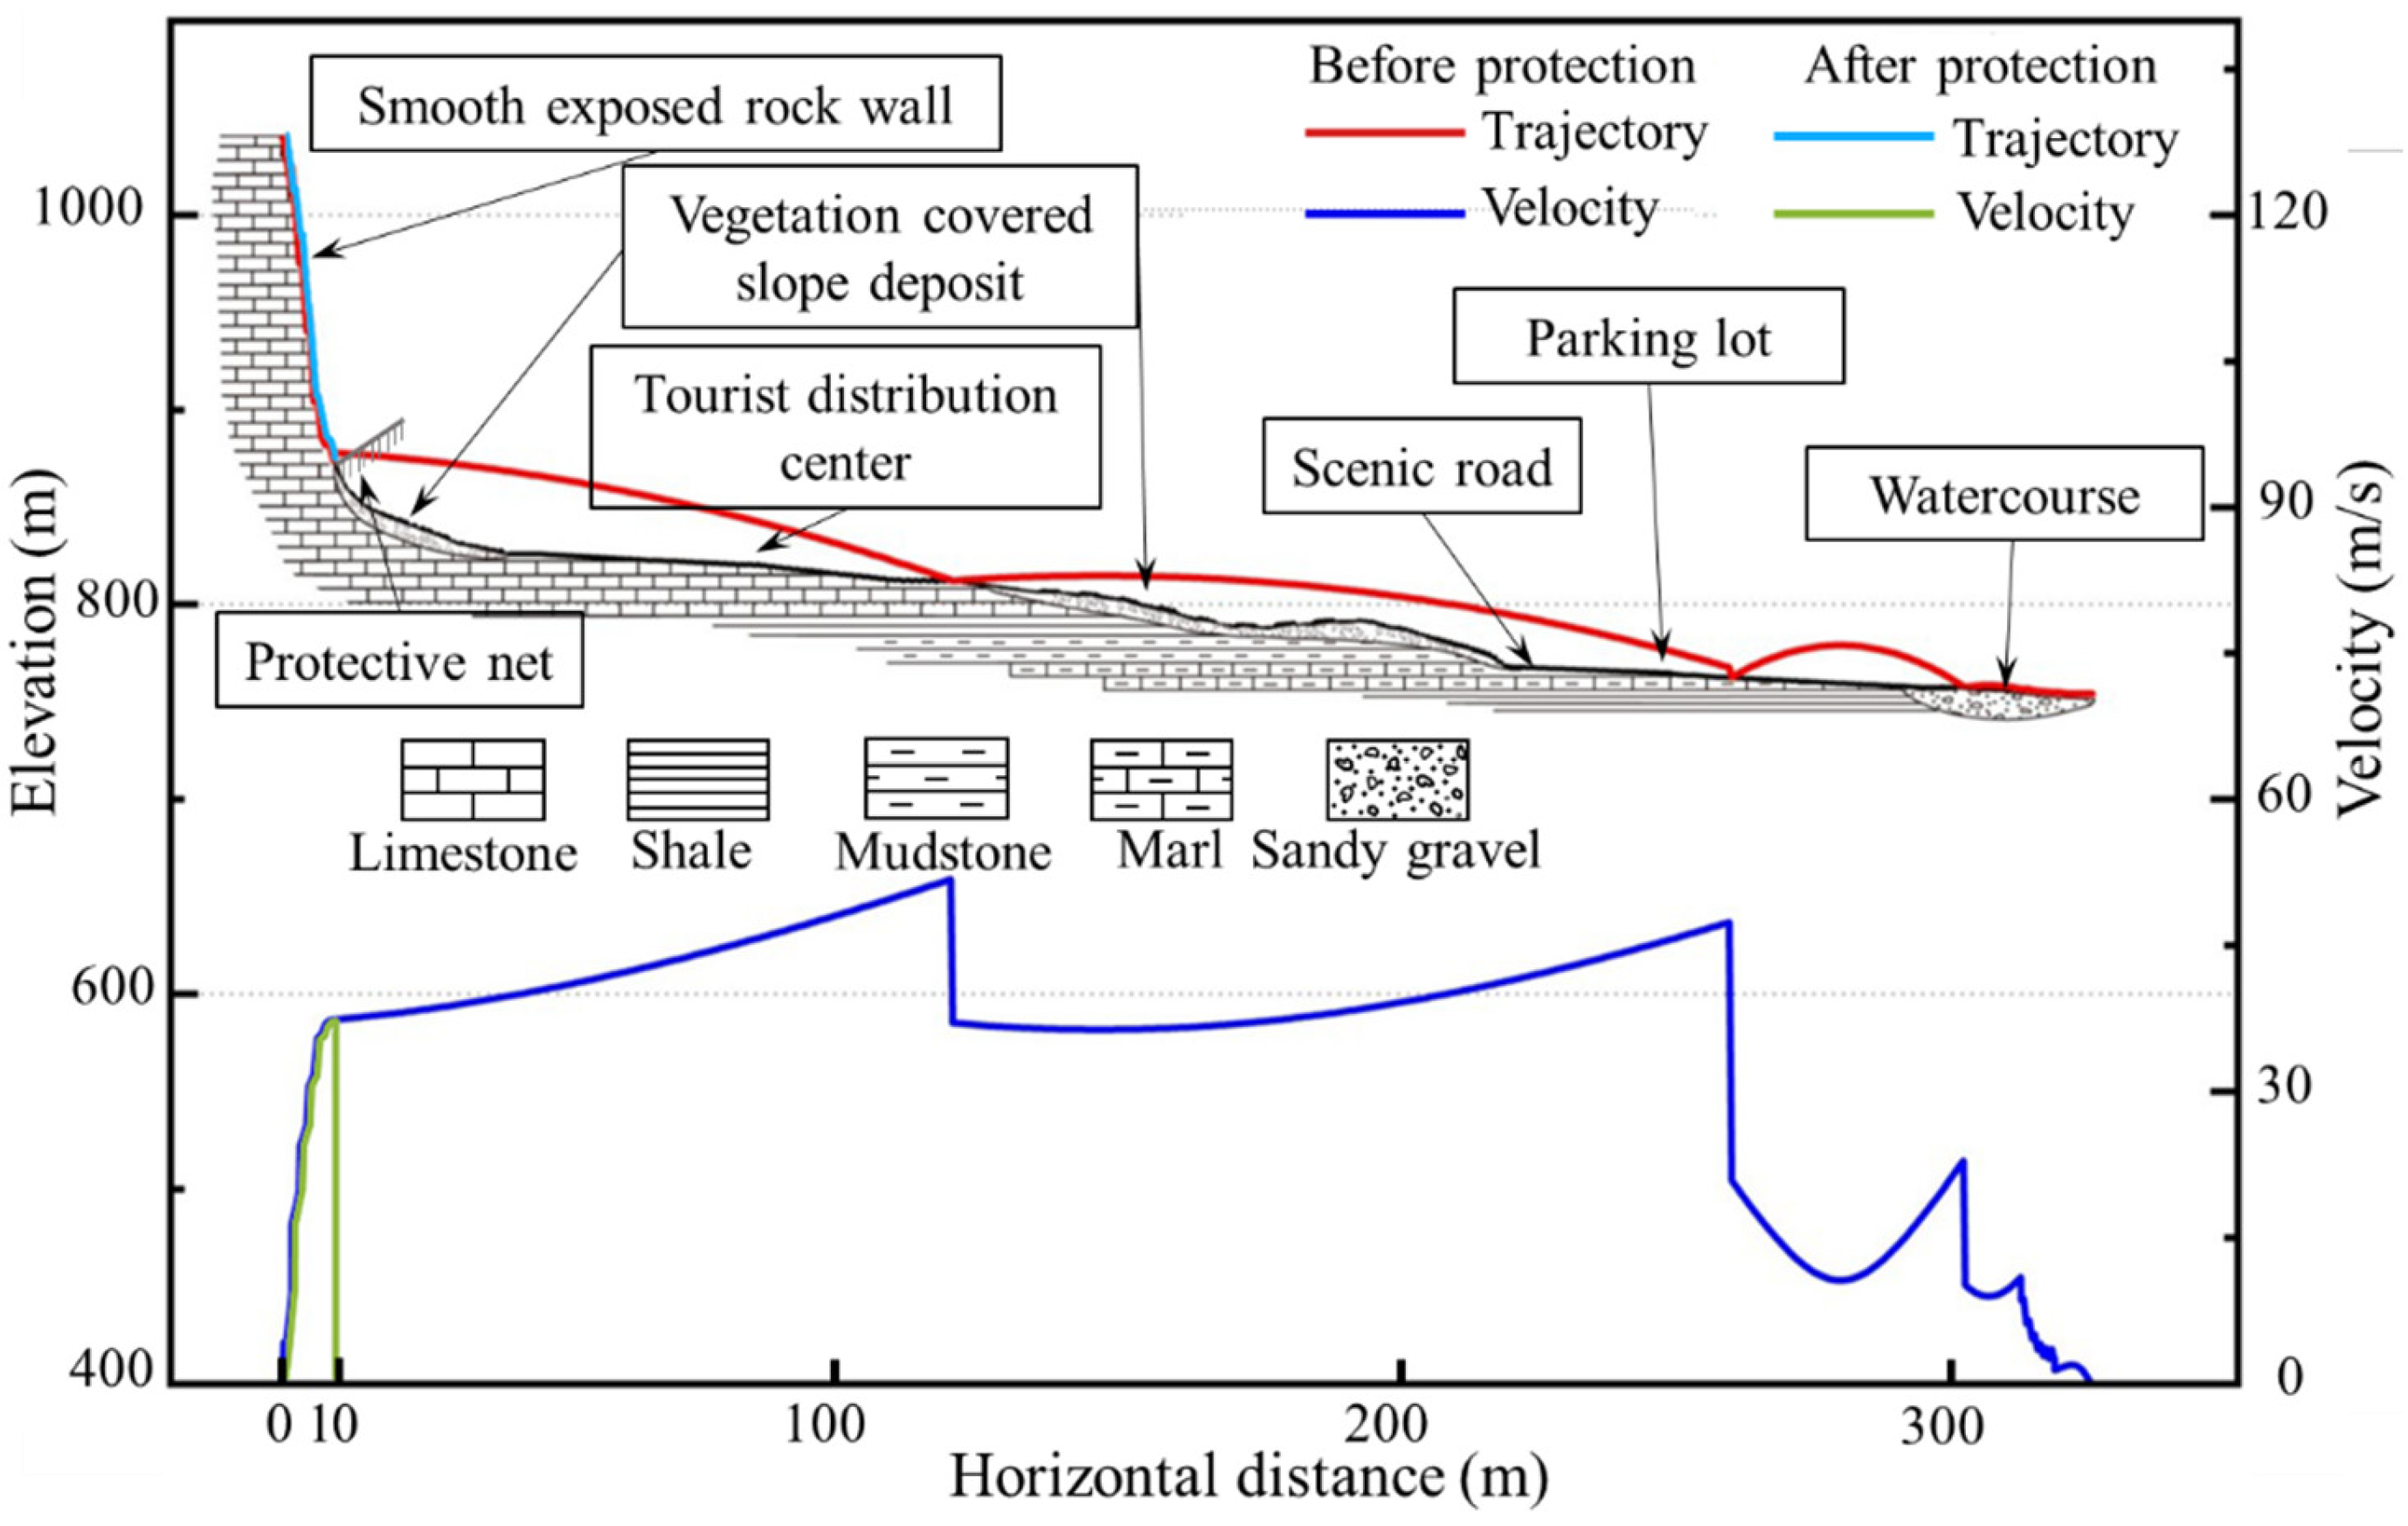
Raster models of the rockfall frequency, bounce height and kinematic energy were obtained by simulating the rockfall movement process, and the weight of each disaster-causing factor was determined by introducing the AHP method. The results of the hazard assessment indicated that the high-energy area of rockfalls at the scenic spots of Sky City was distributed at the foot of the steep cliff and primarily threatened the tourist distribution center below.
(5)
This study proposed an easy-to-use integrated solution from region-scale early identification to individual evaluation of rockfall events, which can provide a technical reference for rockfall prevention and control in similar alpine canyon regions. In future research, the applicability and accuracy of the InSAR technique in identifying the activity of potential rockfall source areas need to be further improved.

Author Contributions

Conceptualization, J.Z. and J.P.; methodology, J.Z. and Z.Y. (Zhaoyue Yu); software, Z.Y. (Zhaoyue Yu) and Z.Y. (Zhaowei Yao); validation, Y.L. and S.S.; investigation, J.Z., Y.L. and Z.Y. (Zhaoyue Yu); writing—original draft preparation, J.Z. and Z.Y. (Zhaoyue Yu); writing—review and editing, J.Z. and J.P.; supervision, J.P.; funding acquisition, J.Z. and Y.L. All authors have read and agreed to the published version of the manuscript.

Funding

This research was funded by the National Natural Science Fund of China (Grant No. 42007269), the National Key Research and Development Program of China (2020YFC1512000), the Geological Exploration Project of Shanxi Province (Grant No. 220126200089), the National Postdoctoral Program for Innovative Talents (Grant No. BX20200286), the China Postdoctoral Science Foundation (Grant No. 2021M700526), the Fundamental Research Funds for the Central Universities, CHD (Grant No. 300102261103) and the Key Laboratory of Safety Engineering and Technology Research of Zhejiang Province (Grant No. 202105).

Data Availability Statement

Not applicable.

Acknowledgments

We appreciate the anonymous reviewers for providing valuable comments on this manuscript. We appreciate the Shanxi Coal Geology 148 Exploration Institute for their help and support to our field work.

Conflicts of Interest

The authors declare no conflict of interest. The funders had no role in the design of the study; in the collection, analyses, or interpretation of data; in the writing of the manuscript, or in the decision to publish the results.

References

  1. Matsuoka, N.; Sakai, H. Rockfall activity from an alpine cliff during thawing periods. Geomorphology 1999, 28, 309–328. [Google Scholar] [CrossRef]
  2. Frattini, P.; Crosta, G.B.; Agliardi, F. Rockfall characterization and modeling. In Landslides: Types, Mechanisms and Modeling; Stead, D., Clague, J.J., Eds.; Cambridge University Press: Cambridge, UK, 2012; pp. 267–281. [Google Scholar]
  3. Loew, S.; Hantz, D.; Gerber, W. 5.09-Rockfall Causes and Transport Mechanisms-A Review. In Treatise on Geomorphology, 2nd ed.; Shroder, J.F., Ed.; Academic Press: Oxford, MA, USA, 2022; pp. 137–168. [Google Scholar]
  4. Hungr, O.; Leroueil, S.; Picarelli, L. The Varnes classification of landslide types, an update. Landslides 2014, 11, 167–194. [Google Scholar] [CrossRef]
  5. Cruden, D.M.; Varnes, D.J. Landslide types and processes. In Landslides Investigation and Mitigation; Turner, A.K., Schuster, R.L., Eds.; Transportation research board, US National Research Council: Washington, DC, USA, 1996; Volume 247, pp. 36–75. [Google Scholar]
  6. Dussauge, C.; Carine, J.R.; Helmstetter, A. Statistical analysis of rockfall volume distributions: Implications for rockfall dynamics. J. Geophys. Res. Sol. Ea. 2007, 108, 2286. [Google Scholar] [CrossRef] [Green Version]
  7. Li, X.N.; Ling, S.X.; Sun, C.W.; Xu, J.X.; Huang, T. Integrated rockfall hazard and risk assessment along highways: An example for Jiuzhaigou area after the 2017 Ms 7.0 Jiuzhaigou earthquake, China. J. Mt. Sci. 2019, 16, 1318–1335. [Google Scholar] [CrossRef]
  8. Carlà, T.; Nolesini, T.; Solari, L.; Rivolta, C.; Cas, L.D.; Casagli, N. Rockfall forecasting and risk management along a major transportation corridor in the Alps through ground-based radar interferometry. Landslides 2019, 16, 1425–1435. [Google Scholar] [CrossRef] [Green Version]
  9. Bajni, G.; Camera, C.A.S.; Apuani, T. Deciphering meteorological influencing factors for Alpine rockfalls: A case study in Aosta Valley. Landslides 2021, 18, 3279–3298. [Google Scholar] [CrossRef]
  10. Giordan, D.; Cignetti, M.; Godone, D.; Bertolo, D.; Paganone, M. Definition of an operative methodology for the management of rockfalls along with the road network. Sustainability 2021, 13, 7669. [Google Scholar] [CrossRef]
  11. Wang, X.L.; Liu, H.Y.; Sun, J.J. A new approach for identification of potential rockfall source areas controlled by rock mass strength at a regional scale. Remote Sens. 2021, 13, 938. [Google Scholar] [CrossRef]
  12. Alvioli, M.; Santangelo, M.; Fiorucci, F.; Cardinali, M.; Marchesini, I.; Reichenbach, P.; Rossi, M.; Guzzetti, F.; Peruccacci, S. Rockfall susceptibility and network-ranked susceptibility along the Italian railway. Eng. Geol. 2021, 293, 106301. [Google Scholar] [CrossRef]
  13. Salvini, R.; Francioni, M.; Riccucci, S.; Bonciani, F.; Callegari, I. Photogrammetry and laser scanning for analyzing slope stability and rock fall runout along the Domodossola–Iselle railway, the Italian Alps. Geomorphology 2013, 185, 110–122. [Google Scholar] [CrossRef]
  14. Cignetti, M.; Godone, D.; Bertolo, D.; Paganone, M.; Thuegaz, P.; Giordan, D. Rockfall susceptibility along the regional road network of Aosta Valley Region (northwestern Italy). J. Maps 2021, 17, 54–64. [Google Scholar] [CrossRef]
  15. Colomina, I.; Molina, P. Unmanned aerial systems for photogrammetry and remote sensing: A review. ISPRS J. Photogramm. Remote Sens. 2014, 92, 79–97. [Google Scholar] [CrossRef] [Green Version]
  16. Abellan, A.; Vilaplana, J.M.; Martinez, J. Application of a long-range Terrestrial Laser Scanner to a detailed rockfall study at Vall de Nuria (Eastern Pyrenees, Spain). Eng. Geol. 2006, 88, 136–148. [Google Scholar] [CrossRef]
  17. Zhang, Y.C.; Yue, P.; Zhang, G.K.; Guan, T.; Lv, M.M.; Zhong, D.H. Augmented reality mapping of rock mass discontinuities and rockfall susceptibility based on unmanned aerial vehicle photogrammetry. Remote Sens. 2019, 11, 1311. [Google Scholar] [CrossRef] [Green Version]
  18. Fanos, A.M.; Pradhan, B.; Alamri, A.; Lee, C.W. Machine learning-based and 3D kinematic models for rockfall hazard assessment using LiDAR Data and GIS. Remote Sens. 2020, 12, 1755. [Google Scholar] [CrossRef]
  19. Liu, H.Y.; Wang, X.L.; Liao, X.H.; Sun, J.J.; Zhang, S. Rockfall investigation and hazard assessment from Nang County to Jiacha County in Tibet. Appl. Sci. 2019, 10, 247. [Google Scholar] [CrossRef] [Green Version]
  20. Zhan, J.W.; Chen, J.P.; Zhang, W.; Han, X.D.; Sun, X.H.; Bao, Y.D. Mass movements along a rapidly uplifting river valley: An example from the upper Jinsha River, southeast margin of the Tibetan Plateau. Environ. Earth Sci. 2018, 77, 634. [Google Scholar] [CrossRef]
  21. Menéndez Duarte, R.; Marquínez, J. The influence of environmental and lithologic factors on rockfall at a regional scale: An evaluation using GIS. Geomorphology 2002, 43, 117–136. [Google Scholar] [CrossRef]
  22. Dorren, L.K.A. A review of rockfall mechanics and modelling approaches. Prog. Phys. Geogr. 2003, 27, 69–87. [Google Scholar] [CrossRef]
  23. Guzzetti, F.; Reichenbach, P.; Wieczorek, G.F. Rockfall hazard and risk assessment in the Yosemite Valley, California, USA. Nat. Hazards Earth Syst. Sci. 2003, 3, 491–503. [Google Scholar] [CrossRef] [Green Version]
  24. Frattini, P.; Crosta, G.; Carrara, A.; Agliardi, F. Assessment of rockfall susceptibility by integrating statistical and physically-based approaches. Geomorphology 2008, 94, 419–437. [Google Scholar] [CrossRef]
  25. Mutar, F.A.; Biswajeet, P. A novel rockfall hazard assessment using laser scanning data and 3D modelling in GIS. Catena 2018, 172, 435–450. [Google Scholar]
  26. Jaboyedoff, M.; Labiouse, V. Preliminary assessment of rockfall hazard based on GIS data. In Proceedings of the 10th International Congress on Rock Mechanics ISRM, Sandton, South Africa, 8 September 2003; pp. 575–578. [Google Scholar]
  27. Loye, A.; Michel, J.; Andrea, P. Identification of potential rockfall source areas at a regional scale using a DEM-based geomorphometric analysis. Nat. Hazards Earth Syst. Sci. 2009, 9, 1643–1653. [Google Scholar] [CrossRef]
  28. Hu, J.A.; Li, Z.W.; Ding, X.L.; Zhu, J.J.; Zhang, L.; Sun, Q. Resolving three-dimensional surface displacements from InSAR measurements: A review. Earth-Sci. Rev. 2014, 133, 1–17. [Google Scholar] [CrossRef]
  29. Hosseini, F.; Pichierri, M.; Eppler, J.; Rabus, B. Staring spotlight TerraSAR-X SAR interferometry for identification and monitoring of small-scale landslide deformation. Remote Sens. 2018, 10, 844. [Google Scholar] [CrossRef] [Green Version]
  30. Li, Z.; Wang, J.A.; Li, L.; Wang, L.X.; Liang, R.Y. A case study integrating numerical simulation and GB-InSAR monitoring to analyze flexural toppling of an anti-dip slope in Fushun open pit. Eng. Geol. 2015, 197, 20–32. [Google Scholar] [CrossRef] [Green Version]
  31. Lin, Z.H.; Duan, Y.; Deng, Y.K.; Tian, W.M.; Zhao, Z. An improved multi-baseline phase unwrapping method for GB-InSAR. Remote Sens. 2022, 14, 2543. [Google Scholar] [CrossRef]
  32. Di Matteo, L.; Romeo, S.; Kieffer, D.S. Rock fall analysis in an Alpine area by using a reliable integrated monitoring system: Results from the Ingelsberg slope (Salzburg Land, Austria). Bull. Eng. Geol. Environ. 2017, 76, 413–420. [Google Scholar] [CrossRef]
  33. Ferrari, F.; Giacomini, A.; Thoeni, K. Qualitative rockfall hazard assessment: A comprehensive review of current practices. Rock Mech. Rock Eng. 2016, 49, 2865–2922. [Google Scholar] [CrossRef]
  34. Volkwein, A.; Schellenberg, K.; Labiouse, V.; Agliardi, F.; Berger, F.; Bourrier, F.; Dorren, L.K.A.; Gerber, W.; Jaboyedoff, M. Rockfall characterisation and structural protection-a review. Nat. Hazards Earth Syst. Sci. 2011, 11, 2617–2651. [Google Scholar] [CrossRef] [Green Version]
  35. Fanos, A.M.; Pradhan, B. Multi-scenario rockfall hazard assessment using LiDAR Data and GIS. Geotech. Geol. Eng. 2016, 34, 1375–1393. [Google Scholar] [CrossRef]
  36. Stevens, W.D. RocFall, a Tool for Probabilistic Analysis, Design of Remedial Measures and Prediction of Rockfalls. Master Thesis, University of Toronto, Toronto, Canada, 1998. [Google Scholar]
  37. Dorren, L.; Berger, F. New approaches for 3D rockfall modelling with or without the effect of forest in Rockyfor3D. In Proceedings of the EGU General Assembly, Vienna, Austria, 2–7 May 2010; p. 14811. [Google Scholar]
  38. Lan, H.X.; Martin, C.D.; Lim, C.H. RockFall analyst: A GIS extension for three-dimensional and spatially distributed rockfall hazard modeling. Comput. Geotech. 2006, 33, 262–279. [Google Scholar] [CrossRef]
  39. Guzzetti, F.; Crosta, G.; Detti, R.; Agliardi, F. STONE: A computer program for the three-dimensional simulation of rock-falls. Comput. Geosci. 2002, 28, 1079–1093. [Google Scholar] [CrossRef]
  40. Lan, H.X.; Martin, C.D.; Zhou, C.H.; Lim, C.H. Rockfall hazard analysis using LiDAR and spatial modeling. Geomorphology 2010, 118, 213–223. [Google Scholar] [CrossRef]
  41. Wang, X.L.; Zhang, L.Q.; Zhang, Z.J.; Zhang, A.M.; Yun, G.R. Rockfall hazard analysis of slope at sutras cave of Shijing Mountain. Rock Soil Mech. 2012, 33, 191–196. [Google Scholar]
  42. Wang, Y.; Zhou, L.Y.; Liu, S.F.; Li, J.Y.; Yang, T.N. Post-cratonization deformation processes and tectonic evolution of the North China Craton. Earth-Sci. Rev. 2018, 177, 320–365. [Google Scholar] [CrossRef]
  43. He, K.; Chen, C.L.; Li, B. Case study of a rockfall in Chongqing, China: Movement characteristics of the initial failure process of a tower-shaped rock mass. Bull. Eng. Geol. Environ. 2019, 78, 3295–3303. [Google Scholar] [CrossRef]
  44. Fu, H.L.; Chen, W.; Fu, J.J. Rockfall mechanisms and block theoretical stability analysis. In Rock Mechanics and Engineering: Prediction and Control of Landslides and Geological Disasters; Fu, H.L., Chen, W., Fu, J.J., Eds.; Elsevier Academic Press: Amsterdam, The Netherlands, 2021; pp. 89–125. [Google Scholar]
  45. Wendeler, C.; Bühler, Y.; Bartelt, P.; Glover, J. Application of three-dimensional rockfall modelling to rock face engineering. Geomech. Tunn. 2017, 10, 74–80. [Google Scholar] [CrossRef]
  46. Strahler, A.N. Equilibrium theory of erosional slopes approached by frequency distribution analysis. Am. J. Sci. 1950, 248, 673–696. [Google Scholar] [CrossRef]
  47. Losasso, L.; Jaboyedoff, M.; Sdao, F. Potential rock fall source areas identification and rock fall propagation in the province of Potenza territory using an empirically distributed approach. Landslides 2017, 14, 1593–1602. [Google Scholar] [CrossRef]
  48. Corona, C.; Trappmann, D.; Stoffel, M. Parameterization of rockfall source areas and magnitudes with ecological recorders: When disturbances in trees serve the calibration and validation of simulation runs. Geomorphology 2013, 202, 33–42. [Google Scholar] [CrossRef]
  49. Derron, M.H.; Stalsberg, K.; Sletten, K. Method for the Susceptibility Mapping of Rock Falls in Norway; Geological Survey of Norway: Trondheim, Norway, 2016; p. 22. [Google Scholar]
  50. Berardino, P.; Fornaro, G.; Lanari, R.; Sansosti, E. A new algorithm for surface deformation monitoring based on small baseline differential SAR interferograms. IEEE Trans. Geosci. Remote Sens. 2002, 40, 2375–2383. [Google Scholar] [CrossRef] [Green Version]
  51. Hooper, A.; Segall, P.; Zebker, H. Persistent scatterer interferometric synthetic aperture radar for crustal deformation analysis, with application to Volcan Alcedo, Galapagos. J. Geophys. Res. Sol. Ea. 2007, 112, B07407. [Google Scholar] [CrossRef] [Green Version]
  52. Pepe, A.; Euillades, L.D.; Manunta, M.; Lanari, R. New advances of the extended minimum cost flow phase unwrapping algorithm for SBAS-DInSAR analysis at full spatial resolution. IEEE Trans. Geosci. Remote Sens. 2011, 49, 4062–4079. [Google Scholar] [CrossRef]
  53. Baran, I.; Stewart, M.P.; Kampes, B.M.; Perski, Z.; Lilly, P. A modification to the Goldstein radar interferogram filter. IEEE Trans. Geosci. Remote Sens. 2003, 41, 2114–2118. [Google Scholar] [CrossRef] [Green Version]
  54. Hooper, A. A multi-temporal InSAR method incorporating both persistent scatterer and small baseline approaches. Geophys. Res. Lett. 2008, 35, L16302. [Google Scholar] [CrossRef] [Green Version]
  55. Ferretti, A.; Prati, C.; Rocca, F. Permanent scatterers in SAR interferometry. IEEE Trans. Geosci. Remote Sens. 2001, 39, 8–20. [Google Scholar] [CrossRef]
  56. Zhang, Y.; Liu, Y.L.; Jin, M.Q.; Jing, Y.; Liu, Y.; Liu, Y.F.; Sun, W.; Wei, J.Q.; Chen, Y.Y. Monitoring land subsidence in Wuhan City (China) using the SBAS-InSAR method with Radarsat-2 imagery data. Sensors 2019, 19, 743. [Google Scholar] [CrossRef] [Green Version]
  57. Asteriou, P.; Tsiambaos, G. Empirical model for predicting rockfall trajectory direction. Rock Mech. Rock Eng. 2016, 49, 927–941. [Google Scholar] [CrossRef]
  58. Li, L.P.; Lan, H.X. Probabilistic modeling of rockfall trajectories: A review. Bull. Eng. Geol. Environ. 2015, 74, 1163–1176. [Google Scholar] [CrossRef]
  59. Saaty, T.L. The Analytic Hierarchy Process; McGraw-Hill: New York, NY, USA, 1980. [Google Scholar]
  60. Saaty, T.L. A scaling method for priorities in hierarchical structures. J. Math. Psychol. 1977, 15, 234–281. [Google Scholar] [CrossRef]
  61. Saaty, T.L. Fundamentals of Decision Making and Priority Theory with the Analytic Hierarchy Process; RWS Publications: Pittsburgh, PA, USA, 2000. [Google Scholar]
  62. Pradhan, B.; Fanos, A.M. Application of LiDAR in rockfall hazard assessment in tropical region. In Laser Scanning Applications in Landslide Assessment; Pradhan, B., Ed.; Springer International Publishing: Cham, Switzerland, 2017; pp. 323–359. [Google Scholar]
  63. China Association of Geological Hazard Prevention. Technical Guideline of InSAR Monitoring for Geo-Hazards T/CAGHP 013-2018; China University of Geosciences Press: Wuhan, China, 2018.
  64. Iannacone, J.P.; Falorni, G. Towards InSAR guidelines for landslide monitoring. In Proceedings of the 69th Canadian Geotechnical Conference, Vancouver, Canada; pp. 1–8.
  65. Rosser, N.; Lim, M.; Petley, D.; Dunning, S.; Allison, R. Patterns of precursory rockfall prior to slope failure. J. Geophys. Res. Earth Surf. 2007, 112, F04014. [Google Scholar] [CrossRef]
  66. Royán, M.J.; Abellán, A.; Jaboyedoff, M.; Vilaplana, J.M.; Calvet, J. Spatio-temporal analysis of rockfall pre-failure deformation using Terrestrial LiDAR. Landslides 2014, 11, 697–709. [Google Scholar] [CrossRef]
  67. Gama, F.F.; Mura, J.C.; Paradella, W.R.; de Oliveira, C.G. Deformations prior to the Brumadinho Dam collapse revealed by Sentinel-1 InSAR data Using SBAS and PSI techniques. Remote Sens. 2020, 12, 3664. [Google Scholar] [CrossRef]
  68. Karamvasis, K.; Karathanassi, V. Performance analysis of open source time series InSAR methods for deformation monitoring over a broader mining region. Remote Sens. 2020, 12, 1380. [Google Scholar] [CrossRef]
  69. Yin, J.F.; Gu, H.D.; Liang, X.D.; Yu, M.; Sun, J.S.; Xie, Y.X.; Li, F.; Wu, C. A possible dynamic mechanism for rapid production of the extreme hourly rainfall in zhengzhou city on 20 July 2021. J. Meteorol. Res. 2022, 36, 6–25. [Google Scholar] [CrossRef]
Figure 1. Geographical location and 3D remote sensing image model of the Taihang GCSA. (ac) Geographical location of the study area. (d) Overview of the Taihang GCSA.
Remotesensing 14 03021 g001
Figure 2. Geological map of the study area.
Remotesensing 14 03021 g002
Figure 3. Distribution map of potential rockfall points in the Taihang GCSA.
Remotesensing 14 03021 g003
Figure 4. Stratigraphic structure characteristics in the study area. (a) Upper hard and lower soft strata, which are mainly distributed in Wangmang Gorge, Wuzhi Gorge, Hongdou Gorge and Baquan Gorge. (b) Soft-hard alternating strata, which are mainly distributed in Qinglong Gorge.
Remotesensing 14 03021 g004
Figure 5. Correlation between stratigraphic structure characteristics and rockfall development pattern in the study area. (ad) Failure modes of rockfalls in the upper hard and lower soft strata. (eh) Failure modes of rockfalls in the soft-hard alternating strata.
Remotesensing 14 03021 g005
Figure 6. Potential rockfall point at the entrance of the Hongdou Gorge scenic spot. (a) Overall view of the potential rockfall point. (b,c) Photos of small rockfall events with the falling and tension failure model near the road in the scenic spot.
Remotesensing 14 03021 g006
Figure 7. A technical framework for rockfall hazard assessment incorporating regional-scale identification of potential rockfall source areas.
Remotesensing 14 03021 g007
Figure 8. Illustration of the SAD method [27]. (a) Ideal profile of a valley profile consisting of two MUs (footslope and cliff) and its corresponding SAD. (b) Realistic profile of a valley profile and its corresponding SAD.
Remotesensing 14 03021 g008
Figure 9. Results of SAD decomposition for HMA A.
Remotesensing 14 03021 g009
Figure 10. Processing flow of the SBAS-InSAR technique.
Remotesensing 14 03021 g010
Figure 11. A 3D high-precision real scene model construction using UAV photogrammetry technology. (a) Construction process of 3D real scene models. (b) 3D real scene model of the scenic spot of Sky City.
Remotesensing 14 03021 g011
Figure 12. Classification scheme of the main HMAs in the study area.
Remotesensing 14 03021 g012
Figure 13. Static identification results of potential rockfall source areas in the Taihang GCSA.
Remotesensing 14 03021 g013
Figure 14. Verification of static identification results of potential rockfall source areas. (a) Comparison of the identification results with the field investigation of potential rockfall points. (b) The slope near the entrance of Baquan Gorge. (c) The slope near the Foshou Pagoda in Qinglong Gorge.
Remotesensing 14 03021 g014
Figure 15. Spatial and temporal baselines of the SAR datasets utilized in this study. (a) Time-position plot of the InSAR image acquisitions. (b) Time-baseline plot of interference pairs of the SAR images.
Remotesensing 14 03021 g015
Figure 16. Calculation results of SBAS-InSAR in the Taihang GCSA.
Remotesensing 14 03021 g016
Figure 17. Distribution map of active rockfall source areas in the Taihang GCSA.
Remotesensing 14 03021 g017
Figure 18. Distribution map of potential rockfall source areas in the Taihang GCSA.
Remotesensing 14 03021 g018
Figure 19. Potential rockfall point of the Sky City scenic spot. (a) Panoramic view of the Sky City scenic spot. (b) Outdoor sightseeing elevator built on the cliff wall. (c) Rock cavity on the cliff wall. (d,e) Damage to facilities caused by rockfalls.
Remotesensing 14 03021 g019
Figure 20. Spatial distribution of disaster-causing factors in the scenic spot of Sky City. (a) Rockfall trajectory. (b) Rockfall frequency. (c) Rockfall kinematic energy. (d) Rockfall bounce height.
Remotesensing 14 03021 g020
Figure 21. Comparison of typical rockfall trajectories for the scenic spot of Sky City before and after placing passive protection nets (the location of the typical rockfall trajectory see Figure 20a).
Remotesensing 14 03021 g021
Figure 22. Results of rockfall hazard zoning for the scenic spot in Sky City.
Remotesensing 14 03021 g022
Figure 23. Response relationship between InSAR time series deformation and rainfall (the positions of points A, B and C are shown in Figure 17).
Remotesensing 14 03021 g023
Table 1. Basic parameters of the Sentinel-1A data for the study area.
Temporal Coverage4 January 2021~30 December 2021
Imagine modeIW
Orbital directionAscending
BandC-band
Azimuth resolution20 m
Range resolution5 m
Wavelength5.6 m
Resolution5 × 20 m
Polarization modeVV
Incident angle33.78°
Table 2. Scale of preference between two parameters in AHP [60].
ScalesDegree of PreferenceExplanation
1Equally importantTwo factors have equal importance
3Moderately more importantOne factor is slightly more important than the other
5Much more importantOne factor is more important than the other
7Very much more importantOne factor is obviously more important than the other
9Extremely more importantOne factor is absolutely more important than the other
2, 4, 6, 8Intermediate judgment valuesThe intermediate value of the above adjacent judgments
ReciprocalsUsed for inverse comparison
Table 3. Random consistency index (RI) [61].
n3456789
RI0.580.901.121.241.321.411.45
Table 4. Classification scheme of the main HMAs in the study area.
HMAFormationLithologyDistribution AreaMorphology
AChd, Chz and ChcQuartzite sandstone, shaleBoth sides of the canyonSteep cliff
BЄm1 and Єm2Mudstone, marlBottom of the
canyon
Gentle slope
CЄm3Mud shale, limestoneBottom of the
canyon
Steep slope
DЄzLimestoneBoth sides of the canyonSteep cliff
EЄg, Єs1 and Os2Limestone, dolomiteTop of the canyonSteep cliff
FOmLimestoneMountain topGentle slope
GQAlluvium, proluvialRiverbed, floodplainFlat ground, gentle slope
Table 5. Slope angle threshold and static source area distribution for each HMA.
HMASlope Angle ThresholdTotal Area
(km2)
Static Source Area
(km2)
Proportion (%)
AB
A44.2°34.3°4.53240.755916.80
B33.8°27.5°9.55722.704528.30
C42.2°33.3°8.55451.407416.45
D48.1°37.5°24.77439.354937.76
E45.8°35.9°51.696115.35629.70
F46.5°31.8°54.55091.40832.58
G41.9°24.4°2.25350.05002.22
Sum----155.918931.037019.91
Table 6. Activity identification results of potential rockfall source areas.
Velocity of LOS Deformation (mm/year)Area (km2)Proportion (%)
−70~−601.59 × 10−30.05
−60~−501.80 × 10−20.61%
−50~−404.65 × 10−21.57%
−40~−301.81 × 10−16.11%
−30~−209.55 × 10−132.27%
−20~−101.7659.39%
Sum2.96100.00%
Table 7. Properties of the underlying surface materials.
Slope TypeNormal Restitution Coefficient (Rn)Tangential Restitution Coefficient (Rt)Friction Angle (°)
Talus covered by grass and shrub0.03~0.330.52~0.8920~30
Soft rock, strongly weathered rock0~0.300.67~0.9315~20
Hard rock, masonry structure0.25~0.450.71~0.9410~15
Soft soil layer0~0.230.58~0.920~30
Water0080
Table 8. The main parameters obtained based on the AHP method.
FactorsJudgment Matrix and WeightAHP Other Values
Rockfall FrequencyKinematic EnergyBounce HeightWeight
Rockfall
frequency
1230.5400CR0.0048
Kinematic energy1/2120.2971CI0.0028
Bounce height1/31/210.1629RI0.5800
Publisher’s Note: MDPI stays neutral with regard to jurisdictional claims in published maps and institutional affiliations.

