Article

The Warming Effect of Urbanization in the Urban Agglomeration Area Accelerates Vegetation Growth on the Urban–Rural Gradient

School of Geography and Planning, Sun Yat-sen University, Guangzhou 510275, China
*
Author to whom correspondence should be addressed.
Remote Sens. 2022, 14(12), 2869; https://doi.org/10.3390/rs14122869
Submission received: 15 May 2022 / Revised: 9 June 2022 / Accepted: 12 June 2022 / Published: 15 June 2022
(This article belongs to the Special Issue Remote Sensing of Ecosystems)

Abstract

:
Urbanization has changed the environmental conditions of vegetation growth, such as the heat island effect, which has an indirect impact on vegetation growth. However, the extent to which the direct and indirect effects of the thermal environment changes caused by urbanization on vegetation growth are unclear. In this study, taking the example of the Guangdong–Hong Kong–Macao Greater Bay Area, a fast-growing national urban agglomeration in China, the relationship between vegetation growth and warming conditions during the period from 2001 to 2020 were explored by the net primary productivity (NPP) and land surface temperature (LST), based on the vegetation growth theory, in urban environments. The results show that there is a significant exponential relationship between the warming and the growth of large-scale vegetation. This relationship is mainly attributable to thermal environmental factors, since their multi-year average contribution rate on the interannual scale is 95.02%. The contribution rate varies on the seasonal scale, according to which the contribution rate is the largest in autumn and the smallest in winter. This research is of great significance for predicting the potential response of vegetation growth to future climate warming and improving vegetation growth in urban areas.

1. Introduction

In the past few decades, the world has experienced rapid urbanization [1], and this is expected to continue in the future [2]. Urbanization refers to a complex coupled evolution of impervious surface expansion, population aggregation, and industrial non-agriculturalization [3]. The net primary productivity (NPP) is a key indicator of the vegetation growth of terrestrial ecosystem [4,5]. Urban vegetation is a special vegetation group dominated by artificial vegetation, which not only provides multiple ecosystem services for human well-being [6,7,8], but is also the sensitive landscape component to improve the urban environment [9,10,11]. The urban heat island effect caused by urbanization has a significant impact on the quality of vegetation growth [12,13,14]. Urban-vegetation remote sensing can be used to scientifically measure the natural attributes and the social characteristics of human living. Through the development of ecological civilization, combining China’s natural beauty and urbanization, it is urgent to comprehensively evaluate urban vegetation. How to quantify the effects of urban eco-environmental change on vegetation growth is an important task of urban ecology and remote sensing. However, positive vegetation growth due to urban environment changes, especially altered atmospheric chemistry, the heat island effect, and different forms of ecological management (fertilized nutrients, irrigation, and new plants), which can help urban ecosystem management to enhance ecosystem services, has been underestimated.
A framework has been proposed to distinguish the direct and indirect effects of urban expansion [15,16,17]. The direct loss of vegetation NPP occurs due to the conversion of vegetated productive land into non-productive land at the landscape scale [18,19]. Meanwhile, urban environment changes, such as atmospheric composition [20], soil moisture [21], and thermal environment [22], which are consequences of impervious surface expansion, has indirect effects on the spatial and temporal distribution of vegetation NPP [23]. Previous studies have reported the field measurement or remote-sensing monitoring to quantify the impact of urbanization on vegetation NPP [8,24,25,26]. Studies based on field measurement methods focus on the impact of urban environments on vegetation NPP at the species level [24,25], but cannot reflect the continuous impact of urban environments on a large scale. With the help of remote sensing, the impact of urban environments on large-scale vegetation NPP can be continuously monitored. However, most studies only reveal the overall impact of urbanization on vegetation NPP [8,26,27]; the systematic and dynamic effects of urban expansion on vegetation are not well understood. The overall indirect effects of urban environment changes on large-area vegetation NPP can be quantified [17,23,28], but it is necessary to improve our understanding of the contribution rate of the indirect effects among urban-environment changes, such as thermal environment dynamics.
Land-surface warming is a typical urban environment change caused by urbanization [20,21,29,30]. Vegetation in urban areas is typically exposed to temperatures that are higher than in rural environments; however, high temperatures may stress plant growth [31] or promote plant photosynthesis and the accumulation of vegetation NPP [29,32]. If vegetation responds similarly to altered temperatures in urban and rural areas, then urban–rural gradients can be seen as natural laboratories. However, it remains difficult to differentiate the relative contributions of varied environmental variables to vegetation responses to urbanization across the urban–rural gradient. Therefore, it is necessary to investigate the response of vegetation to land-surface warming, which can help us to be better to understand the indirect impact of urbanization on vegetation growth.
The main objective of this study was to explore the dynamic effects of urbanization on vegetation NPP. We developed a contribution rate to quantify the indirect effects of urbanization expansion on vegetation from the perspective of a dynamic urban–rural gradient over multiple years. Furthermore, full-coverage vegetation was identified in the urban–rural gradient to separate the direct and indirect effects of urbanization expansion. We aimed to investigate the urbanization-induced thermal environment changes over the past 20 years, the indirect impact of urbanization on NPP, and the warming-induced effects on vegetation growth.

2. Materials and Methods
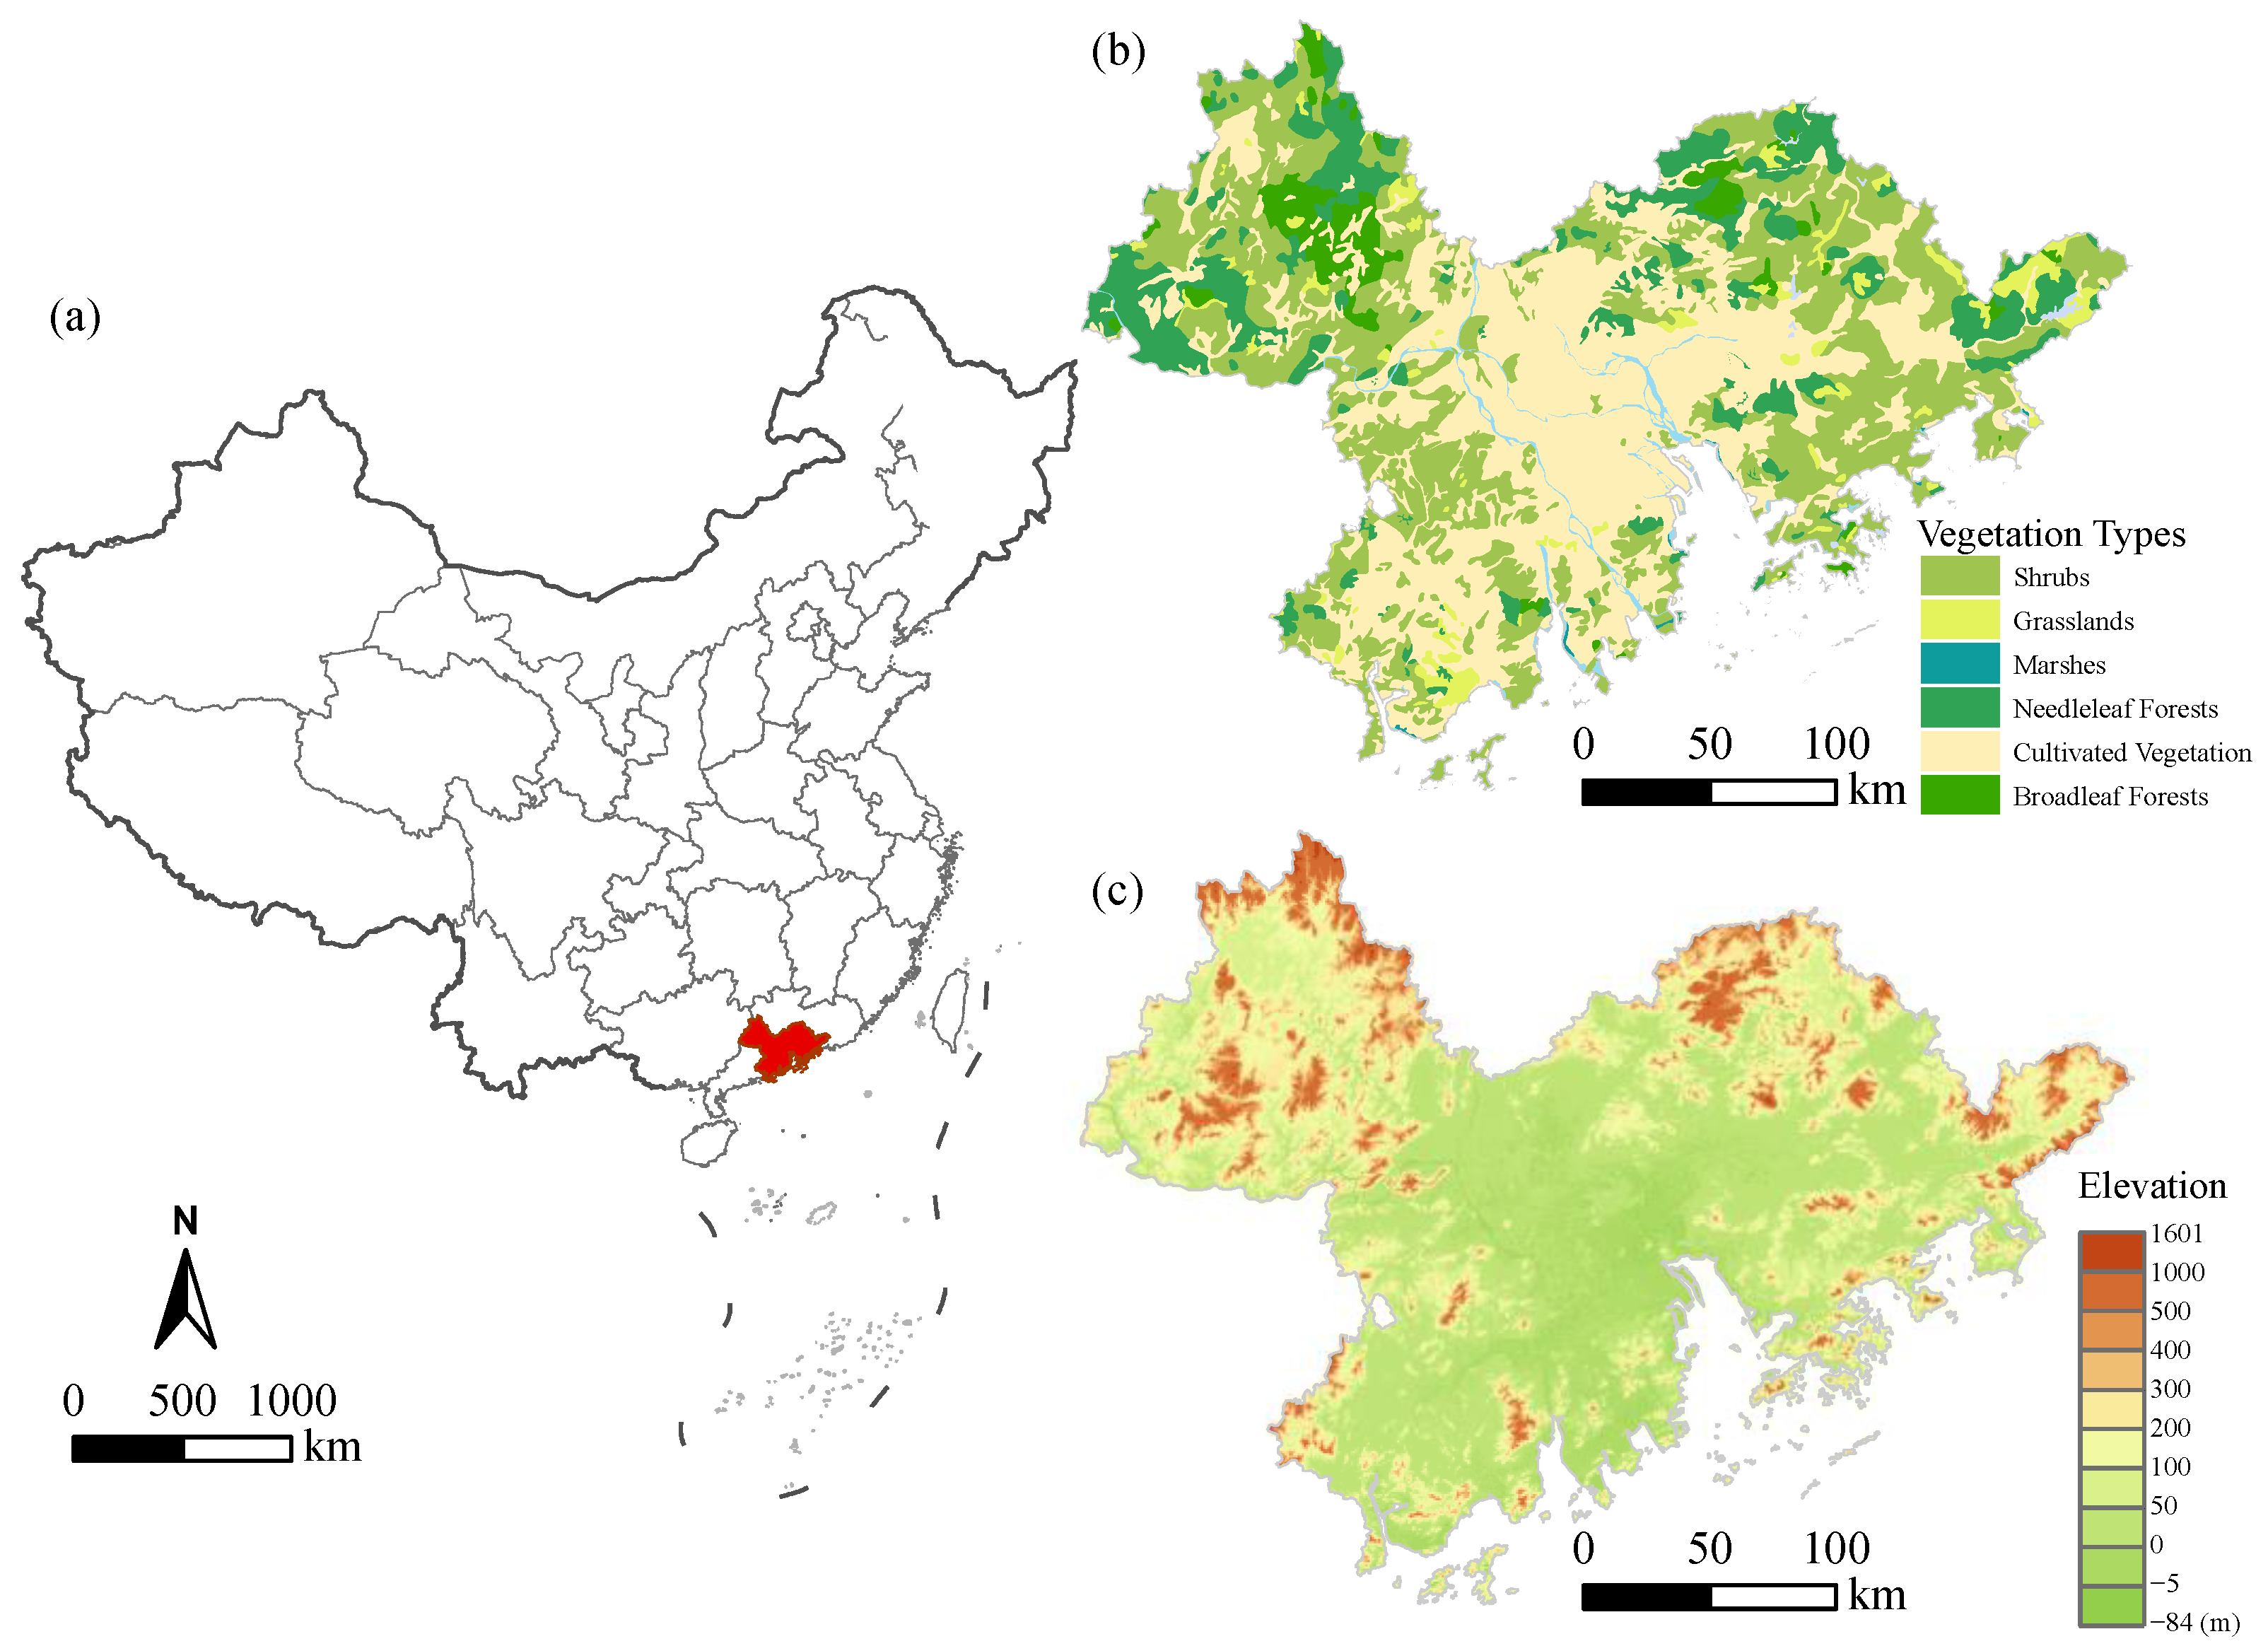
2.1. Study Area

The Guangdong–Hong Kong–Macao Greater Bay Area (GHM-GBA) consists of nine mainland cities and two special administrative regions, Hong Kong and Macau, with a total area of about 56,000 km2 [33]. The natural condition of this region is subtropical monsoon climate with dense river networks. It is very hot and wet in summer. The terrain is high in the northwest and low in the southeast; however, most of its cities are located on the Pearl River Delta (Figure 1a,c). It is one of the most urbanized areas in China and is known as one of the four major bay regions in the world. Since it has experienced a rapid urbanization process, it is an ideal region to study the relationship between urbanization and vegetation growth. At the same time, some rural areas have been preserved, and it features a relatively complete urban–rural gradient. The microclimatic condition of GHM-GBA has undergone a significant urban-island effect, which has profoundly changed its ecological environment. It is also a natural laboratory in which to examine the thermal environment changes influencing vegetation growth, since vegetation in urban areas is often exposed to higher temperatures. The urban agglomeration area also reflects expected future environmental conditions in most non-urban areas. The vegetation types mainly consist of needleleaf and broadleaf forests (Figure 1b).

2.2. Data Sources

Several datasets were used to quantify the indirect effects of urbanization on vegetation growth, including MODIS-LST, MODIS-NDVI, Impervious surface data, auxiliary climate data, and a vegetation-type map.
(1)
MODIS-LST. The widely-used MOD11A2 V6 product provides a time series of 8-day average land surface temperature (LST) with a 1-kilometer spatial resolution with a high accuracy [34,35]. In this study, the daytime surface temperatures of “LST_Day_1 km” were used to represent the LST, and the maximum-value composite data processing was transcribed into monthly data on the Google Earth Engine (GEE). Next, the brightness values (DN) was converted to degrees (°C). The quality of the data was also assessed by the ground-weather-station records. Using the average atmospheric temperature records of 7 stations in the study area, we analyzed the temperature records of the stations corresponding to MODIS-LST, and established a univariate linear regression analysis. The results showed that at the significant p < 0.01 level, the slope coefficient was in the range of 0.87~1.11, and the determination R2 was 0.72–0.79, indicating that the MODIS-LST data reflected the real thermal environment in the study area.
(2)
MODIS-NDVI. The MODIS-NDVI dataset covered the period from 2001 to 2020, with a spatial resolution of 250 m and a temporal resolution of 16 days. The maximum monthly data processing was completed on the GEE platform.
(3)
Impervious Surface Data. The land use/land-cover data were mapped by random forest method on the Google Earth Engine (GEE) platform from 2000 to 2020 [36]. Land-cover types were divided into six categories: cultivated land, forest land, grassland, water area, impervious surface, and unused land. The accuracy of various land-cover categories was above 88%. Next, the percentage of impervious surface area (ISP) for every 5 years was calculated on a grid with a size of 250 m × 250 m. The ISP represented a dynamic urban–rural gradient from 0% to 100%.
(4)
Auxiliary data. The vegetation-type data were obtained from the National Glacier and Permafrost Desert Science Data Center. The vegetation-type data from the study area were extracted to estimate NPP. The climatic data, including the monthly sunshine percentage, monthly average temperature, and monthly precipitation data of 26 meteorological stations in the study area, were downloaded from the China Meteorological Science Data Sharing Service Network (http://cdc.cma.gov.cn/, accessed on 3 March 2021), which were interpolated in a spatial resolution of 250 m and used for NPP estimation [37,38].

2.3. Methods

2.3.1. Estimated NPP
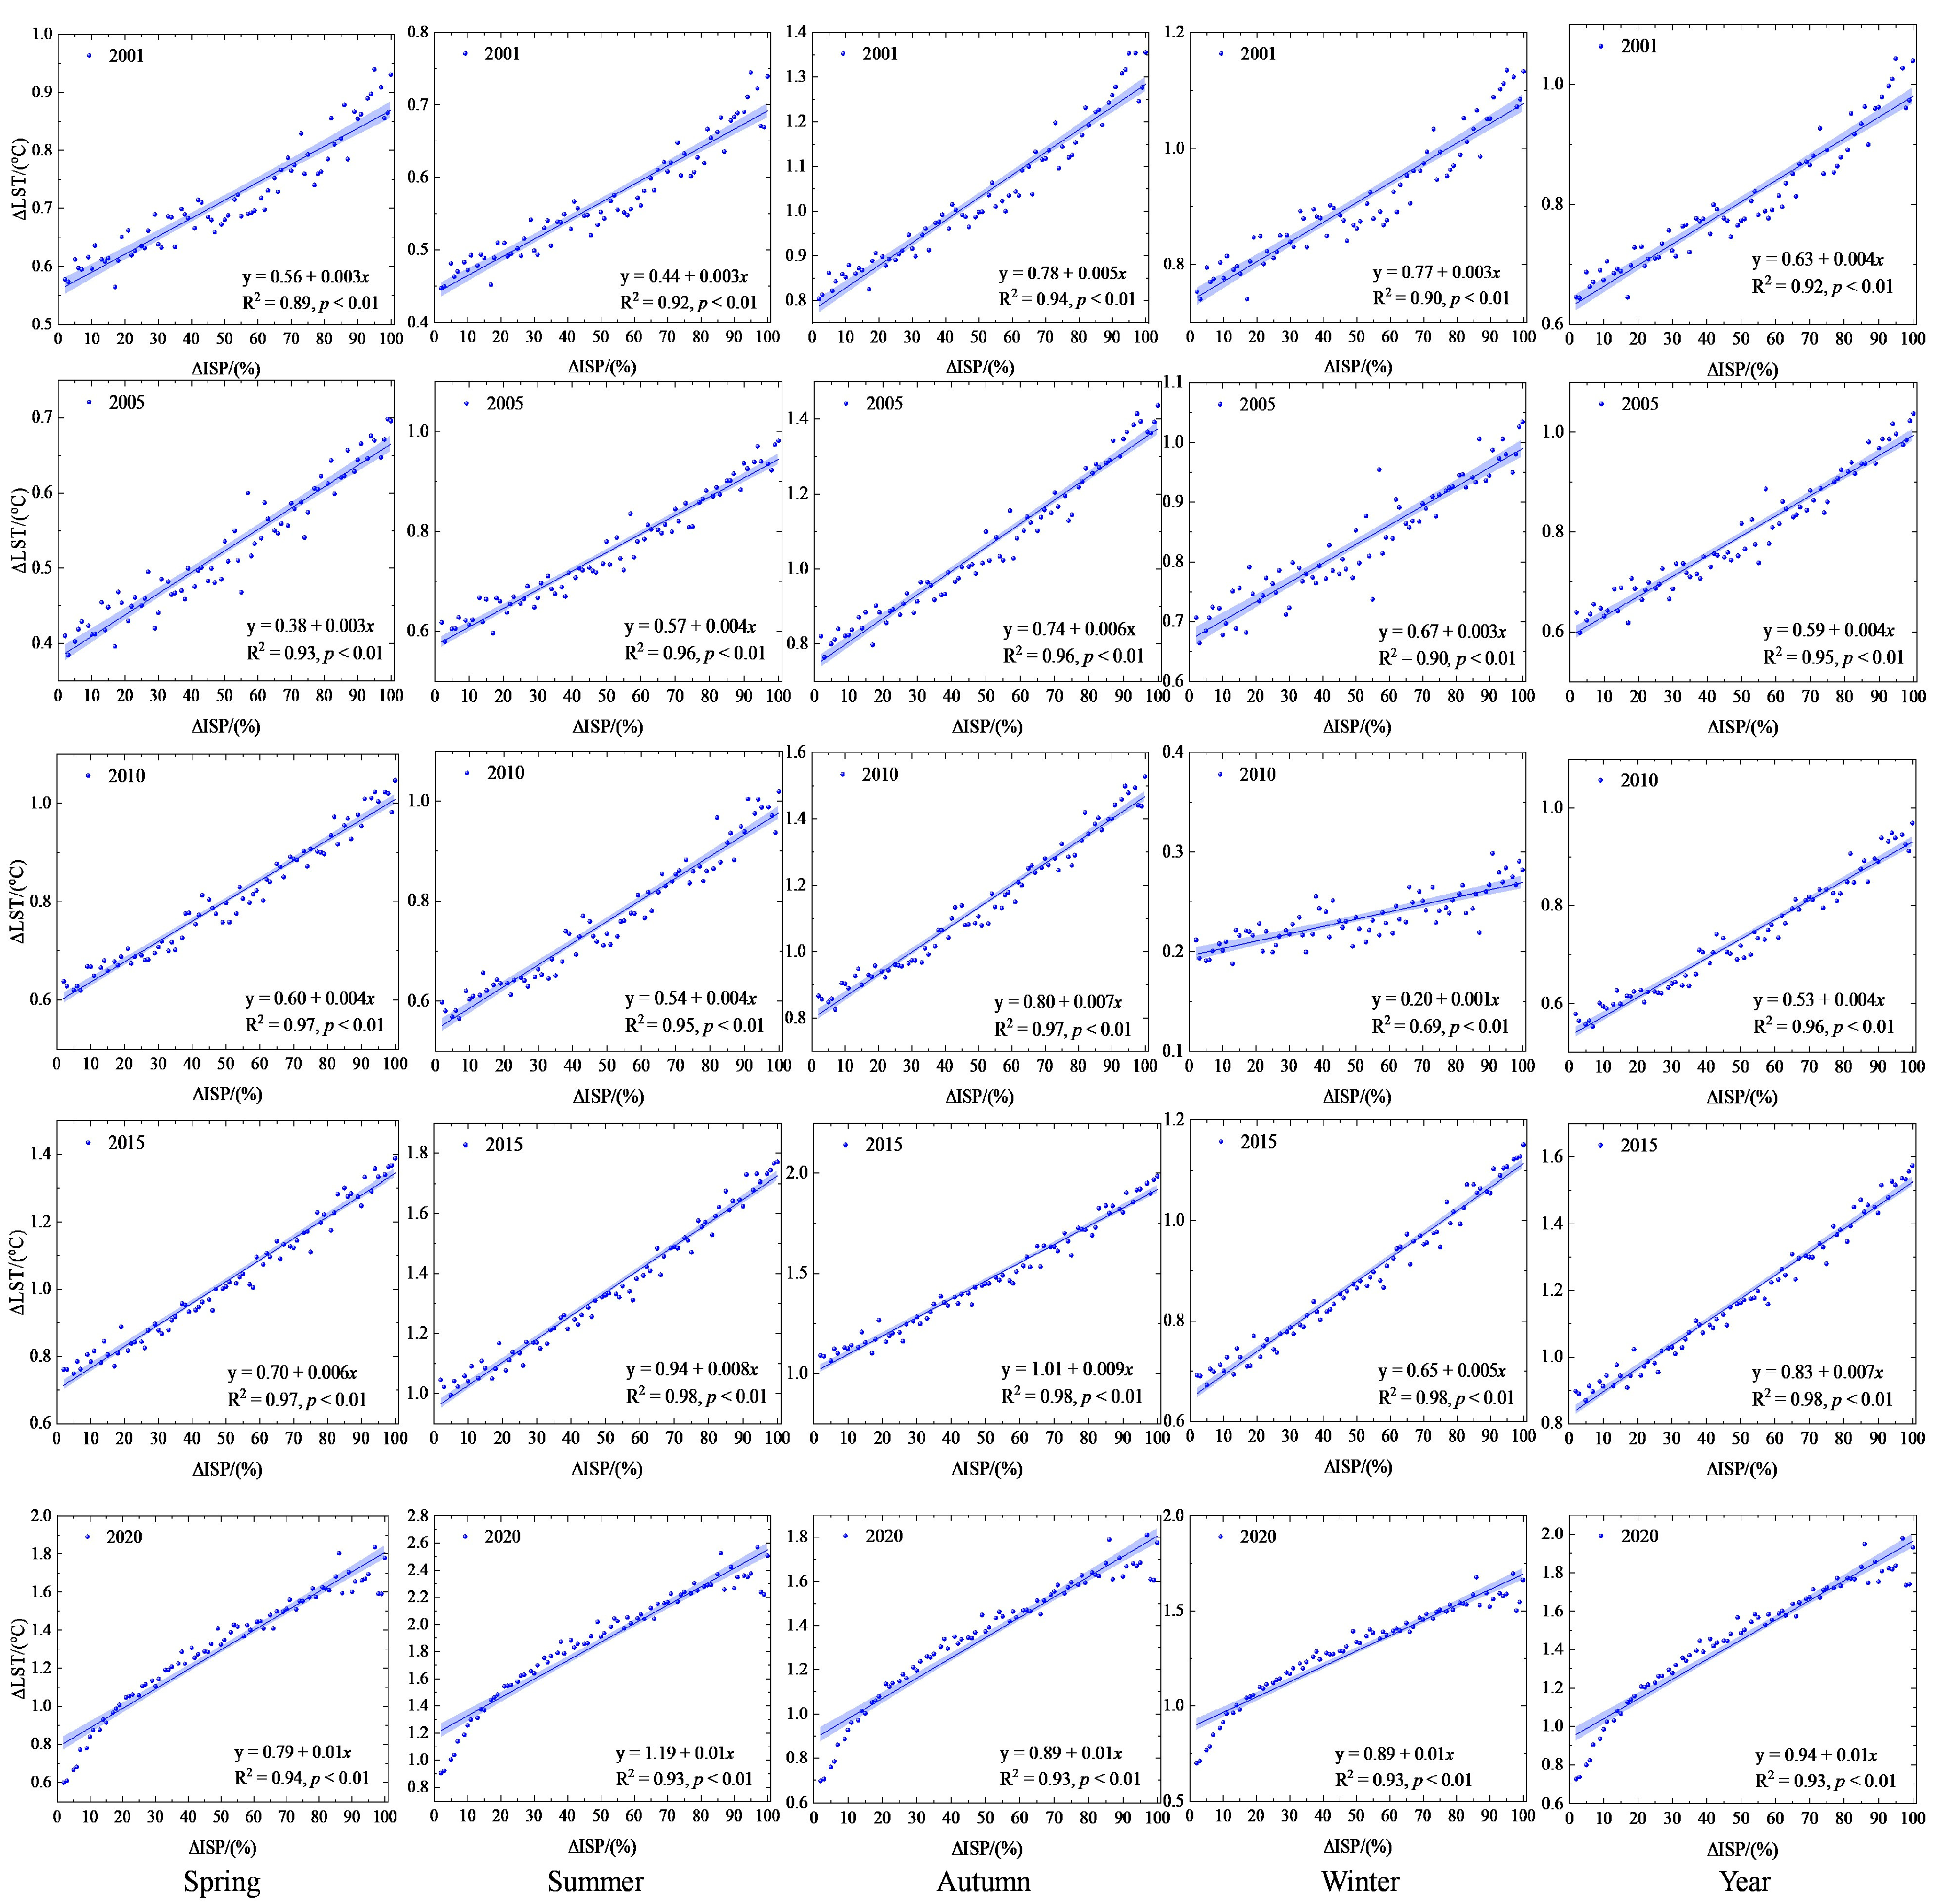
The CASA model was used to estimate the monthly net primary productivity (NPP) of vegetation from 2001 to 2020. In the CASA model, NPP is estimated based on the photosynthetically active radiation (APAR) and light utilization efficiency of vegetation. The details of the calculation formula process can be found in [39]. The estimated NPPs were validated by other produces. The MODIS17A3HGF annual NPP product was used to verify the inversion results of this study. We set 250 random sampling points, and proposed a quadratic regression between the annual NPP data and the simulated data to compare the degree of agreement. The results showed that at the significant p < 0.01 level, there was a good quadratic relationship between the predicted data and the validation data, and the R2 was 0.46–0.61. However, since the spatial resolution of the MODIS17A3HGF was relatively coarse, and the high-value pixel was limited, there was a higher value in our estimated results than at the high-values region. This was spatially consistent with the trend.

2.3.2. ISP vs. LST

In order to contrast the effects of urbanization, an urbanization-intensity index was defined by the ISP within each 250-m × 250-m grid. The urban–rural gradient analysis was conducted within the whole boundary for GHM-GBA agglomeration area. The gradients of ISP were used to characterize the urbanization intensity in each 1% interval. The 0% of ISP was set as the base of non-urbanization. The overall difference LST (ΔLST) between urban and non-urbanized area was calculated to represent the impact of urbanization on LST. To explore the patterns of LST variation along the urban–rural gradient, LST for each 1% interval (i.e., 0–1%, 1–2%, …, 99–100%) were calculated. Next, the urban–rural gradient trend was extracted from the linear regression model as follows:
Δ LST t , i = a Δ ISP t , i   + b
where Δ LST t , i is the annual or seasonal ΔLST of the i-th urbanization gradient in the t-th year, Δ ISP t , i is difference of the i-th urbanization gradient and the non-urbanized area (ISP = 0) in the t year, and i ranges from 1 to 100.

2.3.3. Identifying Indirect Urbanization Effects on Vegetation Growth

There are significant differences in vegetation cover (FVC) between urban and rural areas due to the loss of the vegetation area as a result of urban expansion, which directly affects the net primary productivity of vegetation. In order to identify the indirect impact of urbanization, it is necessary to estimate the NPP value when each urban–rural gradient is fully covered by vegetation, so as to eliminate the direct impact of urban–rural FVC differences.
Firstly, to separate the direct and indirect effects of urbanization on vegetation growth, a series of formulas were designed. The FVC i were calculated in each pixel based on the NPP pixel, and then the actual NPP values of each pixel were separated by the FVC of the pixel to estimate the NPP a i when the vegetation reached the full coverage state. The formulas are as follows:
NPP a i = NPP i FVC i
FVC i = S v i S w
where NPPai represents when the NPP reached full-vegetation-cover status in the ith pixel (g C/m2), NPPi is the actual NPP value in the ith pixel (g C/m2), FVCi is the percentages of vegetation cover in the ith pixel, Svi is the area of vegetation in the ith pixel, and Sw is the area of the pixel, which in this study, was 250 m × 250 m.
Moreover, to identify indirect urbanization effects on vegetation growth, an exponential function was employed to explore relationship between NPP and ISP in the fully urban–rural gradient. Subsequently, a ∆NPP was used to refer to the difference value between NPP of non-urbanization area and the full-cover NPPai in each 1% interval gradient. The formula is as follows:
Δ NPP t , i = a e b · Δ ISP t , i   + c
where Δ NPP t i is the annual or seasonal ΔNPP of the urbanization gradient in the t year. If ∆NPP is positive, we can infer that urbanization has a positive indirect impact on vegetation growth.   Δ ISP t , i is difference of the i-th urbanization gradient and the non-urbanized area (ISP = 0) in the t year, and i ranges from 1 to 100.
Furthermore, to quantify the LST influence on NPP, the relationship between LST and NPP were built by the exponential function model in the urbanization gradient. The calculation formula is:
Δ NPP t , i = a e b · Δ LST t , i + c
where Δ NPP t , i is the annual or seasonal ΔNPP of the i-th urbanization gradient in the t year, and Δ LST t , i is the difference value of LST in the i-th urbanization gradient in the t year.

2.3.4. Quantifying the Effects of Warming on Vegetation Growth

In the theory of remotely sensed urban-vegetation growth, human-induced climate warming fertilizes vegetation [15]. In order to quantify the contribution rate of thermal environment to the indirect effects of urbanization on vegetation NPP, the study assumed that the indirect effect of urbanization can be divided into two parts: thermal environmental factors and non-thermal environmental factors. First, ΔNPP caused by the increased ΔISP is defined as the total indirect effect of urbanization. Next, ΔNPP caused by the increased ΔISP is defined as the indirect effects of warming on urbanization. Finally, the contribution rate of thermal factors to the indirect impact of urbanization can be calculated by the following ratio:
ln Δ NPP t i = k I S P Δ ISP t i + c 1
ln Δ NPP t i = k L S T Δ LST t i + c 3
Δ LST t i = a Δ ISP t i + c 2
Δ LST c o n = a × k L S T k I S P × 100 %
where k I S P , k L S T , and a are the coefficients in the univariate linear regression. Δ LST c o n represents the contribution rate of thermal environmental factors to the indirect impact of urbanization on NPP. When a × k L S T is greater than or equal to k I S P , this indicates that the indirect impact of urbanization on vegetation is completely determined by thermal environmental factors. Δ NPP t i is the normalized annual or seasonal ∆NPP of the ith urbanization gradient in the t year; LST t i is the year or season ∆LST after the normalization of the ith urbanization gradient in the t year; and Δ ISP t i is the normalized urbanization intensity difference between the ith urbanization gradient and the non-urbanized area (ISP = 0%) in the t year.

3. Results

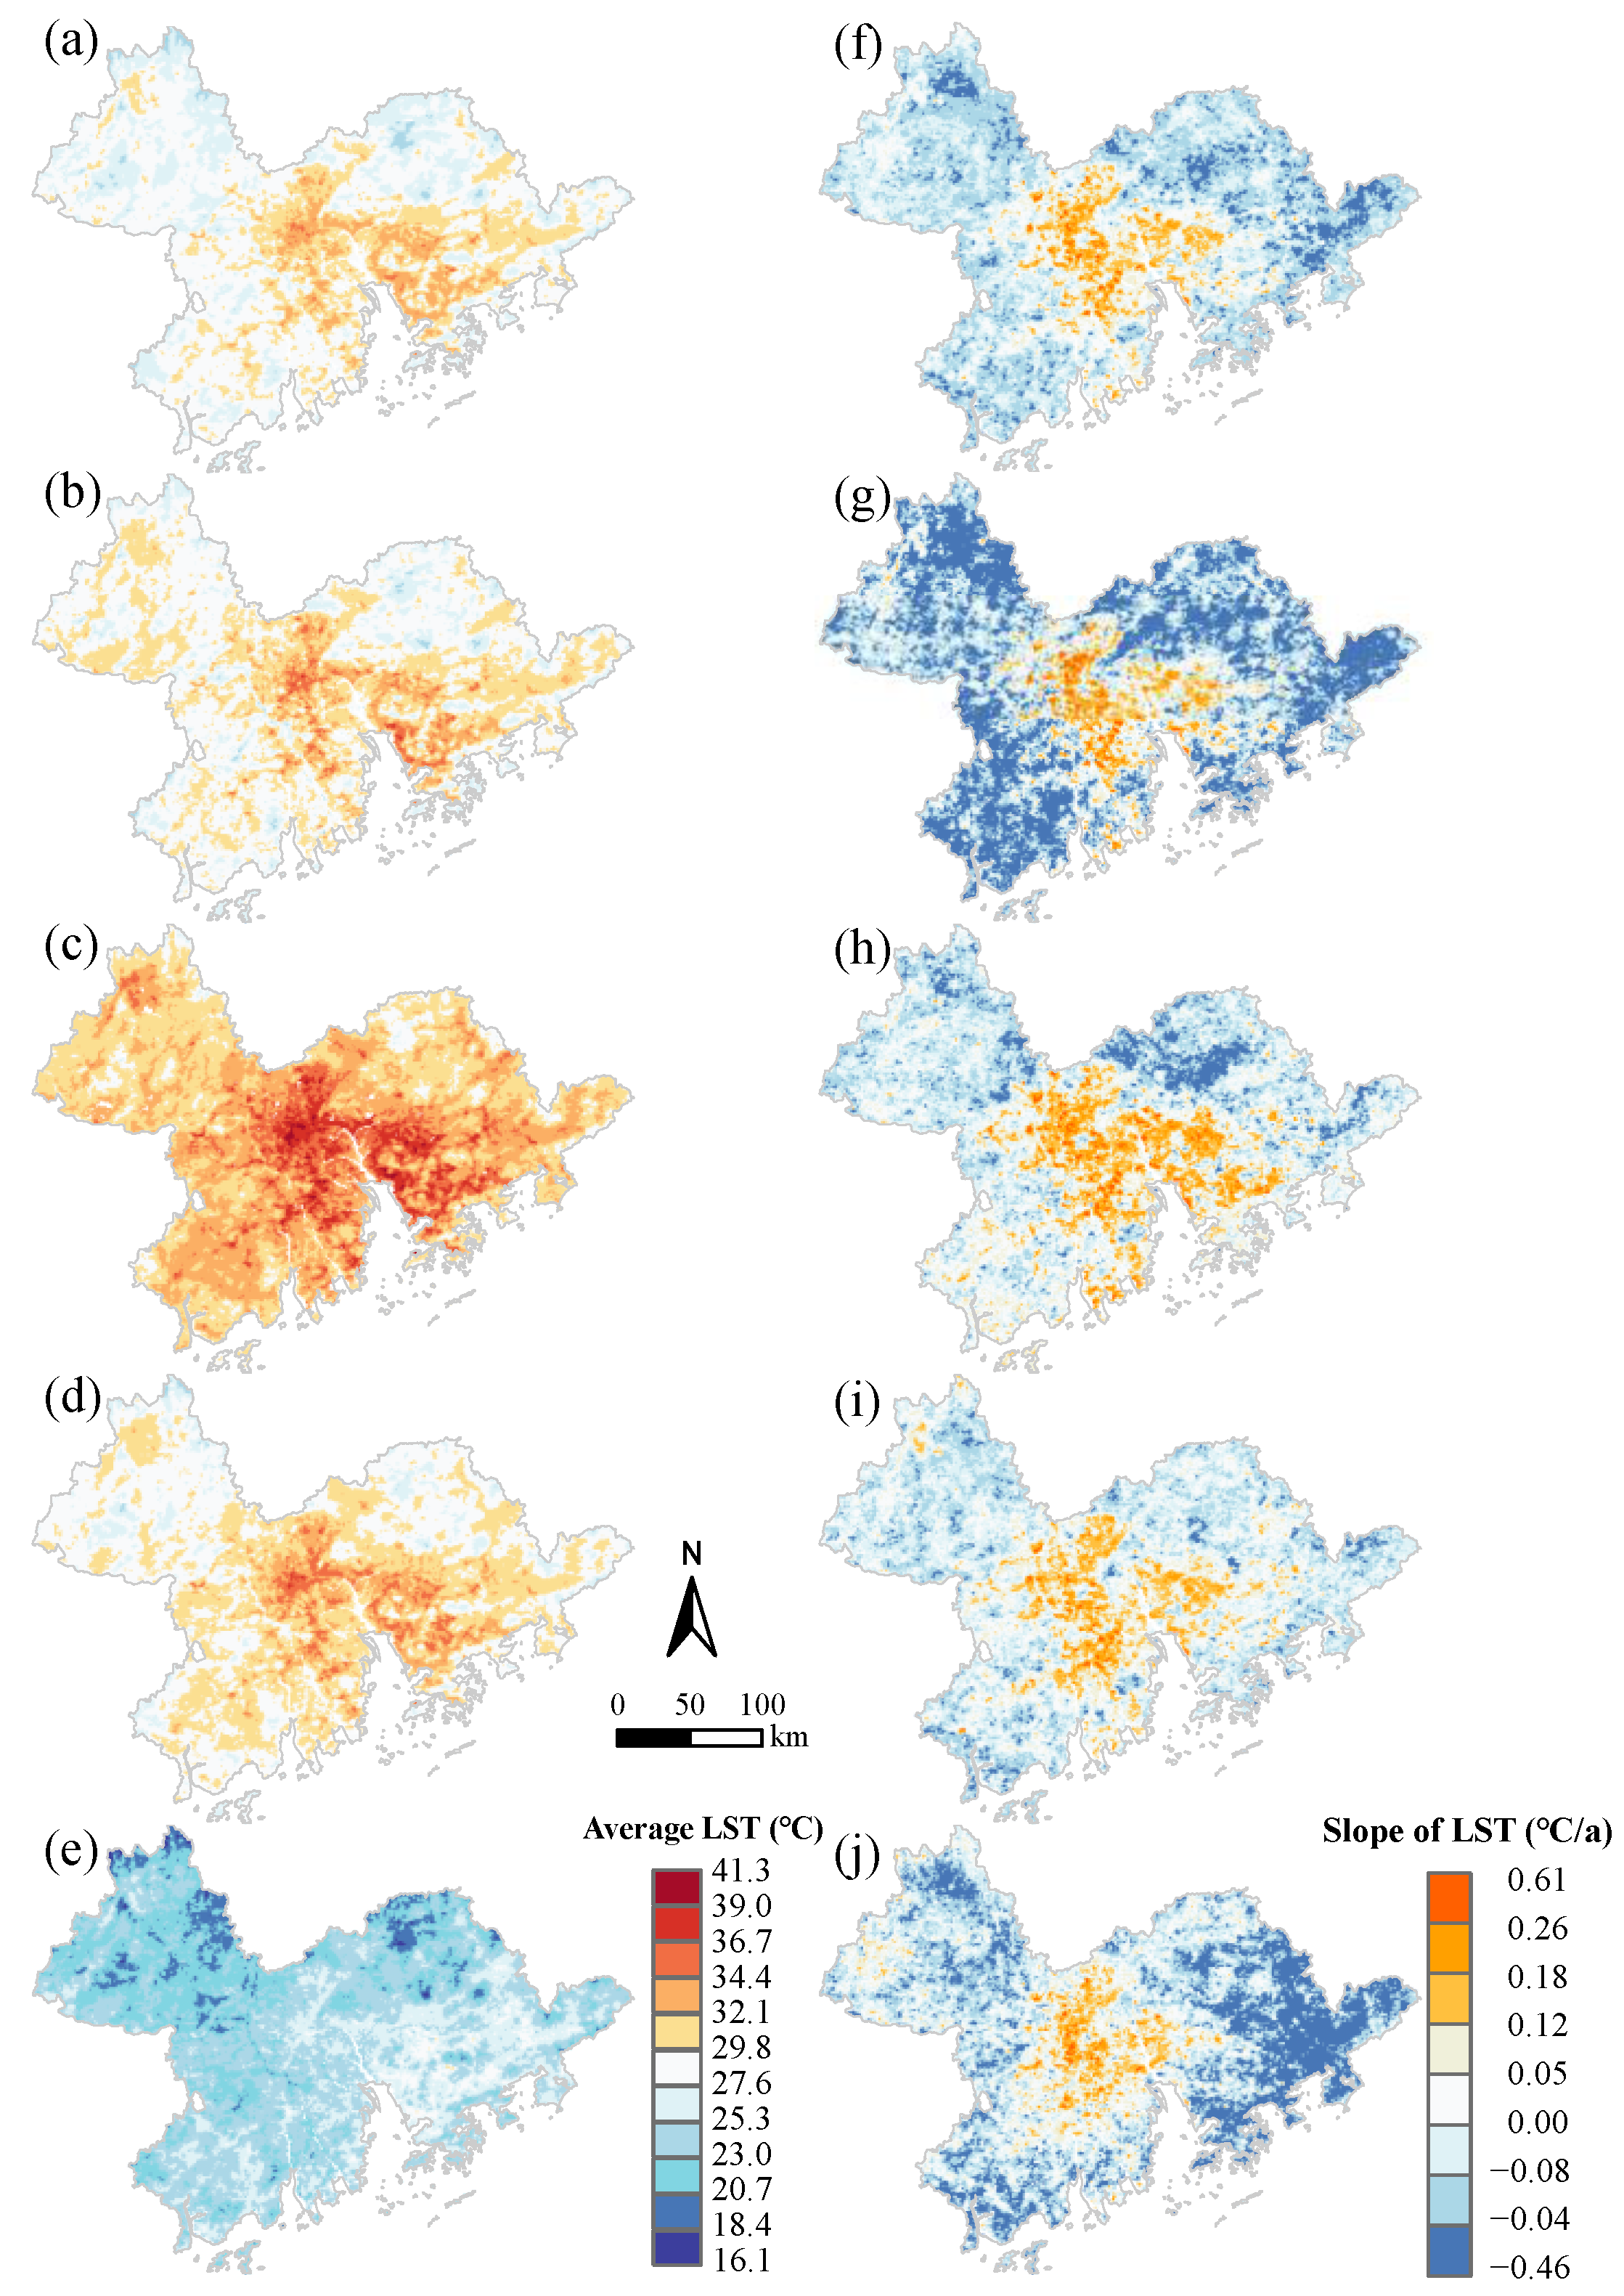
3.1. The Urbaniztion-Induced Thermal Environment Changes

There is a typically spatial gradient of the annual and seasonal mean LST in the GHM–GBA region, which reflects the warming in the central region and cooling on the eastern and western sides during the past two decades (Figure 2). The warming effect of urbanization has gradually increased over time. The results show that for each 10% increase in ISP, the annual LST gradually increased from 0.67 °C in 2001 to 1.04 °C in 2020. The greater the ISP, the greater the interannual fluctuation in the warming effect (Figure 3).
In order to quantify the urbanization-induced thermal environment changes, a linear regression was employed to show the difference in the LST for each year based on the urban–rural gradient (Figure 3). A warming effect (ΔLST > 0) from 2001 to 2020 was determined. The annual LST rose to approximately 0.70 °C. when the ISP increased by 10% in the urban–rural gradient. When the ISP increased by 80–100% in the central urban region, the annual surface temperature was at least 0.84 °C higher than that in the non-urbanized area (ISP = 0). These trends were also observed in other seasons. The temperature increases in spring, summer, autumn and winter were 0.38~1.83 °C, 0.45~2.57 °C, 0.69~1.98 °C, and 0.19~1.70 °C, respectively, for every 10% increase in each ISP gradient. The LST ranking for the four seasons was as follows when the ISP increased: autumn (0.84 °C), summer (0.74 °C), winter (0.63 °C), and spring (0.61 °C). This indicated that the urbanization-induced thermal environment increase amplitude was more obvious in autumn than in other seasons.

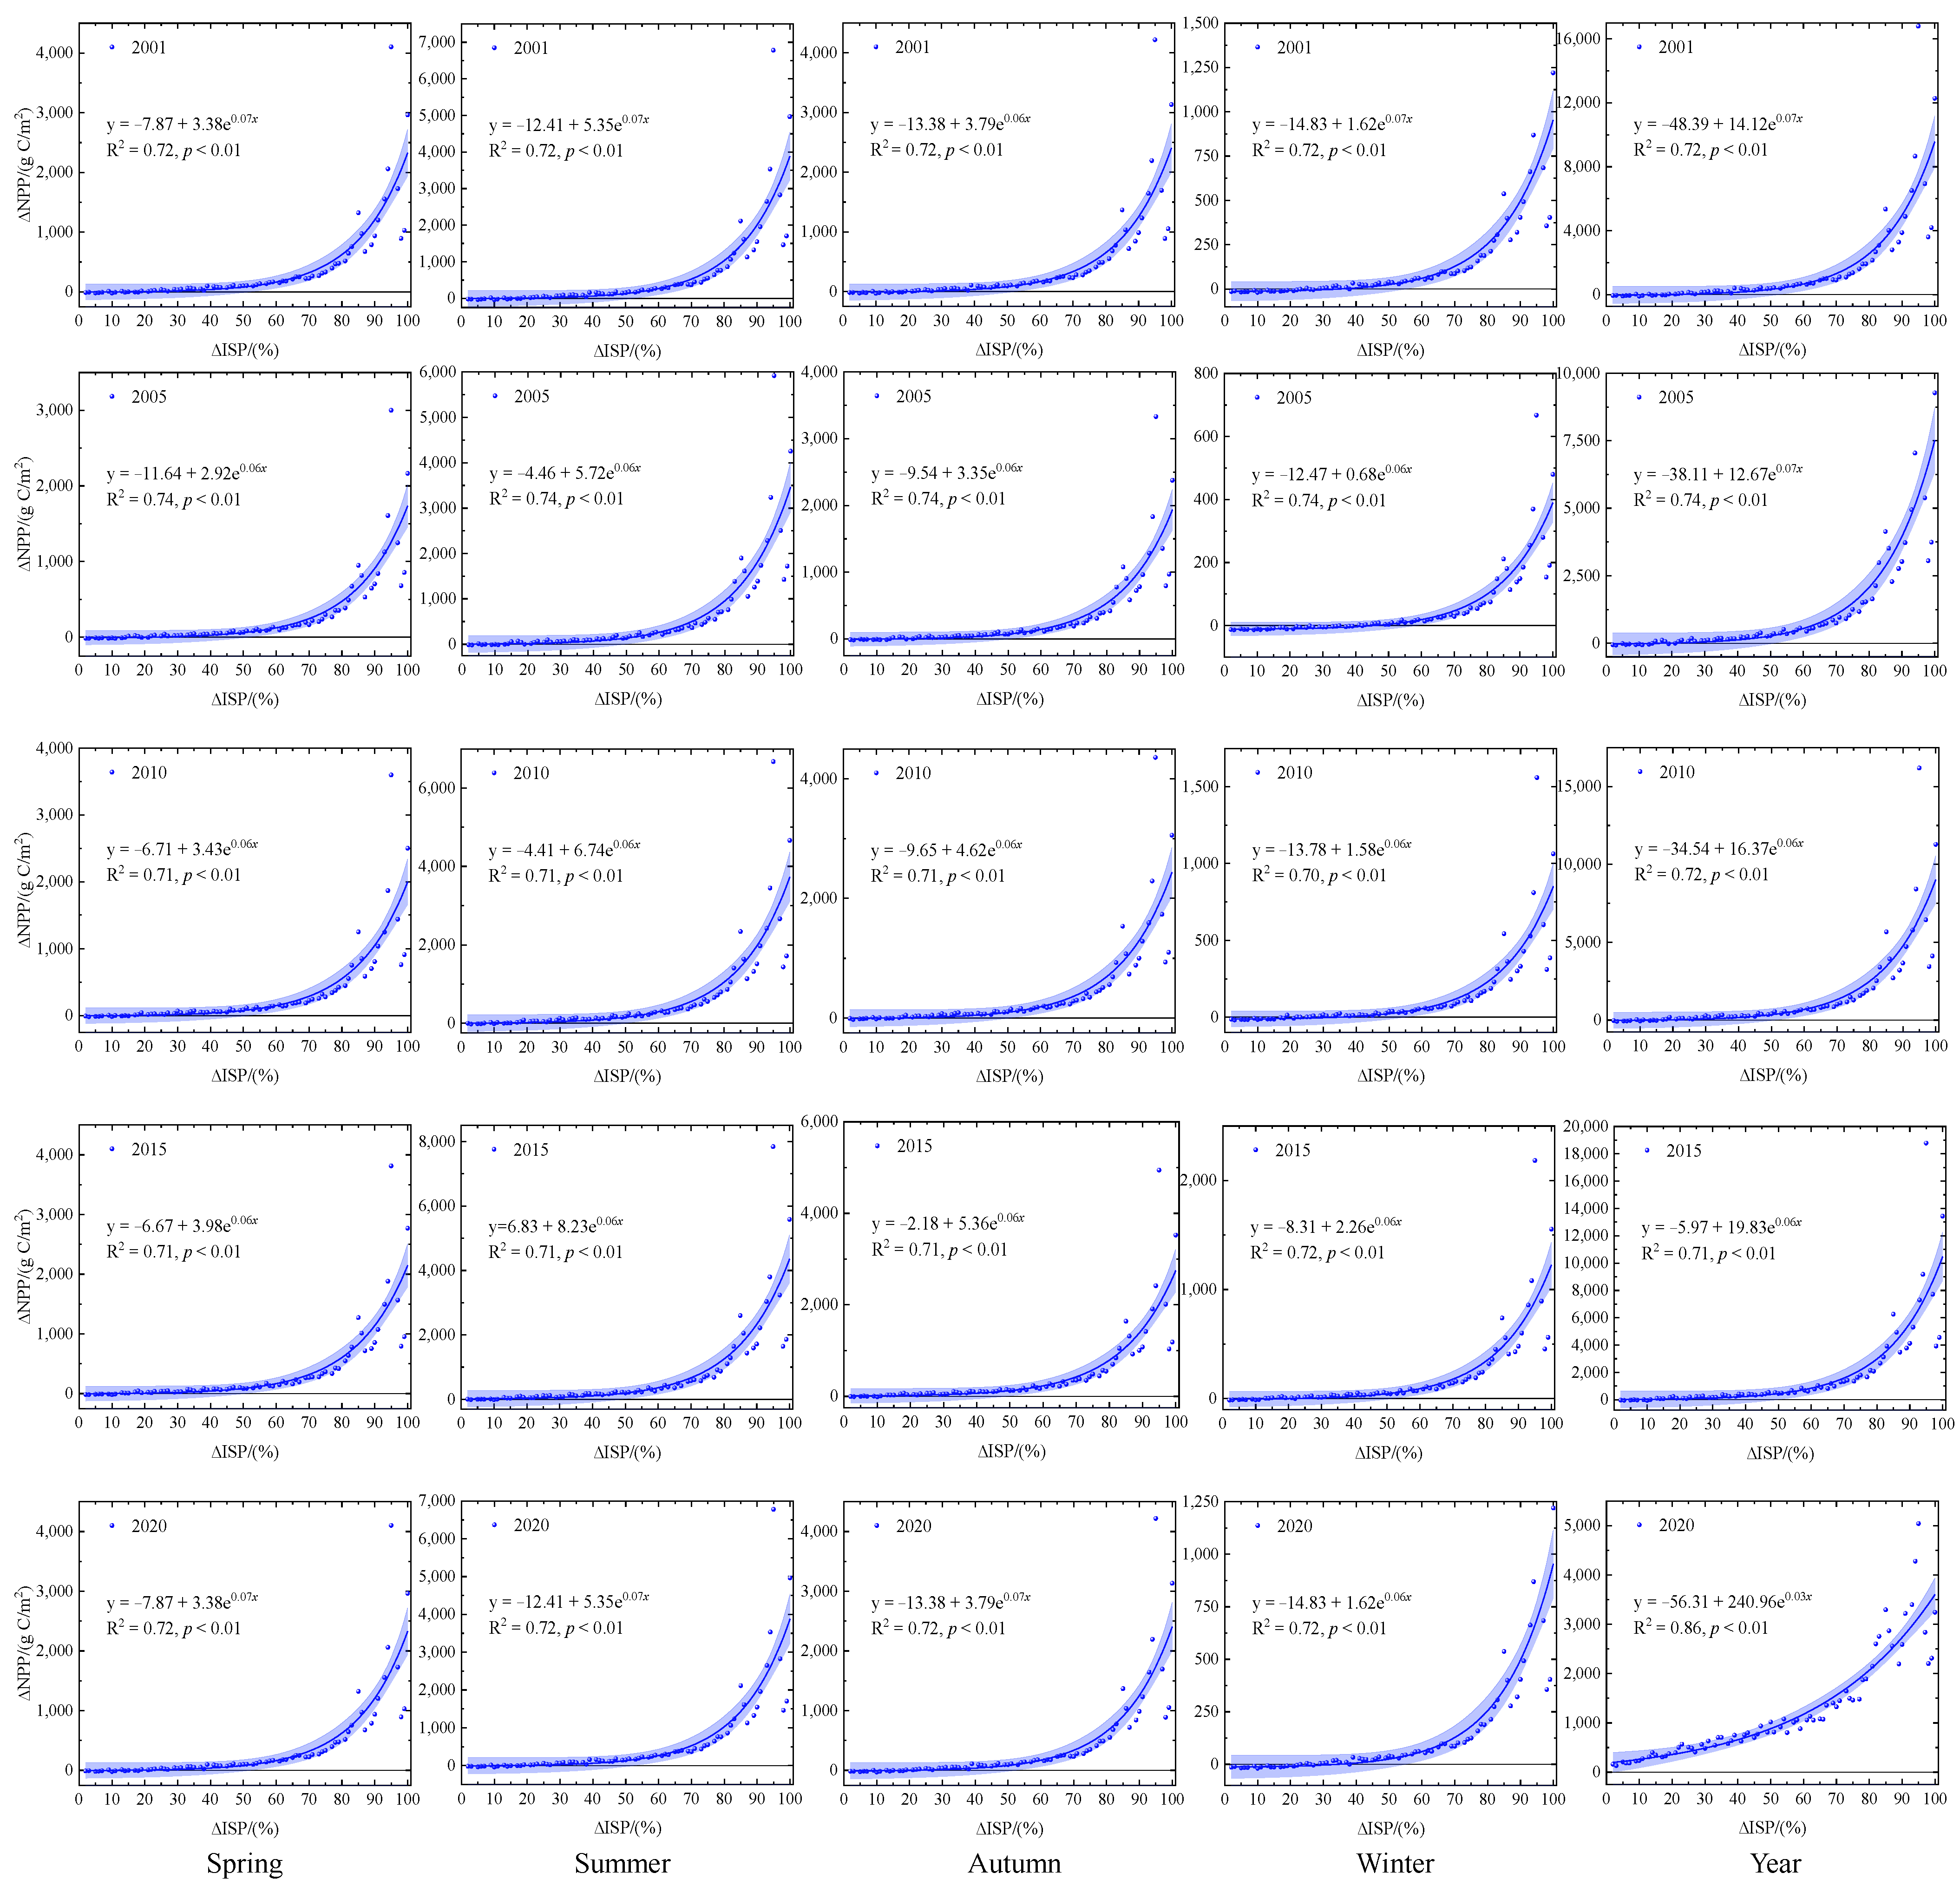
3.2. Indirect Impact of Urbanization on NPP

To identify the indirect impact of urbanization on vegetation growth, the full-vegetation-cover pixel was selected to eliminate the NPP change caused by the land-use/land-cover changes. The differences in NPP in the fully vegetated areas of the urban–rural gradient showed a positive exponential growth trend through an increase in ISP during 2001 to 2020 (Figure 4). However, urban environments may have a negative impact on vegetation NPP in low-urbanization areas. When the ISP was below 17.60%, the annual NPP decreased (annual ∆NPP < 0) by up to 107.87 g C/m2/a. When the ISP was higher than 17.60%, the annual NPP increased (annual ∆NPP > 0), indicating that urbanization promotes vegetation growth under the combined influence of urban environmental factors and human vegetation management. With the intensification of urbanization, the promotion effect of urbanization on vegetation growth gradually increased. When the ISP was over 60.00%, the annual ∆NPP surged, and the promotion effect of urbanization on vegetation growth was significantly enhanced. When the ISP was larger than 80.00, the annual NPP increased by at least 1640.19 g C/m2/a compared to the ISP = 0% non-urbanization area.
During the study period, the ISP threshold for the effect of urbanization on vegetation growth rose. The threshold effects of the ISP indirectly enhancing the urban NPP increased from 17.60% in 2001 to 0.01% in 2020, indicating that the positive indirect impact increased in the urban–rural gradient. Moreover, the ISP threshold had obvious seasonal differences. It was highest in winter, up to 48.48%, while it was not observed in summer, which shows that the indirect impact of urbanization on vegetation growth is the largest in summer, and the smallest in winter.

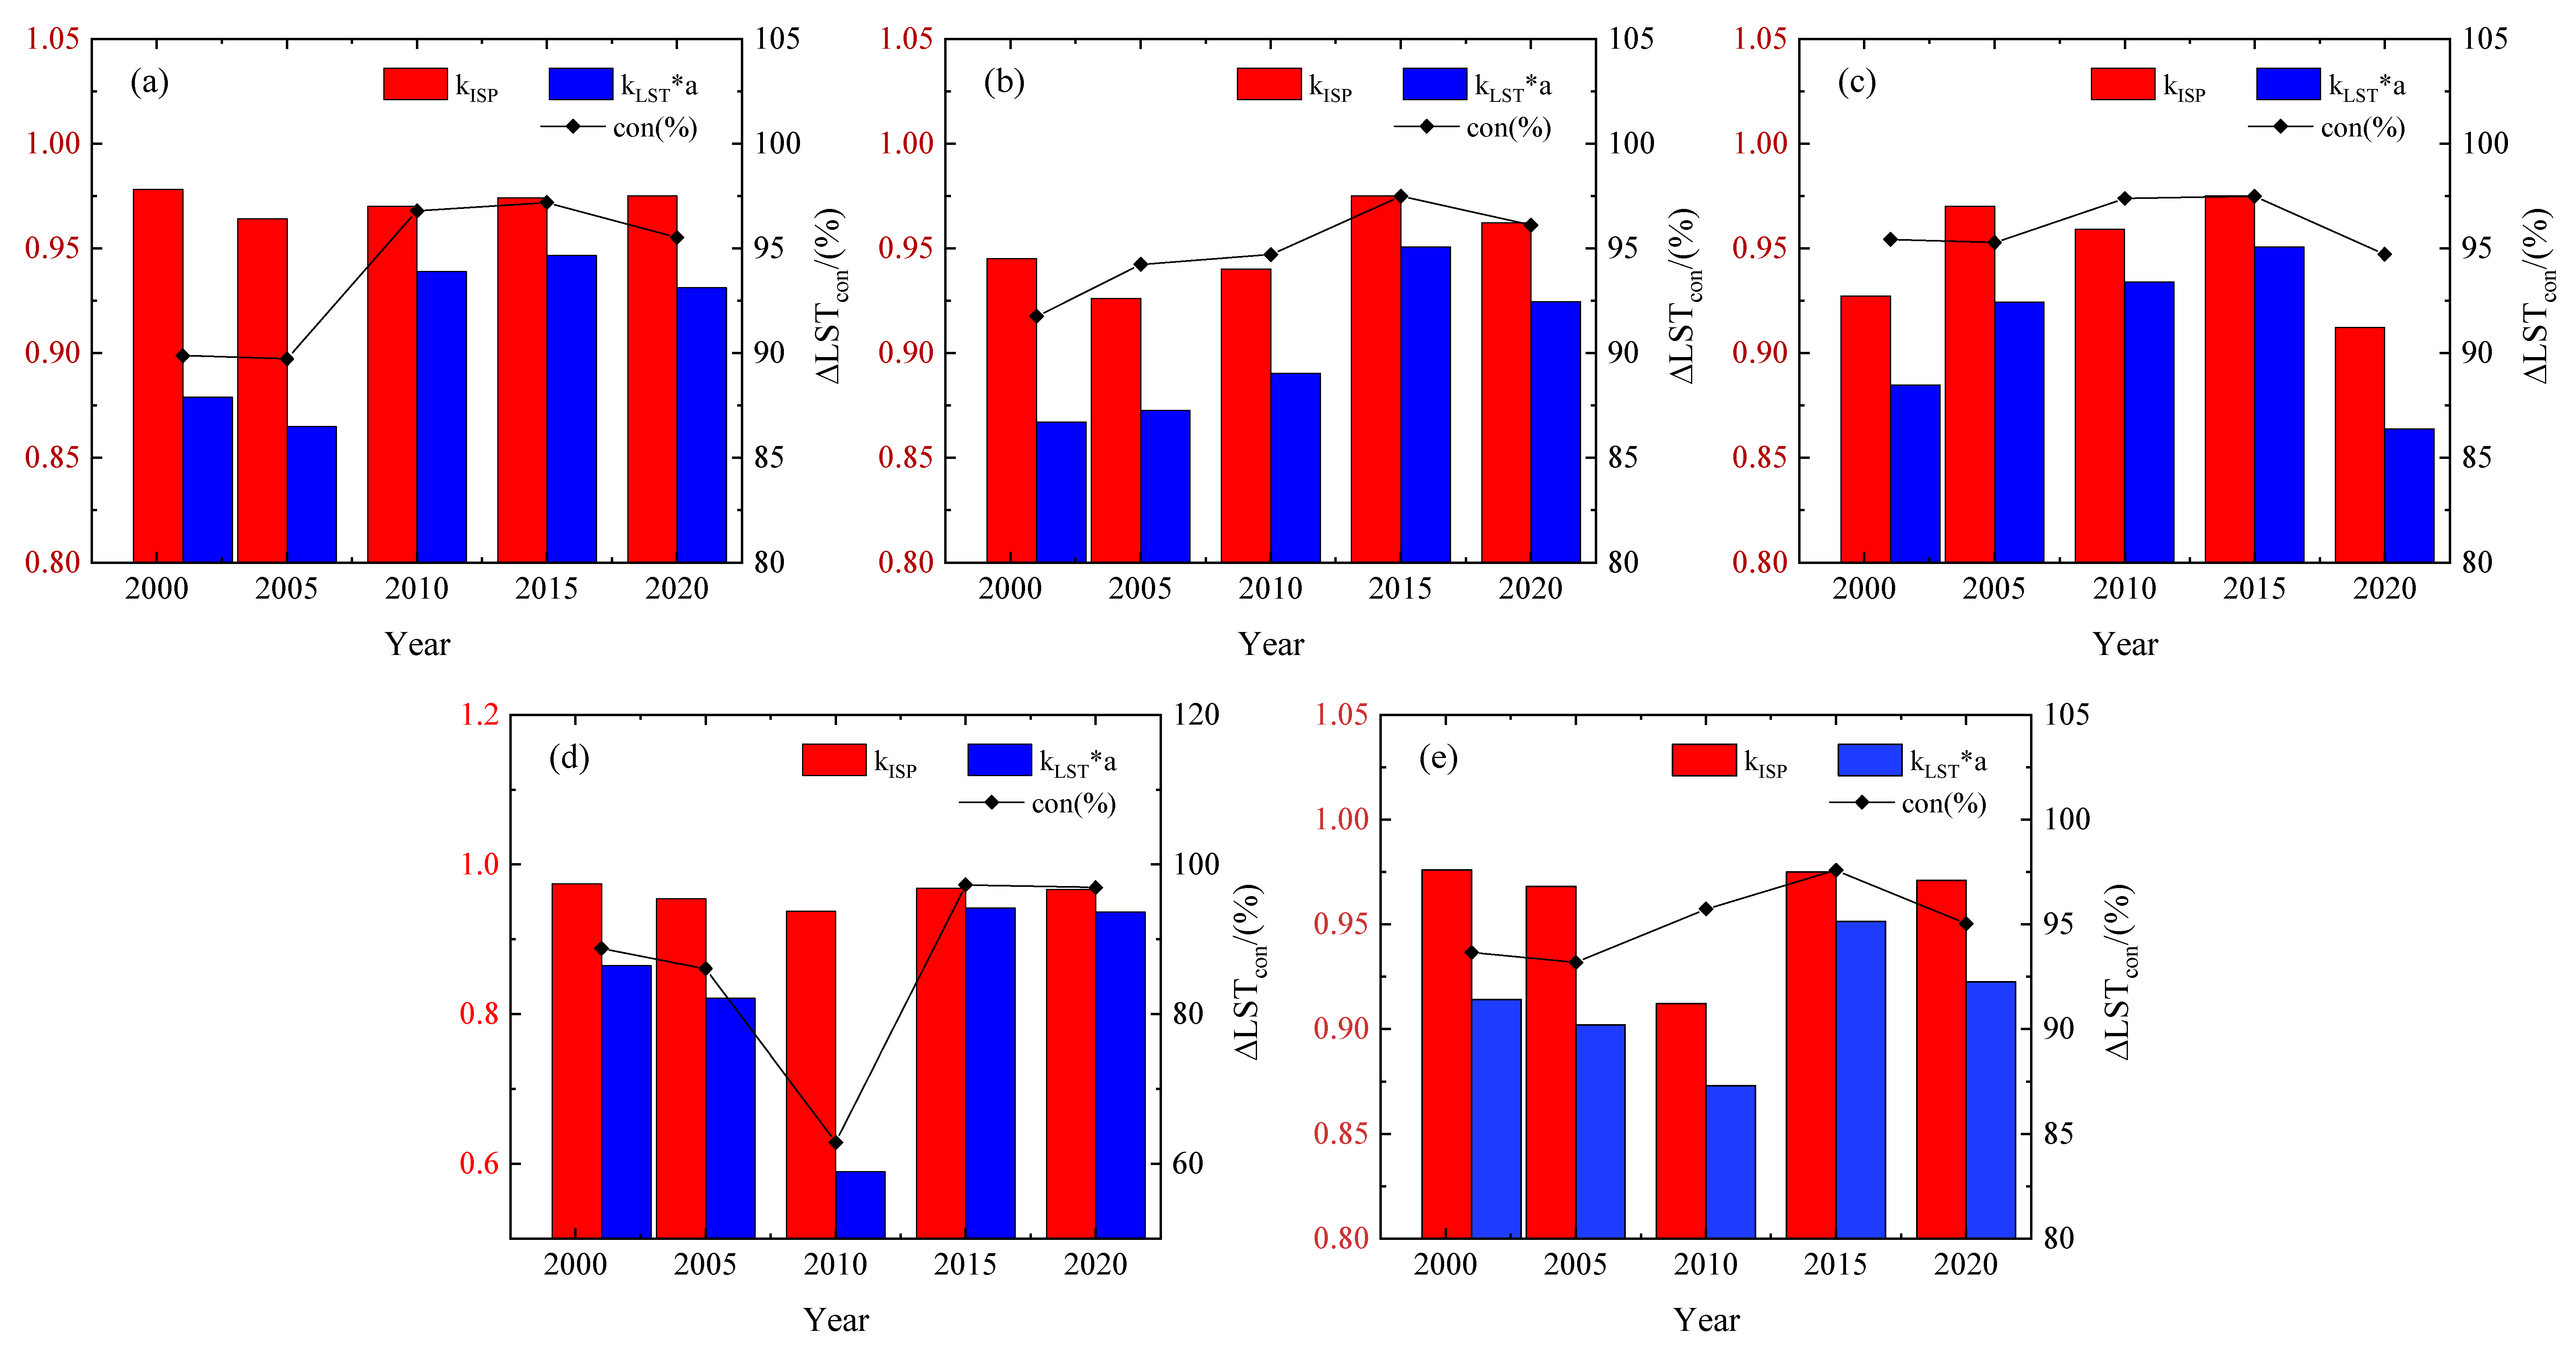
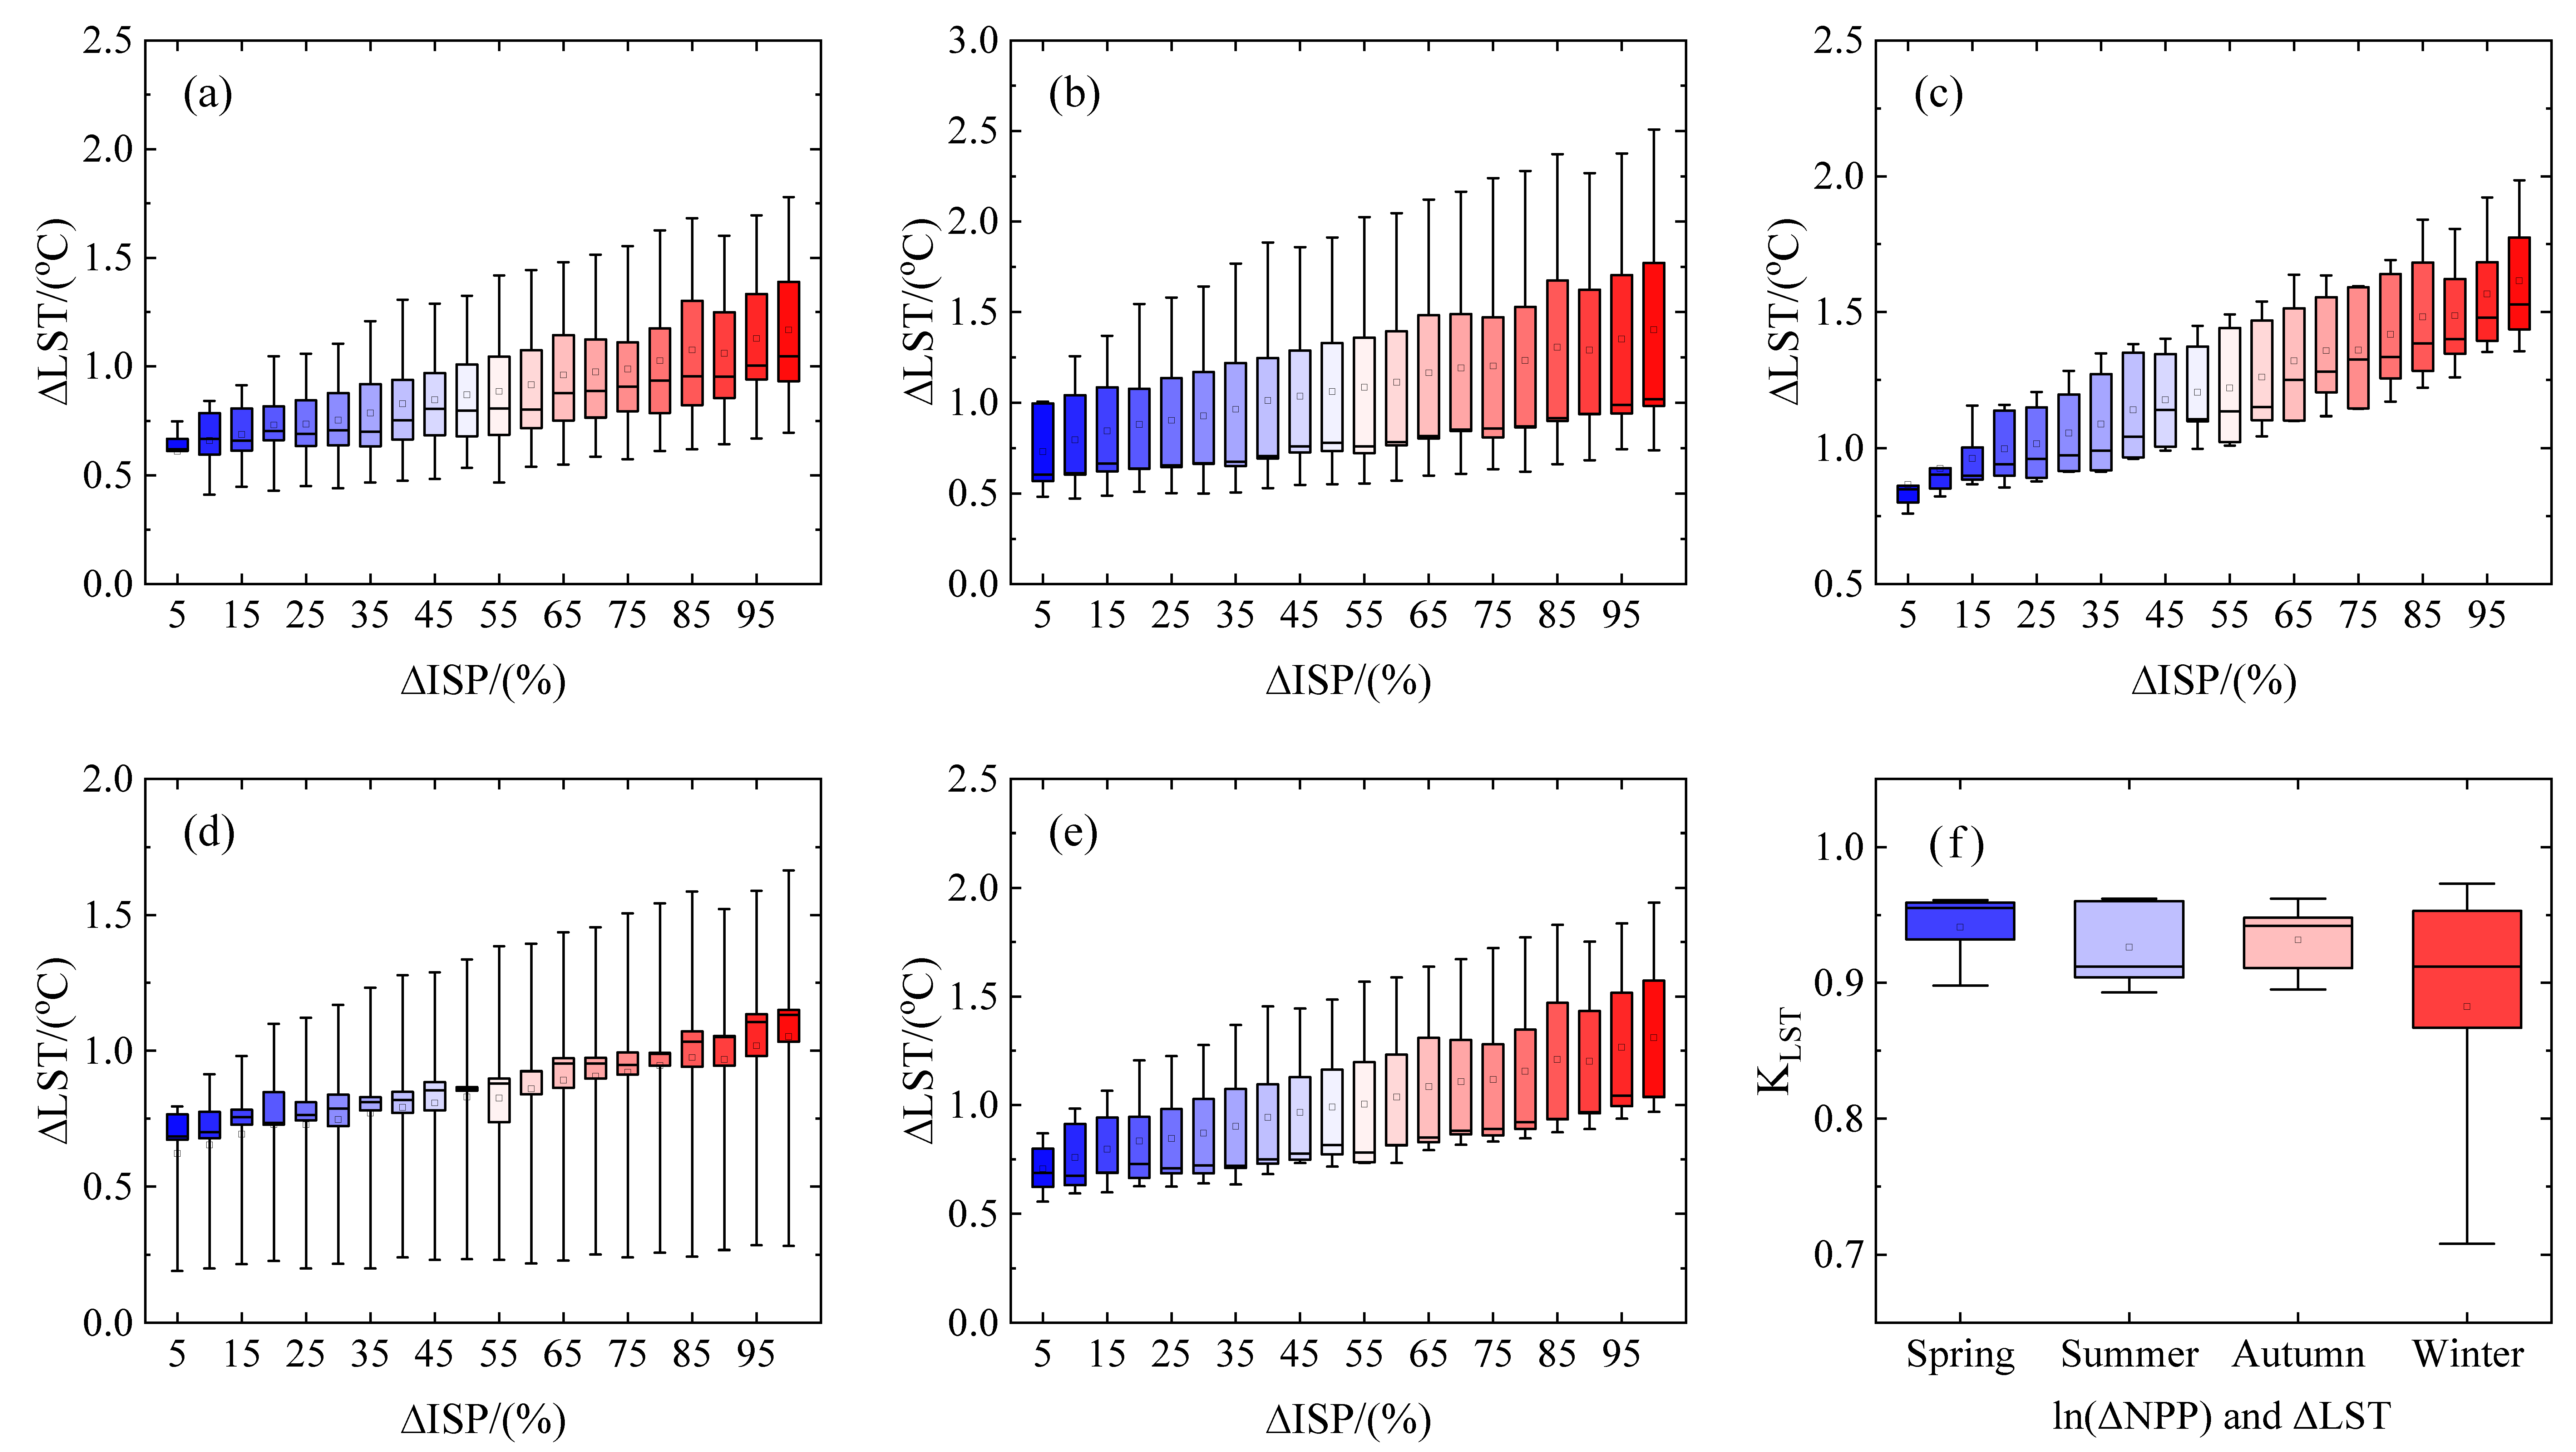
3.3. The Impact of Thermal Environment Changes on NPP

There was also an exponential growth relationship between the thermal environmental changes in the NPP from 2001 to 2020 (Figure 5). The annual NPP difference was mainly positive with the increase in LST, indicating that the warming effect caused by urbanization generally promoted vegetation growth. There were significant seasonal differences in the response of the NPP to the thermal environmental changes during the study period. The range of the thermal environment changes increased significantly, from 0.6~1.8 °C, across the urban–rural gradient; this exponential growth mostly exerted positive effects on the NPP, indicating that the warming effect caused by urbanization generally promoted vegetation growth.
The effect of the land-surface warming on the NPP was the largest during spring, during which the ΔLST increased by 1 °C and the ln(ΔNPP) increased by an average of 5.97 g C/m2/a. In winter, the ln(ΔNPP) increased by 4.99 g C/m2/a on average, while the ΔLST increased by 1 °C. The upper and lower quartiles were the widest in winter and the narrowest in spring, indicating that the impact scope fluctuated greatly in winter, but was more stable in spring (Figure 5).

3.4. Warming-Induced Effects on Vegetation Growth

Through the normalized regression coefficient of the effects of indirect vegetation growth, the contribution of the ISP and LST to urban vegetation growth was quantified (the red bar represents the ISP’s indirect impact coefficient; the blue bar represents the LST’s indirect impact coefficient), and, next, the contribution rate of the warming effect of urbanization on the NPP was identified (polyline, Figure 6). From 2001 to 2020, the contribution of the indirect effect of urbanization on the NPP grew, causing 91–98% of the vegetation growth; meanwhile, the indirect impact of the LST change on the NPP was 87–95%, indicating that the warming-induced indirect effects on vegetation growth contributed a value of 93.17–97.58%. The average contribution rate during the past two decades was 95.02%, indicating that urban land-surface warming is the biggest climate factor in vegetation growth in urban environments.
Moreover, these contribution rates were also observed in the four seasons. The ISP’s indirect effects were 96–98% in spring, 94–98% in summer, 91–98% in autumn, and 94–97% in winter, respectively. At the same time, the indirect impact of LST was 86–95% in spring, 87–95% in summer, 86–95% in autumn, and 59–94% in winter, respectively, during 2001, 2005, 2010, 2015, and 2020. The warming-induced vegetation growth contribution rates were 89.71–97.18%, 91.74–97.48%, 94.70–97.48%, and 62.87–97.27%, respectively. The largest contribution of the LST to the vegetation growth was in autumn, with a rate of 96.05%, and the lowest was in winter, with a rate of 86.37%. These results indicate that the implicit transmission-chain-induced urban vegetation growth was confirmed: urbanization, caused by land use/land cover, mainly enhanced the thermal climate in the urban–rural gradient to improve vegetation growth and promoted the growth of the NPP in urban areas. However, since these vegetation-growth ratios were far lower than the vegetation loss caused by urban expansion, the total NPP was still a trend of loss in the urban agglomeration area.

4. Discussion

4.1. Land-Surface-Warming Imprint on NPP Change

This study provides a land-surface-warming approach to quantifying the indirect impact of urbanization on vegetation using remote-sensing images, along with the dynamic urban–rural gradient, which deepens our understanding of the indirect effect of urbanization on vegetation growth. These findings are consistent with those of Zhao et al. [15], Guan et al. [23], and Wei et al. [29]. NPP is a key indicator of vegetation-growth quality within a specific time [6,7]. Urban land-surface warming has profound indirect effects on vegetation NPP, which is able to promote the growth of vegetation through urban thermal environments and man-made ecosystem management. Guan et al. [23] found that the urbanization of Kunming has had a significant indirect beneficial impact on vegetation productivity in the past 30 years, offsetting nearly 30% of the direct losses caused by the replacement of vegetation areas by impervious surfaces, which suggests that the temperature was the main factor in the indirect effect. Wei et al. [29] found that the heat-island effect was the main environmental factor in central Shanghai, based on the marginal effect of environmental factors, while other climatic factors, such as soil moisture and solar radiation, had little effect on vegetation productivity. Our study found that the contribution rate of the thermal environment to the indirect effects reached 95.02%. There were also seasonal differences: these indirect effects mainly occurred in summer and autumn. It seems that the indirect effects were due to seasonal urban microclimate environments and policies
Moreover, the GHM–GBA region is the earliest urbanization region in China. Since the rapid process of urbanization, many urban ecosystem management policies have been implemented in urban areas, such as ecological control lines, urban ecological restoration planning etc. The cities in the GHM–GBA region improved their green infrastructure network systems and park-city construction action plans, according to the law. These measures helped to protect urban vegetation effectively. The region is also suitable for vegetation growth based on its levels of rainfall and subtropical temperatures. This meant that the highest growth rate occurred after 2010. The emphasis on the ecological environment in the GHM–GBA region, along with the dynamics of the urban–rural gradient, made its ecological condition more suitable to vegetation growth. Therefore, the contribution rate and scope of urbanization to the indirect effects increased from 2001 to 2020, in different periods (Figure 7).
Previous studies have shown that other environmental conditions, such as atmospheric composition [20], soil moisture [21], etc., also have a certain impact on vegetation growth. Thus, the indirect effect of urbanization on vegetation growth quality is not only attributed to the thermal environment, but also to other environmental factors. However, according to our findings, urbanization mainly boosts vegetation growth by altering the thermal environment.

4.2. Uncertainty and Limitations

This study built a new approach to quantifying the indirect effects of urbanization, through which it was found that urban thermal environment changes are the most significant microclimate condition influencing urban vegetation growth. Most previous studies has examined the indirect effects of urbanization; however, these studies considered GPP as the key indicator [16]. Although the indirect effects of urbanization on vegetation NPP were closely examined, there were still some limitations in this study. One limitation is that the direct effects of urbanization, which we did not estimate, are usually negative [15,16]. Zhao et al. [15] found that the impact of urban environments on vegetation growth in 32 major cities of China explained approximately 40% of the direct loss of vegetation caused by the replacement of vegetation areas by impervious surfaces. In this study, we assumed that urbanization affected the full coverage grid in the urban–rural gradient; thus, it was not possible to quantify the extent to which the indirect impact offset the direct impact.
In addition, some studies indicate that urban warming promotes vegetation growth in suburbs, but not in urban centers [23]. By contrast, other studies show that the ability of urban warming to increase vegetation growth gradually weakens from urban centers to suburbs [29]. However, we quantified the indirect effects from a dynamic urban–rural gradient perspective. This perspective can be used to independently determine the gradient from a fixed location, and to generalize a continuous gradient; however, it also induced some uncertainty in the comparison of the specific effects of urban centers and suburbs.
Finally, this study also has some limitations and uncertainties in its remote sensing data analysis. Firstly, the NPP was estimated by the CASA model to characterize the vegetation growth quality, but due to the limited number of meteorological stations to interpolate the spatial input data, there may have been some uncertainty in the estimated results [37]. Moreover, we used the MOD17A3HGF data product to verify the high accuracy on a yearly scale; however, new and precise validation data were not found on a finer time scale. The quality of the estimated NPP in the urban areas may have been overestimated, which, in turn, affected the assessment of the relationship between urbanization and vegetation growth. Secondly, this research found that nonlinear statistical analysis is a better approach to explaining the pairwise relationship between urbanization, thermal environments, and NPP. However, statistical methods alone cannot fully reveal the internal mechanisms of thermal environments and vegetation growth quality in highly urbanized areas. In the future, more abundant and explanatory models based on ecological processes could be introduced to provide mechanistic explanations.

5. Conclusions

Rapid urbanization has led to the transition of the landscape matrix from nature to imperviousness, which alters urban ecosystems and micro-environments, which, in turn, may affect vegetation growth in urban areas. In this study, the spatial and temporal distribution of the indirect effects of urbanization on vegetation NPP were quantified in the urban–rural gradient of the GHM–GBA agglomeration region. It was found that the indirect effect of urbanization had a significant positive effect on vegetation NPP in the urban–rural gradient, with seasonal differences and interannual changes that were large in summer and small in winter. The indirect effects of urbanization were mainly caused by land-surface warming, which may have accounted for 95.02% of the indirect effects. Thus, the obvious existence of positive indirect effects indicates that thermal environment regulation can be utilized to improve vegetation growth and enhance ecosystem services by employing appropriate urban ecosystem management.

Author Contributions

Conceptualization, Z.L. and Z.F.; methodology, Z.F. and Y.Z.; writing—original draft preparation, Z.F. and Z.L.; writing—review and editing, Z.L.; funding acquisition, Z.L. All authors have read and agreed to the published version of the manuscript.

Funding

This research was funded by Guangdong Basic and Applied Basic Research Foundation, grant number 2022A1515010062, and the National Natural Science of Foundation, grant number 41571172.

Data Availability Statement

Not applicable.

Conflicts of Interest

The authors declare no conflict of interest.

References

  1. Liu, X.; Huang, Y.; Xu, X.; Li, X.; Li, X.; Ciais, P.; Lin, P.; Gong, K.; Ziegler, A.D.; Chen, A.; et al. High-spatiotemporal-resolution mapping of global urban change from 1985 to 2015. Nat. Sustain. 2020, 3, 564–570. [Google Scholar] [CrossRef]
  2. Chen, M.; Liu, W.; Lu, D. Challenges and the way forward in China’s new-type urbanization. Land Use Policy 2016, 55, 334–339. [Google Scholar] [CrossRef]
  3. Chen, G.; Li, X.; Liu, X.; Chen, Y.; Liang, X.; Leng, J.; Xu, X.; Liao, W.; Qiu, Y.A.; Wu, Q.; et al. Global projections of future urban land expansion under shared socioeconomic pathways. Nat. Commun. 2020, 11, 537. [Google Scholar] [CrossRef] [PubMed] [Green Version]
  4. Pickett, S.T.A.; Cadenasso, M.L.; Grove, J.M.; Boone, C.G.; Groffman, P.M.; Irwin, E.; Kaushal, S.S.; Marshall, V.; McGrath, B.P.; Nilon, C.H.; et al. Urban ecological systems: Scientific foundations and a decade of progress. J. Environ. Manag. 2011, 92, 331–362. [Google Scholar] [CrossRef] [PubMed]
  5. Youngsteadt, E.; Dale, A.G.; Terando, A.J.; Dunn, R.R.; Frank, S.D. Do cities simulate climate change? A comparison of herbivore response to urban and global warming. Global Chang. Biol. 2015, 21, 97–105. [Google Scholar] [CrossRef]
  6. Zhao, S.; Zhou, D.; Zhu, C.; Qu, W.; Zhao, J.; Sun, Y.; Huang, D.; Wu, W.; Liu, S. Rates and patterns of urban expansion in China’s 32 major cities over the past three decades. Landsc. Ecol. 2015, 30, 1541–1559. [Google Scholar] [CrossRef]
  7. Paolini, L.; Aráoz, E.; Gioia, A.; Powell, P.A. Vegetation productivity trends in response to urban dynamics. Urban For. Urban Green. 2016, 17, 211–216. [Google Scholar] [CrossRef]
  8. Haberl, H.; Erb, K.H.; Krausmann, F.; Gaube, V.; Bondeau, A.; Plutzar, C.; Gingrich, S.; Lucht, W.; Fischer-Kowalski, M. Quantifying and mapping the human appropriation of net primary production in earth’s terrestrial ecosystems. Proc. Natl. Acad. Sci. USA 2007, 104, 12942–12947. [Google Scholar] [CrossRef] [Green Version]
  9. Martínez, B.; Sánchez-Ruiz, S.; Campos-Taberner, M.; García-Haro, F.J.; Gilabert, M.A. Exploring Ecosystem Functioning in Spain with Gross and Net Primary Production Time Series. Remote Sens. 2022, 14, 1310. [Google Scholar] [CrossRef]
  10. Liu, X.; Pei, F.; Wen, Y.; Li, X.; Wang, S.; Wu, C.; Cai, Y.; Wu, J.; Chen, J.; Feng, K.; et al. Global urban expansion offsets climate-driven increases in terrestrial net primary productivity. Nat. Commun. 2019, 10, 5558. [Google Scholar] [CrossRef] [Green Version]
  11. Roy, S.; Byrne, J.; Pickering, C. A systematic quantitative review of urban tree benefits, costs, and assessment methods across cities in different climatic zones. Urban For. Urban Green. 2012, 11, 351–363. [Google Scholar] [CrossRef] [Green Version]
  12. Chen, W.Y. The role of urban green infrastructure in offsetting carbon emissions in 35 major Chinese cities: A nationwide estimate. Cities 2015, 44, 112–120. [Google Scholar] [CrossRef]
  13. Griscom, B.W.; Adams, J.; Ellis, P.W.; Houghton, R.A.; Lomax, G.; Miteva, D.A.; Schlesinger, W.H.; Shoch, D.; Siikamäki, J.V.; Smith, P.; et al. Natural climate solutions. Proc. Natl. Acad. Sci. USA 2017, 114, 11645–11650. [Google Scholar] [CrossRef] [PubMed] [Green Version]
  14. Grimm, N.B.; Faeth, S.H.; Golubiewski, N.E.; Redman, C.L.; Wu, J.; Bai, X.; Briggs, J.M. Global Change and the Ecology of Cities. Science 2008, 319, 756–760. [Google Scholar] [CrossRef] [PubMed] [Green Version]
  15. Zhao, S.; Liu, S.; Zhou, D. Prevalent vegetation growth enhancement in urban environment. Proc. Natl. Acad. Sci. USA 2016, 113, 6313–6318. [Google Scholar] [CrossRef] [Green Version]
  16. Chen, Y.; Huang, B.; Zeng, H. How does urbanization affect vegetation productivity in the coastal cities of eastern China? Sci. Total Environ. 2022, 811, 152356. [Google Scholar] [CrossRef]
  17. Zhong, J.; Liu, J.; Jiao, L.; Lian, X.; Xu, Z.; Zhou, Z. Assessing the comprehensive impacts of different urbanization process on vegetation net primary productivity in Wuhan, China, from 1990 to 2020. Sustain. Cities Soc. 2021, 75, 103295. [Google Scholar] [CrossRef]
  18. Liu, X.; Wang, P.; Song, H.; Zeng, X. Determinants of net primary productivity: Low-carbon development from the perspective of carbon sequestration. Technol. Forecast. Soc. Chang. 2021, 172, 121006. [Google Scholar] [CrossRef]
  19. Chen, Y.; Wang, J.; Xiong, N.; Sun, L.; Xu, J. Impacts of Land Use Changes on Net Primary Productivity in Urban Agglomerations under Multi-Scenarios Simulation. Remote Sens. 2022, 14, 1755. [Google Scholar] [CrossRef]
  20. Takagi, M.; Gyokusen, K. Light and atmospheric pollution affect photosynthesis of street trees in urban environments. Urban For. Urban Green. 2004, 2, 167–171. [Google Scholar] [CrossRef]
  21. Quigley, M.F. Street trees and rural conspecifics: Will long-lived trees reach full size in urban conditions? Urban Ecosyst. 2004, 7, 29–39. [Google Scholar] [CrossRef]
  22. Arnfield, A.J. Two decades of urban climate research: A review of turbulence, exchanges of energy and water, and the urban heat island. Int. J. Climatol. J. R. Meteorol. Soc. 2003, 23, 1–26. [Google Scholar] [CrossRef]
  23. Guan, X.; Shen, H.; Li, X.; Gan, W.; Zhang, L. A long-term and comprehensive assessment of the urbanization-induced impacts on vegetation net primary productivity. Sci. Total Environ. 2019, 669, 342–352. [Google Scholar] [CrossRef] [PubMed]
  24. Jónsson, S.; Segall, P.; Pedersen, R.; Björnsson, G. Post-earthquake ground movements correlated to pore-pressure transients. Nature 2003, 424, 179–183. [Google Scholar] [CrossRef]
  25. Ziska, L.H.; Bunce, J.A.; Goins, E.W. Characterization of an Urban-Rural CO2/Temperature Gradient and Associated Changes in Initial Plant Productivity during Secondary Succession. Oecologia 2004, 139, 454–458. [Google Scholar] [CrossRef]
  26. Wu, S.; Zhou, S.; Chen, D.; Wei, Z.; Dai, L.; Li, X. Determining the contributions of urbanisation and climate change to NPP variations over the last decade in the Yangtze River Delta, China. Sci. Total Environ. 2014, 472, 397–406. [Google Scholar] [CrossRef]
  27. Yan, Y.; Wu, C.; Wen, Y. Determining the impacts of climate change and urban expansion on net primary productivity using the spatio-temporal fusion of remote sensing data. Ecol. Indic. 2021, 127, 107737. [Google Scholar] [CrossRef]
  28. Zhong, Q.; Ma, J.; Zhao, B.; Wang, X.; Zong, J.; Xiao, X. Assessing spatial-temporal dynamics of urban expansion, vegetation greenness and photosynthesis in megacity Shanghai, China during 2000–2016. Remote Sens. Environ. 2019, 233, 111374. [Google Scholar] [CrossRef]
  29. Wei, S.; Chen, Q.; Wu, W.; Ma, J. Quantifying the indirect effects of urbanization on urban vegetation carbon uptake in the megacity of Shanghai, China. Environ. Res. Lett. 2021, 16, 64088. [Google Scholar] [CrossRef]
  30. Zhao, L.; Lee, X.; Smith, R.B.; Oleson, K. Strong contributions of local background climate to urban heat islands. Nature 2014, 511, 216–219. [Google Scholar] [CrossRef]
  31. Wang, J.; Xiang, Z.; Wang, W.; Chang, W.; Wang, Y. Impacts of strengthened warming by urban heat island on carbon sequestration of urban ecosystems in a subtropical city of China. Urban Ecosyst. 2021, 24, 1165–1177. [Google Scholar] [CrossRef]
  32. Wang, S.; Ju, W.; Peñuelas, J.; Cescatti, A.; Zhou, Y.; Fu, Y.; Huete, A.; Liu, M.; Zhang, Y. Urban−rural gradients reveal joint control of elevated CO2 and temperature on extended photosynthetic seasons. Nat. Ecol. Evol. 2019, 3, 1076–1085. [Google Scholar] [CrossRef] [PubMed] [Green Version]
  33. Lu, Y.; Yang, J.; Peng, M.; Li, T.; Wen, D.; Huang, X. Monitoring ecosystem services in the Guangdong-Hong Kong-Macao Greater Bay Area based on multi-temporal deep learning. Sci. Total Environ. 2022, 822, 153662. [Google Scholar] [CrossRef] [PubMed]
  34. Kuang, W.; Liu, Y.; Dou, Y.; Chi, W.; Chen, G.; Gao, C.; Yang, T.; Liu, J.; Zhang, R. What are hot and what are not in an urban landscape: Quantifying and explaining the land surface temperature pattern in Beijing, China. Landsc. Ecol. 2015, 30, 357–373. [Google Scholar] [CrossRef]
  35. Ma, Q.; Wu, J.; He, C. A hierarchical analysis of the relationship between urban impervious surfaces and land surface temperatures: Spatial scale dependence, temporal variations, and bioclimatic modulation. Landsc. Ecol. 2016, 31, 1139–1153. [Google Scholar] [CrossRef]
  36. Dubeau, P.; King, D.; Unbushe, D.; Rebelo, L. Mapping the Dabus Wetlands, Ethiopia, Using Random Forest Classification of Landsat, PALSAR and Topographic Data. Remote Sens. 2017, 9, 1056. [Google Scholar] [CrossRef] [Green Version]
  37. Du, Y.; Mao, H.; Liu, A.; Pan, W. The climatological calculation and distribution of global solar radiation in Guangdong Province. Res. Sci. 2003, 25, 66–70. (In Chinese) [Google Scholar]
  38. Vicente-Serrano, S.M.; Saz-Sánchez, M.A.; Cuadrat, J.M. Comparative analysis of interpolation methods in the middle Ebro Valley (Spain): Application to annual precipitation and temperature. Clim. Res. 2003, 24, 161–180. [Google Scholar] [CrossRef] [Green Version]
  39. Zhu, W.; Pan, Y.; Zhang, J. Estimation of net primary productivity of Chinese terrestrial vegetation based on remote sensing. Chin. J. Plant Ecol. 2007, 31, 413–424. (In Chinese) [Google Scholar]
Figure 1. Location of the Guangdong−Hong Kong−Macao Greater Bay: (a) location in China; (b) vegetation type map; (c) elevation map.
Remotesensing 14 02869 g001
Figure 2. The annual and seasonal mean and slope of LST in the GHM−GBA region: (a) annual average LST; (b) spring average LST; (c) summer average LST; (d) autumn average LST; (e) winter average LST; (f) slope of annual LST; (g) slope of spring LST; (h) slope of summer LST; (i) slope of autumn LST; (j) slope of winter LST.
Remotesensing 14 02869 g002
Figure 3. The impact of urbanization on LST during 2001–2020.
Remotesensing 14 02869 g003
Figure 4. The indirect impact of ISP on NPP during 2001–2020.
Remotesensing 14 02869 g004
Figure 5. The impact of annual mean LST on NPP during 2001−2020.
Remotesensing 14 02869 g005
Figure 6. The land-surface-warming-induced contribution to the effects of urbanization on NPP during 2001–2020. Note: (a) spring; (b) summer; (c) autumn; (d) winter; (e) year. k I S P represents the total indirect effect of urbanization; k L S T a represents the indirect effects of warming on urbanization.
Remotesensing 14 02869 g006
Figure 7. The scope and amount of ∆LST and ∆ISP, and the coefficient of ∆LST and ∆ISP: (a) spring ∆LST and ∆ISP; (b) summer ∆LST and ∆ISP; (c) autumn ∆LST and ∆ISP; (d) winter ∆LST and ∆ISP; (e) year ∆LST and ∆ISP; (f) coefficient of ln(∆NPP) and ∆LST.
Remotesensing 14 02869 g007
Publisher’s Note: MDPI stays neutral with regard to jurisdictional claims in published maps and institutional affiliations.

