Article

Estimating Productivity Measures in Guayule Using UAS Imagery and Sentinel-2 Satellite Data

by
Truman P. Combs
1,2,*,
Kamel Didan
1,2,
David Dierig
3,
Christopher J. Jarchow
2 and
Armando Barreto-Muñoz
1,2
1
Vegetation Index & Phenology (VIP) Laboratory, The University of Arizona, Tucson, AZ 85721, USA
2
Biosystems Engineering Department, University of Arizona, Tucson, AZ 85719, USA
3
Guayule Research Farm, Bridgestone Americas, Inc., Eloy, AZ 85131, USA
*
Author to whom correspondence should be addressed.
Remote Sens. 2022, 14(12), 2867; https://doi.org/10.3390/rs14122867
Submission received: 22 April 2022 / Revised: 6 June 2022 / Accepted: 7 June 2022 / Published: 15 June 2022

Abstract

:
Guayule (Parthenium argentatum Gray) is a perennial desert shrub currently under investigation as a viable commercial alternative to the Pará rubber tree (Hevea brasiliensis), the traditional source of natural rubber. Previous studies on guayule have shown a close association between morphological traits or biomass and rubber content. We collected multispectral and RGB-derived Structure-from-motion (SfM) data using an unmanned aircraft system (UAS; drone) to determine if incorporating both high-resolution normalized difference vegetation index (NDVI; an indicator of plant health) and canopy height (CH) information could support model predictions of crop productivity. Ground-truth resource allocation in guayule was measured at four elevations (i.e., tiers) along the crop’s vertical profile using both traditional biomass measurement techniques and a novel volumetric measurement technique. Multiple linear regression models estimating fresh weight (FW), dry weight (DW), fresh volume (FV), fresh-weight-density (FWD), and dry-weight-density (DWD) were developed and their performance compared. Of the crop productivity measures considered, a model predicting FWD (i.e., the fresh weight of plant material adjusted by its freshly harvested volume) and incorporating NDVI, CH, NDVI:CH interaction, and tier parameters reported the lowest mean absolute percentage error (MAPE) between field measurements and predictions, ranging from 9 to 13%. A reduced FWD model incorporating only NDVI and tier parameters was developed to explore the scalability of model predictions to medium spatial resolutions with Sentinel-2 satellite data. Across all UAS surveys and corresponding satellite imagery compared, MAPE between FWD model predictions for UAS and satellite data were below 3% irrespective of soil pixel influence.

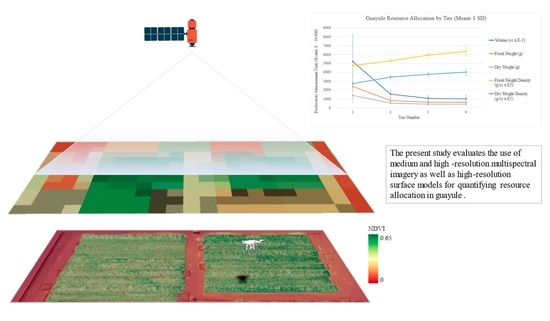
Graphical Abstract

1. Introduction

Unmanned aircraft systems (UASs, i.e., drones) experienced considerable developments in technology and utilization in recent years driven by military, academic, and civilian interests. Among the widespread and varied applications is precision monitoring and management in agricultural systems [1]. UASs represent a middle-ground between the financial and logistical demands of field data collection and the insufficient spatial or temporal resolution of satellite data [2]. High spatial resolutions coupled with on-demand temporal accessibility enable researchers and managers to explore unprecedented perspectives on crop development and resource use.
Of particular agronomic significance in the last century is Guayule (Parthenium argentatum Gray), a perennial shrub endemic to the southwestern United States and northern Mexico. The plant is currently being evaluated as a sustainable, alternative source of natural rubber [3]. The Pará rubber tree (Hevea brasiliensis), which is both dependent on a tropical climate and highly susceptible to disease, currently comprises at least 80% of the world’s supply of natural rubber [4,5]. Guayule, by comparison, has low water requirements and reaches harvest maturity after only two years [6]. Previous research has focused on the role of genetic trait selection and environmental conditions (e.g., soil type and irrigation) on guayule rubber production [7,8]. Because most of the plant’s rubber content is stored in bark tissue [9,10], current breeding and management efforts aim to maximize the bark-to-wood ratio.
Direct measurements of crop morphological characteristics can be difficult, but several techniques exist for relating complex traits to simpler, more easily measured traits [11]. For example, measurements of fresh weight and dry weight (biomass) have long been used as simple measures of crop performance [12]. Allometric equations can relate traits such as canopy height (CH) and width or stem diameter at breast height (DBH) to coarse measures of biomass or volume [13,14,15]. Regardless of whether data are obtained destructively or allometrically, in situ measurements can be costly and time consuming. As a result, the agricultural industry has recently turned to remote sensing as a potentially more efficient alternative for monitoring crops [16].
Surface modeling techniques and technology can be used to measure plant structural features, such as crop height, volume, biomass, and lateral density (i.e., crop spacing). Structure-from-Motion (SfM) photogrammetry, one such approach, uses red-green-blue (RGB) imagery to reconstruct three-dimensional (3D) scenes from a series of two-dimensional (2D) photographs [17,18,19,20,21]. Eltner et al., (2020) outlines a variety of applications for SfM, such as geomorphological mapping, and provides a framework for collecting and processing SfM data which prioritizes surface model accuracy [22]. Light detection and ranging (LiDAR) technology produces similar 3D datasets, and often with improved outcomes; however, these sensors can be prohibitively expensive [23,24,25,26].
Multispectral imagery (i.e., monochromatic images captured at specific wavelengths of the electromagnetic spectrum), once restricted to coarse satellite or handheld (i.e., small footprint) applications, is witnessing renewed interest in the advent of UAS-mounted sensors capable of producing high-resolution vegetation index (VI) products. The normalized difference vegetation index (NDVI) and other multispectral indices have also been linked to field-based measures of biomass, volume, phenology, leaf area index (LAI), and other indicators of crop stress or performance [27,28,29,30]. Limited research has started to look at fusing these disparate structural and multispectral datatypes for improved accuracy and precision in spatiotemporal models of crop production, but additional work is needed [31,32,33].
Despite its potential to revolutionize remote sensing at local scales, UAS technology currently lacks the capacity for monitoring large management areas. Recent improvements in satellite spatial resolutions have emerged to resolve such gaps in data collection. The Sentinel-2 mission from the European Space Agency’s (ESA) Copernicus Programme uses a constellation of twin satellites (i.e., S-2A and S-2B) launched in 2015 and 2017, respectively, with the primary focus of land monitoring at high spatial (10–60 m) and temporal (five-day combined repeat) resolutions [34]. The Copernicus Programme offers Analysis Ready Data (ARD) as georeferenced and radiometrically and geometrically corrected surface reflectance imagery (Level-2A). Several recent studies have demonstrated the potential for Sentinel-2 data to be used in monitoring croplands [35,36]. The increasingly higher temporal and spatial resolutions of satellite sensors affords the ability to scale crop estimates from field and UAS surveys to satellite data at no cost to the user.
No studies have attempted to link structural and multispectral data for estimating resource allocation in guayule. Field observations indicate the tendency for guayule to distribute leaves, wood, and bark heterogeneously throughout its architecture (e.g., leaves in a mature crop are localized primarily in the top half of the plant). We hypothesize that differentiating between height (i.e., vertical distribution) of resource allocation could support managers in characterizing bioproduct potential in individuals of differing architecture. UASs offer many advantages over satellite platforms, but the former are not well suited for managing large agricultural regions due to limited spatial coverage and short battery life. The objectives of our research were to 1) determine if NVDI (i.e., a measure of plant greenness) can be integrated with CH information derived from SfM models to predict the allocation of resources along the vertical profile in guayule and 2) evaluate the scalability of a UAS resource allocation model to medium-resolution, landscape-scale satellite data.

2. Materials and Methods

2.1. Field Site

The research site was located at a Guayule Research Farm, operated by Bridgestone Americas, Inc. (Bridgestone) in Eloy, Arizona. The region of interest (ROI) consisted of a 3.5-acre area of mature guayule. Guayule is harvested every two years for rubber production. At the time of this research, plants were approximately 1.5 years old with full canopy closure. The ROI was the site of an ongoing experiment investigating the effects of water delivery methods and application rates on productivity [37]. The irrigation study examined six unique treatments, with three replicates for each treatment (n = 18; Figure 1). Treatments were characterized by differences in irrigation delivery (i.e., flood versus drip irrigation) and water application schemes ranging from 50% to 150% of field capacity per irrigation event.

2.2. Equipment

RGB data were collected as JPEG images using a DJI Phantom 4 quadcopter. The UAS is equipped with a 1/2.3″ CMOS 12.4-megapixel sensor, which is manipulated via a three-axis gimbal [38]. We used Pix4DCapture to pre-program the flight path, speed, and altitude, overlap between RGB images, and sensor view angle (Figure 2a) [39]. Single-band data were collected as TIF images using a Parrot Sequoia multispectral sensor. The sensor was attached to the UAS using a 3D-printed immobile mount and directed nadir. The Sequoia incorporates four global shutter 1.2-megapixel sensors which capture monochrome data in the green (530–570 nm), red (640–680 nm), red edge (730–740 nm), and NIR (770–810 nm) regions of the electromagnetic spectrum [40]. RGB and multispectral data were collected at 25 m and 100 m above ground level (AGL), respectively; the latter data were collected via manual piloting (Figure 2b; i.e., without a flight planner). Dates of aerial and harvest data collection are presented in Table 1.

2.3. Georeferencing

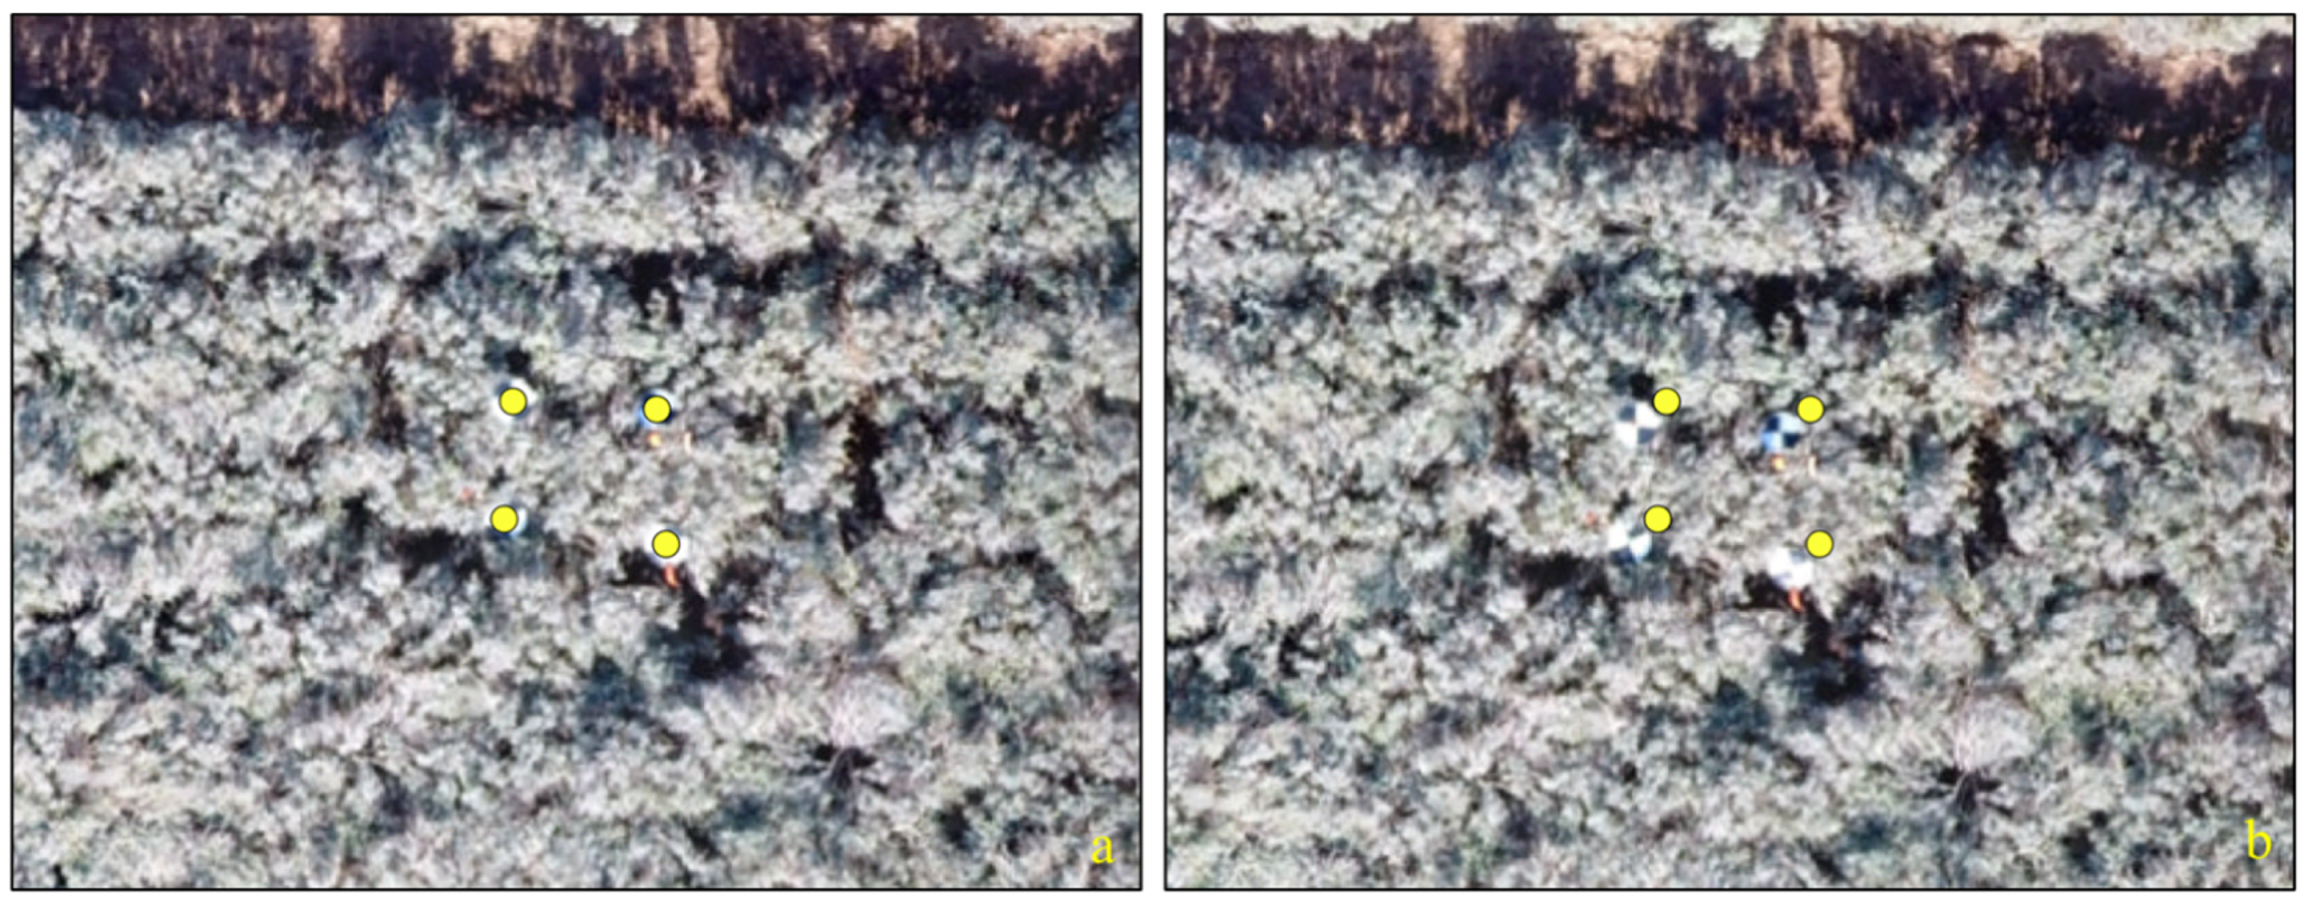
Preliminary analysis suggested poor geolocation when relying on Phantom 4 EXIF metadata alone (Figure 3). Georeferencing markers were deployed immediately prior to the 19 December 2019 sampling and aerial survey event; thus, no prior surveys included markers for radial error estimation. Nine high-contrast ground control targets were placed at ground level within and surrounding the ROI for estimating radial geolocation error. A total of nine one-square-meter samples of total above-ground plant material were removed from Drip-50 (n = 3), Drip-75 (n = 3), and Drip-100 (n = 3) treatments (Figure 1) on 23 December 2019. Each roughly one-cubic-meter (i.e., accounting for a one-square-meter sampling footprint and approximate crop height) sample was marked centrally with a flag and four high-contrast targets were placed on the top of the canopy directly above each corner of the square footprint boundary to allow for vertical error estimation. Heights AGL were measured in situ to the nearest cm at each canopy-surface target (n = 4 per sample) as well as the approximated center of the sample for a total of five height measurements per sample. Since the guayule were grown in a ridge-and-furrow layout with the ground level directly below each canopy-surface target falling within the furrows, the difference between each canopy-surface target elevation both including and excluding furrow height was recorded to account for true canopy elevation AGL.

2.4. Harvest and Fresh Weight Measurements

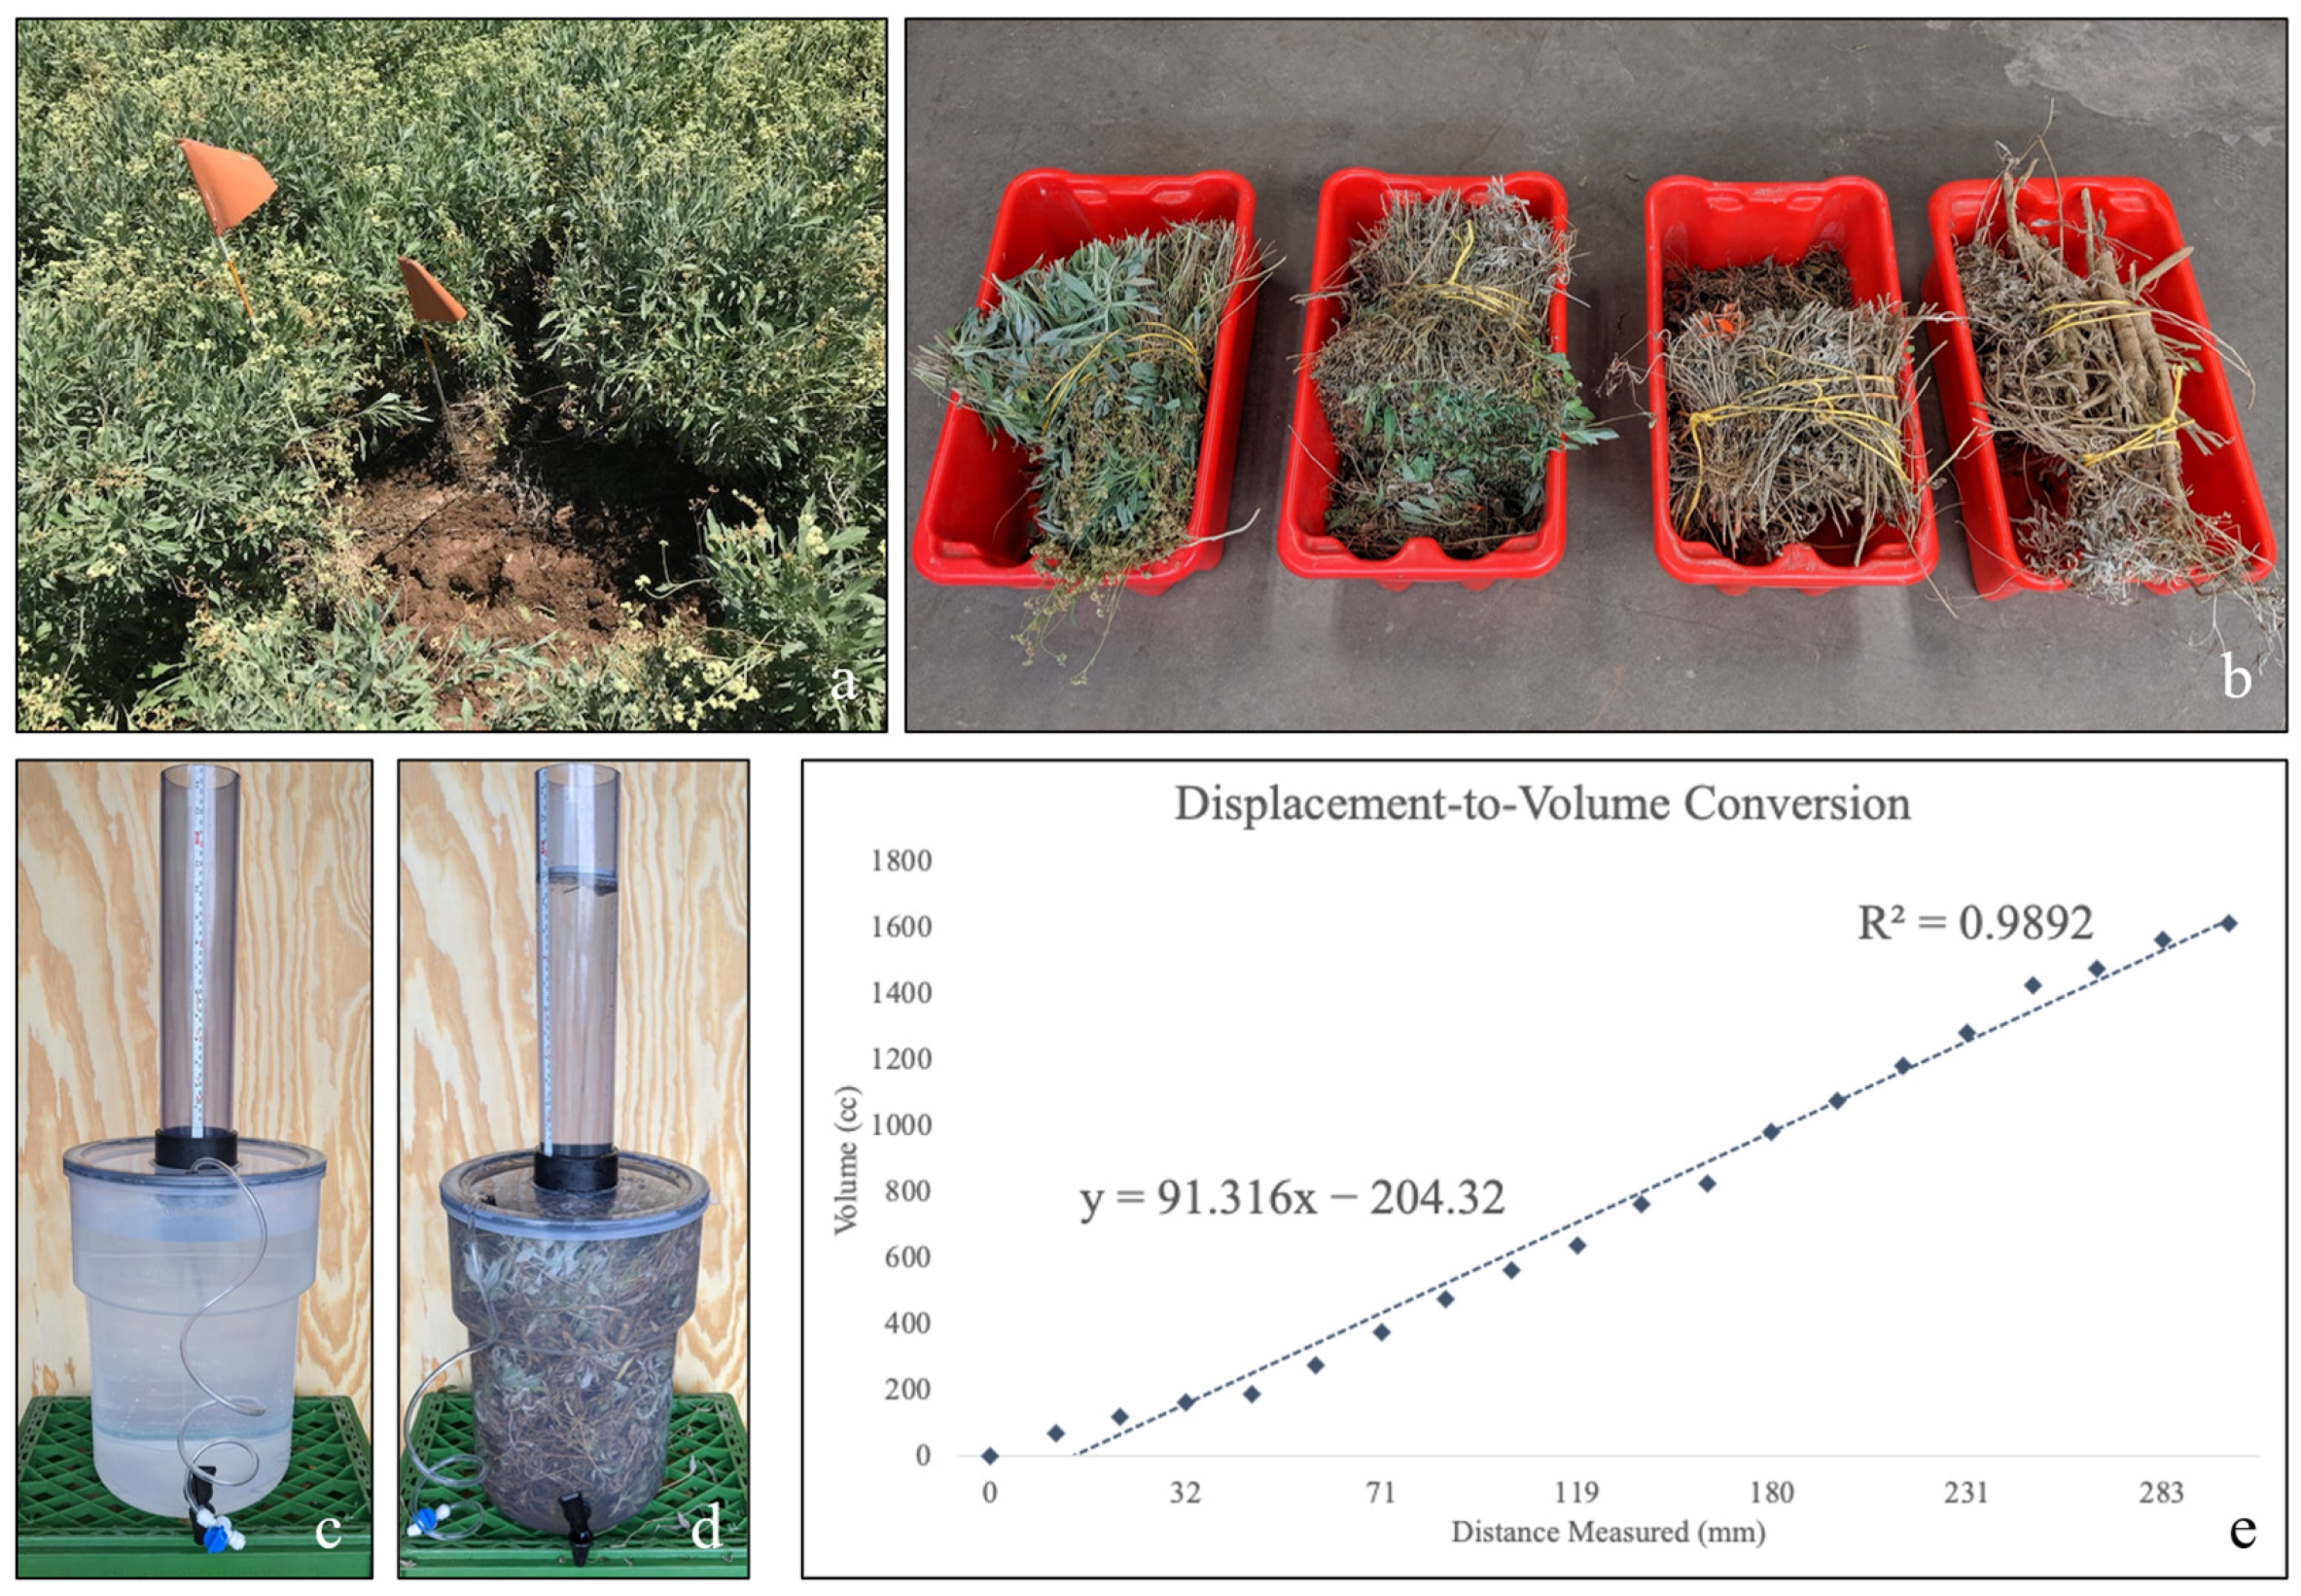
Plants were harvested at the soil level and promptly bound to preserve the relative height of each plant within the sample according to the alignment of the cuts (Figure 4a). Each bound sample was quartered vertically along the main stem based on the arithmetic average of the five CH measurements specific to each sample (Figure 4b), and fresh weights were recorded for each subsample (n = 36) in grams. To prevent water loss and its effect on fresh volume, each subsample was sealed in an airtight plastic bag and stored in a humidity-controlled refrigeration unit until volumetric measurement was performed.

2.5. Volumetric Measurements

Subsamples were individually immersed in a water displacement measurement chamber designed to estimate the volumetric contribution of all fresh plant material. Following immersion, the device was sealed and agitated for approximately two minutes to eliminate any air pockets that would otherwise falsely contribute to the volumetric measurements. Volume was recorded as the displacement of water in mm within a vertically-oriented, transparent PVC reducer following the addition of plant material (Figure 4c,d). Displacement was converted to volumetric terms using a simple calibration equation determined empirically and based on chamber design specifications (Figure 4e).
To estimate volumetric measurement chamber precision, an independent sample was collected from treatment A-50 for evaluation (Figure 1). The sample was segmented according to the process described above. The top section (i.e., Tier 1) was immersed in the chamber and its volume recorded. Without removing the subsample, but instead removing and preserving the original volume of water used to measure displacement, the process was repeated eight times to determine if air pockets or water losses greatly affected measurement variability. The test was repeated for the bottom section (Tier 4). These subsamples reflect the extremes of resource allocation wherein most flexible stems and green leaf material occur in Tier 1, while thick, woody stem material predominates Tier 4. Tiers 2 and 3 share qualities of both regions. We assumed issues with measurement precision (e.g., water losses or air pockets resulting in volume underestimation or overestimation, respectively) would most likely be present at the extremes of resource allocation (i.e., Tier 1 or Tier 4). Each iterative measurement was compared against the arithmetic mean of all nine measurements to compute root mean square error (RMSE) for both tiers, separately. Evaluation of the volumetric measurement chamber’s precision reported low variation between repeated measurements of the same subsample. Tier 1 reported an RMSE of 2243.853 cm3 (7.44% of the average measurement for Tier 1) and Tier 4 reported an RMSE of 309.751 cm3 (2.43% of the average measurement for Tier 4). Figure 10 in Section 3.2 depicts these error terms graphically.

2.6. Dry Weight Measurements

Following data collection for volumetric measurements, subsamples were placed in an outdoor covered tent to air dry for approximately two weeks. The subsamples were milled and a small portion of the homogenous material was oven dried at 110 °C for 24 h to derive the percentage of residual moisture. Total dry weight was extrapolated using air dried weight and residual moisture by the following equation:
Total Dry Weight = Air Dried Weight − (Air Dried Weight × Residual Moisture %)

2.7. RGB Image Processing

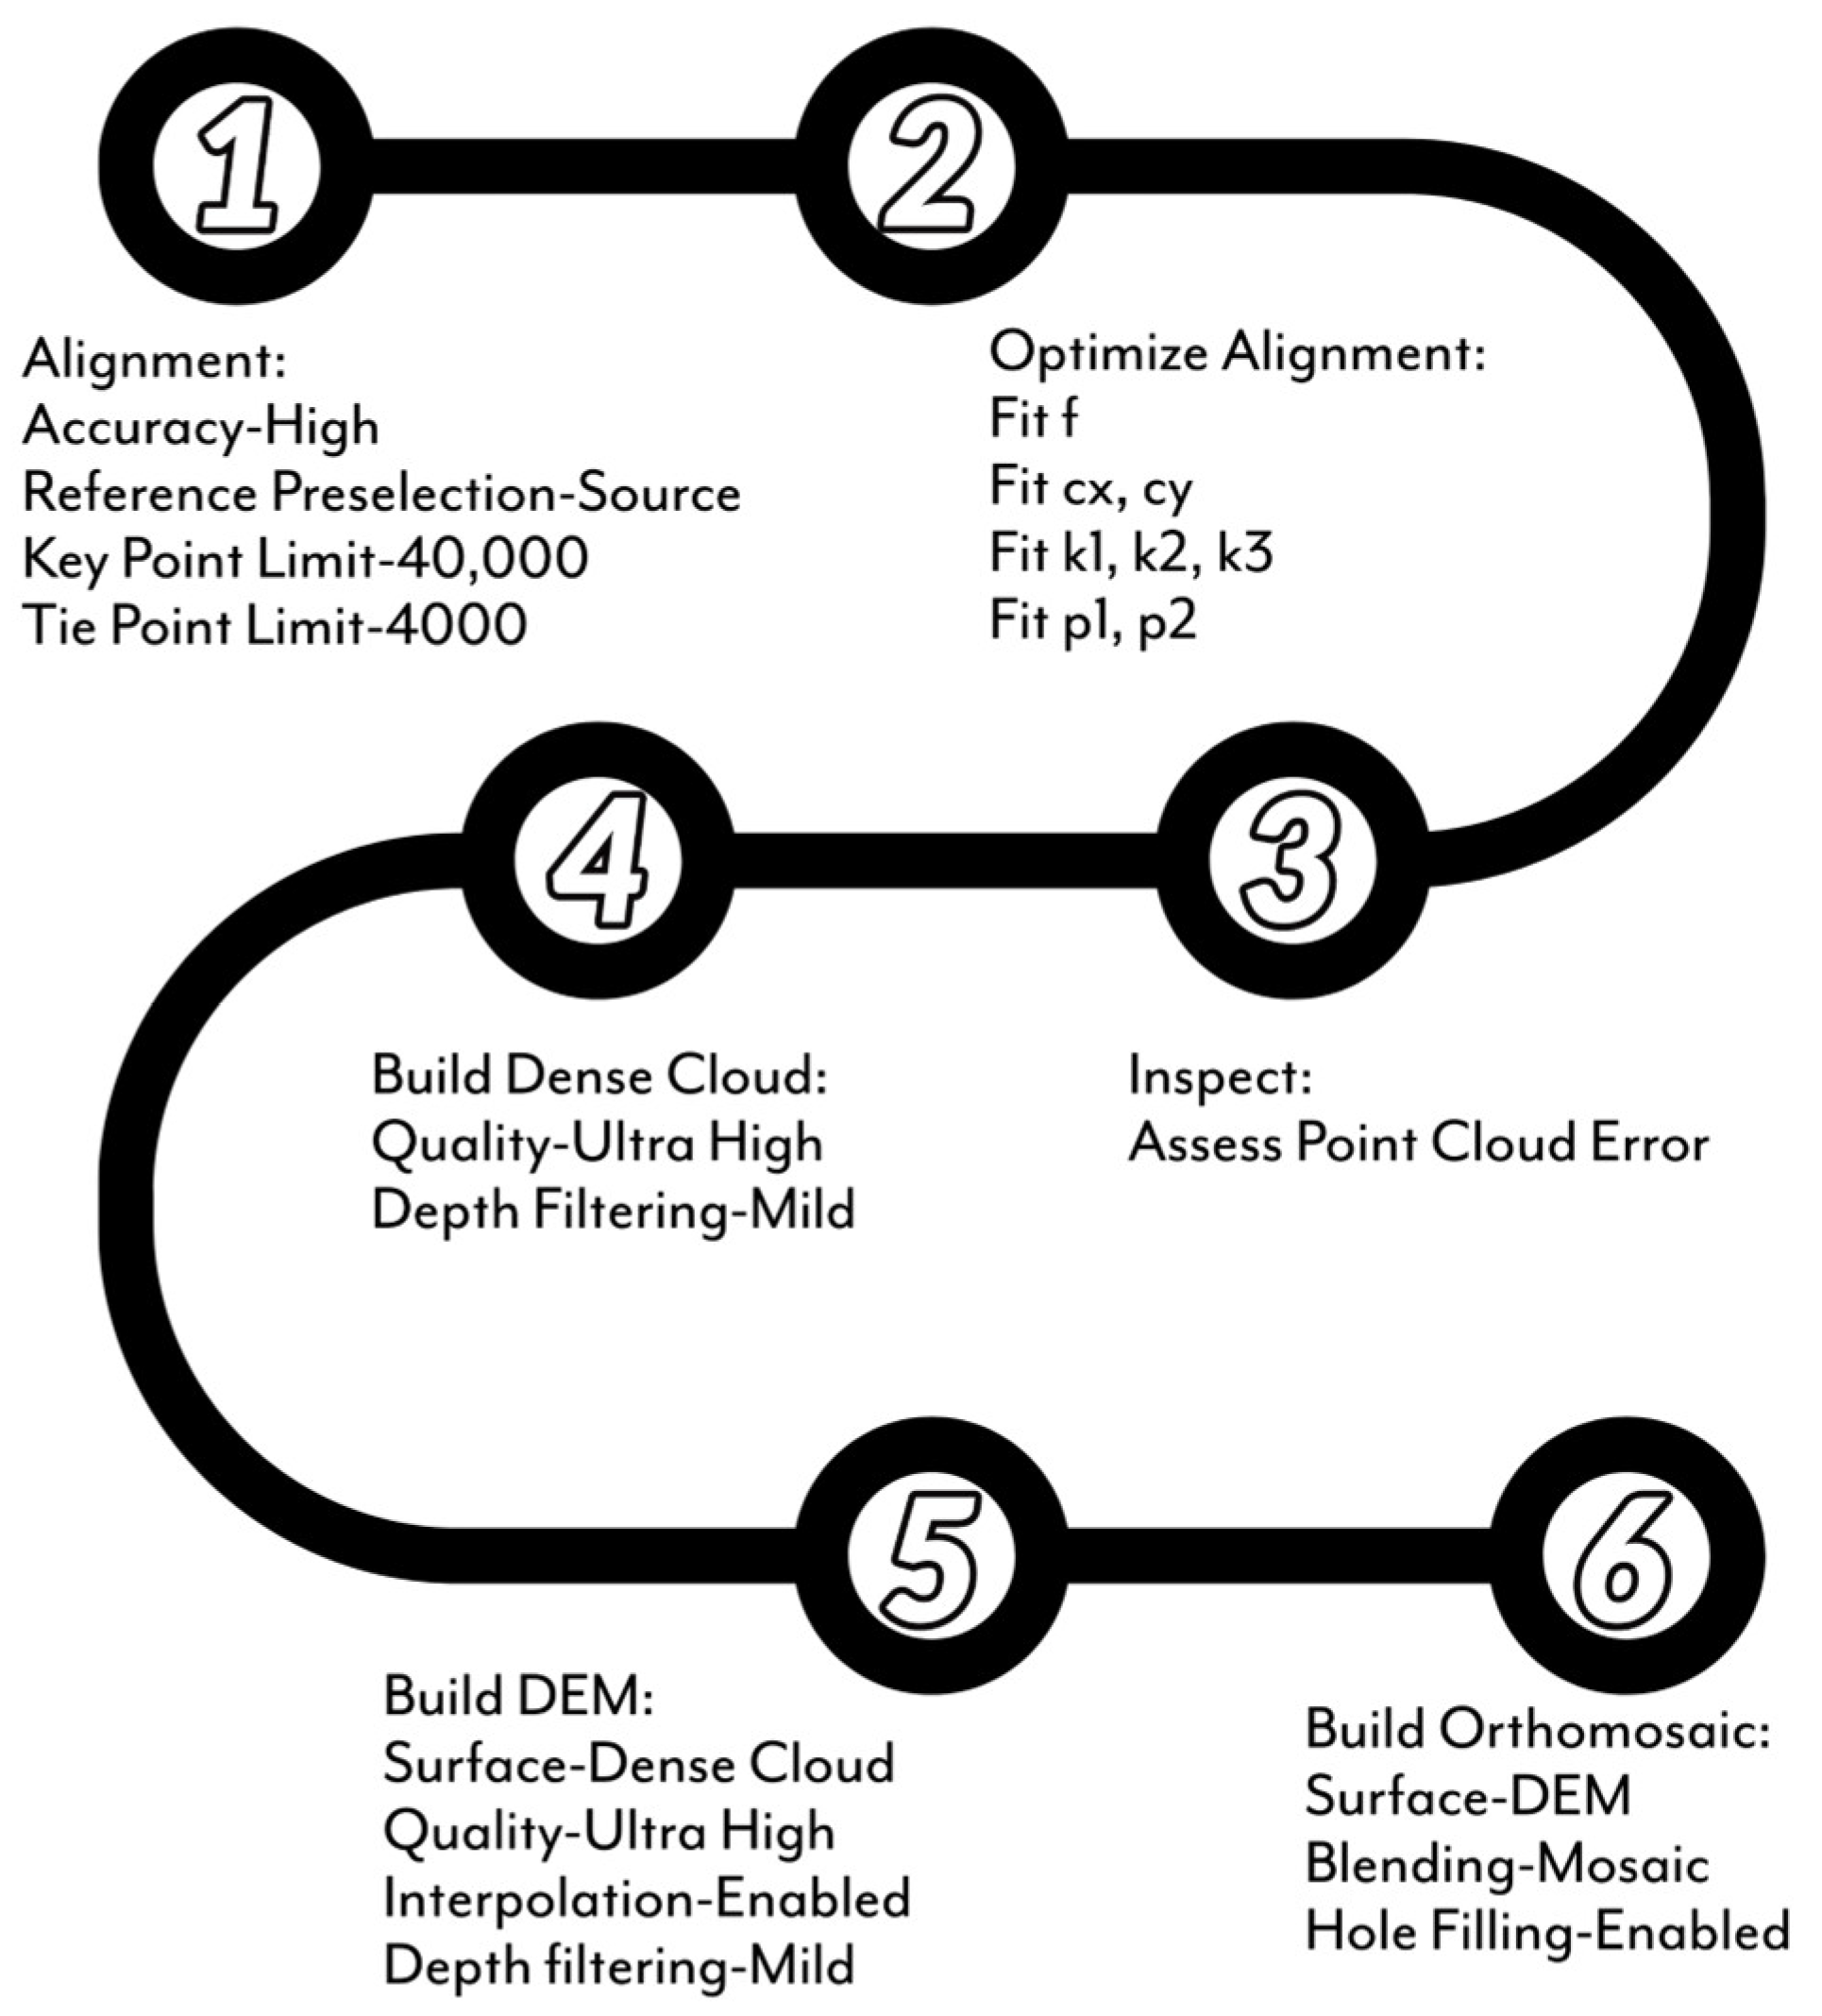
RGB imagery was collected using the optical sensor which is standard to the Phantom 4 UAS. Datasets ranged from 500 to 600 photos per mission using the flight parameters described in Figure 2a. RGB images were processed in Agisoft Metashape version 1.6. Images were assigned relative locations in 3D space by EXIF metadata attached to each image. To derive the digital surface model (DSM) and RGB orthomosaic used in resource allocation model development, images were subjected to a series of processing stages (Figure 5). Only those processing parameters which preserved original image quality were selected for this research (i.e., images were not resampled to coarser resolutions to expedite processing). The added processing time enables the finest spatial resolution of resultant products. High-accuracy image alignment and Agisoft’s recommended key and tie point limits provided in the User Manual were utilized [41]. Common points identified across proximally-related images were assigned Cartesian coordinates in 3D space, referred to as a sparse point cloud. A dense point cloud was generated using the sparse point cloud framework to identify a high volume of points related to the sparsely distributed points previously identified. The dense point cloud was inspected visually to ensure the surface model would not be affected by an abundance of misplaced points. Dense point clouds were used to generate both DSMs and RGB orthomosaics. Interpolation was selected as the method for achieving a closed, continuous model (i.e., converting points to a gapless surface). RGB orthomosaics and DSMs across all survey dates were resampled to a common resolution of 2 cm/pixel.

2.8. Multispectral Image Processing

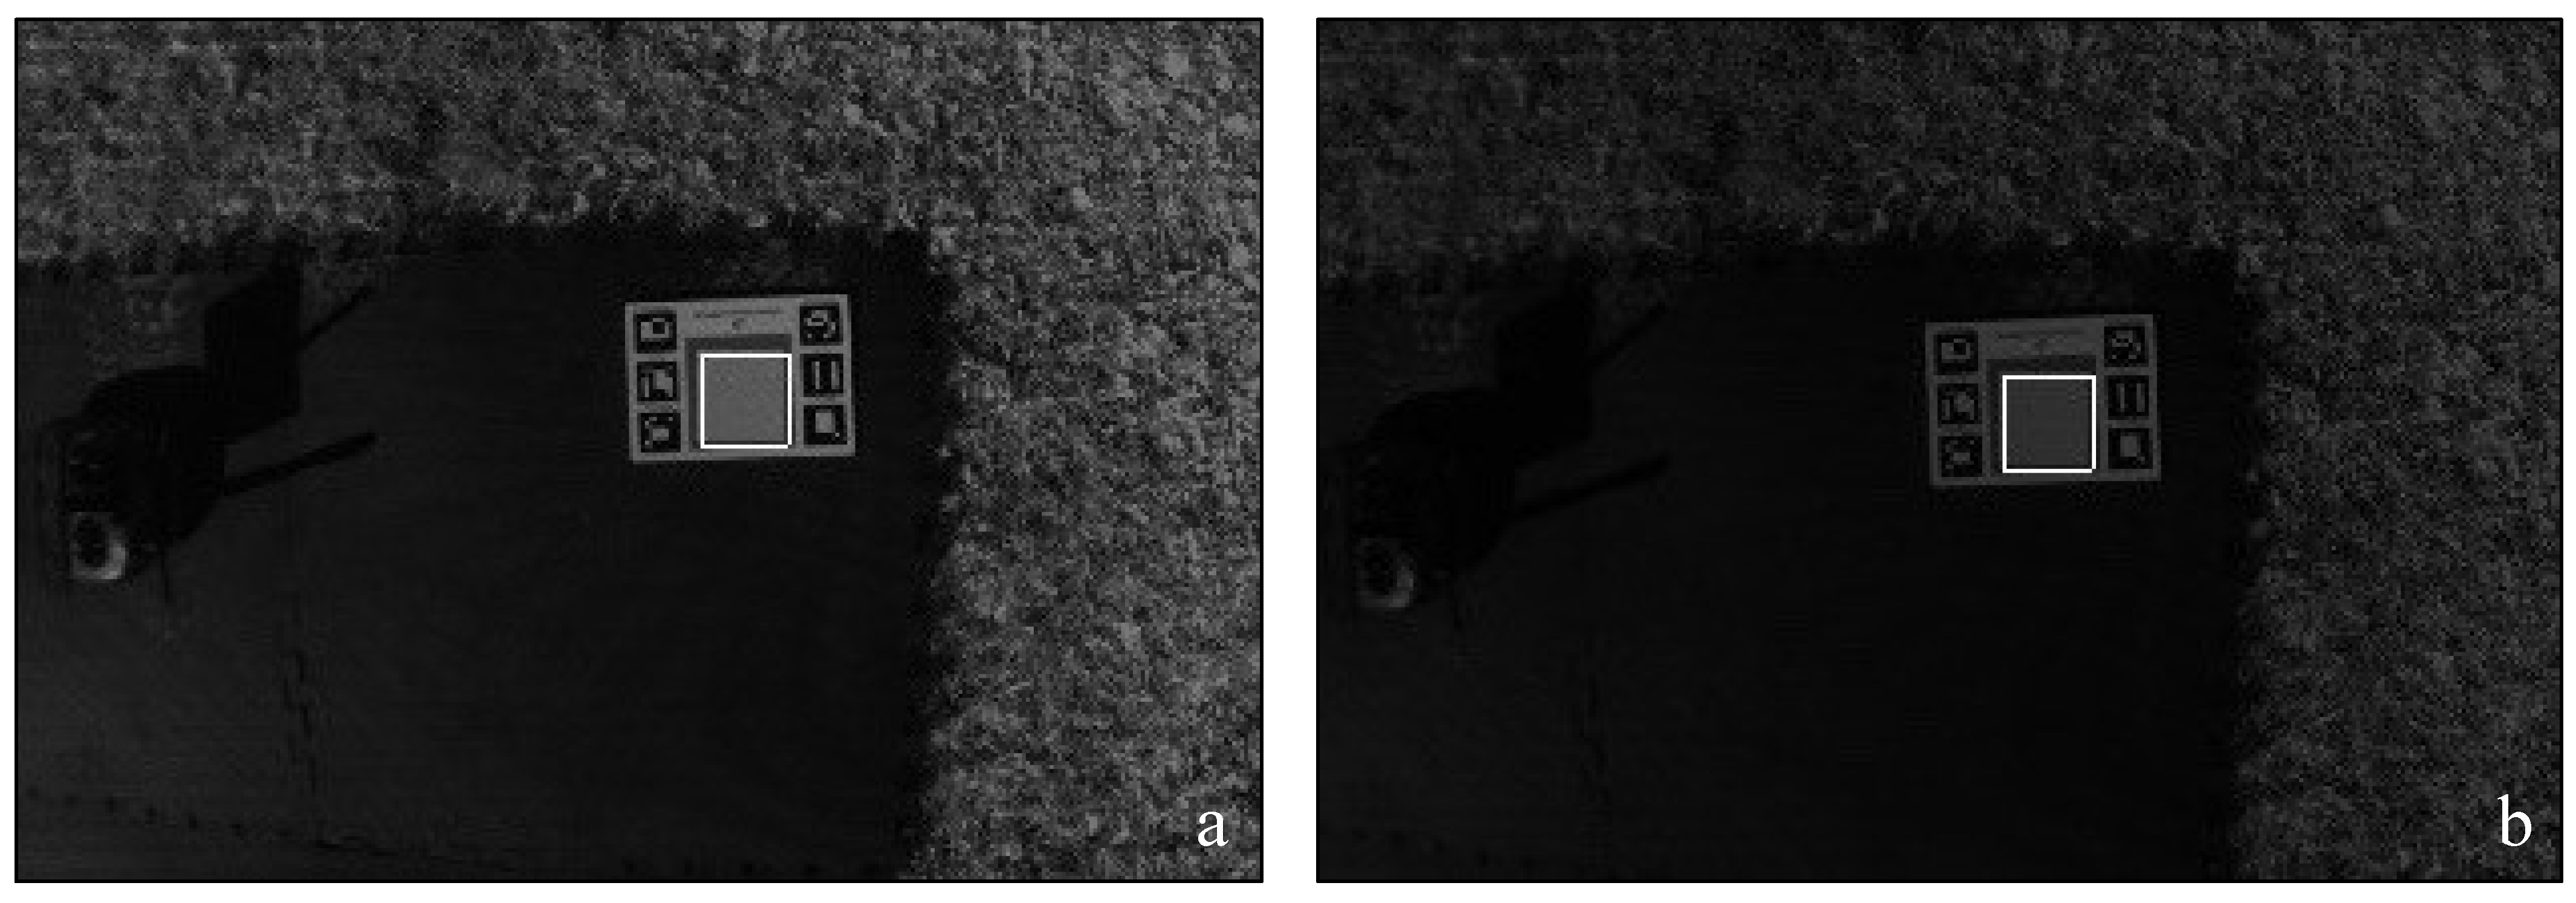
Multispectral flight campaigns yielded datasets of lower spatial resolution due to flight altitude and fixed-mount limitations. Multispectral images were visually inspected to remove blurred or superfluous coverage, resulting in a dataset of 15 images per survey for use in orthomosaic rendering (Figure 2b). Multispectral data were processed using the same procedures for processing RGB data, except for those steps needed to produce elevation models. Although the images were collected at 100 m AGL, the datasets were of sufficient spatial resolution to identify the same permanent, fixed features used to manually georeference the RGB data. Images were aligned, converted to point clouds, and orthorectified into a georeferenced mosaic. The orthomosaics were each radiometrically corrected using two calibration images from each campaign collected at the beginning and end of each flight to account for changes in ambient lighting (Figure 6). Images of an Airinov calibration target were manually cropped to identify only those pixels of known reflectance. The resultant radiometrically corrected orthomosaics were resampled to a common resolution of 10 cm/pixel and clipped to the same spatial extent as the RGB orthomosaics and elevation models.

2.9. Canopy Height Model

DSMs offer Z-axis information on surface height for each pixel in a raster dataset. However, a digital terrain model (DTM) describing the base elevation of the ground irrespective of any above-ground land features present (e.g., bare ground after vegetation removal) is required to produce a CH model (CHM). A DTM was not available for the ROI. Additionally, elevation information contained in the EXIF metadata was inadequate for placing the resultant orthomosaics at a consistent ground elevation across all field campaigns, with two scenes differing by as much as 100 m. To correct this, we manually tied images to eight permanent, fixed features identified within the ROI on Google Earth (Figure 1). Elevation at these eight positions was assigned from a UAS-derived DSM generated from a second, independent flight campaign conducted on 19 December 2019 (Table 1). While the global accuracy of this independent elevation data was not field-validated, its difference relative to the post-harvest (i.e., 23 December 2020) DSM with images tied to the same eight, fixed-elevation positions formed the basis for calculating changes in CH. Following the harvest, geolocation markers once resting on the top of the closed canopy at the four sample boundary corners fell to the ground level, directly below. The difference between pre-harvest (19 December 2019) and post-harvest (23 December 2019) DSMs was used to calculate localized CH information for the nine sampling locations subjected to total above-ground harvest between the two aerial surveys. The independent dataset from 19 December 2019 was not included in subsequent statistical analyses or resource allocation model development. All analysis-destined datasets were re-processed according to this georeferencing correction procedure.

2.10. Statistical Analyses

Multiple linear regression was performed on the field data for December 19, the only day for which harvest data were available. Predictors evaluated for the models under consideration included mean pixel NDVI, mean pixel CH, and a term representing the interaction of NDVI and CH. Mean NDVI and mean CH were calculated from only those raster pixels occurring within the defined sample boundaries. Categorical variables representing each of the four sample tiers were also included to allow for subsample-specific model predictions. Six samples, inclusive of all four tiers, were used to calibrate the models (n = 24). The remaining three samples (each consisting of four subsamples; n = 12) were used to evaluate model performance. Response variables considered under this framework included fresh weight (FW), dry weight (DW), fresh volume (FV), fresh-weight-density (FWD), and dry-weight-density (DWD). Models which omitted terms (i.e., nested models) for mean CH, mean NDVI, or their interaction were evaluated against each other and the full model for each response variable. The corrected Akaike Information Criterion (AICc) was used to rank and select models, as described in Huang et al., (2014) [42].
Assumptions of homoscedasticity for ordinary least squares (OLS) regression were violated in full (i.e., non-nested) models across all response variables, verified by visual inspection of the standardized residual plots. The violation was addressed according to the model selection protocol for heteroscedastic data outlined in Zuur et al., (2009) [43]. Generalized least squares (GLS) regression models weighted by the different variance-covariance structures were ranked for models based on each response variable, separately. Model performance for FW, DW, FV, and DWD did not improve after incorporating various variance-covariance structures. Incorporating variance structures in these models did not resolve residual heterogeneity, so we applied transformations to the response variables. A natural-log transformation on the response variables for FW, DW, and FV models improved heteroscedasticity in standardized residual plots; however, a reciprocal transformation of the response variable was required to improve heteroscedasticity for the DWD model. The resulting GLS models were subjected to backwards stepwise elimination to test all model terms for statistical significance (α = 0.05).
Sentinel-2 NDVI images were selected as the data source for scaling from UAS to satellite-borne data. Data for the ROI were available beginning in December 2018 and were analyzed through May 2020, at which point all guayule in the ROI were harvested. Pixels classified in the Scene Classification Quality Indicator band as types other than vegetated, bare ground, or soil were removed (filtered) from analysis (Figure 7b). Images were excluded if ≤25% of pixels remained over the ROI following the filtering process (Figure 7c,d).
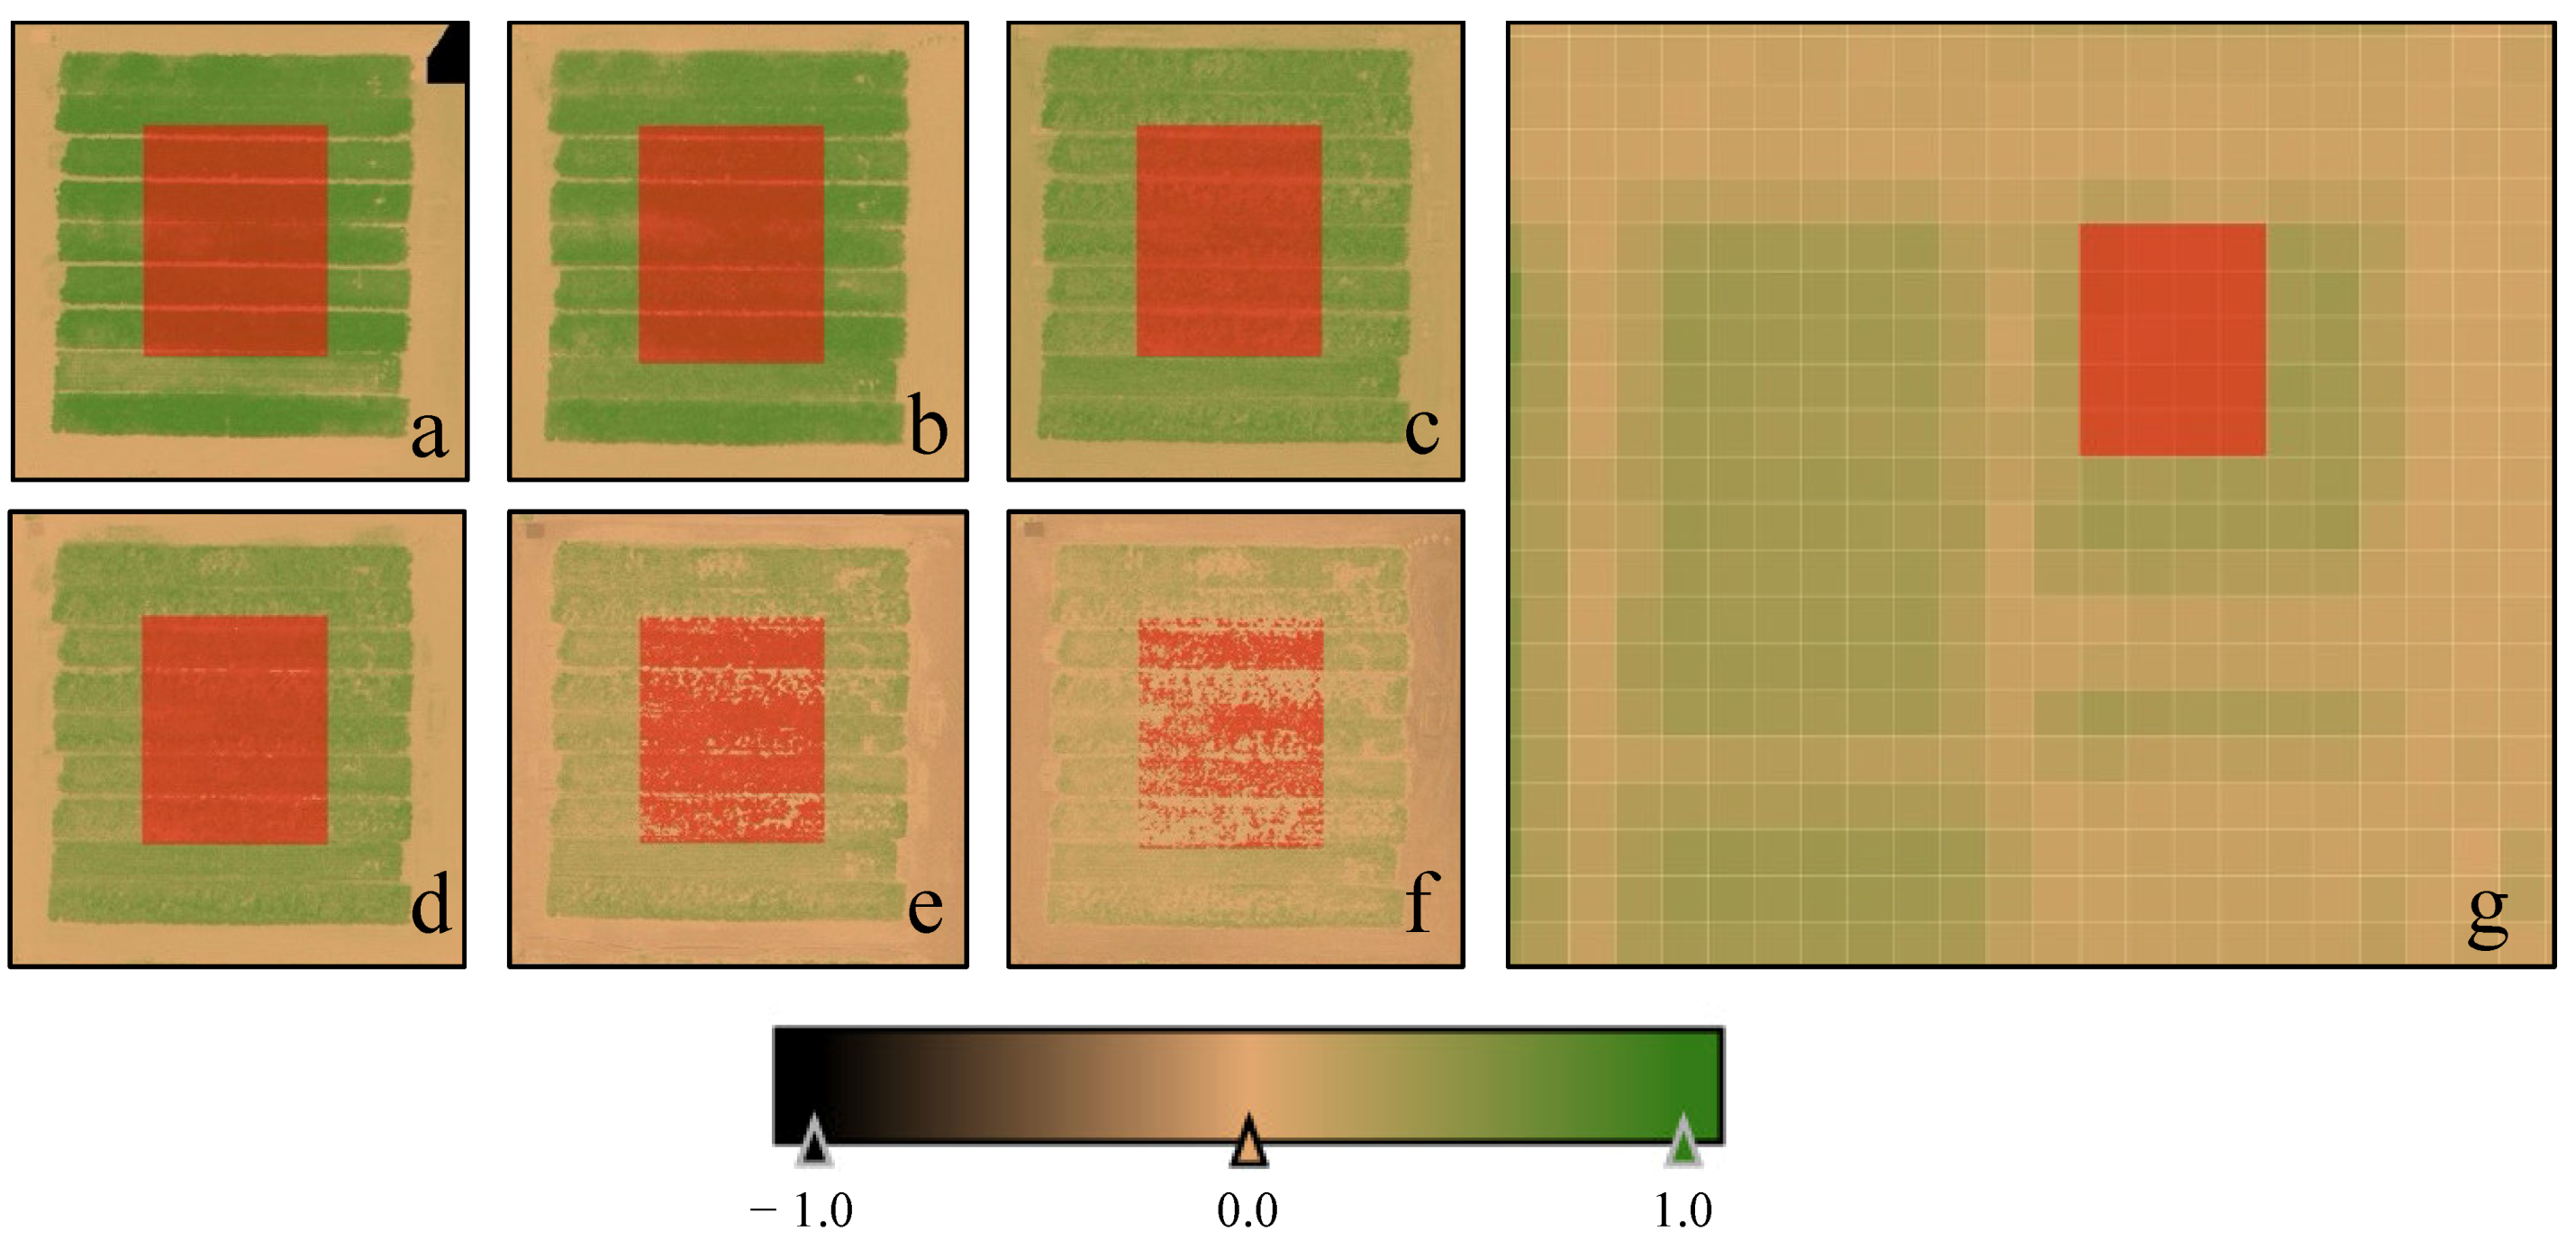
The rectangular vector polygon overlaying the east field of the ROI (hereafter: ROIE), approximately 50 m × 40 m, was used to delineate pixels spanning several irrigation treatments for comparison between the 19 December 2019, UAS NDVI raster and corresponding Sentinel-2 data (Figure 8). The Sentinel-2 image both nearest in time to each UAS survey and free from cloud and aerosol effects was selected for use in this analysis. Differences in collection date between UAS imagery and the corresponding Sentinel-2 overpass were never greater than the Sentinel-2 twin-sensor revisit time of 5 days.
For the December UAS and Sentinel-2 imagery, the Sentinel-2 grid was used to construct 20 contiguous 10 m polygons (50 × 40 m total; Figure 9a; hereafter ROIE-20). These 20 polygons allowed for inspection of model performance at medium spatial resolutions (i.e., 10 m/pixel) for the month harvest data were used to build the model (i.e., December). For Sentinel-2 data from 16 December 2019—the overpass date closest to the 19 December 2019, UAS survey—individual pixel values (i.e., 1 pixel/polygon) were substituted into the FWDNDVI model to generate FWD estimates. ROIE-20 was applied a second time to the 19 December 2019, UAS raster data to yield approximately 10,000 pixels at a spatial resolution of 10 cm/pixel for each of the 20 polygons (Figure 9b). All pixels within each polygon were averaged and substituted into the FWDNDVI model for comparison against Sentinel-2 data. ROIE-20 was applied a third time to the 19 December 2019, UAS raster with the added constraint of masking out any pixels identified as soil (Figure 9c). NDVI pixel values approaching 0 typically correspond to soils; however, various environmental factors (e.g., soil moisture content) can influence scene-to-scene differences in soil NDVI. Iterative attempts to converge on a soil masking threshold sensitive to soil conditions across all UAS survey dates resulted in NDVIsoil of 0.15. Pixels at or below this threshold were excluded from analysis to produce a third round of FWD predictions more closely aligned with the soil-exclusive data used to build the FWDNDVI model. MAPE, RMSE, and Pearson’s correlation coefficient were used to evaluate performance across Sentinel-2 data, soil-inclusive UAS data, and soil-exclusive UAS data.
For all other UAS surveys and corresponding Sentinel-2 data collected between August 2019 and February 2020, a single FWDNDVI model prediction was made for the entire ROIE (i.e., the original 50 m × 40 m region; Figure 8) to illustrate the influence of soil pixels on model predictions across time as soil visibility changes with phenology. FWD predictions made with Sentinel-2 data, soil-inclusive UAS data, and soil-exclusive UAS data were compared by MAPE and RMSE.

3. Results

3.1. Geospatial Error

Radial RMSE of RGB imagery collected using the Phantom 4 optical sensor ranged from 1.4–2.9 cm for dates with available data when compared against the 19 December 2019, reference dataset (Table 1 and Table 2). Because of the coarser spatial resolution, the radial error of multispectral imagery was higher, with a range of 10.1–21.4 cm.
Vertical error assessment in the DSM was limited due to the availability of ground-truth data on 19 December 2019, the only date for which elevation AGL was measured at each of the 36 harvest boundary markers (Figure 1). Since guayule crops are grown on the ridges of a ridge-and-furrow system and boundary markers were placed on the closed canopy (pre-harvest) directly above furrow regions, it was important to account for the influence of ridge height in defining canopy elevation AGL. To explore these effects, AGL was recorded to reflect CH both including and excluding the height contributed by the ridge. Contrary to our predictions, adjusting CH to remove ridge height contributions resulted in a more than two-fold increase in RMSEz (15.8 cm) when compared to unadjusted CH (RMSEz = 5.9 cm).

3.2. Crop Productivity Measurements

Data were first visualized in a stacked bar plot to screen for outliers or trends in crop performance under varying irrigation treatments. Figure 10 graphically depicts a strong correlation between volume and either fresh weight (r = 0.99, t = 33.43, df = 34, p-value < 0.001) or dry weight (r = 0.98, t = 31.42, df = 34, p-value < 0.0001) for each tier. This relationship holds true for each subsample except for Tier 1 from treatment E-75 (Figure 1), where volume appears overestimated, indicative of a possible outlier. For the FWD full model (inclusive of a variance structure), Tier 1 of E-75 reported a percentage error of 57.49% between the in situ measurement and model output. Data collection field notes for the E-75 Tier 1 subsample indicate the volumetric measurement had to be repeated, either due to equipment failure and/or user error. Due to the challenges associated with re-measuring samples following an initial volumetric chamber immersion and its impact on fresh harvest volume, inflated measurement error for Tier 1 of E-75 is highly likely.

3.3. UAS Model Selection and Performance

Following the selection of an appropriate variance structure (described in Section 2.10), a backwards stepwise elimination approach for identifying statistically significant terms in each of the FW, DW, FV, FWD, and DWD models was performed (Table 3).
The FWD model incorporating the power variance-covariance structure was the only model to report all terms as statistically significant. The full model predicting FWD and incorporating a power variance-covariance structure based on the interaction between NDVI and CH terms reported a lower AICc and satisfactory standardized residuals when compared to its full model counterpart lacking a variance structure.
For natural-log-transformed FW, DW, and FV models, only CH and tier terms were significant. Only the tier term was significant in the reciprocal-transformed DWD model; thus, further consideration of its prediction performance was not pursued.
The FWD model inclusive of a statistically significant NDVI term was selected for evaluating model scaling to spaceborne data due to the relative abundance of satellite multispectral data and lack of available satellite surface model data at similar spatial resolutions. CH and interaction terms were first removed and the Zuur et al., (2009) protocol was reapplied to examine a model based on only NDVI and tier terms [43]. Assumptions of homoscedasticity were satisfied under the OLS model (i.e., hereafter: FWDNDVI) by visual inspection of the standardized residuals. Pearson’s correlation coefficient between the predictions made by full the FWD and the reduced FWDNDVI models was reported at 0.91 (t = 6.56, df = 9, p-value < 0.001).
Performance of best-fit FW, DW, FV, and FWD models were evaluated against each other by comparing the mean absolute percentage error (MAPE) between field measurements and model predictions. RMSE was also calculated, but these error terms only permit direct comparison between models which share the same response units. FW, DW, and FV models (i.e., inclusive of mean CH and tier terms only) reported MAPEs of 21.66% (RMSE = 458.94 g), 23.32% (RMSE = 305.40 g), and 28.03% (RMSE = 15,128.42 cc), respectively. By comparison, the full FWD model (i.e., inclusive of power variance-covariance structure as well as mean NDVI, mean CH, interaction, and tier terms) reported a MAPE of 13.25% (RMSE = 8.26 × 10⁻³ g/cc). MAPE for the full FWD model was further reduced to 9.23% (RMSE = 6.23 × 10⁻³ g/cc) by excluding the questionable Tier 1 E-75 data point. Based on these results, the best-performing model (i.e., the model reporting the lowest MAPE) of those considered was the full FWD model, defined by the following equation (also provided in Table 3):
FWD = 0.2131 − 0.1769 × HeightAVG − 0.3905 × NDVIAVG + 0.0066 × Tier2 + 0.0116 × Tier3 + 0.0158 × Tier4 + 0.4134 × NDVI:Height

3.4. Scaled Model Performance

The reduced FWDNDVI model used in assessing model scaling potential was defined by the following equation:
FWDNDVI = 0.0531 − 0.0107 × NDVIAVG + 0.0052 × Tier2 + 0.0116 × Tier3 + 0.0166 × Tier4
Using UAS-derived soil-exclusive (i.e., vegetation only) data as a reference, Sentinel-2 and UAS-derived soil-inclusive data were compared to illustrate FWDNDVI model performance for a medium resolution data source and across a range of environmental conditions (i.e., crop phenology as it relates to nadir soil visibility). Between soil-inclusive and soil-exclusive UAS data for 19 December 2019, MAPE was reported at 0.02% with an RMSE of 1.7 × 10⁻⁵ g/cc and R = 0.99. Due to high similarity between soil-inclusive and soil-exclusive model predictions for December 19, soil-inclusive model predictions were compared against Sentinel-2 model predictions. MAPE for the comparison between soil-inclusive and Sentinel-2 FWDNDVI model outputs was reported at 2.31% with a RMSE of 1.3 × 10⁻³ g/cc and a R = 0.70. The combined error (across all dates of comparison) between Sentinel-based FWDNDVI predictions and soil-inclusive FWDNDVI predictions was also low (MAPE = 2.15%; RMSE = 1.5 × 10⁻³ g/cc). A modest reduction in MAPE to 1.84% and RMSE to 1.2 × 10⁻³ g/cc was noted between predictions made with Sentinel-2 data versus soil-exclusive UAS data. Once again, combined error across all dates of comparison between soil-inclusive and soil-exclusive FWDNDVI(UAS) model predictions was low (MAPE = 0.32%; RMSE = 3.5 × 10⁻⁴ g/cc).

4. Discussion

Our study used UAS multispectral and SfM data to develop models capable of estimating resource allocation in guayule crops across variable growing conditions. We iteratively evaluated multiple explanatory variables to optimize model selection for various indicators of crop productivity, which we successfully scaled up to coarser, freely available satellite imagery. We revealed two particularly important crop modeling considerations: (1) the potential for integrating UAS-derived spectral and structural data to improve models and support monitoring of crop production and (2) the value and efficacy of scaling from UAS to satellite data for monitoring larger management areas, a current limitation with UAS technology.
Spatial accuracy is critical to minimizing error in inter-scene comparisons. While absolute (i.e., global) accuracy was not important in the current study, high scene-to-scene (relative) accuracy was needed to ensure misalignments did not contribute substantially to our error analysis. As expected, lower radial error was observed across all RGB orthomosaics when compared to multispectral orthomosaics, which is attributable in part to the differing spatial resolutions between these data types (i.e., 2 cm vs. 10 cm, respectively). Although higher error was observed for the UAS multispectral data collected on 19 December 2019 (RMSE = 21.4 cm), this error did not directly affect the quality of the derived models because pixels corresponding to the harvest boundary markers were manually isolated and extracted for each treatment. Additionally, the influence of spatial error on the DSMs and multispectral orthomosaics was effectively reduced during aggregation to the coarser resolution used in the scaled-up models. While radial accuracy plays important roles in time series analyses and other research which prioritizes spatial accuracy, local radial accuracy at the observed magnitude is of lesser importance to this research.
High vertical accuracy, however, is critical to identifying subtle height differences between treatments or samples. An RMSEz of 15.8 cm (Table 2) for the “ridge-less” CH estimation aggregated across an entire square meter of plant material could, for example, misrepresent plant volume by thousands of cubic centimeters. Despite our efforts to minimize the contribution of ridge height to canopy elevation AGL, by including the ridge, we reduced vertical error (RMSE = 5.9 cm) when compared to the adjusted, ridge-less height. We attribute this observation in part to harvest boundary markers falling (post-harvest) to ridge slope locations rather than the lowest point of furrow depressions where measurements occurred. Variable marker placement could inflate RMSE if some markers rest flatly in the furrow depression, while others rest at locations along the ridge slope which are inconsistent within and across samples. Furthermore, it is possible plant debris (e.g., stems and leaves) prevented markers from establishing direct contact with the lowest point between ridges where measurements were taken. The added “correction” measurements also serve as opportunities for propagating additional error due to the nature of correcting one visual observation with another of the same accuracy and precision.
We recommend exploring current advances in GPS and optical sensor resolution, coupled with best practices in mission design, for minimizing geospatial errors and time spent pre-processing poorly georeferenced data. Our geolocation errors were consistent with those observed in Padró et al., (2019) for GCP-corrected data. We recommend using a UAS equipped with a real time kinematic (RTK) or post processed kinematic (PPK) GPS to minimize spatial error [44], the use of which is described and substantiated by Losè et al., (2020) [45]. Properly characterizing the geospatial accuracy of these aircraft systems and the level of allowable uncertainty from the outset enables optimized survey design and execution while also streamlining data processing workflows [46].
Drip treatments were evaluated by sampling a square meter of plant material from nine locations. Using the common sampling practice of placing a quadrat within a treatment and removing all plants occurring within its perimeter fails to address the variation in crop spacing which manifests as inconsistent numbers of individual plants between samples. Still further, the issue of external, adjacent plants influencing within-quadrat crops under closed canopy conditions warrants some consideration under the sampling protocols employed here.
These challenges form the basis for supporting a productivity metric, and ultimately a model, based on density, which renders the sampling footprint irrelevant. When the productivity metric no longer depends on sampling consistency, we begin to see the advantage in using density to draw conclusions about crop performance. Plant material density is expected to vary according to phenology, maturity, resource stress, and location within the vertical profile of the plant, all of which have the potential to influence the ratio of bark-to-wood and other resource allocation metrics, as well as permitting comparisons across time for supporting management decisions [9,47]. The implications of a productivity metric based on density are further supported by the findings of Veatch-Blohmet et al., (2006). The authors demonstrate the importance of inducing crop water stress to reduce leaf biomass and stem diameter for the purposes of increasing bark surface area, where rubber resides [8]. A density metric, which incorporates both crop biomass and volume information, is likely to capture crop responses to water stress in at least one of the two measurement domains. However, future research should further explore the value of a density metric with an approach which examines the distinct contributions made by the various structural constituents of a guayule plant.
AICc rewards model parsimony and adds a penalty for increasing the number of model parameters [48]. Additional research is needed to better understand the inferior performance of a DWD model incorporating both NDVI and CH parameters, as indicated by AICc for full and reduced models. Similarly, FW, DW, and FV model selection favored models without NDVI or interaction terms, suggesting CH may more strongly influence these productivity metrics. However, alternative selections for the VI used, approaches to minimizing vertical error in SfM surface models, and their combined effects on model performance should be evaluated in future work.
In the context of existing research, the performance of the FWD model (MAPE = 9.23%) rivals the deep learning approach taken by Nevavuori et al., (2019) to predict crop yield from remotely sensed RGB and NDVI. The authors reported MAPEs between 8.8% and 12.6% for hectare-scale measurements of biomass, depending on the growth stage of the crop [49]. However, several other studies report MAPEs for image-derived yield estimation (i.e., hectare-scale biomass) below 7%, suggesting room for improvement in our modeling approach [50,51].
UAS-derived soil-inclusive and soil-exclusive predictions made by the FWDNDVI model reported little disagreement for the December survey. The findings were confirmed by a low MAPE and strong Pearson’s correlation coefficient between these predictions. This occurs because fewer pixels are excluded from zonal statistics under closed canopy conditions. Reduced model prediction agreement between UAS and Sentinel-2 data for the same time period likely results from differences in sensor performance, as indicated by an increased MAPE and reduced Pearson’s correlation coefficient.
The strong agreement between UAS-derived soil-inclusive and soil-exclusive model predictions degraded only slightly across the full range of UAS surveys. When comparing Sentinel-2 data against UAS soil-inclusive and soil-exclusive predictions, separately, removing soil pixels resulted in a modest improvement in agreement between satellite and UAS estimates. This observation was unexpected considering our inability to remove soil pixels from Sentinel-2 data. These findings further suggest differences between UAS and Sentinel-2 sensor specifications and performance impact model predictions more strongly than soil visibility under the conditions examined.
While mean Sentinel-2 NDVI (derived from the Level-2A analysis-ready product) was higher than mean UAS NDVI (soil-inclusive or soil-exclusive) for all surveys, further research is needed to characterize the performance of UAS and satellite sensors for the purposes of data harmonization. Huang et al., (2021) pointed out that bandwidth, spatial resolution, and data processing procedures can each impact the reported NDVI, especially atmospheric correction, which generally has the effect of increasing the value of NDVI [52]. The systematic overestimation of NDVI with Sentinel-2 when compared to either UAS datasets suggests broader differences in design and performance between the sensors compared; Franzini et al., (2019) observed the opposite phenomenon, where UAS NDVI derived from a Parrot Sequoia multispectral sensor was consistently higher than Sentinel-2 NDVI for the same region [53]. These disparate outcomes warrant further investigation.
Masking the UAS data to remove pixels below a threshold of 0.15 NDVI raised NDVI in winter months when compared to unmasked (i.e., soil-inclusive) data. This is expected due to the increasing influence of soil pixels on mean NDVI as the canopies recede during periods of dormancy. Setting a higher or lower threshold would affect the performance of the model, but we used a threshold of 0.15 to illustrate the potential challenges for developing models desensitized to variable soil visibility. Higher thresholds could be selected to better separate treatments from adjacent ridges (i.e., soil between treatments) in productive months at the expense of potentially removing dormant guayule pixels exhibiting lower NDVI in winter months. Future work should include the establishment of a dynamic masking threshold, which reflects changes in canopy cover across the growing season.

5. Conclusions

UAS-derived NDVI and SfM products can be integrated to model resource allocation in guayule, particularly FWD distribution along the crop’s vertical profile. Given the derived relationship between biomass or volume and density, and prior research demonstrating the relationships between rubber content and biomass or morphological traits, future work should investigate the relationship between plant material density versus morphology (i.e., material type as leaves, stems, etc.) and density as it directly relates to rubber content. Efforts to scale UAS-derived estimates of FWD to medium resolution satellite imagery suggested strong potential for successful outcomes, but increased sensor harmonization would likely improve these estimates.

6. Patents

T.P.C. and K.D. are currently pursuing patent rights for the volumetric measurement device described in Section 2, of which they are the sole contributors to its development.

Author Contributions

T.P.C. and K.D. were responsible for securing and allocating funds in support of this project. T.P.C., K.D. and D.D. each contributed to the experimental design and development of data collection protocols. D.D. also directed staff at the Bridgestone Guayule Research Farm to assist with field harvests and sample preparation. A.B.-M. and C.J.J. provided support in data analyses and in the use of Python, R, and GIS platforms. T.P.C. conducted UAS flights, post-harvest measurements, and data analyses and prepared the manuscript. C.J.J. and D.D. reviewed and edited the manuscript. K.D. provided necessary project supervision and consultation at each stage. All authors have read and agreed to the published version of the manuscript.

Funding

T.P.C. would like to acknowledge the Institute for Energy Solutions at the University of Arizona for providing Summer Graduate Fellowship (2019) funding which supported travel and equipment expenses. This research was further supported by NASA Grant no. 80NSSC18K0617 (K.D., PI), NASA Grant no. 80NSSC21K1516 (K.D., PI), and by Sustainable Bioeconomy for Arid Regions (SBAR) USDA National Institute of Food and Agriculture (NIFA) Grant no. 2017-68005-26867.

Data Availability Statement

Data supporting the reported results are available upon request.

Acknowledgments

We would like to thank the entire staff at the Bridgestone Guayule Research Farm for their assistance in getting crops harvested and prepared for analysis.

Conflicts of Interest

The authors declare no conflict of interest.

References

  1. Daponte, P.; De Vito, L.; Glielmo, L.; Iannelli, L.; Liuzza, D.; Picariello, F.; Silano, G. A Review on the Use of Drones for Precision Agriculture. IOP Conf. Ser. Earth Environ. Sci. 2019, 275, 012022. [Google Scholar] [CrossRef]
  2. Spalević, Ž.; Ilić, M.; Savija, V. The Use of Drones in Agriculture: ICT Policy, Legal and Economical Aspects. Ekonomika 2018, 64, 93–107. [Google Scholar] [CrossRef] [Green Version]
  3. Rasutis, D.; Soratana, K.; McMahan, C.; Landis, A.E. A Sustainability Review of Domestic Rubber from the Guayule Plant. Ind. Crops Prod. 2015, 70, 383–394. [Google Scholar] [CrossRef]
  4. Ilut, D.C.; Sanchez, P.L.; Coffelt, T.A.; Dyer, J.M.; Jenks, M.A.; Gore, M.A. A Century of Guayule: Comprehensive Genetic Characterization of the US National Guayule (Parthenium Argentatum A. Gray) Germplasm Collection. Ind. Crops Prod. 2017, 109, 300–309. [Google Scholar] [CrossRef]
  5. van Beilen, J.B.; Poirier, Y. Guayule and Russian Dandelion as Alternative Sources of Natural Rubber. Crit. Rev. Biotechnol. 2007, 27, 217–231. [Google Scholar] [CrossRef]
  6. Foster, M.A.; Coffelt, T.A. Guayule Agronomics: Establishment, Irrigated Production, and Weed Control. Ind. Crops Prod. 2005, 22, 27–40. [Google Scholar] [CrossRef]
  7. Estilai, A.; Ehdaie, B.; Naqvi, H.H.; Dierig, D.A.; Ray, D.T.; Thomson, A.E. Correlations and Path Analyses of Agronomic Traits in Guayule. Crop Sci. 1992, 32, 953–957. [Google Scholar] [CrossRef]
  8. Veatch-Blohm, M.E.; Ray, D.T.; McCloskey, W.B. Water-Stress-Induced Changes in Resin and Rubber Concentration and Distribution in Greenhouse-Grown Guayule. Agron. J. 2006, 98, 766–773. [Google Scholar] [CrossRef]
  9. Dierig, D.A.; Thompson, A.E.; Ray, D.T. Relationship of Morphological Variables to Rubber Production in Guayule. Euphytica 1989, 44, 259–264. [Google Scholar] [CrossRef]
  10. Kuruvadi, S.; Jasso Cantu, D.; Angulo-Sanchez, J.L. Rubber Content in Different Plant Parts and Tissues of Mexican Guayule Shrubs. Ind. Crops Prod. 1997, 7, 19–25. [Google Scholar] [CrossRef]
  11. Catchpole, W.R.; Wheeler, C.J. Estimating Plant Biomass: A Review of Techniques. Aust. J. Ecol. 1992, 17, 121–131. [Google Scholar] [CrossRef]
  12. Zhao, D.; Glaz, B.; Edme, S.; Del Blanco, I. Precision of Sugarcane Biomass Estimates in Pot Studies Using Fresh and Dry Weights. J. Am. Soc. Sugar Cane Technol. 2010, 30, 37. [Google Scholar]
  13. de Carvalho, E.X.; Menezes, R.S.C.; de Sá Barreto Sampaio, E.V.; Neto, D.E.S.; Tabosa, J.N.; de Oliveira, L.R.; Simões, A.L.; Sales, A.T. Allometric Equations to Estimate Sugarcane Aboveground Biomass. Sugar Tech 2019, 21, 1039–1044. [Google Scholar] [CrossRef]
  14. Kuyah, S.; Dietz, J.; Muthuri, C.; Jamnadass, R.; Mwangi, P.; Coe, R.; Neufeldt, H. Allometric Equations for Estimating Biomass in Agricultural Landscapes: I. Aboveground Biomass. Agric. Ecosyst. Environ. 2012, 158, 216–224. [Google Scholar] [CrossRef]
  15. Murray, R.B.; Jacobson, M.Q. An Evaluation of Dimension Analysis for Predicting Shrub Biomass. J. Range Manag. 1982, 35, 451. [Google Scholar] [CrossRef]
  16. Kumar, L.; Mutanga, O. Remote Sensing of Above-Ground Biomass. Remote Sens. 2017, 9, 935. [Google Scholar] [CrossRef] [Green Version]
  17. Brocks, S.; Bendig, J.; Bareth, G. Toward an Automated Low-Cost Three-Dimensional Crop Surface Monitoring System Using Oblique Stereo Imagery from Consumer-Grade Smart Cameras. J. Appl. Remote Sens 2016, 10, 046021. [Google Scholar] [CrossRef] [Green Version]
  18. da Cunha, J.P.A.R.; Sirqueira Neto, M.A.; Hurtado, S.M.C. Estimating Vegetation Volume of Coffee Crops Using Images from Unmanned Aerial Vehicles. Eng. Agríc. 2019, 39, 41–47. [Google Scholar] [CrossRef]
  19. Ehlert, D.; Horn, H.-J.; Adamek, R. Measuring Crop Biomass Density by Laser Triangulation. Comput. Electron. Agric. 2008, 61, 117–125. [Google Scholar] [CrossRef]
  20. Iqbal, F.; Lucieer, A.; Barry, K.; Wells, R. Poppy Crop Height and Capsule Volume Estimation from a Single UAS Flight. Remote Sens. 2017, 9, 647. [Google Scholar] [CrossRef] [Green Version]
  21. Lati, R.N.; Manevich, A.; Filin, S. Three-Dimensional Image-Based Modelling of Linear Features for Plant Biomass Estimation. Int. J. Remote Sens. 2013, 34, 6135–6151. [Google Scholar] [CrossRef]
  22. Eltner, A.; Sofia, G. Structure from Motion Photogrammetric Technique. In Developments in Earth Surface Processes; Elsevier: Amsterdam, The Netherlands, 2020; Volume 23, pp. 1–24. ISBN 978-0-444-64177-9. [Google Scholar]
  23. Christiansen, M.; Laursen, M.; Jørgensen, R.; Skovsen, S.; Gislum, R. Designing and Testing a UAV Mapping System for Agricultural Field Surveying. Sensors 2017, 17, 2703. [Google Scholar] [CrossRef] [Green Version]
  24. Eitel, J.U.H.; Magney, T.S.; Vierling, L.A.; Brown, T.T.; Huggins, D.R. LiDAR Based Biomass and Crop Nitrogen Estimates for Rapid, Non-Destructive Assessment of Wheat Nitrogen Status. Field Crops Res. 2014, 159, 21–32. [Google Scholar] [CrossRef]
  25. Obanawa, H.; Yoshitoshi, R.; Watanabe, N.; Sakanoue, S. Portable LiDAR-Based Method for Improvement of Grass Height Measurement Accuracy: Comparison with SfM Methods. Sensors 2020, 20, 4809. [Google Scholar] [CrossRef] [PubMed]
  26. Wallace, L.; Lucieer, A.; Malenovský, Z.; Turner, D.; Vopěnka, P. Assessment of Forest Structure Using Two UAV Techniques: A Comparison of Airborne Laser Scanning and Structure from Motion (SfM) Point Clouds. Forests 2016, 7, 62. [Google Scholar] [CrossRef] [Green Version]
  27. Carlson, T.N.; Ripley, D.A. On the Relation between NDVI, Fractional Vegetation Cover, and Leaf Area Index. Remote Sens. Environ. 1997, 62, 241–252. [Google Scholar] [CrossRef]
  28. Jin, H.; Eklundh, L. A Physically Based Vegetation Index for Improved Monitoring of Plant Phenology. Remote Sens. Environ. 2014, 152, 512–525. [Google Scholar] [CrossRef]
  29. Olson, D.; Chatterjee, A.; Franzen, D.W.; Day, S.S. Relationship of Drone-Based Vegetation Indices with Corn and Sugarbeet Yields. Agron. J. 2019, 111, 2545–2557. [Google Scholar] [CrossRef]
  30. Stavrakoudis, D.; Katsantonis, D.; Kadoglidou, K.; Kalaitzidis, A.; Gitas, I. Estimating Rice Agronomic Traits Using Drone-Collected Multispectral Imagery. Remote Sens. 2019, 11, 545. [Google Scholar] [CrossRef] [Green Version]
  31. Schaefer, M.; Lamb, D. A Combination of Plant NDVI and LiDAR Measurements Improve the Estimation of Pasture Biomass in Tall Fescue (Festuca arundinacea Var. Fletcher). Remote Sens. 2016, 8, 109. [Google Scholar] [CrossRef] [Green Version]
  32. Tilly, N.; Aasen, H.; Bareth, G. Fusion of Plant Height and Vegetation Indices for the Estimation of Barley Biomass. Remote Sens. 2015, 7, 11449–11480. [Google Scholar] [CrossRef] [Green Version]
  33. Viljanen, N.; Honkavaara, E.; Näsi, R.; Hakala, T.; Niemeläinen, O.; Kaivosoja, J. A Novel Machine Learning Method for Estimating Biomass of Grass Swards Using a Photogrammetric Canopy Height Model, Images and Vegetation Indices Captured by a Drone. Agriculture 2018, 8, 70. [Google Scholar] [CrossRef] [Green Version]
  34. European Space Agency. Sentinel-2 User Handbook; ESA Standard Document; ESA: Paris, France, 2015. [Google Scholar]
  35. Gómez, D.; Salvador, P.; Sanz, J.; Casanova, J.L. Potato Yield Prediction Using Machine Learning Techniques and Sentinel 2 Data. Remote Sens. 2019, 11, 1745. [Google Scholar] [CrossRef] [Green Version]
  36. Nguyen, M.; Baez-Villanueva, O.; Bui, D.; Nguyen, P.; Ribbe, L. Harmonization of Landsat and Sentinel 2 for Crop Monitoring in Drought Prone Areas: Case Studies of Ninh Thuan (Vietnam) and Bekaa (Lebanon). Remote Sens. 2020, 12, 281. [Google Scholar] [CrossRef] [Green Version]
  37. Elshikha, D.E.M.; Waller, P.M.; Hunsaker, D.J.; Dierig, D.; Wang, G.; Cruz, V.M.V.; Thorp, K.R.; Katterman, M.E.; Bronson, K.F.; Wall, G.W. Growth, Water Use, and Crop Coefficients of Direct-Seeded Guayule with Furrow and Subsurface Drip Irrigation in Arizona. Ind. Crops Prod. 2021, 170, 113819. [Google Scholar] [CrossRef]
  38. DJI. Phantom 4 User Manual v1.6; DJI: Shenzhen, China, 2017. [Google Scholar]
  39. (Android) Pix4Dcapture—Manual and Settings. Available online: https://support.pix4d.com/hc/en-us/articles/360019848872-Manual-and-Settings-Android-PIX4Dcapture#label1 (accessed on 6 June 2022).
  40. Parrot Sequoia: User Guide. 2017. Available online: https://www.parrot.com/assets/s3fs-public/2021-09/sequoia-userguide-en-fr-es-de-it-pt-ar-zn-zh-jp-ko_0.pdf (accessed on 6 June 2022).
  41. Agisoft Metashape User Manual—Professional Edition; Version 1.6; Agisoft: St. Petersburg, Russia, 2020.
  42. Huang, J.; Wang, H.; Dai, Q.; Han, D. Analysis of NDVI Data for Crop Identification and Yield Estimation. IEEE J. Sel. Top. Appl. Earth Obs. Remote Sens. 2014, 7, 4374–4384. [Google Scholar] [CrossRef]
  43. Zuur, A.F.; Ieno, E.N.; Walker, N.; Saveliev, A.A.; Smith, G.M. Mixed Effects Models and Extensions in Ecology with R; Statistics for Biology and Health; Springer: New York, NY, USA, 2009; ISBN 978-0-387-87457-9. [Google Scholar]
  44. Padró, J.-C.; Muñoz, F.-J.; Planas, J.; Pons, X. Comparison of Four UAV Georeferencing Methods for Environmental Monitoring Purposes Focusing on the Combined Use with Airborne and Satellite Remote Sensing Platforms. Int. J. Appl. Earth Obs. Geoinf. 2019, 75, 130–140. [Google Scholar] [CrossRef]
  45. Teppati Losè, L.; Chiabrando, F.; Giulio Tonolo, F. Are measured ground control points still required in uav based large scale mapping? Assessing the positional accuracy of an rtk multi-rotor platform. Int. Arch. Photogramm. Remote Sens. Spatial Inf. Sci. 2020, XLIII-B1-2020, 507–514. [Google Scholar] [CrossRef]
  46. Issues of scale and optimal pixel size. In Spatial Statistics for Remote Sensing; Curran, P.J.; Atkinson, P.M. (Eds.) Kluwer Academic Publishers: Dordrecht, The Netherlands, 2002; Volume 1, pp. 115–132. [Google Scholar]
  47. Curtis, O.F. Distribution of Rubber and Resins in Guayule. Plant Physiol. 1947, 22, 333–359. [Google Scholar] [CrossRef] [Green Version]
  48. Cavanaugh, J.E. Unifying the Derivations for the Akaike and Corrected Akaike Information Criteria. Stat. Probab. Lett. 1997, 33, 201–208. [Google Scholar] [CrossRef]
  49. Nevavuori, P.; Narra, N.; Lipping, T. Crop Yield Prediction with Deep Convolutional Neural Networks. Comput. Electron. Agric. 2019, 163, 104859. [Google Scholar] [CrossRef]
  50. Ahmad, I.; Saeed, U.; Fahad, M.; Ullah, A.; Habib ur Rahman, M.; Ahmad, A.; Judge, J. Yield Forecasting of Spring Maize Using Remote Sensing and Crop Modeling in Faisalabad-Punjab Pakistan. J Indian Soc. Remote Sens. 2018, 46, 1701–1711. [Google Scholar] [CrossRef]
  51. Franch, B.; Bautista, A.S.; Fita, D.; Rubio, C.; Tarrazó-Serrano, D.; Sánchez, A.; Skakun, S.; Vermote, E.; Becker-Reshef, I.; Uris, A. Within-Field Rice Yield Estimation Based on Sentinel-2 Satellite Data. Remote Sens. 2021, 13, 4095. [Google Scholar] [CrossRef]
  52. Huang, S.; Tang, L.; Hupy, J.P.; Wang, Y.; Shao, G. A Commentary Review on the Use of Normalized Difference Vegetation Index (NDVI) in the Era of Popular Remote Sensing. J. For. Res. 2021, 32, 1–6. [Google Scholar] [CrossRef]
  53. Franzini, M.; Ronchetti, G.; Sona, G.; Casella, V. Geometric and Radiometric Consistency of Parrot Sequoia Multispectral Imagery for Precision Agriculture Applications. Appl. Sci. 2019, 9, 5314. [Google Scholar] [CrossRef] [Green Version]
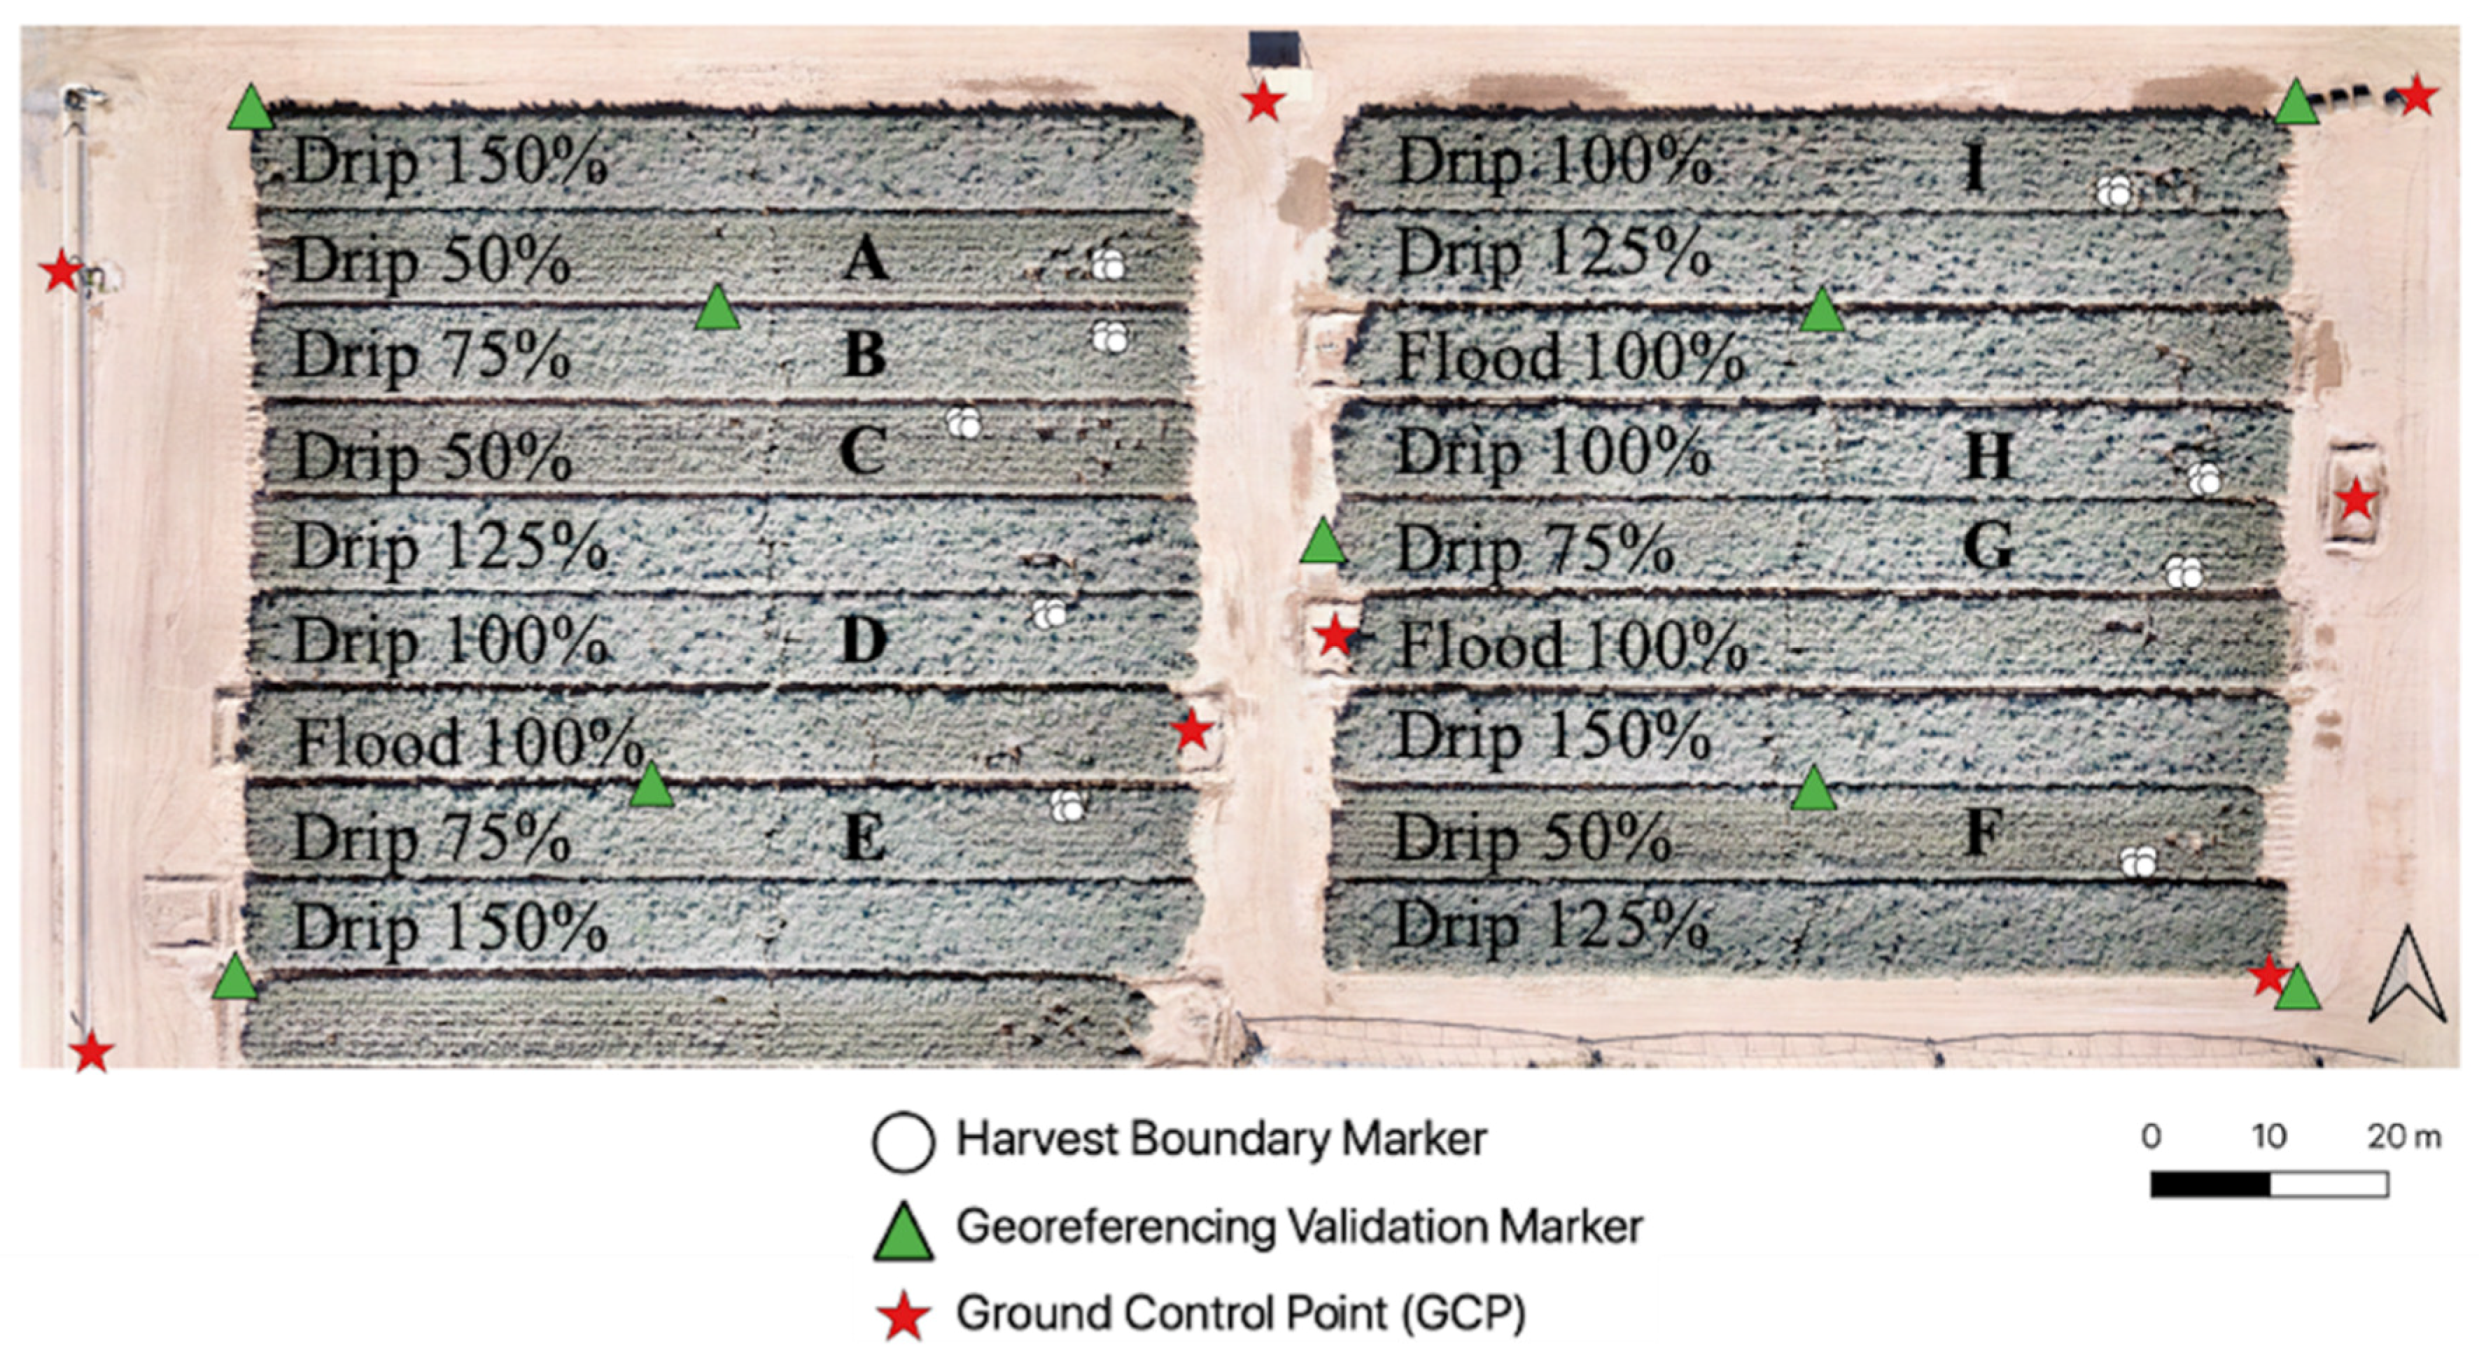
Figure 1. An RGB orthomosaic (19 December 2019) of the ROI depicting variable irrigation modalities and application rates. Treatments A–I (Drip 50%, Drip 75%, and Drip 100%) were examined in the research presented here. All above-ground plant material occurring within one-square-meter samples was removed for analysis.
Remotesensing 14 02867 g001
Figure 2. SfM mission settings selected in a flight planning application (a). Flight parameters and path were maintained across all RGB data collection campaigns (Table 1). The application does not provide a quantitative specification for flight speed as this setting is largely dependent on image overlap. Unlike the low-altitude, automated missions executed for collecting SfM data, the use of a third-party multispectral camera prevented mission automation. Multispectral images were collected at much higher altitudes (e.g., 100 m AGL) with manual operation of the UAS (b). For this reason, no two multispectral imaging missions conducted across time were identical. However, full-field coverage, reduced image blur, and nadir camera pitch were prioritized.
Remotesensing 14 02867 g002
Figure 3. Radial error observed between a corrected, georeferenced orthomosaic (a) and an uncorrected orthomosaic using UAS-derived referencing (b) from imagery dated 19 December 2019. Yellow dots represent the measured geographic locations of the measured markers.
Remotesensing 14 02867 g003
Figure 4. Harvesting one square meter of guayule (a); quartering the sample along its vertical axis (b); water is strategically removed and set aside to allow for the addition of plant material (c). Once added, the removed water is replaced and the displacement recorded (d); equation used to convert linear displacement to volumetric units (e).
Remotesensing 14 02867 g004
Figure 5. Image processing workflow in Agisoft Metashape.
Remotesensing 14 02867 g005
Figure 6. Radiometric calibration plate used to convert raw digital numbers (a) to reflectance values (b).
Remotesensing 14 02867 g006
Figure 7. An NDVI grayscale Sentinel-2 image dated 26 December 2018, with the east and west fields shown for illustration (a). Satellite data were filtered to remove cloud-impacted imagery using the Sentinel-2 scene classification layer (SC), which categorizes pixels into 12 distinct classes (b). Unfiltered (c) and filtered (d) time series data depicting mean pixel NDVI were extracted from Sentinel-2 ARD.
Remotesensing 14 02867 g007
Figure 8. UAS NDVI rasters clipped to a 50 m × 40 m region within the eastern field of the irrigation study for the following dates: 30 August 2019 (a), 5 October 2019 (b), 22 November 2019 (c), 19 December 2019 (d), 28 January 2020 (e), and 25 February 2020 (f). As the canopy recedes during the winter months, a greater percentage of soil directly below the treatments is distinguishable in high-resolution imagery (demonstrated here using a 0.15 NDVI threshold). The clipping region (ROIE) was applied to Sentinel-2 imagery for corresponding survey dates; however, its 10 m spatial resolution does not support equivalent soil pixel identification and removal. This limitation is demonstrated for a Sentinel-2 NDVI raster dated 24 February 2020 (g), the cloud- and aerosol-free satellite overpass date nearest to the corresponding UAS survey date.
Remotesensing 14 02867 g008
Figure 9. ROIE-20 polygons used to sample regions throughout the east field for December across Sentinel-2 data (a), UAS soil-inclusive data (b), and UAS soil-exclusive data (c).
Remotesensing 14 02867 g009
Figure 10. Individual value-stacked bar plots depicting the distribution of fresh weight (a), dry weight (a), and volume (b) along the quartered vertical profile of guayule. FW and DW arithmetic average of three samples and their standard deviation are illustrated for D-100. RMSE of volumetric measurements for tiers 1 and 4 are shown as error bars for A-50.
Remotesensing 14 02867 g010
Table 1. Date and type of data collection.
30 August
2019
23 September
2019
25 October
2019
22 November
2019
19 December
2019
23 December
2019
28 January
2020
25 February
2020
RGB XXXX 1XX
MultispectralX XXX XX
Harvest X
1 A second, independent RGB mission was flown on this date to serve as a reference dataset.
Table 2. Radial and vertical error estimation.
19 December 201923 December 201928 January 202025 February 2020
Radial RGB
RMSE (m)
0.0290.0220.014*
Radial Multispectral
RMSE (m)
0.214*0.1010.174
Vertical RGB
(Incl Furrow)
RMSE (m)
0.059***
Vertical RGB
(Excl Furrow)
RMSE (m)
0.158***
* Dates for which data to perform radial or vertical error estimation were unavailable.
Table 3. Final UAS-based productivity models: coefficients and term significance.
Model InterceptHGTNDVITier2 Tier3Tier4NDVI:HGT
DWCoefficient4.61502.9980Excl 1−0.9253−1.2389−1.2887Excl
(p-value 2) (<0.0001)(0.2721)(<0.0001)(<0.0001)(<0.0001)(<0.0001)
FWCoefficient5.33802.7890Excl−1.0457−1.3208−1.3639Excl
(p-value) (<0.0001)(0.2385)(<0.0001)(<0.0001)(<0.0001)(<0.0001)
VOLCoefficient8.20412.9867Excl−1.1474−1.5345−1.6563Excl
(p-value) (<0.0001)(0.3020)(<0.0001)(<0.0001)(<0.0001)(<0.0001)
FWDCoefficient0.2131−0.1769−0.39050.00660.01160.01580.4134
(p-value) (<0.0001)(<0.0001)(<0.0001)(<0.0001)(<0.0001)(<0.0001)
DWDCoefficient35.8821ExclExcl−7.0990−9.1552−10.9751Excl
(p-value) (0.8793)(0.4962)(<0.0001)(<0.0001)(<0.0001)(<0.0001)
1 Models parameters reporting as statistically insignificant were excluded (Excl) from further consideration and omitted here. 2 Calculated stepwise by dropping statistically insignificant terms, as determined through ANOVA testing (Type I).
Publisher’s Note: MDPI stays neutral with regard to jurisdictional claims in published maps and institutional affiliations.