
Concept and Design of Martian Far-IR ORE Spectrometer (MIRORES)

 ,
,  , , , , ,
Abstract
:
1. Introduction
2. Spectral Ranges and Interferences
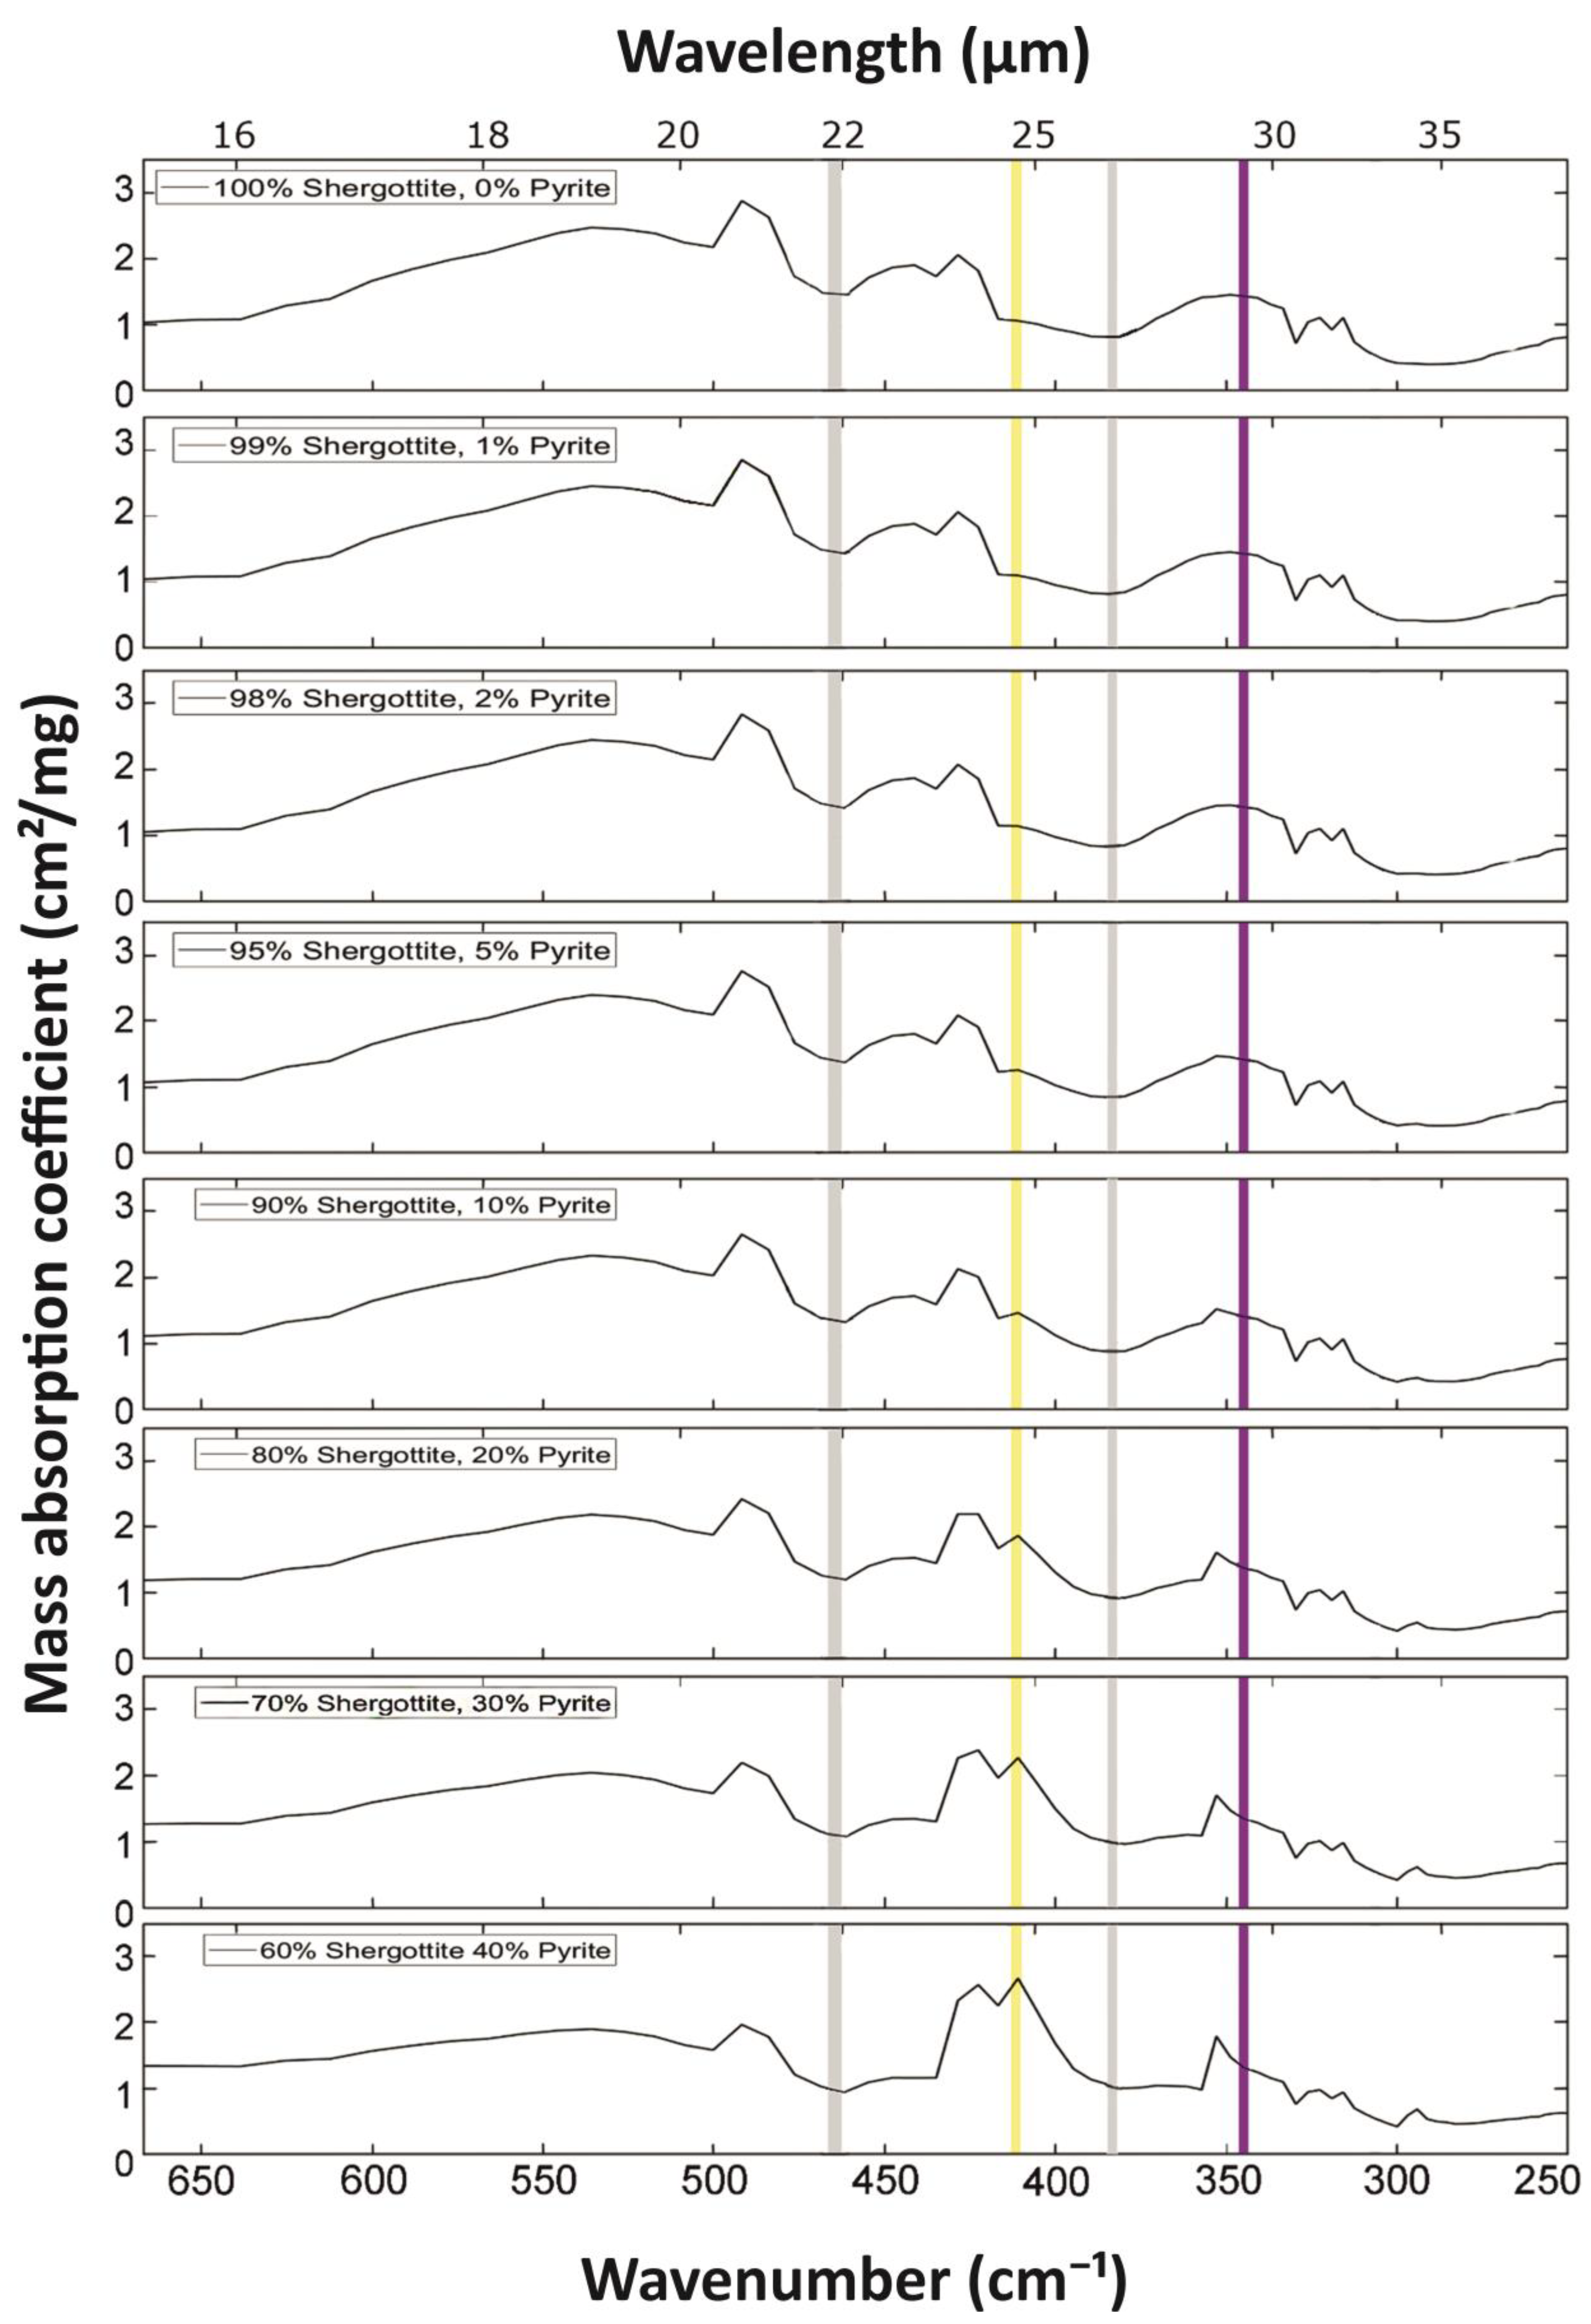
3. Simulated Mass Absorption Coefficients for Various Mineral Mixtures
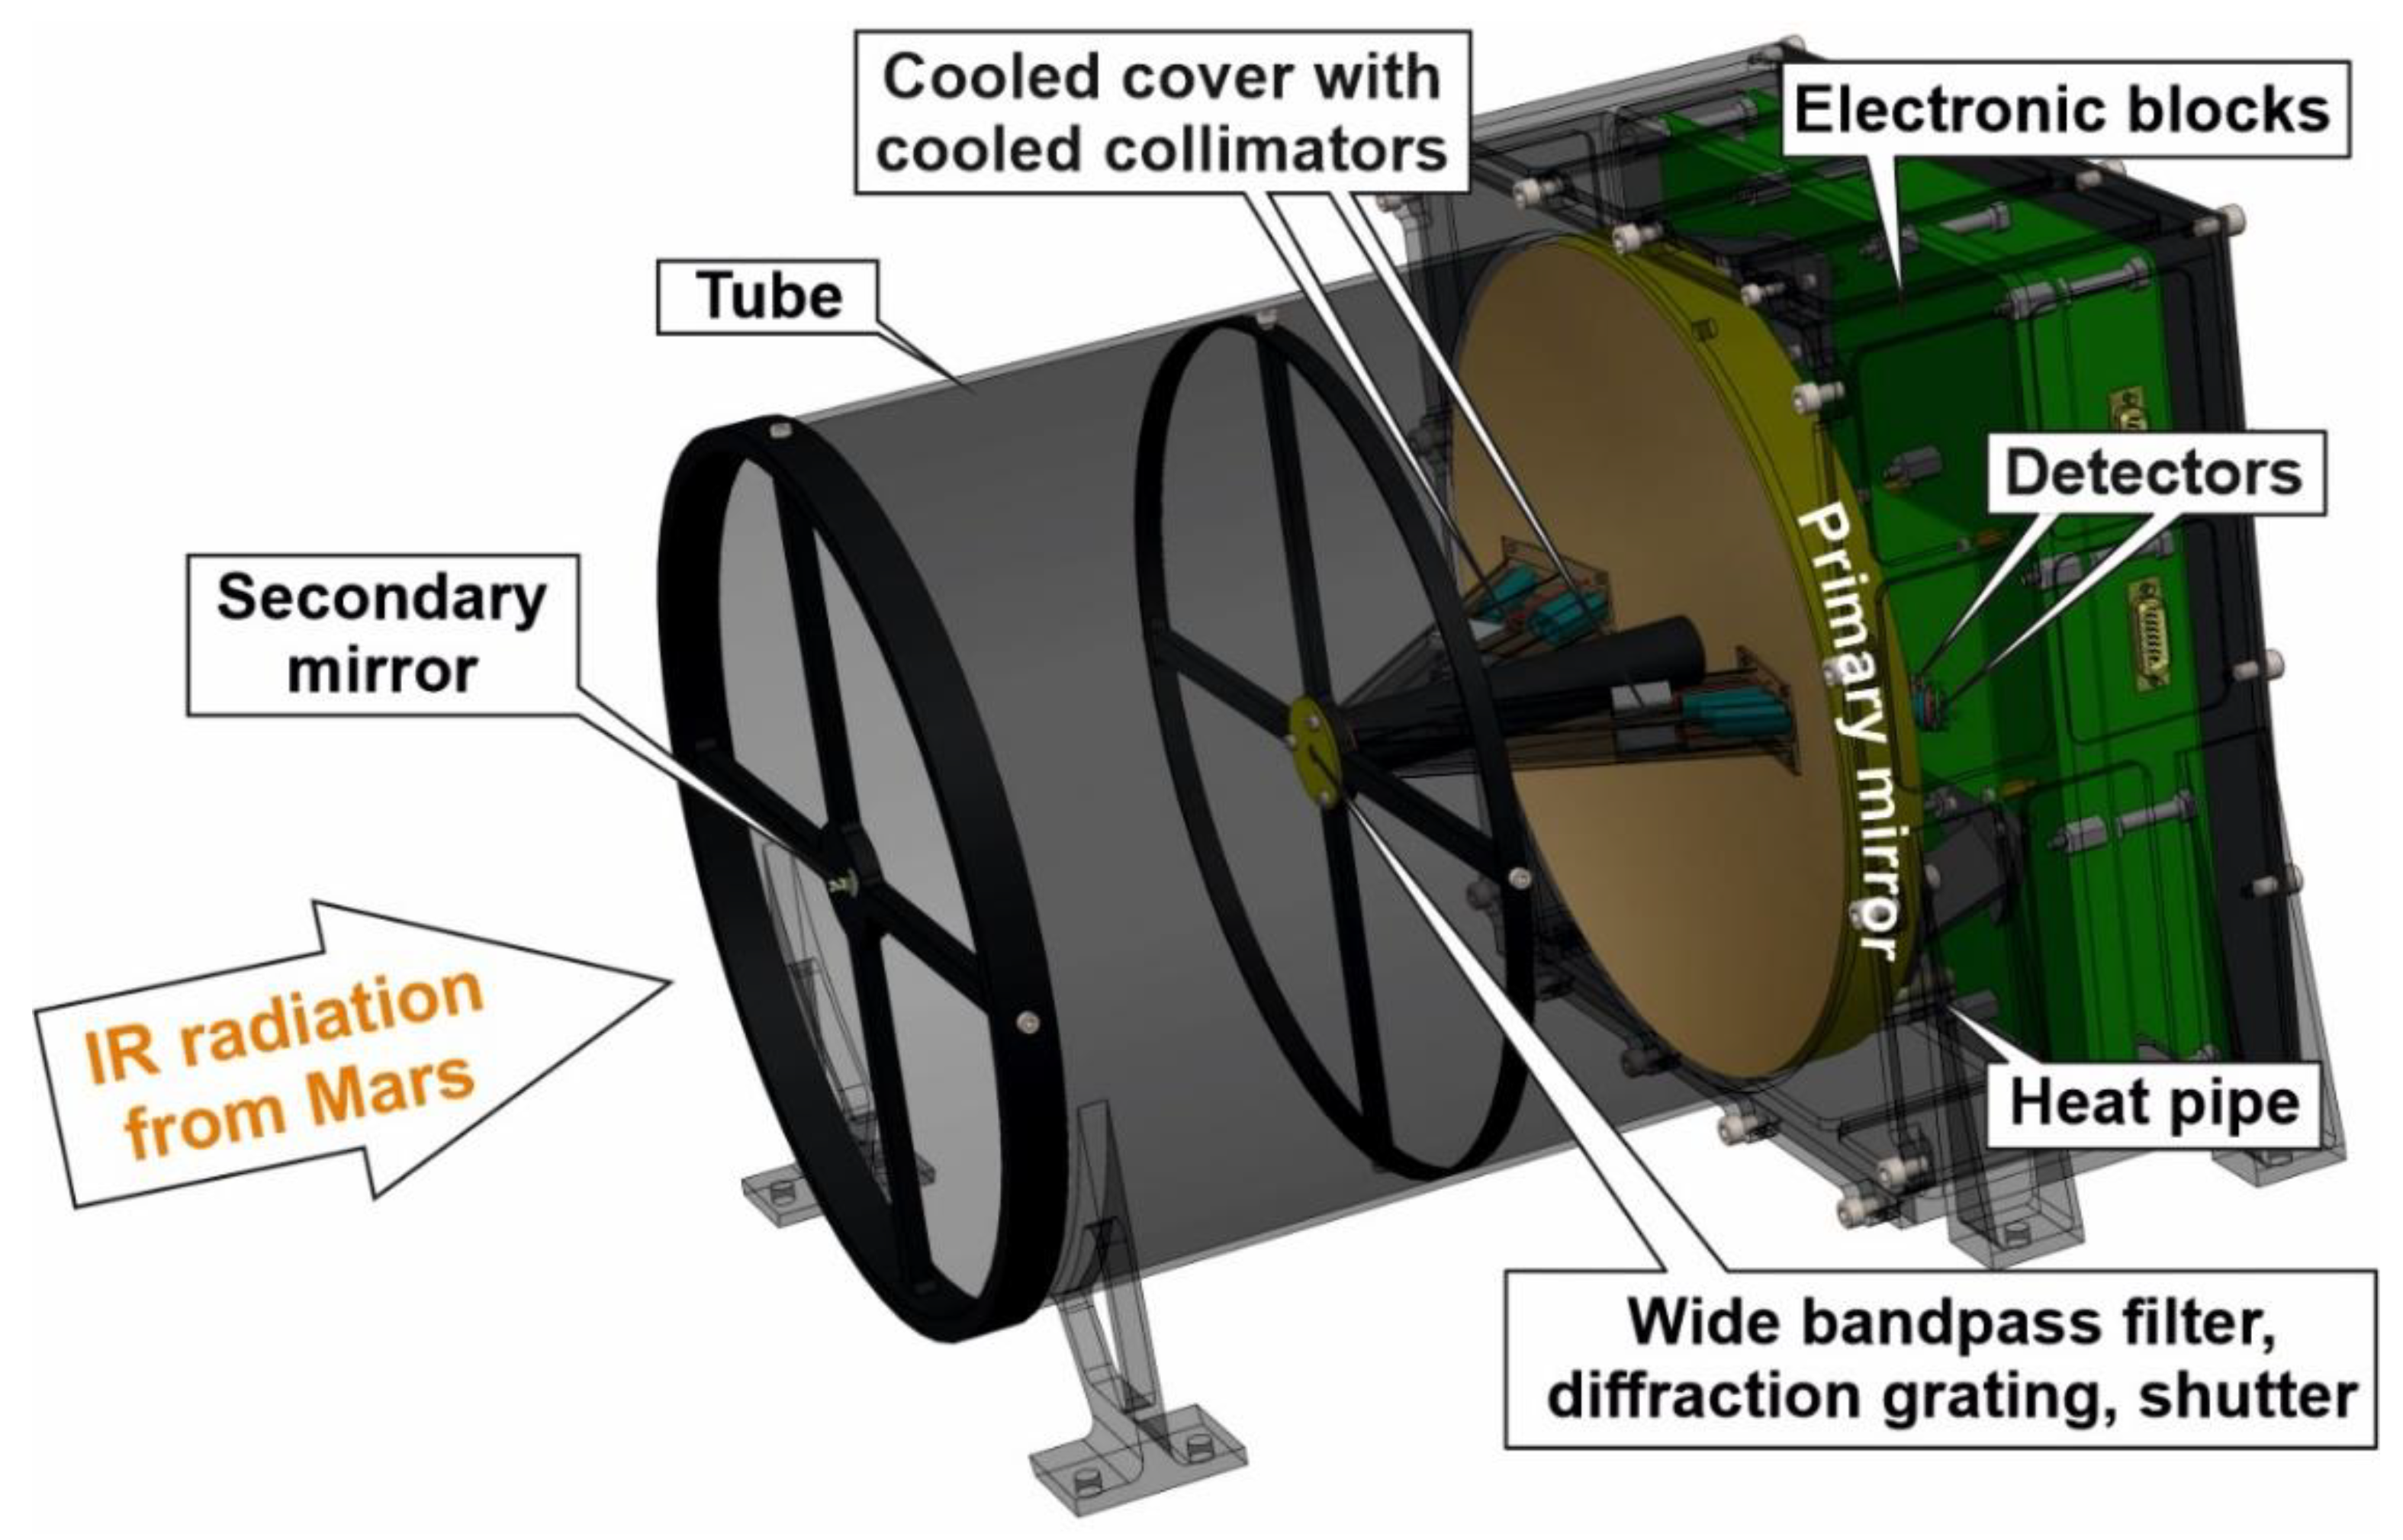
4. General Design
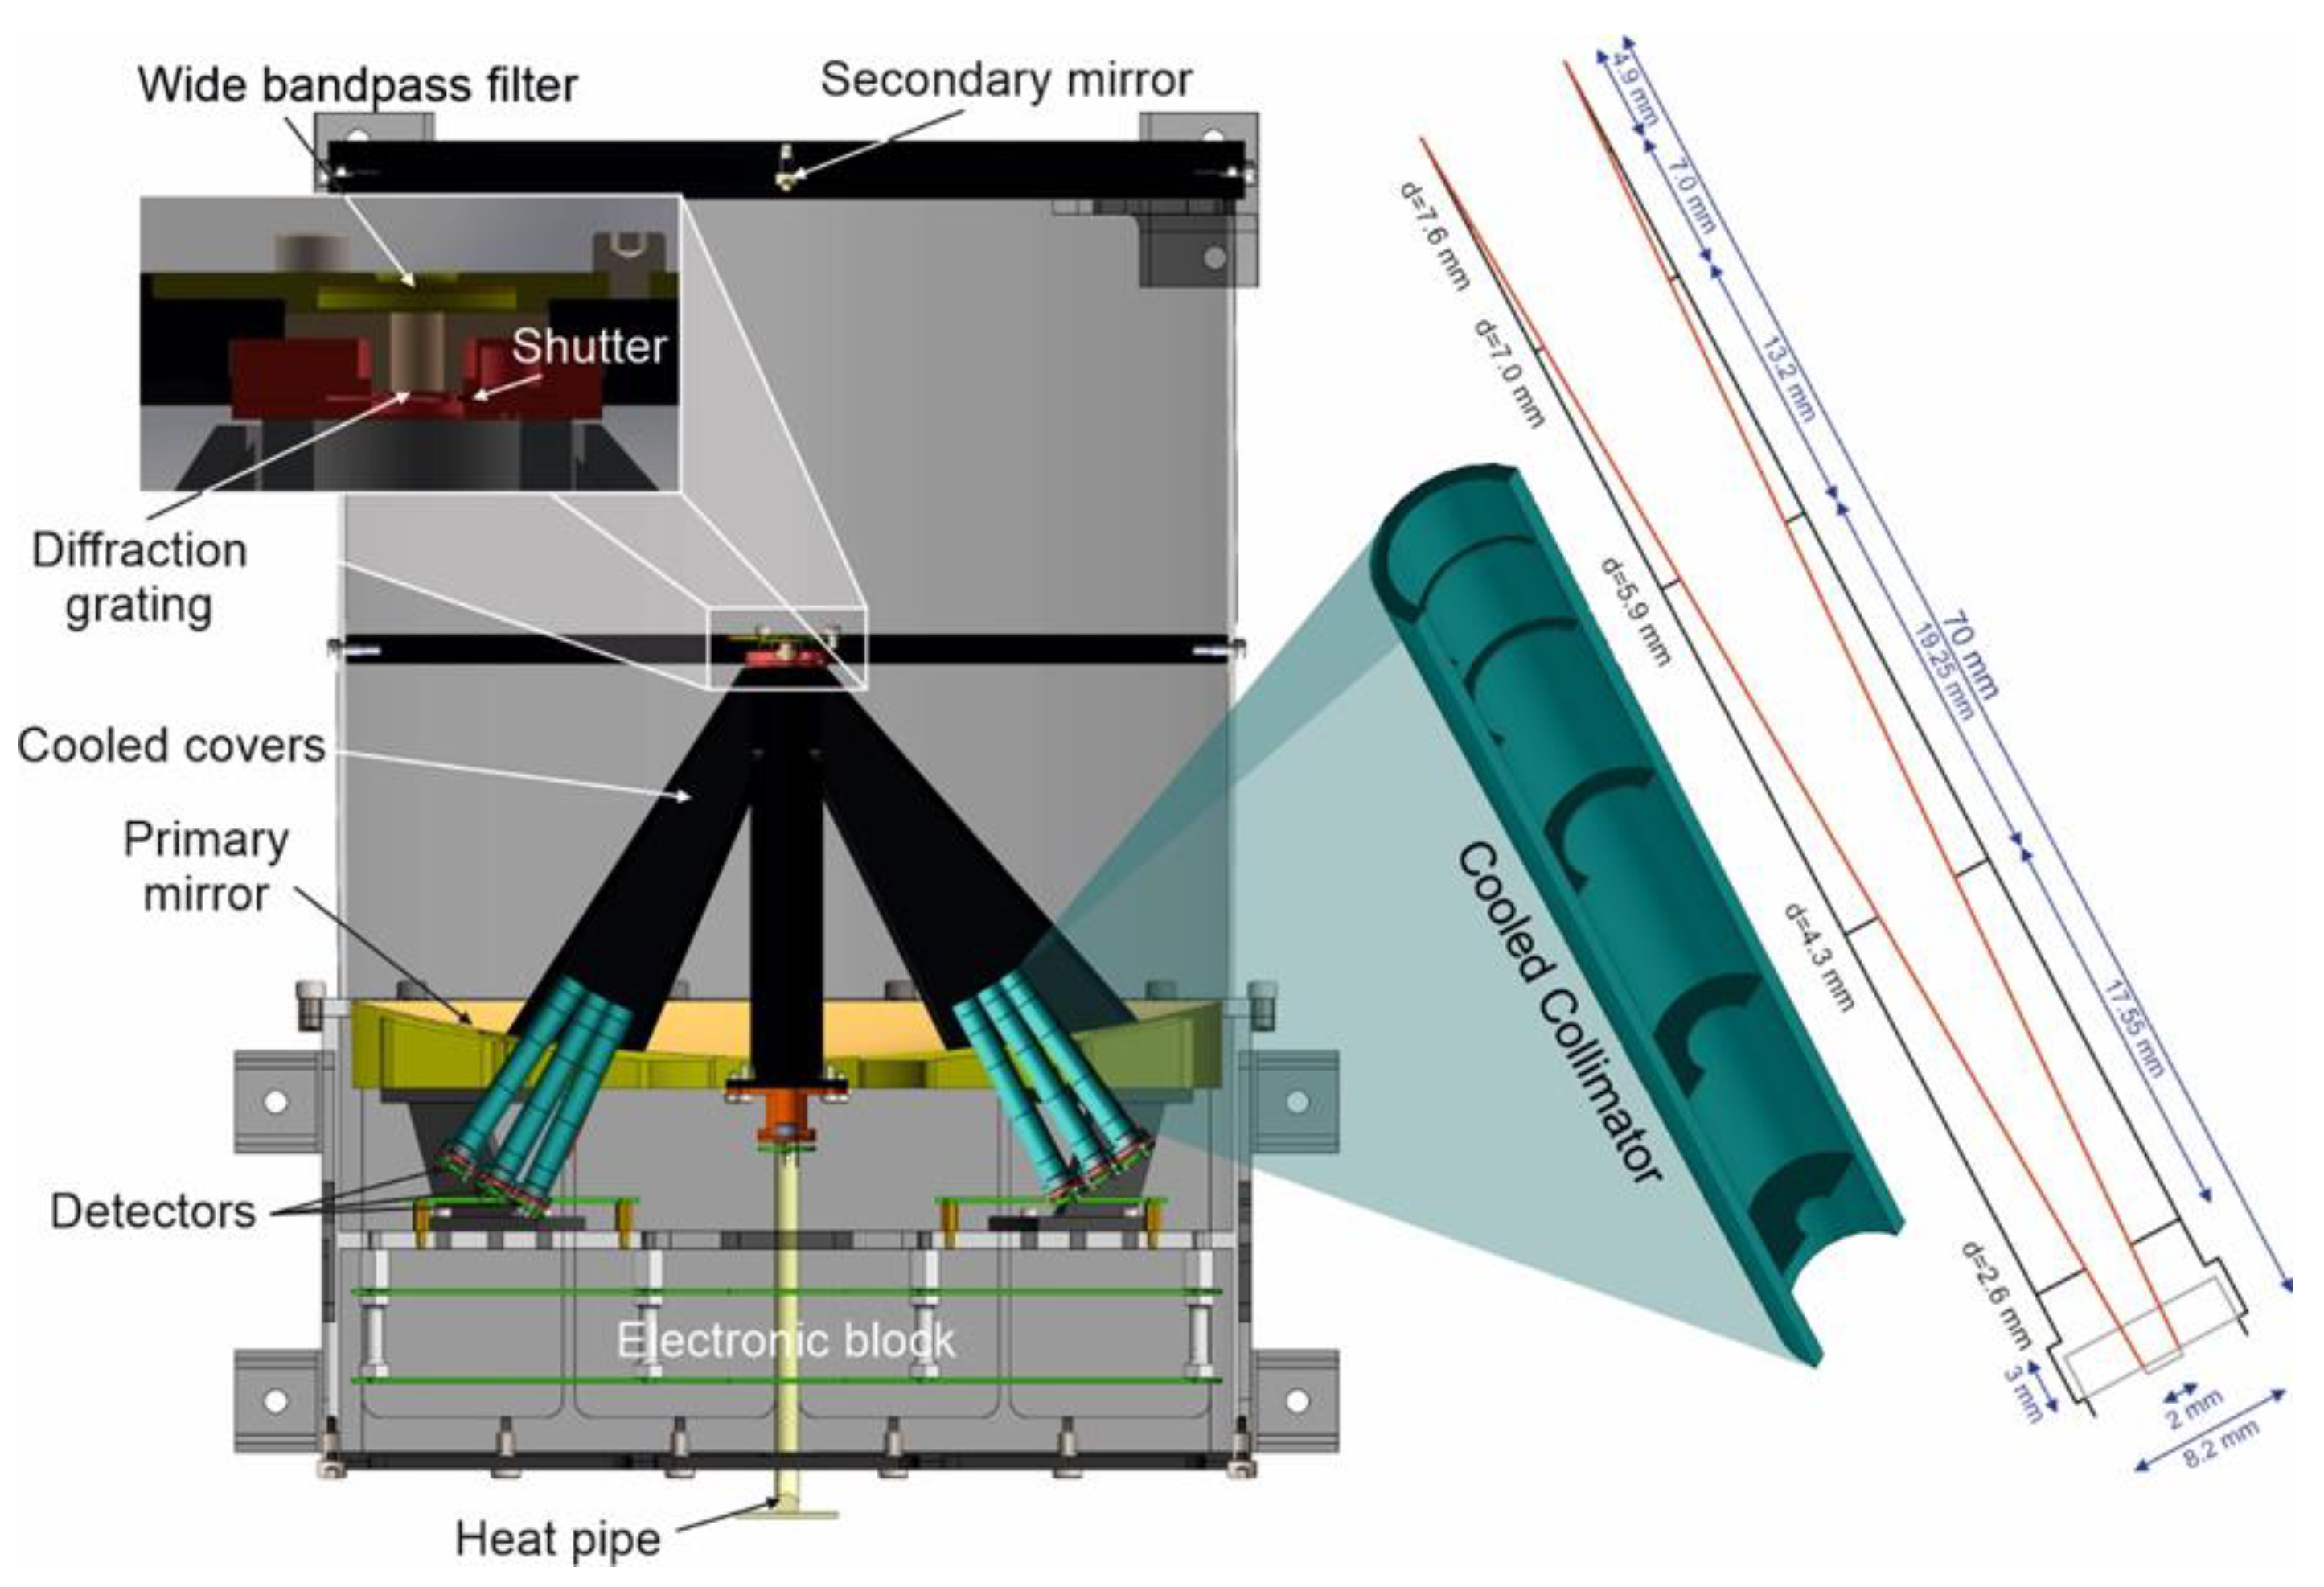
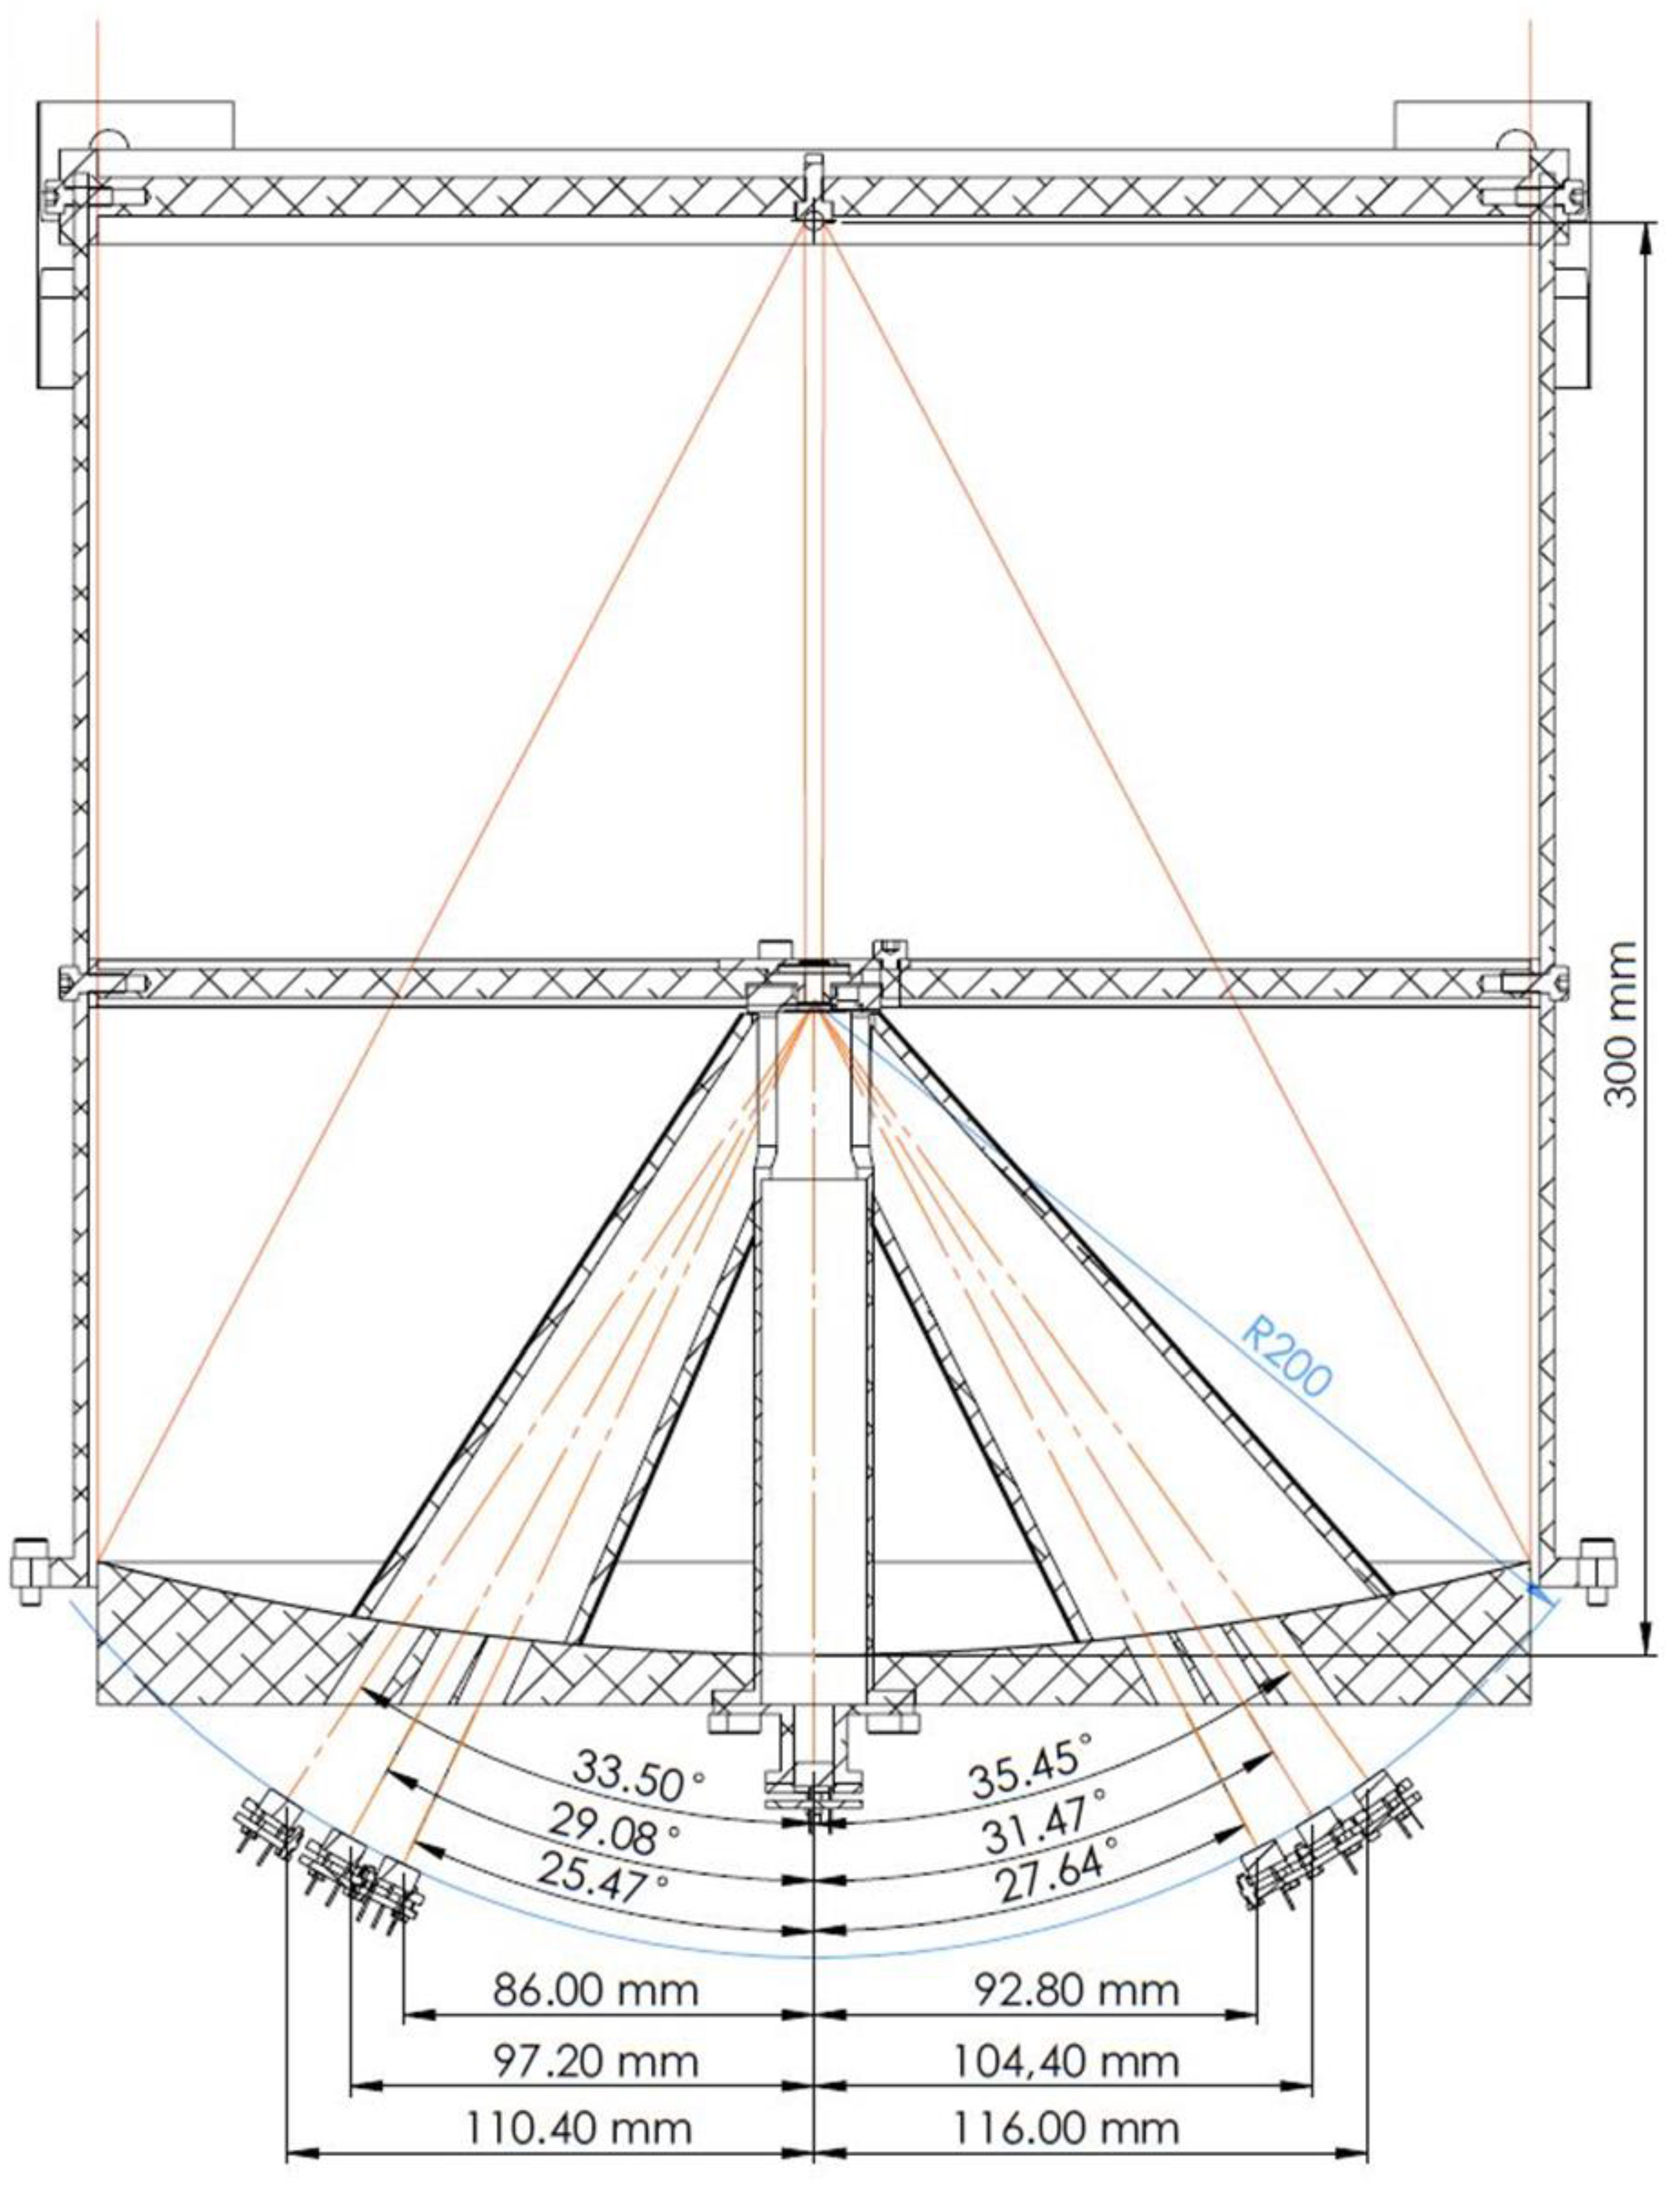
5. Optical System
6. Detection System
7. Conclusions
Supplementary Materials
Author Contributions
Funding
Data Availability Statement
Conflicts of Interest
References
- Messina, P.; Vennemann, D. The European space exploration programme: Current status of ESA’s plans for Moon and Mars exploration. Acta Astronaut. 2005, 57, 156–160. [Google Scholar] [CrossRef] [PubMed]
- International Space Exploration Coordination Group. The Global Exploration Roadmap; National Aeronautics and Space Administration: Washington, DC, USA, 2013. [Google Scholar]
- International Space Exploration Coordination Group. The Global Exploration Roadmap; National Aeronautics and Space Administration: Washington, DC, USA, 2018. [Google Scholar]
- European Space Agency (ESA). ESA Space Resources Strategy. Available online: https://sci.esa.int/documents/34161/35992/1567260390250-ESA_Space_Resources_Strategy.pdf (accessed on 22 May 2019).
- U.S. Geological Survey. Mineral Commodity Summaries; Online; U.S. Geological Survey: Washington, DC, USA, 2016. [Google Scholar]
- Vaughan, D.J.; Corkhill, C.L. Mineralogy of sulfides. Elements 2017, 13, 81–87. [Google Scholar] [CrossRef]
- King, P.L.; McSween, J.Y. Effects of H2O, pH, and oxidation state on the stability of Fe minerals on Mars. J. Geophys. Res. E Planets 2005, 110, 113. [Google Scholar] [CrossRef]
- King, P.L.; McLennan, S.M. Sulfur on Mars. Elements 2010, 6, 107–112. [Google Scholar] [CrossRef]
- Pirajno, F.; van Kranendonk, M.J. Review of hydrothermal processes and systems on Earth and implications for Martian analogues. Aust. J. Earth Sci. 2005, 52, 329–351. [Google Scholar] [CrossRef]
- West, M.D.; Clarke, J.D.A. Potential martian mineral resources: Mechanisms and terrestrial analogues. Planet. Space Sci. 2010, 58, 574–582. [Google Scholar] [CrossRef]
- Squyres, S.W.; Aharonson, O.; Clark, B.C.; Cohen, B.A.; Crumpler, L.; De Souza, P.A.; Farrand, W.H.; Gellert, R.; Grant, J.; Grotzinger, J.P.; et al. Pyroclastic activity at home plate in Gusev crater, Mars. Science 2007, 316, 738–742. [Google Scholar] [CrossRef]
- Morris, R.V.; Klingelhöfer, G.; Schröer, C.; Fleischer, I.; Ming, D.W.; Yen, A.S.; Gellert, R.; Arvidson, R.E.; Rodionov, D.S.; Crumpler, L.S.; et al. Iron mineralogy and aqueous alteration from Husband Hill through Home Plate at Gusev Crater, Mars: Results from the Mössbauer instrument on the Spirit Mars Exploration Rover. J. Geophys. Res. E Planets 2008, 113, E12S42. [Google Scholar] [CrossRef]
- Vaniman, D.T.; Bish, D.L.; Ming, D.W.; Bristow, T.F.; Morris, R.V.; Blake, D.F. Mineralogy of a Mudstone at Bay, Yellowknife Crater, Gale. Science 2014, 343, 1–9. [Google Scholar] [CrossRef]
- Wang, Z.; Becker, H. Chalcophile elements in Martian meteorites indicate low sulfur content in the Martian interior and a volatile element-depleted late veneer. Earth Planet. Sci. Lett. 2017, 463, 56–68. [Google Scholar] [CrossRef]
- Wang, Z.; Becker, H. Silver contents and Cu/Ag ratios in Martian meteorites and the implications for planetary differentiation. Geochim. Cosmochim. Acta 2017, 216, 96–114. [Google Scholar] [CrossRef]
- Baumgartner, R.J.; Fiorentini, M.L.; Lorand, J.P.; Baratoux, D.; Zaccarini, F.; Ferrière, L.; Prašek, M.K.; Sener, K. The role of sulfides in the fractionation of highly siderophile and chalcophile elements during the formation of martian shergottite meteorites. Geochim. Cosmochim. Acta 2017, 210, 1–24. [Google Scholar] [CrossRef]
- Lorand, J.P.; Pont, S.; Chevrier, V.; Luguet, A.; Zanda, B.; Hewins, R. Petrogenesis of martian sulfides in the Chassigny meteorite. Am. Mineral. 2018, 103, 872–885. [Google Scholar] [CrossRef]
- Franz, H.B.; Kim, S.T.; Farquhar, J.; Day, J.M.D.; Economos, R.C.; McKeegan, K.D.; Schmitt, A.K.; Irving, A.J.; Hoek, J.; Iii, J.D. Isotopic links between atmospheric chemistry and the deep sulphur cycle on Mars. Nature 2014, 508, 364–368. [Google Scholar] [CrossRef]
- Bibring, J.-P.; Soufflot, A.; Berthe, M.; All, E. OMEGA: Observatoire pour la Mineralogie, I’Eau, les Glaces et I’Activite. Mars Express Sci. Payload 2004, 1240, 37–49. [Google Scholar]
- Horgan, B.H.N.; Cloutis, E.A.; Mann, P.; Bell, J.F. Near-infrared spectra of ferrous mineral mixtures and methods for their identification in planetary surface spectra. Icarus 2014, 234, 132–154. [Google Scholar] [CrossRef]
- Taylor, L.A.; Nazarov, M.A.; Shearer, C.K.; McSween, H.Y.; Cahili, J.; Neal, C.R.; Ivanova, M.A.; Barsukova, L.D.; Lentz, R.C.; Clayton, R.N.; et al. Martian meteorite Dhofar 019: A new shergottite. Meteorit. Planet. Sci. 2002, 37, 1107–1128. [Google Scholar] [CrossRef]
- Bibring, J.P.; Langevin, Y.; Mustard, J.F.; Poulet, F.; Arvidson, R.; Gendrin, A.; Gondet, B.; Mangold, N.; Pinet, P.; Forget, F.; et al. Global mineralogical and aqueous Mars history derived from OMEGA/Mars express data. Science 2006, 312, 400–404. [Google Scholar] [CrossRef]
- Brusentsova, T.; Peale, R.E.; Maukonen, D.; Figueiredo, P.; Harlow, G.E.; Ebel, D.S.; Nissinboim, A.; Sherman, K.; Lisse, C.M. Laboratory far-infrared spectroscopy of terrestrial sulphides to support analysis of cosmic dust spectra. Mon. Not. R. Astron. Soc. 2012, 420, 2569–2579. [Google Scholar] [CrossRef]
- Hony, S.; Bouwman, J.; Keller, L.P.; Waters, L.B.F.M. The detection of iron sulfides in Planetary Nebulae. Astron. Astrophys. 2003, 393, L103–L106. [Google Scholar] [CrossRef]
- Dyar, M.D.; Holden, P.; Bishop, J.L.; Lane, M.D. Spectroscopic Characterization of hydrothermal sulfide chimneys at the Juan de Fuca Ridge. Lunar Planet. Sci. Conf. 2009, 40, 2221. [Google Scholar]
- Nian-Xin, M.; Ye-Xiao, H.; Wei, L.; Hong-Juan, Y.; Xue-Chu, S. Far-infrared spectra of naturally occuring FeS2 (Pyrite). Acta Phys. Sin. 1993, 42, 1712–1718. [Google Scholar] [CrossRef]
- Lorand, J.P.; Chevrier, V.; Sautter, V. Sulfide mineralogy and redox conditions in some shergottites. Meteorit. Planet. Sci. 2005, 40, 1257–1272. [Google Scholar] [CrossRef]
- Gattacceca, J.; Hewins, R.H.; Lorand, J.P.; Rochette, P.; Lagroix, F.; Cournède, C.; Uehara, M.; Pont, S.; Sautter, V.; Scorzelli, R.B.; et al. Opaque minerals, magnetic properties, and paleomagnetism of the Tissint Martian meteorite. Meteorit. Planet. Sci. 2013, 48, 1919–1936. [Google Scholar] [CrossRef]
- Smith, M.R.; Bandfield, J.L. Geology of quartz and hydrated silica-bearing deposits near Antoniadi Crater, Mars. J. Geophys. Res. Planets 2012, 117, 34. [Google Scholar] [CrossRef]
- Farmer, V.C. Infrared Spectra of Minerals; Mineralogical Society: London, UK, 1974. [Google Scholar]
- Rogalski, A. Next decade in infrared detectors. In Proceedings of the Electro-Optical and Infrared Systems: Technology and Applications XIV. International Society for Optics and Photonics, Warsaw, Poland, 9 October 2017; Volume XIV, p. 104330L. [Google Scholar] [CrossRef]
- Safari, M.; Maghsoudi, A.; Pour, A.B. Application of Landsat-8 and ASTER satellite remote sensing data for porphyry copper exploration: A case study from Shahr-e-Babak, Kerman, south of Iran. Geocarto Int. 2018, 33, 1186–1201. [Google Scholar] [CrossRef]
- Read, P.L.; Lewis, S.R.; Mulholland, D.P. The physics of Martian weather and climate: A review. Rep. Prog. Phys. 2015, 78, 125901. [Google Scholar] [CrossRef]
- Montabone, L.; Forget, F.; Millour, E.; Wilson, R.J.; Lewis, S.R.; Cantor, B.; Kass, D.; Kleinböhl, A.; Lemmon, M.T.; Smith, M.D.; et al. Eight-year climatology of dust optical depth on Mars. Icarus 2015, 251, 65–95. [Google Scholar] [CrossRef]
- Bandfield, J.L. Global mineral distributions on Mars. J. Geophys. Res. 2002, 107, 5042. [Google Scholar] [CrossRef]
- Farrand, W.H.; Glotch, T.D.; Rice, J.W.; Hurowitz, J.A.; Swayze, G.A. Discovery of jarosite within the Mawrth Vallis region of Mars: Implications for the geologic history of the region. Icarus 2009, 204, 478–488. [Google Scholar] [CrossRef]
- Zalewska, N. Hellas Planitia as a potential site of sedimentary minerals. Planet. Space Sci. 2013, 78, 25–32. [Google Scholar] [CrossRef]
- Chukanov, N.V.; Chervonnyi, A.D. Infrared Spectroscopy of Minerals and Related Compounds; Springer: Cham, Switzerland, 2016; ISBN 3319253492. [Google Scholar]
- Carter, J.; Viviano-Beck, C.; Loizeau, D.; Bishop, J.; Le Deit, L. Orbital detection and implications of akaganéite on Mars. Icarus 2015, 253, 296–310. [Google Scholar] [CrossRef]
- Bajda, T. Solubility of mimetite Pb5(AsO4)3Cl at 555C. Environ. Chem. 2010, 7, 268–278. [Google Scholar] [CrossRef]
- Ehlmann, B.L.; Edwards, C.S. Mineralogy of the Martian Surface. Annu. Rev. Earth Planet. Sci. 2014, 42, 291–315. [Google Scholar] [CrossRef]
- Cousin, A.; Sautter, V.; Payré, V.; Forni, O.; Mangold, N.; Gasnault, O.; Le Deit, L.; Johnson, J.; Maurice, S.; Salvatore, M.; et al. Classification of igneous rocks analyzed by ChemCam at Gale crater, Mars. Icarus 2017, 288, 265–283. [Google Scholar] [CrossRef]
- Xue, Y.; Yang, Y.; Yu, L. Mineral composition of the Martian Gale and Nili Fossae regions from Mars Reconnaissance Orbiter CRISM images. Planet. Space Sci. 2018, 163, 97–105. [Google Scholar] [CrossRef]
- Singh, P.; Sarkar, R.; Porwal, A. Orbital remote sensing of impact-induced hydrothermal systems on Mars. Ore Geol. Rev. 2019, 108, 101–111. [Google Scholar] [CrossRef]
- Mancarella, F.; Fonti, S.; Alemanno, G.; Orofino, V.; Blanco, A. Aqueous alteration detection in Tikhonravov crater, Mars. Planet. Space Sci. 2018, 152, 165–175. [Google Scholar] [CrossRef]
- Lin, H.; Zhang, X. Retrieving the hydrous minerals on Mars by sparse unmixing and the Hapke model using MRO/CRISM data. Icarus 2017, 288, 160–171. [Google Scholar] [CrossRef]
- Bandfield, J.L.; Glotch, T.D.; Christensen, P.R. Spectroscopic identification of carbonate minerals in the martian dust. Science 2003, 301, 1084–1087. [Google Scholar] [CrossRef]
- Rothman, L.S.; Gordon, I.E.; Babikov, Y.; Barbe, A.; Benner, D.C.; Bernath, P.F.; Birk, M.; Bizzocchi, L.; Boudon, V.; Brown, L.R.; et al. The HITRAN2012 molecular spectroscopic database. J. Quant. Spectrosc. Radiat. Transf. HITRAN2012 Mol. Spectrosc. Database 2013, 130, 4–50. [Google Scholar] [CrossRef]
- Gielen, C.; Van Winckel, H.; Min, M.; Waters, L.; Evans, T.L. SPITZER survey of dust grain processing in stable discs around binary post-AGB stars. Astron. Astrophys. 2008, 490, 725–735. [Google Scholar] [CrossRef]
- Koike, C.; Tsuchiyama, A.; Shibai, H.; Suto, H.; Tanabé, T.; Chihara, H.; Sogawa, H.; Mouri, H.; Okada, K. Absorption spectra of Mg-rich Mg-Fe and Ca pyroxenes in the mid- and far-infrared regions. Astron. Astrophys. 2000, 363, 1115–1122. [Google Scholar]
- Chihara, H.; Koike, C. Infrared absorption spectra of plagioclase feldspar: Dependencies of composition and temperature. Planet. Space Sci. 2017, 149, 94–99. [Google Scholar] [CrossRef]
- Bishop, J.; Murad, E. The visible and infrared spectral properties of jarosite and alunite. Am. Mineral. 2005, 90, 1100–1107. [Google Scholar] [CrossRef]
- Bishop, J.L.; Lane, M.D.; Dyar, M.D.; King, S.J.; Brown, A.J.; Swayze, G.A. Spectral properties of Ca-sulfates: Gypsum, bassanite, and anhydrite. Am. Mineral. 2014, 99, 2105–2115. [Google Scholar] [CrossRef]
- Bhattacharya, S.; Mitra, S.; Gupta, S.; Jain, N.; Chauhan, P.; Parthasarathy, G. Jarosite occurrence in the Deccan Volcanic Province of Kachchh, western India: Spectroscopic studies on a Martian analog locality. J. Geophys. Res. 2016, 121, 402–431. [Google Scholar] [CrossRef]
- Calvo, M.; Sevillano, E. Pyrite crystals from Soria and La Rioja provinces, Spain. Mineral. Mag. 1989, 20, 451–456. [Google Scholar]
- Kölbl, D.; Pignitter, M.; Somoza, V.; Schimak, M.P.; Strbak, O.; Blazevic, A.; Milojevic, T. Exploring fingerprints of the extreme thermoacidophile Metallosphaera sedula grown on synthetic martian regolith materials as the sole energy sources. Front. Microbiol. 2017, 8, 1918. [Google Scholar] [CrossRef]
- Zalewska, N.E.; Mroczkowska-Szerszeń, M.; Fritz, J.; Błęcka, M. Modeling of surface spectra with and without dust from Martian infrared data: New aspects. Aircr. Eng. Aerosp. Technol. 2019, 91, 333–345. [Google Scholar] [CrossRef]
- Zolotov, M.Y.; Shock, E.L. Formation of jarosite-bearing deposits through aqueous oxidation of pyrite at Meridiani Planum, Mars. Geophys. Res. Lett. 2005, 32, 90. [Google Scholar] [CrossRef]
- Schwenzer, S.P.; Abramov, O.; Allen, C.C.; Bridges, J.C.; Clifford, S.M.; Filiberto, J.; Kring, D.A.; Lasue, J.; McGovern, P.J.; Newsom, H.E.; et al. Gale Crater: Formation and post-impact hydrous environments. Planet. Space Sci. 2012, 70, 84–95. [Google Scholar] [CrossRef]
- Yen, A.S.; Morris, R.V.; Clark, B.C.; Gellert, R.; Knudson, A.T.; Squyres, S.; Mittlefehldt, D.W.; Ming, D.W.; Arvidson, R.; McCoy, T.; et al. Hydrothermal processes at Gusev Crater: An evaluation of Paso Robles class soils. J. Geophys. Res. E Planets 2008, 113, 108. [Google Scholar] [CrossRef]
- De Angelis, S.; Manzari, P.; De Sanctis, M.C.; Altieri, F.; Carli, C.; Agrosì, G. Application of spectral linear mixing to rock slabs analyses at various scales using Ma_Miss BreadBoard instrument. Planet. Space Sci. 2017, 144, 1–15. [Google Scholar] [CrossRef]
- Shi, C.; Wang, L. Incorporating spatial information in spectral unmixing: A review. Remote Sens. Environ. 2014, 149, 70–87. [Google Scholar] [CrossRef]
- Ramsey, M.S.; Christensen, P.R. Mineral abundance determination: Quantitative deconvolution of thermal emission spectra. J. Geophys. Res. Solid Earth 1998, 103, 577–596. [Google Scholar] [CrossRef]
- Lyon, R. Analysis of rocks by spectral infrared emission (8 to 25 microns). Econ. Geol. 1965, 60, 715–736. [Google Scholar] [CrossRef]
- Thomson, J.L.; Salisbury, J.W. The Mid-Infrared Reflectance of Mineral Mixtures (7–14/m). Remote Sens. Environ. 1993, 13, 1–13. [Google Scholar] [CrossRef]
- Smith, M.D.; Bandfield, J.L.; Christensen, P.R. Separation of atmospheric and surface spectral features in Mars Global Surveyor Thermal Emission Spectrometer (TES) spectra. J. Geophys. Res. 2000, 105, 9589. [Google Scholar] [CrossRef]
- Christensen, P.R.; Bandfield, J.L.; Smith, M.D.; Hamilton, V.E.; Clark, R.N. Identification of a basaltic component on the Martian surface from Thermal Emission Spectrometer data spectra of Mars during the initial aerobraking and science-phasing. J. Geophys. Res. Plants 2000, 105, 9609–9621. [Google Scholar] [CrossRef]
- Bishop, J.L.; Michalski, J.R.; Carter, J. Remote Detection of Clay Minerals, 1st ed.; Elsevier Ltd.: Amsterdam, The Netherlands, 2017; Volume 8, ISBN 9780081003558. [Google Scholar]
- Zalewska, N. Modeling of Sprectra With and Without Dust from Martian Surface Based on Infrared Data. Trans. Inst. Aviat. 2016, 245, 287–308. [Google Scholar] [CrossRef]
- Martin-Izard, A.; Arias, D.; Arias, M.; Gumiel, P.; Sanderson, D.J.; Castañon, C.; Lavandeira, A.; Sanchez, J. A new 3D geological model and interpretation of structural evolution of the world-class Rio Tinto VMS deposit, Iberian Pyrite Belt (Spain). Ore Geol. Rev. 2015, 71, 457–476. [Google Scholar] [CrossRef]
- Connerney, J.E.P.; Acuña, M.H.; Ness, N.F.; Kletetschka, G.; Mitchell, D.L.; Lin, R.P.; Reme, H. Tectonic implications of Mars crustal magnetism. Proc. Natl. Acad. Sci. USA 2005, 102, 14970–14975. [Google Scholar] [CrossRef] [PubMed]
- Lenardic, A.; Nimmo, F.; Moresi, L. Growth of the hemispheric dichotomy and the cessation of plate tectonics on Mars. J. Geophys. Res. E Planets 2004, 109, 53. [Google Scholar] [CrossRef]
- Bouley, S.; Baratoux, D.; Paulien, N.; Missenard, Y.; Saint-Bézar, B. The revised tectonic history of Tharsis. Earth Planet. Sci. Lett. 2018, 488, 126–133. [Google Scholar] [CrossRef]
- Mège, D.; Masson, P. A plume tectonics model for the Tharsis province, Mars. Planet. Space Sci. 1996, 44, 1499–1546. [Google Scholar] [CrossRef]
- Skok, J.R.; Mustard, J.F.; Ehlmann, B.L.; Milliken, R.E.; Murchie, S.L. Silica deposits in the Nili Patera caldera on the Syrtis Major volcanic complex on Mars. Nat. Geosci. 2010, 3, 838–841. [Google Scholar] [CrossRef]
- Schulze-Makuch, D.; Dohm, J.M.; Fan, C.; Fairén, A.G.; Rodriguez, J.A.P.; Baker, V.R.; Fink, W. Exploration of hydrothermal targets on Mars. Icarus 2007, 189, 308–324. [Google Scholar] [CrossRef]
- Michalski, J.R.; Dobrea, E.Z.N.; Niles, P.B.; Cuadros, J. Ancient hydrothermal seafloor deposits in Eridania basin on Mars. Nat. Commun. 2017, 8, 15978. [Google Scholar] [CrossRef]
- Osinski, G.R.; Tornabene, L.L.; Banerjee, N.R.; Cockell, C.S.; Flemming, R.; Izawa, M.R.M.; Mccutcheon, J.; Parnell, J.; Preston, L.J.; Pickersgill, A.E.; et al. Impact-generated hydrothermal systems on Earth and Mars. Icarus 2013, 224, 347–363. [Google Scholar] [CrossRef]
- Dare, S.A.S.; Barnes, S.J.; Prichard, H.M. The distribution of platinum group elements (PGE) and other chalcophile elements among sulfides from the Creighton Ni-Cu-PGE sulfide deposit, Sudbury, Canada, and the origin of palladium in pentlandite. Miner. Depos. 2010, 45, 765–793. [Google Scholar] [CrossRef]
- Frimmel, H.E. Detrital origin of hydrothermal Witwatersrand goldÐa review. Terra Nova 1997, 9, 192–197. [Google Scholar] [CrossRef]
- Li, C.; Naldrett, A.J. A numerical model for the compositional variations of Sudbury sulfide ores and its application to exploration. Economic 1994, 89, 1599–1607. [Google Scholar] [CrossRef]
- Dare, S.A.S.; Barnes, S.J.; Prichard, H.M.; Fisher, P.C. Chalcophile and platinum-group element (PGE) concentrations in the sulfide minerals from the McCreedy East deposit, Sudbury, Canada, and the origin of PGE in pyrite. Miner. Depos. 2011, 46, 381–407. [Google Scholar] [CrossRef]
- Brož, P.; Hauber, E.; Wray, J.J.; Michael, G. Amazonian volcanism inside Valles Marineris on Mars. Earth Planet. Sci. Lett. 2017, 473, 122–130. [Google Scholar] [CrossRef]
- Hawkins, G.J.; Sherwood, R.E.; Djotni, K.; Threadgold, T.M. Cooled optical filters for Q -band infrared astronomy (15–40 μm). Adv. Opt. Mech. Technol. Telesc. Instrum. II 2016, 9912, 991235. [Google Scholar] [CrossRef]
- Lennie, A.R.; Vaughan, D.J. Kinetics of the marcasite-pyrite transformation: An infrared spectroscopic study. Am. Mineral. 1992, 77, 1166–1171. [Google Scholar]
- Rigopoulou, D.; Pearson, C.; Ellison, B.; Wiedner, M.; Okada, V.O.; Tan, B.K.; Garcia-Bernete, I.; Gerin, M.; Yassin, G.; Caux, E.; et al. The far-infrared spectroscopic surveyor (FIRSS). Exp. Astron. 2021, 51, 699–728. [Google Scholar] [CrossRef]
- Kendix, E.; Moscardi, G.; Mazzeo, R.; Baraldi, P.; Prati, S.; Joseph, E.; Capelli, S. Far infrared and Raman spectroscopy analysis of inorganic pigments. J. Raman Spectrosc. 2008, 39, 1104–1112. [Google Scholar] [CrossRef]
- Murad, E.; Bishop, J.L. The infrared spectrum of synthetic akaganeite, β-FeOOH. Am. Mineral. 2000, 85, 716–721. [Google Scholar] [CrossRef]
- Salisbury, J.W.; Walter, L.S.; Vergo, N. Availability of a library of infrared (2.1–25.0 μm) mineral spectra. Am. Mineral. 1989, 74, 938–939. [Google Scholar]
- Stimson, M.; O’Donnell, M. The Infrared and Ultraviolet Absorption Spectra of Cytosine and Isocytosine in the Solid State. J. Am. Chem. Soc. 1952, 74, 1805–1808. [Google Scholar] [CrossRef]
- Salisbury, J.W.; Walter, L.S.; Vergo, N. Mid-infrared (2.1–25 um) spectra of minerals: First edition. USGS Open-File Rep. 1987, 390. [Google Scholar]


Publisher’s Note: MDPI stays neutral with regard to jurisdictional claims in published maps and institutional affiliations. |
© 2022 by the authors. Licensee MDPI, Basel, Switzerland. This article is an open access article distributed under the terms and conditions of the Creative Commons Attribution (CC BY) license (https://creativecommons.org/licenses/by/4.0/).
Share and Cite
Ciazela, J.; Bakala, J.; Kowalinski, M.; Plocieniak, S.; Zalewska, N.; Pieterek, B.; Mrozek, T.; Ciazela, M.; Paslawski, G.; Steslicki, M.; et al. Concept and Design of Martian Far-IR ORE Spectrometer (MIRORES). Remote Sens. 2022, 14, 2799. https://doi.org/10.3390/rs14122799
Ciazela J, Bakala J, Kowalinski M, Plocieniak S, Zalewska N, Pieterek B, Mrozek T, Ciazela M, Paslawski G, Steslicki M, et al. Concept and Design of Martian Far-IR ORE Spectrometer (MIRORES). Remote Sensing. 2022; 14(12):2799. https://doi.org/10.3390/rs14122799
Chicago/Turabian StyleCiazela, Jakub, Jaroslaw Bakala, Miroslaw Kowalinski, Stefan Plocieniak, Natalia Zalewska, Bartosz Pieterek, Tomasz Mrozek, Marta Ciazela, Grzegorz Paslawski, Marek Steslicki, and et al. 2022. "Concept and Design of Martian Far-IR ORE Spectrometer (MIRORES)" Remote Sensing 14, no. 12: 2799. https://doi.org/10.3390/rs14122799
APA StyleCiazela, J., Bakala, J., Kowalinski, M., Plocieniak, S., Zalewska, N., Pieterek, B., Mrozek, T., Ciazela, M., Paslawski, G., Steslicki, M., Szaforz, Z., Barylak, J., Kuzaj, M., Maturilli, A., Helbert, J., Muszynski, A., Rataj, M., Gburek, S., Jozefowicz, M., & Marciniak, D. (2022). Concept and Design of Martian Far-IR ORE Spectrometer (MIRORES). Remote Sensing, 14(12), 2799. https://doi.org/10.3390/rs14122799